Embed Size (px)
Citation preview

DON’T BE A FOOL – STAY IN SCHOOL
Team 3Eric Aube
Joseph Tirona
Overall Question
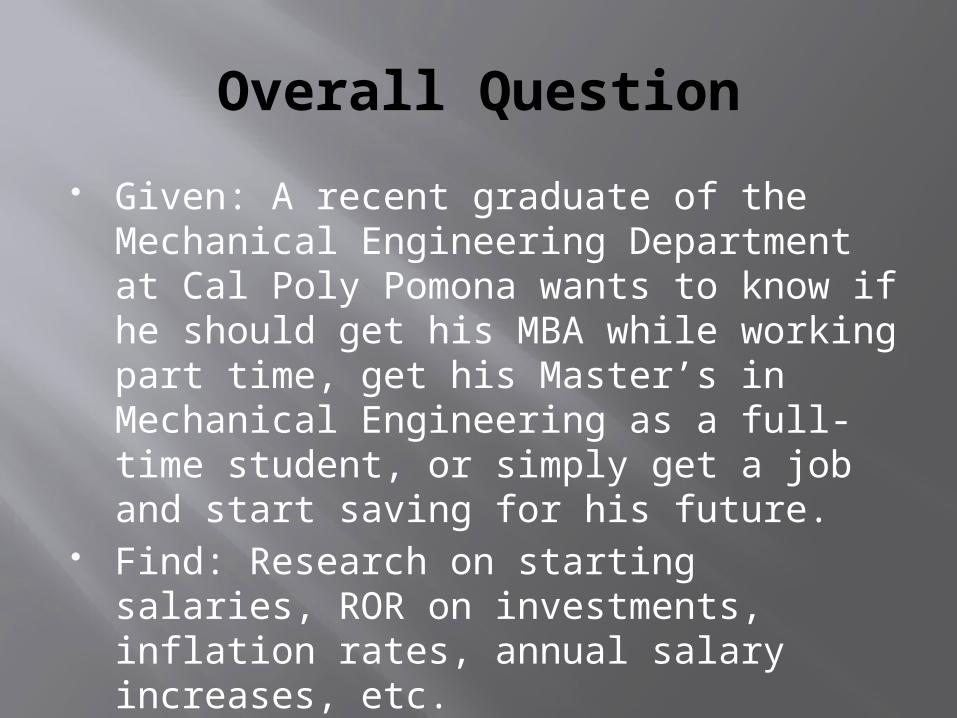
Given: A recent graduate of the Mechanical Engineering Department at Cal Poly Pomona wants to know if he should get his MBA while working part time, get his Master’s in Mechanical Engineering as a full-time student, or simply get a job and start saving for his future.
Find: Research on starting salaries, ROR on investments, inflation rates, annual salary increases, etc.

Scenario # 1
Education: Bachelor’s in Mechanical Engineering (BSME)
Starting Salary: $53,000 Average Annual Increase in Salary: 7% Rate of Return (ROR) on Investments: 2% Cost of Living: $30,000 for the first year, with a
adjustment for inflation in all subsequent years Taxes: Done according to bracket for a single
filer on page 394 (Table 12-1a) Inflation: 4% Tuition Costs: None

Scenario # 2
Education: Bachelor’s in Mechanical Engineering (BSME) with an MBA
Starting Salary: $65,200 Average Annual Increase in Salary: 9% Rate of Return (ROR) on Investments: 2% Cost of Living: $30,000 for the first year, with a
adjustment for inflation in all subsequent years Taxes: Done according to bracket for a single
filer on page 394 (Table 12-1a) Inflation: 4% Tuition Costs: $10,000 annually for 3 years

Scenario # 3
Education: Master’s in Mechanical Engineering Starting Salary: $67,248 Average Annual Increase in Salary: 10% Rate of Return (ROR) on Investments: 2% Cost of Living: $30,000 for the first year, with a
adjustment for inflation in all subsequent years Taxes: Done according to bracket for a single
filer on page 394 (Table 12-1a) Inflation: 4% Tuition Costs: $14,000 annually for 2 years

Cash Flow Diagram – Scenario 1Cash Flow vs. Age
-$400,000
-$200,000
$0
$200,000
$400,000
$600,000
$800,000
23 26 29 32 35 38 41 44 47 50 53 56 59 62
Income
LivingExpenses+'Bachelors1'!$D$2:$D$41
Taxes

Cash Flow Diagram – Scenario 2Cash Flow vs. Age
-$1,000,000
-$500,000
$0
$500,000
$1,000,000
$1,500,000
$2,000,000
23 26 29 32 35 38 41 44 47 50 53 56 59 62
Income
Living Expenses
Taxes
Tuition

Cash Flow Diagram – Scenario 3Cash Flow vs. Age
-$1,000,000
-$500,000
$0
$500,000
$1,000,000
$1,500,000
$2,000,000
$2,500,000
23 26 29 32 35 38 41 44 47 50 53 56 59 62
Tuition
Income
Living Expenses
Taxes

SENSITIVITY ANALYSIS
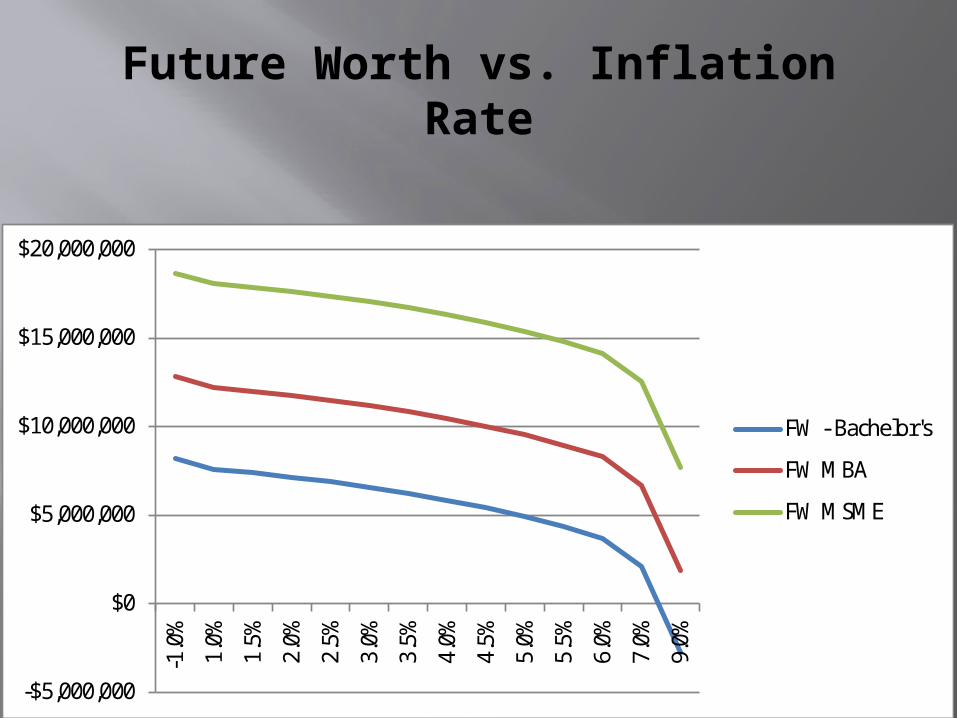
Future Worth vs. Inflation Rate
-$5,000,000
$0
$5,000,000
$10,000,000
$15,000,000
$20,000,000
-1.0
%
1.0%
1.5%
2.0%
2.5%
3.0%
3.5%
4.0%
4.5%
5.0%
5.5%
6.0%
7.0%
9.0%
FW - Bachelor's
FW MBA
FW MSME

Conclusion for FW vs. Inflation Rate
An increase inflation rate causes a decrease in total future worth.
The impact of inflation is severe; thus, you have to be careful to ensure that you are saving enough and getting enough ROR to combat any rises in inflation.
Inflation impacts all three scenarios fairly equally; but MSME still wins because its total FW is higher than all the others for the same inflation rates.

Future Worth vs. Age of Retirement
$0
$5,000,000
$10,000,000
$15,000,000
$20,000,000
$25,000,000
$30,000,000
$35,000,000
$40,000,000
52 57 59 60 62 63 65 67 72
FW - Bachelor's
FW - MBA
FW - MSME
Conclusion for FW vs. Age of Retirement
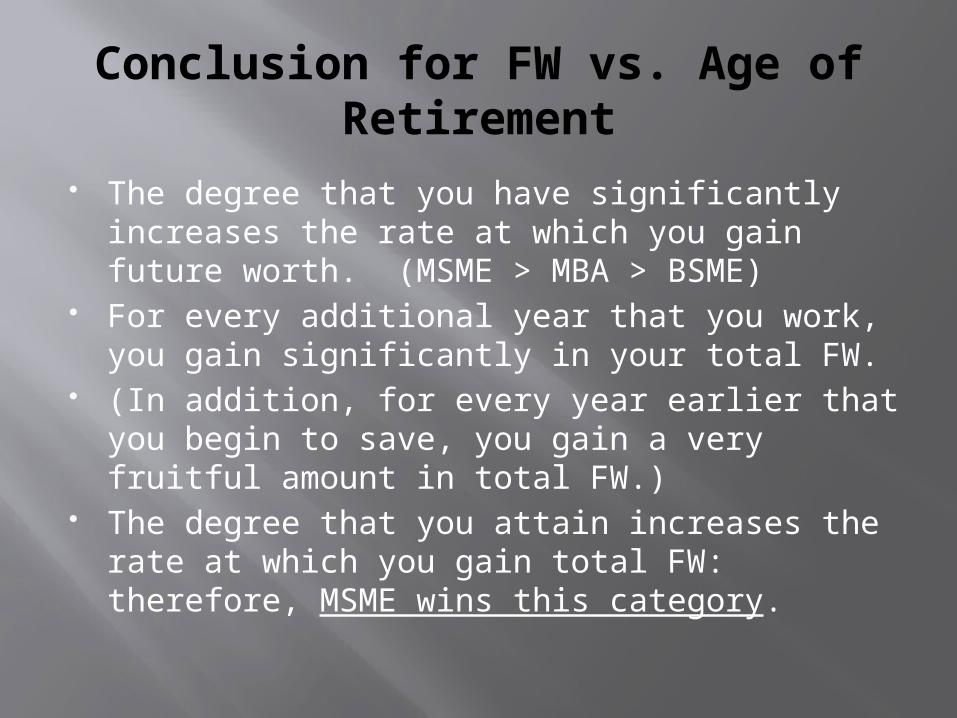
The degree that you have significantly increases the rate at which you gain future worth. (MSME > MBA > BSME)
For every additional year that you work, you gain significantly in your total FW.
(In addition, for every year earlier that you begin to save, you gain a very fruitful amount in total FW.)
The degree that you attain increases the rate at which you gain total FW: therefore, MSME wins this category.
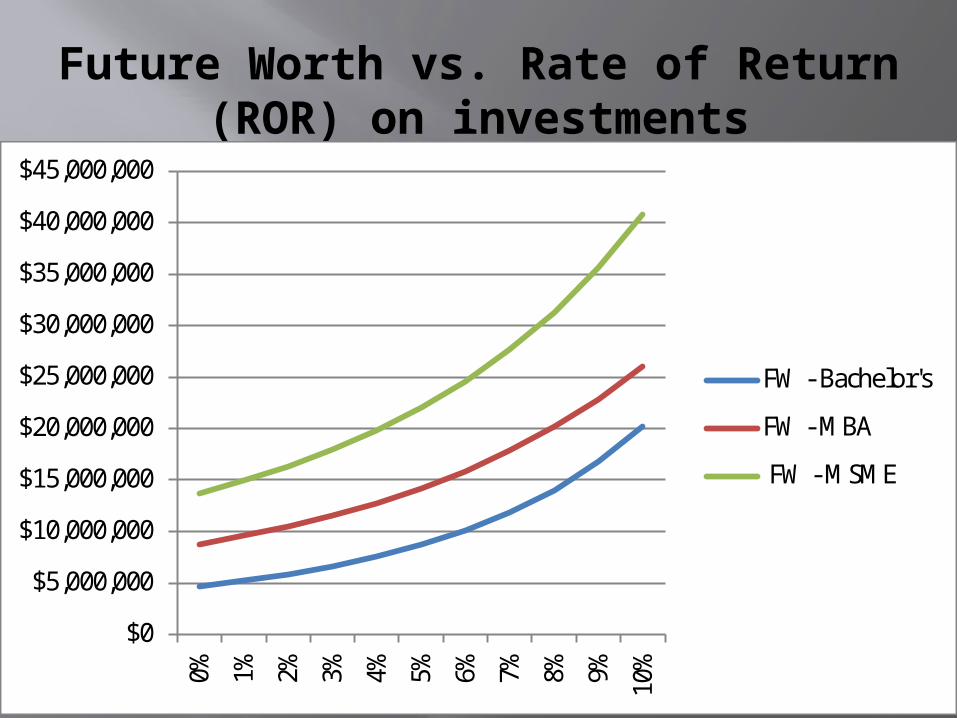
Future Worth vs. Rate of Return (ROR) on investments
$0
$5,000,000
$10,000,000
$15,000,000
$20,000,000
$25,000,000
$30,000,000
$35,000,000
$40,000,000
$45,000,0000% 1% 2% 3% 4% 5% 6% 7% 8% 9% 10
%
FW - Bachelor's
FW - MBA
FW - MSME

Conclusion for FW vs. Rate of Return on Investments
The higher your rate of return on investments, your total FW increases exponentially.
For every ROR that we found, getting your MSME is the most beneficial scenario in trying to get the most out of your FW.

Future Worth vs. Starting Salary
$0
$2,000,000
$4,000,000
$6,000,000
$8,000,000
$10,000,000
$12,000,000
$14,000,000
$16,000,000
$18,000,000
$20,000,000
FW - BSME
FW - MBA
FW - MSME
Conclusions for FW vs. Starting Salary
For each starting Salary, getting a MSME is still the best option.
This is further magnified when one considers that those graduates of MSME programs usually have HIGHER starting salaries than those graduates with only a BSME or MBA anyway.
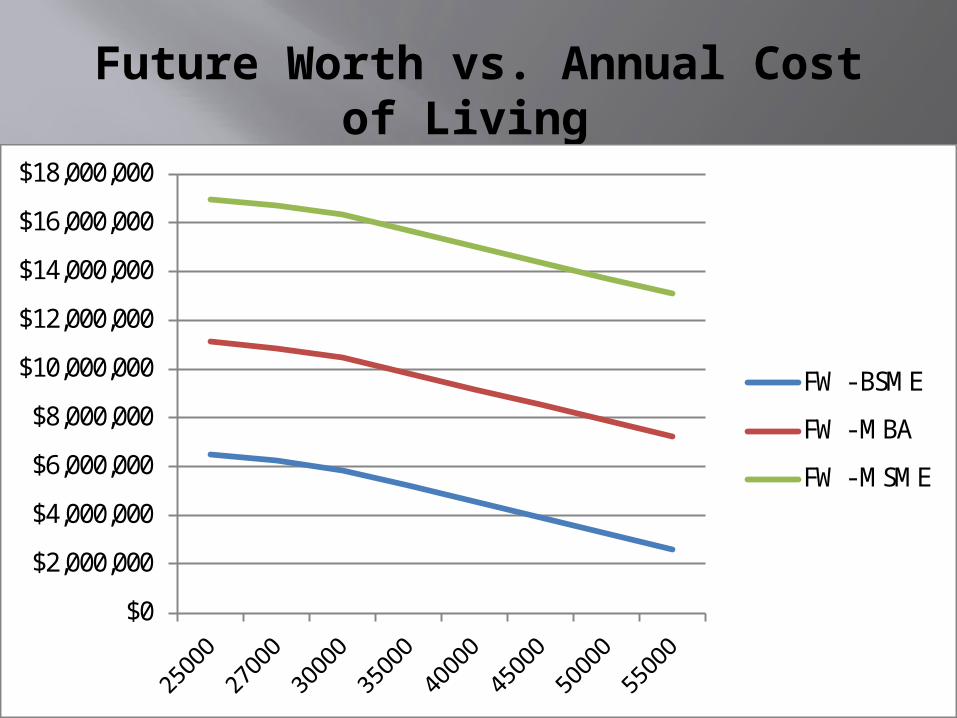
Future Worth vs. Annual Cost of Living
$0
$2,000,000
$4,000,000
$6,000,000
$8,000,000
$10,000,000
$12,000,000
$14,000,000
$16,000,000
$18,000,000
FW - BSME
FW - MBA
FW - MSME
Conclusions for FW vs. Annual Cost of Living
Any increase in one’s Cost of Living impacts each scenario equally. Thus, MSME is still the best option because it had the highest FW originally.
Future Worth vs. Annual Salary Increase
$0
$5,000,000
$10,000,000
$15,000,000
$20,000,000
$25,000,000
$30,000,000
$35,000,000
4% 5% 6% 7% 8% 9% 10% 11% 12%
FW BSME
FW MBA
FW MSME

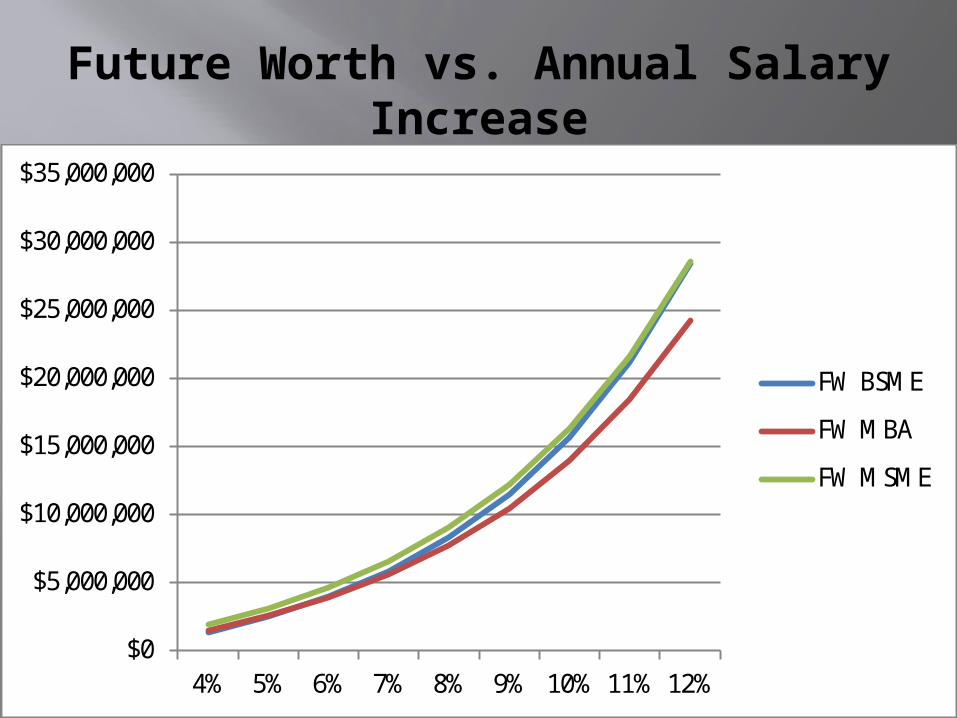
Conclusions for FW vs. Annual Salary Increase
Unlike all the other scenarios, all three lines fall on top of each other.
Whichever job has the highest annual salary increase, (in terms of percentage), is the best option.
We will call this a wash; but generally, MSME graduates have a higher annual salary increase than those with a BSME. (10% vs. 7%)
MSME’s also have a very slightly higher increase than those with an MBA. (10% vs. 9%)
Overall Conclusions
Get an Master’s in Mechanical Engineering!