Embed Size (px)
Citation preview
Team Riskless Kelsey Kitchen, Kara Schulman,
Kaiqi Zhang, Simon Webb

Strategy after Management Meeting 1
Target each growing segment
with a differentiated
product
Projected product features with
regression-based charts tool
Heavy spending on advertising and
better allocation commercial team
Focus on getting products right in
Sonite market before allocating resources here
Delayed entry and used semantic scale tools to
target only Followers
Took out necessary loans for first R&D and
continuously improved REVOLT
Sonite market:
Vodite market:
2
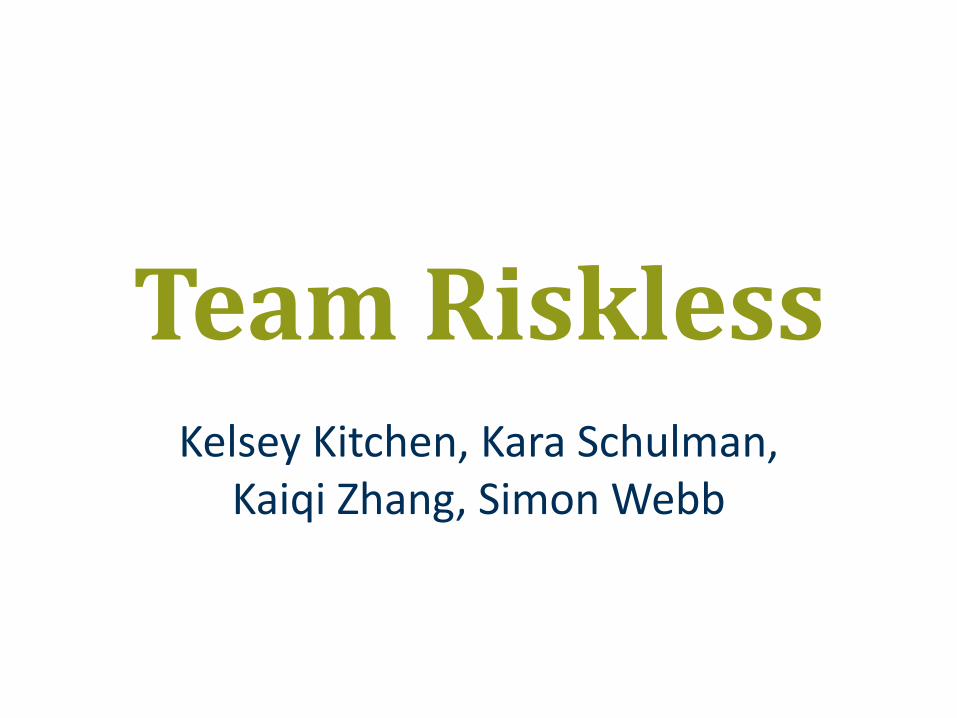
Situation: “which market is most poorly served?”
RONDO
• Targeting Savers
• Low price leader
ROCK
• Targeting High Earners
• Market share leader
ROLL
• Targeting Shoppers
• Emphasis on price and convenience
3
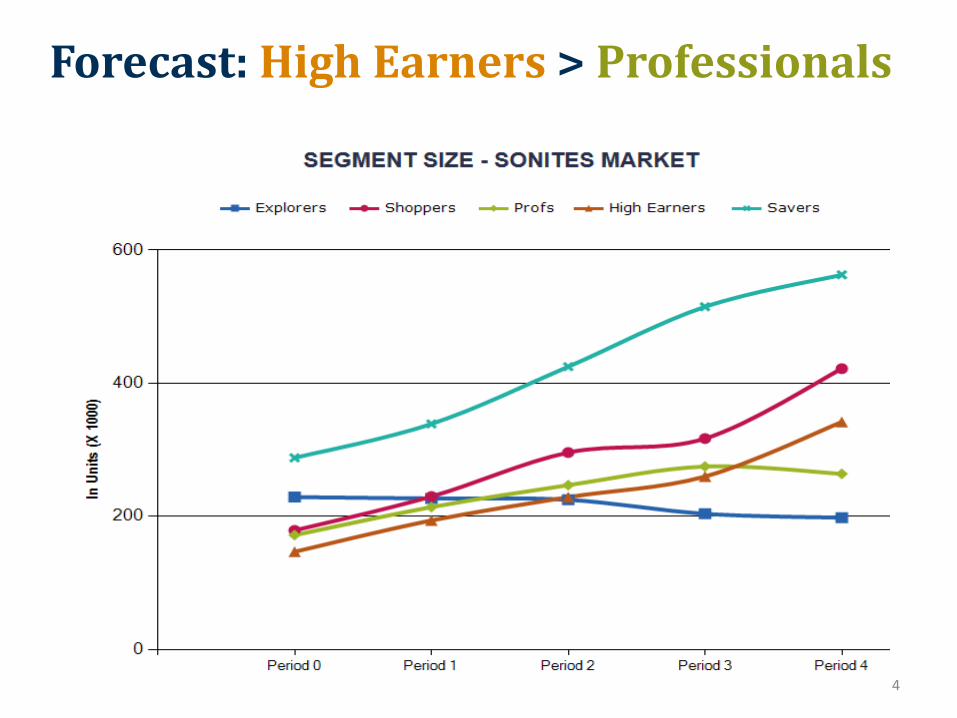
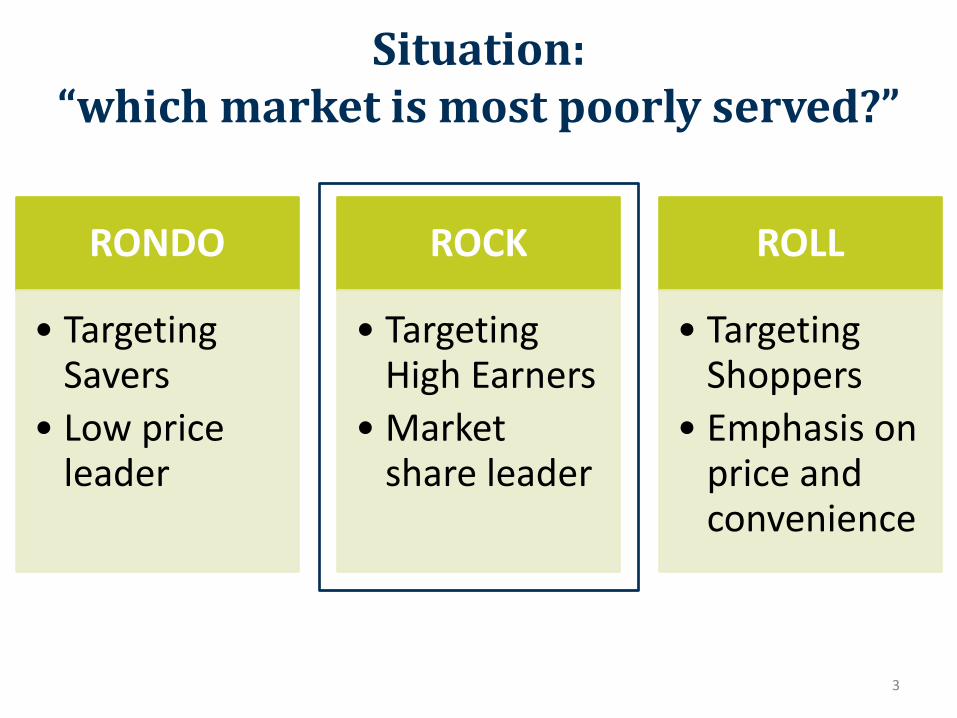
Forecast: High Earners > Professionals
4

Improvement of Commercial Team
5
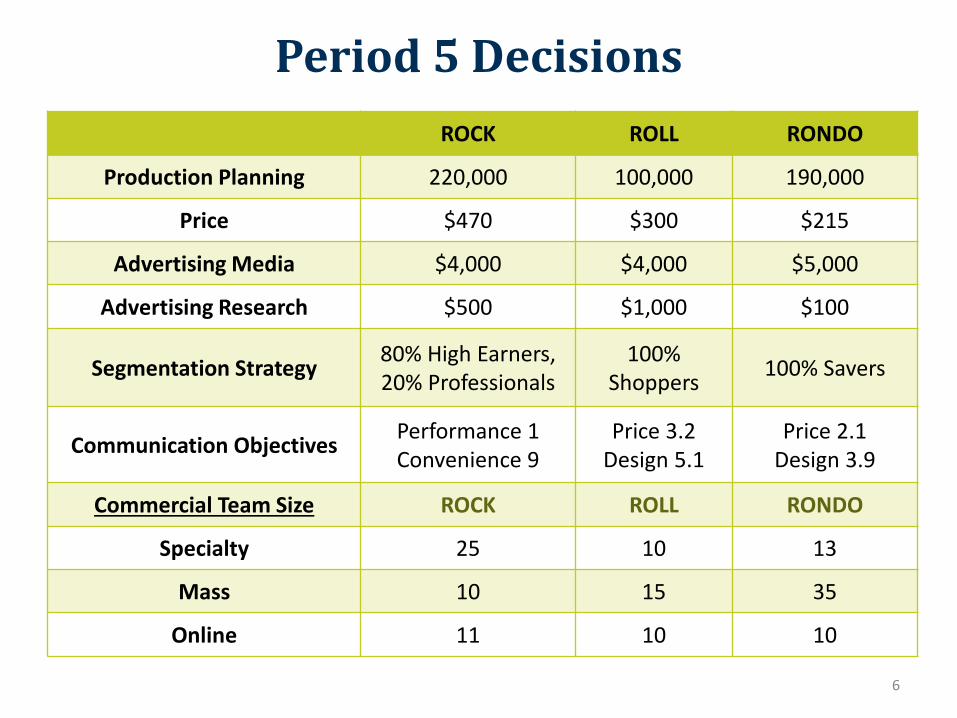
ROCK ROLL RONDO
Production Planning 220,000 100,000 190,000
Price $470 $300 $215
Advertising Media $4,000 $4,000 $5,000
Advertising Research $500 $1,000 $100
Segmentation Strategy 80% High Earners, 20% Professionals
100% Shoppers
100% Savers
Communication Objectives Performance 1 Convenience 9
Price 3.2 Design 5.1
Price 2.1 Design 3.9
Commercial Team Size ROCK ROLL RONDO
Specialty 25 10 13
Mass 10 15 35
Online 11 10 10
Period 5 Decisions
6
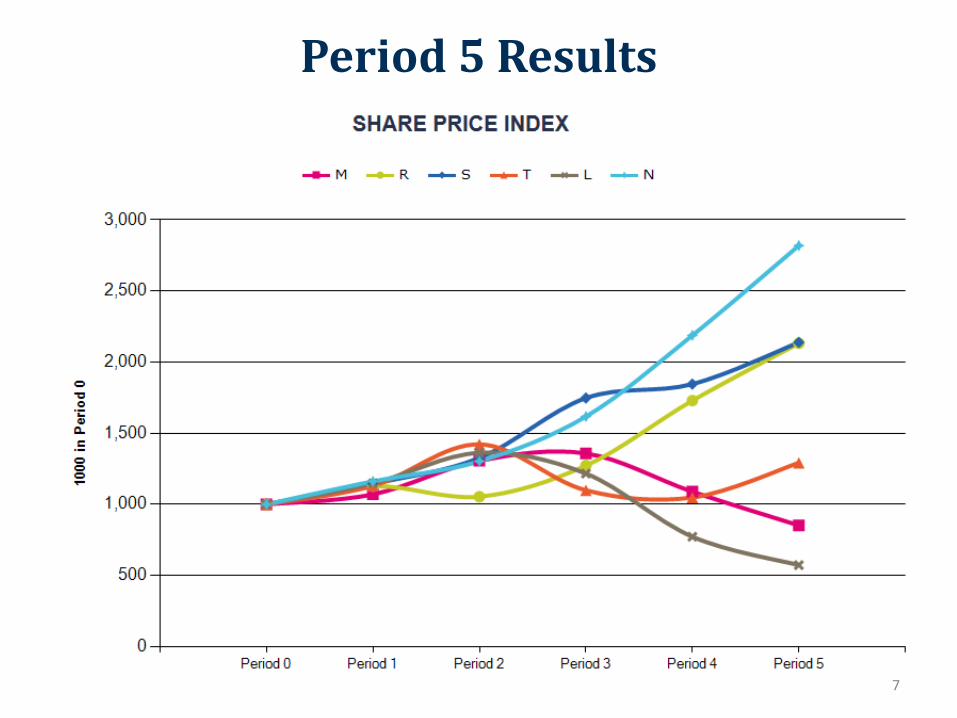
7
Period 5 Results
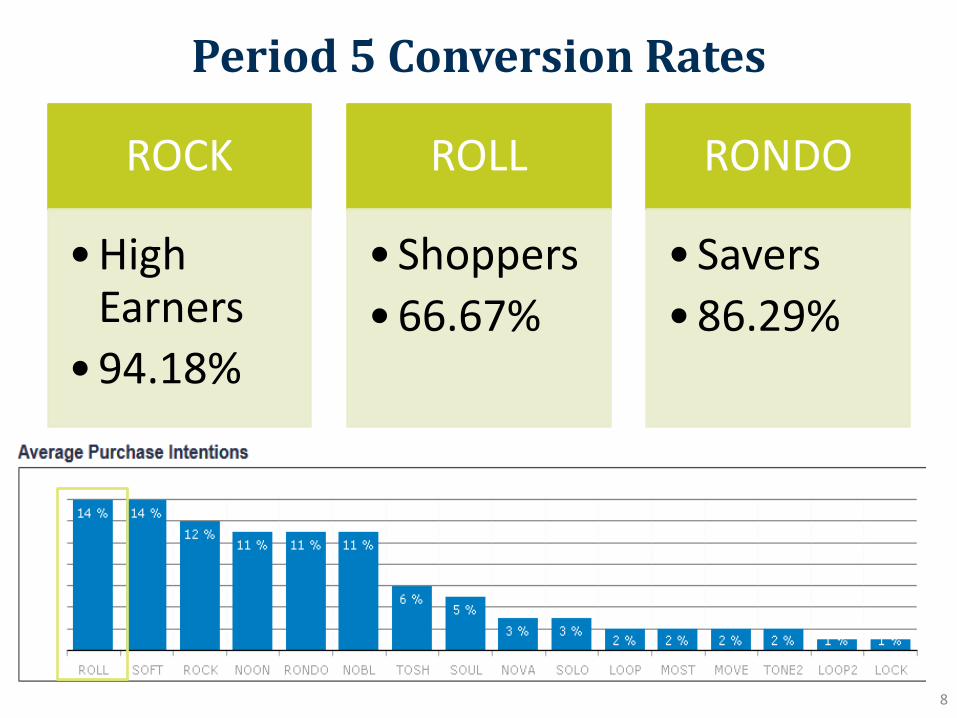
ROCK
• High Earners
• 94.18%
ROLL
• Shoppers
• 66.67%
RONDO
• Savers
• 86.29%
8
Period 5 Conversion Rates

Features
9
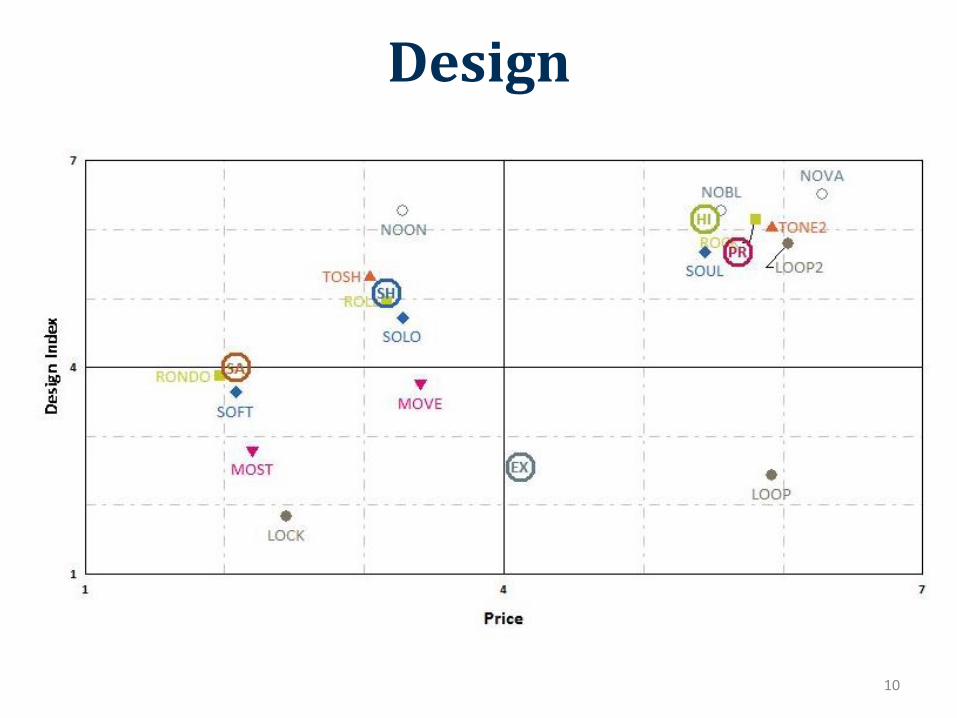
Design
10
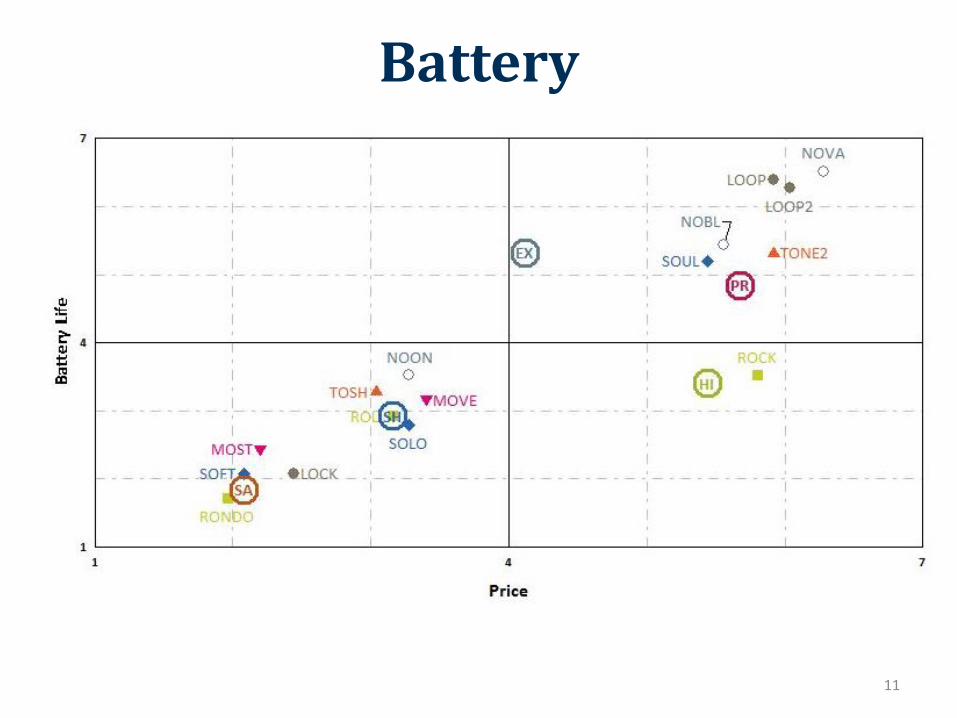
Battery
11

Display
12

Processing Power
13

ROCK ROLL RONDO
Production Planning 330,000 280,000 380,000
Price $470 $300 $215
Advertising Media $3,000 $3,500 $3,500
Advertising Research $100 $100 $100
Segmentation Strategy 100% High Earners
100% Shoppers 100% Savers
Communication Objectives (importance of characteristics)
Price 5.4 PPower 4.2
Price 3.1 PPower 4.4
Price 2 PPower 2.4
Commercial Team Size ROCK ROLL RONDO
Specialty 25 20 13
Mass 10 25 35
Online 11 10 10
14
Period 6 Decisions
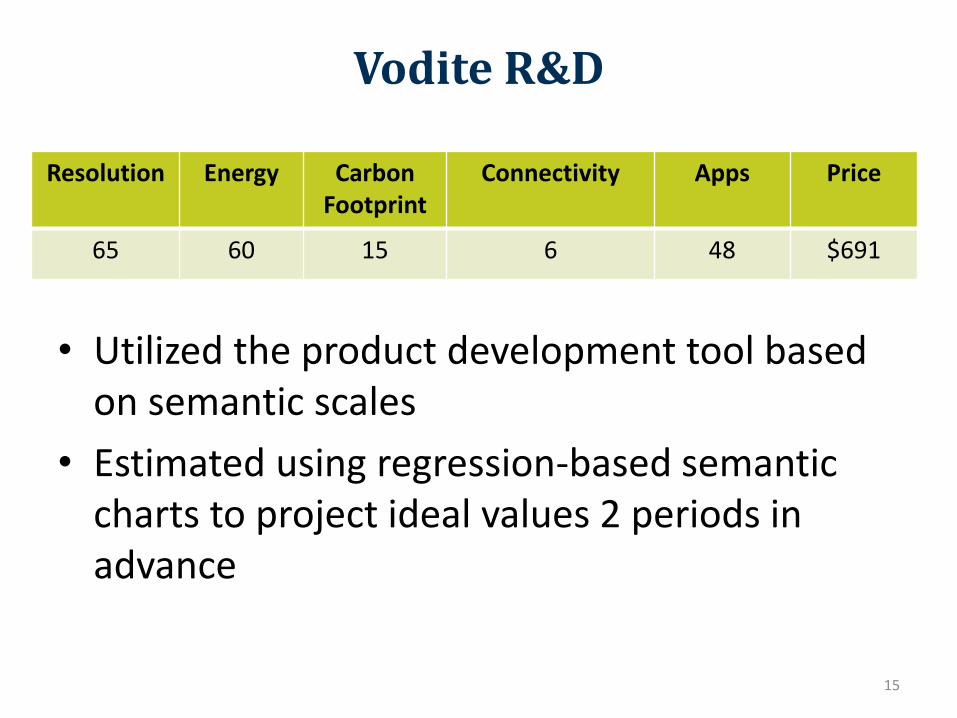
Vodite R&D
• Utilized the product development tool based on semantic scales
• Estimated using regression-based semantic charts to project ideal values 2 periods in advance
15
Resolution Energy Carbon Footprint
Connectivity Apps Price
65 60 15 6 48 $691
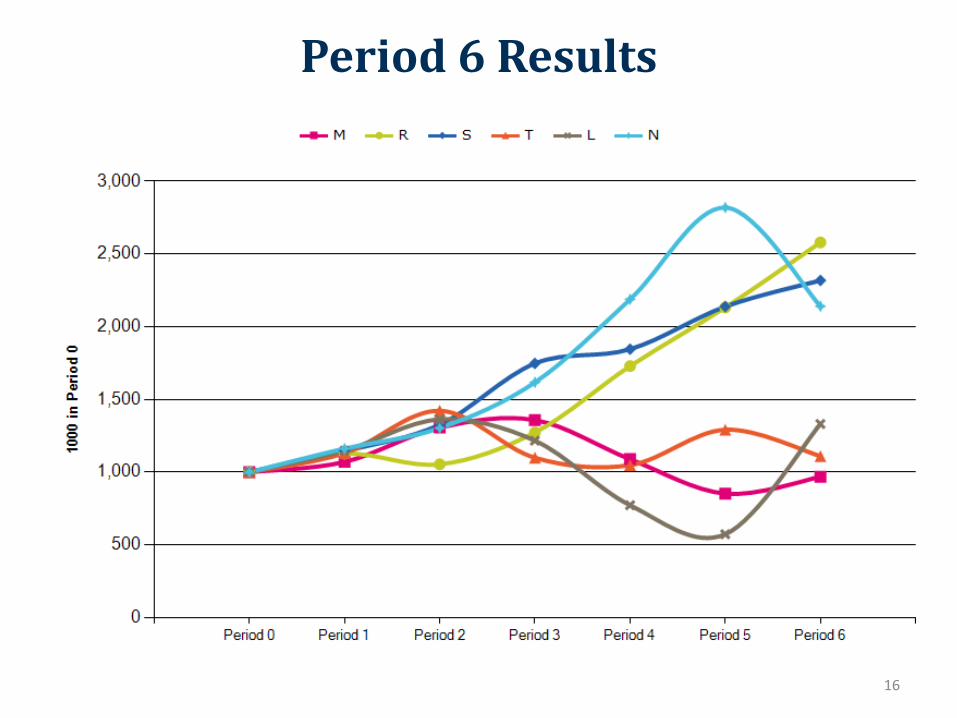
16
Period 6 Results

ROCK
• High Earners
• 91.9%
ROLL
• Shoppers
• 44.5%
RONDO
• Savers
• 28.3%
17
Period 6 Conversion Rates
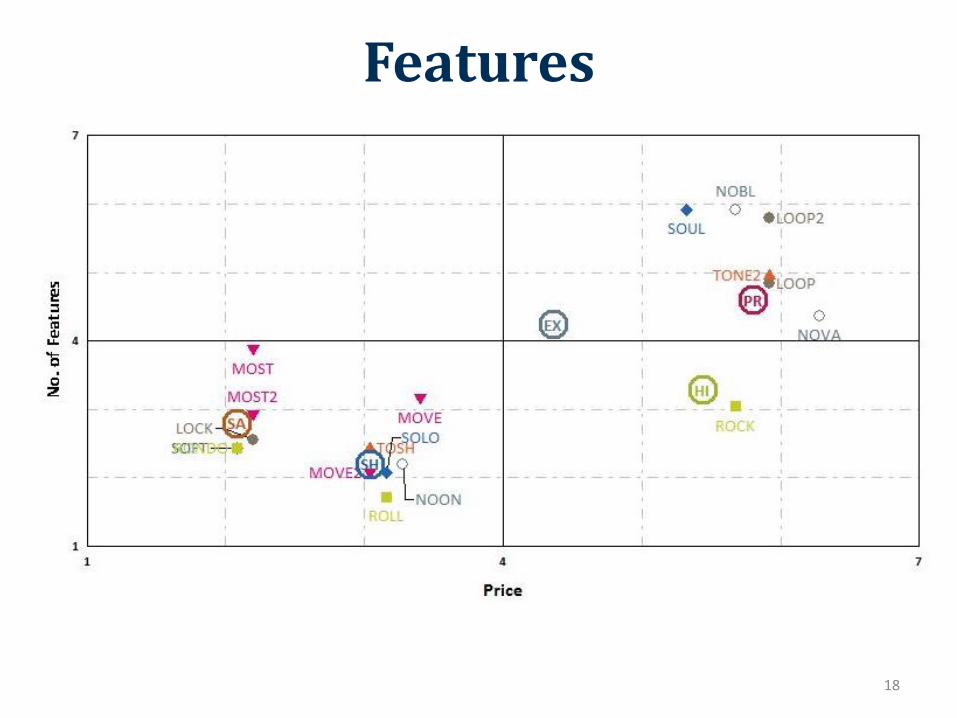
Features
18

Design
19
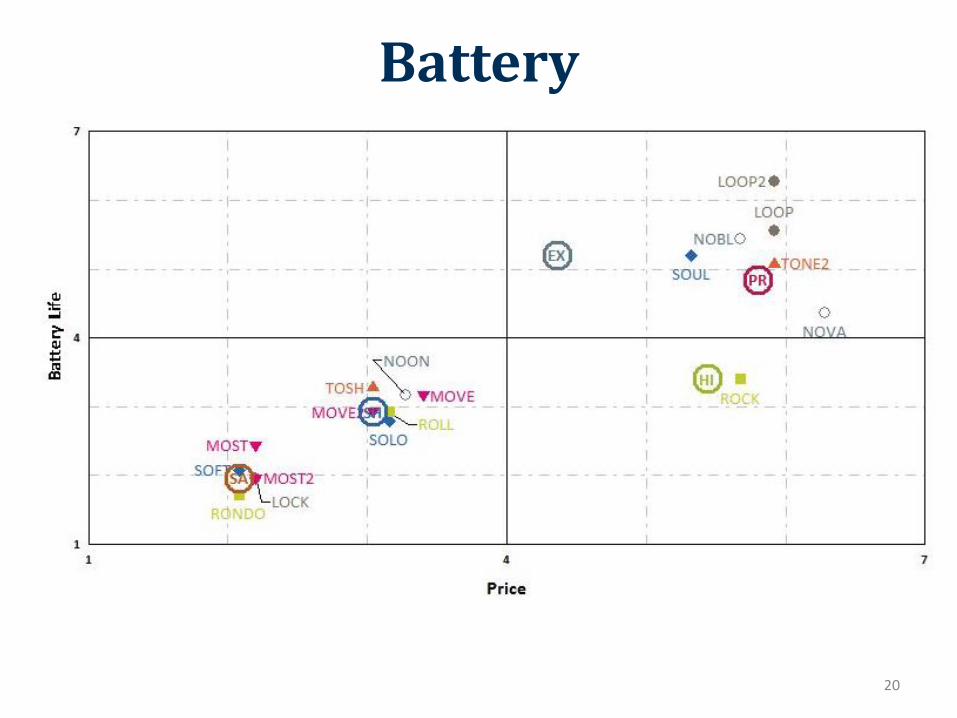
Battery
20

Display
21

Processing Power
22

ROCK ROLL RONDO REVOLT
Production Planning 315,000 330,000 0 55,000
Price $470 $300 $215 $400
Advertising Media $3,500 $3,500 $3,500 $3,500
Advertising Research $100 $100 $100 $100
Segmentation Strategy 100% High Earners
100% Shoppers
100% Savers 100% Followers
Communication Objectives
Price 5.4 PPower 4.1
Price 3 PPower 4.7
Economy 13 Convenience (3)
Price 4.4 Connectivity 3.3
Commercial Team Size ROCK ROLL RONDO REVOLT
Specialty 25 20 15 20
Mass 10 25 35 25
Online 11 10 10 10
23
Period 7 Decisions

24
Period 7 Results

ROCK
• High Earners
• 89.63%
ROLL
• Shoppers
• 44.77%
RONDO
• Savers
• 18.54%
REVOLT
• Followers
• 91%
25
Period 7 Conversion Rates
SONITE Semantic Scales Period 7

Features
27
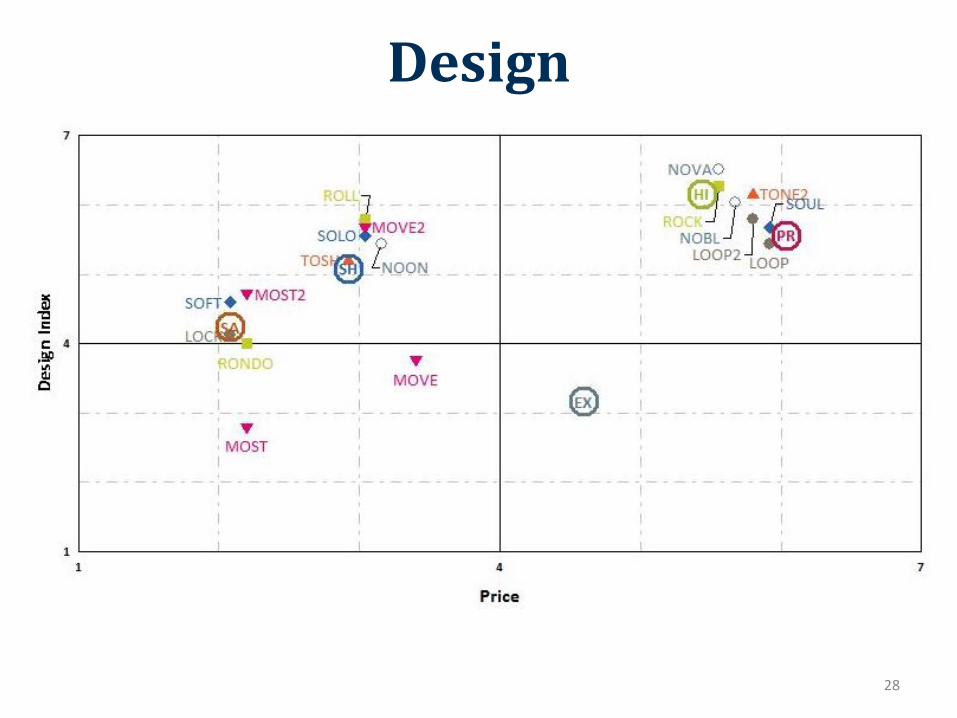
Design
28

Battery
29

Display
30
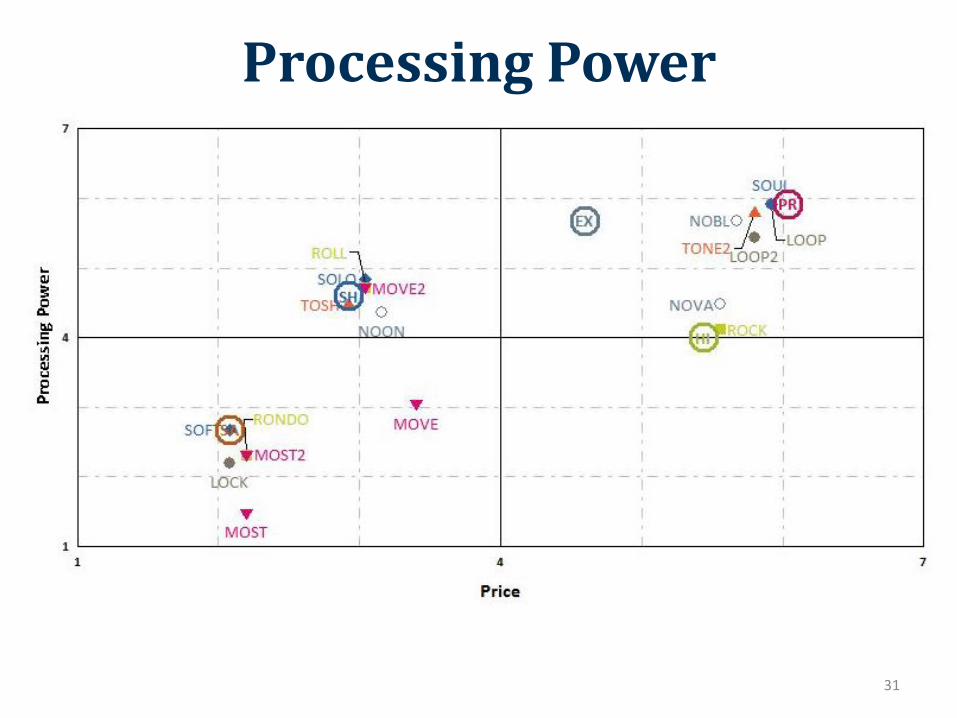
Processing Power
31
VODITE Semantic Scales Period 7
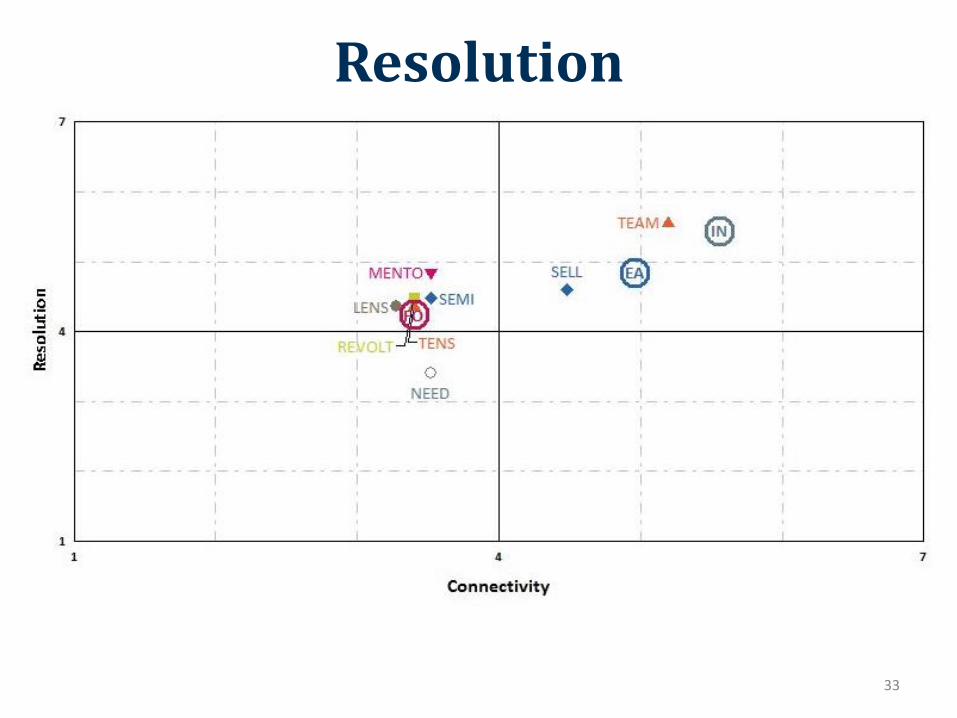
Resolution
33
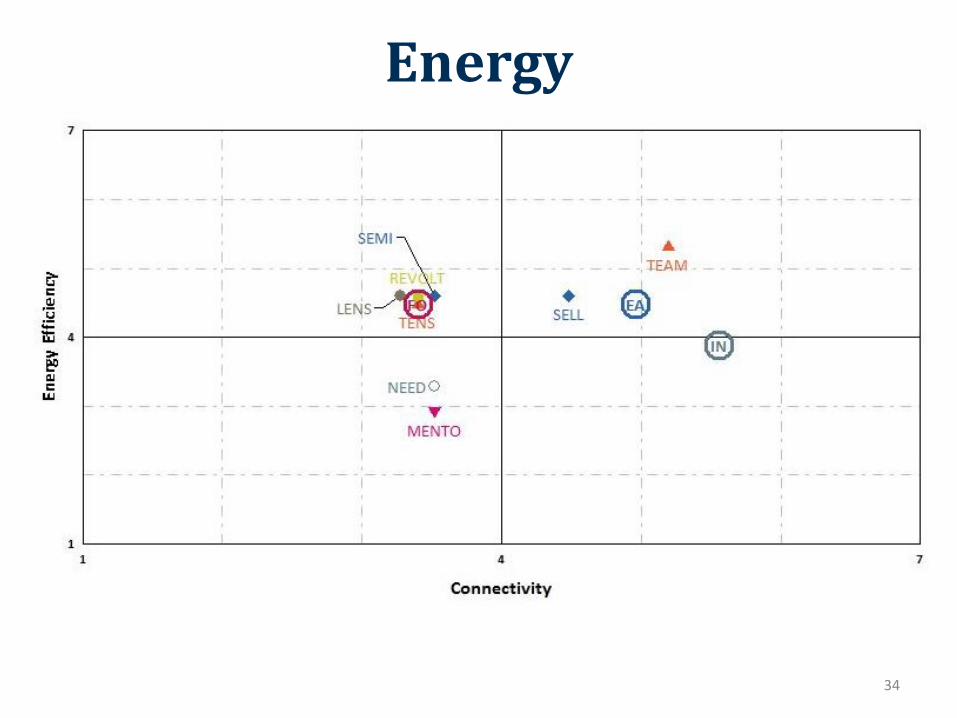
Energy
34
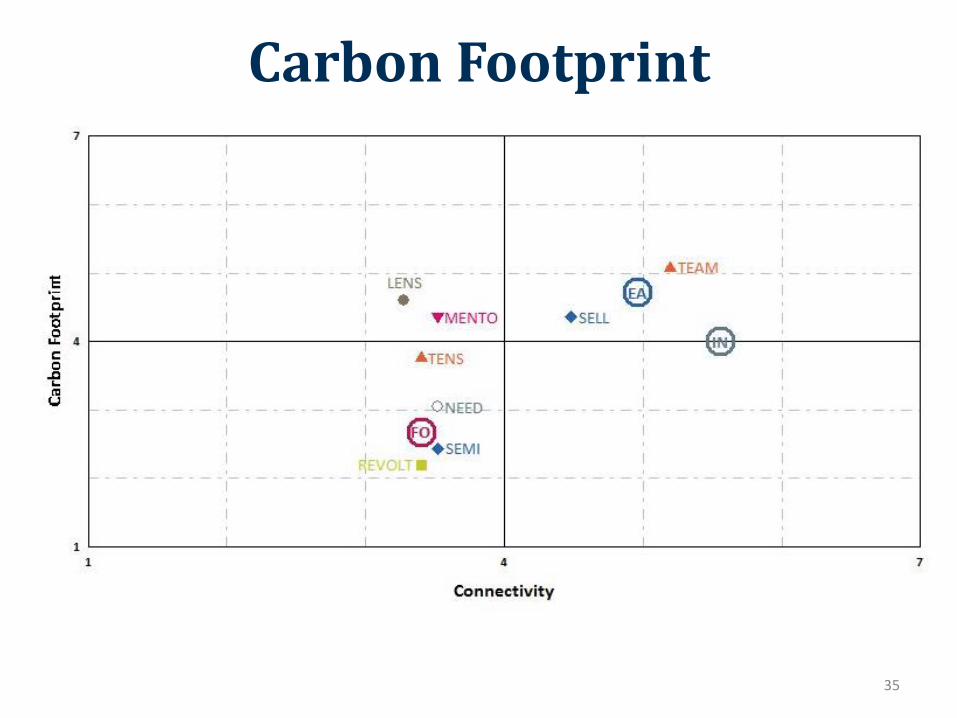
Carbon Footprint
35

Apps
36

Price
37

ROCK ROLL RONDO REVOLT
Production Planning 330,000 350,000 300,000 140,000
Price $470 $280 $205 $400
Advertising Media $3,100 $3,200 $3,500 $3,200
Advertising Research $500 $500 $500 $500
Segmentation Strategy 100% High Earners
100% Shoppers
100% Savers 100% Followers
Communication Objectives
Price 5.4 PPower 3.9
Price 2.9 PPower 4.8
Price 2 PPower 2.7
Price 3.8 Connectivity 2.6
Commercial Team Size ROCK ROLL RONDO REVOLT
Specialty 25 20 15 20
Mass 10 25 35 27
Online 11 10 10 12
38
Period 8 Decisions

Period 8 Results
39
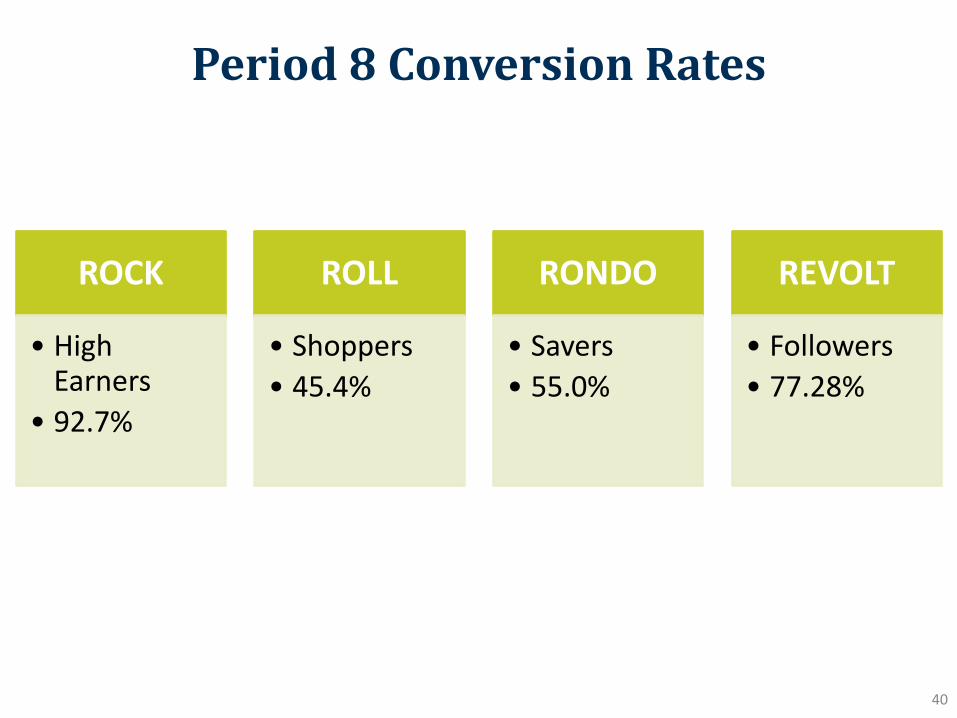
ROCK
• High Earners
• 92.7%
ROLL
• Shoppers
• 45.4%
RONDO
• Savers
• 55.0%
REVOLT
• Followers
• 77.28%
40
Period 8 Conversion Rates
SONITE Semantic Scales Period 8

Features
42

Design
43
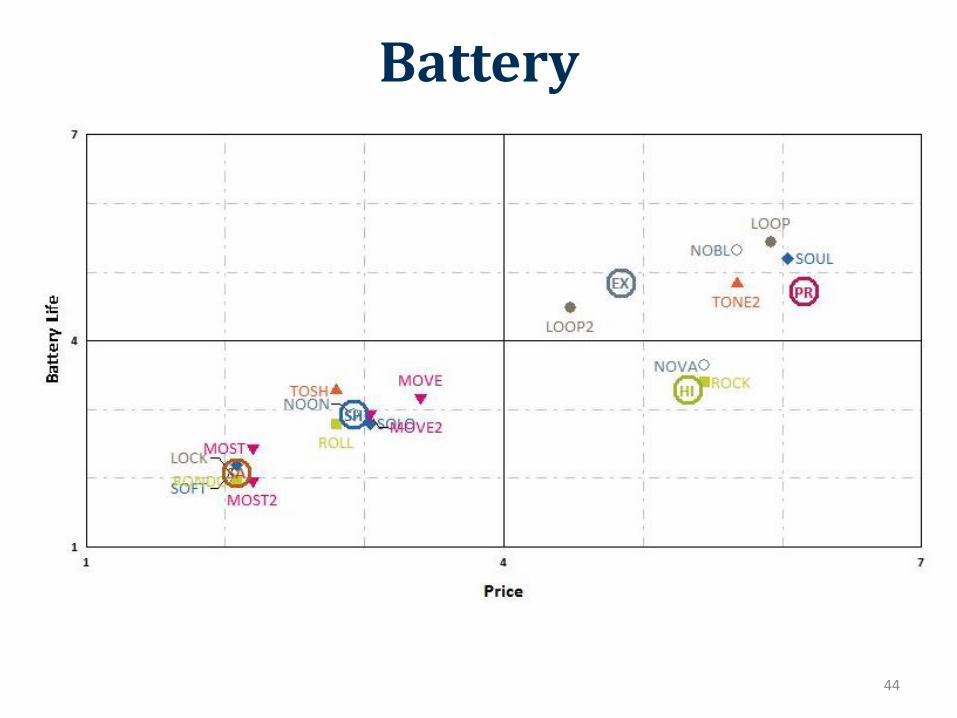
Battery
44
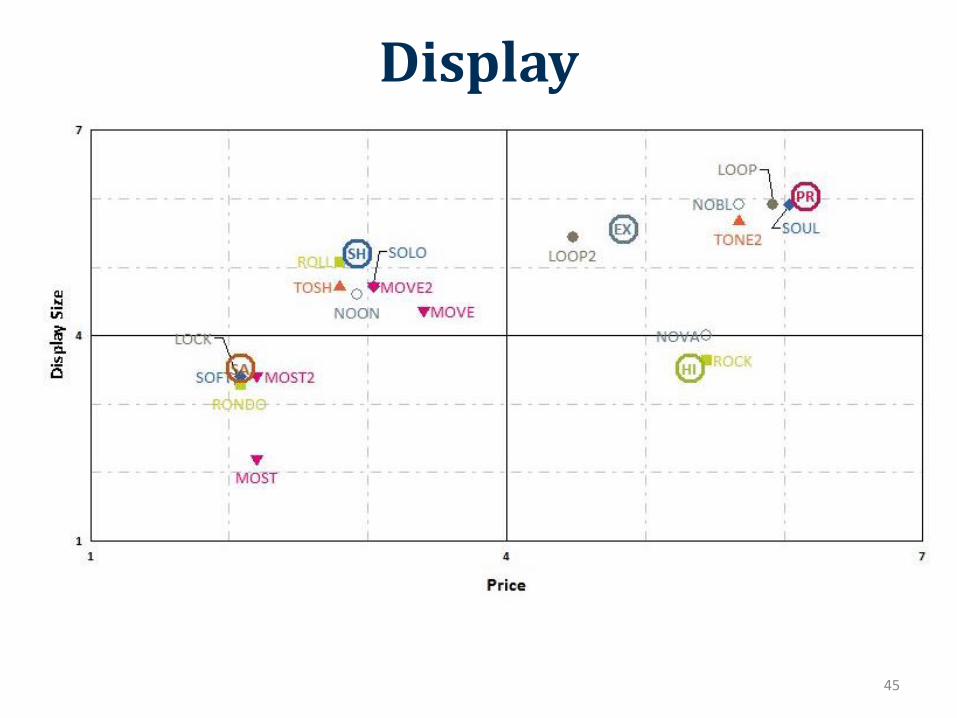
Display
45

Power
46

VODITE Semantic Scales Period 8
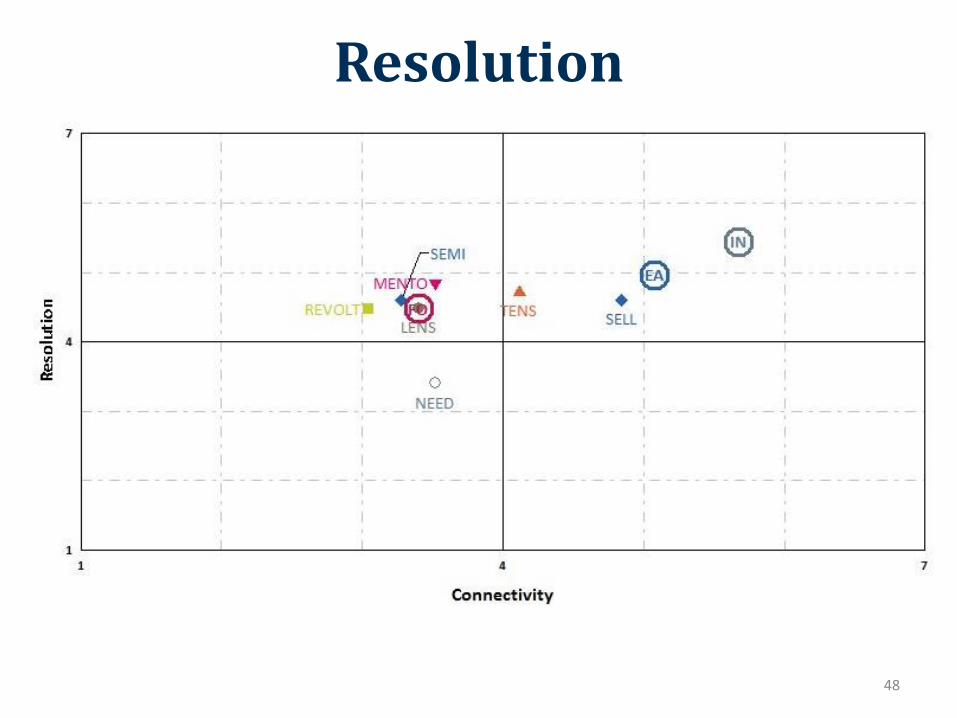
Resolution
48
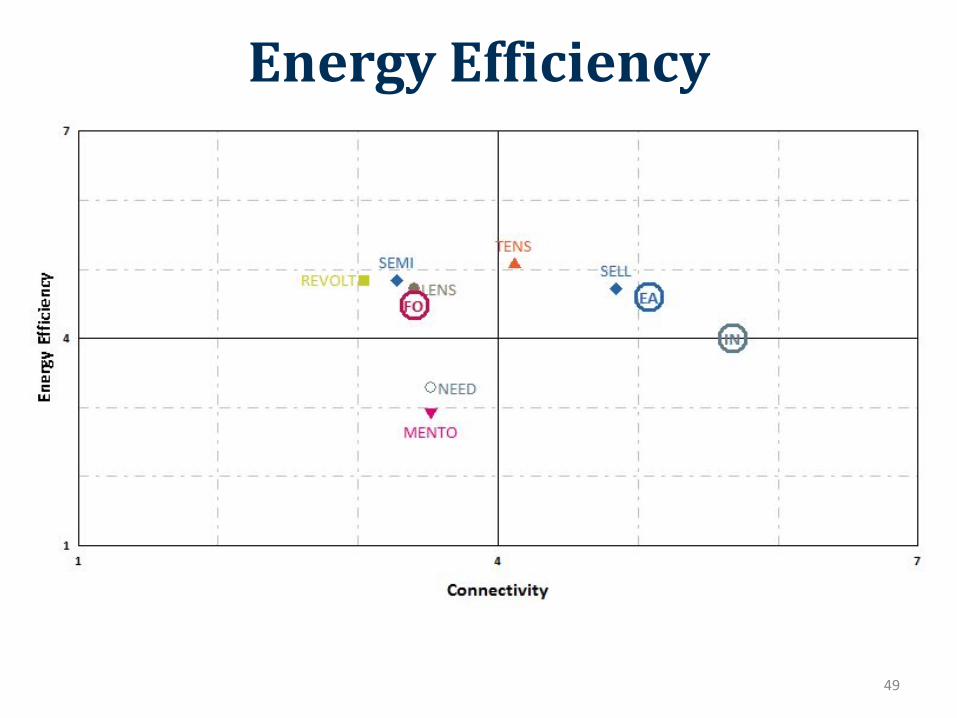
Energy Efficiency
49
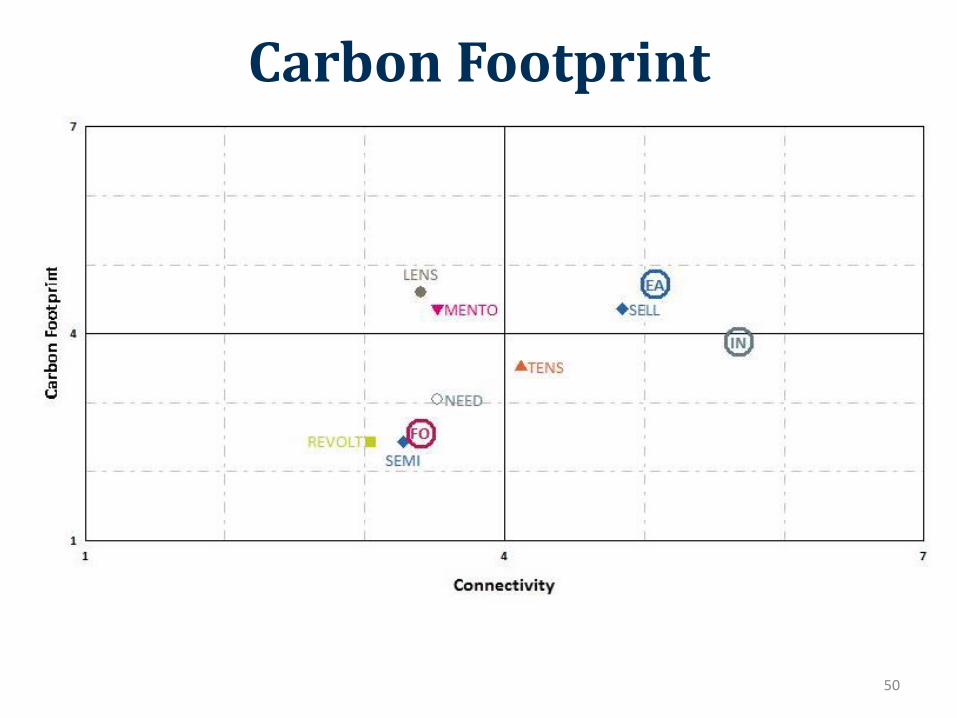
Carbon Footprint
50
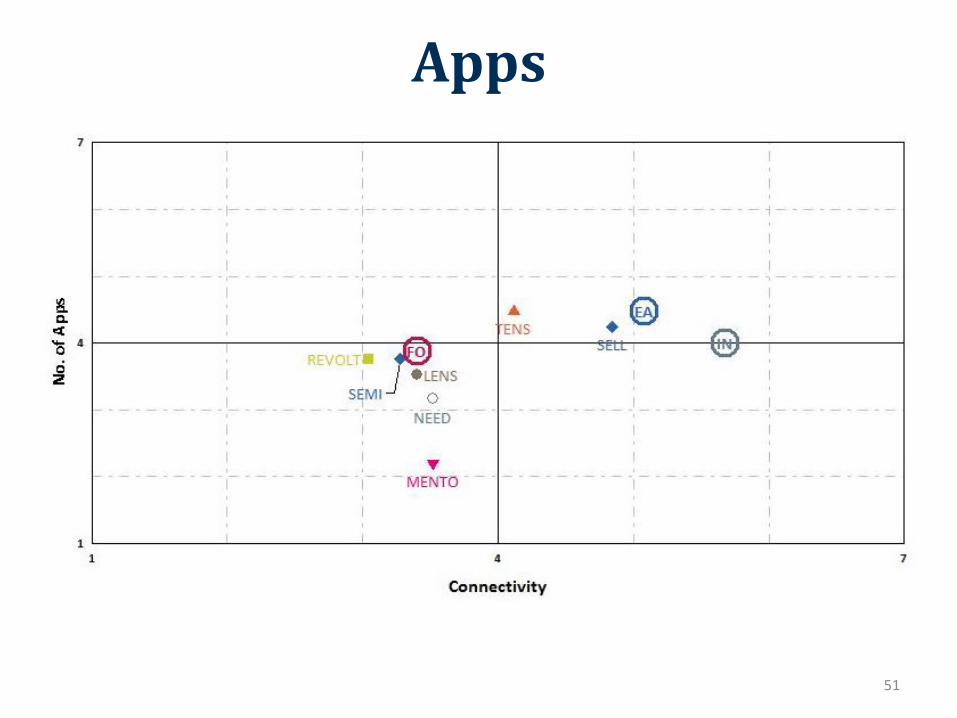
Apps
51
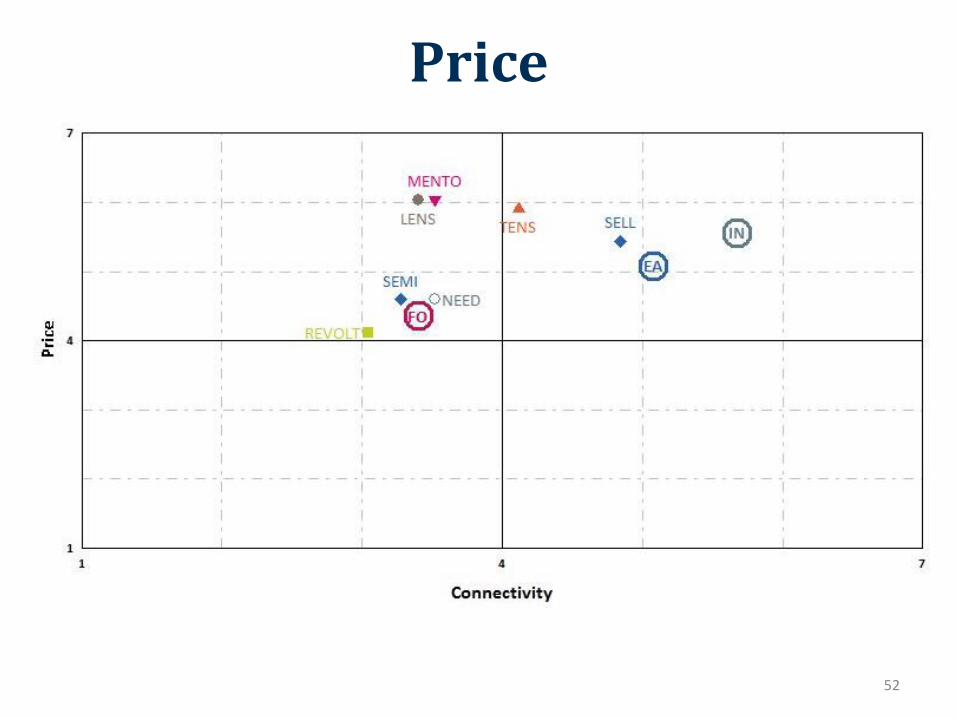
Price
52
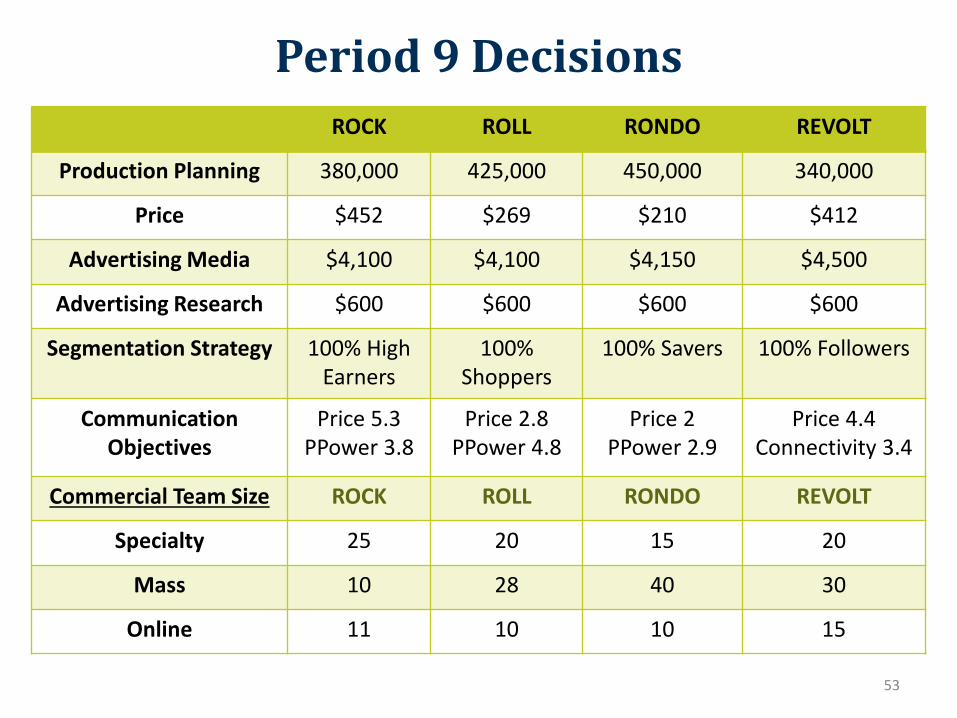
ROCK ROLL RONDO REVOLT
Production Planning 380,000 425,000 450,000 340,000
Price $452 $269 $210 $412
Advertising Media $4,100 $4,100 $4,150 $4,500
Advertising Research $600 $600 $600 $600
Segmentation Strategy 100% High Earners
100% Shoppers
100% Savers 100% Followers
Communication Objectives
Price 5.3 PPower 3.8
Price 2.8 PPower 4.8
Price 2 PPower 2.9
Price 4.4 Connectivity 3.4
Commercial Team Size ROCK ROLL RONDO REVOLT
Specialty 25 20 15 20
Mass 10 28 40 30
Online 11 10 10 15
53
Period 9 Decisions
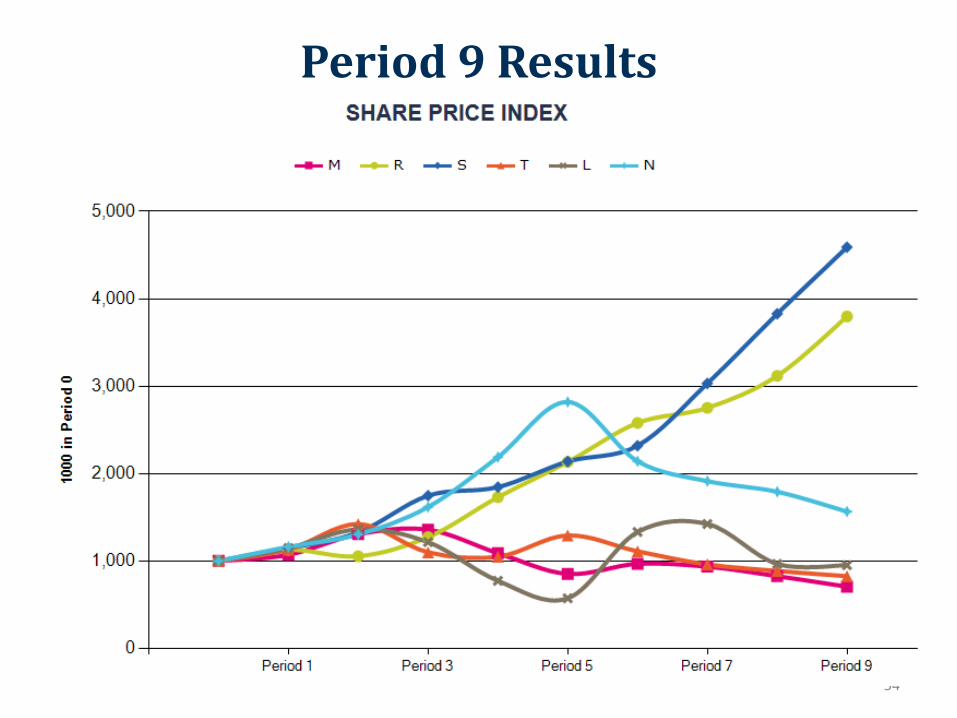
Period 9 Results
54
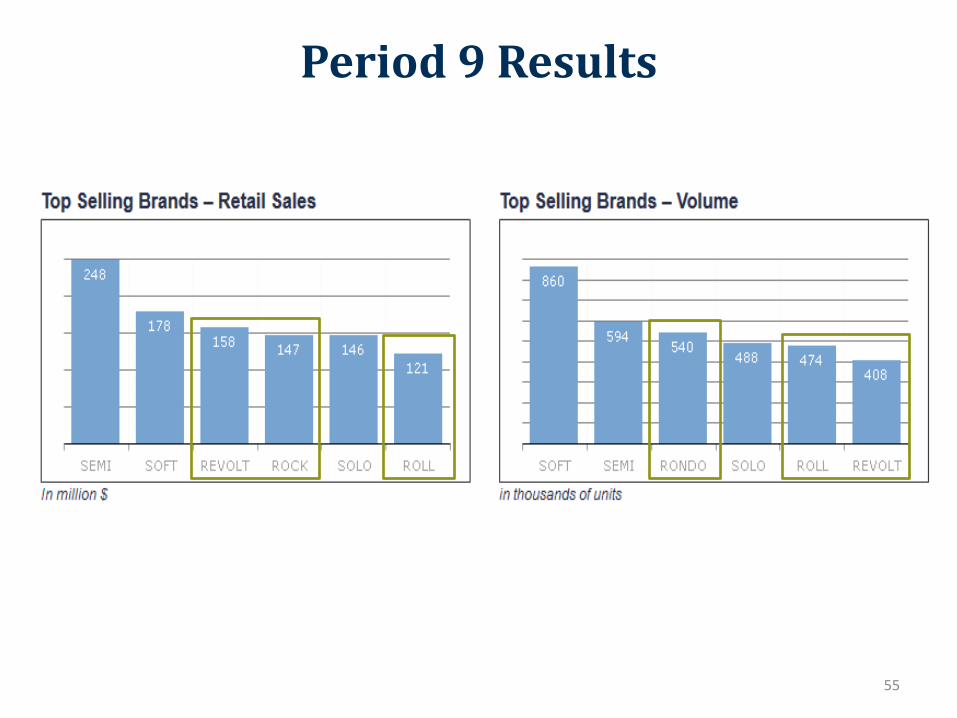
Period 9 Results
55
What we might have done differently
• Better estimates of production
– Each brand was estimated +/- 20% and compared to competitors
• Opportunity to have another Vodite brand
– Relied less on the tools for physical characteristics projections
56
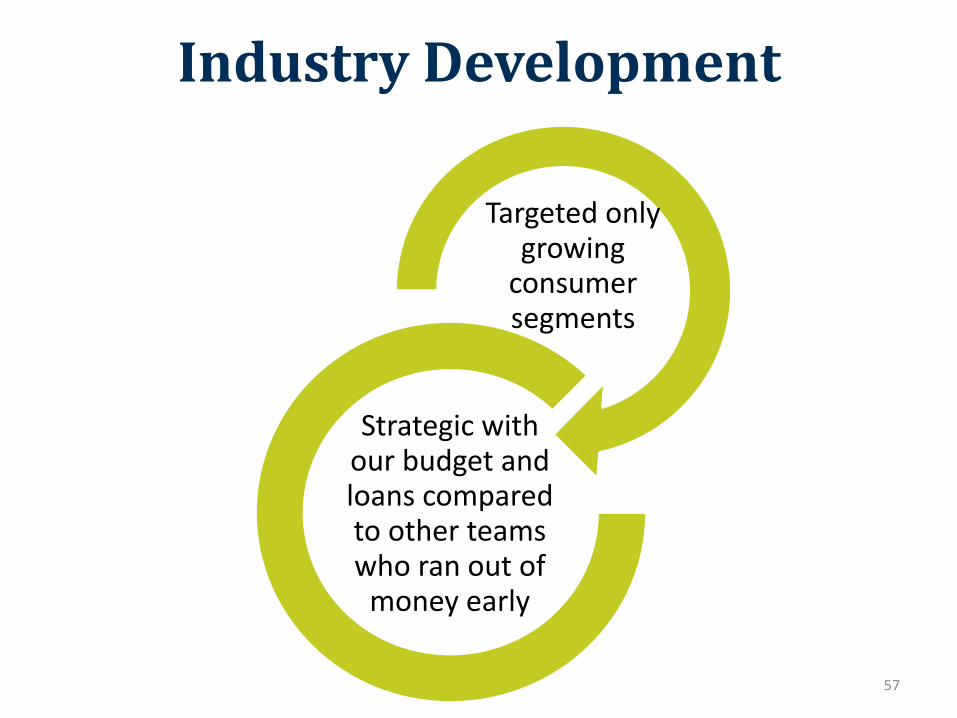
Industry Development
Targeted only growing
consumer segments
Strategic with our budget and loans compared to other teams who ran out of
money early
57
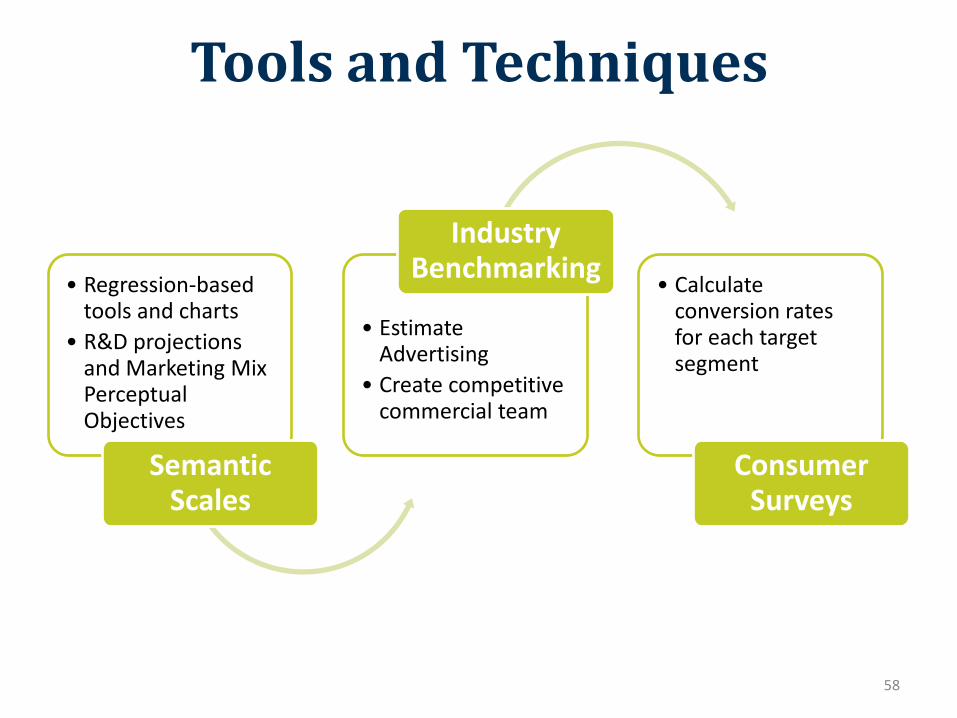
Tools and Techniques
• Regression-based tools and charts
• R&D projections and Marketing Mix Perceptual Objectives
Semantic Scales
• Estimate Advertising
• Create competitive commercial team
Industry Benchmarking
• Calculate conversion rates for each target segment
Consumer Surveys
58
Initial objectives for increasing wealth for our shareholders
1) Providing superior value to our customers by creating brands to target their ideal values, in turn increasing Riskless’ revenue growth
2) Creating future R&D projects that will provide optimal returns on the investments of our stakeholders
3) Constantly representing our brand image by remaining ahead of the competition in each consumer segment
59
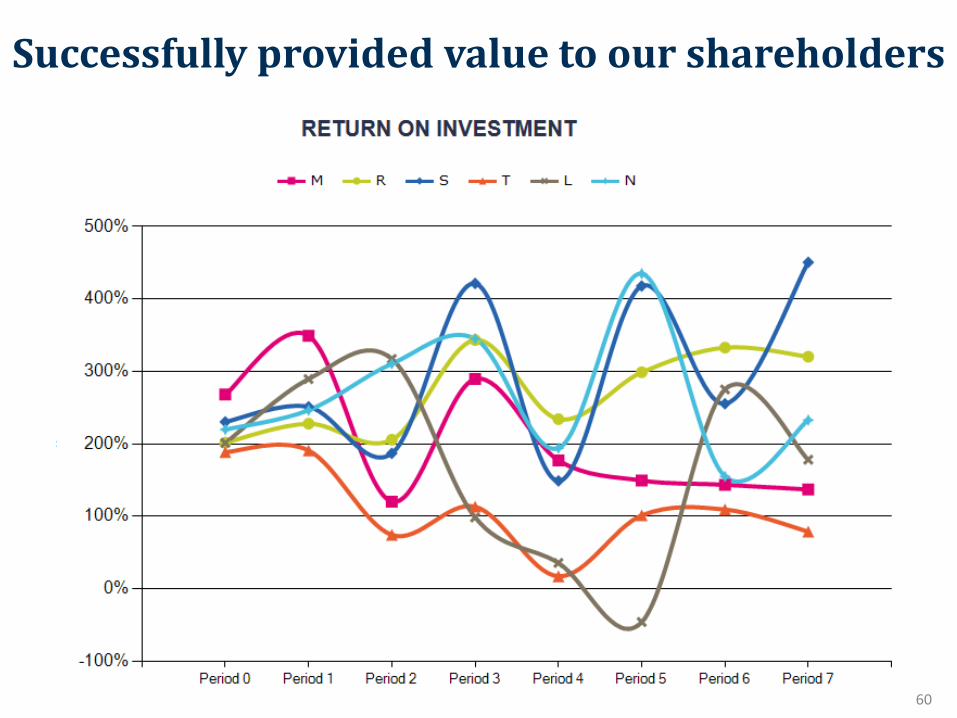
Successfully provided value to our shareholders
60
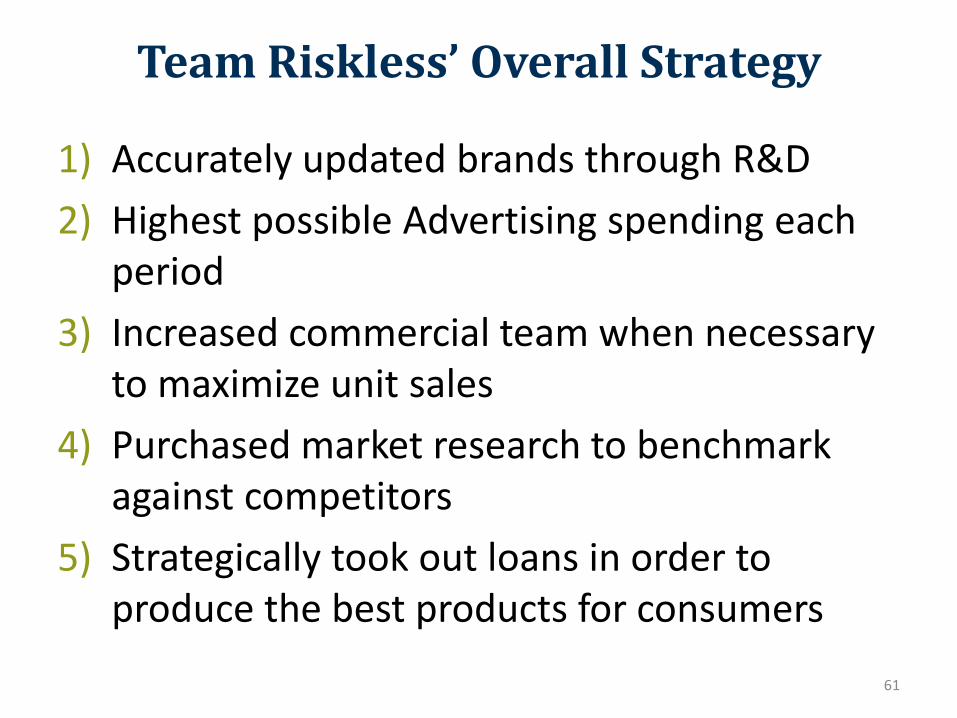
Team Riskless’ Overall Strategy
1) Accurately updated brands through R&D
2) Highest possible Advertising spending each period
3) Increased commercial team when necessary to maximize unit sales
4) Purchased market research to benchmark against competitors
5) Strategically took out loans in order to produce the best products for consumers
61
Questions?
62 Team Riskless: Simon Webb, Kaiqi Zhang, Kara Schulman, Kelsey Kitchen

Appendix A: Forecast
63

64
Appendix B: Period 5 Conversion Rates

Appendix C: Period 6 Conversion Rates
65
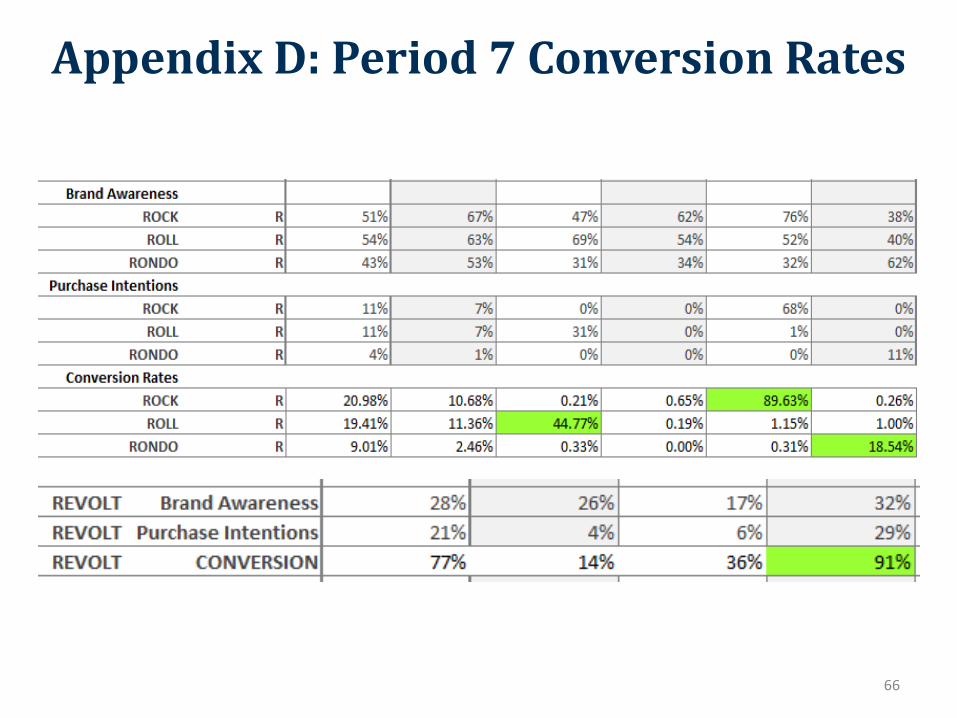
Appendix D: Period 7 Conversion Rates
66
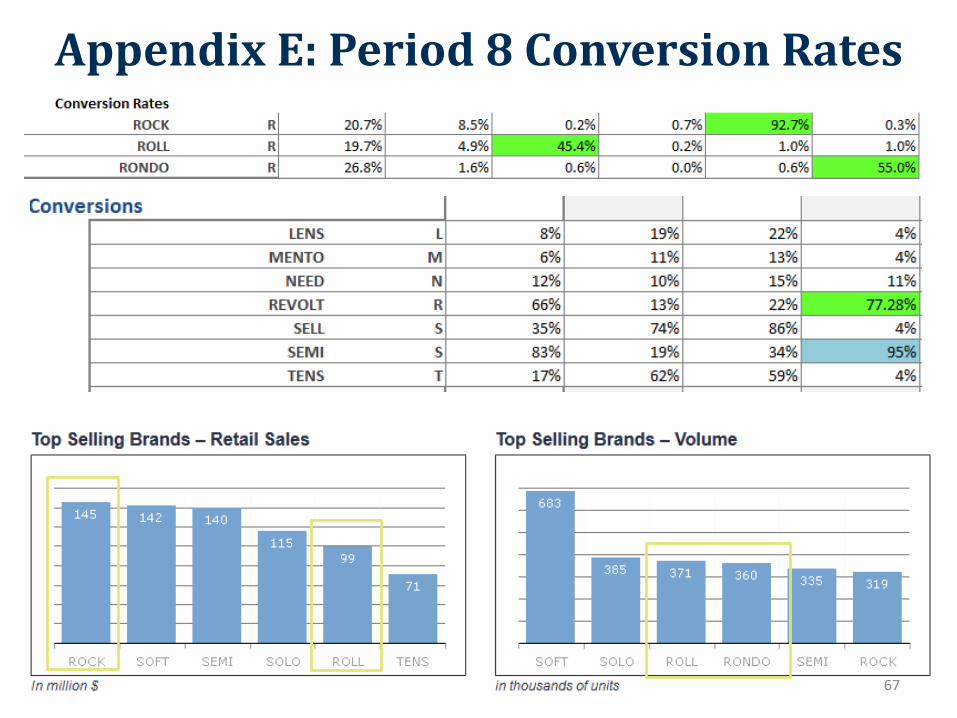
Appendix E: Period 8 Conversion Rates
67