Embed Size (px)
Citation preview
Dennis Coates, Petr Parshakov
TEAM VS. INDIVIDUAL
TOURNAMENTS:
EVIDENCE FROM PRIZE
STRUCTURE IN ESPORTS
BASIC RESEARCH PROGRAM
WORKING PAPERS
SERIES: ECONOMICS
WP BRP 138/EC/2016
This Working Paper is an output of a research project implemented at the National Research University Higher
School of Economics (HSE). Any opinions or claims contained in this Working Paper do not necessarily reflect the
views of HSE
Dennis Coates1,1 Petr Parshakov
22
TEAM VS. INDIVIDUAL TOURNAMENTS:
EVIDENCE FROM PRIZE STRUCTURE IN ESPORTS3
This study tests the implications of tournament theory using data on eSports (video game)
competitions. We incorporate team production with the theory of rank order elimination
tournaments since in our analysis, competitors in an elimination tournament are groups rather
than individuals. In this setting, the issue of proper incentives becomes more complicated than
in the normal tournament model. Our findings demonstrate that the prize structure is convex in
rank order which means that the contestants in eSports tournaments are risk averse. The results
for the team games are more consistent with the tournament theory than the results for individual
games. From the practical point of view, we provide decision-makers in both sports and business
with the insights about the compensation design with respect to importance of the competition
and its type.
JEL Classification: Z20, J3
Keywords: tournament theory, eSports, video games, team production.
11
Department of Economics, UMBC, Baltimore, MD 21250; [email protected] 22
National Research University Higher School of Economics. International laboratory of
intangible-driven economy. E-mail: [email protected] 3 The authors are grateful to Marina Zavertiaeva, Iuliia Naidenova, Angel Barajas, Elena Shakina, Mariia Molodchik, Tim
Pawlowski, participants of Perm Workshop on Applied Economic Modeling, participants of SEA 2015 annual meeting and
participants of HSE April conference 2016 for useful comments. We are immensely grateful to Jason Ureta and his project
(www.esportsearnings.com) for the important data. This study comprises research findings from the «Intangible-driven dynamics
in economics and finance» carried out within International Laboratory of Intangible-driven Economy (ID Lab) of the National
Research University Higher School of Economics’ Basic Research Program in 2016.
3
Introduction
Lazear and Rosen (1981) introduced rank order tournaments as optimal labor contracts and
Rosen (1986) extended the analysis to elimination tournaments. Lazear and Rosen (1981)
suggested large salary dispersion can lead to greater effort and higher productivity. Levine
(1991) argues that by equalizing salaries a firm may improve cohesion and, therefore,
productivity. Ehrenberg and Bognanno (1990) tested the theory by examining the impact of
prize structure in golf tournaments on performance of golfers. Since that time, the predictions of
tournament theory have been studied in a number of sporting contexts including auto racing
(Becker and Huselid, 1992; Depken and Wilson, 2004), marathons (Frick et al., 2007), tennis
(Gilsdorf and Sukhatme, 2008) and in the presence of superstars (Brown, 2011).
A closely related literature has developed examining production in teams. Beginning with
Alchian and Demsetz (1972) team production models have focused on getting incentives right
such that team members do not shirk their responsibilities or sabotage the efforts of the team.
For example, Winter (2004) and Gould and Winter (2009) develop models where individual
team members may increase or decrease their effort in response to increased effort by
teammates. Ramaswamy and Rowthorn (1991) adapt an efficiency wage model to develop an
efficient distribution of wages in which they find that the worker with the greatest ability to
sabotage the group effort gets the highest wage.
Empirical work has tested the tournament versus cohesion theory both in the business
world and in the sporting context. Evidence is mixed in the sporting context with improved
performance with more equal salary distribution in Major League Baseball (Bloom, 1999;
DeBrock et al., 2004; Depken, 2000) but in the National Basketball Association performance
improves with less equal distribution (Simmons and Berri, 2011) or there is no effect (Berri and
Jewell, 2004; Katayama and Nuch, 2011). Franck and Nüesch (2011) and Coates et al. (2014)
study salary dispersion and team performance in the Bundesliga and Major League Soccer,
respectively. Frank and Neusch find a U-shaped relationship while Coates et al. find that team
4
production falls with more unequal salary distribution. Frick et al. (2003) study the National
Football League and Kahane (2012) studies the National Hockey League.
This paper incorporates team production with the theory of rank order elimination
tournaments. Existing literature focuses on individual sports, golf, tennis, marathons and auto
racing, of which only tennis is of the elimination tournament variety, or team sports which are
not elimination tournaments. In our analysis, competitors in an elimination tournament are
groups rather than individuals. In this setting, the issue of proper incentives becomes more
complicated than in the normal tournament model. The tournament organizer will want to induce
teams to compete especially hard for the first prize, as in the standard model, but the tournament
organizer and the team organizer will want to induce the best effort out of all members of a team.
The competition studied is video games. The paper begins by describing video game
competitions including documenting the growth in competitive video gaming as well as in the
value of prizes to be won. There is an active player market as well, with players being recruited
to top teams by investors and compensation sufficiently large that players need not have other
jobs. The paper describes tournament theory and provides an overview of the empirical
literature before turning to the data for this analysis and the methodology. The paper ends with a
presentation and discussion of empirical results and a conclusion.
Theoretical background
eSports
To date there is no common definition of eSports. Wagner (2006) defines eSports as “an
area of sport activities in which people develop and train mental or physical abilities in the use of
information and communication technologies”. Witkowski (2012) criticized this definition
because many aspects of traditional sports are computer-assisted or computer-mediated. Another
definition is available from Hamari and Sjöblom (2015), who regard eSports as “a form of sports
where the primary aspects of the sport are facilitated by electronic systems; the input of players
5
and teams as well as the output of the eSports system are mediated by human-computer
interfaces”.
Since eSports are an emerging form of activity, there are only a few studies devoted to this
particular field. In general, the literature on eSports is very limited, with most papers focusing on
the definition of this phenomenon and its future implications (Seo, 2013; Seo and Jung, 2014;
Taylor, 2012; Taylor and Witkowski, 2010).
The history of eSports tournaments is quite long. The first such event took place at
Stanford University in 1972. It was called the “Intergalactic Spacewar Olympics” and the prize
was a subscription to Rolling Stone magazine (Hiltscher and Scholz, 2015). However, the
industry of eSports events considerably evolved during the 1990s. With the establishment of the
Cyberathlete Professional League (CPL) in 1997, tournament prize pools became larger due to
corporate sponsorship and an increasing number of spectators, both online and live (Gaudiosi,
2013). For now, CPL is inactive and has been substituted by the Electronic Sports League (ESL).
Until 2011, the largest eSports event was the World Cyber Games (WCG). This event was
regarded as the eSports Olympics (Svoboda, 2004), whereas the biggest event is currently
DreamHack, which comprises tournaments for the most popular games. Sponsorship is the core
funding system for eSports tournaments (Taylor, 2012, p.154). There are different kinds of
sponsors. Game producers are interested in promoting their games through these tournaments.
Hardware producers are also natural eSports sponsors (SteelSeries, MSI, Intel). There are also
companies that promote their goods using eSports, such as Coca-Cola (“Coca-Cola and Riot
Games Renew Partnership for 2015: The Coca-Cola Company”, 2015). Seo's (2013) study was
one of the first attempts to analyze the marketing aspects of eSports.
eSports games can be categorized into different genres. For example, games can be
multiplayer online battle arena games, real-time strategy games or tactical first-person shooter
games. There are sports games, racing games and fighting games. However, based on
cumulative tournament prize money, the top five games come from the multiplayer online battle
6
arena, real-time strategy or tactical first-person shooter genres. These games are Dota 2, League
of Legends, StarCraft II, Counter-Strike: Global Offensive, and Counter-Strike (“Top 50 Games
Awarding Prize Money - eSports Game Rankings: eSports Earnings”, 2015).
There are offline (so called “LAN” tournaments; LAN is a local area network in contrast to
internet-based or online tournaments) and online competitions for most games. The leading
tournaments are held offline and take place in front of live spectators. The most common format
is a double-elimination system, whereas the format in the case of a low number of participants is
a single-elimination system. Big events also have a group stage as a preliminary competition
before the playoffs stage. Parshakov and Zavertiaeva (2015) underline the difference between
prizes for online and offline tournaments. They show that 78% of gamers prize money is earned
from offline tournaments. eSport competitons are structured like many regular sport
competitions and a natural question is to what extent their incentive structure follows tournament
theory.
Tournament theory and prize structure
Tournament theory is concerned with groups of agents that compete for a prize. The key
feature of tournament theory is that the reward is based on relative rank (Lazear and Rosen,
1981). The reward for tournament winners is designed to maximize the effort of all contestants.
Since the reward can be either monetary or nonmonetary, tournament theory has implications in
a wide range of fields. For example, tournament theory explains how judges compete for the
ultimate prize, which is a decision from the US Supreme Court (Choi and Gulati, 2004), or how
contract growers vie to supply broiler chickens to Perdue and Tyson (Knoeber and Thurman,
1994). It also explains compensation structures (Messersmith et al., 2011). Sporting events
provide a natural context for tournament theory (Depken and Wilson, 2004; Melton and Zorn,
2000).
7
To maximize effort, the prize spread in a tournament should be optimized. By prize spread,
we mean the difference between the prize for winning the current level and the prize for winning
the next level in sequential elimination tournaments (Becker and Huselid, 1992; Messersmith et
al., 2011). A sequential elimination is a tournament organized in such a way that winners of the
current stage compete in the next stage against other winning actors (Choi and Gulati, 2004;
O’Neill and O’Reilly, 2010). As such, the optimal prize structure involves a prize spread that
maximizes the ratio of actor effort to the prize. If it is too small, actors are not incentivized to
maximize their effort. If it is too high, actors take on an additional risk of losing and need to be
separately compensated for such a risk (DeVaro, 2006; Kepes et al., 2009). Using data from
automobile racing, some studies find that nonlinear rewards may be associated with more risky
behavior (Depken and Wilson, 2004; Schwartz et al., 2007).
A number of theoretical papers show that tournament theory suggests a reward structure
that allows for a competition to be organized with optimal effort (Baker et al., 1988; Lazear,
1999; Lazear and Rosen, 1981; Prendergast, 1999). Rosen (1986, p.705) shows that, for risk-
neutral contestants, the inter-rank spreads are constant until the final stages, at which point the
inter-rank spread will exhibit a distinct and substantial increase in this linear function. Rosen also
demonstrated that “if players are risk-averse, the incentive maintaining prize structure requires
strictly increasing interrank spreads, with an even larger increment between first and second
place.” (Rosen, 1986, p. 706). We formulate two research hypotheses concerning the structure of
prizes in eSports:
1. the function describing the relationship between prize and rank is convex;
2. the difference in prize (inter-rank spread) for the final stage contestants, relative to
the lower stage contestants, should be extraordinarily large in relation to the inter-
rank spread for the contestants in the lower stages.
Such hypotheses were tested in the business context. Lambert et al. (1993) and Conyon et
al. (2001) found convex relationships between executive pay and organizational levels.
8
However, in business, there are significant nonmonetary incentives for the contestants. This
presents a limitation in such research, since tournament theory supposes that “the prize is
presumed to be the actors’ predominant motive. Research that incorporates more complex social
understandings of actor objectives may be beneficial” (Connelly et al., 2013, p.29). However,
since the reward is mostly performance-based in eSports (Parshakov and Zavertiaeva, 2015), this
provides us with perfect data for testing the implications of tournament theory.
Data
To test the implications of tournament theory in the context of eSports, we use data on
prizes that players win in tournaments. We obtained this information from the results of the
eSports Earnings project. This resource is based on freely available public information on
different tournaments in eSports, the nicknames of winners and the sums won. The eSports
Earnings website contains information on each gamer’s prize earnings for each tournament (in
dollars) for the period from 1999 to 2014. Nominal prizes are corrected in line with the official
US inflation rates.
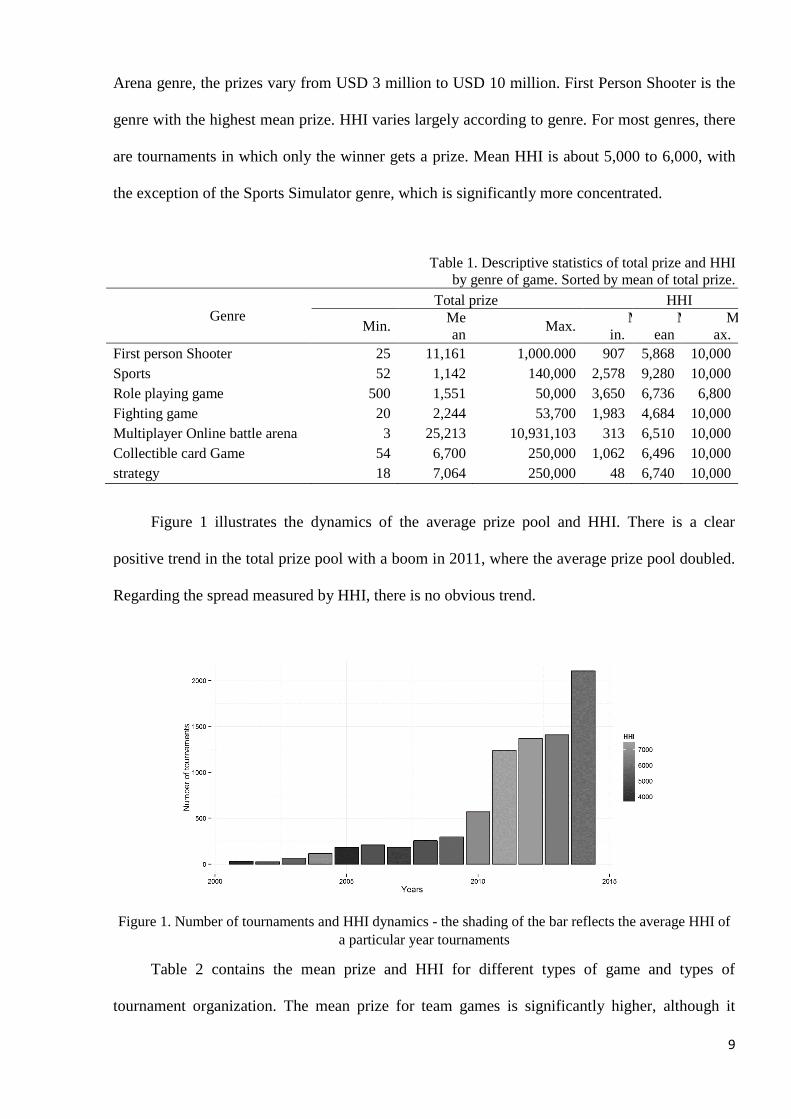
Table 1 presents some of the descriptive statistics for prizes and prize concertation. A
typical tournament has prizes for the top eight winners. For some tournaments, especially
individual, this number might be lower. For descriptive purposes, we calculate the Herfindahl-
Hirschman Index (HHI) to estimate the concentration of the prizes. HHI is calculated as follows:
𝐻𝐻𝐼𝑖 = ∑ (𝑝𝑟𝑖𝑧𝑒𝑖
∑ 𝑝𝑟𝑖𝑧𝑒𝑖8𝑖=1
⋅ 100)
2𝑛
𝑖=1
where 𝑝𝑟𝑖𝑧𝑒𝑖 is the prize of the gamer of rank i and n is the number of winners. The higher
the HHI, the bigger the spread between winners’ prizes. For the perfectly concentrated
tournament, where the winner takes all of the prize pool, HHI is equal to 10,000.
As one can see from Table 1, the total prize pool varies game by game. However, even for
one game, the variation in prize pool is large. For example, for the Multiplayer Online Battle
9
Arena genre, the prizes vary from USD 3 million to USD 10 million. First Person Shooter is the
genre with the highest mean prize. HHI varies largely according to genre. For most genres, there
are tournaments in which only the winner gets a prize. Mean HHI is about 5,000 to 6,000, with
the exception of the Sports Simulator genre, which is significantly more concentrated.
Table 1. Descriptive statistics of total prize and HHI
by genre of game. Sorted by mean of total prize.
Genre Total prize HHI
Min. Me
an Max.
M
in.
M
ean
M
ax.
First person Shooter 25 11,161 1,000.000 907 5,868 10,000
Sports 52 1,142 140,000 2,578 9,280 10,000
Role playing game 500 1,551 50,000 3,650 6,736 6,800
Fighting game 20 2,244 53,700 1,983 4,684 10,000
Multiplayer Online battle arena 3 25,213 10,931,103 313 6,510 10,000
Collectible card Game 54 6,700 250,000 1,062 6,496 10,000
strategy 18 7,064 250,000 48 6,740 10,000
Figure 1 illustrates the dynamics of the average prize pool and HHI. There is a clear
positive trend in the total prize pool with a boom in 2011, where the average prize pool doubled.
Regarding the spread measured by HHI, there is no obvious trend.
Figure 1. Number of tournaments and HHI dynamics - the shading of the bar reflects the average HHI of
a particular year tournaments
Table 2 contains the mean prize and HHI for different types of game and types of
tournament organization. The mean prize for team games is significantly higher, although it
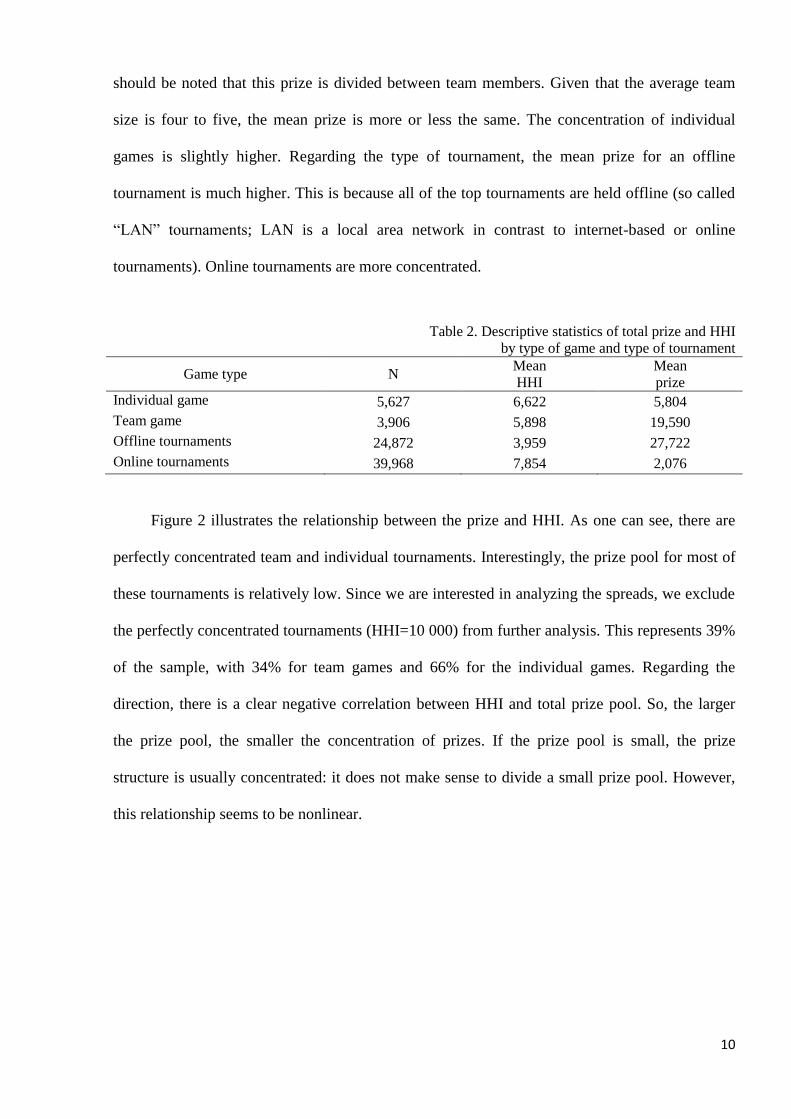
10
should be noted that this prize is divided between team members. Given that the average team
size is four to five, the mean prize is more or less the same. The concentration of individual
games is slightly higher. Regarding the type of tournament, the mean prize for an offline
tournament is much higher. This is because all of the top tournaments are held offline (so called
“LAN” tournaments; LAN is a local area network in contrast to internet-based or online
tournaments). Online tournaments are more concentrated.
Table 2. Descriptive statistics of total prize and HHI
by type of game and type of tournament
Game type N Mean
HHI
Mean
prize
Individual game 5,627 6,622 5,804
Team game 3,906 5,898 19,590
Offline tournaments 24,872 3,959 27,722
Online tournaments 39,968 7,854 2,076
Figure 2 illustrates the relationship between the prize and HHI. As one can see, there are
perfectly concentrated team and individual tournaments. Interestingly, the prize pool for most of
these tournaments is relatively low. Since we are interested in analyzing the spreads, we exclude
the perfectly concentrated tournaments (HHI=10 000) from further analysis. This represents 39%
of the sample, with 34% for team games and 66% for the individual games. Regarding the
direction, there is a clear negative correlation between HHI and total prize pool. So, the larger
the prize pool, the smaller the concentration of prizes. If the prize pool is small, the prize
structure is usually concentrated: it does not make sense to divide a small prize pool. However,
this relationship seems to be nonlinear.
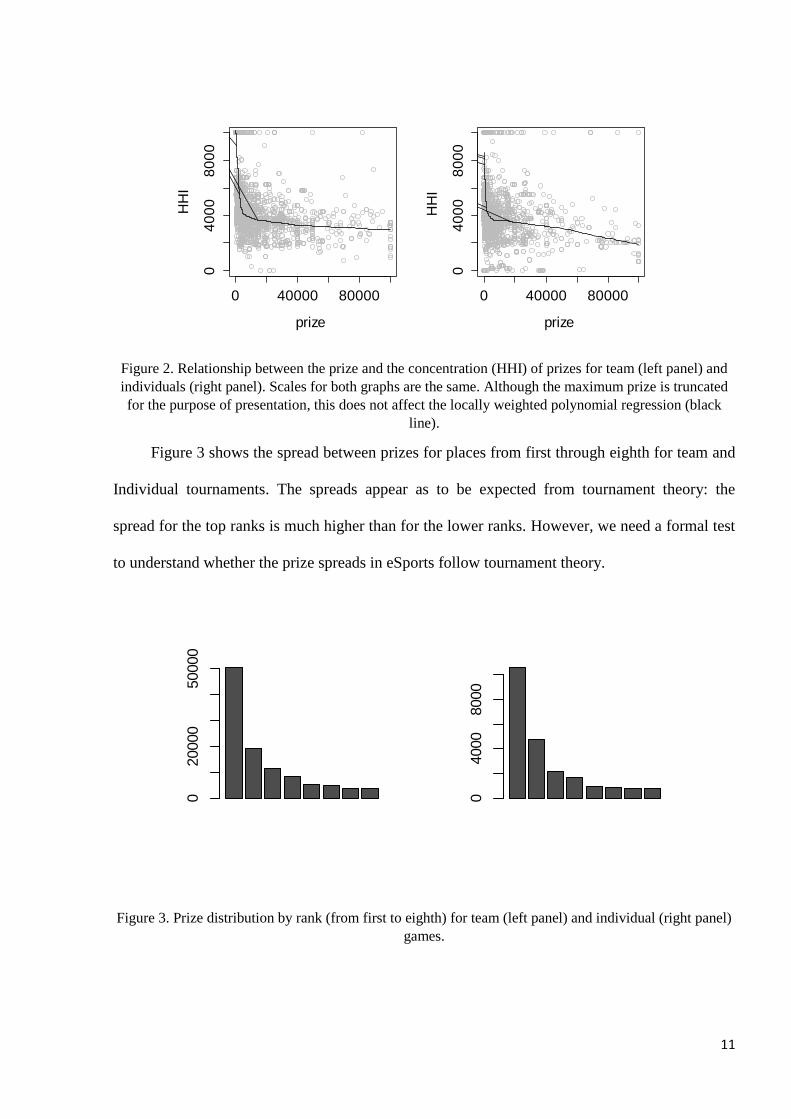
11
Figure 2. Relationship between the prize and the concentration (HHI) of prizes for team (left panel) and
individuals (right panel). Scales for both graphs are the same. Although the maximum prize is truncated
for the purpose of presentation, this does not affect the locally weighted polynomial regression (black
line).
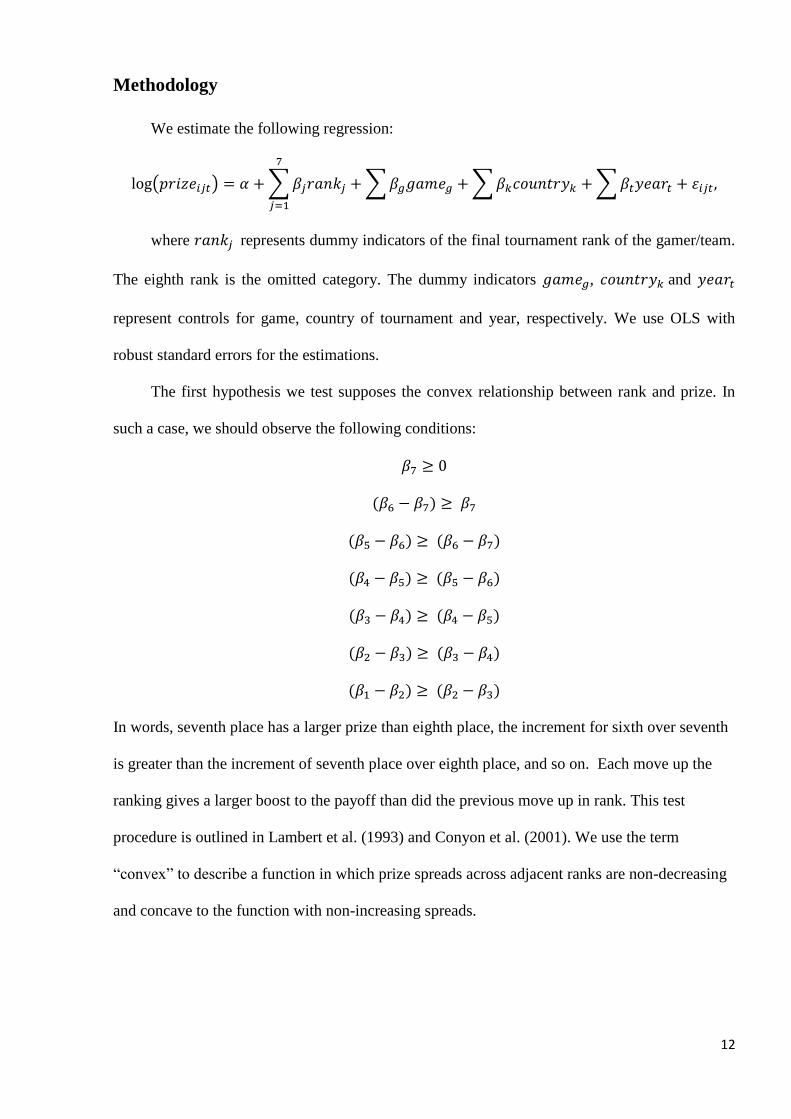
Figure 3 shows the spread between prizes for places from first through eighth for team and
Individual tournaments. The spreads appear as to be expected from tournament theory: the
spread for the top ranks is much higher than for the lower ranks. However, we need a formal test
to understand whether the prize spreads in eSports follow tournament theory.
Figure 3. Prize distribution by rank (from first to eighth) for team (left panel) and individual (right panel)
games.
0 40000 80000
04
00
08
00
0
prize
HH
I
0 40000 80000
04
00
08
00
0
prize
HH
I
020000
50000
04000
8000
12
Methodology
We estimate the following regression:
log(𝑝𝑟𝑖𝑧𝑒𝑖𝑗𝑡) = 𝛼 + ∑ 𝛽𝑗𝑟𝑎𝑛𝑘𝑗
7
𝑗=1
+ ∑ 𝛽𝑔𝑔𝑎𝑚𝑒𝑔 + ∑ 𝛽𝑘𝑐𝑜𝑢𝑛𝑡𝑟𝑦𝑘 + ∑ 𝛽𝑡𝑦𝑒𝑎𝑟𝑡 + 𝜀𝑖𝑗𝑡,
where 𝑟𝑎𝑛𝑘𝑗 represents dummy indicators of the final tournament rank of the gamer/team.
The eighth rank is the omitted category. The dummy indicators 𝑔𝑎𝑚𝑒𝑔, 𝑐𝑜𝑢𝑛𝑡𝑟𝑦𝑘 and 𝑦𝑒𝑎𝑟𝑡
represent controls for game, country of tournament and year, respectively. We use OLS with
robust standard errors for the estimations.
The first hypothesis we test supposes the convex relationship between rank and prize. In
such a case, we should observe the following conditions:
𝛽7 ≥ 0
(𝛽6 − 𝛽7) ≥ 𝛽7
(𝛽5 − 𝛽6) ≥ (𝛽6 − 𝛽7)
(𝛽4 − 𝛽5) ≥ (𝛽5 − 𝛽6)
(𝛽3 − 𝛽4) ≥ (𝛽4 − 𝛽5)
(𝛽2 − 𝛽3) ≥ (𝛽3 − 𝛽4)
(𝛽1 − 𝛽2) ≥ (𝛽2 − 𝛽3)
In words, seventh place has a larger prize than eighth place, the increment for sixth over seventh
is greater than the increment of seventh place over eighth place, and so on. Each move up the
ranking gives a larger boost to the payoff than did the previous move up in rank. This test
procedure is outlined in Lambert et al. (1993) and Conyon et al. (2001). We use the term
“convex” to describe a function in which prize spreads across adjacent ranks are non-decreasing
and concave to the function with non-increasing spreads.
13
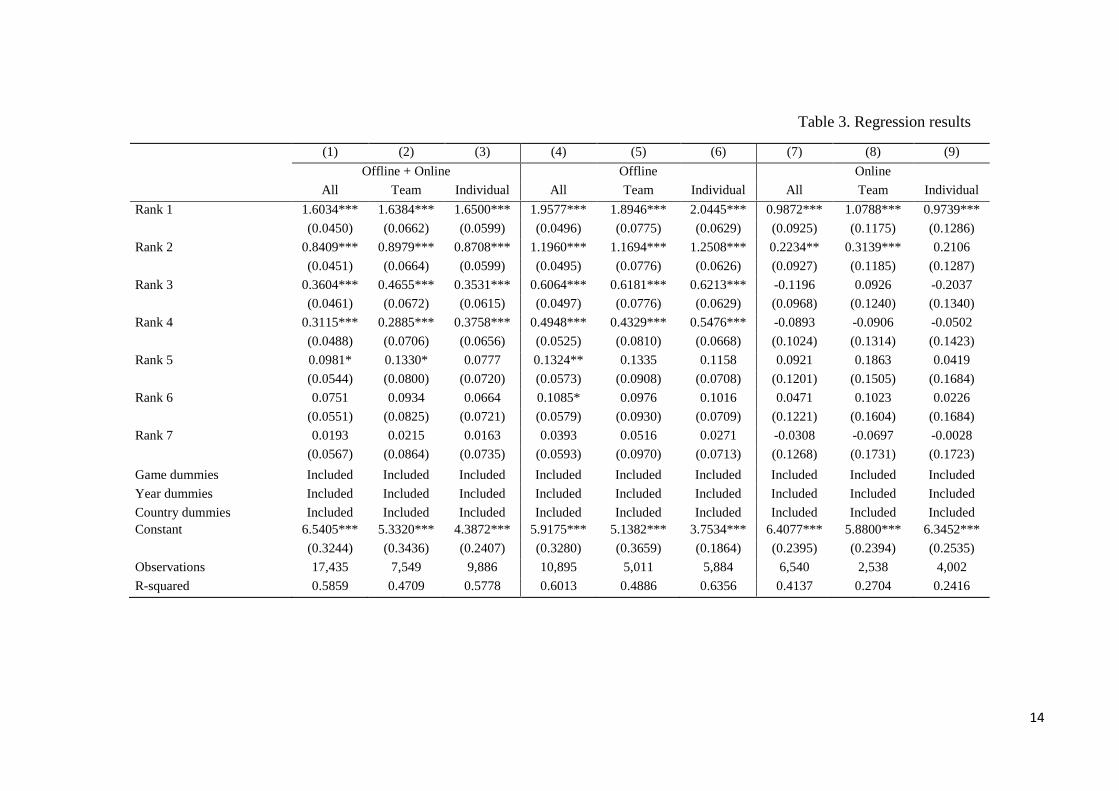
Empirical Results
The results of regression analysis are presented in Table 3. Models 1 to 3 are estimated
based on the total sample, while models 4 to 6 are estimated only for offline tournaments and
models 7 to 9 concern online tournaments. Since we use the log of a prize as the dependent
variable, the coefficients indicate the average percentage difference between an omitted category
and the gamer/team rank. The results are comparable with what one would expect from
tournament theory: the prizes for the top ranks are significantly higher than for lower ranks.
However, the number of significant ranks varies according to the type of tournament and game.
We further analyze results in two contexts: (1) top (offline) tournaments vs. low (online)
tournaments, and (2) team vs. individual games.
The comparison of the major and minor tournaments provides information about the
structure of rewards in the case of different prize sizes. Since each game in our sample involves
both online and offline tournaments, it is possible to control all the necessary parameters except
for the type of tournament (offline or online).
The results indicate a significant difference between offline and online tournaments
(models 4 and 7). For online tournaments only, two ranks are significant, while for the offline six
ranks are significant offline. Therefore, in order to maximize the effort in a major tournament,
the organizer should design the prize structure in such a way that almost all of the contestants
will win a prize, which significantly differs from the previous rank prize. This might be
explained by the fact that competition is high and the chances of winning, even for a strong
contestant, are lower than in a lowly tournament. Since the probability of winning is lower, the
prize is consequently higher, even for lower ranks.
Interestingly, the results for team and individual games are similar (models 2 and 3). The
number of significant ranks is the same; moreover, the spreads also look similar. The type of
tournament explains much more than the type of game involved.
14
Table 3. Regression results
(1) (2) (3) (4) (5) (6) (7) (8) (9)
Offline + Online Offline Online
All Team Individual All Team Individual All Team Individual
Rank 1 1.6034*** 1.6384*** 1.6500*** 1.9577*** 1.8946*** 2.0445*** 0.9872*** 1.0788*** 0.9739***
(0.0450) (0.0662) (0.0599) (0.0496) (0.0775) (0.0629) (0.0925) (0.1175) (0.1286)
Rank 2 0.8409*** 0.8979*** 0.8708*** 1.1960*** 1.1694*** 1.2508*** 0.2234** 0.3139*** 0.2106
(0.0451) (0.0664) (0.0599) (0.0495) (0.0776) (0.0626) (0.0927) (0.1185) (0.1287)
Rank 3 0.3604*** 0.4655*** 0.3531*** 0.6064*** 0.6181*** 0.6213*** -0.1196 0.0926 -0.2037
(0.0461) (0.0672) (0.0615) (0.0497) (0.0776) (0.0629) (0.0968) (0.1240) (0.1340)
Rank 4 0.3115*** 0.2885*** 0.3758*** 0.4948*** 0.4329*** 0.5476*** -0.0893 -0.0906 -0.0502
(0.0488) (0.0706) (0.0656) (0.0525) (0.0810) (0.0668) (0.1024) (0.1314) (0.1423)
Rank 5 0.0981* 0.1330* 0.0777 0.1324** 0.1335 0.1158 0.0921 0.1863 0.0419
(0.0544) (0.0800) (0.0720) (0.0573) (0.0908) (0.0708) (0.1201) (0.1505) (0.1684)
Rank 6 0.0751 0.0934 0.0664 0.1085* 0.0976 0.1016 0.0471 0.1023 0.0226
(0.0551) (0.0825) (0.0721) (0.0579) (0.0930) (0.0709) (0.1221) (0.1604) (0.1684)
Rank 7 0.0193 0.0215 0.0163 0.0393 0.0516 0.0271 -0.0308 -0.0697 -0.0028
(0.0567) (0.0864) (0.0735) (0.0593) (0.0970) (0.0713) (0.1268) (0.1731) (0.1723)
Game dummies Included Included Included Included Included Included Included Included Included
Year dummies Included Included Included Included Included Included Included Included Included
Country dummies Included Included Included Included Included Included Included Included Included
Constant 6.5405*** 5.3320*** 4.3872*** 5.9175*** 5.1382*** 3.7534*** 6.4077*** 5.8800*** 6.3452***
(0.3244) (0.3436) (0.2407) (0.3280) (0.3659) (0.1864) (0.2395) (0.2394) (0.2535)
Observations 17,435 7,549 9,886 10,895 5,011 5,884 6,540 2,538 4,002
R-squared 0.5859 0.4709 0.5778 0.6013 0.4886 0.6356 0.4137 0.2704 0.2416
15
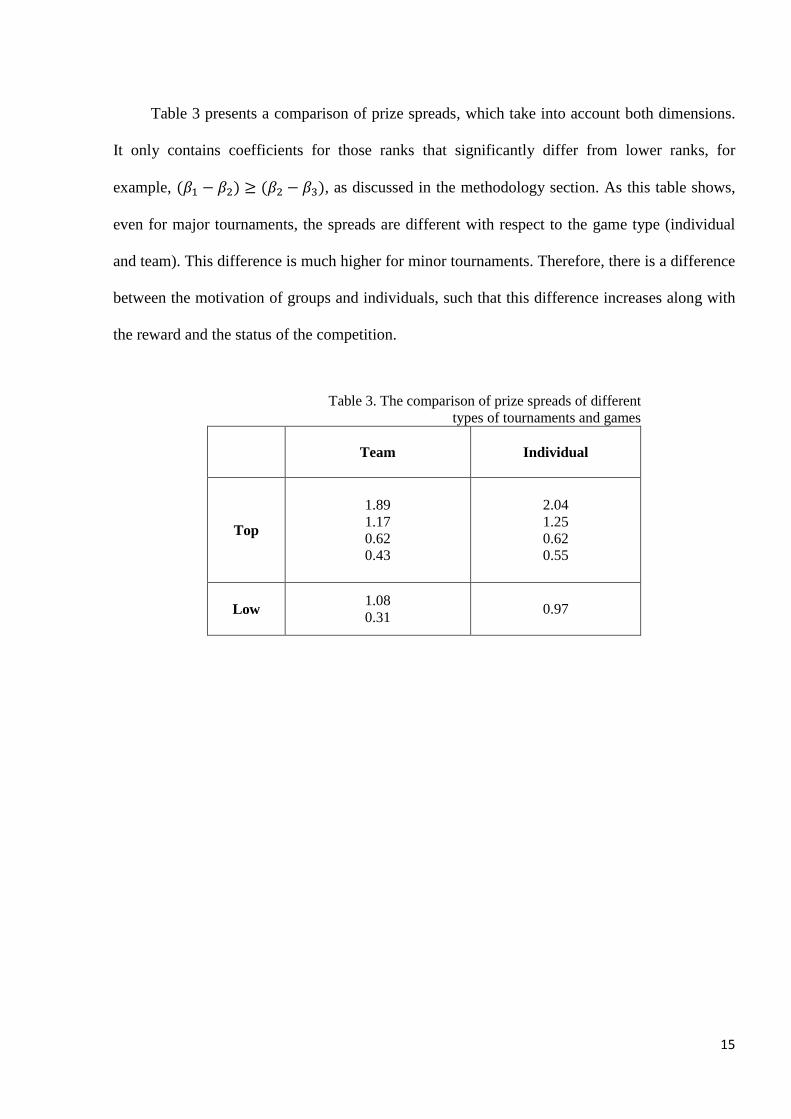
Table 3 presents a comparison of prize spreads, which take into account both dimensions.
It only contains coefficients for those ranks that significantly differ from lower ranks, for
example, (𝛽1 − 𝛽2) ≥ (𝛽2 − 𝛽3), as discussed in the methodology section. As this table shows,
even for major tournaments, the spreads are different with respect to the game type (individual
and team). This difference is much higher for minor tournaments. Therefore, there is a difference
between the motivation of groups and individuals, such that this difference increases along with
the reward and the status of the competition.
Table 3. The comparison of prize spreads of different
types of tournaments and games
Team Individual
Top
1.89
1.17
0.62
0.43
2.04
1.25
0.62
0.55
Low 1.08
0.31 0.97
16
Conclusion
Lazear and Rozen’s tournament theory is devoted to optimal labor contracts. It has been
supported by many subsequent pieces of empirical research in different fields (Choi and Gulati,
2004; Depken and Wilson, 2004; Knoeber and Thurman, 1994; Melton and Zorn, 2000;
Messersmith et al., 2011). In our study we find empirical evidence that prize spreads in eSports
tournaments follow the tournament theory of Lazear and Rosen (1981) and Rosen (1986). This
means that tournament organizers are interested in maximizing the participants’ effort and
productivity similar to traditional competition in sports and business. Another similarity is that,
according to our results, the prize structure is convex in rank order. According to Rosen (1986, p.
706), this means that the contestants in eSports tournaments are risk averse. One would expect
that gamers are risk-loving, but are similar to CEO and other board executives (Conyon et al.,
2001; Lambert et al., 1993) in terms of risk-aversion.
Interestingly, for the low-level tournaments the prize spread is smaller. Since in
tournament theory prize spread can be treated an indicator of the degree of risk-aversion, one can
conclude that the risk aversion of the particular contestant varies among the competitions of
different levels.
Interestingly, the results for the team games are more consistent with the tournament
theory than are results from individual games. This raises interesting questions about production
in teams and payoffs to performance. For example, while teams in eSports tend to share prize
money equally a natural question is whether this distribution produces optimal performance.
Team members may shirk because their share of the prize is the same with or without great
effort. In all types of competitions, tournament organizer does not observe the effort of the
contestants. However, in team competitions the manager of a team does not observe the effort of
each player, so the level of information asymmetry is even higher than in individual
competitions. Another important difference is that in individual competitions the contestant set
the goal by himself while in team competition the manager or team leader is doing this. This
17
might influence the motivation of particular team members. For these reasons, combining team
production and tournament theories and developing a model of optimal tournament design for
competitions of teams is potentially interesting from both business and sport point of view.
From the practical point of view, our findings are useful to people who make decisions
about compensation schemes both in sports and business. We provide such decision-makers with
the insights about the compensation design with respect to importance of the competition and its
type. For example, the more important the tournament is, the higher should be the prize spread, it
is insufficient to increase only the prize pool. Also, the compensation structure should be
different for the teams and individuals.
Our findings are subject to at least two limitations. First, results obtained in the framework
of this project may not be transferable to other sports because of the features of eSports. Second,
we assume the tournaments are designed in a such way to maximize the effort.
18
References
Alchian, A.A. and Demsetz, H. (1972), “Production, information costs, and economic organization”, The
American Economic Review, Vol. 62 No. 5, pp. 777–795.
Baker, G.P., Jensen, M.C. and Murphy, K.J. (1988), “Compensation and incentives: Practice vs. theory”,
The Journal of Finance, Vol. 43 No. 3, pp. 593–616.
Becker, B.E. and Huselid, M.A. (1992), “The incentive effects of tournament compensation systems”,
Administrative Science Quarterly, pp. 336–350.
Berri, D.J. and Jewell, R.T. (2004), “Wage inequality and firm performance: Professional basketball’s
natural experiment”, Atlantic Economic Journal, Vol. 32 No. 2, pp. 130–139.
Bloom, M. (1999), “The performance effects of pay dispersion on individuals and organizations”,
Academy of Management Journal, Vol. 42 No. 1, pp. 25–40.
Brown, J. (2011), “Quitters never win: The (adverse) incentive effects of competing with superstars”,
Journal of Political Economy, Vol. 119 No. 5, pp. 982–1013.
Choi, S. and Gulati, M. (2004), “A Tournament of Judges?”, California Law Review, pp. 299–322.
Coates, D., Frick, B. and Jewell, T. (2014), “Superstar Salaries and Soccer Success The Impact of
Designated Players in Major League Soccer”, Journal of Sports Economics, p.
1527002514547297.
“Coca-Cola and Riot Games Renew Partnership for 2015: The Coca-Cola Company”. (2015), , 17 April,
available at: http://www.coca-colacompany.com/stories/coca-cola-and-riot-games-renew-
partnership-for-2015/ (accessed 24 March 2016).
Connelly, B.L., Tihanyi, L., Crook, T.R. and Gangloff, K.A. (2013), “Tournament Theory Thirty Years of
Contests and Competitions”, Journal of Management, p. 0149206313498902.
Conyon, M.J., Peck, S.I. and Sadler, G.V. (2001), “Corporate tournaments and executive compensation:
Evidence from the U.K.”, Strategic Management Journal, Vol. 22 No. 8, pp. 805–815.
DeBrock, L., Hendricks, W. and Koenker, R. (2004), “Pay and Performance The Impact of Salary
Distribution on Firm-Level Outcomes in Baseball”, Journal of Sports Economics, Vol. 5 No. 3,
pp. 243–261.
Depken, C.A. (2000), “Wage disparity and team productivity: evidence from major league baseball”,
Economics Letters, Vol. 67 No. 1, pp. 87–92.
Depken, C.A. and Wilson, D.P. (2004), “The Efficiency of the NASCAR Reward System Initial
Empirical Evidence”, Journal of Sports Economics, Vol. 5 No. 4, pp. 371–386.
DeVaro, J. (2006), “Strategic promotion tournaments and worker performance”, Strategic Management
Journal, Vol. 27 No. 8, pp. 721–740.
Ehrenberg, R.G. and Bognanno, M.L. (1990), “The incentive effects of tournaments revisited: Evidence
from the European PGA tour”, Industrial & Labor Relations Review, Vol. 43 No. 3, p. 74S–88S.
Franck, E. and Nüesch, S. (2011), “The effect of wage dispersion on team outcome and the way team
outcome is produced”, Applied Economics, Vol. 43 No. 23, pp. 3037–3049.
Frick, B., Prinz, J. and others. (2007), “Pay and performance in professional road racing: the case of city
marathons.”, International Journal of Sport Finance, Vol. 2 No. 1, pp. 25–35.
Frick, B., Prinz, J. and Winkelmann, K. (2003), “Pay inequalities and team performance: Empirical
evidence from the North American major leagues”, International Journal of Manpower, Vol. 24
No. 4, pp. 472–488.
Gaudiosi, J. (2013), “CPL Founder Angel Munoz Explains Why He Left ESports And Launched Mass
Luminosity”, Forbes, 9 April, available at:
http://www.forbes.com/sites/johngaudiosi/2013/04/09/cpl-founder-angel-munoz-explains-why-
he-left-esports-and-launched-mass-luminosity/ (accessed 23 March 2016).
Gilsdorf, K.F. and Sukhatme, V.A. (2008), “Testing Rosen’s Sequential Elimination Tournament Model
Incentives and Player Performance in Professional Tennis”, Journal of Sports Economics, Vol. 9
No. 3, pp. 287–303.
Gould, E.D. and Winter, E. (2009), “Interactions between workers and the technology of production:
Evidence from professional baseball”, The Review of Economics and Statistics, Vol. 91 No. 1, pp.
188–200.
Hamari, J. and Sjöblom, M. (2015), What Is eSports and Why Do People Watch It?, SSRN Scholarly
Paper No. ID 2686182, Social Science Research Network, Rochester, NY, available at:
http://papers.ssrn.com/abstract=2686182 (accessed 25 December 2015).
19
Hiltscher, J. and Scholz, T.M. (2015), eSports Yearbook 2013/14, Vol. 4, BoD–Books on Demand,
available at: (accessed 27 December 2015).
KAHANE, L. (2012), “SALARY DISPERSION AND TEAM PRODUCTION”, The Oxford Handbook
of Sports Economics Volume 2: Economics Through Sports, Vol. 2, p. 153.
Katayama, H. and Nuch, H. (2011), “A game-level analysis of salary dispersion and team performance in
the national basketball association”, Applied Economics, Vol. 43 No. 10, pp. 1193–1207.
Kepes, S., Delery, J. and Gupta, N. (2009), “Contingencies in the effects of pay range on organizational
effectiveness”, Personnel Psychology, Vol. 62 No. 3, pp. 497–531.
Knoeber, C.R. and Thurman, W.N. (1994), “Testing the theory of tournaments: An empirical analysis of
broiler production”, Journal of Labor Economics, pp. 155–179.
Lambert, R.A., Larcker, D.F. and Weigelt, K. (1993), “The structure of organizational incentives”,
Administrative Science Quarterly, pp. 438–461.
Lazear, E.P. (1999), Personnel Economics: Past Lessons and Future Directions, National Bureau of
Economic Research, available at: http://www.nber.org/papers/w6957 (accessed 26 March 2016).
Lazear, E.P. and Rosen, S. (1981), “Rank-Order Tournaments as Optimum Labor Contracts”, The Journal
of Political Economy, Vol. 89 No. 5, pp. 841–864.
Levine, D.I. (1991), “Cohesiveness, productivity, and wage dispersion”, Journal of Economic Behavior &
Organization, Vol. 15 No. 2, pp. 237–255.
Melton, M. and Zorn, T.S. (2000), “An empirical test of tournament theory: the senior pga tour”,
Managerial Finance, Vol. 26 No. 7, pp. 16–32.
Messersmith, J.G., Guthrie, J.P., Ji, Y.-Y. and Lee, J.-Y. (2011), “Executive turnover: the influence of
dispersion and other pay system characteristics.”, Journal of Applied Psychology, Vol. 96 No. 3,
p. 457.
O’Neill, O.A. and O’Reilly, C.A. (2010), “Careers as tournaments: The impact of sex and gendered
organizational culture preferences on MBAs’ income attainment”, Journal of Organizational
Behavior, Vol. 31 No. 6, pp. 856–876.
Parshakov, P. and Zavertiaeva, M.A. (2015), Success in eSports: Does Country Matter?, SSRN Scholarly
Paper No. ID 2662343, Social Science Research Network, Rochester, NY, available at:
http://papers.ssrn.com/abstract=2662343 (accessed 2 March 2016).
Prendergast, C. (1999), “The provision of incentives in firms”, Journal of Economic Literature, Vol. 37
No. 1, pp. 7–63.
Ramaswamy, R. and Rowthorn, R.E. (1991), “Efficiency wages and wage dispersion”, Economica, pp.
501–514.
Rosen, S. (1986), “Prizes and Incentives in Elimination Tournaments”, The American Economic Review,
pp. 701–715.
Schwartz, J.T., Isaacs, J.P. and Carilli, A.M. (2007), “To race or to place? An empirical investigation of
the efficiency of the NASCAR points competition”, Journal of Sports Economics, Vol. 8 No. 6,
pp. 633–641.
Seo, Y. (2013), “Electronic sports: A new marketing landscape of the experience economy”, Journal of
Marketing Management, Vol. 29 No. 13-14, pp. 1542–1560.
Seo, Y. and Jung, S.-U. (2014), “Beyond solitary play in computer games: The social practices of
eSports”, Journal of Consumer Culture, p. 1469540514553711.
Simmons, R. and Berri, D.J. (2011), “Mixing the princes and the paupers: Pay and performance in the
National Basketball Association”, Labour Economics, Vol. 18 No. 3, pp. 381–388.
Svoboda, E. (2004), “World Cyber Games Finals”, 1 October, available at: http://spectrum.ieee.org/geek-
life/tools-toys/world-cyber-games-finals (accessed 24 March 2016).
Taylor, T.L. (2012), Raising the Stakes: E-Sports and the Professionalization of Computer Gaming, MIT
Press.
Taylor, T.L. and Witkowski, E. (2010), “This is how we play it: what a mega-LAN can teach us about
games”, Proceedings of the Fifth International Conference on the Foundations of Digital Games,
ACM, pp. 195–202.
“Top 50 Games Awarding Prize Money - eSports Game Rankings :: e-Sports Earnings”. (2015), ,
available at: http://www.esportsearnings.com/games (accessed 24 March 2016).
Wagner, M.G. (2006), “On the Scientific Relevance of eSports.”, Proceedings of the 2006 International
Conference on Internet Computing & Conference on Computer Games Development, ICOMP
2006, Las Vegas, Nevada, USA, June 26-29, 2006, pp. 437–442.
20
Winter, E. (2004), “Incentives and discrimination”, The American Economic Review, Vol. 94 No. 3, pp.
764–773.
Witkowski, E. (2012), “On the Digital Playing Field How We ‘Do Sport’ With Networked Computer
Games”, Games and Culture, Vol. 7 No. 5, pp. 349–374.
Petr Parshakov
International Laboratory of Intangible-driven Economy
National Research University Higher School of Economics (Perm, Russia)
e-mail: [email protected]
Any opinions or claims contained in this Working Paper do not necessarily
reflect the views of HSE.
© Coates, Parshakov, 2016