Embed Size (px)
Citation preview
© Tech-Clarity, Inc. 2012
Tech-Clarity Perspective: Best Practices for Developing
Industrial Equipment
Top Performers Drive Growth and Profitability with Advanced Design Practices and Enabling Technology
2 © Tech-Clarity, Inc. 2012
Table of Contents Executive Overview ....................................................................... 3 Strategies to Differentiate, Customize, Globalize .......................... 4 Challenges and Performance Priorities ......................................... 5 Identifying the Top Performers ...................................................... 6 Strategies of the Top Performers ................................................... 7 Best Practices used by the Top Performers .................................. 9 Enabling Top Design and Development Performance ................. 10 Conclusion ................................................................................... 13 Recommendations ....................................................................... 14 About the Author .......................................................................... 14 About the Research ..................................................................... 15
3 © Tech-Clarity, Inc. 2012
Executive Overview Industrial equipment companies struggle to differentiate themselves in today’s highly competitive, global markets. This report investigates the business strategies, approaches, challenges, processes, and technologies these companies employ and how they impact financial performance. The goal of the research is to identify and share best practices that drive better product profitability. The results are based on 378 online survey responses from manufacturers around the globe that compete in the industrial equipment market.
Some industrial equipment manufacturers have taken significantly more advantage of the recovery.
Analysis of the responses shows that the global economic recovery has helped industrial equipment companies economically. In fact, the companies responding to this survey have, on average, effectively grown revenue and profit margins over the last two years. Some industrial equipment manufacturers, however, have taken significantly more advantage of the recovery. These companies, the “Top Performers,” have:
• Grown revenue 2.2 times more than average • Increased profit margins 2.4 times more than average
The research shows that the top performing companies have taken different approaches when compared to average performers. While the strategies and challenges across different performance levels are similar, what sets the leaders apart is how they implement and support these strategies. The top performing companies have adopted more advanced engineering approaches, including:
• Modular design approaches • Platform design techniques • Rules-based design approaches
The top performers also use technology that supports these techniques. While the most common technologies are relatively the same across performance levels, the top performers are more likely to leverage:
• Simulation tools • Product configurators or design automation • Product Lifecycle Management (PLM) • Factory layout / simulation tools
The findings from this report show how the top performers leverage advanced processes and tools. These results can be used as guidelines for other industrial equipment companies to improve their growth and profitability.
4 © Tech-Clarity, Inc. 2012
Strategies to Differentiate, Customize, Globalize The industrial equipment industry is a crowded market. Large and small companies alike compete for business in an environment with relatively low barriers to entry compared with selling highly complex and regulated products like automobiles or airplanes. It has become a very global market, with competitors appearing across the world.
The two most common responses to a survey question about business strategies revolve around differentiation.
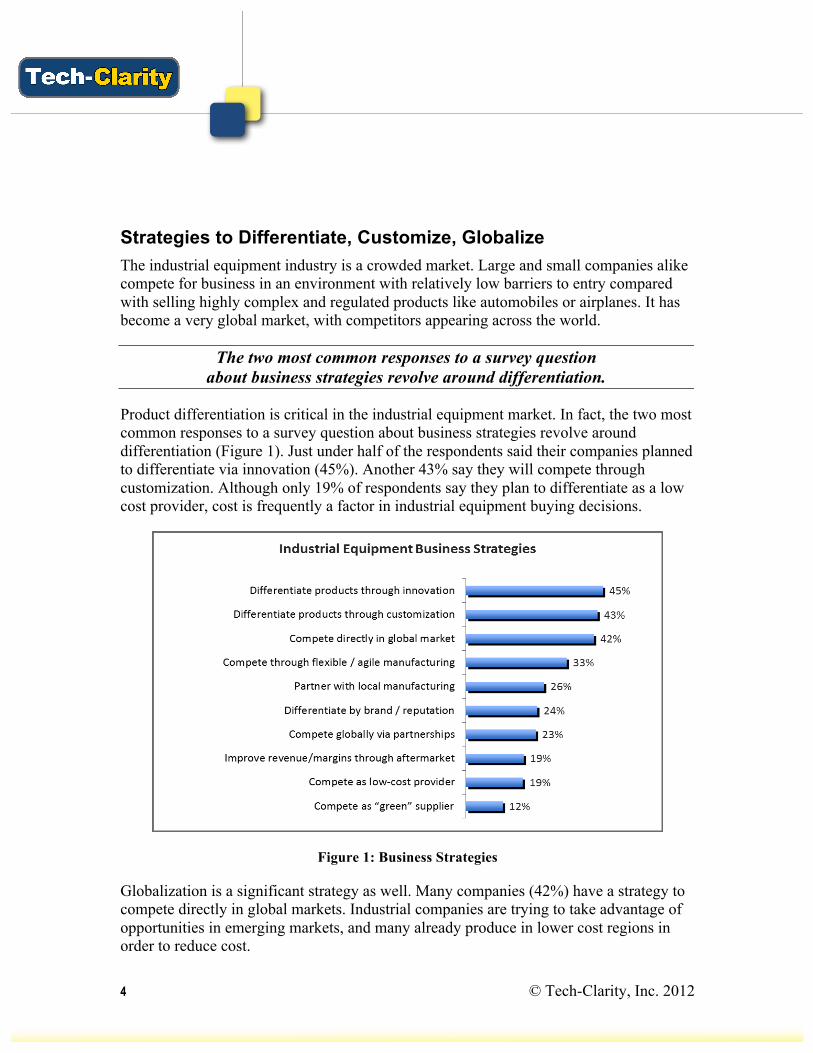
Product differentiation is critical in the industrial equipment market. In fact, the two most common responses to a survey question about business strategies revolve around differentiation (Figure 1). Just under half of the respondents said their companies planned to differentiate via innovation (45%). Another 43% say they will compete through customization. Although only 19% of respondents say they plan to differentiate as a low cost provider, cost is frequently a factor in industrial equipment buying decisions.
Figure 1: Business Strategies
Globalization is a significant strategy as well. Many companies (42%) have a strategy to compete directly in global markets. Industrial companies are trying to take advantage of opportunities in emerging markets, and many already produce in lower cost regions in order to reduce cost.
5 © Tech-Clarity, Inc. 2012
How else do companies compete in this crowded market? When asked about their design and product development approaches, over one-half (54%) of respondents say they customize or tailor products to order. This includes assemble to order (ATO), configure to order (CTO), or engineer to order (ETO) approaches. Product customization is a reality in this marketplace, whether to differentiate or simply to ensure that products work for their intended purpose and in their intended location. Unfortunately, as Tech-Clarity Mass Customization of Highly Configurable Products points out, many companies that customize products struggle with manual and inefficient processes. Industrial equipment manufacturers frequently fall into this category.
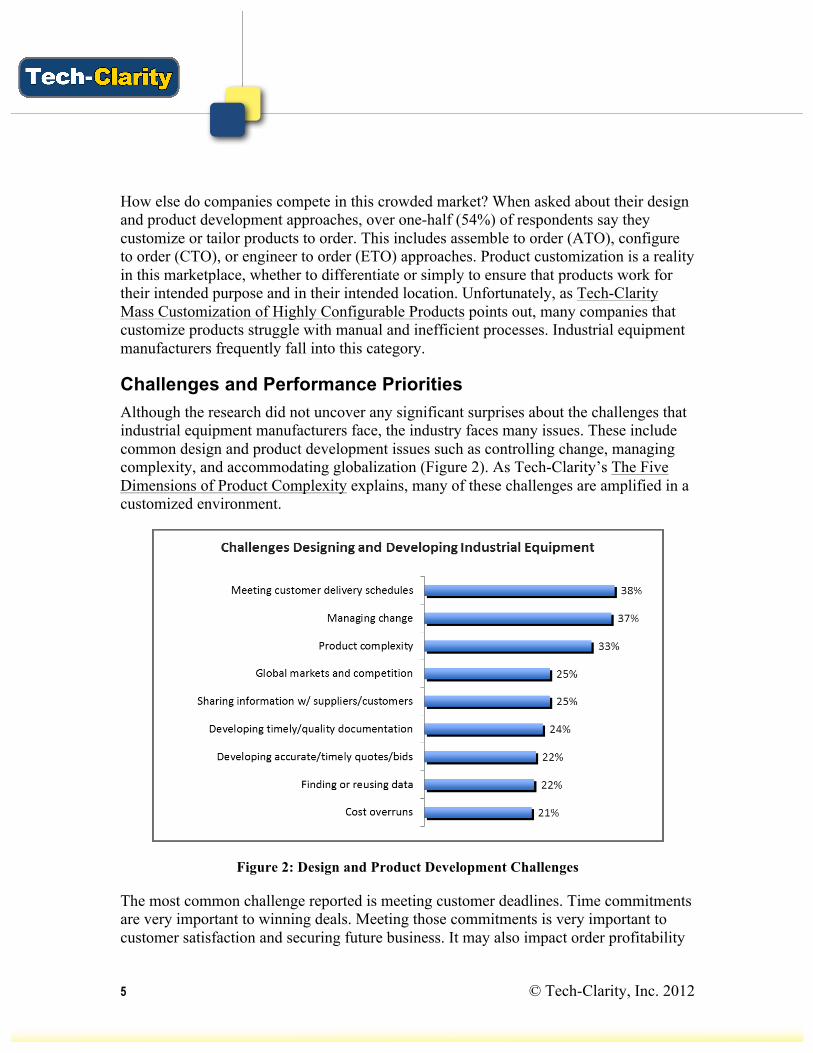
Challenges and Performance Priorities Although the research did not uncover any significant surprises about the challenges that industrial equipment manufacturers face, the industry faces many issues. These include common design and product development issues such as controlling change, managing complexity, and accommodating globalization (Figure 2). As Tech-Clarity’s The Five Dimensions of Product Complexity explains, many of these challenges are amplified in a customized environment.
Figure 2: Design and Product Development Challenges
The most common challenge reported is meeting customer deadlines. Time commitments are very important to winning deals. Meeting those commitments is very important to customer satisfaction and securing future business. It may also impact order profitability
6 © Tech-Clarity, Inc. 2012
directly if incentives or milestones are missed. As one participant that produces industrial equipment for oil, gas, chemical companies says, “I only have a few months to get everything built and shipped before our customers begin their season.”
Identifying the Top Performers Manufacturers take a variety of approaches to address the challenges of the industrial equipment market. To help companies learn from the most successful manufacturers, the survey asked each participant to evaluate their company’s performance relative to their competitors on:
• Revenue growth (last 24 months) • Profit margin expansion (last 24 months) • Percent of revenue from new products (< 3 years old) • Quote accuracy • Time to develop a quote
Survey analysis identified the top performers based on the two financially oriented metrics. These metrics were chosen because they are the most tangible and readily comparable across companies. Respondents with the greatest reported growth and profit margin expansion over the last 24 months were identified as “Top Performers,” and made up the top 17% of companies.
The top performers managed to grow on average by 2.2 times more over the last two years, increasing annual revenue 22%.
How much better are these top performers doing? In addition to asking how companies are doing against their competitors, the survey requested quantitative responses. The results confirmed the selection of the top performers and shed some light on how much better they perform (Table 1). The average across all companies was a 10% growth in revenue over the last 2 years. This can most likely be attributed to the economic recovery. The top performers, however, managed to grow on average by 2.2 times more over the last two years, increasing annual revenue by 22%. Although most companies improved, the top performers are taking more full advantage of the recovery.
Metric Average Response
Top Performers
Annual Revenue Growth 10% 22% Profit Margin Expansion 7% 17%
Table 1: Product Development Performance
7 © Tech-Clarity, Inc. 2012
As with revenue, companies on average have improved profit margins over the last two years. This is likely because although the economy is recovering, many companies are limiting their headcount growth. The top performing companies not only grew the top line more than average, they also improved their margins 2.4 times more in the same period of time (17% compared to 7%, on average). This shows that the leading companies are able to grow profitably without letting cost outstrip growth.
The top performing companies not only grew the top line more than average, they also improved their margins 2.4 times more in the same period of time.
Strategies of the Top Performers By determining what the top performers have in common we can make recommendations to others. The top performing manufacturers place greater emphasis on globalization, quote accuracy, and the level of innovation in their product portfolio. Specifically, the top performers:
• Are 78% more likely to compete in global markets • Are 55% more likely to partner with local manufacturing • Place higher emphasis on the percent of revenue from new products • Put more importance on the accuracy and timeliness of their quotes
For the most part, the strategies employed by the top performers are similar to other companies with the exception that globalization is more prevalent in their objectives. Three-quarters (75%) of the top performers indicate they have a strategy to compete directly in global markets, compared to less than half (42%) of all companies. They were also 55% more likely (40% compared to 26%) to partner with local manufacturing.
The top performing companies are innovating more and keeping portfolios fresh.
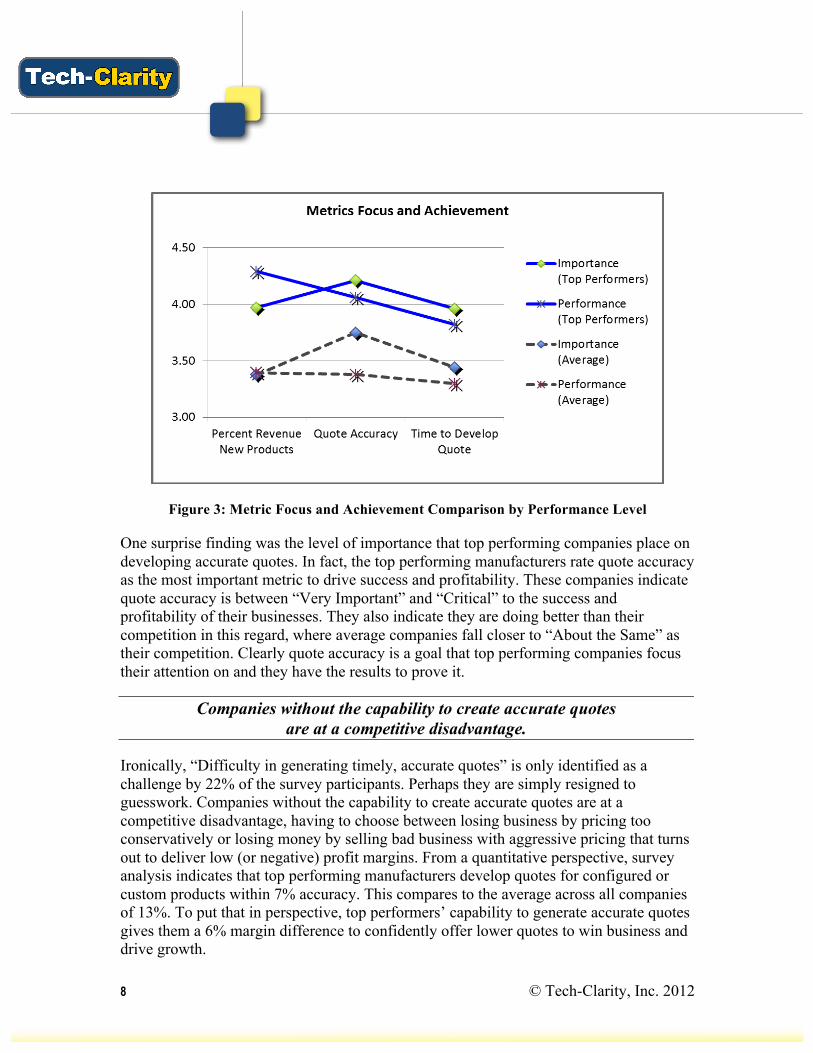
Despite the similarities in strategies, there were differences in the way top performers viewed critical success factors in the industrial equipment market (Figure 3). For example, the top performing companies are innovating more and keeping portfolios fresh. On average, top performers (solid lines) view the percent of revenue from new products as “Very Important” while all companies (dashed line) averaged closer to “Important.” Interestingly, the top performers also report higher performance related to portfolio freshness. The top performers indicate that they are “Better” to “Much Better” than their competitors, on average, as compared to all companies that were between “About the Same” and “Better.”
8 © Tech-Clarity, Inc. 2012
Figure 3: Metric Focus and Achievement Comparison by Performance Level
One surprise finding was the level of importance that top performing companies place on developing accurate quotes. In fact, the top performing manufacturers rate quote accuracy as the most important metric to drive success and profitability. These companies indicate quote accuracy is between “Very Important” and “Critical” to the success and profitability of their businesses. They also indicate they are doing better than their competition in this regard, where average companies fall closer to “About the Same” as their competition. Clearly quote accuracy is a goal that top performing companies focus their attention on and they have the results to prove it.
Companies without the capability to create accurate quotes are at a competitive disadvantage.
Ironically, “Difficulty in generating timely, accurate quotes” is only identified as a challenge by 22% of the survey participants. Perhaps they are simply resigned to guesswork. Companies without the capability to create accurate quotes are at a competitive disadvantage, having to choose between losing business by pricing too conservatively or losing money by selling bad business with aggressive pricing that turns out to deliver low (or negative) profit margins. From a quantitative perspective, survey analysis indicates that top performing manufacturers develop quotes for configured or custom products within 7% accuracy. This compares to the average across all companies of 13%. To put that in perspective, top performers’ capability to generate accurate quotes gives them a 6% margin difference to confidently offer lower quotes to win business and drive growth.
9 © Tech-Clarity, Inc. 2012
Best Practices used by the Top Performers Although the top performing companies have some differences in strategy compared to average performers, the analysis shows that what really sets them apart is the way they go about achieving it – their processes and their enabling technology. Specifically, the top performers are:
• Over 3 times as likely to use rules-based design approaches • About twice as likely to develop a single, global product • 50% more likely to leverage platform design techniques • 38% more likely to use modular design approaches
Although the top performing companies have differences in strategy compared to average performers, what really sets them apart is the way they go about
achieving it – their processes and their enabling technology.
Customizing or tailoring products to market is very common in the industrial equipment industry. In part this is a lever of competition to specialize products to customer needs and performance requirements, and reflects an overall trend in product development. But industrial equipment companies are also more likely to customize products due to the simple reality that the equipment is often incorporated into existing customer sites.
Top performing manufacturers are much more likely to employ advanced engineering and product development approaches.
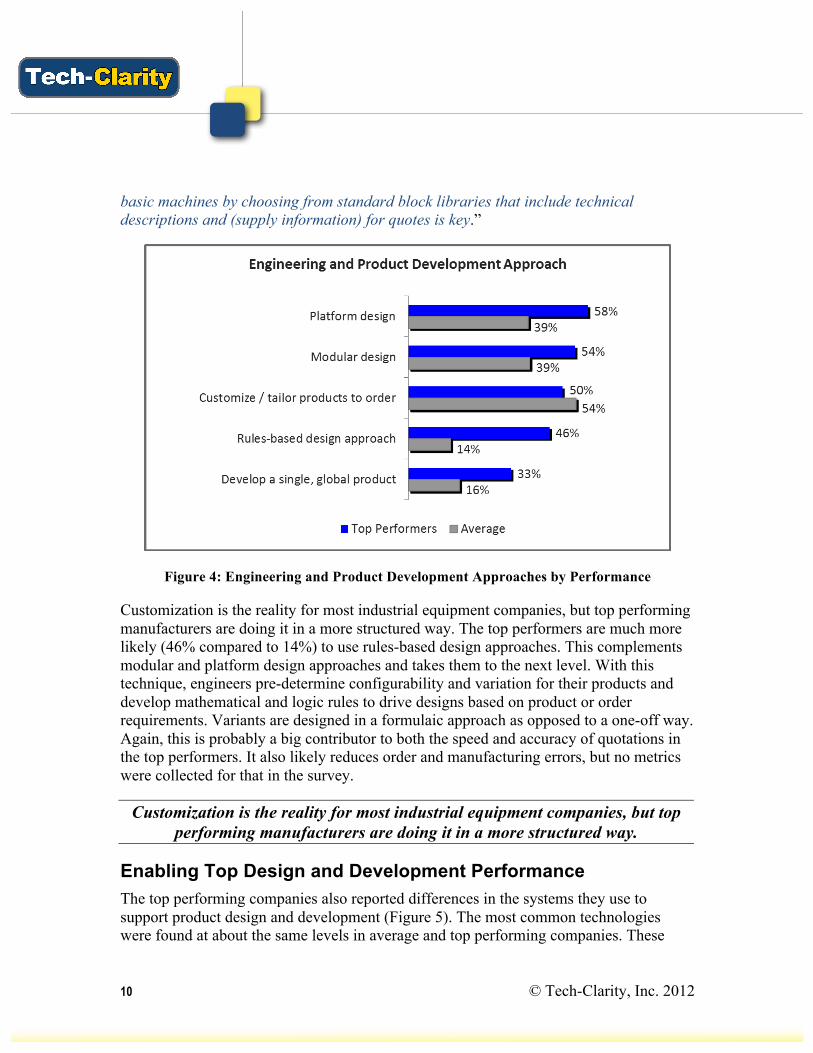
Customization is a common practice and doesn’t appear to differentiate companies in performance. However, top performing manufacturers are much more likely to employ advanced engineering and product development approaches (Figure 4). For example, they are much more likely to adopt platform design approaches (58% compared to only 39%). This approach involves developing a base design that can be reused for different products. They were also more likely (54% compared to 39%) to adopt modular design approaches, where they can mix and match subsystems to develop a product.
Both modular and platform-based design approaches help manufacturers improve their ability to develop custom products and product variants more readily. By reusing platforms and modules, they can increase efficiency and reduce variability. Although these design methods may take more effort and planning up front they make product variants much easier to develop. This may also be a contributor to their ability to generate more accurate quotes, because each new order is not a brand new design. As a manufacturer of equipment for cold rolling mills serving high-tech and electronics and other industries commented, “Being able to assemble a quote and generate drawings of
10 © Tech-Clarity, Inc. 2012
basic machines by choosing from standard block libraries that include technical descriptions and (supply information) for quotes is key.”
Figure 4: Engineering and Product Development Approaches by Performance
Customization is the reality for most industrial equipment companies, but top performing manufacturers are doing it in a more structured way. The top performers are much more likely (46% compared to 14%) to use rules-based design approaches. This complements modular and platform design approaches and takes them to the next level. With this technique, engineers pre-determine configurability and variation for their products and develop mathematical and logic rules to drive designs based on product or order requirements. Variants are designed in a formulaic approach as opposed to a one-off way. Again, this is probably a big contributor to both the speed and accuracy of quotations in the top performers. It also likely reduces order and manufacturing errors, but no metrics were collected for that in the survey.
Customization is the reality for most industrial equipment companies, but top performing manufacturers are doing it in a more structured way.
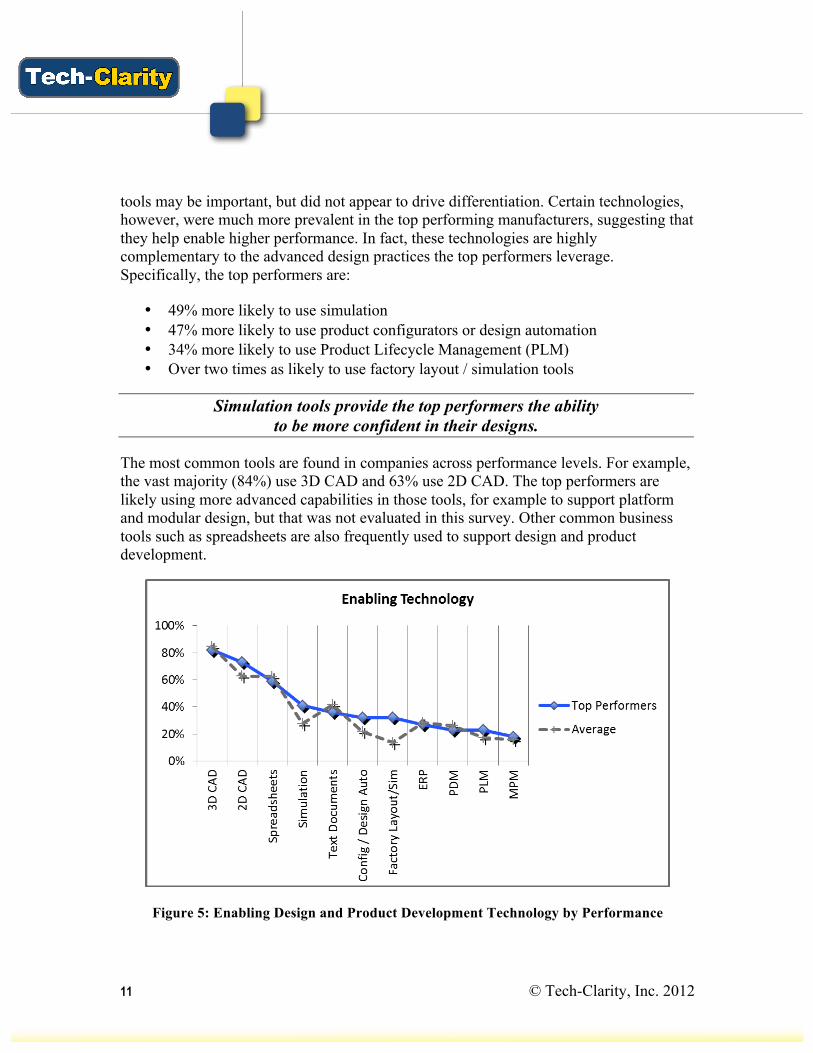
Enabling Top Design and Development Performance The top performing companies also reported differences in the systems they use to support product design and development (Figure 5). The most common technologies were found at about the same levels in average and top performing companies. These
11 © Tech-Clarity, Inc. 2012
tools may be important, but did not appear to drive differentiation. Certain technologies, however, were much more prevalent in the top performing manufacturers, suggesting that they help enable higher performance. In fact, these technologies are highly complementary to the advanced design practices the top performers leverage. Specifically, the top performers are:
• 49% more likely to use simulation • 47% more likely to use product configurators or design automation • 34% more likely to use Product Lifecycle Management (PLM) • Over two times as likely to use factory layout / simulation tools
Simulation tools provide the top performers the ability to be more confident in their designs.
The most common tools are found in companies across performance levels. For example, the vast majority (84%) use 3D CAD and 63% use 2D CAD. The top performers are likely using more advanced capabilities in those tools, for example to support platform and modular design, but that was not evaluated in this survey. Other common business tools such as spreadsheets are also frequently used to support design and product development.
Figure 5: Enabling Design and Product Development Technology by Performance
12 © Tech-Clarity, Inc. 2012
The top performers used some tools at much higher frequencies than others. For example, the top performers are much more likely to use simulation (41% compared to 27%) than others. These tools help them evaluate the performance of their designs in a simulated environment to get them right the first time, as discussed in Tech-Clarity’s The Business Value of Simulation report. This is particularly important when designing customized products that may never be built the same way twice. Simulation tools provide the top performers the ability to be more confident in their designs, which perhaps adds to their ability to develop accurate quotes. “The best I have seen is done in 3D and then simulated,” explains one material handling equipment manufacturer.
Leading companies are also more likely to use product configurators or design automation.
Leading companies are also more likely to use product configurators or design automation (32% compared to 22%) technologies, although only about one-third are doing so. These tools allow them to use automated rules to rapidly (and accurately) develop BOMs and designs for new products or orders. This effectively puts automation behind the rules-based design approach discussed earlier to increase efficiency. They can also help build speed, accuracy, and confidence into the quotation process. “We have an automated system that generates about 6,000 newly configured parts per week from a sales order with no human interaction,” wrote a producer of equipment for industries including food and beverage.
PLM helps companies with custom products support complex design processes and the large numbers of designs generated, and can help orchestrate the
processes required to design and build complex products.
The solutions found in the leading manufacturers included enterprise solutions as well as design tools. The top performing companies are more likely to use PLM, although only about one-quarter of them (23%) report using it. About another one-quarter use PDM. PLM helps align processes with data and coordinates business processes across the enterprise. As company making equipment for building products and fabrication mentioned, “When data is configured properly the flow of information is increased enormously and the design process reaches the maximum potential.” PLM helps companies with custom products support complex design processes and the large numbers of designs generated, and can help orchestrate the processes required to design and build complex products.
13 © Tech-Clarity, Inc. 2012
Conclusion Industrial equipment companies face many challenges in tight markets and struggle to differentiate themselves. Although most companies have grown and improved margins over the last two years, likely due to the economic recovery, some manufacturers have been able to take more advantage. These top performing companies face the same challenges and adopt similar strategies, but have adopted more global strategies and place higher emphasis on innovation (fresher product portfolios) and developing accurate quotes.
The leaders take advantage of more advanced design and product development approaches, including the adoption of
platform design, modular approaches, and rules-based design.
What really sets the top performers apart are the different approaches used to design and develop their products. The leaders take advantage of more advanced design and product development approaches, including the adoption of platform design, modular approaches, and rules-based design. They have also adopted different systems. While they use 2D, 3D, and spreadsheets like the rest, they are much more likely to use simulation, configurators, PLM, and factory simulation technologies. These solutions are highly complementary with the advanced design techniques and help them develop more accurate quotes to win more business with confidence.
“Through the use of engineering and product development best practices and software we significantly improved quality and
reduced time and cost of new product development.”
As one manufacturer of equipment for consumer products and other industrial industries summarizes nicely, “Through the use of engineering and product development best practices and software we significantly improved quality and reduced time and cost of new product development.” The lessons learned from the top performers support this, and offer guidance to others looking to improve their business performance.
14 © Tech-Clarity, Inc. 2012
Recommendations Based on industry experience and research for this report, Tech-Clarity offers the following recommendations:
• Place significant emphasis on performance metrics for quote accuracy and the percent of revenue from new products
• Adopt advanced engineering techniques such as modular design, platform design, and rules-based approaches
• Support advanced design techniques with the appropriate design tools, including simulation, configurators, design automation, and factory layout tools
• Consider implementing PLM to manage the complexity of today’s global, complex, customized products and design and development environments
• Consider globalization as a strategy to increase business performance
About the Author Jim Brown is the President of Tech-Clarity, an independent research and consulting firm that specializes in analyzing the true business value of software technology and services. Jim has over 20 years of experience in software for the manufacturing industries, with a broad background including roles in industry, management consulting, the software industry, and research. His experience spans enterprise applications including PLM, ERP, quality management, service, manufacturing, and others. Jim is passionate about improving product innovation, product development, and engineering performance through the use of software technology and social computing techniques.
Jim is an experienced researcher, author, and public speaker and enjoys the opportunity to speak at conferences or anywhere that he can engage with people that are passionate about improving business performance through software technology.
Jim can be reached at [email protected]. You can follow Jim on Twitter at @jim_techclarity, you can read his blog at www.tech-clarity.com/clarityonplm, or you can find Tech-Clarity on Facebook.
15 © Tech-Clarity, Inc. 2012
About the Research Tech-Clarity gathered and analyzed 700 responses to a web-based survey on designing software-intensive products. These survey responses were gathered by direct e-mail, social media, and online postings by both Tech-Clarity and Autodesk. Of these, 378 respondents were identified as manufacturers in the industrial equipment industry and their responses were analyzed to make observations and draw conclusions for this report.
The respondents were comprised of less than one-half (40%) who were individual contributors. Over one-third (38%) were manager or director level. There was also good representation (15%) from VP or executive levels, along with some others (7%) who were not classified.
The respondents represented a mix of company sizes, the majority of whom (57%) were from smaller companies (1 to 100 employees). 22% were between 101-500 employees and 20% were over 500 employees. A small number did not know or chose not to disclose their company size. While this sample size is weighted more heavily to smaller companies than some Tech-Clarity studies, this is likely due to the fact that the industrial equipment industry includes a large number of smaller businesses.
The respondents also indicated a good mix in regards to product complexity, as represented by the average size of their BOMs. When asked about average BOM size, 10% reported relatively small BOM sizes (1-10 parts). Others were more complex, 41% indicating BOM sizes from 11-100 parts, 30% indicating BOM sizes from 101-1,000 parts and 13% reporting highly complex products (over 1,000 parts). A small number, 6%, either didn’t know or chose not to disclose.
The respondents reported doing business globally, with most companies doing business in Western Europe (63%), about one-half doing business in North America (46%), about one-quarter doing business in Eastern Europe (22%), 20% doing business in China, and others doing business in Latin America, India, Africa, Australia, Japan, Korea, and other regions.
Initial respondents included manufacturers as well as service providers and software companies, but responses from those determined not to be directly involved in designing and developing products (software vendors and consultants) were not included in the analysis. In addition, those that did not compete in the industrial equipment market were not included in the survey results. The majority of companies (378, as reported above) were considered to have direct involvement in designing and developing industrial equipment and the report reflects their experience.