Embed Size (px)
Citation preview

TECH Document
DELTA
Venlighedsvej 4
DK-2970 Hørsholm
Denmark
Tel. +45 72 19 40 00
delta.dk
March 2015
TN7
Perceptual characteristics of audio The sound wheel can be used to provide an objective description of the sound
Torben Holm Pedersen For definitions of the sound wheel's
attributes, see page 21.

TN6
Page 2
Contents
Summary ....................................................................................... 3
Background .................................................................................... 4
Technical specifications ................................................................. 4
Product descriptions and reviews ................................................... 5
Sensory evaluations ....................................................................... 6
The Filter Model ............................................................................. 7
Listening tests ................................................................................ 9
Attributes properties ..................................................................... 11
Attributes for a sound wheel for reproduced sound ...................... 11
The sound wheel for reproduced sound ....................................... 16
Qualifications of attributes ............................................................ 16
Sensory product information ........................................................ 18
Preference mapping ..................................................................... 19
Future work .................................................................................. 20
Conclusion ................................................................................... 20
Definitions of attributes ................................................................. 21
Words that you perhaps miss ....................................................... 26
Examples of frequency ranges ..................................................... 28
Extra copies of the report may be ordered from DELTA
by email at: [email protected]

TN7
Page 3
Summary
This TECH Document describes how to proceed from the technical
data to an objective characteristic of the perceived sound.
When you choose an audio product, e.g.
loudspeakers or headphones, you would like
to take different product properties into
consideration. But what about the sound?
Neither technical data nor graphs of technical
measurements give an impression of the
perceived sound from the products.
Claims made about the products or various
reviews do not provide a person with a clear
impression of what they can expect of the
sound. This makes it difficult to weigh up
sound against other product properties.
Another problem is that very colourful and
diverse language is used to describe the
sound character. A sound wheel has been
developed as a way to remedy this (see the
front page), which names relevant attributes
and orders them in a hierarchy.
A large number of attributes is found from
literature search and in product reviews and
manufacturers' descriptions.
The sound wheel's attributes have been
subsequently selected and defined through a
systematic process that is described in the
TECH Document.
The TECH Document describes how it is
possible to differentiate between subjective
and objective listening tests, and states how
reliable listening tests for characterising the
sound are carried out.
Finally, an example of a sensory product
declaration for loudspeakers is given, and a
model is shown which can predict preference
based on the attributes that are included in
the product declaration.
Author: Torben Holm Pesersen
Title: Characteristics of sound
from audio products.
Company: DELTA, SenseLab

TN7
Page 4
Background
When someone chooses an audio product, e.g. loudspeakers or headphones, they take different
product properties into consideration. Price, size, facilities, colour, form ... and the sound quality. How
these different properties are prioritised depends on the individual and how they intend to use the
product. Perhaps the person makes an intuitive choice, either because they like the look of the
product, they hear music that they like or the product is inexpensive. Perhaps they take a more
systematic approach, and get information about different characteristics, but if so, they will encounter
a problem with sound quality: Is it good quality and do I think it sounds good (enough)?
Can the answer be found in the technical specifications, in the manufacturer's and dealer's
descriptions or is it better to use reviews on the Internet, in newspapers and in hi-fi magazines?
This document describes how systematic evaluations carried out listeners can be objective and useful
to consumers, dealers and manufacturers. The TECH Document focuses on loudspeakers and
earphones, because they are the most influential link in the chain when it comes to listening to audio.
Technical specifications
An audio system's properties can be described on the basis of the technical data, see Figure 1.
The technical data should be viewed as informational labelling. In general, it is easy to see how large
and heavy loudspeakers are, but does a 400 W loudspeaker sound better than an 80 W speaker, and
how important is it that the treble does up to 35 kHz in relation to an impedance of 4 or 8 ohms? But
the tables cannot give you an impression of the speakers’ actual sound, just as the informational label
on a bag of cookies cannot tell you how the cookies taste.
Figure 1 Examples of technical data in the form of
tables of product properties for loudspeakers

TN7
Page 5
It is an improvement if you can find graphs of the technical measurements. This may be in the form of
frequency characteristics, see Figure 2, distortion curves at different frequencies and different sound
levels, and perhaps even graphs that show the spread of the sound at different frequencies.
However, the problem with these curves is that even for people who have good technical insight, they
are difficult to interpret in relation to the perceived audio characteristics. They can provide an initial
impression if the person knows how to read them, but there are not many people around who can
translate them into describing how a loudspeaker or earphone sounds.
Product descriptions and reviews
Graphs of technical measurements were standard in brochures in the past. Today, the standard thing
is to have descriptions of the products. Figure 3 shows extracts from different dealers' product
descriptions. On the basis of these, it can be difficult to see the reason for the large differences in
prices of the loudspeakers in question, and getting an impression of how the loudspeakers actually
sound is even more difficult.
Another option is to read independent product reviews. Some of these are carried out on the basis of
careful listening tests using different pieces of music. However, there are (at least) four kinds of
problem with this:
- Knowledge of the product, i.e. make, price, look, greatly affects the assessment.
- Reviewers are not always objective, their subjective preferences influence the results.
- Different reviewers use different terms to describe what they hear.
- The reviewers are different, but we do not know by how much.
In general, researchers, manufacturers, dealers and hi-fi magazines lack a uniform and consistent
language when describing sound, e.g. from loudspeakers and earphones. A survey carried out by
Figure 2 Examples of technical data in the form of
frequency characteristics, i.e. curves showing how loud different frequencies are
reproduced.

TN7
Page 6
DELTA1 shows that the language that is used, differs to a large degree. This means that it can be
difficult comparing information from different sources, and in the worst case, you end up with different
terms used to describe the same sound characteristics or the same term used to describe different
sound characteristics.
Sensory evaluations
Sensory evaluations are best known in connection with foods, where a group of people, who are
trained in assessing flavour and aroma (a sensory panel), characterise a product. Food producers use
such panels for product development and quality control, and there is a wide range of standardised
methods available for that purpose. The idea is that a group of people are used as an objective
measuring instrument, for example, to characterise taste. The perceived product characteristics are
something more than the chemical contents of the food (which can be compared with the technical
data to loudspeakers). The taste assessments are carried out as a blind test unless there is a direct
desire to compare appearance and taste.
In addition to obtaining stable results using this technique with a trained panel, a statistical analysis
will also be able to show how precisely the results can be trusted.
It is important to make clear that these kinds of measurements are objective, and they must not be
confused with subjective assessments of liking. The sensory panel can for example, state how salty a
soup tastes but it is you (i.e. the consumer) who decides how much saltiness you prefer. In other
words: The sensory panel will precisely grade the taste on a scale between "Very little salt" to "A lot of
salt" while the consumer has his own individual opinion on "Needs salt", "Enough salt" and "Too salty".
1 Attributes development for reproduced sound. SenseLab report 011/14, see madebydelta.com/senselab
Figure 3 Examples of product descriptions.

TN7
Page 7
When the sensory panel has to characterise a food, it first finds the properties or attributes that are
relevant for the product in question. This is achieved by the panel tasting a suitable selection of
products from the product category, so the panel can reach agreement on which attributes best
describe the products. For example, if it is cookies, these attributes might be vanilla flavour,
sweetness, butter flavour and crispness. These different attributes are assessed independently and
objectively. With training, a consensus is achieved between the panel members' (the assessors)
assessments and their use of answering axes for each of these attributes, before the actual testing
begins.
By using the same principles and methods for listening tests of audio products, it is possible to
characterise the sound in an objective and uniform way. However, it presupposes that relevant and
well-defined attributes are available for this purpose. How these are found, selected and qualified, will
be clarified later, after an overview of the types of measurements that have already been mentioned.
The Filter Model
The physical measurement of the product's properties is often considered the objective truth in
contrast to the sensory measurements, where people are used as measuring instruments. It is
strange, because if you want to know something about how a thing is perceived, you have to ask
people who have perceived it through their senses. Yet we often hear the question "Can you trust
such assessments?" and statements like "We're different after all", " No one owns the patent that says
what good wine tastes like!", "Taste varies from person to person", "You can't trust subjective
assessments."
The correct question is: Can subjective measurements be objective? The answer is YES! The problem
is that confusing terminology is often used in discussions about this topic.
The "Filter Model" shown in Figure 4, is an attempt to remedy this. The model illustrates the
relationships between physical measurements (with measuring devices) and the sensory (objective
and subjective) measurements.
Figure 4 The Filter Model

TN7
Page 8
The physical sound in the left side of the model can be measured using technical measuring devices.
We can measure many details about sound and express them in technical terms and curves, which
the first section of this report looked at. The measuring point M1, represents the physical/instrumental
measurements.
The physical sound must "pass though" our hearing before we can perceive it. Hearing works like a
filter (the blue filter), colouring the sound in different ways. We cannot hear all of the details in the
sound (e.g. we cannot hear measurable physical distortion, if it is under a certain limit), and the lowest
and highest range frequencies are not perceived as strongly as the medium range. The only way to
measure how the sound is perceived is to ask the listeners about their perception. We are only
interested in how the sound is perceived, not if the listeners like it. The measuring point M2,
represents measurements, which are objective quantifications of the perceived sound properties. The
main aim is to get information about the characteristics of the sound, as perceived by the listener. The
perceived sound is characterised objectively by the listeners, without any reference to whether they
like it or not. The assessments should be carried out by a panel of trained listeners who understand
the attributes that the sound is being assessed by, and the scales that are used for the assessment.
On the basis of these measurements, a description of the perceptual sound profile can be made, i.e. a
loudspeaker's sound for example. Since an average is taken of a number of listeners' assessments, it
is also possible to say something about the degree of measurement uncertainty with this
"measurement". Since it is objective measurements, the results are not dependent on the listeners'
preferences or cultural or geographical background. With reference to the soup example, we are only
talking about how salty the soup is – not whether we like it or not.
The perceived sound passes through another non-acoustic and subjective filter, the red filter in Figure
4, which determines to which degree or not we like what we hear. This filter represents individual
factors, such as mood, context, personal background (cultural and geographical) and expectations.
After this filter, we can ask to which degree the listener likes the sound, whether the quality was
satisfactory or whether the sound irritated or annoyed the listener. The measurement point M3, is
determined by the affective measurements, i.e. subjective measurements of, for example, preference.
Such measurements are normally carried out by "naive" listeners, i.e. untrained listeners who have no
experience of listening tests. The listeners should be chosen from the relevant target group (the
consumers, users, average citizens, etc.), so that knowledge about the consumers' reaction to and
preference for the product is known. Context (e.g. what the product will be used for), cultural and
individual factors, have an impact on the result, and there are often subgroups or clusters with
different preferences, e.g. because of age and geographical background. Returning to the soup
example – some people and cultures prefer a more salty taste than others.
The relationships between the physical measurements in M1 and the perceptual measurements in
M2, are called perceptual models. The relationships between the perceptual (M2) and the affective
measurements (M3) are called preference mapping.
We can conclude that: Tests where people use their senses to provide assessments are called
sensory measurements. There are two types of sensory tests, the objective/perceptual measurement
and the subjective/affective measurement.

TN7
Page 9
Listening tests When a listening test is to be performed, a number of factors must be taken into consideration:
The listening room
In the case of loudspeakers, a listening room which does not colour the sound must be used. First, the
reverberation time must be short and lie within specified limits. Second, the background noise must be
low, so that unintended sound does not interfere with the listening test, see Figure 5.
Blind test and randomisation
The listening test must be performed as a blind test, i.e. the listeners must not see the loudspeakers
or know which kind of loudspeakers are being listened to. The loudspeakers must be hidden behind
an acoustically transparent curtain or screen. The time between the presentations and the order of the
presentations has an affect (the order effect). Therefore, each listener must be presented with the test
items and the programme materials in a new and randomised order.
Programme material and loudness equalisation
The entire signal chain from the CD or sound file must be of a sufficiently high quality so that it does
not limit the sound quality or colour the sound. A suitable programme material must be chosen (music
and speech), which can expose the loudspeakers' properties. For example, the bass cannot be
assessed if only flute music is played. The assessment is affected by the loudness; therefore the
loudspeakers must be adjusted to have the same sound level prior to the test (loudness equalisation).
Figure 5 SenseLab's listening room, which complies
with the standards EBU Tech 3276 and ITU-R BS.1116-1 for multichannel loud
speaker testing. This means that, among other things, background noise has to be at
a very low level and there is a specified reverberation time. The loudspeakers
shown are not part of a blind test.

TN7
Page 10
Attributes and responses
Usually the sound is characterised by attributes. There are a number of requirements for good
attributes, but the main requirements are that they are precise and well defined and that they are
understood in the same way by all of the listeners. The listeners give their responses by marking on
answering axes. See Figure 6. The answers are registered and saved for statistical analysis.
Listening panel
A panel of selected and trained listeners is used for perceptual measurements. The basis for the
selection of the listeners or assessors includes different hearing tests and on them being subsequently
trained in the assessment of different attributes, the use of answer axes and test methods.
The listeners' performances in the individual tests are monitored. It is required that the listeners can
distinguish between the products, that they can repeat their own assessments and that they are in
reasonable consensus with the other listeners.
In the case of a consumer panel for affective measurements, there is no requirement that there must
be consensus with the other listeners when dealing with preference assessments.
Figure 6 Examples of answering axes for the attribute Bass Depth, which is defined in the right side of the image. By pressing the buttons A to H, the assessor can listen to the corresponding
loudspeakers. The assessments are given by moving the markers on the answering axes
to the desired position. When the next attribute is to be assessed, the relation
between the letters A-H and the loudspeakers is changed.
Figure 7 Diagram for monitoring the listeners. Based
on the results, the listeners' performances can be calculated and displayed in a diagram
like this. Good listeners will be placed in the upper right corner, which states that they can
repeat their own assessments (Reliability) and hear the difference between the tested
products (Discrimination).

TN7
Page 11
Attributes properties The attributes that are used, is not meant to describe the sound as such, but the change of the original
sound which the audio system causes. The ideal system – in any case for a faithful reproduction of the
sound – is transparent, there is nothing missing and nothing added in relation to the original sound.
The problem with assessing the sound systems is that the listener does not necessarily know the
original sound; it may even be that it has never existed. The original can be a real sound, a mix in a
recording studio or a virtual sound in the mind of the creator. You may wonder how someone can
assess the change in a sound they have never heard before in reality or which perhaps has never
existed in reality. For the same reason we talk about "envisioned original", i.e. the original, as we
remember it as or as we think it should be, on the basis of the sound we actually perceive. It is a
paradox, but it works in practice.
Good attributes must ideally:
1. Be able to be discriminated between stimuli
2. Be unambiguous for all of the assessors
3. Be able to create consensus between the assessors
4. Have little or no overlap with other terms
5. Be specifiable on scales and be precise and reliable
6. Relate to real products
7. Be related to terms that relates to consumers' preferences
8. Be simple and specific rather than be combinations of terms
9. Have communication value without being slang
10. Relate to physical measures or metrics, that can define stimuli
11. Be specifiable through a reference, which is easy to establish
As stated previously, the usual practice with perceptual measurements is to begin by finding suitable
attributes, which can characterise the actual products, and then subsequently choose and define the
attributes that shall be used in the test. This work is time-consuming and if the same kinds of products
are being test repeatedly, a lexicon of well-defined attributes would be useful. To create an overview,
the attributes can be organised into a hierarchical structure, e.g. in the form of a sound wheel.
Attributes for a sound wheel for reproduced
sound The attributes for reproduced sound characterise the product (the loudspeaker or earphone) on the
basis of the change to the envisioned original, which the product causes. To find words that can be
used to describe sound; we have reviewed scientific articles, reviews of audio equipment and
marketing material issued by dealers and manufacturers. In previous work, we have found words that
generally describe sound – we found over 600 different words. In the current work, which concentrates
on audio products, the total was 'only' 200 words.

TN7
Page 12
It quickly became apparent that different sources used language very differently. Some examples are
shown in Figure 8.
When words from Danish and foreign sources are compared, you may get the impression that
different terms are not used equally often, e.g. in Danish and in English. However, it must be
remembered that in Danish many words are combined into single words, whereas in English two
words are used. For example Bass Depth, Bass Precision, Deep Bass ... contribute to the word Bass
in English but not to the word "Bas" in Danish.
Figure 8 Examples of words used to describe sound
from different sources. The greater the typography, the more frequent the word
appears.

TN7
Page 13
As it can be seen, there is a large choice of words to describe sound. Unfortunately, they are not
uniform or well-defined, and there is significant overlap between the attributes that the words describe.
To create more clarity and order, we reviewed the words in a structured process, which also involved
listening tests.
The very first thing we did was to remove hedonic expressions, i.e. words related to subjective
preferences, e.g. expressions like "lovely sound", "an irritating treble", "a preferred acoustic image".
Next, the words were translated into Danish, as much as possible in the same form, and sorted
alphabetically. Next, doubles, vague expressions and redundant words were removed.
The remaining words were discussed with four experienced listeners from our listening panel. This
resulted in 80 words related to timbre that were selected for a "Napping" procedure. Napping stems
from the French word "nappe", which means table cloth. The procedure is performed by placing the
products on a table cloth, with products that are similar being placed close to each other, and products
that are more different being placed further away from each other. In our case, the products were the
selected words and the table cloth was a computer screen, where the words could be moved around
using a mouse. Eight assessors from DELTA's specialised expert panel took part. This panel includes
musicians, hi-fi enthusiasts, acoustic students, a sound designer, a sound producer, and a person with
a PhD in audio design. The result from one of the participants is shown in Figure 10.
On the basis of the words' coordinates for each the eight participant's results, an overall hierarchical
cluster analysis can be carried out, where the result is a structure, a dendogram, which orders the
words in relation to each other. See Figure 11.
We want to select attributes in accordance with the set requirements for good attributes, but this result
in the following problem: We must use assessors who are trained in the domain to be able to select
the relevant attributes, and we must use the relevant attributes to train the assessors. In other words,
it must necessarily be an iterative process.
Figure 9 Overview of English words used to describe sound when using audio.

TN7
Page 14
Therefore, two listening tests were carried out using DELTA's listening panel. In the first test, sound
examples were played using eight very different loudspeaker systems and recorded using an artificial
head (Head And Torso Simulator, HATS) in the listening position in DELTA's listening room. Fifteen
assessors listened to the recordings using Sennheiser HD 650 headphones, and were asked to define
nine timbral attributes, attack and two spatial attributes, and state any attributes that were considered
to be missing.
The given attributes were:
Full (Very little – A lot)
Rumbling (Very little – A lot)
Depth (Very little– A lot)
Nasal (Very little – A lot)
Brilliance (Very little – A lot)
Sharp (Very little – A lot)
Timbre balance (Dark – Light)
Attack (Imprecise – Precise)
Bass precision (Imprecise – Precise)
Localisation (Diffuse – Precise)
Spatial sense (Diffuse – Precise)
Figure 10 Example of an assessor's positioning of approx. 80 timbre-related words in
accordance with the "Napping" method.

TN7
Page 15
In the first test, the only programme material used was: The CD "Famous blue raincoat", Jennifer
Warnes – "Bird on a wire", which among tonmeisters, is considered to be a very good recording.
In the second test, the assessors listened in turn to four loudspeakers placed in a mono set up in the
listening room.
The objective of the test was to:
Describe the difference between the loudspeakers.
State which differences were the largest and most prominent.
State a preference value for each speaker.
The differences should be described in the categories:
Dynamics
Treble
Midrange
Bass
Timbre balance
Transparency
Figure 11 The result of a cluster analysis of the timbre-related words. The length of each horizontal
'note' is proportional to the difference between the sub groups.

TN7
Page 16
The following pieces of music were used:
Dire Straits - Calling Elvis
Dire Straits – Every street
Dire Straits – Money for nothing
Jennifer Warnes – Bird on a wire
Serenade In E Flat Minor, Rondo Alegro
Tina Dickow – Room with a view
Helge Linn Trio – Natsukashii
The results of the two tests were a number of words and attributes with definitions. The words were
collated in categories and for each category the frequency of the words were counted. The most
frequently occurring words, which were not considered to have overlap, were used as descriptors for
the attributes in the respective category.
Next, the definitions were compared and systematically reviewed. The different person's definitions
were consolidated to a whole and the definitions for the different attributes were mutually coordinated,
so there was no overlap and ambiguity.
The sound wheel for reproduced sound Even though up until now, work has only been intensively carried out for the timbral part of the sound
wheel, an attempt has already been made to design a sound wheel that gives an overall picture. The
sound wheel is shown on the front page of the report.
The sound wheel is a hierarchically organised collection of words, which can be used to describe the
sound, e.g. of loudspeakers and earphones, i.e. to state the characteristics of the products using a
number of attributes. The sound wheel is a means to create a common language to describe audio
system characteristics. It is not a characteristic of the music and voices etc. as such, but the change in
these that the system causes. The sound wheel orders the attributes (outer ring) into categories
(middle ring) which again are ordered into main groups (inner ring).
Qualifications of attributes The sound wheel is meant for general use within reproduced sound, and ideally must therefore
contain all attributes that may be relevant. The attributes must ideally fulfil as a minimum the first four
points in the list of the attributes properties, see page 11. Normally, only a few of the sound wheel's
attributes will be used in a specific test. Typically, in a specific test, fewer than 10 attributes are
sufficient in detail to describe the difference between the products.
With the objective of qualifying a section of the attributes, a new test was carried out. Before the test
was performed, training material was made that consisted of 50 different tonal colours of six
programme materials. The colourings corresponded to the definitions of the attributes and were used
to train the assessors in the specialised expert assessor panel
With eight people from this panel, a listening test was carried out on 15 loudspeakers in mono. The
test was carried out twice. To qualify the attributes, the assessors' ability to repeat their own
assessments and to discriminate between loudspeakers tested for a number of attributes.
TN7
Page 17
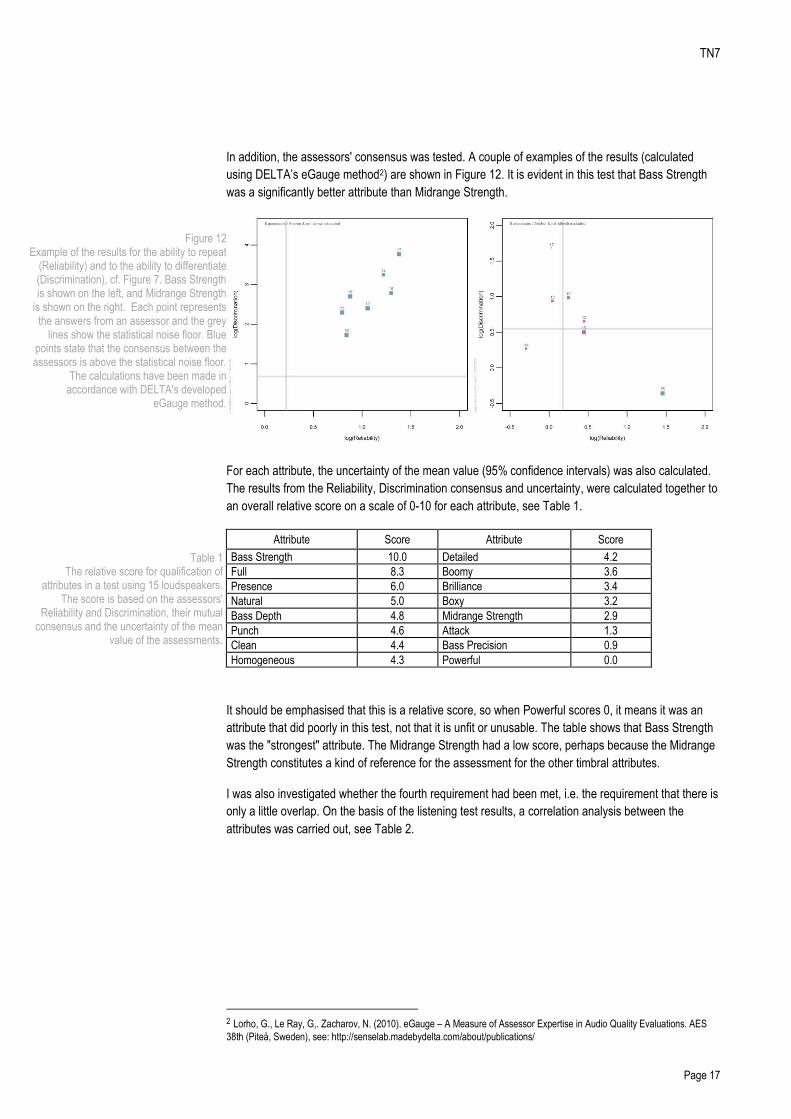
In addition, the assessors' consensus was tested. A couple of examples of the results (calculated
using DELTA’s eGauge method2) are shown in Figure 12. It is evident in this test that Bass Strength
was a significantly better attribute than Midrange Strength.
For each attribute, the uncertainty of the mean value (95% confidence intervals) was also calculated.
The results from the Reliability, Discrimination consensus and uncertainty, were calculated together to
an overall relative score on a scale of 0-10 for each attribute, see Table 1.
Attribute Score Attribute Score
Bass Strength 10.0 Detailed 4.2
Full 8.3 Boomy 3.6
Presence 6.0 Brilliance 3.4
Natural 5.0 Boxy 3.2
Bass Depth 4.8 Midrange Strength 2.9
Punch 4.6 Attack 1.3
Clean 4.4 Bass Precision 0.9
Homogeneous 4.3 Powerful 0.0
It should be emphasised that this is a relative score, so when Powerful scores 0, it means it was an
attribute that did poorly in this test, not that it is unfit or unusable. The table shows that Bass Strength
was the "strongest" attribute. The Midrange Strength had a low score, perhaps because the Midrange
Strength constitutes a kind of reference for the assessment for the other timbral attributes.
I was also investigated whether the fourth requirement had been met, i.e. the requirement that there is
only a little overlap. On the basis of the listening test results, a correlation analysis between the
attributes was carried out, see Table 2.
2 Lorho, G., Le Ray, G,. Zacharov, N. (2010). eGauge – A Measure of Assessor Expertise in Audio Quality Evaluations. AES
38th (Piteå, Sweden), see: http://senselab.madebydelta.com/about/publications/
Figure 12 Example of the results for the ability to repeat
(Reliability) and to the ability to differentiate (Discrimination), cf. Figure 7. Bass Strength is shown on the left, and Midrange Strength
is shown on the right. Each point represents the answers from an assessor and the grey
lines show the statistical noise floor. Blue points state that the consensus between the assessors is above the statistical noise floor.
The calculations have been made in accordance with DELTA's developed
eGauge method.
Table 1 The relative score for qualification of
attributes in a test using 15 loudspeakers. The score is based on the assessors'
Reliability and Discrimination, their mutual consensus and the uncertainty of the mean
value of the assessments.

TN7
Page 18
Bas
s
Str
engt
h
Bas
s D
epth
Pun
ch
Pre
senc
e
Bril
lianc
e
Nat
ural
Pow
erfu
l
Bass Strength
1.00 0.98 0.95 0.84 0.79 0.71 0.67
Bass Depth 0.98 1.00 0.96 0.85 0.83 0.73 0.72
Punch 0.95 0.96 1.00 0.95 0.93 0.87 0.63
Presence 0.84 0.85 0.95 1.00 0.97 0.96 0.52
Brilliance 0.79 0.83 0.93 0.97 1.00 0.95 0.54
Natural 0.71 0.73 0.87 0.96 0.95 1.00 0.42
Powerful 0.67 0.72 0.63 0.52 0.54 0.42 1.00
The correlation coefficient in the table stated to what degree there is accordance between the
attributes. 1.00 states full accordance and 0.00 states no accordance between two attributes, i.e. they
are independent of one another. It can be seen that there is a very high correlation between many of
the shown attributes in the respective test. Either this may be because the attributes naturally overlap
or it may be that "good" loudspeakers often score highly on all of the attractive attributes at the same
time. The attribute Boxy was also tested, and had a high negative correlation with many of the shown
attributes.
Sensory product information In general, sensory assessments and also listening tests are an important tool in connection with
product development. Often, the product must be as good as or better than a specific benchmark in
relation to specific attributes. It may be a competing product or perhaps the old model's sound was
slight too dark, so the new model has to be a little lighter, with more brilliance. Perhaps it is about
placing the bass reproduction for the new model between two models that are already on the market.
However, if a structured and objective listening test has been carried out, it is then reasonable to
utilise the results to also guide the customers. As consumer information to supplement to the sales
claim.
"No one owns the patent that says what good wine tastes like" – We are not getting any the wiser
when we learn that it is a fantastic red wine with a beautiful colour that tastes great with soup, meat
and dessert. We gain more if we know how strong the flavour is, how sweet or dry it is, etc.
Correspondingly, this applies to reproduced sound from audio products.
It is not enough though to have an assessment of the sound quality, because the sound quality is a
statement of the degree to which the sound from a product meets the expectations. The assessment
of quality includes a (conscious or unconscious) comparison with the desired properties (a "personal"
reference"). The better the sound's characteristics meet the desired properties the higher the quality
the sound is judged to have. Unless a common accepted quality reference is found, "quality" must be
considered a subjective term.
If a consumer wants to make a serious attempt to choose between different loudspeakers, the person
usually listens to them in one or more store sales rooms. But there are many reasons why this is an
almost impossible exercise, so if there was objective product information available, which describe the
sound characteristics, this would be helpful. Figure 13 shows an example of what this could look like.
Table 2 Correlation analysis between some of the
attributes that were included in the listening test

TN7
Page 19
If the consumer looked at the three loudspeakers that are shown in the figure, there would have been
no doubt about the tonal properties, which could be compared with size, price, etc.
Preference mapping In connection with the Filter Model that was shown on page 7, it was stated that the relationships
between the perceptual and the affective measurements (in this case preference) are called
preference mapping.
In connection with the listening test named on page 16, the assessors were also asked also to state
the degree of preference. To be relevant, the preference assessment is normally carried out by
consumers from the relevant market segment, but we might claim that the assessors represent the
segment of critical listeners.
On the basis of the assessors’ assessments of the attributes in the "Sensory product information" in
Figure 13, a model has been built to calculate their preferences. The results are shown in Figure 14. It
can be seen that there is good correlation between the model's predictions and the actual stated
preferences in the listening test.
The example shows that the method works, but it does not show the degree to which the results can
be generalised. This requires that the model's predictions are tested on loudspeakers which results
are not included in the "model construction".
Another factor which the attentive reader has perhaps noticed is that there are more than 15
loudspeakers along the horizontal axis. This is because the test was carried out twice and some of the
loudspeakers were included in both tests. Some of the assessments of the same speakers deviated
significantly in the two tests. It is generally known that the assessments of a loudspeaker to some
degree are influenced by which other loudspeaker it is compared with. Therefore, three loudspeakers
are selected; see Figure 13, which will function as anchor points in the coming tests.
0
2
4
6
8
10
12
14
Loudspeaker 1
Loudspeaker 2
Loudspeaker 3
Figure 13 Example of the results of the listening test
mentioned on page 16. The results stem from three loudspeakers, intended for use as
the upper, middle and bottom anchor in the coming listening tests.

TN7
Page 20
Future work The main emphasis of the performed work so far, has been the timbral attributes, which can explain
approx. 70% of the perceived differences between loudspeakers. In the next phase, we will look in
more detail at the spatial attributes for stereo and surround sound systems.
Conclusion The technical data on their own do not provide information on the sound character of the audio
products. By supplementing the technical data with the results of listening tests, it is possible to get an
objective characteristic of the perceived sound. However, it requires that the listening tests are carried
out as structured blind tests with trained listeners in a listening room that does not colour the sound.
For such tests, among other things, a lexicon of well-defined attributes that the listeners are trained in
must be used. The sound wheel is such a collection of attributes, of which the timbral attributes have
been qualified in a number of tests. The aim of the sound wheel is to create a common language to
describe systems for audio reproduction.
An objective characteristic of the perceived sound can be used in product development, but it can also
be used as sensory product information, which the consumer will benefit from. On the basis of the
results of objective listening tests, the customer's preferences can be modelled and thus predicted.
0
2
4
6
8
10
12
0 5 10 15 20
Pre
fere
nce
ass
ess
me
nt,
sca
le 0
-15
.
Loudspeaker no.
Listening test
Model
To learn more, visit
madebydelta.com/senselab
Here you will find background
articles and reports about the
executed measurements.
Figure 14 The preference assessments in the listening
test compared with the preference calculated with a model based on the attributes in
Figure 13. The loudspeakers are numbered, and are placed on the horizontal with
increasing preference in accordance with the results from the listening test.
R2 = 0.96

TN7
Page 21
Definitions of attributes With a few exceptions, it is not enough to describe the attributes using a single word. Different people
can have different perceptions of the meanings of a word. To be able to use the attributes
unambiguously and objectively, they must therefore be defined. Terms are used in the definitions,
such as bass, midrange and treble, and reference are given to musical instruments. This is why at the
end of the TECH Document (page 28) there is some information about this.
Loudness
Loudness How loud the sound is perceived.. Scale: Soft - (Suitable) - Loud
Dynamics The ability to precisely and convincingly reproduce fast, large changes in loudness, and to reproduce
a large level range and clearly differentiate between sound levels.
Attack Transient response. Specifies whether the drum beats and percussion, etc. are accurate and clear i.e.
if you can hear the actual strokes from drumstick, the plucking of the strings etc. it is also expressed
as the ability to reproduce each audio source transients cleanly and separated from the rest of the
sound image. Imprecise Attack is understood as unclear or a muted impact.
Scale: Imprecise – Precise
Bass Precision Are instrument impacts from the bass drum and bass precise, crisp and without distortion, are the
impacts tight and well defined? Bass precision may be defined as Attack in the bass region. Imprecise
means that the attack spread in time and the peak of the impact is softened.
Scale: Imprecise – Precise
Punch Specifies whether the strokes on drums and bass are reproduced with clout, almost as if you can feel
the blow. The ability to effortlessly handle large volume excursions without compression (compression
is heard as level variations that are smaller than one would expect from the envisioned original
sound). Scale: A little – A lot
Powerful The ability to handle high sound levels, especially when striking the drums and bass. Indicates
whether the Punch, Attack and Bass precision are maintained at high volume. Scale: A little – A lot
Treble Treble is the reproduction of the highest frequencies (above approx. 3 kHz), i.e. the overtone range for
voices and most instruments. Only the piccolo, certain types of percussion instruments and
instruments with a very large frequency range (organs) have their fundamental frequencies in the
treble. Speech's sharpest consonants, e.g. "s" - sounds are also found in this range.

TN7
Page 22
Treble strength The relative strength of the treble or high frequencies.
Scale:
Weak: Covered, unsharp.
A little under neutral: A soft sound without being dull.
Neutral: In the middle of the scale, where you can clearly distinguish instruments.
A lot: Treble Raised. Sharp, hard sound.
Brilliance Treble or high frequency extension.
Scale:
A little: As if you hear music through a door, muffled, blurred or dull.
A lot: Crystal-clear reproduction extended treble range with airy and open treble. Lightness,
purity and clarity with space for instruments. Clarity in the upper frequencies without being
sharp or shrill and without distortion.
Tinny Resonances or narrowband frequency prominence in the treble or high frequencies. Scale: None – Weak – A lot
Midrange Midrange is the reproduction of the midrange frequencies, approx. 400-3000 Hz, e.g. soprano,
trumpets, violins and xylophones.
Midrange Strength The relative level of the midrange, i.e. the middle frequencies, e.g. sopranos, trumpets, violins and
xylophones. Not to be confused with Canny which represents prominent narrow frequency ranges
(resonances) in the midrange. Scale: Soft - Loud
Nasal A closed sound with pronounced midrange. Gives the impression corresponding to vocalists singing
through the nose (nasal).
Scale: A little – A lot
Canny The music sounds like it is being played in a can or tube. The sound is characterised by prominent
and narrowband resonances in the midrange.
Scale: A little – A lot
Bass Bass describes the lowest tone range (below approx. 400 Hz). The bass range includes male voices,
bass guitar large drums, kettledrums and the tuba.
Bass Strength The relative level of bass, i.e. the low frequencies, for example male voices, bass guitar, bass drum,
timpani and tuba. Should not be confused with Bass Depth that indicates the low frequency bass
extension. Scale: Soft - Loud

TN7
Page 23
Bass Depth Denotes how far the bass extends downwards. If it goes down in the low end of the spectrum, there is
great depth. Should not be confused with Bass strength, which indicates the strength of the bass or
Boomy which relates to resonances in the lower bass region. Scale: A little - A lot
Boomy Resonances in the low bass, as sound in a large barrel, which gives a prominent bass resound
resounding (reverberating) when bass and bass drums are heard. The representation tends to
become muddy and imprecise. Scale: None – Weak – Loud
Boxy Boxy denotes a hollow sound, as if the sound was played inside a small box. Represents resonances
in the upper bass frequency range. Scale: None – Weak – Loud
Timbral balance Describes the balance between bass and treble and the cohesion between the different tone ranges.
Dark- Light Denotes the balance between bass and treble.
Scale:
Dark: Excessive bass. Either loud bass or weak treble.
Neutral: Bass and treble are perceived equally loud, there is a balance in the reproduction.
This also applies if both bass and treble are equally weak or if the bass and treble are both
too loud. If it leads to prominent or soft midrange this is assessed by the Midrange strength.
Bright: Excessive treble. Either loud treble or weak bass.
The cause for the sound being dark or light can deduced from the assessments of Bass strength and
Treble strength.
Full If both low and high frequencies are well represented with good extension the sound is Full. Scale: A little – A lot
Homogeneous Denotes to which degree the different frequency ranges (bass, midrange and treble) are coherent,
continuous, and balanced without gaps between them. That there are seamless transitions between
the tone ranges. Scale: A little – A lot
Spatial sound image
Distance The perceived distance between the listener and the main sound sources (instruments/singer). Does
the music sound as if it is close by or far away? Scale: Near - Far

TN7
Page 24
Width The width of the sound image (expressed as the perceived angle). - The width of the sound sources
positions (soundscape width). The width of any reverberation should not be included in the
assessment. Scale: Small - Very wide
Depth The depth of the sound image (i.e., in the direction away from the listener). Not to be confused with
distance. Scale: Flat - Deep
Stereo balance
Is the soundstage skewed to one side (left or right) or is it centred in the middle? Scale: Skewed - Balanced
Spatial – localisation
Precise Can the individual instruments and voices be clearly placed and separated in the spatial sound
image? How precise are the individual sound sources positioned in the room? If the individual sound
sources are inadvertently spread or broadened out the precision is low. Scale: Low - High
Envelopment Are you surrounded by the reproduced sound and does it give a sense of space around you? Scale: A little – A lot
Externalization When listening with headphones: To what extent do you perceive the sound sources outside of your
head? Scale: A little – A lot
Transparency Transparency states to what degree the system is transparent, so that it does not colour or affect the
music, speech, etc. Transparency also states to what degree it sounds as if the sound sources are
present. Transparency is an overall attribute, which depends to what degree the attributes in the other
categories are optimal.
Presence The degree to which the sound sources sound like they are present and not remote and absent. Scale: A little – A lot
Clean It is easy to listen into the music, which is clear and distinct. Instruments and vocals are reproduced
accurately and distinctly. The opposite of clean: dull, muddy. Scale: A little – A lot

TN7
Page 25
Detailed
A well-resolved sound rich in detail. Instruments, voices etc. can easily be separated.
The music has many details, details that cannot be measured, details that give the music "soul". It
may be small audible nuances: Breathing from a singer, fingers wandering across the guitar strings,
the flaps from the clarinet, embouchure sound of the saxophone, the impact from the piano's hammers
when they hit the strings.
Scale: A little – A lot
Natural Sounds reproduced with high fidelity. Acoustic instruments, voices and sounds, sounds like in reality.
The sound is similar to the listener's expectation to the original sound without any timbral or spatial
coloration or distortion, "Nothing added - nothing missing." The soundstage is clear in space and
brings you close to the perceived original sound experience.
Scale: A little – A lot
Artefacts - signal-related
Shrill Treble Distortion. Very sharp s-sounds, cymbals etc. Scale: A little – A lot
Rubbing As the sound of something scraping on a (rough) surface.
Scale: A little – A lot
Rough A hoarse off-sound unintentionally accompanying the reproduced sound. Bass distortion. Scale: A little – A lot
Buzzing A zzz-like, undesirable sound typically in the low and midrange frequencies. Scale: A little – A lot
Clipped The harmonics are to pronounced and sharp. Scale: A little – A lot
Distorted Additional sounds that add sharpness to the reproduction.
Scale: A little – A lot
Compressed Limited dynamic range leading to a lack of natural peaks. Dymanic compression may be heard as a
pumping effect. Scale: A little – A lot

TN7
Page 26
Artefacts - Noise
Hissing A noise-like sizzling sound, like the sound of bacon in a frying pan.
Scale: A little – A lot
Humming Low frequency noise with tonal components
Scale: A little – A lot
Bubbling Sound or noise with fast (<1 sec.) variations in frequency and/or loudness. Scale: A little – A lot
Fluctuating/Intermittend Noise with varying loudness and or pauses
Scale: A little – A lot
Words that you perhaps miss As stated earlier, the attributes in the sound wheel are the most frequently used words in every
category. The definitions given above have been made so that they take the words that were ranked
lower into consideration. Below is a list of the most important words that are not included, with
reference to the attribute that covers them.
Absence, see Presence
Airy, see Brilliance
Attack in the bass range, see Bass Precision
Attenuated strike, see Attack
Bass distortion, see Rough
Bass extension, see Bass Depth
Blunt, see Treble Strength
Blurred, see Brilliance
Centred, see Stereo Balance
Clarity, see Brilliance
Clear positioning of sound sources, see
Precise Localisation
Clear, see Clean
Cohesive tone ranges, see Homogeneous
Cold, see Dark-Light (Light)
Covered, see Treble Strength
Crisp, see Brilliance
Crystal clear, see Brilliance
Detailed richness, see Detailed
Direct bass, see Bass Precision
Distinct, see Bass Precision
Dull, see Brilliance
Dynamic bass, see Bass Precision
Echoey, see Boomy
Effortless, see Punch
Enclosed, see Brilliance
Envisioned original sound, see Natural
Fast bass, see Bass Precision
Feeling of space, see Envelopment
Fidelity, see Natural
Flat, see Depth
Hard, see Treble Strength
Heavy, see Bass Depth
Hoarse, see Rough
Hollow, see Boxy
Inflated, see Bass Strength
Instruments can be easily separated, see
Detailed
Large frequency range, see Full
Lightness, see Brilliance
Limited dynamic, see Compressed
Listen into the music, see Clean
Lively, see Detailed
Muddy, see Boomy
Muddy, see Clean
Musical, see Natural
Narrow, see Width
Near, see Distance
Not cohesive, see Homogeneous
Off-sound, see Distortion

TN7
Page 27
Open, see Brilliance
Overlapping, see Clean
Perceived loudness, see Loudness
Pointed, see Tinny
Potent bass, see Bass Strength
Pumped effects, see Compressed
Remote, see Distance
Resonance in the low bass, see Boomy
Resonance in the midrange, see Canny
Resonance in the treble, see Tinny
Resonance in the upper bass, see Boxy
Rich, see Full
Rub, see Rubbing
Seamless, see Homogeneous
Sharp, see Brilliance
Sharp, see Treble Strength
Shining, see Brilliance
Sizzling, see Hissing
Skew, see Stereo Balance
Smooth, see Clean
Soft sound, see Treble Strength
Sonores, see Bass Strength
Soul, see Detailed
Sound sources outside head (with
earphones), see Externalisation
Space for instruments, see Brilliance
Spacious separation, see Precise Localisation
The music is present, see Transparency
The sound sources are present, see
Transparency
Thin sound, see Bass Strength
Thin sound, see Bass Strength
Tight, see Bass Precision
Transient reproduction, see Attack
Transient response, see Attack
Treble distortion, see Shrill
Treble extent, see Brilliance
Unclear blow, see Attack
Voices can be easily separated, see Detailed
Warm, see Dark-Light (Light)
Well-defined, see Detailed
Whole, see Homogeneous
Without natural peaks, see Compressed

TN7
Page 28
Examples of frequency ranges
Source: Semantic Space of Sounds.
http://www.madebydelta.com/imported/senselab/The_Semantic_Spaces_of_Sounds.pdf
Source: http://dpaudioa.blogspot.dk/2011/02/frequency-amplitude-and-eq.html
Figure 15 In the definitions of attributes, a file of
different frequency ranges is referred to. The figure shows which frequencies the different
ranges cover.
Figure 16 In the definitions of attributes, a file for
different instruments is referred to. The figure shows which frequencies the different ranges cover. The red ranges states the instruments'
fundamental tone, the yellow ranges state the overtones (and consonants for speech)

TN7
Page 29
About TECH Document
To learn more about the subject described in this TECH Document, visit senselab.madebydelta.com,
which has background reports and articles.
DELTA regularly publishes the TECH Document series to report the latest international knowledge in
our specialist areas. The aim is to help bring about faster turnaround, where the newest technological
breakthroughs become commercially viable for Danish companies.
About DELTA
DELTA helps its customers through the optimal application of technology that will be successful in a
complex world. We manage design, development, test, certification and advisory services in
electronics, microelectronics, software technology, light, optics, acoustics, vibration and sensor
systems.
DELTA is one of the leading development institutes in Europe, and one of only nine Approved Danish
Technological Institutes (GTS) in Denmark. We employ 270 people in Denmark, Sweden and the UK
and collaborate with customers in over 50 countries.