Embed Size (px)
Citation preview
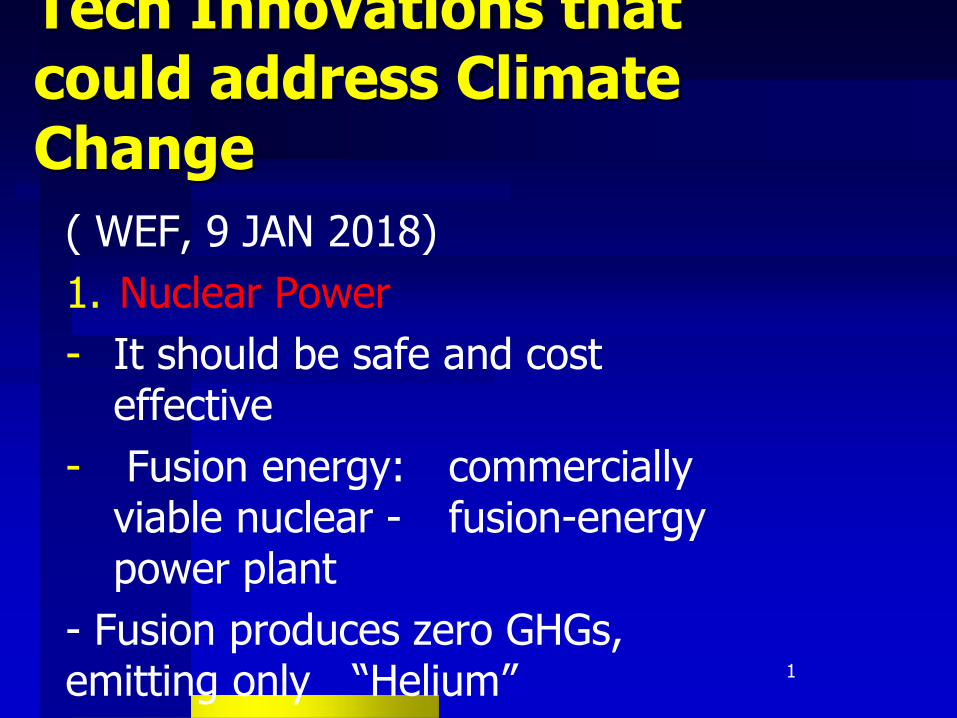
Tech Innovations that could address Climate Change
( WEF, 9 JAN 2018)1. Nuclear Power- It should be safe and cost
effective - Fusion energy: commercially
viable nuclear - fusion-energy power plant
- Fusion produces zero GHGs, emitting only “Helium” 1
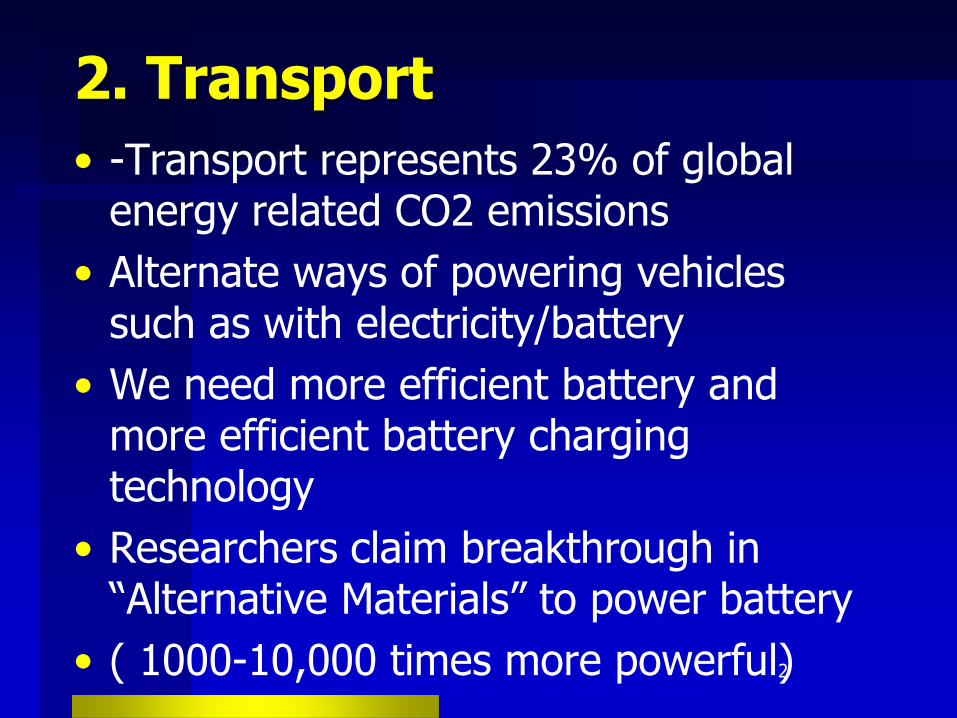
2. Transport• -Transport represents 23% of global
energy related CO2 emissions• Alternate ways of powering vehicles
such as with electricity/battery• We need more efficient battery and
more efficient battery charging technology
• Researchers claim breakthrough in “Alternative Materials” to power battery
• ( 1000-10,000 times more powerful)2

3. Food • About ¼ of global emissions come from
feeding the world’s 7 Billion People • There is “no way to produce enough
meat for 9 Billion people “ ( B Gates)• One alternative is to produce “Lab-
grown meat “that looks like and taste feels like the real thing
• One company has already created the first meat burger that is plant based ,made from vegetable protein found in” Peas”
3
4.(a) Manufacturing
• About 30 % emissions come from industry
• Carbon engineering : removing CO2 from air( one company already has demonstration plant) that is removing one ton of CO2from the air every day
• Direct air capture can remove far more CO2 per acre of footprint than trees & plants ( Company statement) 4
4(b).Carbon Capture and Storage ( CCS)• CCS has not yet proven at large scale
,although individual components of CCS ( capture, transport and sequestration ) are established technologies( IEA)
• About 12 CCS projects are operating globally (2015)
• Hope we will develop technologies and find commercial viable solutions for CCS, for coal –fired plants
5
5. Buildings
• Combined emissions from lighting, power, heating & cooling( office & home) contribute almost 20 % of global emissions
• Part of the answer is to build smart cities ( EE, renewable ,end use, technology adoption etc.)
6

Funding Commitments
• Members of the Breakthrough Energy Coalition (BEC)
• BEC includes JEFF BEZOS(Amazon),Jack Ma ( Ali baba), Richard Branson
• Committed to invest more than $ 1 Billion in New Technologies in the next 20 years
7

THANK YOU !!!
8

Responding to Development Priorities of Nepal: Relevance of Regional Experiences to Nepal
Bindu N. Lohani
9
AIT Day Symposium
HOTEL HIMALAYA
10 February 2017, Lalitpur , Nepal
10
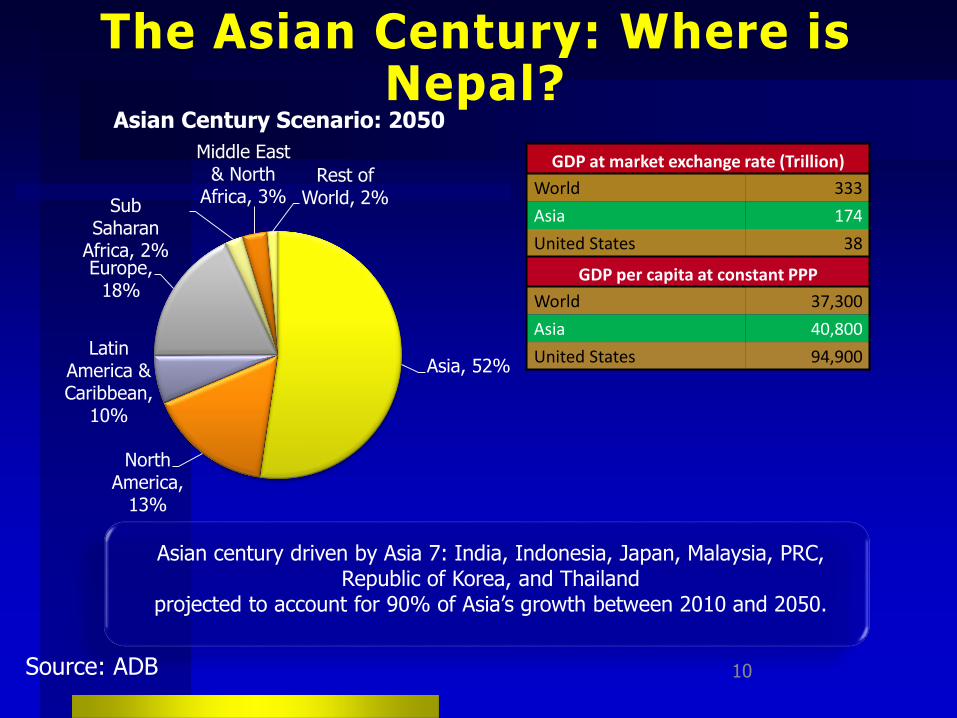
Asia, 52%
North America,
13%
Latin America & Caribbean,
10%
Europe, 18%
Sub Saharan
Africa, 2%
Middle East & North
Africa, 3%Rest of
World, 2%
Asian Century Scenario: 2050GDP at market exchange rate (Trillion)
World 333Asia 174United States 38
GDP per capita at constant PPPWorld 37,300Asia 40,800United States 94,900
Asian century driven by Asia 7: India, Indonesia, Japan, Malaysia, PRC, Republic of Korea, and Thailand
projected to account for 90% of Asia’s growth between 2010 and 2050.
The Asian Century: Where is Nepal?
Source: ADB
Regional and Global Mega Trends :
What they mean to Nepal?
11

Global Mega Trends
12
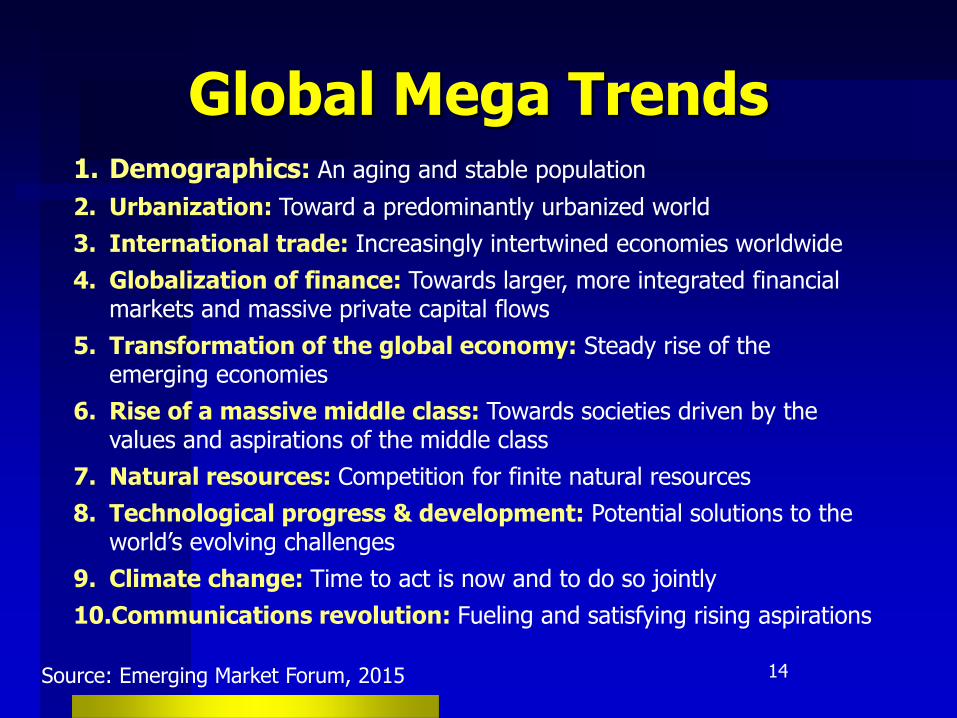
1. Demographics: An aging and stable population2. Urbanization: Toward a predominantly urbanized world3. International trade: Increasingly intertwined economies worldwide4. Globalization of finance: Towards larger, more integrated financial
markets and massive private capital flows5. Transformation of the global economy: Steady rise of the
emerging economies6. Rise of a massive middle class: Towards societies driven by the
values and aspirations of the middle class7. Natural resources: Competition for finite natural resources8. Technological progress & development: Potential solutions to the
world’s evolving challenges9. Climate change: Time to act is now and to do so jointly10.Communications revolution: Fueling and satisfying rising aspirations
Source: Emerging Market Forum, 2015
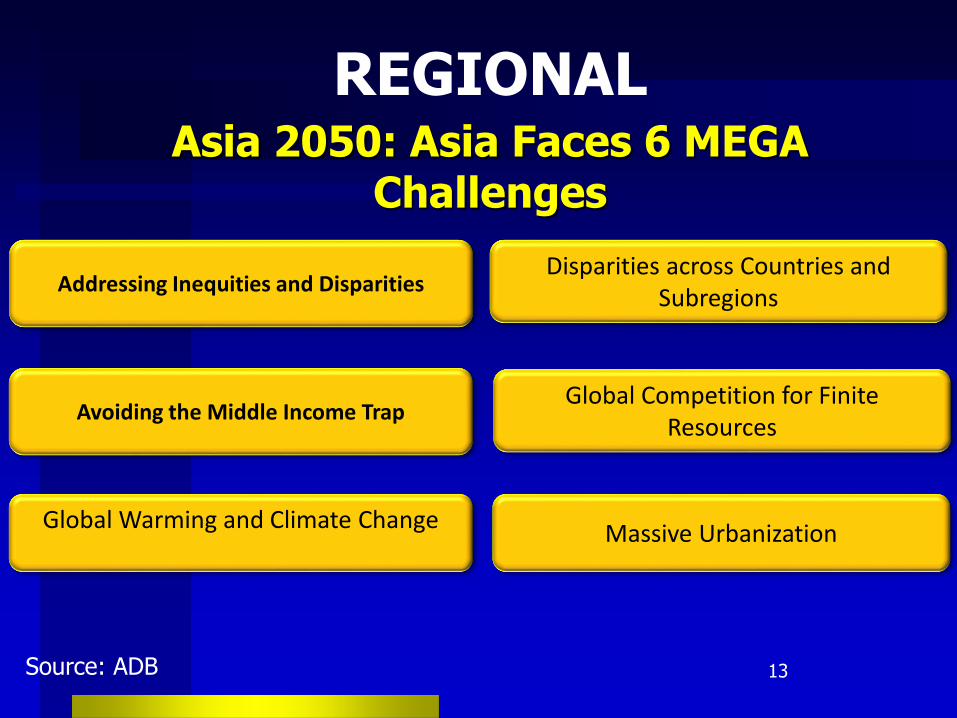
Asia 2050: Asia Faces 6 MEGA Challenges
Avoiding the Middle Income Trap
Addressing Inequities and Disparities
Massive Urbanization
Disparities across Countries and Subregions
Global Warming and Climate Change
Global Competition for Finite Resources
13
REGIONAL
Source: ADB
Global Mega Trends
14
1. Demographics: An aging and stable population2. Urbanization: Toward a predominantly urbanized world3. International trade: Increasingly intertwined economies worldwide4. Globalization of finance: Towards larger, more integrated financial
markets and massive private capital flows5. Transformation of the global economy: Steady rise of the
emerging economies6. Rise of a massive middle class: Towards societies driven by the
values and aspirations of the middle class7. Natural resources: Competition for finite natural resources8. Technological progress & development: Potential solutions to the
world’s evolving challenges9. Climate change: Time to act is now and to do so jointly10.Communications revolution: Fueling and satisfying rising aspirations
Source: Emerging Market Forum, 2015
Selected Mega Trends: Relevance to Nepal
15
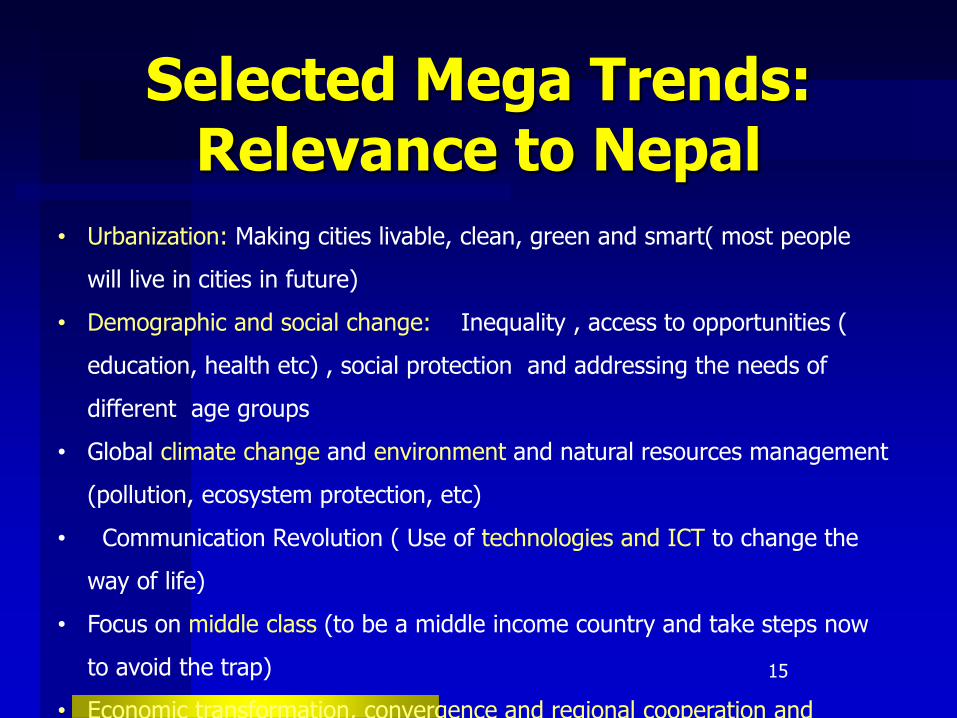
• Urbanization: Making cities livable, clean, green and smart( most people will live in cities in future)
• Demographic and social change: Inequality , access to opportunities ( education, health etc) , social protection and addressing the needs of different age groups
• Global climate change and environment and natural resources management (pollution, ecosystem protection, etc)
• Communication Revolution ( Use of technologies and ICT to change the way of life)
• Focus on middle class (to be a middle income country and take steps now to avoid the trap)
• Economic transformation, convergence and regional cooperation and

16

1000
6000
11000
16000
21000
26000
31000
36000
41000
46000
5 10 15 20 25 30 35 40
GN
I pe
r ca
pita
($,
Atla
s M
etho
d)
Singapore
Korea
Malaysia
Thailand
Indonesia
Philippines
PRC
India
Sri Lanka
Years since middle income was reached
High Income
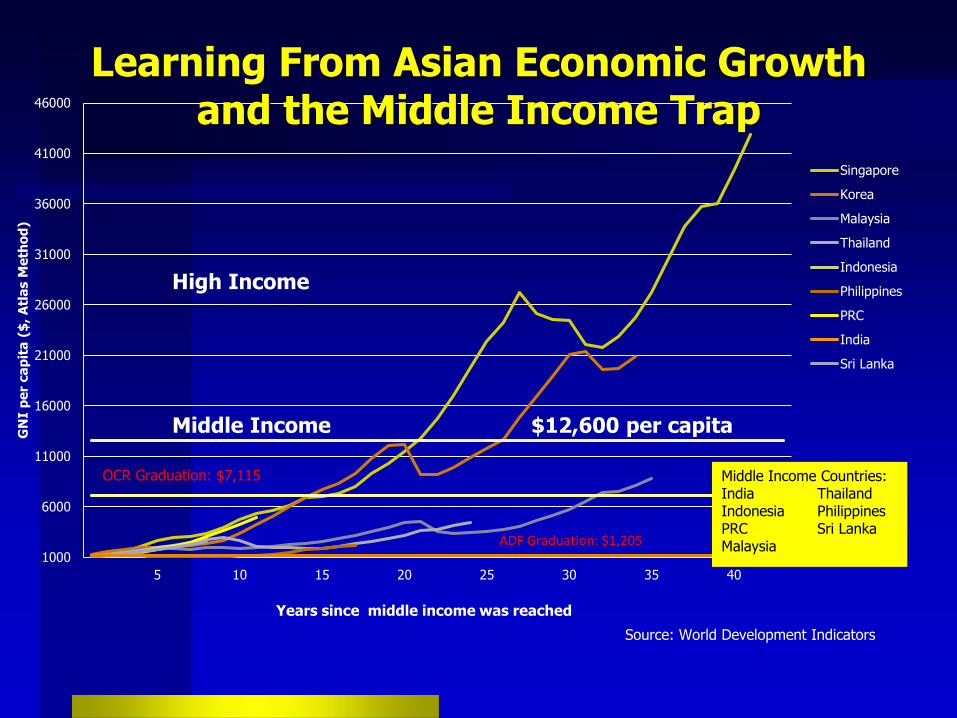
Middle Income $12,600 per capita
Source: World Development Indicators
Middle Income Countries:India ThailandIndonesia PhilippinesPRC Sri LankaMalaysia
OCR Graduation: $7,115
ADF Graduation: $1,205
Learning From Asian Economic Growth and the Middle Income Trap
18
-
10,000
20,000
30,000
40,000
50,000
60,000
70,000
1980
1981
1982
1983
1984
1985
1986
1987
1988
1989
1990
1991
1992
1993
1994
1995
1996
1997
1998
1999
2000
2001
2002
2003
2004
2005
2006
2007
2008
2009
2010
2011
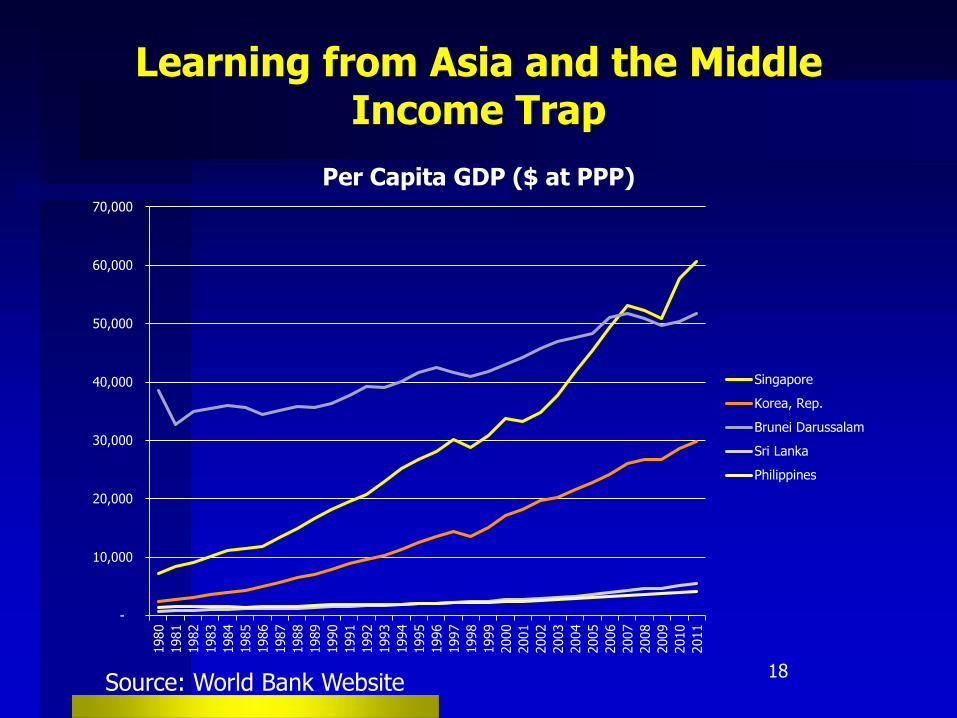
Per Capita GDP ($ at PPP)
SingaporeKorea, Rep.Brunei DarussalamSri LankaPhilippines
Source: World Bank Website
Learning from Asia and the Middle Income Trap
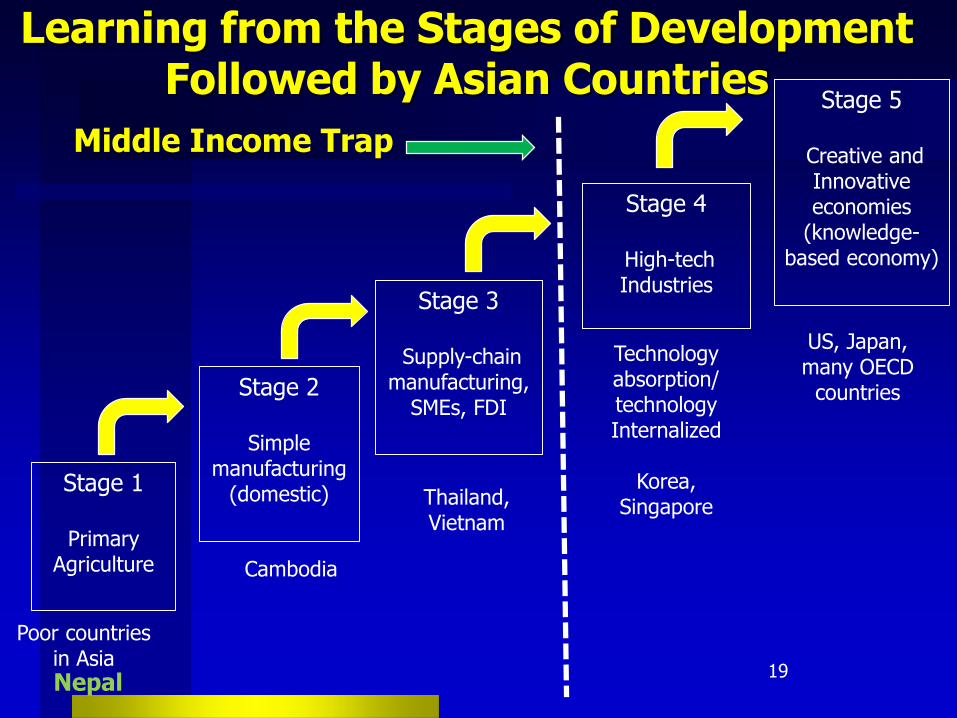
Learning from the Stages of Development Followed by Asian Countries
19
Stage 1
Primary Agriculture
Stage 2
Simple manufacturing
(domestic)
Stage 3
Supply-chainmanufacturing,
SMEs, FDI
Stage 4
High-tech Industries
Stage 5
Creative and Innovative economies
(knowledge-based economy)
Technologyabsorption/technologyInternalized
Korea, Singapore
Middle Income Trap
Poor countries in Asia
Thailand, Vietnam
Cambodia
US, Japan, many OECD
countries
Nepal
20

STRUCTURAL TRANSFORMATION IS REQUIRED
Source: ADB

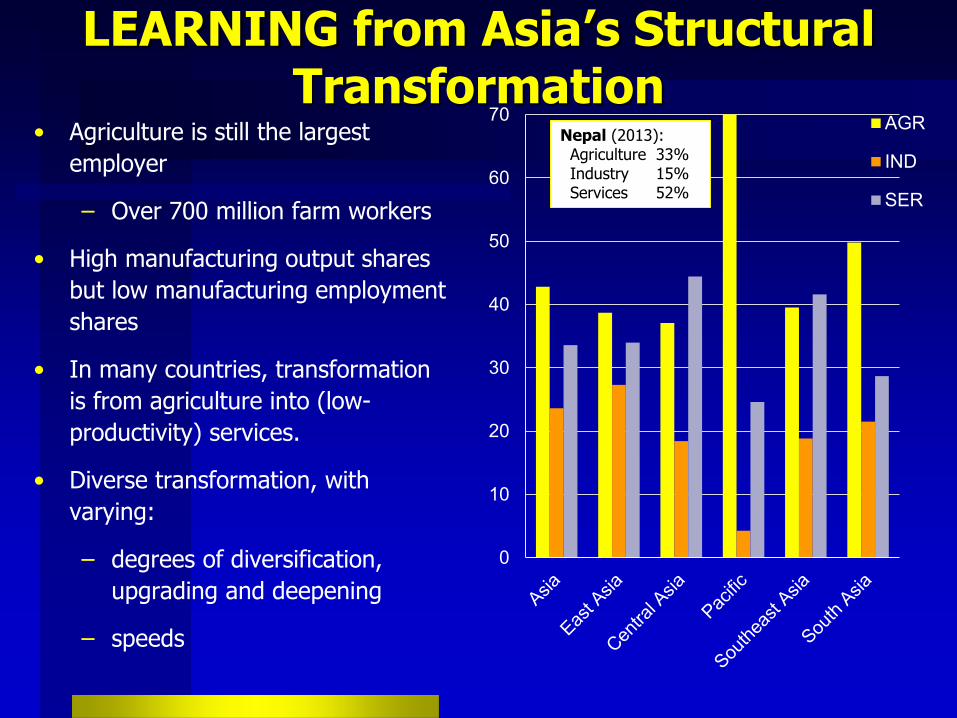
LEARNING from Asia’s Structural Transformation
• Agriculture is still the largest employer
– Over 700 million farm workers
• High manufacturing output shares but low manufacturing employment shares
• In many countries, transformation is from agriculture into (low-productivity) services.
• Diverse transformation, with varying:
– degrees of diversification, upgrading and deepening
– speeds
0
10
20
30
40
50
60
70 AGR
IND
SER
Nepal (2013):Agriculture 33%Industry 15%Services 52%
520
3550
6580
95
Man
ufac
turin
g ou
tput
(%
of G
DP
)
100025000
4900073000
97000
GDP per capita (constant 2000 US$)
Developing Asia Rest of the world
Manufacturing Output
515
2535
Man
ufac
turi
ng e
mpl
oym
ent (
% o
f tot
al)
100021000
4100061000
GDP per capita (constant 2000 US$)
Developing Asia Rest of the world
Manufacturing Employment
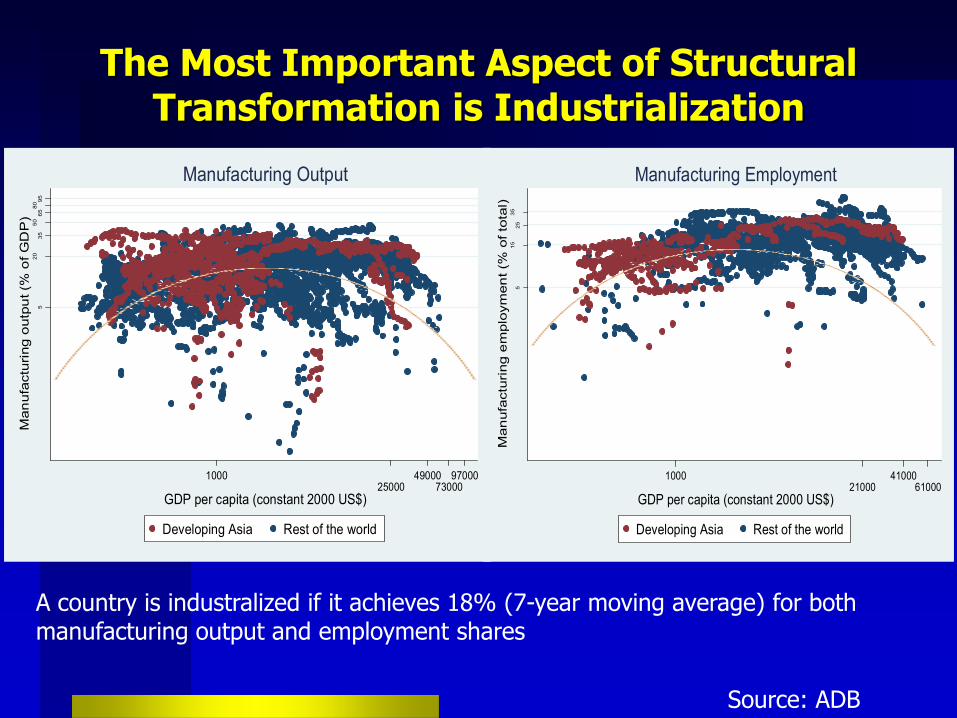
The Most Important Aspect of Structural Transformation is Industrialization
Source: ADB
A country is industralized if it achieves 18% (7-year moving average) for bothmanufacturing output and employment shares

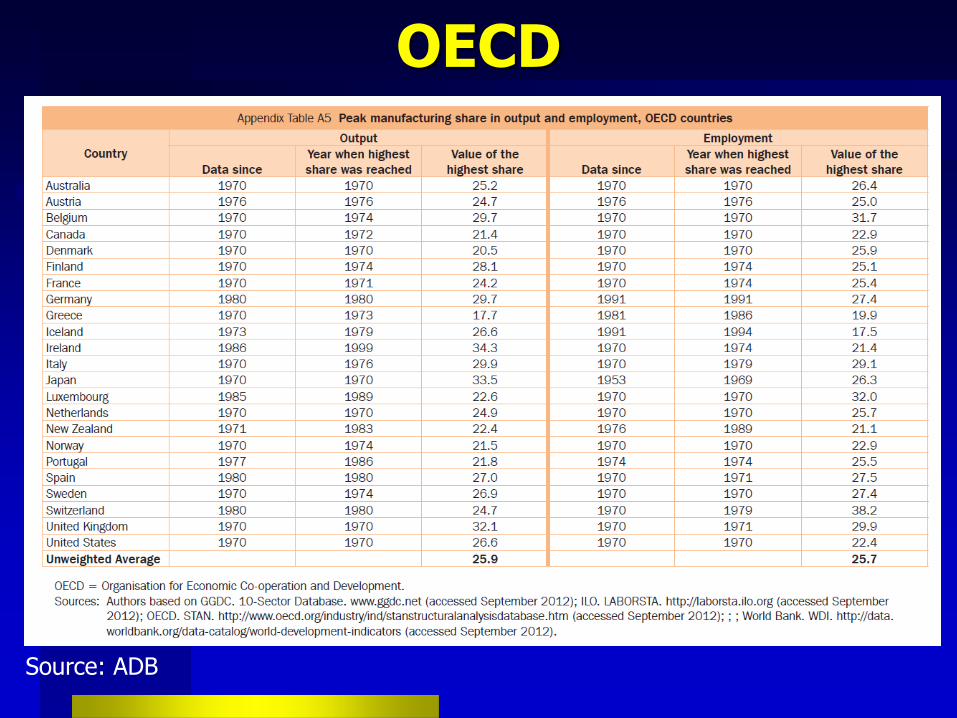
The OECD Case
• The members of OECD industrialized long ago and have clearly deindustrialized during the last 3 decades or so.
• Their manufacturing output and employment shares peaked at about 25% during the 1970s —in some cases reaching 30% and above.
• The share then declined to about half of that.
OECD
Source: ADB

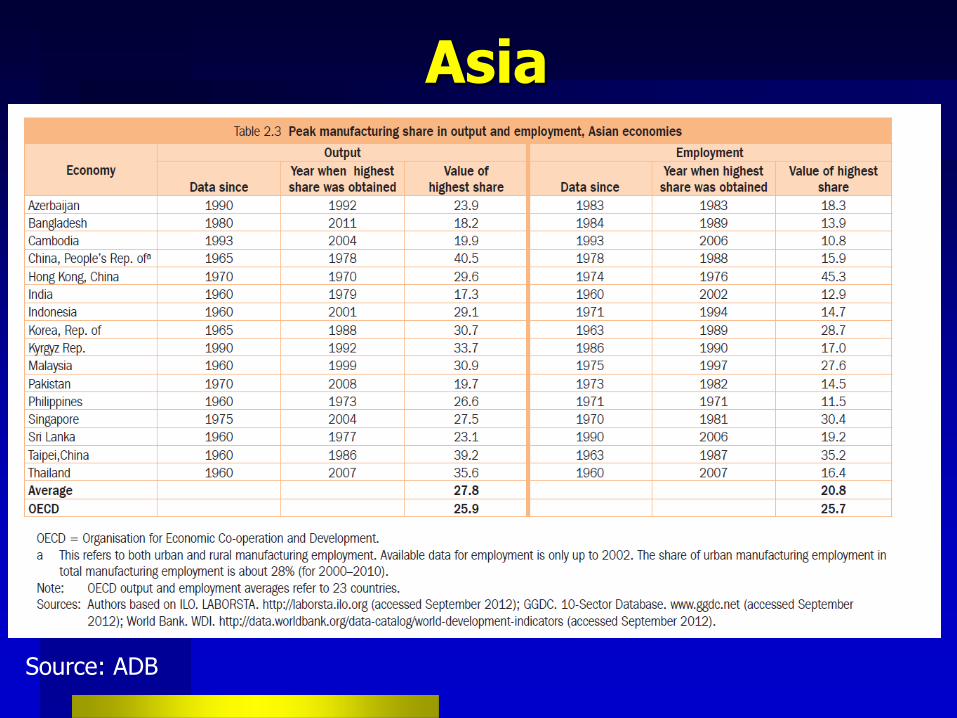
Asia
Source: ADB
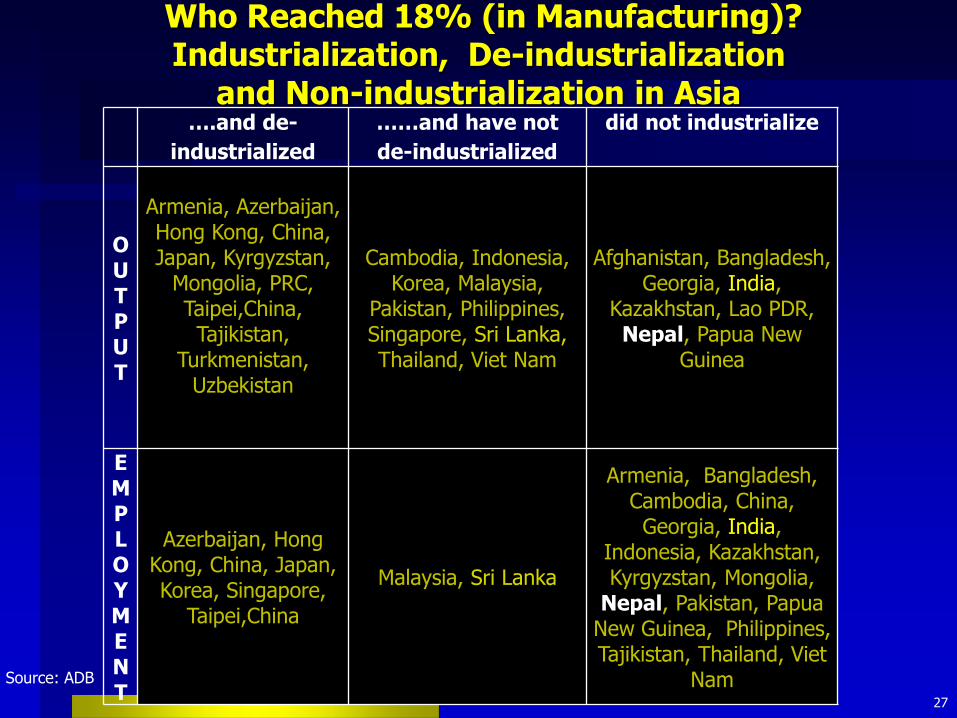
Who Reached 18% (in Manufacturing)? Industrialization, De-industrialization
and Non-industrialization in Asia
27
….and de-industrialized
……and have not de-industrialized
did not industrialize
OUTPUT
Armenia, Azerbaijan, Hong Kong, China, Japan, Kyrgyzstan,
Mongolia, PRC, Taipei,China, Tajikistan,
Turkmenistan, Uzbekistan
Cambodia, Indonesia, Korea, Malaysia,
Pakistan, Philippines, Singapore, Sri Lanka,Thailand, Viet Nam
Afghanistan, Bangladesh, Georgia, India,
Kazakhstan, Lao PDR, Nepal, Papua New
Guinea
EMPLOYMENT
Azerbaijan, Hong Kong, China, Japan, Korea, Singapore,
Taipei,ChinaMalaysia, Sri Lanka
Armenia, Bangladesh, Cambodia, China, Georgia, India,
Indonesia, Kazakhstan, Kyrgyzstan, Mongolia,
Nepal, Pakistan, Papua New Guinea, Philippines, Tajikistan, Thailand, Viet
Nam Source: ADB

A Key Message is:
Challenge of reallocating labor to manufacturing and high productivity sectors – BECOMING A KNOWLEDGE-BASED ECONOMY WILL
HELP ACHIEVE THIS.
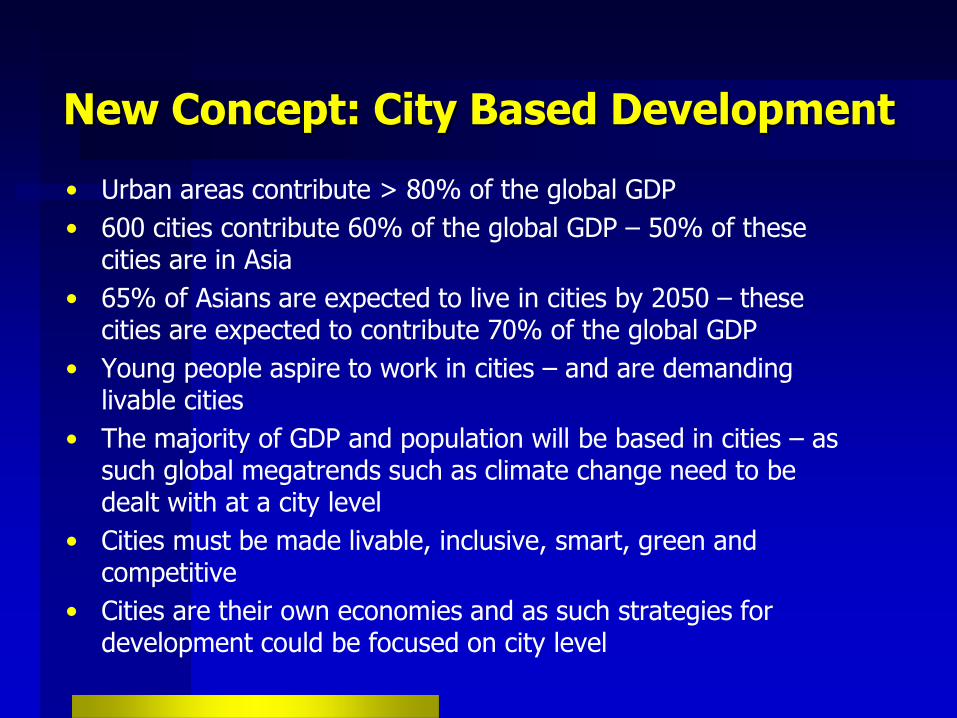
New Concept: City Based Development• Urban areas contribute > 80% of the global GDP• 600 cities contribute 60% of the global GDP – 50% of these
cities are in Asia• 65% of Asians are expected to live in cities by 2050 – these
cities are expected to contribute 70% of the global GDP• Young people aspire to work in cities – and are demanding
livable cities• The majority of GDP and population will be based in cities – as
such global megatrends such as climate change need to be dealt with at a city level
• Cities must be made livable, inclusive, smart, green and competitive
• Cities are their own economies and as such strategies for development could be focused on city level

BUILDING KNOWLEDGE-BASED ECONOMIES
30
LEAPFROGGING OPPORTUNITY: Where and How?
• Today's most technologically advanced economies are truly knowledge-based.
• Use of knowledge generation is key to wealth creation.
• Major OECD countries, where more than 50% of GDP are knowledge-related, exemplify this.
31
Knowledge-based Economies
Source: OECD. 1996. The Knowledge Economy.
What are some success stories in building knowledge-based
economies?
32

Success Stories: Korea• R&D as % of GDP: from 0.5% in 1965 to 2.5% in 1997 to 3.7%
in 2010.– Korea intends to increase this to 5.0% of GDP
• Super ministry combining science and technology and IT: Ministry of Science, ICT and Future Planning
• Government for R&D – Republic of Korea Advanced Institute of Science and Technology and
Korean Institute of Science and Technology – Government incentives for private sector – Fiscal and trade policies tax credits, accelerated depreciation, lowered
import tariffs)• Education: 35% of all Korean tertiary graduates earned degrees
in engineering, manufacturing or construction disciplines (1999)
33

Success Stories: Singapore• From labor-intensive growth to skill-intensive growth to
technology-intensive growth to knowledge and innovation economy-based growth
• R&D expenditure was 0.5% of GDP in the initial years and has steadily grown to 2.3% of GDP. – The country intends to increase it to 3.5% of GDP by 2015.
• Role of Government: Economic Development Board (EDB) and Agency for Science, Technology and Research (A*Star)
• Singapore emerged as a hub of services and further developed new high-growth services capabilities
34

Success Stories: Finland• 1950s: Finland was still an agriculture-based economy. • 1990s onward: country firmly established as an innovation-
based knowledge economy. • Broad-based and engaging approach to formulating the
education, research, and innovation policy agenda• 2010-2015: R&D to reach 4% of GDP by 2015• Support to the ICT sector used a multipronged approach linked
funding for R&D, – enhanced education and human capital development specifically for IT– support to state technology agencies and other institutions – central focus on ICT as a competitive sector for the economy
35
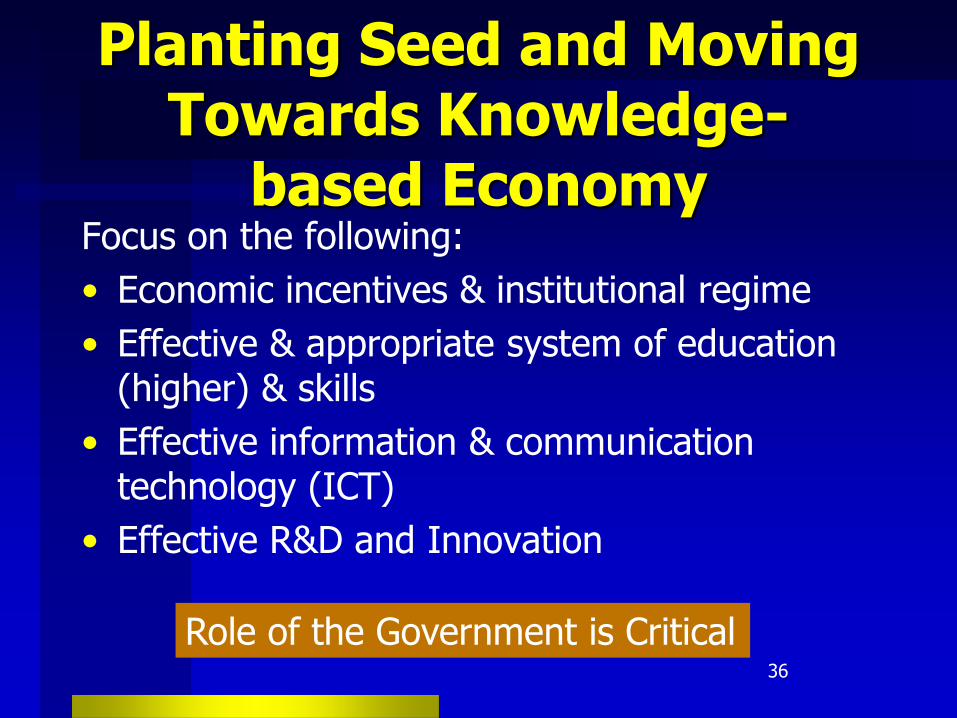
Planting Seed and Moving Towards Knowledge-
based EconomyFocus on the following:• Economic incentives & institutional regime• Effective & appropriate system of education
(higher) & skills• Effective information & communication
technology (ICT)• Effective R&D and Innovation
36Role of the Government is Critical

Investment in Knowledge is Critical
• Investment in R&D• Investment in higher education• Investment in IT• Investment in innovation• Use of new technology
37
Role of the Government is Critical

Thank You !!
38
Responding to Development Priorities of Nepal: Relevance of Regional Experiences to Nepal
Bindu N. Lohani
39
AIT Day Symposium
HOTEL HIMALAYA
10 February 2017, Lalitpur , Nepal

40
Asia, 52%
North America,
13%
Latin America & Caribbean,
10%
Europe, 18%
Sub Saharan
Africa, 2%
Middle East & North
Africa, 3%Rest of
World, 2%
Asian Century Scenario: 2050GDP at market exchange rate (Trillion)
World 333Asia 174United States 38
GDP per capita at constant PPPWorld 37,300Asia 40,800United States 94,900
Asian century driven by Asia 7: India, Indonesia, Japan, Malaysia, PRC, Republic of Korea, and Thailand
projected to account for 90% of Asia’s growth between 2010 and 2050.
The Asian Century: Where is Nepal?
Source: ADB

Regional and Global Mega Trends :
What they mean to Nepal?
41

Global Mega Trends
42
1. Demographics: An aging and stable population2. Urbanization: Toward a predominantly urbanized world3. International trade: Increasingly intertwined economies worldwide4. Globalization of finance: Towards larger, more integrated financial
markets and massive private capital flows5. Transformation of the global economy: Steady rise of the
emerging economies6. Rise of a massive middle class: Towards societies driven by the
values and aspirations of the middle class7. Natural resources: Competition for finite natural resources8. Technological progress & development: Potential solutions to the
world’s evolving challenges9. Climate change: Time to act is now and to do so jointly10.Communications revolution: Fueling and satisfying rising aspirations
Source: Emerging Market Forum, 2015

Asia 2050: Asia Faces 6 MEGA Challenges
Avoiding the Middle Income Trap
Addressing Inequities and Disparities
Massive Urbanization
Disparities across Countries and Subregions
Global Warming and Climate Change
Global Competition for Finite Resources
43
REGIONAL
Source: ADB

Global Mega Trends
44
1. Demographics: An aging and stable population2. Urbanization: Toward a predominantly urbanized world3. International trade: Increasingly intertwined economies worldwide4. Globalization of finance: Towards larger, more integrated financial
markets and massive private capital flows5. Transformation of the global economy: Steady rise of the
emerging economies6. Rise of a massive middle class: Towards societies driven by the
values and aspirations of the middle class7. Natural resources: Competition for finite natural resources8. Technological progress & development: Potential solutions to the
world’s evolving challenges9. Climate change: Time to act is now and to do so jointly10.Communications revolution: Fueling and satisfying rising aspirations
Source: Emerging Market Forum, 2015

Selected Mega Trends: Relevance to Nepal
45
• Urbanization: Making cities livable, clean, green and smart( most people will live in cities in future)
• Demographic and social change: Inequality , access to opportunities ( education, health etc) , social protection and addressing the needs of different age groups
• Global climate change and environment and natural resources management (pollution, ecosystem protection, etc)
• Communication Revolution ( Use of technologies and ICT to change the way of life)
• Focus on middle class (to be a middle income country and take steps now to avoid the trap)
• Economic transformation, convergence and regional cooperation and
1000
6000
11000
16000
21000
26000
31000
36000
41000
46000
5 10 15 20 25 30 35 40
GN
I pe
r ca
pita
($,
Atla
s M
etho
d)
Singapore
Korea
Malaysia
Thailand
Indonesia
Philippines
PRC
India
Sri Lanka
Years since middle income was reached
High Income
Middle Income $12,600 per capita
Source: World Development Indicators
Middle Income Countries:India ThailandIndonesia PhilippinesPRC Sri LankaMalaysia
OCR Graduation: $7,115
ADF Graduation: $1,205
Learning From Asian Economic Growth and the Middle Income Trap

47
-
10,000
20,000
30,000
40,000
50,000
60,000
70,000
1980
1981
1982
1983
1984
1985
1986
1987
1988
1989
1990
1991
1992
1993
1994
1995
1996
1997
1998
1999
2000
2001
2002
2003
2004
2005
2006
2007
2008
2009
2010
2011
Per Capita GDP ($ at PPP)
SingaporeKorea, Rep.Brunei DarussalamSri LankaPhilippines
Source: World Bank Website
Learning from Asia and the Middle Income Trap

Learning from the Stages of Development Followed by Asian Countries
48
Stage 1
Primary Agriculture
Stage 2
Simple manufacturing
(domestic)
Stage 3
Supply-chainmanufacturing,
SMEs, FDI
Stage 4
High-tech Industries
Stage 5
Creative and Innovative economies
(knowledge-based economy)
Technologyabsorption/technologyInternalized
Korea, Singapore
Middle Income Trap
Poor countries in Asia
Thailand, Vietnam
Cambodia
US, Japan, many OECD
countries
Nepal
STRUCTURAL TRANSFORMATION IS REQUIRED
Source: ADB
LEARNING from Asia’s Structural Transformation
• Agriculture is still the largest employer
– Over 700 million farm workers
• High manufacturing output shares but low manufacturing employment shares
• In many countries, transformation is from agriculture into (low-productivity) services.
• Diverse transformation, with varying:
– degrees of diversification, upgrading and deepening
– speeds
0
10
20
30
40
50
60
70 AGR
IND
SER
Nepal (2013):Agriculture 33%Industry 15%Services 52%

520
3550
6580
95
Man
ufac
turin
g ou
tput
(%
of G
DP
)
100025000
4900073000
97000
GDP per capita (constant 2000 US$)
Developing Asia Rest of the world
Manufacturing Output
515
2535
Man
ufac
turi
ng e
mpl
oym
ent (
% o
f tot
al)
100021000
4100061000
GDP per capita (constant 2000 US$)
Developing Asia Rest of the world
Manufacturing Employment
The Most Important Aspect of Structural Transformation is Industrialization
Source: ADB
A country is industralized if it achieves 18% (7-year moving average) for bothmanufacturing output and employment shares
The OECD Case
• The members of OECD industrialized long ago and have clearly deindustrialized during the last 3 decades or so.
• Their manufacturing output and employment shares peaked at about 25% during the 1970s —in some cases reaching 30% and above.
• The share then declined to about half of that.

OECD
Source: ADB
Asia
Source: ADB

Who Reached 18% (in Manufacturing)? Industrialization, De-industrialization
and Non-industrialization in Asia
55
….and de-industrialized
……and have not de-industrialized
did not industrialize
OUTPUT
Armenia, Azerbaijan, Hong Kong, China, Japan, Kyrgyzstan,
Mongolia, PRC, Taipei,China, Tajikistan,
Turkmenistan, Uzbekistan
Cambodia, Indonesia, Korea, Malaysia,
Pakistan, Philippines, Singapore, Sri Lanka,Thailand, Viet Nam
Afghanistan, Bangladesh, Georgia, India,
Kazakhstan, Lao PDR, Nepal, Papua New
Guinea
EMPLOYMENT
Azerbaijan, Hong Kong, China, Japan, Korea, Singapore,
Taipei,ChinaMalaysia, Sri Lanka
Armenia, Bangladesh, Cambodia, China, Georgia, India,
Indonesia, Kazakhstan, Kyrgyzstan, Mongolia,
Nepal, Pakistan, Papua New Guinea, Philippines, Tajikistan, Thailand, Viet
Nam Source: ADB
A Key Message is:
Challenge of reallocating labor to manufacturing and high productivity sectors – BECOMING A KNOWLEDGE-BASED ECONOMY WILL
HELP ACHIEVE THIS.

New Concept: City Based Development• Urban areas contribute > 80% of the global GDP• 600 cities contribute 60% of the global GDP – 50% of these
cities are in Asia• 65% of Asians are expected to live in cities by 2050 – these
cities are expected to contribute 70% of the global GDP• Young people aspire to work in cities – and are demanding
livable cities• The majority of GDP and population will be based in cities – as
such global megatrends such as climate change need to be dealt with at a city level
• Cities must be made livable, inclusive, smart, green and competitive
• Cities are their own economies and as such strategies for development could be focused on city level
BUILDING KNOWLEDGE-BASED ECONOMIES
58
LEAPFROGGING OPPORTUNITY: Where and How?

• Today's most technologically advanced economies are truly knowledge-based.
• Use of knowledge generation is key to wealth creation.
• Major OECD countries, where more than 50% of GDP are knowledge-related, exemplify this.
59
Knowledge-based Economies
Source: OECD. 1996. The Knowledge Economy.

What are some success stories in building knowledge-based
economies?
60
Success Stories: Korea• R&D as % of GDP: from 0.5% in 1965 to 2.5% in 1997 to 3.7%
in 2010.– Korea intends to increase this to 5.0% of GDP
• Super ministry combining science and technology and IT: Ministry of Science, ICT and Future Planning
• Government for R&D – Republic of Korea Advanced Institute of Science and Technology and
Korean Institute of Science and Technology – Government incentives for private sector – Fiscal and trade policies tax credits, accelerated depreciation, lowered
import tariffs)• Education: 35% of all Korean tertiary graduates earned degrees
in engineering, manufacturing or construction disciplines (1999)
61
Success Stories: Singapore• From labor-intensive growth to skill-intensive growth to
technology-intensive growth to knowledge and innovation economy-based growth
• R&D expenditure was 0.5% of GDP in the initial years and has steadily grown to 2.3% of GDP. – The country intends to increase it to 3.5% of GDP by 2015.
• Role of Government: Economic Development Board (EDB) and Agency for Science, Technology and Research (A*Star)
• Singapore emerged as a hub of services and further developed new high-growth services capabilities
62
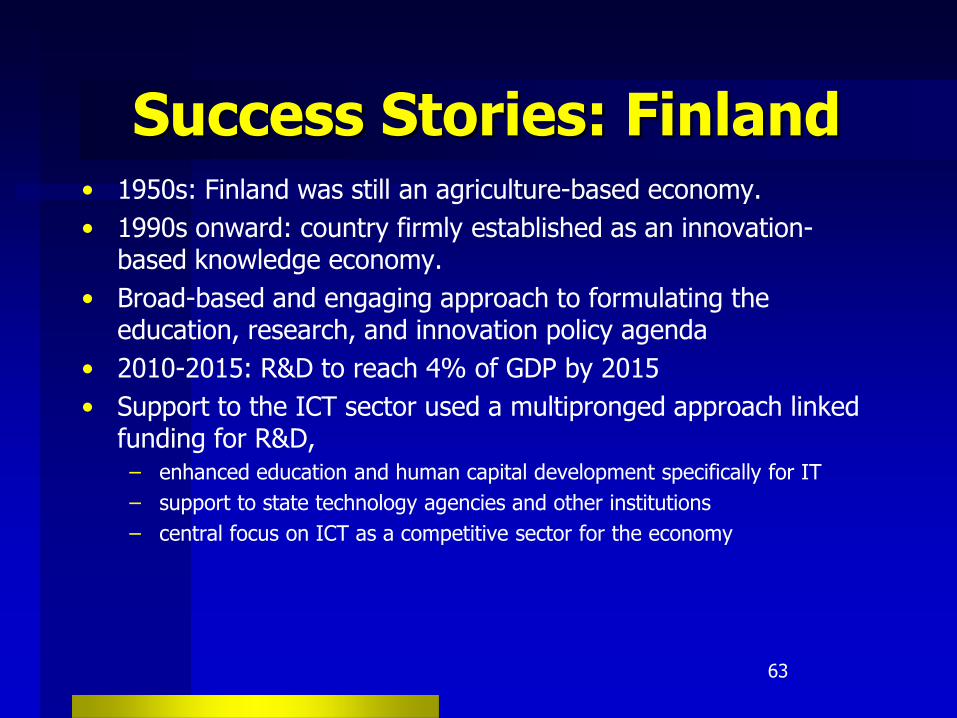
Success Stories: Finland• 1950s: Finland was still an agriculture-based economy. • 1990s onward: country firmly established as an innovation-
based knowledge economy. • Broad-based and engaging approach to formulating the
education, research, and innovation policy agenda• 2010-2015: R&D to reach 4% of GDP by 2015• Support to the ICT sector used a multipronged approach linked
funding for R&D, – enhanced education and human capital development specifically for IT– support to state technology agencies and other institutions – central focus on ICT as a competitive sector for the economy
63

Planting Seed and Moving Towards Knowledge-
based EconomyFocus on the following:• Economic incentives & institutional regime• Effective & appropriate system of education
(higher) & skills• Effective information & communication
technology (ICT)• Effective R&D and Innovation
64Role of the Government is Critical
Investment in Knowledge is Critical
• Investment in R&D• Investment in higher education• Investment in IT• Investment in innovation• Use of new technology
65
Role of the Government is Critical

Thank You !!
66