Embed Size (px)
Citation preview
Technical Analysis Functions
Forex can be analyzed by means of either fundamental analysis or technical analysis. Those who analyze securities using fundamental analysis rely on data such as the profits-to-earnings ratio, yield, and dividend whereas those who analyze securities using technical analysis look for technical patterns on Forex charts by using calculations referred to as “technical indicators”. Technical analysis is a form of market analysis that studies the demand and supply for securities based on volume and price studies. Technicians attempt to identify price trends in a market using one or more technical indicators.
There are many different types of technical indicators and most are built into the ForexTickChart.com programming language as primitive functions, as outlined in this chapter. ForexTickChart.com also allows you to program additional technical indicators by using a combination of primitive functions. Later in this Guide we provides examples and techniques for building custom indicators and trading systems.
This section provides a comprehensive list of the primitive technical analysis functions that are supported by the ForexTickChart.com programming language.
Please note that many technical indicator names are quite long, therefore function abbreviations have been conveniently provided wherever possible.
Long name: SimpleMovingAverage(CLOSE, 30)
Abbreviated name: SMA(CLOSE, 30)
SMA is the same function as SimpleMovingAverage and both methods work the same way. Each function provides an abbreviated name if available.
Moving Averages
Moving averages are the foundation of technical analysis. These functions calculate averages or variations of averages of the underlying vector. Many technical indicators rely upon the smoothing features of moving averages as part of their calculation.
For example, the Moving Average Convergence / Divergence (MACD) indicator in ForexTickChart.com allows you to specify the moving average type used within the indicator’s “Signal Line” calculation.
This section covers the Simple moving average, which is simply an average price over time, the exponential moving average, which is more complex and places extra
over time, the exponential moving average, which is more complex and places extra weight on prior values, plus several other types of moving averages like weighted averages, triangular averages, time series calculations, and so forth.
Each moving average in this section has an associated constant identifier that can be used as a function argument to specify the type of moving average to use by any given technical indicator that requires a moving average type. Simple Moving Average
SimpleMovingAverage(Vector, Periods) SMA(Vector, Periods)
MA Type Argument ID: SIMPLE
Overview The Simple Moving Average is simply an average of values over a specified period of time. Interpretation
A Moving Average is most often used to average values for a smoother representation of the underlying price or indicator.
ExampleCLOSE > SMA(CLOSE, 30) Evaluates to true when the close is greater than a 30-day SMA.
Exponential Moving Average
ExponentialMovingAverage(Vector, Periods) EMA(Vector, Periods)
MA Type Argument ID: EXPONENTIAL
Overview An Exponential Moving Average is similar to a Simple Moving Average. An EMA is calculated by applying a small percentage of the current value to the previous value, therefore an EMA applies more weight to recent values.
Interpretation A Moving Average is most often used to average values for a smoother representation of the underlying price or indicator.
ExampleCLOSE > EMA(CLOSE, 30) Evaluates to true when the close is greater than a 30-day EMA.
Time Series Moving Average
TimeSeriesMovingAverage(Vector, Periods) TSMA(Vector, Periods)
MA Type Argument ID: TIME_SERIES Overview A Time Series Moving Average is similar to a Simple Moving Average, except that values are derived from linear regression forecast values instead of regular values. Interpretation A Moving Average is most often used to average values for a smoother representation of the underlying price or indicator.
ExampleCLOSE > TSMA(CLOSE, 30) Evaluates to true when the close is greater than a 30-day TSMA. Variable Moving Average
VariableMovingAverage(Vector, Periods) VMA(Vector, Periods)
MA Type Argument ID: VARIABLE
Overview A Variable Moving Average is similar to an exponential moving average except that it adjusts to volatility.
Interpretation A Moving Average is most often used to average values for a smoother representation of the underlying price or indicator.
ExampleCLOSE > VMA(CLOSE, 30) Evaluates to true when the close is greater than a 30-day VMA.
Triangular Moving Average
TriangularMovingAverage(Vector, Periods) TMA(Vector, Periods)
MA Type Argument ID: TRIANGULAR
Overview The Triangular Moving Average is similar to a Simple Moving Average, except that more weight is given to the price in the middle of the moving average periods.
Interpretation A Moving Average is most often used to average values for a smoother representation
of the underlying price or indicator.
ExampleCLOSE > TMA(CLOSE, 30) Evaluates to true when the close is greater than a 30-day TMA.
Weighted Moving Average
WeightedMovingAverage(Vector, Periods) WMA(Vector, Periods)
MA Type Argument ID: WEIGHTED
Overview A Weighted Moving Average places more weight on recent values and less weight on older values.
Interpretation A Moving Average is most often used to average values for a smoother representation of the underlying price or indicator.
ExampleCLOSE > WMA(CLOSE, 30) Evaluates to true when the close is greater than a 30-day WMA. Welles Wilder Smoothing (Moving Average)
WellesWilderSmoothing(Vector, Periods) WWS(Vector, Periods)
MA Type Argument ID: WILDER
Overview The Welles Wilder's Smoothing indicator is similar to an exponential moving average. The indicator does not use the standard exponential moving average formula. Welles Wilder described 1/14 of today's value + 13/14 of yesterday's average as a 14-day exponential moving average.
Interpretation This indicator is used in the manner that any other moving average would be used.
ExampleCLOSE > WWS(CLOSE, 30) Evaluates to true when the close is greater than a 30-day WWS.
Volatility Index Dynamic Average -VIDYA (Moving Average)
VIDYA(Vector, Periods, R2Scale)
MA Type Argument ID: VIDYA
Overview VIDYA (Volatility Index Dynamic Average), developed by Mr. Tuschar Chande, is a moving average derived from linear regression R
2.
Interpretation A Moving Average is most often used to average values for a smoother representation of the underlying price or indicator. Because VIDYA is a derivative of linear regression, it quickly adapts to volatility.
Parameters R2Scale is a value specifying the R-Squared scale to use in the linear regression calculations. Mr. Chande recommends a value between 0.5 and 0.8 (default value is 0.65).
ExampleCLOSE > VIDYA(CLOSE, 30, 0.65) Evaluates to true when the close is greater than a 30-day VIDYA with an R
2 of
0.65. Linear Regression Functions
A classic statistical problem is to try to determine the relationship between two random variables X and Y such as the closing price of a Forex over time. Linear regression attempts to explain the relationship with a straight line fit to the data. The linear regression model postulates that Y = a + bX + e
Where the "residual" e is a random variable with mean zero. The coefficients a and b are determined by the condition that the sum of the square residuals is as small as possible. The indicators in this section are based upon this model.
R2 (R-Squared)
RSquared(Vector, Periods) R2(Vector, Periods)
Overview R-Squared is the coefficient of determination for the supplied vector over the specified periods. The values oscillate between 0 and 1.
ExampleR2(CLOSE, 30) < 0.1 Evaluates to true when the coefficient of determination is less than 0.1.
Slope
Slope(Vector, Periods)
Overview Returns the linear regression slope value for the data being analyzed over the specified number of periods. Values oscillate from negative to positive numbers.
ExampleSLOPE(CLOSE, 30) > 0.3 Evaluates to true when the slope is greater than 0.3.
Forecast
Forecast(Vector, Periods)
Overview Returns the linear regression forecast for the next period based on the linear regression calculation over the specified number of periods.
ExampleForecast(CLOSE, 30) > REF(CLOSE,1) Evaluates to true when the forecast is higher than the previous closing price. Intercept
Intercept(Vector, Periods)
Overview Returns the linear regression intercept for the last period’s Y value, based on the linear regression calculation over the specified number of periods.
ExampleIntercept(CLOSE, 30) > REF(CLOSE,1) Evaluates to true when the intercept is higher than the previous closing price.
Band Functions
Certain technical indicators are designed for overlaying on price charts to form an envelope or band around the underlying price. A change in trend is normally indicated if the underlying price breaks through one of the bands or retreats after briefly touching a band. The most popular band indicator is the Bollinger Bands, developed by Stock trader John Bollinger in the early 1980’s.
Bollinger Bands
BollingerBandsTop(Vector, Periods, Standard Deviations, MA Type)
BBT(Vector, Periods, Standard Deviations, MA Type)
BollingerBandsMiddle(Vector, Periods, Standard Deviations, MA Type) BBM(Vector, Periods, Standard Deviations, MA Type)
BollingerBandsBottom(Vector, Periods, Standard Deviations, MA Type) BBB(Vector, Periods, Standard Deviations, MA Type)
Overview Bollinger bands rely on standard deviations in order to adjust to changing market conditions. When a Currency becomes volatile the bands widen (move further away from the average). Conversely, when the market becomes less volatile the bands contract (move closer to the average). Tightening of the bands is often used as an early indication that the currency's volatility is about to increase.
Interpretation Bollinger Bands (as with most bands) can be imposed over an actual price or another indicator. When prices rise above the upper band or fall below the lower band, a change in direction may occur when the price penetrates the band after a small reversal from the opposite direction.
Recommended Parameters Vector: CLOSE Periods: 20 Standard Deviations: 2 MA Type: EXPONENTIAL
ExampleCLOSE > BBT(CLOSE, 20, 2, EXPONENTIAL) Evaluates to true when the close is greater than a 20-day Bollinger Band Top calculated by 2 standard deviations, using an exponential moving average. Keltner Channels
KeltnerChannelTop(Periods, MA Type, Multipler) KCT(Periods, MA Type, Multiplier)
KeltnerChannelMedian(Periods, MA Type, Multipler) KCM(Periods, MA Type, Multiplier)
KeltnerChannelBottom(Periods, MA Type, Multipler) KCB(Periods, MA Type, Multiplier)
Overview Keltner channels are calculated from the Average True Range and shifted up and down from the median based on the multiplier.
Interpretation
Like other bands, Keltner channels can be imposed over an actual price or another indicator. Keltner bought when prices closed above the upper band and sold when prices closed below the lower band. Keltner channels can also be interpreted the same way as Bollinger bands are interpreted.
Recommended Parameters Periods: 15 MA Type: EXPONENTIAL Shift: 1.3
ExampleCLOSE > KCT(15, EXPONENTIAL, 1.3) Evaluates to true when the close closes above the Keltner channel top.
Moving Average Envelope
MovingAverageEnvelopeTop(Periods, MA Type, Shift) MAET(Periods, MA Type, Shift)
MovingAverageEnvelopeBottom(Periods, MA Type, Shift) MAEB(Periods, MA Type, Shift)
Overview Moving Average Envelopes consist of moving averages calculated from the underling price, shifted up and down by a fixed percentage.
Interpretation Moving Average Envelopes (or trading bands) can be imposed over an actual price or another indicator. When prices rise above the upper band or fall below the lower band, a change in direction may occur when the price penetrates the band after a small reversal from the opposite direction.
Recommended Parameters Periods: 20 MA Type: SIMPLE Shift: 5
ExampleCLOSE > MAET(20, SIMPLE, 5) Evaluates to true when the close is greater than a 20-day Moving Average Envelope Top calculated by 5% using a simple moving average.
Prime Number Bands
PrimeNumberBandsTop() PNBT()
PrimeNumberBandsBottom() PNBB()
Overview This novel indicator identifies the nearest prime number for the high and low and plots the two series as bands.
ExampleCLOSE > PNBT() Evaluates to true when the close is greater than the Prime Number Bands Top.
Oscillator Functions
This section covers technical indicators that oscillate from one value to another.
Most oscillators measure the velocity of directional price or volume movement. These indicators often go into overbought and oversold zones, at which time a reaction or reversal is possible. The slope of the oscillator is usually proportional to the velocity of the price move. Likewise, the distance the oscillator moves up or down is usually proportional to the magnitude of the move.
A large percentage of technical indicators oscillate, so this section covers quite a few functions.
Momentum Oscillator
MomentumOscillator(Vector, Periods) MO(Vector, Periods)
Overview The momentum oscillator calculates the change of price over a specified length of time as a ratio.
Interpretation Increasingly high values of the momentum oscillator may indicate that prices are trending strongly upwards. The momentum oscillator is closely related to MACD and Price Rate of Change (ROC).
Recommended Parameters Vector: CLOSE Periods: 14
ExampleMO(CLOSE, 14) > 90
Evaluates to true when the momentum oscillator of the close is over 90 Chande Momentum Oscillator
ChandeMomentumOscillator(Vector, Periods) CMO(Vector, Periods)
Overview The Chande Momentum Oscillator (CMO), developed by Tushar Chande, is an advanced momentum oscillator derived from linear regression. This indicator was published in his book titled “New Concepts in Technical Trading” in the mid 90’s.
Interpretation The CMO enters into overbought territory at +50, and oversold territory at -50. You can also create buy/sell triggers based on a moving average of the CMO. Also, increasingly high values of CMO may indicate that prices are trending strongly upwards. Conversely, increasingly low values of CMO may indicate that prices are trending strongly downwards.
Recommended Parameters Vector: CLOSE Periods: 14
ExampleCMO(CLOSE, 14) > 48 Evaluates to true when the CMO of the close is overbought.
Volume Oscillator
VolumeOscillator(Short Term Periods, Long Term Periods, MA Type, Points or Percent) VO(Short Term Periods, Long Term Periods, MA Type, Points or Percent)
Overview The Volume Oscillator shows a spread of two different moving averages of volume over a specified period of time.
Interpretation Offers a clear view of whether or not volume is increasing or decreasing.
Recommended Parameters Short Term Periods: 9 Long Term Periods: 21 MA Type: SIMPLE Points or Percent: PERCENT
Example
VO(9, 21, SIMPLE, PERCENT) > 0 Price Oscillator
PriceOscillator(Vector, Short Term Periods, Long Term Periods, MA Type) PO(Vector, Short Term Periods, Long Term Periods, MA Type)
Overview Similar to the Volume Oscillator, the Price Oscillator is calculated based on a spread of two moving averages.
Interpretation The Price Oscillator is basically a moving average spread. Buying usually occurs when the oscillator rises, and selling usually occurs when the oscillator falls.
Recommended Parameters Vector: CLOSE Short Term Periods: 9 Long Term Periods: 14 MA Type: SIMPLE
ExamplePO(CLOSE, 9, 14, SIMPLE) > 0 Evaluates to true when the Price Oscillator is in positive territory.
Detrended Price Oscillator
DetrendedPriceOscillator(Vector, Periods, MA Type) DPO(Vector, Periods, MA Type)
Overview Similar to the Price Oscillator except DPO is used when long-term trends or outliers make the underlying price difficult to analyze.
Interpretation Buying occurs when the oscillator rises. Selling occurs when the oscillator falls.
Recommended Parameters Vector: CLOSE Periods: 20 MA Type: SIMPLE
ExampleDPO(CLOSE, 20, SIMPLE) > 0 Evaluates to true when the Detrended Price Oscillator is in positive territory. Prime Number Oscillator
PrimeNumberOscillator(Vector) PNO(Vector)
Overview Finds the nearest prime number from either the top or bottom of the series, and plots the difference between that prime number and the series itself.
Interpretation This indicator can be used to spot market turning points. When the oscillator remains at the same high point for two consecutive periods in the positive range, consider selling. Conversely, when the oscillator remains at a low point for two consecutive periods in the negative range, consider buying.
Recommended Parameters Vector: CLOSE
ExamplePNO(CLOSE) = REF(PNO(CLOSE), 1) AND REF(PNO(CLOSE), 2) != PNO(CLOSE)
Fractal Chaos Oscillator
FractalChaosOscillator(Periods) FCO(Periods)
Overview The chaotic nature of Forex market movements explains why it is sometimes difficult to distinguish daily charts from monthly charts if the time scale is not given. The patterns are similar regardless of the time resolution. Like the chambers of the nautilus, each level is like the one before it, but the size is different. To determine what is happening in the current level of resolution, the fractal chaos oscillator can be used to examine these patterns.
Interpretation A buy signal is generated when the oscillator tops, and a sell signal is generated when the oscillator bottoms.
Recommended Parameters Periods: 21
ExampleFCO(21) > REF(FCO(21),1) Rainbow Oscillator
RainbowOscillator(Vector, Levels, MA Type)
RBO(Vector, Levels, MA Type)
Overview The rainbow oscillator is calculated based upon multiple time frames of a moving average.
Interpretation The trend may reverse suddenly when values stay above 0.80 or below 0.20 for two consecutive days.
Recommended Parameters Vector: CLOSE Levels: 3 MA Type: SIMPLE
ExampleSET R = RBO(CLOSE, 3, SIMPLE) R > 0.8 AND REF(R, 1) > 0.8 Evaluates to true when the Rainbow Oscillator has been above 0.8 for at least two consecutive days.
TRIX
TRIX(Vector, Periods)
Overview TRIX is a momentum oscillator that shows the rate of change of an exponentially averaged closing price.
Interpretation The most common usage of the TRIX oscillator is to buy when the oscillator rises and sell when the oscillator falls.
Recommended Parameters Vector: CLOSE Periods: 9
ExampleTRIX(CLOSE, 9) > 0.9 Evaluates to true when TRIX is in overbought territory.
Vertical Horizontal Filter
VerticalHorizontalFilter(Vector, Periods) VHF(Vector, Periods)
Overview The Vertical Horizontal Filter (VHF) identifies whether a market is in a trending or a
choppy movement phase.
Interpretation The VHF indicator is most commonly used as an indicator of market volatility. It is also frequently used as a component to other technical indicators. Recommended Parameters Vector: CLOSE Periods: 21 ExampleVHF(CLOSE, 21) < 0.2 Ease Of Movement
EaseOfMovement(Vector, Periods) EOM(Vector, Periods)
Overview The Ease of Movement oscillator displays a unique relationship between price change and volume.
Interpretation The Ease of Movement oscillator rises when prices are trending upwards under low volume, and likewise, the Ease of Movement oscillator falls when prices are trending downwards under low volume.
Recommended Parameters Vector: CLOSE Periods: 21
ExampleEOM(CLOSE, 21) > 0 Evaluates to true when the Ease of Movement is in positive territory.
Wilder’s Directional Movement System
ADX(Periods), ADXR(Periods), DIP(Periods), DIN(Periods), TRSUM(Periods), DX(Periods)
Overview The Welles Wilder's Directional Movement System contains five indicators; ADX, DI+, DI-, DX, and ADXR.
The ADX (Average Directional Movement Index) is an indicator of how much the market is trending, either up or down: the higher the ADX line, the more the market is trending and the more suitable it becomes for a trend-following system. This indicator consists of two lines: DI+ and DI-, the first one being a measure of uptrend and the second one a measure of downtrend.
Detailed information about this indicator and formulas can be found in Welles Wilder's book, "New Concepts in Technical Trading Systems". The standard Directional
Movement System draws a 14 period DI+ and a 14 period DI-in the same chart panel. ADX is also sometimes shown in the same chart panel.
Interpretation A buy signal is given when DI+ crosses over DI-, a sell signal is given when DI-crosses over DI+.
Recommended Parameters Periods: 21
ExampleDIP(14) > 60 True Range
TrueRange() TR()
Overview The True Range is a component of Wilder’s Directional Movement System.
ExampleTR() > 1.95
Williams %R
WilliamsPctR(Periods) WPR(Periods)
Overview Developed by trader Larry Williams, the Williams’ %R indicator measures overbought/oversold levels. This indicator is similar to the Stochastic Oscillator. The outputs range from 0 to -100.
Interpretation The market is considered overbought when the %R is in a range of 0 to -20, and oversold when %R is in a range of -80 to -100.
Recommended Parameters Periods: 14
ExampleWPR(14) < -80 Evaluates to true when Williams’ %R is oversold.
Williams’ Accumulation / Distribution
WilliamsAccumulationDistribution() WAD()
Overview Another indicator developed by trader Larry Williams, the Accumulation / Distribution indicator shows a relationship of price and volume.
Interpretation When the indicator is rising, the security is said to be accumulating. Conversely, when the indicator is falling, the security is said to being distributing. Prices may reverse when the indicator converges with price.
ExampleWAD() < 1 Evaluates to true when Williams’ Accumulation / Distribution is below 1. Chaikin Volatility
ChaikinVolatility(Periods, Rate of Change, MA Type) CV(Periods, Rate of Change, MA Type)
Overview The Chaikin Volatility Oscillator is a moving average derivative of the Accumulation / Distribution index. This indicator quantifies volatility as a widening of the range between the high and the low price.
Interpretation The Chaikin Volatility Oscillator adjusts with respect to volatility, independent of long-term price action. The most popular interpretation is to sell when the indicator tops out, and to buy when the indicator bottoms out.
Recommended Parameters Periods: 10 Rate of Change: 10 MA Type: SIMPLE
ExampleCV(10, 10, SIMPLE) < -25
Aroon
AroonUp(Periods) AroonDown(Periods)
Overview The Aroon indicator was developed by Tushar Chande in the mid 1990’s. This indicator is often used to determine whether a currency is trending or not and how stable the
trend is.
Interpretation Trends are determined by extreme values (above 80) of both lines (Aroon up and Aroon down), whereas unstable prices are determined when both lines are low (less than 20).
Recommended Parameters Periods: 25
ExampleAroonUp(25) > 80 AND AroonDown(25) > 80
Moving Average Convergence / Divergence (MACD)
MACD(Short Cycle, Long Cycle, Signal Periods, MA Type) MACDSignal(Short Cycle, Long Cycle, Signal Periods, MA Type)
Overview The MACD is a moving average oscillator that shows potential overbought/oversold phases of market fluctuation. The MACD is a calculation of two moving averages of the underlying price/indicator.
Interpretation Buy and sell interpretations may be derived from crossovers (calculated by the MACDSignal function), overbought / oversold levels of the MACD and divergences between MACD and underlying price.
Recommended Parameters Long Cycle: 26 Short Cycle: 13 Signal Periods: 9 MA Type: SIMPLE
ExampleSET A = MACDSignal(13, 26, 9, SIMPLE) SET B = MACD(13, 26, 9, SIMPLE) CROSSOVER(A, B) = TRUE Evaluates to true when the MACD Signal line recently crossed over the MACD.
High Minus Low
HighMinusLow() HML()
Overview This function returns the high price minus the low price for each bar.
Interpretation This indicator is often used as a component for other technical indicators but can be used with a moving average to show the change in price action over time.
ExampleSET A = SMA(HML(), 14) A > REF(A, 10) Evaluates to true when the height of each bar has been increasing over the past several bars.
Stochastic Oscillator
SOPK(%K Periods, %K Slowing Periods, %D Periods, MA Type) SOPD(%K Periods, %K Slowing Periods, %D Periods, MA Type)
Overview The Stochastic Oscillator is a popular indicator that shows where a security’s price has closed in proportion to its closing price range over a specified period of time.
Interpretation The Stochastic Oscillator has two components: %K (the SOPK function) and %D (the SOPD function). %K is most often displayed on a Forex chart as a solid line and %D is often shown as a dotted line. The most widely used method for interpreting the Stochastic Oscillator is to buy when either component rises above 80 or sell when either component falls below 20. Another way to interpret the Stochastic Oscillator is to buy when %K rises above %D, and conversely, sell when %K falls below %D.
Recommended Parameters % K Periods: 9 % K Slowing Periods: 3 % D Periods: 9 MA Type: SIMPLE
ExampleSOPK(9, 3, 9, SIMPLE) > 80 OR SOPD(9, 3, 9, SIMPLE) > 80 Evaluates to true when the Stochastic Oscillator is in oversold territory.
Index Functions
This section covers technical indicators that are known as indexes, such as the famous Relative Strength Index, Historical Volatility Index, and many others.
Relative Strength Index
RelativeStrengthIndex(Vector, Periods) RSI(Vector, Periods)
Overview The RSI is popular indicator developed by trader Welles Wilder. The RSI is a popular indicator that shows comparative price strength within a single security.
Interpretation The most widely used method for interpreting the RSI is price / RSI divergence, support / resistance levels and RSI chart formations.
Recommended Parameters Vector: CLOSE Periods: 14
ExampleRSI(CLOSE, 14) > 55 Mass Index
MassIndex(Periods) MI(Periods)
Overview The Mass Index identifies price changes by indexing the narrowing and widening change between high and low prices.
Interpretation According to the inventor of the Mass Index, reversals may occur when a 25period Mass Index rises above 27 or falls below 26.5.
Recommended Parameters Periods: 25
ExampleMI(25) > 27
Historical Volatility Index
HistoricalVolatilityIndex(Vector, Periods, Bar History, Standard Deviations) HVI(Vector, Periods, Bar History, Standard Deviations)
Overview Historical volatility is the log-normal standard deviation. The Historical Volatility Index is based on the book by Don Fishback, "Odds: The Key to 90% Winners".
The formula for a 30-day historical volatility index between 1 and 0 is: Stdev(Log(Close / Close Yesterday), 30) * Sqrt(365)
Some traders use 252 instead of 365 for the bar history that is used by the square root function. The Log value is a natural log (i.e. Log10).
Interpretation High values of HVI indicate that the currency is volatile, while low values of HVI indicate that the currency is either flat or trending steadily.
Recommended Parameters Vector: CLOSE Periods: 15 Bar History: 30 Standard Deviations: 2
ExampleHVI(CLOSE, 15, 30, 2) < 0.01 Money Flow Index
MoneyFlowIndex(Periods) MFI(Periods)
Overview The Money Flow Index measures money flow of a security, using volume and price for calculations.
Interpretation Market bottoms may be identified by values below 20 and tops may be identified by values above 80. Divergence of price and Money Flow Index may be watched.
Recommended Parameters Periods: 15
ExampleMFI(15) < 20
Chaikin Money Flow Index
ChaikinMoneyFlow (Periods) CMF (Periods)
Overview The Chaikin Money Flow oscillator is a momentum indicator that spots buying and selling by calculating price and volume together. This indicator is based upon Accumulation / Distribution, which is in turn based upon the premise that if a currency closes above its midpoint, (high + low) / 2, for the day then there was accumulation that day, and if it closes below its midpoint, then there was distribution that day.

Interpretation A buy signal is generated when the indicator is rising and is in positive territory. A sell signal is generated when the indicator is falling and is in negative territory.
Recommended Parameters Periods: 15
ExampleCMF(15) > 20 AND REF(CMF(15), 1) > 20 Evaluates to true when the Chaikin Money Flow Index is bullish.
Comparative Relative Strength Index
ComparativeRelativeStrength(Vector1, Vector2) CRSI (Vector1, Vector2)
Overview The Comparative Relative Strength index compares one vector with another.
Interpretation The base vector is outperforming the other vector when the Comparative RSI is trending upwards.
Recommended Parameters Vector1: CLOSE Vector2: [Any]
ExampleCRSI(CLOSE, VOLUME) > 1 Evaluates to true when the trend in price has outpaced the trend in volume.
Price Volume Trend
PriceVolumeTrend(Vector) PVT(Vector)
Overview Also known as Volume Price Trend. This indicator consists of a cumulative volume that adds or subtracts a multiple of the percentage change in price trend and current volume, depending upon their upward or downward movements. PVT is used to determine the balance between a currency's demand and supply. This indicator shares similarities with the On Balance Volume index.
Interpretation The Price and Volume Trend index generally precedes actual price movements. The
premise is that well-informed investors are buying when the index rises and uninformed investors are buying when the index falls.
Recommended Parameters Vector: CLOSE
ExampleTREND(PVT(CLOSE)) = UP Evaluates to true when PVT is trending upwards.
Positive Volume Index
PositiveVolumeIndex(Vector) PVI(Vector)
Overview The Positive Volume Index puts focus on periods when volume increases from the previous period.
Interpretation The interpretation of the Positive Volume Index is that the majority of investors are buying when the index rises, and selling when the index falls.
Recommended Parameters Vector: CLOSE
ExampleTREND(PVI(CLOSE)) = UP Evaluates to true when PVI is trending upwards.
Negative Volume Index
NegativeVolumeIndex(Vector) NVI(Vector)
Overview The Negative Volume Index is similar to the Positive Volume Index, except it puts focus on periods when volume decreases from the previous period.
Interpretation The interpretation of the Negative Volume Index is that well-informed investors are buying when the index falls and uninformed investors are buying when the index rises.
Recommended Parameters Vector: CLOSE
ExampleTREND(NVI(CLOSE)) = UP Evaluates to true when NVI is trending upwards.
On Balance Volume
OnBalanceVolume(Vector) OBV(Vector)
Overview The On Balance Volume index shows a relationship of price and volume in the form of a momentum index.
Interpretation On Balance Volume generally precedes actual price movements. The premise is that well-informed investors are buying when the index rises and uninformed investors are buying when the index falls.
Recommended Parameters Vector: CLOSE
ExampleTREND(OBV(CLOSE)) = UP Evaluates to true when OBV is trending upwards.
Performance Index
PerformanceIndex(Vector) PFI(Vector)
Overview The Performance indicator calculates price performance as a normalized value or percentage.
Interpretation A Performance indicator shows the price of a security as a normalized value. If the Performance indicator shows 50, then the price of the underlying security has increased 50% since the start of the Performance indicator calculations. Conversely, if the indictor shows -50, then the price of the underlying security has decreased 50% since the start of the Performance indicator calculations.
Recommended Parameters Vector: CLOSE
ExamplePFI(CLOSE) > 45 Evaluates to true when the performance index is over 45%
Trade Volume Index
TradeVolumeIndex(Vector, Minimum Tick Value) TVI(Vector, Minimum Tick Value)
Overview The Trade Volume index shows whether a security is being accumulated or distributed (similar to the Accumulation/Distribution index).
Interpretation When the indicator is rising, the security is said to be accumulating. Conversely, when the indicator is falling, the security is said to being distributing. Prices may reverse when the indicator converges with price.
Recommended Parameters Vector: CLOSE Minimum Tick Value: 0.25
ExampleTVI(CLOSE, 0.25) > 0 Evaluates to true when the Trade Volume Index is in positive territory.
Swing Index
SwingIndex(Limit Move Value) SI(Limit Move Value)
Overview The Swing Index (Wilder) is a popular indicator that shows comparative price strength within a single security by comparing the current open, high, low, and close prices with previous prices.
Interpretation The Swing Index is a component of the Accumulation Swing Index.
Recommended Parameters Limit Move Value: 1

ExampleSI(1) > 0 Evaluates to true when the Swing Index is in positive territory.
Accumulative Swing Index
AccumulativeSwingIndex(Limit Move Value) ASI(Limit Move Value)
Overview The Accumulation Swing Index (Wilder) is a cumulative total of the Swing Index, which shows comparative price strength within a single security by comparing the current open, high, low, and close prices with previous prices.
Interpretation The Accumulation Swing Index may be analyzed using technical indicators, line studies, and chart patterns, as an alternative view of price action.
Recommended Parameters Limit Move Value: 1
ExampleTREND(ASI(1)) > UP Evaluates to true when the Accumulative Swing Index is trending upwards.
Commodity Channel Index (CCI)
CommodityChannelIndex(Periods, MA Type) CCI(Periods, MA Type)
Overview Donald Lambert developed the CCI indicator. Although the purpose of this indicator is to identify cyclical turns in commodities, it is often used for securities.
Interpretation This indicator oscillates between an overbought and oversold condition and works best in a sideways market.
Recommended Parameters Periods: 21 MA Type: SIMPLE
ExampleCCI(12, SIMPLE) > 0 AND REF(CCI(12, SIMPLE), 1) < 0
Evaluates to true when the CCI has just moved into positive territory.
Parabolic Stop and Reversal (Parabolic SAR)
ParabolicSAR(Min AF, Max AF) PSAR(Min AF, Max AF)
Overview Author Welles Wilder developed the Parabolic SAR. This indicator is always in the market (whenever a position is closed, an opposing position is taken). The Parabolic SAR indicator is most often used to set trailing price stops.
Interpretation A stop and reversal (SAR) occurs when the price penetrates a Parabolic SAR level.
Recommended Parameters Min AF (Accumulation Factor): 0.02 Max AF (Accumulation Factor): 0.2
ExampleCROSSOVER(CLOSE, PSAR(0.02, 0.2)) = TRUE Evaluates to true when the close recently crossed over the Parabolic SAR.
Stochastic Momentum Index
SMIK(%K Periods, %K Smooth, %K Double Periods, %D Periods, MA Type, %D MA Type) SMID(%K Periods, %K Smooth, %K Double Periods, %D Periods, MA Type, %D MA Type)
Overview The Stochastic Momentum Index, developed by William Blau, first appeared in the January 1993 issue of Stocks & Commodities magazine. This indicator plots the closeness of price relative to the midpoint of the recent high / low range.
Interpretation The Stochastic Momentum Index has two components: %K (SMIK) and %D (SMID). %K is most often displayed on a chart as a solid line and %D is often shown as a dotted line. The most widely used method for interpreting the Stochastic Momentum Index is to buy when either component rises above 40 or sell when either component falls below 40. Another way to interpret the Stochastic Momentum Index is to buy when %K rises above %D, or sell when %K falls below %D.
Recommended Parameters %K Periods: 14 %K Smoothing: 2
%K Double Periods: 3 %D Periods: 9 MA Type: SIMPLE %D MA Type: SIMPLE
ExampleSMID(14, 2, 3, 9, SIMPLE, SIMPLE) > 40 OR SMIK(14, 2, 3, 9, SIMPLE, SIMPLE) > 40 Evaluates to true when the Stochastic Momentum Index is in oversold territory.
General Indicator Functions
Median Price MEDIANPRICE() MP()
Overview A Median Price is simply an average of one period’s high and low values.
Interpretation A Median Price is often used as an alternative way of viewing price action and also as a component for calculating other technical indicators.
ExampleCROSSOVER(CLOSE, SMA(MP(), 14)) Evaluates to true when the close crossed over the 14-day SMA of the Median Price.
Typical Price TypicalPrice() TP()
Overview A Typical Price is an average of one period’s high, low, and close values.
Interpretation A Typical Price is used as a component for the calculation of several technical indicators.
ExampleCROSSOVER(CLOSE, SMA(TP(), 14)) Evaluates to true when the close crossed over the 14-day SMA of the Typical Price.
Weighted Close
WeightedClose() WC()
Overview Weighted Close is an average of each day’s open, high, low, and close, where more weight is placed on the close.
Interpretation The Weighted Close indicator is a simple method that offers a simplistic view of market prices.
ExampleWC() > REF(WC(), 1) Evaluates to true when the weighted close is higher than the previous value. Price Rate of Change
PriceRateOfChange(Vector, Periods) PROC(Vector, Periods)
Overview The Price ROC shows the difference between the current price and the price one or more periods in the past.
Interpretation A 12-day Price ROC is most often used as an overbought/oversold indicator.
Recommended Parameters Vector: CLOSE Periods: 12
ExamplePROC(CLOSE, 12) > 0 AND REF(PROC(CLOSE, 12),1) < 0 Evaluates to true when the Price ROC recently shifted into positive territory.
Volume Rate of Change
VolumeRateOfChange(Vector, Periods) VROC(Vector, Periods)
Overview The Volume Rate of Change indicator shows whether or not volume is trending in one direction or another.
Interpretation Sharp Volume ROC increases may signal price breakouts.
Recommended Parameters Vector: VOLUME Periods: 12
ExampleVROC(VOLUME, 12) > 0 AND REF(VROC(VOLUME, 12), 1) < 0 Evaluates to true when the Volume ROC recently moved into positive territory.
Highest High Value
HighestHighValue(Periods) HHV(Periods)
Overview Returns the highest value of the high price over the specified number of periods.
Interpretation Used as a component for calculation by many other technical indicators.
Recommended Parameters Periods: 21
ExampleHIGH = HHV(21) Evaluates to true when the high is the highest high in the past 21 bars.
Lowest Low Value
LowestLowValue(Periods) LLV(Periods)
Overview Returns the lowest value of the low price over the specified number of periods.
Interpretation Used as a component for calculation by many other technical indicators.
Recommended Parameters Periods: 21
ExampleLOW = LLV(21) Evaluates to true when the low is the lowest low in the past 21 bars.
Standard Deviations
StandardDeviations(Vector, Periods, Standard Deviations, MA Type) SDV(Vector, Periods, Standard Deviations, MA Type)
Overview Standard Deviation is a common statistical calculation that measures volatility. Many technical indicators rely on standard deviations as part of their calculation.
Interpretation Major highs and lows often accompany extreme volatility. High values of standard deviations indicate that the price or indicator is more volatile than usual.
Recommended Parameters Vector: CLOSE Periods: 21 Standard Deviations: 2 MA Type: SIMPLE
ExampleSDV(CLOSE, 21, 2, SIMPLE) > REF(SDV(CLOSE, 21, 2, SIMPLE), 10) Evaluates to true when 21 period Standard Deviations are greater than 10 days ago.
Japanese Candlestick Patterns
Just about every trader is familiar with Japanese Candlestick charting, which was popularized by Steve Nison, author of the book "Japanese Candlestick Charting Techniques". Many traders have been using a form of Japanese candlestick charting for decades, even before it was named "candlestick charting".
What are Candlesticks? The main feature of a candlestick is that the area between the open and close price is filled in, with emphasis on the direction. Typically you will see bars represented as dark candles on days where the price closed lower than the open, or white candles on days where the price closed higher than the open. The actual high and low prices are called "wicks". Candlesticks don't involve calculations, rather they simply offer a different perspective for viewing price action. The interpretation of candlesticks is based primarily on patterns that are formed from period to period. For example, you may have heard of terms like "Three Black Crows", "Morning Star", or "Dark Cloud Cover". These are all candlestick patterns, which are formed by two or more candlesticks.

A Graphical Representation A Japanese Candlestick pattern is a group of price bars as shown in figure 1. Traditionally you will see dark candles on days where the price closed lower than the open, or white candles on days where the price closed higher than the open. Sometimes in instructional material you will see gray bars, which means that the bar may be either white or black.
Identifying Candlestick Patterns Although you could very well write your own scripts to search for candlestick patterns, ForexTickChart.com provides a simple, built-in function that can identify up to two-dozen predefined patterns:
CandlestickPattern() CSP()
Overview The CandlestickPattern() function identifies candlestick patterns automatically. The function takes no arguments and outputs a constant representing one of the two-dozen candlestick patterns as outlined below.
ExampleCSP() = MORNING_STAR Evaluates to true when the candlestick pattern is a Morning Star.
Patterns The Candlestick function returns the following constants. Also see later in this Guide for visual representations of these patterns: LONG_BODY DOJI HAMMER HARAMI STAR DOJI_STAR MORNING_STAR EVENING_STAR PIERCING_LINE ENGULFING_LINE HANGING_MAN DARK_CLOUD_COVER BEARISH_ENGULFING_LINE BEARISH_DOJI_STAR BEARISH_SHOOTING_STAR SPINNING_TOPS HARAMI_CROSS BULLISH_TRISTAR THREE_WHITE_SOLDIERS THREE_BLACK_CROWS ABANDONED_BABY BULLISH_UPSIDE_GAP BULLISH_HAMMER BULLISH_KICKING BEARISH_KICKING BEARISH_BELT_HOLD BULLISH_BELT_HOLD BEARISH_TWO_CROWS BULLISH_MATCHING_LOW
Trading System Examples & Techniques
Trading Systems A trading system is basically a set of rules that determine entry and exit points for any given currency pair. Traders often refer to these points as trade signals.
A trading system is objective and mechanical. The purpose is to provide a strategy to produce profits greater than losses by controlling your trades for you.
This section provides hands-on learning by teaching the trader how to translate trading system rules into script form using real trading systems as examples.
Trading systems usually include one or more technical indicators in their implementation. For example, a Moving Average Crossover system would buy when a short-term moving average crosses above a long-term moving average and sell when a short-term moving average crosses below a long-term moving average.
Trading systems may have any number of rules, such as “don’t buy unless volume is trending upwards”, or “exit if Parabolic SAR crosses the close”, etc.
The actual profitability of a trading system depends on how well the trading system’s rules perform on a trade-by-trade basis. Traders spend much of their time optimizing their trading systems in order to increase profits and reduce risks. In the case of a basic Moving Average Crossover system, this is accomplished by modifying the parameters of the moving averages themselves.
A trader may optimize a trading system by means of back testing. The back testing feature of ForexTickChart.com allows you to back test your trading systems and modify parameters to achieve the maximum amount of profit and minimum amount of risk. Refer to your trading software documentation for details.
Moving Average Crossover System
The Moving Average Crossover System is perhaps the simplest of all trading systems. This system uses two moving averages to generate signals. A buy signal is generated when a short-term moving average crosses over a longer-term moving average, and sells when a short-term moving average crosses below a long-term moving average.
The number of signals generated by this trading system is proportional to the length and type of moving averages used. Short-term moving averages generate more signals and enter into trades sooner than longer-term moving averages.

Unfortunately, a very short-term moving average crossover system will also generate more false signals than a longer-term system, while a very long-term system will generate fewer false signals, but will also miss a larger proportion of profits. This difficult balance applies to nearly every trading system and is the core subject of numerous books on technical analysis.
One solution to this problem is to use a secondary technical indicator to confirm entry and/or exit signals. A popular technical indicator used primarily for exit signals is the Parabolic SAR. The following script uses a 20/60 EMA for entries and a Parabolic SAR for exits.
Moving Average Crossover System Script Buy Signals # 20-period EMA crosses over the 60-period EMA CROSSOVER(EMA(CLOSE, 20), EMA(CLOSE, 60))
Sell Signals # 20-period EMA crosses under the 60-period EMA CROSSOVER(EMA(CLOSE, 60), EMA(CLOSE, 20))
Exit Long # The close crosses above the Parabolic SAR CROSSOVER(CLOSE, PSAR(CLOSE, 0.02, 0.2))
Exit Short # The close crosses below the Parabolic SAR CROSSOVER(PSAR(CLOSE, 0.02, 0.2), CLOSE)
Price Gap System
An upward price gap occurs when a currency opens substantially higher than the previous day’s high price. This often occurs after an unexpected announcement, much better than expected earnings report, and so forth.
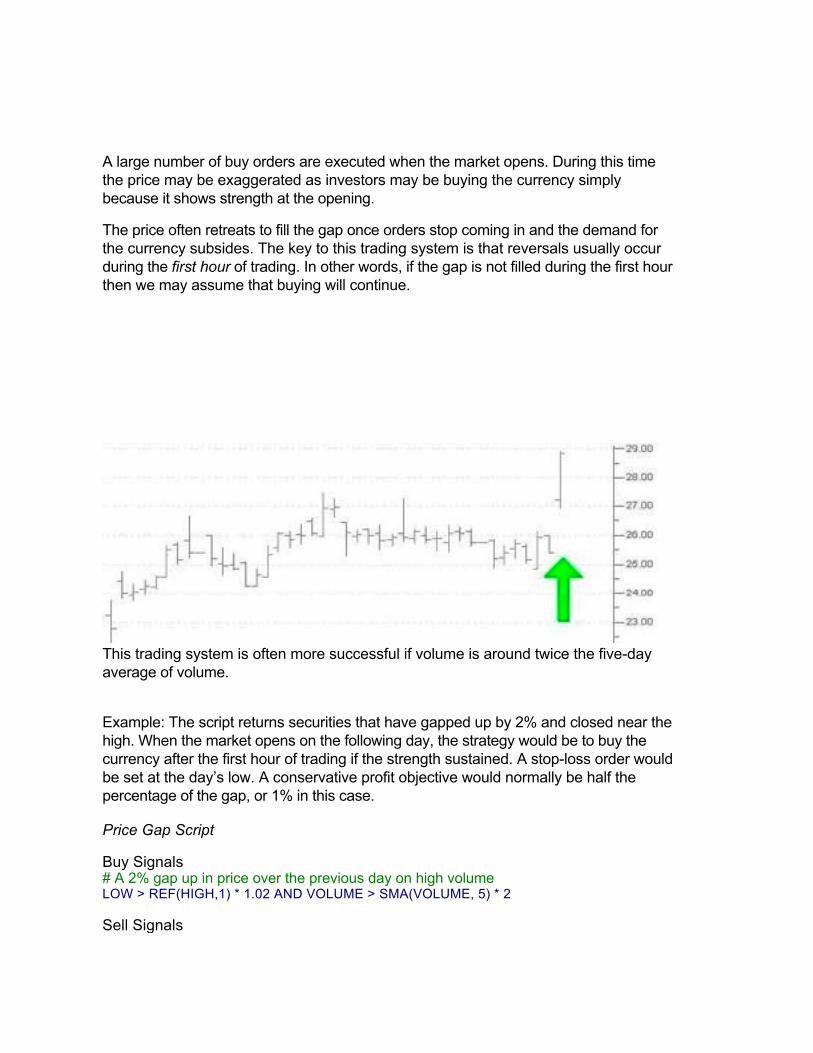
A large number of buy orders are executed when the market opens. During this time the price may be exaggerated as investors may be buying the currency simply because it shows strength at the opening.
The price often retreats to fill the gap once orders stop coming in and the demand for the currency subsides. The key to this trading system is that reversals usually occur during the first hour of trading. In other words, if the gap is not filled during the first hour then we may assume that buying will continue.
This trading system is often more successful if volume is around twice the five-day average of volume.
Example: The script returns securities that have gapped up by 2% and closed near the high. When the market opens on the following day, the strategy would be to buy the currency after the first hour of trading if the strength sustained. A stop-loss order would be set at the day’s low. A conservative profit objective would normally be half the percentage of the gap, or 1% in this case.
Price Gap Script
Buy Signals # A 2% gap up in price over the previous day on high volume LOW > REF(HIGH,1) * 1.02 AND VOLUME > SMA(VOLUME, 5) * 2
Sell Signals
# A 2% gap down in price over the previous day on high volume HIGH < REF(LOW,1) * 0.98 AND VOLUME > SMA(VOLUME, 5) * 2
Exit Long Use a profit objective roughly ½ the size of the gap with a stop-loss.
Exit Short Use a profit objective roughly ½ the size of the gap with a stop-loss.
Bollinger Bands System
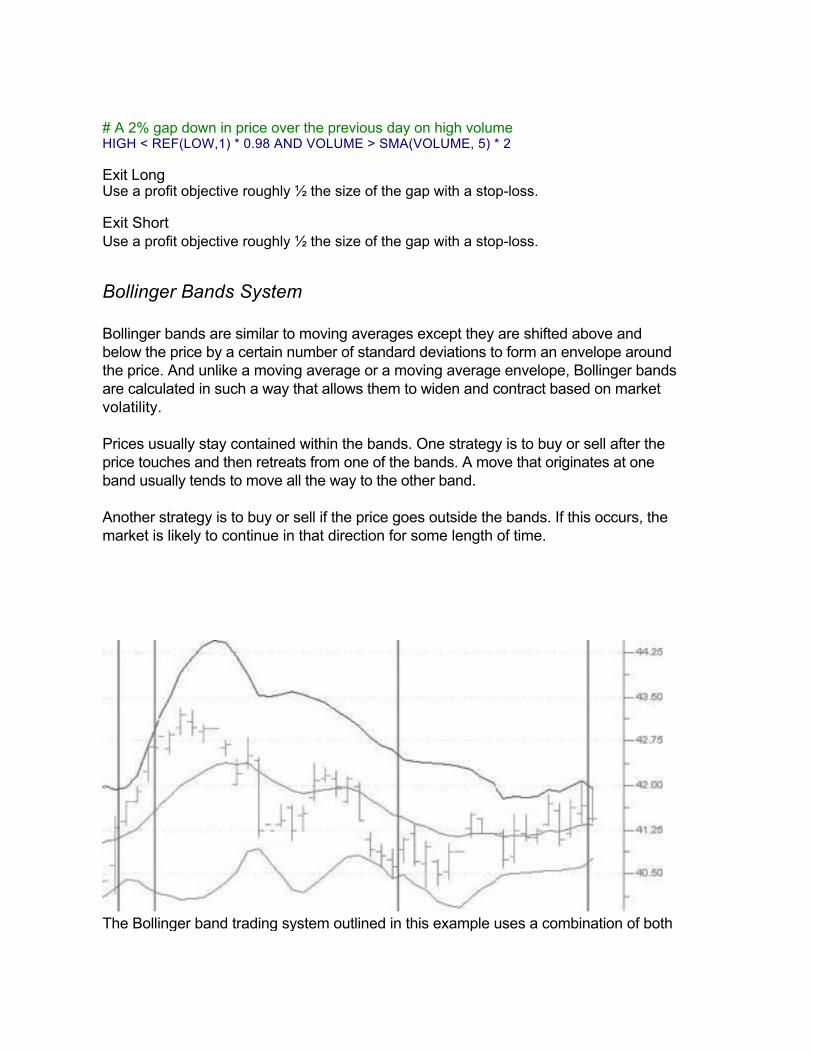
Bollinger bands are similar to moving averages except they are shifted above and below the price by a certain number of standard deviations to form an envelope around the price. And unlike a moving average or a moving average envelope, Bollinger bands are calculated in such a way that allows them to widen and contract based on market volatility.
Prices usually stay contained within the bands. One strategy is to buy or sell after the price touches and then retreats from one of the bands. A move that originates at one band usually tends to move all the way to the other band.
Another strategy is to buy or sell if the price goes outside the bands. If this occurs, the market is likely to continue in that direction for some length of time.
The Bollinger band trading system outlined in this example uses a combination of both
trading strategies. The system buys if a recent bar touched the bottom band and the current bar is within the bands, and also buys if the current high has exceeded the top band by a certain percentage. The system sells based on the opposite form of this strategy.
Bollinger Bands Script
Buy Signals # Buy if a previous value was below the low band and is now above SET Bottom = BBB(CLOSE, 20, 2, EXPONENTIAL) SET Top = BBT(CLOSE, 20, 2, EXPONENTIAL) ((REF(CLOSE, 1) < REF(Bottom, 1)) AND CLOSE > Bottom) OR # Also buy if the close is above the top band plus 2% CLOSE > Top * 1.02
Sell Signals # Sell if a previous value was above the high band and is now below SET Bottom = BBB(CLOSE, 20, 2, EXPONENTIAL) SET Top = BBT(CLOSE, 20, 2, EXPONENTIAL) ((REF(CLOSE, 1) > REF(Top, 1)) AND CLOSE < Top) OR # Also sell if the close is below the bottom band minus 2% CLOSE < Bottom * 0.98
Historical Volatility and Trend
This trading system buys or sells on increasing volume and lessening volatility. The concept is that trends are more stable if volatility has been decreasing and volume has been increasing over many days.
Volume is an important component to this trading system since almost every important turning point in a currency is accompanied by an increase in volume.
The key element in this trading system is the length of the primary price trend. The longer the price trend is, the more reliable the signal.
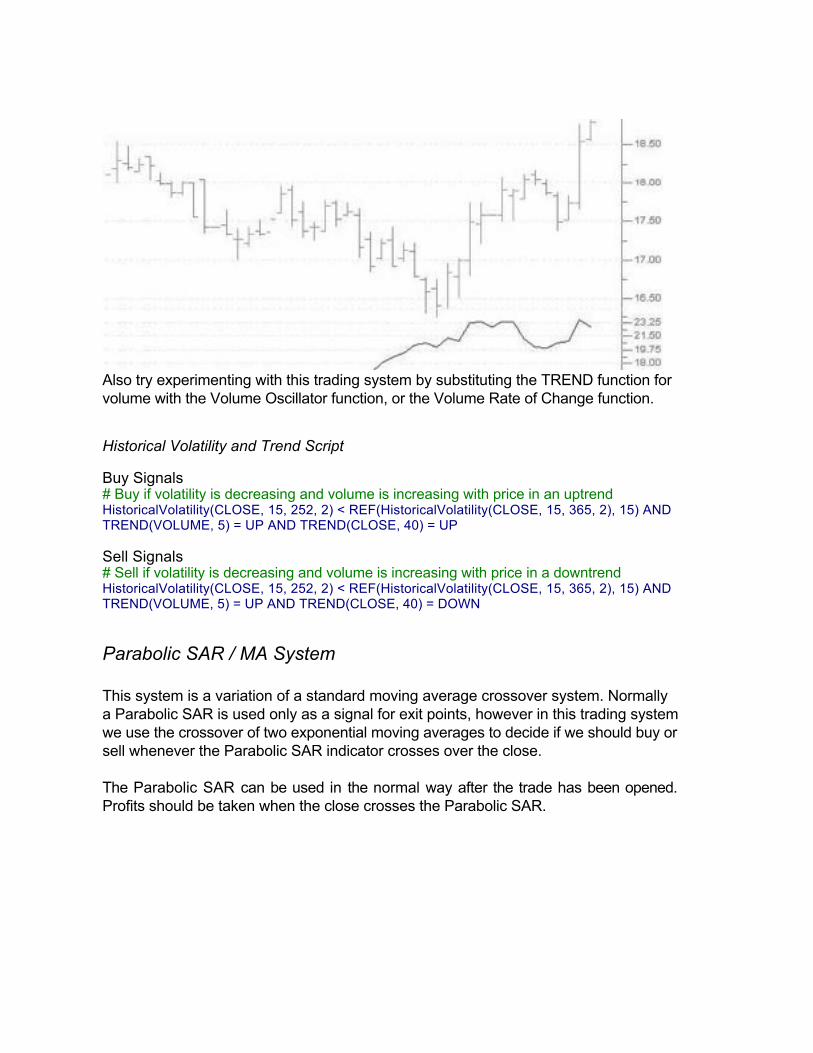
Also try experimenting with this trading system by substituting the TREND function for volume with the Volume Oscillator function, or the Volume Rate of Change function.
Historical Volatility and Trend Script
Buy Signals # Buy if volatility is decreasing and volume is increasing with price in an uptrend HistoricalVolatility(CLOSE, 15, 252, 2) < REF(HistoricalVolatility(CLOSE, 15, 365, 2), 15) AND TREND(VOLUME, 5) = UP AND TREND(CLOSE, 40) = UP
Sell Signals # Sell if volatility is decreasing and volume is increasing with price in a downtrend HistoricalVolatility(CLOSE, 15, 252, 2) < REF(HistoricalVolatility(CLOSE, 15, 365, 2), 15) AND TREND(VOLUME, 5) = UP AND TREND(CLOSE, 40) = DOWN
Parabolic SAR / MA System
This system is a variation of a standard moving average crossover system. Normally a Parabolic SAR is used only as a signal for exit points, however in this trading system we use the crossover of two exponential moving averages to decide if we should buy or sell whenever the Parabolic SAR indicator crosses over the close.
The Parabolic SAR can be used in the normal way after the trade has been opened. Profits should be taken when the close crosses the Parabolic SAR.
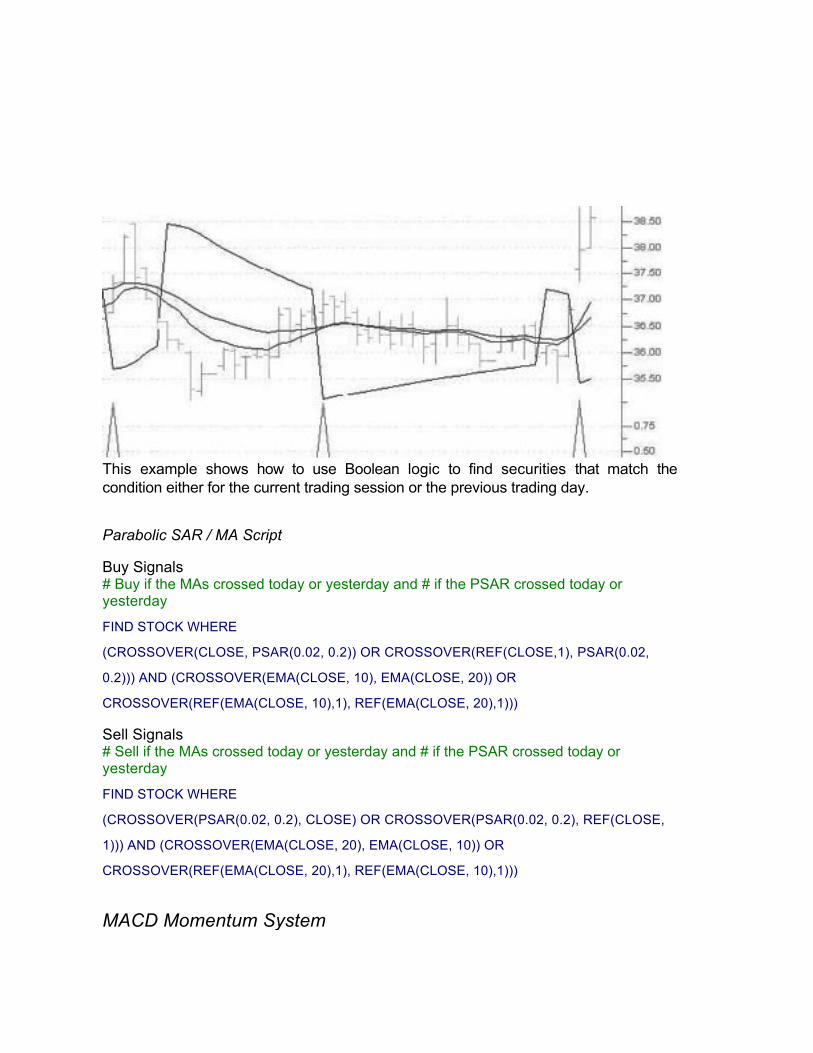
This example shows how to use Boolean logic to find securities that match the condition either for the current trading session or the previous trading day.
Parabolic SAR / MA Script
Buy Signals # Buy if the MAs crossed today or yesterday and # if the PSAR crossed today or yesterday
FIND STOCK WHERE
(CROSSOVER(CLOSE, PSAR(0.02, 0.2)) OR CROSSOVER(REF(CLOSE,1), PSAR(0.02,
0.2))) AND (CROSSOVER(EMA(CLOSE, 10), EMA(CLOSE, 20)) OR
CROSSOVER(REF(EMA(CLOSE, 10),1), REF(EMA(CLOSE, 20),1)))
Sell Signals # Sell if the MAs crossed today or yesterday and # if the PSAR crossed today or yesterday
FIND STOCK WHERE
(CROSSOVER(PSAR(0.02, 0.2), CLOSE) OR CROSSOVER(PSAR(0.02, 0.2), REF(CLOSE,
1))) AND (CROSSOVER(EMA(CLOSE, 20), EMA(CLOSE, 10)) OR
CROSSOVER(REF(EMA(CLOSE, 20),1), REF(EMA(CLOSE, 10),1)))
MACD Momentum System
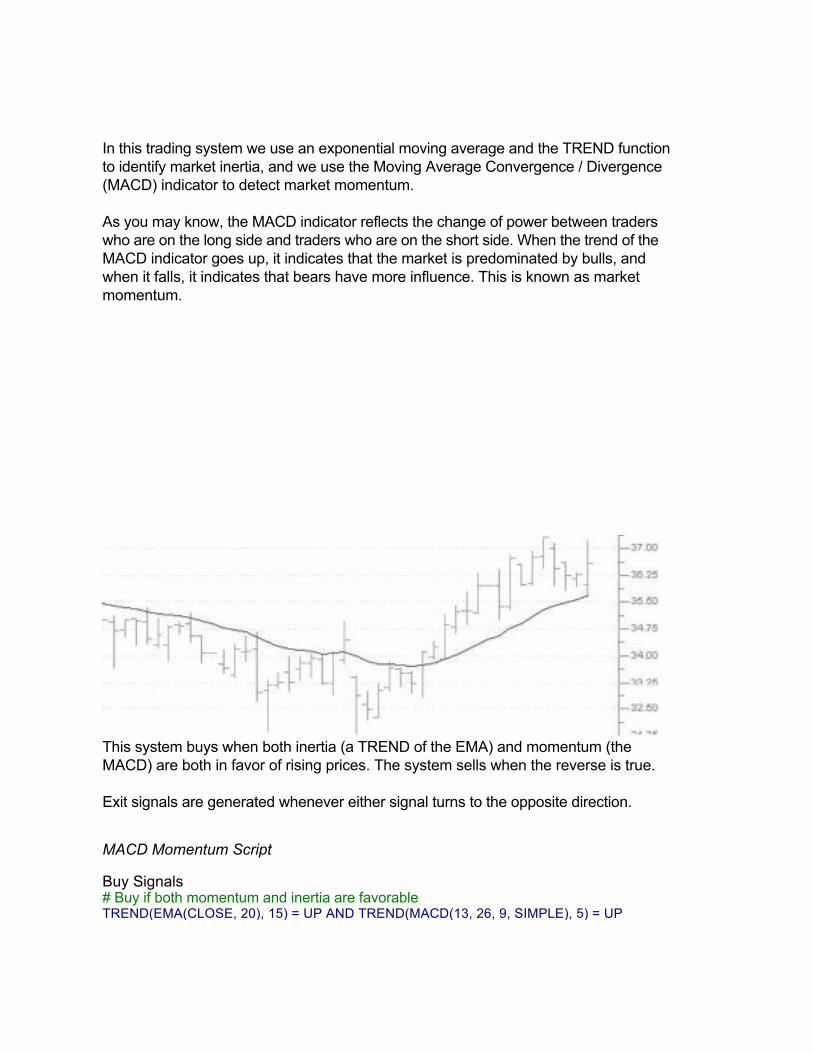
In this trading system we use an exponential moving average and the TREND function to identify market inertia, and we use the Moving Average Convergence / Divergence (MACD) indicator to detect market momentum.
As you may know, the MACD indicator reflects the change of power between traders who are on the long side and traders who are on the short side. When the trend of the MACD indicator goes up, it indicates that the market is predominated by bulls, and when it falls, it indicates that bears have more influence. This is known as market momentum.
This system buys when both inertia (a TREND of the EMA) and momentum (the MACD) are both in favor of rising prices. The system sells when the reverse is true.
Exit signals are generated whenever either signal turns to the opposite direction.
MACD Momentum Script
Buy Signals # Buy if both momentum and inertia are favorable TREND(EMA(CLOSE, 20), 15) = UP AND TREND(MACD(13, 26, 9, SIMPLE), 5) = UP
Sell Signals # Sell if both momentum and inertia are favorable TREND(EMA(CLOSE, 20), 15) = DOWN AND TREND(MACD(13, 26, 9, SIMPLE), 5) = DOWN
Exit Long Signal # Exit if either momentum or inertia become unfavorable TREND(EMA(CLOSE, 20), 15) = DOWN OR TREND(MACD(13, 26, 9, SIMPLE), 5) = DOWN
Exit Short Signal # Exit if either momentum or inertia become unfavorable TREND(EMA(CLOSE, 20), 15) = UP OR TREND(MACD(13, 26, 9, SIMPLE), 5) = UP
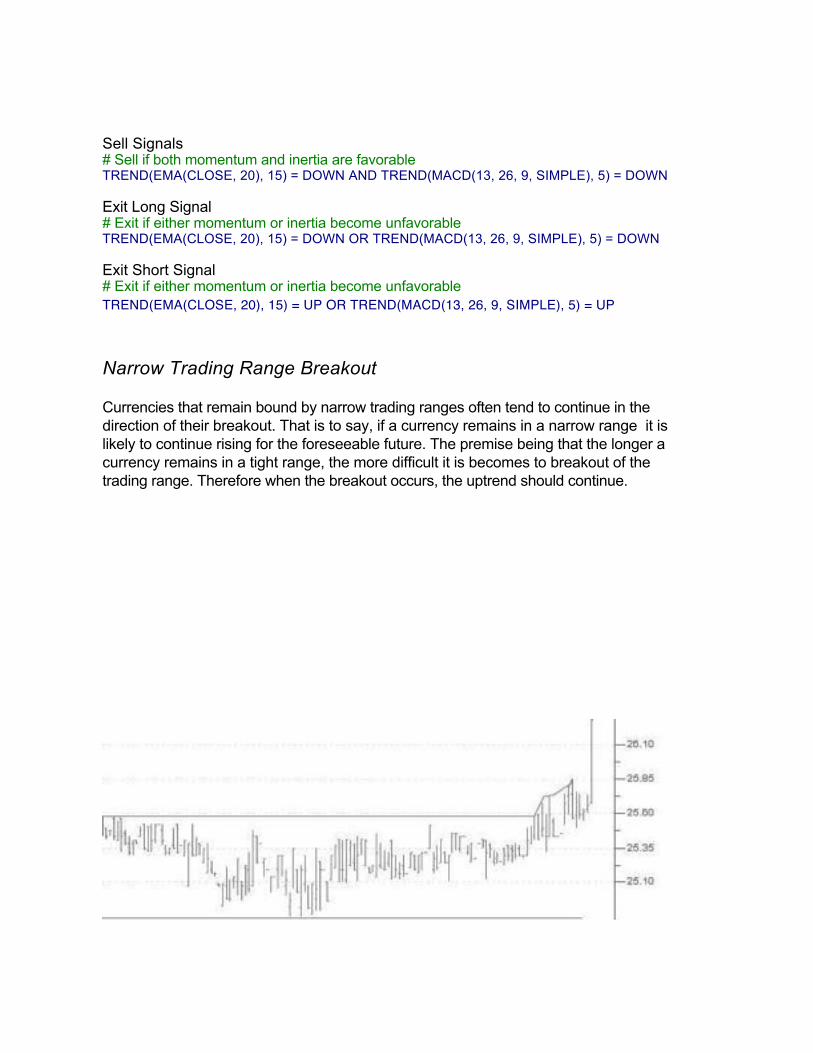
Narrow Trading Range Breakout
Currencies that remain bound by narrow trading ranges often tend to continue in the direction of their breakout. That is to say, if a currency remains in a narrow range it is likely to continue rising for the foreseeable future. The premise being that the longer a currency remains in a tight range, the more difficult it is becomes to breakout of the trading range. Therefore when the breakout occurs, the uptrend should continue.
Narrow Trading Range Script
# Define a 2% trading range over 50 days FIND STOCK WHERE MAX(CLOSE, 50) < CLOSE * 1.01 AND MIN(CLOSE, 50) > CLOSE * 0.98 AND
# Filter out inactive securities CLOSE != REF(CLOSE, 1) AND REF(CLOSE,1) != REF(CLOSE, 2) AND REF(CLOSE,2) != REF(CLOSE, 3)
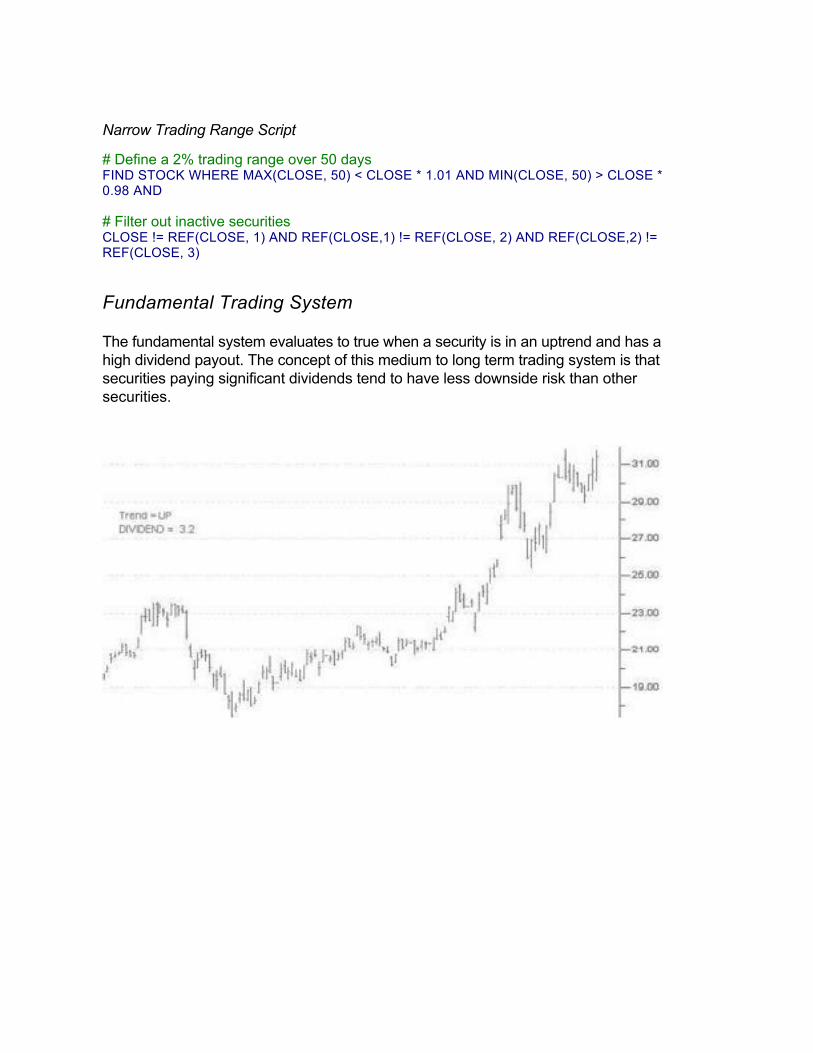
Fundamental Trading System
The fundamental system evaluates to true when a security is in an uptrend and has a high dividend payout. The concept of this medium to long term trading system is that securities paying significant dividends tend to have less downside risk than other securities.
Fundamental Trading System Script
Buy Signals # Buy in an uptrend with a high dividend DIVIDEND > 3 AND TREND(CLOSE, 50) = UP
Sell Signals NA
Exit Signals Exit if and when dividend decreases or TREND changes to DOWN.
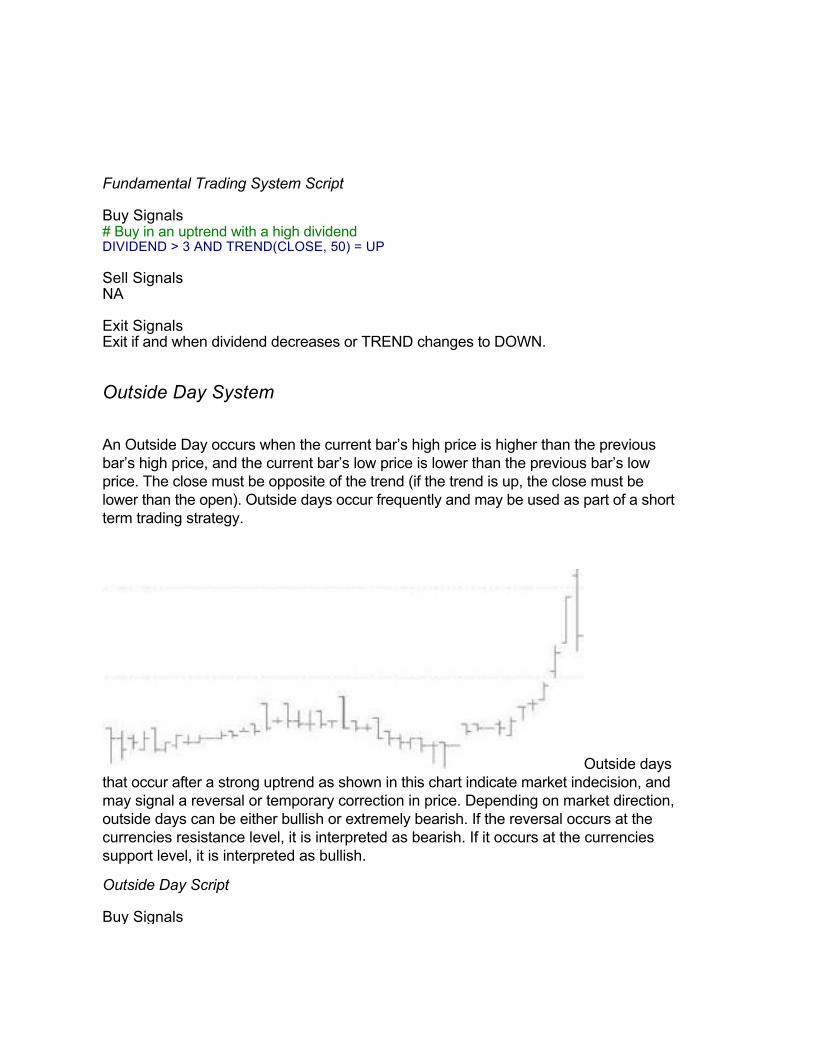
Outside Day System
An Outside Day occurs when the current bar’s high price is higher than the previous bar’s high price, and the current bar’s low price is lower than the previous bar’s low price. The close must be opposite of the trend (if the trend is up, the close must be lower than the open). Outside days occur frequently and may be used as part of a short term trading strategy.
Outside days that occur after a strong uptrend as shown in this chart indicate market indecision, and may signal a reversal or temporary correction in price. Depending on market direction, outside days can be either bullish or extremely bearish. If the reversal occurs at the currencies resistance level, it is interpreted as bearish. If it occurs at the currencies support level, it is interpreted as bullish.
Outside Day Script
Buy Signals
# Find outside days LOW < REF(LOW, 1) AND HIGH > REF(HIGH, 1) AND HIGH > REF(HIGH, 1) AND CLOSE < OPEN AND # Outside days are more significant if the # previous bar is shorter in height HIGH -LOW > (REF(HIGH, 1) -REF(LOW, 1)) * 1.5 AND # The trend should be up TREND(CLOSE, 30) = UP
Sell Signals # Find outside days LOW < REF(LOW, 1) AND HIGH > REF(HIGH, 1) AND HIGH > REF(HIGH, 1) AND CLOSE < OPEN AND HIGH -LOW > (REF(HIGH, 1) -REF(LOW, 1)) * 1.5 AND # The trend should be down for a sell signal TREND(CLOSE, 30) = DOWN
Japanese Candlestick Engulfing Line System
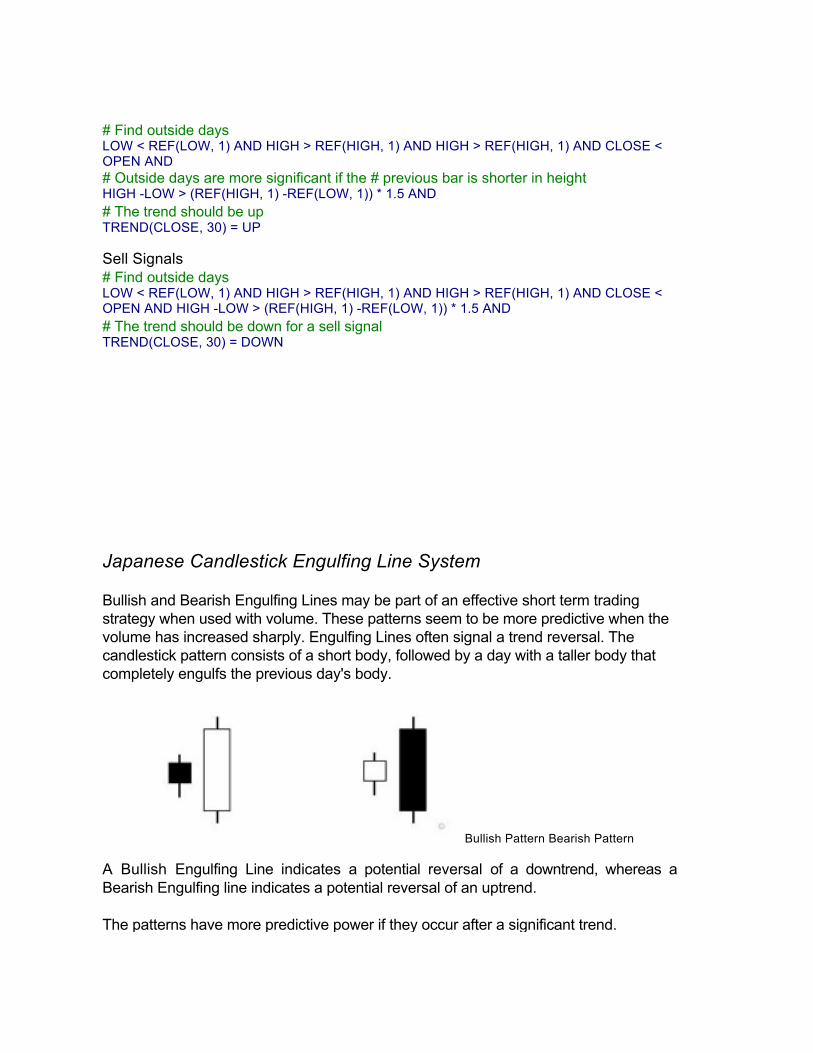
Bullish and Bearish Engulfing Lines may be part of an effective short term trading strategy when used with volume. These patterns seem to be more predictive when the volume has increased sharply. Engulfing Lines often signal a trend reversal. The candlestick pattern consists of a short body, followed by a day with a taller body that completely engulfs the previous day's body.
Bullish Pattern Bearish Pattern
A Bullish Engulfing Line indicates a potential reversal of a downtrend, whereas a Bearish Engulfing line indicates a potential reversal of an uptrend.
The patterns have more predictive power if they occur after a significant trend.

Signals # Bullish Pattern CANDLESTICKPATTERN() = BULLISH_ENGULFING_LINE AND TREND(CLOSE, 30) = DOWN AND VOLUME > REF(VOLUME, 1)
# Bearish Pattern
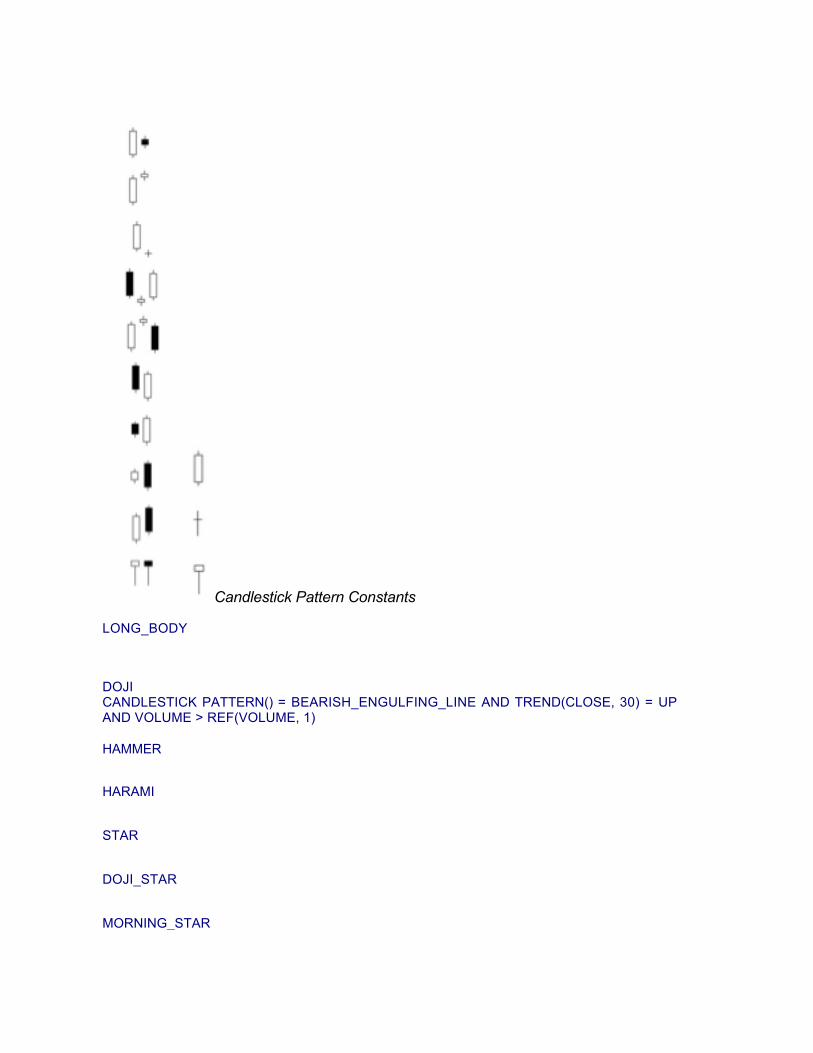
Candlestick Pattern Constants
LONG_BODY
DOJI CANDLESTICK PATTERN() = BEARISH_ENGULFING_LINE AND TREND(CLOSE, 30) = UP AND VOLUME > REF(VOLUME, 1)
HAMMER
HARAMI
STAR
DOJI_STAR
MORNING_STAR
EVENING_STAR
PIERCING_LINE
BULLISH_ENGULFING_LINE
BEARISH_ENGULFING_LINE
DARK_CLOUD_COVER
HANGING_MAN
BEARISH_DOJI_STAR
BEARISH_SHOOTING_STAR
SPINNING_TOPS
HARAMI_CROSS
BULLISH_TRISTAR
THREE_WHITE_SOLDIERS
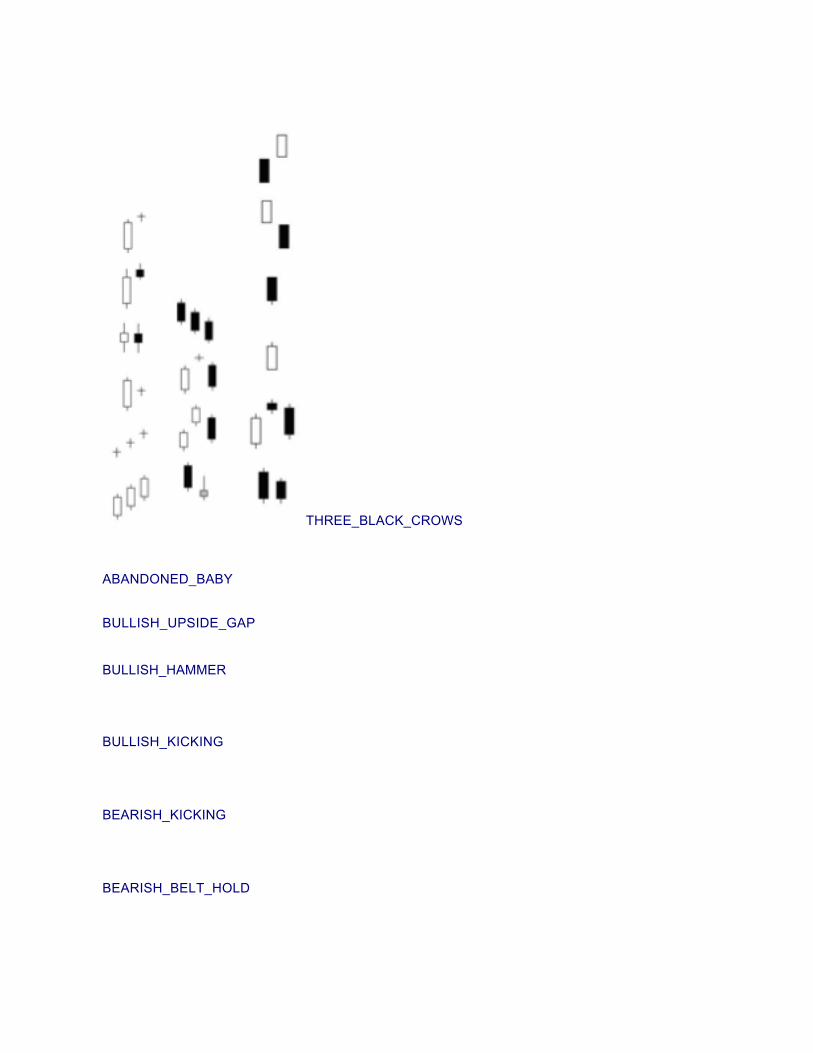
THREE_BLACK_CROWS
ABANDONED_BABY
BULLISH_UPSIDE_GAP
BULLISH_HAMMER
BULLISH_KICKING
BEARISH_KICKING
BEARISH_BELT_HOLD

BULLISH_BELT_HOLD
BEARISH_TWO_CROWS
BULLISH_MATCHING_LOW