Embed Size (px)
Citation preview
Research Division Federal Reserve Bank of St. Louis Working Paper Series
Technical Analysis in the Foreign Exchange Market
Christopher J. Neely and
Paul A. Weller
Working Paper 2011-001B
http://research.stlouisfed.org/wp/2011/2011-001.pdf
January 2011 Revised July 2011
FEDERAL RESERVE BANK OF ST. LOUIS Research Division
P.O. Box 442 St. Louis, MO 63166
______________________________________________________________________________________
The views expressed are those of the individual authors and do not necessarily reflect official positions of the Federal Reserve Bank of St. Louis, the Federal Reserve System, or the Board of Governors.
Federal Reserve Bank of St. Louis Working Papers are preliminary materials circulated to stimulate discussion and critical comment. References in publications to Federal Reserve Bank of St. Louis Working Papers (other than an acknowledgment that the writer has had access to unpublished material) should be cleared with the author or authors.

Prepared for Wiley’s Handbook of Exchange Rates
Technical Analysis in the Foreign Exchange Market
Christopher J. Neely*
Paul A. Weller
July 24, 2011
Abstract: This article introduces the subject of technical analysis in the foreign exchange market, with emphasis on
its importance for questions of market efficiency. “Technicians” view their craft, the study of price patterns, as
exploiting traders’ psychological regularities. The literature on technical analysis has established that simple
technical trading rules on dollar exchange rates provided 15 years of positive, risk-adjusted returns during the 1970s
and 80s before those returns were extinguished. More recently, more complex and less studied rules have produced
more modest returns for a similar length of time. Conventional explanations that rely on risk adjustment and/or
central bank intervention do not plausibly justify the observed excess returns from following simple technical
trading rules. Psychological biases, however, could contribute to the profitability of these rules. We view the
observed pattern of excess returns to technical trading rules as being consistent with an adaptive markets view of the
world.
Keywords: exchange rate, technical analysis, technical trading, intervention, efficient markets hypothesis, adaptive
markets hypothesis
JEL Codes: F31, G14, G11, G15
* Corresponding author. Send correspondence to Chris Neely, Box 442, Federal Reserve Bank of St. Louis, St. Louis, MO 63166-0442; e-mail: [email protected]; phone: 314-444-8568; fax: 314-444-8731. Paul Weller’s email: [email protected]; phone: (319) 335-1017. Christopher J. Neely is an assistant vice president and economist at the Federal Reserve Bank of St. Louis. Paul A. Weller is the John F. Murray Professor of Finance at the University of Iowa. The authors thank many readers for helpful comments: Mike Dempster, Valérie Gastaldy, Ramo Gençay, Mark Hoeman, Richard Levich, Ike Mathur, participants at a Kepos Capital Management seminar and an anonymous referee. Brett Fawley provided excellent research assistance. The authors are responsible for errors. The views expressed in this paper are those of the authors and do not necessarily reflect those of the Federal Reserve Bank of St. Louis or the Federal Reserve System.

1
I. INTRODUCTION
Technical analysis is the use of past price behavior and/or other market data, such as volume, to guide trading
decisions in asset markets. These decisions are often generated by applying simple rules to historical price data. A
technical trading rule (TTR), for example, might suggest buying a currency if its price has risen more than 1% from
its value five days earlier. Traders in stock, commodity and foreign exchange markets use such rules widely.
Technical methods date back at least to 1700, but the “Dow Theory,” proposed by Wall Street Journal editors
Charles Dow and William Peter Hamilton, popularized them in the late nineteenth and early twentieth centuries.1
Technical analysts—who often refer to themselves as “technicians”—argue that their approach allows them to profit
from changes in the psychology of the market. The following statement expresses this view:
The technical approach to investment is essentially a reflection of the idea that prices move in
trends which are determined by the changing attitudes of investors toward a variety of economic, monetary,
political and psychological forces…Since the technical approach is based on the theory that the price is a
reflection of mass psychology (“the crowd”) in action, it attempts to forecast future price movements on the
assumption that crowd psychology moves between panic, fear, and pessimism on one hand and confidence,
excessive optimism, and greed on the other. (Pring (1991, pp. 2-3))
Although modern technical analysis was originally developed in the context of the stock market, its advocates
argue that it applies in one form or another to all asset markets. Since the era of floating exchange rates began in the
early 1970s, foreign currency traders have widely adopted this approach to trading. At least some technicians
clearly believe that the foreign exchange market is particularly prone to trending.
Currencies have the tendency to develop strong trends, stronger than stocks in my opinion because
currencies reflect the performance of countries. (Jean-Charles Gand, Société Générale Gestion, in
Clements (2010 p. 84))
It has been our longstanding experience that nothing trends as well or as clearly as a major currency
market — not equity market indices, not commodity markets and not even long-term Treasuries. (Walter
Zimmermann, United-ICAP, in Clements (2010 p. 197))
1 Lo and Hasanhodzic (2010) survey the long history of technical analysis; they present evidence that ancient peoples tracked asset prices and might have engaged in technical analysis. Nison (1991) notes that Munehisa Homma reportedly made a fortune in eighteenth-century Japan using “candlestick” patterns to predict rice market prices. Schwager (1993, 1995) and Covel (2005) discuss how technical analysis is an important tool for many of today’s most successful traders.

2
Academic research on the profitability of technical analysis tends to confirm the idea that foreign exchange
markets trend particularly well. After reviewing the literature on technical analysis in a variety of markets, Park and
Irwin (2007) conclude that technical analysis is profitable in foreign exchange and commodity futures markets but
not in stock markets (also, see Silber (1994)).
This chapter briefly introduces technical methods and then discusses how and why academic researchers have
investigated these methods in the foreign exchange market. We then describe what economists have learned about
technical analysis and conclude with a discussion of promising avenues of future research. Readers interested in
learning more about technical methods should consult technical analysis textbooks such as Murphy (1986), Pring
(1991), or Elder (1993). Readers wishing for a detailed literature review of technical analysis in currency markets
should go to Menkhoff and Taylor’s (2007) excellent survey.
II. THE PRACTICE OF TECHNICAL ANALYSIS
A. The Philosophy of Technical Analysis
Technical analysts argue that their methods take advantage of market psychology as illustrated by the
quotation from Pring (1991) above. In particular, technical textbooks such as Murphy (1986) and Pring (1991)
outline three principles that guide the behavior of technical analysts.2 The first is that market action (prices and
transactions volume) “discounts” everything. In other words, an asset’s price history incorporates all relevant
information, so there is no need to forecast or research asset “fundamentals.” Indeed, technical purists don’t even
look at fundamentals, except through the prism of prices, which reflect fundamentals before those variables are fully
observable. Presaging recent findings by Engel and West (2005), Murphy (1986) claims that asset price changes
often precede observed changes in fundamentals. The second principle is that asset prices move in trends. This is
essential to the success of technical analysis because trends imply predictability and enable traders to profit by
buying (selling) assets when the price is rising (falling). This is captured in the technicians’ mantra “the trend is your
friend.” The third principle of technical analysis is that history repeats itself. Asset traders will tend to react in a
similar way when confronted by similar conditions. This implies that asset price patterns will tend to repeat
themselves.
Using these three principles, technical analysts attempt to identify trends and reversals of trends. These 2 Murphy (1986) and Pring (1991) provide a much more comprehensive treatment of technical analysis and these principles. Rosenberg and Shatz (1995) advocate the use of technical analysis with more economic explanation.

3
methods are explicitly extrapolative; that is, they infer future price changes from those of the recent past.
Technicians argue that formal methods of detecting trends are necessary because prices move up and down around
the primary (or longer-run) trend. That is, technical indicators can be constructed with data over multiple time
frames, from intraday to daily or multiyear horizons. Technicians may consider patterns over these multiple
timeframes, placing increased emphasis on the signals from longer horizons.
Volume frequently plays a role in technical analysis. In the stock market, for example, rising volume is
often said to confirm an uptrend. Some researchers on technical analysis in the stock market have evaluated rules
that incorporate volume measures. Neely et al. (2010), for example, use an “on-balance-volume” rule in studying
technical and fundamental predictors of the S&P 500 equity premium. But foreign exchange markets are
decentralized; there are no comprehensive indicators of daily volume. Technicians in foreign exchange markets
sometimes use proxies for total volume, such as volume measures from futures markets, such as the IMM
Commitment of Traders, or screen-based tick counts or proprietary data from market-making banks. But foreign
exchange volume remains difficult to track.
B. Types of Technical Analysis
There are many types of technical analysis and many ways to map current and past price and volume data
into trading decisions. Broadly speaking, technicians have traditionally employed two types of analysis to
distinguish trends from shorter-run fluctuations and to identify reversals: charting and mechanical (or indicator)
methods. Charting, the older of the two methods, involves graphing the history of prices over some period—
determined by the practitioner—to predict future patterns from past patterns. Charting is a very subjective system
that requires the analyst to use judgment and skill in finding and interpreting patterns. Mechanical rules (i.e.,
indicators), on the other hand, impose consistency and discipline on the technician by requiring him to use rules
based on mathematical functions of present and past exchange rates.
Charting is a complex subject and a full discussion is well beyond the scope of this chapter. Bulkowski
(2000) details the subject. Figure 1, however, provides a flavor of the type of patterns that technicians look for in the
data and depicts what technicians describe as a “triple top”—three unsuccessful attempts to break a resistance level.
The triple top shown here is in the yen/euro (JPY/EUR) market in 2009 before the price broke a support level in

4
early 2010.3 The triple top is a reversal pattern and generates a sell signal after a period of price increases. Figure 2
illustrates another type of reversal pattern, a “head-and-shoulders” pattern, for the U.S. dollar/deutschemark
(USD/DEM). The “neckline” shown in the figure joins the troughs separating the head from the two shoulders.
When the exchange rate passes through the neckline a sell signal is produced. Osler and Chang (1995) find some
value in this classic pattern for some currencies.
[Insert Figures 1 and 2 about here.]
To avoid the subjectivity involved in interpreting charts, economists have almost always studied
mechanical rules. Table I shows three traditional technical rules economists have tested in the context of foreign
exchange and/or equity markets: (i) filter, (ii) double moving average (MA), and (iii) channel. A filter rule produces
a buy (sell) signal whenever the exchange rate rises (falls) by more than a given percentage from its most recent low
(high). The choice of filter size is left to the technical analyst but typically ranges from ½ to 10%. An MA rule
compares a short and a long moving average of past prices and generates a buy (sell) signal if the short moving
average intersects the long moving average from below (above). For example, one widely used rule, which we write
as MA(5, 20), compares a 5-day and a 20-day moving average. A channel rule counsels to buy (sell) the asset when
its price exceeds (is less than) the maximum (minimum) over the previous n days. 4 All three of these rules require
technicians to choose parameters, and technical manuals provide little guidance on the appropriate values of these
parameters except to appeal to common practice. This introduces the possibility of data snooping and data mining
biases and is a source of significant problems in any rigorous statistical test for the existence of excess returns. We
consider ways of minimizing such biases in Section IV.
[Insert Table I here]
In recent practice, technicians more commonly favor several newer indicators that also use mathematical
functions to determine when to buy or sell (Clements (2010)). These rules are less well-known by economists and
less well tested. Table II describes four of these types of rules: (i) relative strength indicator (RSI), (ii)
exponentially weighted moving average (EWMA), (iii) moving average convergence divergence (MACD) and (iv)
3 A resistance (support) level is a set of local maxima (minima) for an asset price. These levels can be static or a function of time. George Davis of RBC Capital Markets identified this triple top example in Figure 1 (Clements (2010)). 4 We define the channel rule following Taylor (1994). Sullivan, Timmermann and White (1999) instead call this same channel rule a support and resistance rule. The Sullivan, Timmermann and White (1999) definition of the channel rule is similar to Taylor (1994), but the rule is conditioned on a formed channel, i.e., the minimum and maximum over the last n days must be within x% of each other.

5
rate of change (ROC). These rules perform the same task as the traditional rules in Table I—they identify trends and
reversals.
[Insert Table II here]
In addition to charting and mechanical methods, technical analysts also use many other types of indicators.
Some such indicators assign a special role to round numbers in support or resistance levels. For example,
technicians interpret a crossing of a significant level, such as a yen/dollar rate of 100, as indicating further
movement in the same direction. For example, Creswell (1995) reported that Jorge Rodriguez, director of North
American Sales at Credit Suisse, stated, “The 100 yen level for the dollar is still a very big psychological barrier and
it will take a few tests before it breaks. But once you break 100 yen, it’s not going to remain there for long. You’ll
probably see it trade between 102 and 106 for a while.” Osler (2003) shows that when an exchange rate approaches
a round number, such as 100 yen to the dollar, it tends to reverse its path. But when an exchange rate does cross
such a level, it tends to move rapidly past it. Osler (2005) links limit orders to the very high proportion of large
changes in exchange rates. Murphy (1986) discusses a number of more esoteric methods, including Elliot wave
theory, Fibonacci numbers and many other technical concepts. In addition, traders sometimes use technical analysis
of one market’s price history to take positions in another market, a practice called intermarket technical analysis.
III. STUDIES OF TECHNICAL ANALYSIS IN THE FOREIGN EXCHANGE MARKET
A. Why Study Technical Analysis?
The widespread use of technical analysis in foreign exchange (and other) markets is puzzling because it implies
that either traders are irrationally making decisions on useless information or that past prices contain useful
information for trading. The latter possibility would contradict the “efficient markets hypothesis,” which holds that
no trading strategy should be able to generate unusual profits on publicly available information—such as past
prices—except by bearing unusual risk. And the observed level of risk-adjusted profitability measures market
(in)efficiency. Therefore much research effort has been directed toward determining whether technical analysis is
indeed profitable or not. One of the earliest studies, by Fama and Blume (1966), found no evidence that a particular
class of TTRs could earn abnormal profits in the stock market. However, more recent research by Brock,
Lakonishok and LeBaron (1992) and Sullivan, Timmermann and White (1999) has provided contrary evidence. And
many studies of the foreign exchange market have found evidence that TTRs can generate persistent profits (Poole
6
(1967), Dooley and Shafer (1984), Sweeney (1986), Levich and Thomas (1993), Neely, Weller and Dittmar (1997),
Gençay (1999), Lee, Gleason and Mathur (2001) and Martin (2001)).
B. Survey Evidence on the Practice of Technical Analysis
An important area of research on technical analysis has focused on documenting how and to what extent it
is actually used in foreign exchange markets. This research is primarily conducted through surveys of technicians.
Allen and Taylor (1990) and Taylor and Allen (1992) conduct the first such surveys on chief foreign exchange
dealers in London. The responses established that almost all traders in the London foreign exchange market use
technical analysis to some degree and that they tend to combine it with fundamental analysis. So there is not an
exclusive reliance on either approach to trading. In addition, the authors find that the relative weight attached to
technical analysis is greater at shorter horizons. Thus, Taylor and Allen (1992) find that 90% of the respondents to
their survey report using some form of technical analysis to inform their trading decisions. In addition, they find
that at short horizons—less than a week—traders use technical analysis much more frequently than they do
fundamental analysis, which uses economic variables such as interest rates and output growth rates to guide trading
decisions.5
Later surveys confirmed many of these early findings. Cheung and Chinn (2001) find that 30% of U.S.
foreign exchange traders could best be characterized as technical analysts and that an increasing percentage use
technical analysis. Cheung, Chinn and Marsh (2004) confirm previous findings that traders pay more attention to
nonfundamental factors at short horizons.
More recent surveys have investigated the educational background, experience and psychological biases of
foreign exchange traders, including technical traders. Menkhoff (1997) refutes the notion that technical traders lack
the experience or education of their peers who trade on fundamentals. The surveyed German technicians do not
differ from non-technicians regarding age, education, position, seniority, their firms’ trading turnover or assets under
management. Menkhoff and Schmidt (2005) investigate the use of buy-and-hold, momentum and contrarian trading
strategies by fund managers. Momentum traders are the least risk-averse and contrarian traders show signs of
overconfidence.
Oberlechner and Osler (2008) use survey evidence from 400 North American foreign exchange traders to
5 Menkhoff (2010) finds that the dominance of technical analysis at short horizons holds for fund managers in general.
7
establish that respondents underestimate uncertainty and overestimate their own abilities. They argue that their
findings help to explain the high volatility of floating exchange rates, the profitability of trend-following strategies
and the apparent irrationality of exchange rate forecasts. Finally, Clements (2010) interviews 13 prominent
technicians about market efficiency, trading strategies, attitudes toward risk and intermarket analysis.
C. Computing Signals and Returns
We first review the basic procedures for evaluating TTR success before describing progress in the literature.
Procedures for evaluating the profitability of trading rules vary somewhat from study to study and have evolved over
the years. We briefly review reasonable and common methods for calculating such statistics. To calculate statistics
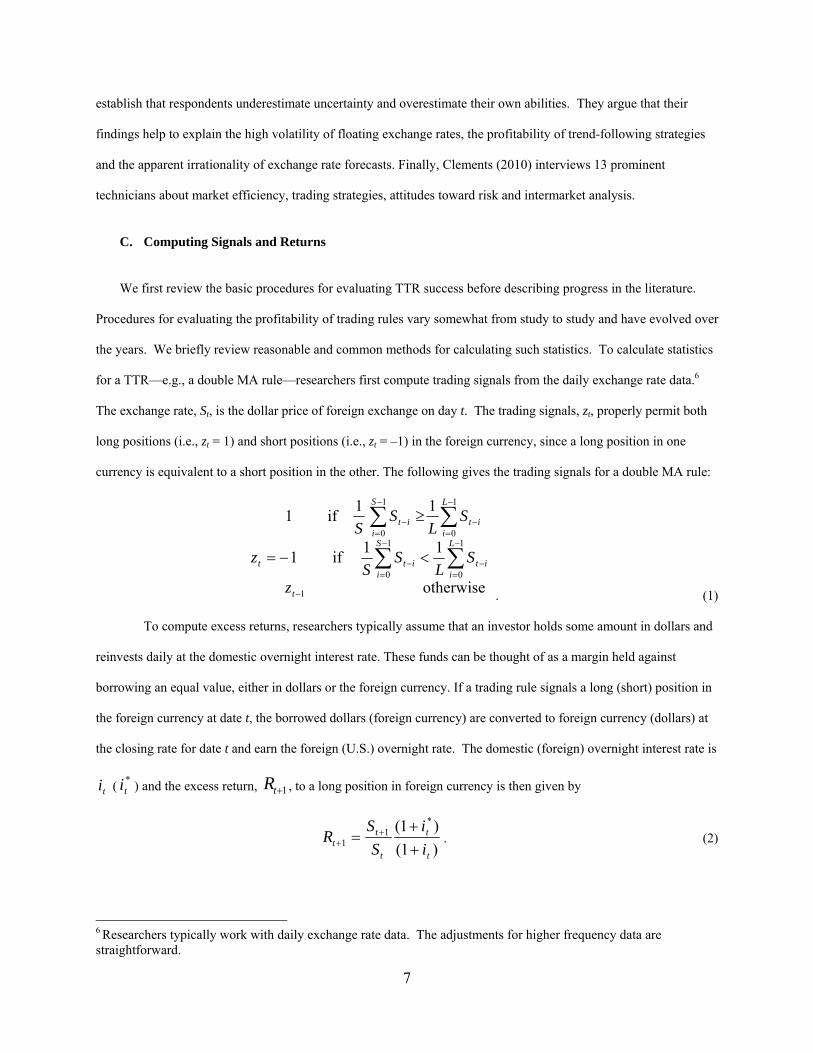
for a TTR—e.g., a double MA rule—researchers first compute trading signals from the daily exchange rate data.6
The exchange rate, St, is the dollar price of foreign exchange on day t. The trading signals, zt, properly permit both
long positions (i.e., zt = 1) and short positions (i.e., zt = –1) in the foreign currency, since a long position in one
currency is equivalent to a short position in the other. The following gives the trading signals for a double MA rule:
otherwise
11if1
11if1
1
1
0
1
0
1
0
1
0
t
L
iit
S
iit
L
iit
S
iit
t
z
SL
SS
SL
SS
z
. (1)
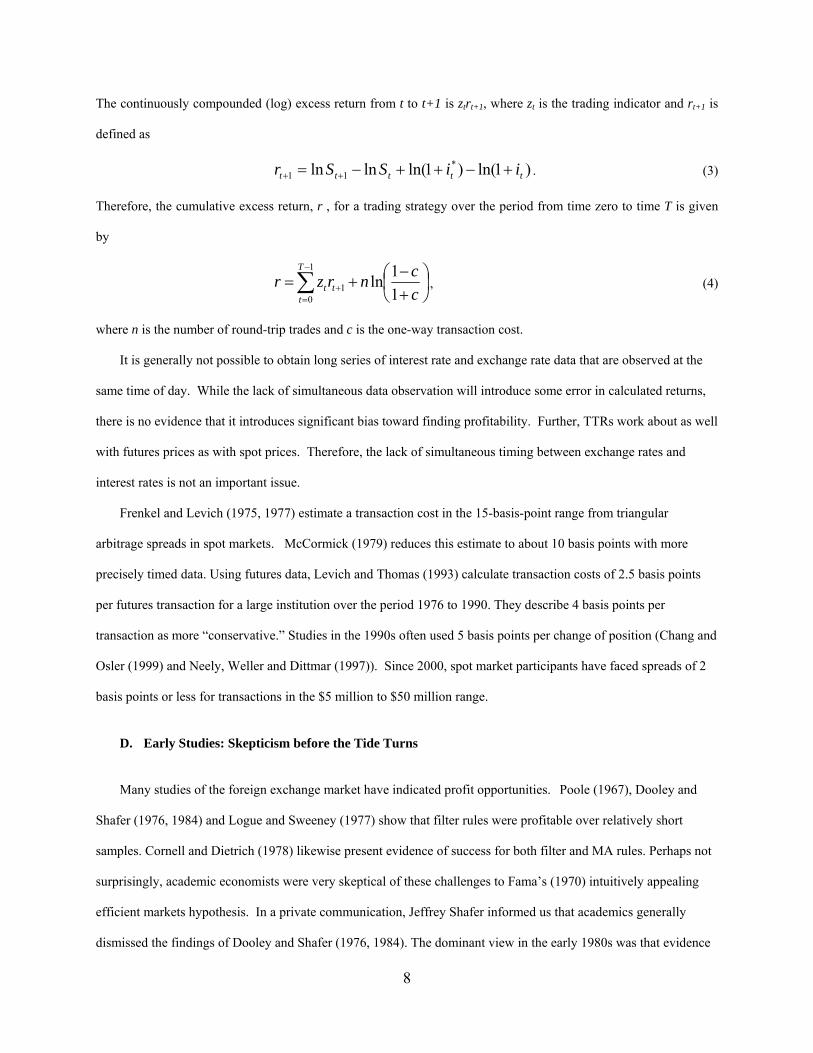
To compute excess returns, researchers typically assume that an investor holds some amount in dollars and
reinvests daily at the domestic overnight interest rate. These funds can be thought of as a margin held against
borrowing an equal value, either in dollars or the foreign currency. If a trading rule signals a long (short) position in
the foreign currency at date t, the borrowed dollars (foreign currency) are converted to foreign currency (dollars) at
the closing rate for date t and earn the foreign (U.S.) overnight rate. The domestic (foreign) overnight interest rate is
it ( it*
) and the excess return, 1tR , to a long position in foreign currency is then given by
RS
S
i
itt
t
t
t
1
1 1
1
( )
( )
*
. (2)
6 Researchers typically work with daily exchange rate data. The adjustments for higher frequency data are straightforward.
8
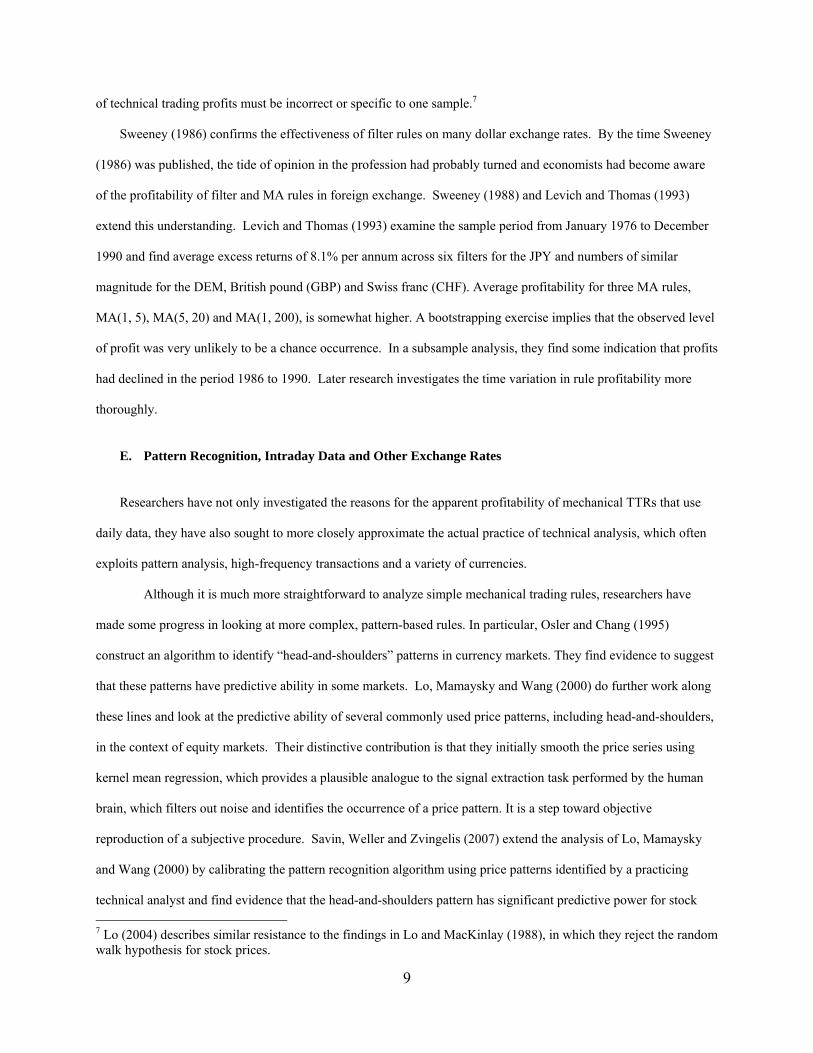
The continuously compounded (log) excess return from t to t+1 is ztrt+1, where zt is the trading indicator and rt+1 is
defined as
)1ln()1ln(lnln *11 ttttt iiSSr . (3)
Therefore, the cumulative excess return, r , for a trading strategy over the period from time zero to time T is given
by
c
cnrzr
T
ttt 1
1ln
1
01 , (4)
where n is the number of round-trip trades and c is the one-way transaction cost.
It is generally not possible to obtain long series of interest rate and exchange rate data that are observed at the
same time of day. While the lack of simultaneous data observation will introduce some error in calculated returns,
there is no evidence that it introduces significant bias toward finding profitability. Further, TTRs work about as well
with futures prices as with spot prices. Therefore, the lack of simultaneous timing between exchange rates and
interest rates is not an important issue.
Frenkel and Levich (1975, 1977) estimate a transaction cost in the 15-basis-point range from triangular
arbitrage spreads in spot markets. McCormick (1979) reduces this estimate to about 10 basis points with more
precisely timed data. Using futures data, Levich and Thomas (1993) calculate transaction costs of 2.5 basis points
per futures transaction for a large institution over the period 1976 to 1990. They describe 4 basis points per
transaction as more “conservative.” Studies in the 1990s often used 5 basis points per change of position (Chang and
Osler (1999) and Neely, Weller and Dittmar (1997)). Since 2000, spot market participants have faced spreads of 2
basis points or less for transactions in the $5 million to $50 million range.
D. Early Studies: Skepticism before the Tide Turns
Many studies of the foreign exchange market have indicated profit opportunities. Poole (1967), Dooley and
Shafer (1976, 1984) and Logue and Sweeney (1977) show that filter rules were profitable over relatively short
samples. Cornell and Dietrich (1978) likewise present evidence of success for both filter and MA rules. Perhaps not
surprisingly, academic economists were very skeptical of these challenges to Fama’s (1970) intuitively appealing
efficient markets hypothesis. In a private communication, Jeffrey Shafer informed us that academics generally
dismissed the findings of Dooley and Shafer (1976, 1984). The dominant view in the early 1980s was that evidence
9
of technical trading profits must be incorrect or specific to one sample.7
Sweeney (1986) confirms the effectiveness of filter rules on many dollar exchange rates. By the time Sweeney
(1986) was published, the tide of opinion in the profession had probably turned and economists had become aware
of the profitability of filter and MA rules in foreign exchange. Sweeney (1988) and Levich and Thomas (1993)
extend this understanding. Levich and Thomas (1993) examine the sample period from January 1976 to December
1990 and find average excess returns of 8.1% per annum across six filters for the JPY and numbers of similar
magnitude for the DEM, British pound (GBP) and Swiss franc (CHF). Average profitability for three MA rules,
MA(1, 5), MA(5, 20) and MA(1, 200), is somewhat higher. A bootstrapping exercise implies that the observed level
of profit was very unlikely to be a chance occurrence. In a subsample analysis, they find some indication that profits
had declined in the period 1986 to 1990. Later research investigates the time variation in rule profitability more
thoroughly.
E. Pattern Recognition, Intraday Data and Other Exchange Rates
Researchers have not only investigated the reasons for the apparent profitability of mechanical TTRs that use
daily data, they have also sought to more closely approximate the actual practice of technical analysis, which often
exploits pattern analysis, high-frequency transactions and a variety of currencies.
Although it is much more straightforward to analyze simple mechanical trading rules, researchers have
made some progress in looking at more complex, pattern-based rules. In particular, Osler and Chang (1995)
construct an algorithm to identify “head-and-shoulders” patterns in currency markets. They find evidence to suggest
that these patterns have predictive ability in some markets. Lo, Mamaysky and Wang (2000) do further work along
these lines and look at the predictive ability of several commonly used price patterns, including head-and-shoulders,
in the context of equity markets. Their distinctive contribution is that they initially smooth the price series using
kernel mean regression, which provides a plausible analogue to the signal extraction task performed by the human
brain, which filters out noise and identifies the occurrence of a price pattern. It is a step toward objective
reproduction of a subjective procedure. Savin, Weller and Zvingelis (2007) extend the analysis of Lo, Mamaysky
and Wang (2000) by calibrating the pattern recognition algorithm using price patterns identified by a practicing
technical analyst and find evidence that the head-and-shoulders pattern has significant predictive power for stock
7 Lo (2004) describes similar resistance to the findings in Lo and MacKinlay (1988), in which they reject the random walk hypothesis for stock prices.

10
returns for periods up to 3 months. The kernel mean regression methodology has yet to be applied to the foreign
exchange market.
Although the majority of academic studies of technical analysis have used daily data, some studies have used
higher-frequency data (Curcio et al. (1997), Osler (2003), Neely and Weller (2003) and Kozhan and Salmon
(2010)). Neely and Weller (2003) use half-hourly data from 1996 to examine trading rules generated by a genetic
program and by a linear forecasting model. Once reasonable transaction costs are taken into account and trade is
restricted to times of normal market activity, they find no evidence of positive excess returns. Kozhan and Salmon
(2010) use tick-by-tick data for the pound sterling against the U.S. dollar drawn from the Reuters D3000 trading
system for separate periods in 2003 and 2008. They find that a trading rule based on a genetic algorithm can earn
significant profits net of transaction costs in 2003 but that these profits disappear by 2008.
Of course, one would like to directly examine the returns to commercial trading recommendations made in real
time. Gençay et al. (2003a) and Gençay et al. (2003b) use high frequency data to compare a widely used
commercial real-time trading model with technical traders and an exponentially weighted moving average model,
respectively. The commercial real-time model dominates its competitors in risk-adjusted return.
Other studies have extended the literature on technical analysis by studying the application of such rules to
other-than-major-dollar exchange rates. Lee and Mathur (1996) find that MA trading rules have marginal
profitability for only two of six cross rates (non-USD rates). Neely and Weller (1999) show remarkable success for
rules created by genetic programming in the target zones of the European Monetary System. Lee, Gleason and
Mathur (2001) discern mixed results for MA and channel rules for 13 Latin American exchange rates. Martin
(2001) discovers that trading rules produce significant profits—but not after risk adjustment—for developing
countries. de Zwart et al. (2009) find that both technical analysis and information from macroeconomic variables
can create profitable trading strategies for emerging market exchange rates from 1997 to 2007. Likewise,
Pukthuanthong-Le, Levich and Thomas (2007) and Pukthuanthong-Le and Thomas (2008) find that emerging
market currencies appear to provide some profit opportunities to technical rules. In summary, the evidence for
technical trading profitability in cross-rates is mixed but emerging markets show greater profits than recent dollar
markets.

11
IV. EXPLAINING THE SUCCESS OF TECHNICAL ANALYSIS
Research from the 1970s through the early 1990s documented a long period, perhaps 15 years, in which fairly
simple technical rules—MA and filter rules—apparently produced substantial excess returns on major exchange
rates. This result was puzzling because it appeared to challenge the intuitively appealing weak-form efficient
markets hypothesis, which stated that past prices should not produce positive risk-adjusted returns.
Several potentially complementary hypotheses have been put forward to explain the apparent success of
technical analysis. First, there are at least three ways—data snooping, publication bias and data mining—in which
the apparent returns could be spurious, an artifact of the research process. Second, the apparent returns might be
consistent with a reasonably efficient market if they are compensation for bearing risk. Third, either known agents
—i.e., central banks—or less understood factors—e.g., cognitive biases—might introduce sufficient inefficiencies to
create the observed returns.
A. Data Snooping, Publication Bias and Data Mining
Data snooping, publication bias and data mining are three related but distinct problems that could tend to
produce the false conclusion that TTRs are successful. In particular, these three issues stem from the fact that it is
always possible to find ex post patterns, such as profitable trading strategies, that exist purely by chance in a specific
data set and will not exist in other samples/data sets. Data snooping is the problem that researchers will choose,
either consciously or unconsciously, to test rules already proven profitable on part or all of the previously tested data
set.8 Data mining is the tendency for each set of researchers to test many rules and to base the overall inference on
the most successful rules: Negative test results are ignored, while positive results are taken to indicate that trading
rule strategies can yield profits. Publication bias refers to the tendency of journals to more readily accept
submissions with positive results (i.e., profitable trading rules) than negative results. Even if every group of
researchers guards assiduously against data snooping and/or data mining, publication bias would result in the
profession reading research from the studies with the most positive results.
Although practicing technicians usually use rules containing a substantial subjective element, researchers
need to evaluate fixed, mechanical trading rules. Some researchers argue that one should test only those rules that
are commonly used in practice to reduce the problem of drawing false conclusions from data mining. This practice
8 It is almost impossible to avoid some data snooping, given that data sets and plausible rules are limited.
12
exacerbates the problem of data snooping, however. Technicians routinely “backtest” rules—test them on past
data—using only rules that were profitable on past data. In other words, technical analysts may have converged on a
small number of rules that happen by chance to have been profitable over some historical time period. Thus, the
study of those rules could be subject to data snooping bias.
Starting in the mid-1990s, studies began to consider more seriously how to confront the data snooping problem.
One way to minimize this bias is to automate the rule-selection procedure and minimize researcher input. Such a
procedure selects rules that perform optimally during some in-sample period and then examines their performance
out of sample. Neely, Weller and Dittmar (1997) use genetic programming to identify optimal rules for six exchange
rates and find evidence of significant profitability for the out-of-sample period 1981 to 1995. The genetic
programming approach allows one to be relatively agnostic about the precise structure of any optimal rule, which
reduces the chance that preconceived notions about what rules “work” may introduce data snooping bias. Gençay
(1999) and others have similarly employed neural networks as “black-box” methods for generating trading rules
with positive results.
Even in the absence of an automated black-box rule selection process, the practice of subdividing a sample
into distinct in- and out-of-sample periods can also reduce the danger of data mining, as well as data snooping. The
in-sample period is used to select rules that perform well during that period and the rules are then tested on the out-
of-sample data. This effectively reduces a very large group of rules to a small group of selected rules that can be
tested in the out-of-sample period with less concern for the number of rules or data snooping bias. Examples of in-
sample/out-of-sample testing include the use of genetic programming (Neely, Weller and Dittmar (1997)) and
various econometric techniques (Taylor (1994) and Dueker and Neely (2007)).
White (2000) introduces another tool—a “reality check”—to correct for the data mining bias that is inherent in
testing a large group of rules in a single paper. This tool allows one to adjust significance levels as a function of the
number of actual or potential rules considered. Qi and Wu (2006) apply White’s reality check in the context of the
foreign exchange market and find evidence that profitability survives for their 1973 to 1998 sample period. It is
considerably weaker for their 1986 to1998 subsample period. Hsu, Hsu and Kuan (2010) test the predictive ability
of trading rules on emerging market indices with the “superior predictive ability” stepwise test of Hansen (2005),
which is also designed to eliminate data snooping bias. They find predictive ability but note that the emergence of
exchange traded funds appears to weaken this phenomenon.

13
Perhaps the most certain solution to data snooping, data mining and publication bias is to analyze the
performance of rules in true out-of-sample tests that occur long after an important study. That is, one can test a
group of rules that were examined in studies conducted sufficiently long ago that one has enough new data to carry
out a true out-of-sample test. Neely, Weller and Ulrich (2009) employ this line of attack. Of course, this technique
has a substantial cost: One must wait years to employ it on past studies.
B. Temporal Variation in Trading Rule Returns
Even if one is confident that one has found a profitable rule or portfolio of rules with positive returns, the
significant possibility that their profitability will vary over time must be considered. It is thus necessary to test the
stability of rule profitability. Several papers have taken up this challenge: Levich and Thomas (1993) note some
(weak) evidence that the profitability of their rules declines in their final subsample period, 1986 to 1990. LeBaron
(2002) finds that returns to a 150-day MA trading rule decline in the 1990s and speculates that data snooping may be
responsible for earlier successes. More recently, Okunev and White (2003) and Olson (2004), using different
optimizing procedures to select MA trading strategies, arrive at different conclusions on the continued profitability
of trading rules. Okunev and White (2003) consider whether momentum strategies in MA rules continue to be
profitable in the recent era. They find that taking simultaneous long and short positions in MA rules with the best
and worst returns over the previous month produces excess returns of 45 to 60 basis points per month over the
period 1980 to 2000.9 Olson (2004) dynamically reoptimizes MA rule portfolios in successive 5-year periods from
1971 to 2000 and then tests these in successive 5-year out-of-sample periods. He finds that post-1970s returns
declined to about zero by the 1990s. Schulmeister (2008) shows that the best of 1024 technical rules in the
DEM/USD market were profitable out-of-sample and that rule profitability has been declining since the late 1980s.
Pukthuanthong-Le, Levich and Thomas (2007) and Pukthuanthong-Le and Thomas (2008) extend the analysis on
time variation in returns to emerging markets. They find that major currencies no longer trend reliably but markets
in newly trading currencies appear to display some profit opportunities from technical rules. This finding suggests
that traders in major currency markets have arbitraged away technical patterns but those patterns still exist in
emerging markets.
9 The returns were not adjusted for transaction costs.

14
Figure 3 illustrates the time variation in the returns to traditional rules. It shows the rolling mean annual return
to a portfolio of the set of traditional rules used in Levich and Thomas (1993): 0.5%, 1%, 2%, 3%, 4%, and 5% filter
rules, as well as MA(1, 5), MA(5, 20), and MA(1, 200) rules. The figure makes clear that the rules were profitable,
on average, during the Levich and Thomas sample, 1976 to 1990, but tended to become much less profitable during
the 1990s and 2000s. The sloping lines, which represent predicted values from a time trend model of trading rule
returns, illustrate the trend decline in profitability over time. This visually confirms that traditional MA and filter
rules had become unprofitable by the early 1990s.
[Insert Figure 3 about here.]
Figure 3 also hints at the major difficulty in detecting time variation in the returns to TTRs in foreign exchange
markets: The returns are noisy. The typical exchange rate has an annual standard deviation around 10%.
Researchers would require long samples to reliably determine that a mean trading rule return declined by 2 or 3
percentage points per annum, especially if the break date was unknown.
The temporal patterns in TTR returns can also illuminate the source of these returns. For example, if rules were
profitable on some particular sample by chance, as a result of data mining, data snooping or publication bias, then
those rules would be very unlikely to remain profitable outside of the original sample. Neely, Weller and Ulrich
(2009) exploit this observation to evaluate explanations for trading rule returns by conducting true, out-of-sample
tests on previously studied rules from the following papers: Sweeney (1986), Levich and Thomas (1993), Taylor
(1994), Neely, Weller and Dittmar (1997) and Dueker and Neely (2007). The rules consisted of filter, MA, and
channel rules, as well as rules developed by genetic programming and econometric methods (ARIMA and Markov
switching models). The logic underlying the analysis was that true, out-of-sample results permitted one to discover
whether the original results reported were the result of data snooping or represented genuine profit opportunities. It
was also possible to look more closely at whether profits had changed over time. The authors concluded that
relatively simple technical rules were genuinely profitable on major floating exchange rates for an extended period,
at least 15 years, from about 1975 to 1990. As the profitability of those simple rules became widely publicized in
the academic literature, the profitability of the rules disappeared. At the same time, more complex and less well-
known rules retained substantial profitability.10
10 In an intriguing study of a non-traditional source of technical information, Charlebois and Sapp (2007) confirm the idea that market participants can predict future asset prices. They show that information from open interest on at-the-money options produces a trading strategy that is more profitable than traditional technical trading rules.

15
Similarly, Kozhan and Salmon (2010), using high-frequency data, find that trading rules derived from a genetic
algorithm were profitable in 2003 but that this was no longer true in 2008. They attribute their finding to a dramatic
rise in the volume of algorithmic trading over this period. Consistent with this explanation, Chaboud et al. (2009)
report that from 2003 to 2007 the fraction of trading volume where at least one of the two counterparties was an
algorithmic trader increased from almost nothing to 60% or more for the yen and euro against the dollar.
The examination of time variation in the returns to trading rules makes it clear that genuine returns existed for
many years and probably still exist at lower levels for more complex rules. This raises the question as to the source
of those genuine returns.
C. Do Technical Trading Returns Compensate Investors for Bearing Risk?
Some of the early studies of technical trading in currency markets made no attempt to adjust for risk. This left
open the possibility that the reported excess returns were not anomalous or an indication of market inefficiency but
simply appropriate compensation for the risk incurred. Researchers have adopted a number of different risk-
adjustment approaches. Sweeney (1986), for example, assumes that any observed deviation from uncovered interest
parity indicates the presence of a constant risk premium (or discount). A long position in foreign currency then earns
a constant risk premium. Since he analyzes trading rules that do not permit short positions, he looks at the excess
return earned by the trading rule (gross return less buy-and-hold return) adjusted according to the number of days
the rule held a long position and thus had to earn the risk premium. He denotes the risk-adjusted return as X* and
finds that observed returns remain positive after this risk adjustment (see Sweeney and Lee (1990)). Although
Sweeney developed the X* statistic in the context of the foreign exchange market, it would seem to be more
appropriate for equities, which might exhibit an unconditional risk premium.
In a standard model of a representative agent maximizing utility over an infinite horizon, it is possible to show
that the following condition should hold:
=cov , , (5)
where Mt is the stochastic discount factor (marginal utility of a dollar in different states of the world). The
covariance term represents the foreign currency risk premium and can be time varying. It captures the extent to
which holding the foreign currency can act as a consumption hedge. If the risk premium, represented by the
covariance term, is zero, we obtain the familiar uncovered interest parity condition,
16
= , (6)
which predicts that the currency with the higher interest rate is expected to depreciate. The very well-documented
violation of this prediction has given rise to the forward premium puzzle and is the source of the carry trade, a
strategy that requires the trader to take a long position in a currency or portfolio of currencies that earns high interest
rates and a short position in a currency or portfolio of currencies that earns low interest rates.
Providing a convincing model of the risk premium is the key to appropriate risk adjustment, both for TTR
returns and for the carry trade. In equity markets the standard approach to risk adjustment is to use a factor model in
which the stochastic discount factor is assumed to be a linear function of individual risk factors. This may be the
capital asset pricing model (CAPM), in which the return on the market portfolio is the single factor, or a multifactor
model such as the Fama-French three-factor model. Although the CAPM has a firm theoretical foundation, there is
little theoretical guidance as to choice of appropriate factors in multifactor models. The Fama-French model, which
adds size and book-to-market factors to the market excess return, is widely used because of its success in explaining
stock returns. It has been difficult, however, to provide a convincing link to underlying sources of risk. And there is
no obvious rationale for using the model to explain currency returns. Recent work by Lustig, Roussanov and
Verdelhan (2010) suggests that a single currency factor constructed as the return on the highest minus the return on
the lowest interest rate currency portfolios may provide a parsimonious explanation of currency risk premia. They
argue that the factor can explain returns to the carry trade but the model has not yet been applied to TTR returns.
Brunnermeier, Nagel, and Pedersen (2009) explain the returns to the carry trade through crash risk caused by the
sudden unwinding of carry trades, which is associated with illiquidity. Menkhoff, Sarno, Schmeling, and Schrimpf
(2010) argue that high-interest currency returns are negatively related to global foreign exchange volatility, which
explain the carry trade returns. In these cases, too, we do not yet know what explanatory power, if any, these factors
have for TTR returns.
Risk adjustment based on the CAPM requires one to select a market portfolio. If markets are fully integrated
and investors hold globally diversified portfolios, then the world market portfolio is the appropriate choice.
Otherwise it may make more sense to choose a particular country’s market portfolio. Taylor (1992) looks at the beta
with the S&P 500, whereas Kho (1996) uses the MSCI (world) market index. Neely, Weller and Dittmar (1997) use
both a world market index and several national indices. A general finding is that trading rule returns are
unconditionally uncorrelated with sources of stock market risk. Since they are also substantially less variable, a
17
portfolio that combines a stock index with a trading rule return will often produce a large improvement in the risk-
return tradeoff (Neely and Weller (1999)). However, Kho (1996) reports that allowing for time variation in the risk
premium can account for much of the excess profitability of a class of moving average rules.
In addition to CAPM betas, researchers have used several other risk-adjustment criteria: Sharpe ratios,
drawdown statistics, and measures derived specifically from utility functions, such as the Xeff measure from
Dacorogna et al. (2001). Xeff measures the utility that the trading strategy provides to a constant absolute risk-averse
individual over a weighted average of return horizons. Because it is difficult to find systematic risk exposure in
foreign exchange trading rules, Sharpe ratios are among the most practically useful risk-adjustment tools because
they permit direct comparison of univariate risk among trading rules.
An exclusive concentration on measures of risk, to the exclusion of Knightian “uncertainty,” is likely to lead to
a false sense of security, among both academics and practitioners. The implicit assumption in applying any of the
measures of risk mentioned above is that the environment is stationary and the past is a good guide to the future. In
other words, we are dealing with a world without “black swans.” Lo and Mueller (2010) have recently argued that
the failure of quantitative models in finance, of which TTRs are a special case, is very often attributable to neglect of
uncertainty as opposed to risk. Of course, since uncertainty is inherently unquantifiable, it is still very much an open
question how best to allow it to influence the construction and application of financial models.
D. Does Foreign Exchange Intervention Create Trading Rule Profits?
One explanation for the profitability of technical trading has a long pedigree going back to Friedman (1953):
Official intervention by the central bank in foreign exchange markets generates inefficiencies from which technical
rules profit (Friedman (1953), Sweeney (1986), and Kritzman (1989)). The presumed inefficiency arises from the
fact that the central bank has a target for the exchange rate that may be different from its fundamental value. This
may be a consequence of the imposition of short-run political objectives or a desire to limit volatility. The fact that
technical rules seem to be less useful in equity and commodity markets—where there is no intervention—has
buttressed the argument (Silber (1994)). LeBaron (1999) shows an intriguing correlation between days of U.S.
intervention and the profitability of MA trading rules. When one removes the returns on intervention days from the
technical trading return series, the mean return to technical trading is no longer statistically significant. Szakmary
and Mathur (1997) show similar results for an international data set using monthly data. But Neely (2002) uses

18
higher-frequency exchange rate data and intervention series from four monetary authorities to show that almost all
the trading rule returns on intervention days occurred overnight, before intervention could plausibly have occurred.
This provides convincing evidence that intervention is not a source of trading profits and that variation in the
frequency of intervention does not explain changes in trading rule profitability. Intervention does not generate
returns to technical trading, but rather responds to strong trends from which technical traders profit.
Table III approximately reproduces LeBaron’s (1999) and Neely’s (2002) results for U.S. data by applying a
MA(1,150) rule to daily DEM/USD and JPY/USD data from 1979 through 1992. Using all observations, the rules
make impressive and statistically significant gross annual returns on both the DEM and JPY data, at 6.97% and
8.35%, respectively. When one removes the respective intervention days, however, the gross annual returns decline
to 2.07% and 3.53%, respectively, which are no longer statistically significant. The row labeled “Markov p-value”
shows the probability that randomly removing return observations would produce as low a return as excluding
intervention days. Both Markov p-values are low, at 8% and 5%, respectively. Here it appears that intervention
creates the returns to technical trading.
[Insert Table III about here.]
When one divides the gross returns into (i) returns prior to the U.S. business day and (ii) returns during the U.S.
business day—when U.S. intervention almost always occurred—one sees that most of the decline in returns caused
by removal of intervention days occurred prior to the U.S. business day and almost certainly prior to intervention.
In other words, the trading rules were especially profitable before and not after the occurrence of intervention. For
example, the overnight return in the DEM market fell from 7.5% to 4.5% and that in the JPY market fell from 7.84%
to 4.15%. It seems unlikely that intervention—which is sporadic and difficult to predict with any precision—would
lower returns before the time of intervention. In addition, the sign of intervention is contrary to the direction of the
trading signal. That is, U.S. authorities tended to be buying (selling) dollars while technical rules were short (long)
in the dollar.11 The evidence is consistent with a story in which the U.S. authorities typically intervene contrary to
strong exchange rate trends—i.e., “lean against the wind”—and TTRs tend to profit from such trends. This creates a
correlation between intervention days and trading profits, but the intervention does not create those profits, it simply
reacts to exchange rate trends.
The weight of empirical evidence supports the conclusion that TTRs were able to earn genuine risk-adjusted
11 Neely (1998) explains how both technical traders and central banks can make positive returns, on average, despite being on opposite sides of the market on days of intervention.
19
excess returns in major foreign exchange markets at least from the mid-1970s until about 1990. We can with some
confidence reject explanations that rely on data mining, compensation for risk or foreign exchange intervention. The
conclusion leads one to accept that these markets were inefficient and raises this question: What was the source of
the inefficiency?
E. Do Cognitive Biases Create Trading Rule Profits?
Evidence has steadily accumulated that suggests that financial markets are not as efficient as had once been
believed. For example, stock prices display short-term momentum over periods of six months to a year and longer-
term mean reversion (De Bondt and Thaler (1985), Chopra, Lakonishok and Ritter (1992) and Jegadeesh and Titman
(1993)). Such phases of momentum and reversal imply the presence of trending behavior of the kind that TTRs are
designed to exploit.12 If we combine this momentum with the evidence of strong and persistent trends in currency
markets, it suggests that common factors are responsible for these patterns in different financial markets.13
Behavioral models that depart from the standard assumption of rationality are able to account for such anomalous
price patterns. Daniel, Hirshleifer and Subrahmanyam (1998) develop a model in which investors are overconfident
and subject to biased self-attribution. Overconfidence manifests itself as a tendency to overestimate the precision of
private information. Biased self-attribution refers to the fact that individuals are prone to thinking that favorable
outcomes are due to skill and unfavorable ones to bad luck. In combination, these cognitive biases result in investors
placing excessive weight on their private information. This generates a price overreaction that is only gradually
reversed as new public information is revealed. In this way, price momentum and reversal are generated. With this
behavioral model’s emphasis on the role of private information, it might be argued that the model provides a more
convincing story to explain momentum in equity markets than in the foreign exchange market, where private
information plays a less prominent role. But Friesen, Weller and Dunham (2009) show that confirmation bias alone
can generate price momentum and reversal; one need not assume that information is private. Confirmation bias is a
phenomenon that has been extensively documented in experimental studies. It is characterized by the search for, or
the interpretation of, evidence in ways that favor existing beliefs or expectations. It has been described as “perhaps
12 Serban (2010) creates foreign exchange trading rules that combine mean reversion and momentum features, which previously have been explored in equity markets. The combination produces abnormal returns for five exchange rates. The results are grossly similar to but exceed those found in equity markets. 13 This argument is further supported by the recent survey data presented in Menkhoff (2010) showing that fund managers in several different countries make extensive use of technical analysis and rely more heavily on it at short horizons. These results parallel the results of surveys of the foreign exchange market discussed above. Clements (2009) interviews fund managers about their views on behavioral finance.

20
the best known and most widely accepted notion of inferential error to come out of the literature on human
reasoning” (Evans (1989) quoted in Nickerson (1998 p. 41)).
Frankel and Froot (1990) argued that the heterogeneous expectations of “chartists” and “fundamentalists” could
be the source of excess volatility and bubbles in the foreign exchange market. Hong and Stein (1999) develop this
idea and assume that investors are boundedly rational and unable to process all the information available. Some
investors are momentum traders (the “chartists’ of Frankel and Froot) and others are “newswatchers” who pay
attention to fundamentals. De Grauwe and Grimaldi (2006) develop a model of heterogeneous agents in the foreign
exchange market that has some similarities to the work of Hong and Stein (1999). They introduce chartists and
fundamentalists—the latter are endowed with some simple learning rules—and find that the chartists trade profitably
and can often dominate the market, consistent with the survey findings mentioned above.14 Chiarella, He and
Hommes (2006) create a model with boundedly rational fundamentalists and chartists who switch between
fundamental and technical rules according to recent performance of the trading rules. That is, the heterogeneous
traders adapt their behavior to market patterns. The authors investigate the implications for bubbles, market crashes,
price resistance and switching between price levels.15 Hommes (2006) and LeBaron (2006) survey such
heterogeneous agent models. Hommes (2011) provides experimental evidence on the importance of heterogeneity
in explaining market outcomes.
Cognitive biases, including confirmation bias and bounded rationality, might create some departures from
perfect efficiency that permit trading rules to have value. But that does not explain the time variation in the returns
to trading rules or how market efficiency evolves over time.
F. Do Markets Adapt to Arbitrage Away Trading Rule Profits?
So what might explain the long period in which researchers found that simple TTRs were profitable and the
subsequent attenuation of the returns to those simple rules but the continued profitability of more complex or less
studied rules? Andrew Lo (2004) put forward the adaptive markets hypothesis (AMH) that posits that financial
markets gradually arbitrage away patterns as they become known. The AMH modifies the efficient markets view of
14 In a complementary approach to the theoretical models of Hong and Stein (1999) and De Grauwe and Grimaldi (2006), Schulmeister (2006) considers the empirical interaction of DEM/USD and EUR/USD trends and trading rule long-short positions. 15 Schulmeister (2009) studies the potential interaction of trading signals and the yen-dollar exchange rate, suggesting that the response of trading signals to news might produce self-fulfilling trends.

21
the world to assert that learning, competition and evolutionary selection pressures govern the forces that drive prices
to their efficient levels. Individual agents are no longer the “hyper-rational” beings of the standard paradigm, but
rather boundedly rational “satisficers”—in the terminology of Herbert Simon (1955). The AMH predicts that profit
opportunities will generally exist in financial markets but that learning and competition will gradually erode these
opportunities as they become known. Because complexity inhibits learning, more complex strategies will persist
longer than simple ones. And as some strategies decline as they become less profitable, there will be a tendency for
other strategies to appear in response to the changing market environment. What is as yet unclear is the extent to
which learning may mitigate or eliminate the effects of cognitive biases. Behavioral finance typically assumes that
the impact of biases is persistent— rather than disappearing as the biases are recognized, as Fama (1998) suggests—
but ultimately this is an empirical question.
Interestingly, the technicians interviewed in Clements (2010) often refer to forces that sound remarkably like
those posited by the AMH. Not surprisingly, technicians generally believe that the EMH is badly flawed, that
markets contain short-lived inefficiencies and that technical analysis is well positioned to exploit them.
The AMH can be seen as an elaboration of certain ideas contained in the paradox of efficient markets put
forward by Grossman and Stiglitz (1980) in the context of equity markets. As applied to the foreign exchange
market, the Grossman and Stiglitz (1980) argument starts by noting that expectations about fundamentals such as
national price levels, interest rates and public debt levels determine exchange rate returns but that information about
these fundamentals is costly for traders to gather and analyze. If traders cannot make some excess returns by trading
on fundamentals, they will not gather and analyze fundamental information. But the traders would not be able to
make excess returns on fundamental information in perfectly efficient markets. Therefore, markets cannot be
perfectly efficient in that exchange rates will not always be exactly where fundamentals suggest they should be. One
resolution to this paradox is to recognize that market analysts can recover the costs of some fundamental research by
trading on marginally better information than the rest of the market. But the residual inefficiency opens up the
possibility that technical traders may be able to profit from movements in exchange rates unrelated to fundamentals.
The AMH implies that profitable trading opportunities will fluctuate over time. Previously successful strategies
will display deteriorating performance, and at the same time new opportunities will appear. Most academic work has
not attempted to investigate possible ways of constructing trading strategies to take advantage of this feature of the
environment. A recent exception is the paper by Dempster and Leemans (2006), which uses an adaptive

22
reinforcement learning algorithm as the basis for a fully automated system for trading in the foreign exchange
market. Using data at one-minute frequency for the euro against the dollar, the authors report a gross return of 26
percent per annum over the period from January 2000 to January 2002.
The AMH is not yet a well-developed theory capable of generating sharp predictions. In particular, the AMH
does not predict the speed of decline of risk-arbitrage opportunities or the time to their extinction. Neither does it
quantitatively predict how the complexity of a rule or opportunity affects its speed of decline. But the AMH
provides some guidance on possible causal factors that may explain the broad findings of the literature on technical
analysis.
V. THE FUTURE OF RESEARCH ON TECHNICAL ANALYSIS
A major challenge for research on technical analysis is to produce a convincing theoretical underpinning for
the voluminous empirical findings in the field. Some promising initial steps have already been taken in this
direction. A number of competing behavioral models are able to reproduce some of the characteristics of currency
markets, but it is important that these models be able to generate new predictions that can be tested. Burnside et al.
(2011) is of particular interest in this regard. The authors construct a model in which overconfidence leads to
overreaction to information about future inflation and provides an explanation for the forward premium puzzle and
the profitability of carry trade strategies. Overconfidence can also be a source of momentum and trending in
currency markets, suggesting that there may be a common underlying cause for the profitability of both TTRs and
the carry trade strategy. Since their model predicts that the forward premium bias should be higher when momentum
is high, we would expect to see a positive correlation between trading rule returns and carry trade profits.
An empirical challenge for technical analysis—one that has not been successfully met so far—would be to link
order flow to technical trading signals and returns.16 An example of work linking order flow with technical analysis
is Gradojevic (2007), who uses order flow as one input to a trading model that combines a neural network with a
fuzzy-logic controller and finds that the model has significant predictive power. Although they do not explicitly link
16 Although order flow is usually thought of as conveying fundamental information, we believe that it can be linked to technical analysis for the following reason: Technicians believe that technical analysis incorporates fundamental information into prices before it is fully public and the order flow literature has illustrated how order flow gradually impounds private information into prices. Therefore, order flow presumably drives the price trends that technicians exploit.

23
to technical trading, Rime, Sarno and Sojli (2010) move in this direction and find that information from order flow
produces a profitable trading strategy.
VI. CONCLUSION
Technical analysis is a popular and widely used approach to trading in the foreign exchange market. Survey
evidence shows that it dominates fundamental analysis at short horizons. These findings were first established for
traders in the London market but have subsequently been confirmed to hold in other markets. Researchers have
demonstrated that TTRs were able to generate excess returns over a long period during the 1970s and 1980s. The
excess returns to relatively simple rules based on filters or moving averages had disappeared by the early 1990s, but
returns to more complex or sophisticated rules have persisted.
We have considered several hypotheses that the literature has advanced to explain these observations. We are
able with some confidence to rule out data mining as an explanation for the early profitability of technical rules.
Both out-of-sample analysis and adjustments to statistical tests indicate that the returns were genuine. Another
possible explanation centers on the intervention operations of the central bank. If the central bank has a target for the
exchange rate that differs from its fundamental value, then intervention may allow speculators to profit at the
expense of the bank. In particular, if the central bank adopts a strategy of “leaning against the wind,” then this may
create predictable trends in the exchange rate that can be detected by technical analysis. However, research using
high-frequency data has shown that the periods of greatest profitability precede central bank interventions. In other
words, central banks have intervened to stem strong trends in the exchange rate, from which TTRs happen to profit.
Therefore intervention has been correlated with periods of high profitability for technical rules.
For the profitability of technical analysis to constitute evidence of market inefficiency, one must establish that
the profits earned are not simply compensation for risk incurred. A variety of risk adjustment methods have failed to
eliminate observed profits. A believer in market efficiency may argue that such tests have omitted some unknown
risk factor. That argument, however, is substantially refuted by the decline in the profitability of simple rules over
time, essentially to zero. It is more plausible that markets have adapted to progressively reduce profit opportunities,
but at a speed that is clearly not consistent with the standard notion of market efficiency.
A proliferation of behavioral models can reproduce the trending seen in foreign exchange markets and show
that technical trading can be consistently profitable in certain circumstances. The adaptive market hypothesis

24
provides a promising framework in which such models can be further developed. Its emphasis on behavioral
decision rules that depart from the standard rational paradigm, and on learning and evolutionary selection
mechanisms, indicates a shift in focus in currency market research and, indeed, in financial markets in general.

25
REFERENCES
Allen, Helen, and Mark P. Taylor, 1990, Charts, noise and fundamentals in the London foreign exchange market,
The Economic Journal 100, 49–59.
Brock, William, Josef Lakonishok, and Blake LeBaron, 1992, Simple technical trading rules and the stochastic
properties of stock returns, Journal of Finance 47, 1731–1764.
Brunnermeier, Markus, Stefan Nagel, and Lasse Pedersen, 2009, Carry trades and currency crashes, NBER
Macroeconomics Annual 2008, 23, 313-347.
Bulkowski, Thomas N., 2000, Encyclopedia of Chart Patterns (John Wiley and Sons, New York, NY).
Burnside, Craig, Bing Han, David Hirshleifer, and Tracy Wang, 2011, Investor overconfidence and the forward
premium puzzle, Review of Economic Studies 78, 523-558.
Chaboud, Alain, Ben Chiquoine, Erik Hjalmarsson, and Clara Vega, 2009, Rise of the machines: Algorithmic
trading in the foreign exchange market, Working paper, Federal Reserve System.
Chang, P.H. Kevin, and Carol Osler, 1999, Methodical madness: Technical analysis and the irrationality of
exchange-rate forecasts, Economic Journal 109, 636–661.
Charlebois, Maxime, and Stephen Sapp, 2007, Temporal patterns in foreign exchange returns and options, Journal
of Money, Credit and Banking 39, 443–470.
Cheung, Yin-Wong, and Menzie D. Chinn, 2001, Currency traders and exchange rate dynamics: A survey of the US
market, Journal of International Money and Finance 20, 439–471.
Cheung, Yin-Wong, Chinn, Menzie D., and Ian W. Marsh, 2004, How do UK-based foreign exchange dealers think
their market operates? International Journal of Finance & Economics 9, 289–306.
Chiarella, Carl, Xue-Zhong He, and Cars Hommes, 2006, A dynamic analysis of moving average rules, Journal of
Economic Dynamics and Control 30, 1729–1753.
Chopra, Navin, Josef Lakonishok, and Jay Ritter, 1992, Measuring abnormal performance: Do stocks overreact?
Journal of Financial Economics 31, 235–268.
Clements, Matthew, 2009, Technical Analysis and Behavioural Finance in Fund Management (Global Markets
Media Ltd, Guilford, UK).
Clements, Matthew, 2010, Technical Analysis in Foreign Exchange Markets (Global Markets Media Ltd, Guilford,
UK).
26
Cornell, W. Bradford, and J. Kimball Dietrich, 1978, The efficiency of the market for foreign exchange under
floating exchange rates, Review of Economics and Statistics 60, 111–120.
Covel, Michael W., 2005, Trend Following: How Great Traders Make Millions in Up or Down Markets (Prentice-
Hall, New York, NY).
Creswell, Juli, 1995, Currency market expects rate cut by Bank of Japan, Wall Street Journal, September 5, C16.
Curcio, Riccardo, Charles Goodhart, Dominique Guillaume, and Richard Payne, 1997, Do technical trading rules
generate profits? Conclusions from the intra-day foreign exchange market, International Journal of Finance &
Economics 2, 267–280.
Dacorogna, Michel M., Ramazan Gençay, Ulrich A. Müller, and Olivier V. Pictet, 2001, Effective return, risk
aversion and drawdowns, Physica A: Statistical Mechanics and Its Applications 248, 229–248.
Daniel, Kent, David Hirshleifer, and Avanidhar Subrahmanyam, 1998, Investor psychology and security market
under- and over-reactions, Journal of Finance 53, 1839–1885.
De Bondt, Werner, and Richard Thaler, 1985, Does the stock market overreact? Journal of Finance 40, 793–805.
De Grauwe, Paul, and Marianna Grimaldi, 2006, Exchange rate puzzles: A tale of switching attractors, European
Economic Review 50, 1–33.
de Zwart, Gerben, Thijs Markwat, Laurens Swinkels, and Dick van Dijk, 2009, The economic value of fundamental
and technical information in emerging currency markets, Journal of International Money and Finance 28, 581–
604.
Dempster, Michael A.H., and V. Leemans, 2006, An automated FX trading system using adaptive reinforcement
learning, Expert Systems with Applications 30, 543–552.
Dooley, Michael P., and Jeffrey R. Shafer, 1976, Analysis of short-run exchange rate behavior: March 1973 to
September 1975, International Finance Discussion Paper No. 123, Federal Reserve Board.
Dooley, Michael P., and Jeffrey R. Shafer, 1984, Analysis of short-run exchange rate behavior: March 1973 to
November 1981, in David Bigman and Teizo Taya, eds.: Floating Exchange Rates and the State of World Trade
Payments (Ballinger Publishing Company, Cambridge, MA).
Dueker, Michael, and Christopher J. Neely, 2007, Can Markov switching models predict excess foreign exchange
returns? Journal of Banking & Finance 31, 279–296.

27
Elder, Alexander, 1993, Trading for a Living: Psychology, Trading Tactics, Money Management (John Wiley and
Sons, New York, NY).
Engel, Charles, and Kenneth West, 2005, Exchange rates and fundamentals, Journal of Political Economy 113, 485–
517.
Evans, Jonathan, 1989, Bias in Human Reasoning: Causes and Consequences (Erlbaum, Hillsdale, NJ).
Fama, Eugene F., 1970, Efficient capital markets: A review of theory and empirical work, The Journal of Finance
25, 383–417.
Fama, Eugene F., 1998, Market efficiency, long-term returns, and behavioral finance, Journal of Financial
Economics, 49, 283-306.
Fama, Eugene F., and Marshall Blume, 1966, Filter rules and stock market trading profits, Journal of Business 39,
226–241.
Frankel, Jeffrey A. and Kenneth A. Froot, 1990, Chartists, Fundamentalists, and Trading in the Foreign Exchange
Market, American Economic Review, 80, 181-185.
Frenkel, Jacob A., and Richard M. Levich, 1975, Covered interest arbitrage: unexploited profits? Journal of
Political Economy, 83, 325–338.
Frenkel, Jacob A., and Richard M. Levich, 1977, Transaction costs and interest arbitrage: Tranquil versus turbulent
periods.” Journal of Political Economy, 85, 1209–1226.
Friedman, Milton, 1953, The Case for Flexible Exchange Rates, Essays in Positive Economics (University of
Chicago Press, Chicago, IL).
Friesen, Geoffrey C., Paul A. Weller, and Lee M. Dunham, 2009, Price trends and patterns in technical analysis: A
theoretical and empirical examination, Journal of Banking and Finance 33, 1089–1100.
Gençay, Ramazan, 1999, Linear, non-linear and essential foreign exchange rate prediction with simple technical
trading rules, Journal of International Economics 47, 91–107.
Gençay, Ramazan, Guiseppe Ballocchi, Michel Dacorogna, Richard Olsen, and Olivier Pictet, 2003a, Real-time
trading models and the statistical properties of foreign exchange rates, International Economic Review 43, 463–
491.
Gençay, Ramazan, Michel Dacorogna, Richard Olsen, and Olivier Pictet, 2003b, Foreign exchange trading models
and market behavior, Journal of Economic Dynamics and Control 27, 909–935.

28
Gradojevic, Nikola, 2007. Non-linear, hybrid exchange rate modeling and trading profitability in the foreign
exchange market, Journal of Economic Dynamics and Control 31(2), 557–574.
Grossman, Sanford J., and Joseph E. Stiglitz, 1980, On the impossibility of informationally efficient markets, The
American Economic Review 70, 393–408.
Hansen, Peter R., 2005, A test for superior predictive ability, Journal of Business and Economic Statistics 23, 365–
380.
Hommes, Cars, 2006, Heterogeneous agent models in economics and finance. in K.L. Judd and L. Tesfatsion, eds.:
Handbook of Computational Economics Vol 2: Agent-based Computational Economics, Part 1, Chapter 9.
(North-Holland).
Hommes, Cars, 2011, The Heterogeneous Expectations Hypothesis: Some Evidence From the Lab, Journal of
Economic Dynamics and Control, 35, 1-24.
Hong, Harrison, and Jeremy Stein, 1999, A unified theory of underreaction, momentum trading and overreaction in
asset markets, Journal of Finance 54, 2143–2184.
Hsu, Po-Hsuan, Yu-Chin Hsu, and Chung-Ming Kuan, 2010, Testing the predictive ability of technical analysis
using a new stepwise test without data snooping bias, Journal of Empirical Finance 17, 471–484.
Jegadeesh, Narasimhan, and Sheridan Titman, 1993, Returns to buying winners and selling losers: Implications for
stock market efficiency, Journal of Finance 48, 65–91.
Kho, Bong-Chan, 1996, Time-varying risk premia, volatility, and technical trading rule profits: Evidence from
foreign currency futures markets, Journal of Financial Economics 41, 249–290.
Kozhan, Roman, and Mark Salmon, 2010, The information content of a limit order book: The case of an FX market,
Working paper.
Kritzman, Mark, 1989, Serial dependence in currency returns: Investment implications, Journal of
PortfolioManagement 16, 96–102.
LeBaron, Blake, 1999, Technical trading rule profitability and foreign exchange intervention, Journal of
International Economics 49, 125–143.
LeBaron, Blake, 2002, Technical trading profitability in foreign exchange markets in the 1990’s, Working paper,
Brandeis University.
29
LeBaron, Blake, 2006, Agent-based computational finance. in K.L. Judd and L. Tesfatsion, eds.: Handbook of
Computational Economics Vol 2: Agent-based Computational Economics, Part 1, Chapter 9. (North-Holland).
Lee, Chun I., Kimberly C. Gleason, and Ike Mathur, 2001, Trading rule profits in Latin American currency spot
rates, International Review of Financial Analysis 10, 135–156.
Lee, Chun I., and Ike Mathur, 1996, Trading rule profits in European currency spot cross-rates, Journal of Banking
and Finance, 20, 949–962.
Levich, Richard M., and Lee R. Thomas III, 1993, The significance of technical trading-rule profits in the foreign
exchange market: A bootstrap approach, Journal of International Money and Finance 12, 451–474.
Lo, Andrew W., 2004, The adaptive markets hypothesis: Market efficiency from an evolutionary perspective,
Journal of Portfolio Management 30th Anniversary Issue, 15–29.
Lo, Andrew W., and Jasmina Hasanhodzic, 2010, The Evolution of Technical Analysis: Financial Prediction from
Babylonian Tablets to Bloomberg Terminals (John Wiley and Sons, Hoboken, NJ).
Lo, Andrew W., and A. Craig MacKinlay, 1988, Stock prices do not follow random walks: Evidence from a simple
specification test, Review of Financial Studies 1, 41–66.
Lo, Andrew W., Harry Mamaysky, and Jiang Wang, 2000, Foundations of technical analysis: Computational
algorithms, statistical inference, and empirical implementation, The Journal of Finance 55, 1705–1770.
Lo, Andrew W., and Mark T. Mueller, 2010, WARNING: Physics Envy May Be Hazardous To Your Wealth, with
Mark Mueller, Journal of Investment Management 8, 13–63.
Logue, Dennis E., and Richard J. Sweeney, 1977, White noise in imperfect markets: The case of the franc/dollar
exchange rate, Journal of Finance 32, 761–768.
Lustig, Hanno, Nick Roussanov, and Adrien Verdelhan, 2010, Countercyclical currency risk premia, NBER
Working Paper 16427.
Martin, Anna D., 2001, Technical trading rules in the spot foreign exchange markets of developing countries,
Journal of Multinational Financial Management 11, 59–68.
McCormick, Frank, 1979, Covered interest arbitrage: Unexploited profits: Comment. Journal of Political Economy
87, 411–417.
Menkhoff, Lukas, 2010, The use of technical analysis by fund managers: International evidence, Journal of Banking
and Finance 34, 2573–2586.
30
Menkhoff, Lukas, Lucio Sarno, Maik Schmeling, and Andreas Schrimpf, 2010, Carry Trades and Global Foreign
Exchange Volatility, Journal of Finance, forthcoming.
Menkhoff, Lukas, and Ulrich Schmidt, 2005, The use of trading strategies by fund managers: Some first survey
evidence 37, 1719–1730.
Menkhoff, Lukas, and Mark P. Taylor, 2007, The obstinate passion of foreign exchange professionals: Technical
analysis, Journal of Economic Literature 45, 936–972.
Murphy, John J., 1986, Technical Analysis of the Futures Markets (New York Institute of Finance, Prentice-Hall,
New York, NY).
Neely, Christopher J., 1998, Technical analysis and the profitability of U.S. foreign exchange intervention, Federal
Reserve Bank of St Louis Review 80, 3–17.
Neely, Christopher J., 2002, The temporal pattern of trading rule returns and exchange rate intervention:
Intervention does not generate technical trading rule profits, Journal of International Economics 58, 211–232.
Neely, Christopher J., David E. Rapach, Jun Tu, and Guofu Zhou, 2010, Out-of-sample equity premium prediction:
Fundamental vs. technical analysis, Federal Reserve Bank of St. Louis Working Paper 2010-008B.
Neely, Christopher J. and Paul A. Weller, 1999, Technical Trading Rules in the European Monetary System,
Journal of International Money and Finance 18, 429–58.
Neely, Christopher J., and Paul A. Weller, 2003, Intraday technical trading in the foreign exchange market, Journal
of International Money and Finance 22, 223–237.
Neely, Christopher J., Paul A. Weller, and Robert Dittmar, 1997, Is technical analysis in the foreign exchange
market profitable? A genetic programming approach, Journal of Financial and Quantitative Analysis 32, 405–
426.
Neely, Christopher J., Paul A. Weller, and Joshua M. Ulrich, 2009, The adaptive markets hypothesis: Evidence from
the foreign exchange market, Journal of Financial and Quantitative Analysis 44, 467–488.
Nickerson, Raymond S., 1998, Confirmation bias: A ubiquitous phenomenon in many guises, Review of General
Psychology 2, 175–220.
Nison, Steve, 1991, Japanese Candlestick Charting Techniques: A Contemporary Guide to the Ancient Investment
Techniques of the Far East (Simon & Schuster, New York, NY).

31
Oberlechner, Thomas, and Carol Osler, 2008, Overconfidence in currency markets, Journal of Financial and
Quantitative Analysis (forthcoming).
Okunev, John, and Derek R. White, 2003, Do momentum-based strategies still work in foreign currency markets?
Journal of Financial and Quantitative Analysis 38, 425–447.
Olson, Dennis, 2004, Have trading rule profits in the currency markets declined over time? Journal of Banking and
Finance 28, 85–105.
Osler, Carol L., 2003, Currency orders and exchange rate dynamics: An explanation for the predictive success of
technical analysis, The Journal of Finance 58, 1791–1820.
Osler, Carol L., 2005, Stop-loss orders and price cascades in currency markets, Journal of International Money and
Finance 24, 219–241.
Osler, Carol L., and Kevin P.H. Chang, 1995, Head and shoulders: Not just a flaky pattern, Federal Reserve Bank
of New York Staff Report No. 4.
Park, Cheol-Ho, and Scott H. Irwin, 2007, What do we know about the profitability of technical analysis? Journal of
Economic Surveys 21, 786–826.
Poole, William, 1967, Speculative prices as random walks: An analysis of ten time series of flexible exchange rates,
Southern Economic Journal 33, 468–478.
Pring, Martin J., 1991, Technical Analysis Explained (McGraw-Hill, New York, NY).
Pukthuanthong-Le, Kuntara, Richard M. Levich, and Lee R. Thomas III, 2007, Do foreign exchange markets still
trend? The Journal of Portfolio Management 34, 114–118.
Pukthuanthong-Le, Kuntara, and Lee R. Thomas III, 2008, Weak-form efficiency in currency markets, Financial
Analysts Journal 64, 31–52.
Qi, Min, and Yangru Wu, 2006, Technical trading-rule profitability, data snooping, and reality check: Evidence
from the foreign exchange market, Journal of Money, Credit, and Banking 38, 2135–2158.
Rime, Dagfinn, Lucio Sarno, and Elvira Sojli, 2010, Exchange rate forecasting, order flow and macroeconomic
information, Journal of International Economics 80, 72–88.
Rosenberg, Michael R., and Eric A. Shatz, 1995, The Merrill Lynch Guide to Understanding and Using Technical
Analysis, Merrill Lynch and Co., Global Securities Research & Economics Group.

32
Savin, Gene, Paul A. Weller, and Jānis Zvingelis, 2007, The predictive power of “head-and-shoulders” price
patterns in the U.S. stock market, Journal of Financial Econometrics 5, 243–265.
Schulmeister, Stephan, 2006, The interaction between technical currency trading and exchange rate fluctuations,
Finance Research Letters 3, 212–233.
Schulmeister, Stephan, 2008, Components of the profitability of technical currency trading, Applied Financial
Economics 18, 917–930.
Schulmeister, Stephan, 2009, Aggregate trading behaviour of technical models and the yen/dollar exchange rate
1976-2007, Japan and the World Economy, 21, pages 270-279.
Schwager, Jack D., 1993, Market Wizards: Interviews with Top Traders (Harper-Collins, New York, NY).
Schwager, Jack D., 1995, The New Market Wizards: Conversations with America’s Top Traders (Wiley, New York,
NY).
Serban, Alina, 2010, Combining mean reversion and momentum trading strategies in foreign exchange markets,
Journal of Banking and Finance 34, 2720–2727.
Silber, William, 1994, Technical trading: When it works and when it doesn’t, Journal of Derivatives 1, 39–44.
Simon, Herbert, 1955, A behavioral model of rational choice, Quarterly Journal of Economics 69, 99–118.
Sullivan, Ryan, Allan Timmermann, and Halbert White, 1999, Data-snooping, technical trading rule performance,
and the bootstrap, Journal of Finance 54, 1647–1691.
Sweeney, Richard J., 1986, Beating the foreign exchange market, Journal of Finance 41, 163–182.
Sweeney, Richard J., 1988, Some new filter tests, methods and results, Journal of Financial and Quantitative
Analysis 23, 285–300.
Sweeney, Ronald J., and E.J.Q. Lee, 1990, International dimensions of securities and currency markets, in Raj
Aggarwal and Cheng-few Lee, eds.: Advances in Financial Planning and Forecasting Series, Volume 4 Part A
(JAI Press, Greenwich, CT).
Szakmary, Andrew C., and Ike Mathur, 1997, Central bank intervention and trading rule profits in foreign exchange
markets, Journal of International Money and Finance, 16, 513–535.
Taylor, Stephen J., 1992, Rewards available to currency futures speculators: Compensation for risk or evidence of
inefficient pricing? Economic Record 68, 105–116.

33
Taylor, Stephen J., 1994, Trading futures using a channel rule: A study of the predictive power of technical analysis
with currency examples, Journal of Futures Markets 14, 215–235.
Taylor, Mark P., and Helen Allen, 1992, The use of technical analysis in the foreign exchange market, Journal of
International Money and Finance 11, 304–314.
White, Halbert, 2000, A reality check for data snooping, Econometrica 68, 1097–1126.
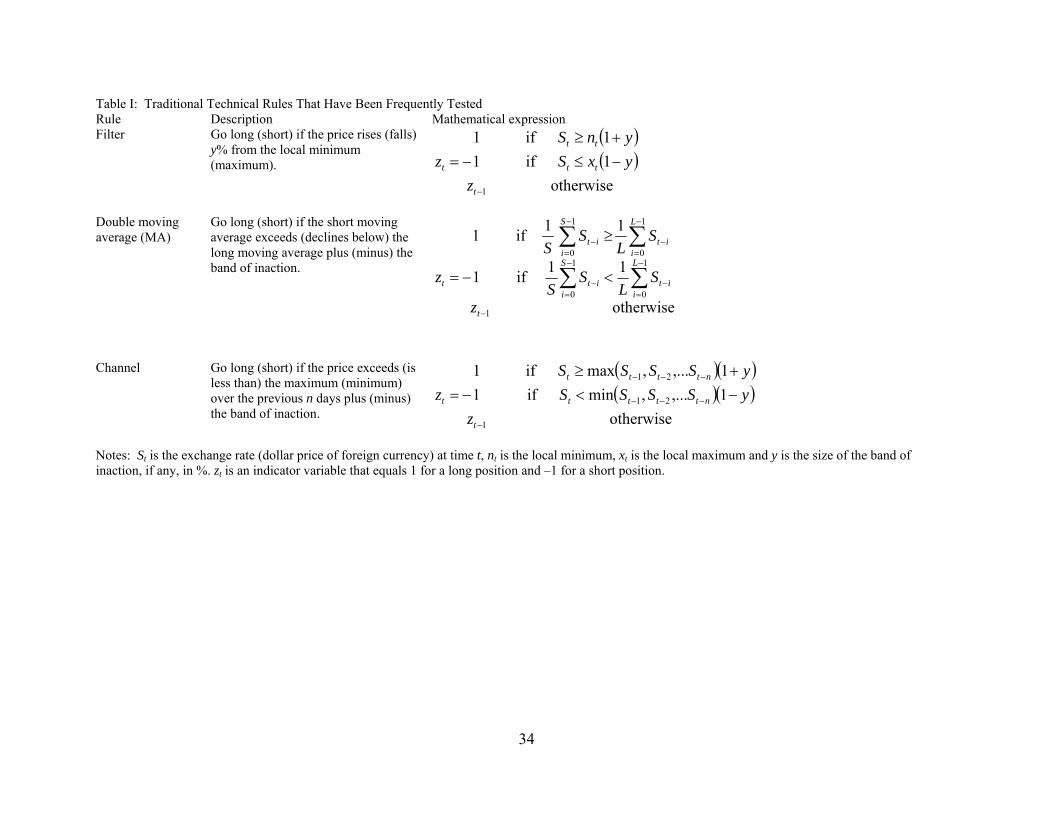
34
Table I: Traditional Technical Rules That Have Been Frequently Tested Rule Description Mathematical expression Filter Go long (short) if the price rises (falls)
y% from the local minimum (maximum).
otherwise
1if
1if
1
1
1
yxS
ynS
z
z tt
tt
t
t
Double moving average (MA)
Go long (short) if the short moving average exceeds (declines below) the long moving average plus (minus) the band of inaction.
otherwise
11if1
11if1
1
1
0
1
0
1
0
1
0
t
L
iit
S
iit
L
iit
S
iit
t
z
SL
SS
SL
SS
z
Channel Go long (short) if the price exceeds (is less than) the maximum (minimum) over the previous n days plus (minus) the band of inaction.
otherwise
1,...,minif
1,...,maxif
1
1
21
21
1
ySSSS
ySSSS
z
z ntttt
ntttt
t
t
Notes: St is the exchange rate (dollar price of foreign currency) at time t, nt is the local minimum, xt is the local maximum and y is the size of the band of inaction, if any, in %. zt is an indicator variable that equals 1 for a long position and –1 for a short position.
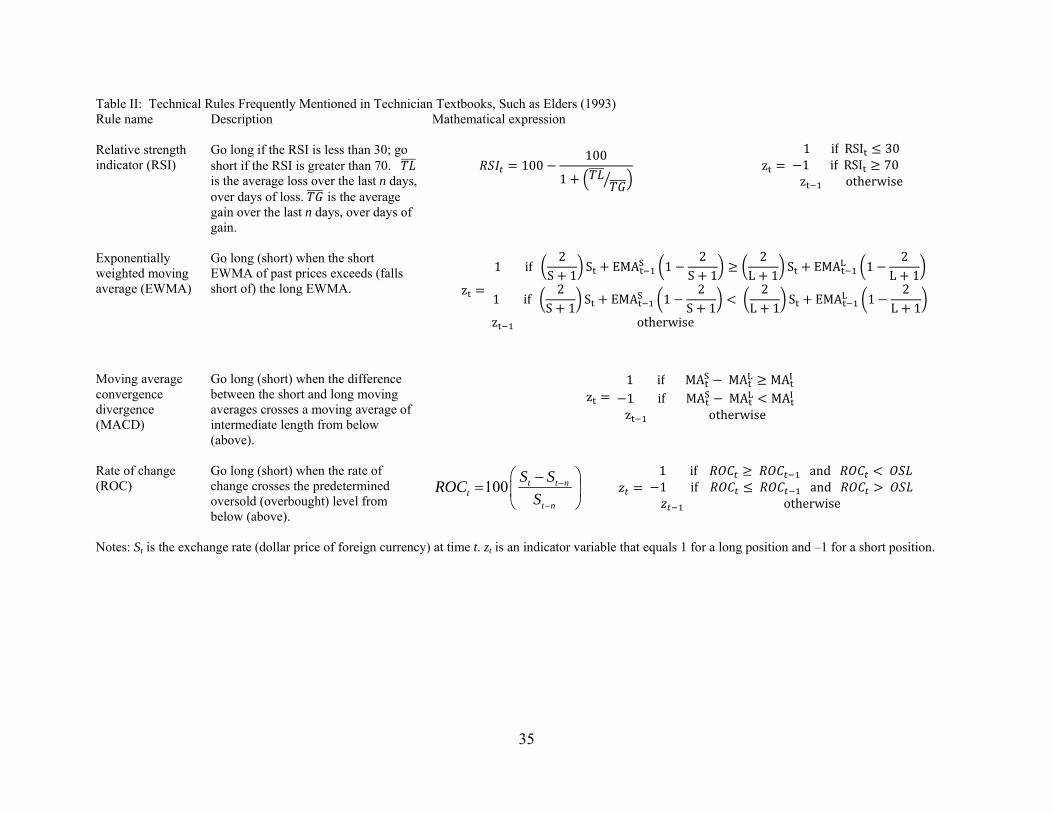
35
Table II: Technical Rules Frequently Mentioned in Technician Textbooks, Such as Elders (1993) Rule name Description Mathematical expression
Relative strength indicator (RSI)
Go long if the RSI is less than 30; go short if the RSI is greater than 70. is the average loss over the last n days, over days of loss. is the average gain over the last n days, over days of gain.
100100
1 z
1 if RSI 301 if RSI 70z otherwise
Exponentially weighted moving average (EWMA)
Go long (short) when the short EWMA of past prices exceeds (falls short of) the long EWMA. z
1 if2
S 1S EMAS 1
2S 1
2L 1
S EMAL 12
L 1
1 if 2
S 1S EMAS 1
2S 1
2
L 1S EMAL 1
2L 1
z otherwise
Moving average convergence divergence (MACD)
Go long (short) when the difference between the short and long moving averages crosses a moving average of intermediate length from below (above).
z 1 if MAS MAL MAI
1 if MAS MAL MAI
z otherwise
Rate of change (ROC)
Go long (short) when the rate of change crosses the predetermined oversold (overbought) level from below (above).
100 t t nt
t n
S SROC
S
1 if and1 if and
otherwise
Notes: St is the exchange rate (dollar price of foreign currency) at time t. zt is an indicator variable that equals 1 for a long position and –1 for a short position.
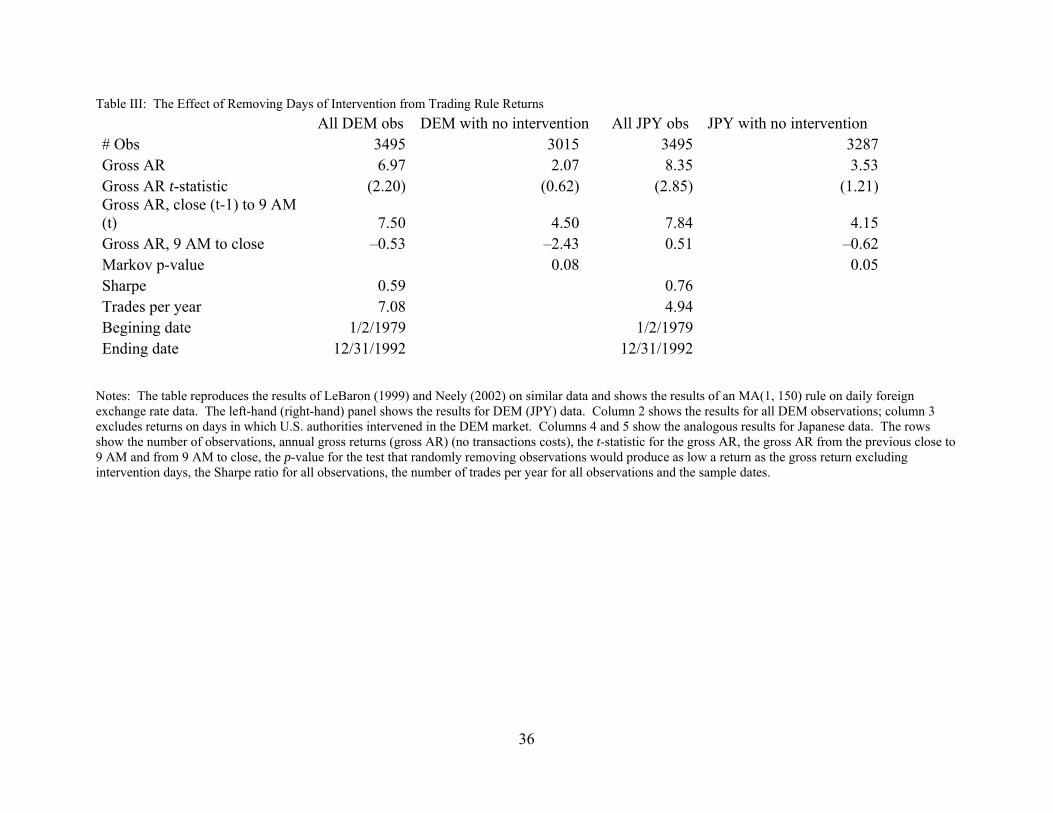
36
Table III: The Effect of Removing Days of Intervention from Trading Rule Returns
All DEM obs DEM with no intervention All JPY obs JPY with no intervention # Obs 3495 3015 3495 3287Gross AR 6.97 2.07 8.35 3.53Gross AR t-statistic (2.20) (0.62) (2.85) (1.21)Gross AR, close (t-1) to 9 AM (t) 7.50 4.50 7.84 4.15Gross AR, 9 AM to close –0.53 –2.43 0.51 –0.62Markov p-value 0.08 0.05Sharpe 0.59 0.76Trades per year 7.08 4.94Begining date 1/2/1979 1/2/1979Ending date 12/31/1992 12/31/1992
Notes: The table reproduces the results of LeBaron (1999) and Neely (2002) on similar data and shows the results of an MA(1, 150) rule on daily foreign exchange rate data. The left-hand (right-hand) panel shows the results for DEM (JPY) data. Column 2 shows the results for all DEM observations; column 3 excludes returns on days in which U.S. authorities intervened in the DEM market. Columns 4 and 5 show the analogous results for Japanese data. The rows show the number of observations, annual gross returns (gross AR) (no transactions costs), the t-statistic for the gross AR, the gross AR from the previous close to 9 AM and from 9 AM to close, the p-value for the test that randomly removing observations would produce as low a return as the gross return excluding intervention days, the Sharpe ratio for all observations, the number of trades per year for all observations and the sample dates.
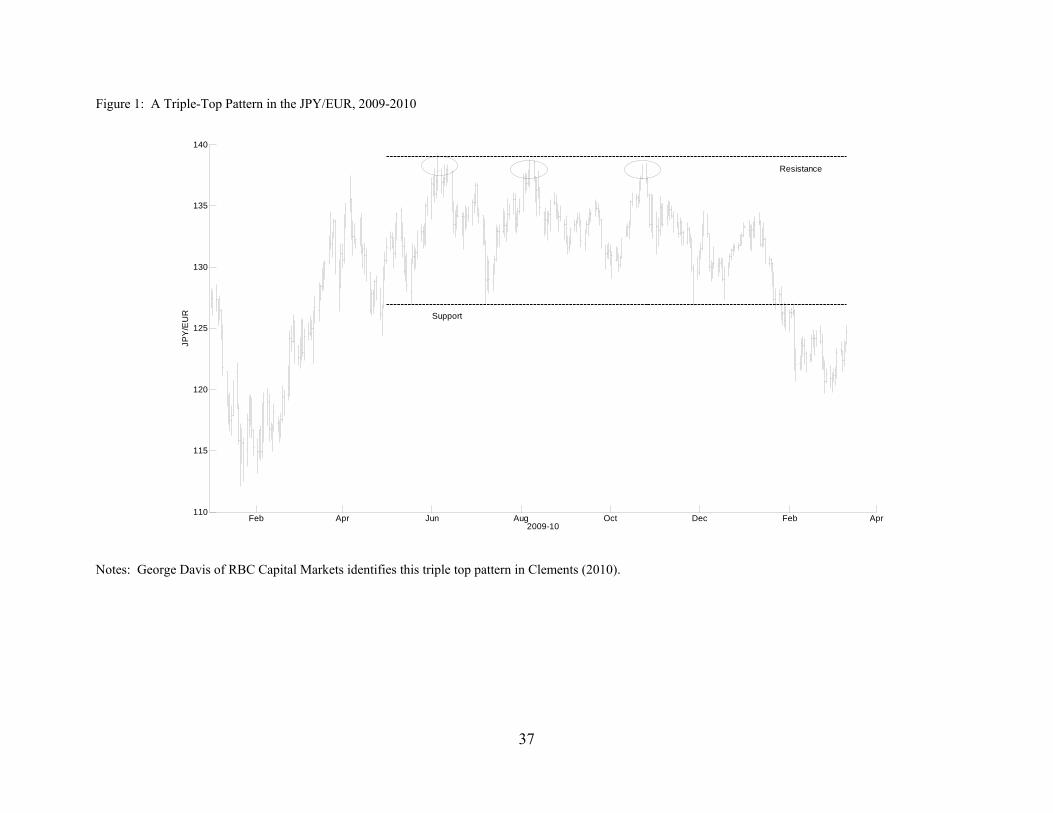
37
Figure 1: A Triple-Top Pattern in the JPY/EUR, 2009-2010
Notes: George Davis of RBC Capital Markets identifies this triple top pattern in Clements (2010).
Feb Apr Jun Aug Oct Dec Feb Apr110
115
120
125
130
135
140
2009-10
JPY
/EU
R Support
Resistance

38
Figure 2: A Head-and-Shoulders Pattern in the USD/DEM, 1991-1992
Sep Nov Jan Mar May0.57
0.58
0.59
0.6
0.61
0.62
0.63
0.64
0.65
0.66
1991-92
US
D/D
EM
Left Shoulder
Head
Right Shoulder
Neckline

39
Figure 3: The Diminishing Returns to Commonly Tested Technical Trading Rules, 1976–2010
Notes: One-year rolling net annual returns to portfolios made up of the commonly used filter and moving average trading rules used in Levich and Thomas (1993), as applied to the GBP/USD, CHF/USD, JPY/USD and DEM-EUR/USD. Horizontal black lines denote zero net returns; sloping red lines denote a fitted linear regression line with a constant and a time trend.
1980 1990 2000 2010-0.3
-0.2
-0.1
0
0.1
0.2GBP/USD Filter and MA Rules
Ave
rage
Ann
ual R
etur
n
1980 1990 2000 2010-0.2
-0.1
0
0.1
0.2
0.3CHF/USD Filter and MA Rules
Ave
rage
Ann
ual R
etur
n
1980 1990 2000 2010-0.2
-0.1
0
0.1
0.2
0.3
0.4
0.5JPY/USD Filter and MA Rules
Ave
rage
Ann
ual R
etur
n
1980 1990 2000 2010-0.2
-0.1
0
0.1
0.2
0.3DEM-EUR/USD Filter and MA Rules
Ave
rage
Ann
ual R
etur
n