Embed Size (px)
Citation preview

University of Calgary
PRISM: University of Calgary's Digital Repository
Graduate Studies Graduate Capstones
2018
Technical And Economic Feasibility Of Building A
Small Hydro Plant In Two Different Sites In Alberta
Ferrer, Cinthya Haybeth Caicedo
Ferrer, C. H. (2018). Technical And Economic Feasibility Of Building A Small Hydro Plant In Two
Different Sites In Alberta (Unpublished report). University of Calgary, Calgary, AB.
http://hdl.handle.net/1880/109768
report
University of Calgary graduate students retain copyright ownership and moral rights for their
thesis. You may use this material in any way that is permitted by the Copyright Act or through
licensing that has been assigned to the document. For uses that are not allowable under
copyright legislation or licensing, you are required to seek permission.
Downloaded from PRISM: https://prism.ucalgary.ca

UNIVERSITY OF CALGARY
Technical and economic feasibility of building a small hydro plant in two different sites in
Alberta
by
Cinthya Haybeth Caicedo Ferrer
A RESEARCH PROJECT SUBMITTED
IN PARTIAL FULFILMENT OF THE REQUIREMENTS FOR THE
DEGREE OF MASTER OF SCIENCE
GRADUATE PROGRAM IN SUSTAINABLE ENERGY DEVELOPMENT
CALGARY, ALBERTA
AUGUST, 2018
© Cinthya Haybeth Caicedo Ferrer 2018


iii
Abstract Hydropower has long been used due to the ease of producing energy via water. However,
construction of large dams has negative environmental impacts on wildlife as well as aquatic
ecosystems, due to large land requirements to support their development. Small dams present an
alternative to limit these known issues, with potential growth of around 77% in Canada alone. This
research aims to assess the technical and economic feasibility of building a small hydro facility at
two sites, in a pre-determined region of Alberta. Using a simplified Levelized Cost of Energy
model for each site, an evaluation will determine which is more ideal to be developed first.
Additionally, the environmental benefits of a large hydropower plant compared to a small
hydropower plant will be discussed. The results are expected to provide the company currently
investigating development at these sites with greater insight on how to proceed with project
development plans.

iv
Acknowledgements The success and final outcome of this project required a lot of guidance and assistance from many
people and I am extremely privileged to have received this all along the completion of my project.
All that I have done is only due to such supervision and assistance.
Sue Kuethe, without her guidance and persistent help this paper would not have been possible.
Dr. Irene Herremans, without her encouragement and guidance, this paper would not have
materialized.
Jim Floyd and Craig Parsons, thank you for providing me an opportunity to do this project. I
am extremely thankful to them for providing such a nice support and guidance
Dr. David Ince, who took keen interest on my project work and guided me all along, till the
completion of this paper.

v
Dedication A Dios siempre!
A mi madre Belén Ferrer y mi Padre Harry Caicedo, gracias por tanto amor y sacrificio. Gracias
por guiarme, inspirarme y mostrarme el camino correcto. Gracias por ayudarme a convertirme en
quién soy ahora. Sin su ejemplo, apoyo e inspiración nunca lo hubiera logrado
A mis hermanos Kelly Caicedo y Harry Caicedo, gracias por ser mi apoyo y brindarme su
comprensión. Aunque nos separe la distancia seguimos uno al lado del otro como si
estuviéramos cogidos de la mano, son el mejor regalo que me han dado mis padres
A mis ángeles en el cielo Ana Belén, Harry y Andrés. Daría mi vida entera para compartir este
momento de gran felicidad con ustedes. Gracias por iluminarme cuando más lo necesité
A mi madrina Flora Ferrer por darme todo su apoyo y siempre creer en mi y recordarme que al
final del camino todo siempre va a estar bien. Te llevo siempre en mi corazón, eres una segunda
madre para mi
A todos mis amigos Adriana, Eluvier, Rachel, Tere, Jose, Silvi, Emilio, Meli. Aunque separados
por la distancia, siempre me brindaron una voz de apoyo. Guardo a cada uno de ustedes en mi
corazón y espero poder devolverles tanto cariño y amor
Gracias a todos los que hicieron de este sueño una hermosa realidad

vi
Table of Contents
Approval Page .................................................................................................................................. i
Company Approval Page ................................................................................................................ ii
Abstract .......................................................................................................................................... iii
Acknowledgements ........................................................................................................................ iv
Dedication ....................................................................................................................................... v
Table of Contents ........................................................................................................................... vi
List of Tables ............................................................................................................................... viii
List of Figures and Illustrations ..................................................................................................... ix
List of Equations ............................................................................................................................. x
CHAPTER 1 INTRODUCTION .................................................................................................... 1
1.1 Multidisciplinary aspects ...................................................................................................... 2
1.1.1 Energy ............................................................................................................................ 2
1.1.2 Economics ...................................................................................................................... 2
1.1.3 Environment ................................................................................................................... 2
1.2 Background ........................................................................................................................... 3
1.2.1 Bow River Basin ............................................................................................................ 3
1.2.2 Alberta Climate Leadership Plan ................................................................................... 3
CHAPTER 2 LITERATURE REVIEW ......................................................................................... 5
2.1 Hydropower technologies ..................................................................................................... 5
2.2 Turbine technologies ............................................................................................................. 7
2.3 Levelized Cost of Energy ...................................................................................................... 8
CHAPTER 3 METHODOLOGY ................................................................................................. 10
CHAPTER 4 SYSTEM SIZE AND ENERGY CALCULATIONS ............................................ 12
4.1 Hydrology ........................................................................................................................... 13
4.2 Turbine selection ................................................................................................................. 18
4.2.1 Net Head ...................................................................................................................... 18

vii
4.2.2 Discharge Flow ............................................................................................................ 18
4.2.3 Kaplan Turbines ........................................................................................................... 19
4.2.4 Generators .................................................................................................................... 22
CHAPTER 5 FINANCIAL ANALYSIS ...................................................................................... 24
5.1 Capital Cost ......................................................................................................................... 24
5.2 Operation and Maintanance Cost ........................................................................................ 26
5.3 LCOE .................................................................................................................................. 26
5.3.1 LCOE Hydroelectric Model Outputs ........................................................................... 27
CHAPTER 6 ENVIRONMENTAL ASSESSMENT AND SOCIAL BENEFIT ........................ 31
6.1 Environmental Assesment .................................................................................................. 31
6.2 Social benefit ...................................................................................................................... 32
CHAPTER 7 CONCLUSIONS, LIMITATIONS AND FUTURE RESEARCH ........................ 34
7.1 Conclusions ......................................................................................................................... 34
7.2 Limitations .......................................................................................................................... 35
7.3 Future Research .................................................................................................................. 35
REFERENCES ............................................................................................................................. 37
APPENDIX A. SITE A AND B ANNUAL AVERAGE FLOW RATE .................................... 40
APPENDIX B. TOTAL INSTALLED HYDROPOWER CAPACITY ....................................... 41
APPENDIX C. RELATIONSHIP BETWEEN COSTS, POWER AND HEAD OF A SMALL
HYDROPOWER SCHEME ......................................................................................................... 42
APPENDIX D. ELECTRICITY GRID DISPLACEMENT AND GRID USAGE FACTORS ... 43

viii
List of Tables
Table 1. Assumptions for Power Output Calculations .................................................................. 16
Table 2. Site A and B Power Capacity (MW) .............................................................................. 17
Table 3. Site A and B Monthly Power Output (MWh) ................................................................. 17
Table 4. Range of Turbine Heads ................................................................................................. 18
Table 5. Site A LCOE Analysis Output ........................................................................................ 27
Table 6. Site B LCOE Analysis Output ........................................................................................ 27

ix
List of Figures and Illustrations
Figure 1. Installed Hydroelectric Capacity by Provinces (2014, in megawatts) ............................ 5
Figure 2. Typical “low head” hydropower plant with storage. ....................................................... 6
Figure 3. (A) Pelton wheel; (B) Francis turbine; (C) Kaplan turbine ............................................. 7
Figure 4. Site A Flow Duration Curve .......................................................................................... 14
Figure 5. Site B Flow Duration Curve .......................................................................................... 15
Figure 4. Turbine Selection – Typical Flow Ranges vs. Net Head ............................................... 19
Figure 5. (a) Basic layout of a Kaplan turbine. (b) turbines normalized efficiency curves .......... 20
Figure 6. Site A Power Output (MWh) VS. Number of Turbine Units ........................................ 21
Figure 7. Site B Power Output (MWh) VS. Number of Turbine Units ........................................ 22
Figure 8. Hydro Generator Turbine .............................................................................................. 23
Figure 9. Total installed cost breakdown by component and capacity weighted ......................... 25
averages for 25 hydropower projects in Asia ............................................................................... 25
Figure 10. LCOE Site A and Site B Comparison ......................................................................... 28
Figure 11. 4 Turbines units scenario NPV VS. IRR and PBP ...................................................... 29
Figure 12. 3 Turbines Scenario NPV VS. IRR and PBP .............................................................. 29
Figure 13. 2 Turbines Scenario NPV VS. IRR and PBP .............................................................. 30
Figure 14. Summary of life cycle GHG emissions from hydropower .......................................... 31

x
List of Equations
Equation 1. Levelized Cost of Energy ............................................................................................ 8
Equation 2. Formula for Hydropower Output ............................................................................... 12
Equation 3. Formula for Hydropower Efficencies ........................................................................ 12

1
Chapter 1 Introduction
Hydropower is the form of renewable energy that is most widely used in the world and
currently provides 17.5% of the world’s electricity. In Canada, hydropower represents 60% of
Canada’s electricity generation (Natural Resources Canada, 2017) however, even though,
hydropower is considered a clean type of energy generation, it has substantial environmental
impacts throughout its entire lifecycle, mostly related to the large amount of land needed as well
as the effect on wildlife and the aquatic ecosystem.
Water is the most available resource in the world, but as the demand for electricity
increases, building a dam presents social and environmental concerns for the population around it
as well as economic impacts related to the cost and time associated with its construction.
Nevertheless, hydropower still has potential for growth, and small hydroelectric, represents an
alternative for remote communities to gain access to affordable and clean electricity without the
negative effects that come with building a dam.
My research project assesses the technical and economic feasibility of building a micro-
hydro facility in two different sites at pre-determined location in Alberta. The first objective of
this research is to determine the technical feasibility of building a small hydroplant in each of the
two sites, Site A and Site B. The second objective is to determine which of the two sites is more
economically feasible for development, to determine at which site a micro-hydro facility should
be developed first. Finally, the environmental benefits and challenges of building a micro-hydro
plant will be evaluated and compared to the environmental impacts of building a large dam in
those specific locations.
2
The technical aspects for establishing the generation plants will be considered in combination with
the Levelized Cost of Energy (LCOE) and will provide the company with better insight from an
economic perspective of whether or not to proceed with its project development plan.
1.1 Multidisciplinary aspects
1.1.1 Energy
The energy dimension will be evaluated by first analyzing the annual flow rate of the river
over the last ten years where the micro-hydro installation is being contemplated; this will allow
for calculation of the size of the system and the type of turbine that is most appropriate for use.
1.1.2 Economics
To assess the economic dimension, a simplified Levelized Cost of Energy (LCOE) analysis
will be undertaken for each site. The LCOE is a method commonly used to evaluate project
feasibility, it assesses how the cost per MWh for the energy generated at the site will affect the
return on the investment. By comparing the final LCOE for each site, this analysis will allow the
company to make a decision as to which of the two sites should be developed first from an
economic perspective.
1.1.3 Environment
During its operation, hydropower does not cause Greenhouse Gas (GHG) emissions
because it uses water coming from a river or lake to convert kinetic energy to electricity by using
a turbine. However, during its construction and dismantling, the machinery used is commonly
powered by fossil fuels, meaning that large hydropower projects also contribute to the GHG
emissions. Likewise, depending on their size (large or small), there could be other impacts on land
use, wildlife and aquatic ecosystems. The implications of development on these aspects were
analysed in this project.

3
1.2 Background
1.2.1 Bow River Basin
The Bow River runs through the most populated region of Alberta, intersecting cities such
as Banff, Canmore, Cochrane and Calgary (George, Tymensen, & Rood, 2002) . The Bow River
is also one of the most extensively dammed rivers, it has several hydroelectric projects along its
river bed. Due to its lenght, the Bow River can be divided into three sections: upper, middle and
lower Bow River. In the upper side its streamflow is high but it is more prone to drought due to
the irrigation deviation as it reaches the lower section. There are three main irrigation diversions
in the Bow River, the Western (WID) Irrigation District located in the City of Calgary, the Bow
River Irrigation Diversion (BRID) near to the town of Carseland and the Eastern Irrigation District
(EID) near to the town of Bassano (George et al., 2002).
For the purpose of this project, the focus will be on the lower side of the river where WID
and EID are located. Currently, the dams built in these locations, are only used for flood control,
irrigation and recreational porpuses. The main objective was to evaluate the potential of adding
value by building a small hydroelectric plant to generate electricity from them.
1.2.2 Alberta Climate Leadership Plan
Alberta’s plan to take action on climate change and protect the province’s health and
environment is described in the Alberta Climate Leadership Plan (ACLP). The key aspects of the
CLP (Government of Alberta, 2016) are:
• “implementing a new carbon price on greenhouse gas emissions”
• “ending pollution from coal-generated electricity by 2030”
• “developing more renewable energy”
• “capping oil sands emissions to 100 megatons per year”

4
• “reducing methane emissions by 45% by 2025”
In order for Alberta to achieve its reduction targets in CO2 emissions and the overall goals, it
will be necessary to increase the use of clean power. Interestingly, Alberta is only considering an
increase of 5% of electricity coming from hydroelectric plants (Alberta Electric System Operator,
2017). This research provide some insight on how to improve and add value to the existing
hydroelectric projects in Alberta and thus increase the use of clean energy that can benefit the
province from an economic, social and environmental perspective.

5
Chapter 2 Literature Review 2.1 Hydropower technologies
Hydropower is one of the technologies that has grown to the greatest extent in the last few
years and is accountable for almost four-fifths of the world’s renewable electricity (International
Renewable Energy Agency (IRENA), 2012). In 2014, Canada had 542 hydroelectric stations with
a total installed capacity of 78,359 MW (Natural Resources Canada, 2017). Quebec and British
Columbia are the provinces that have developed this technology to the greatest extent, however,
there is still significant potential for growth and this is where small hydro can play an important
role. The potential capacity for small hydro is about 15,000 MW. Currently, small hydro installed
capacity in Canada is about 3,400 MW (Natural Resources Canada, 2016) which means there is a
77% potential for growth.
Figure 1. Installed Hydroelectric Capacity by Provinces (2014, in megawatts)
Source: (Natural Resources Canada, 2017)
Hydropower generates electricity by converting kinetic energy of falling water into
mechanical energy through a turbine which spins an electricity generator to produce electricity.
From there the electricity is transported through the transmission and distribution lines for

6
commercial or domestic use. The water used is then sent back to the river and continues to flow
downstream.
Figure 2. Typical “low head” hydropower plant with storage.
Source: (International Renewable Energy Agency (IRENA), 2012)
Hydropower is classified as ‘large’ or ‘small’, depending on its capacity and the electricity
demand that needs to be supplied. This research project focused mainly on small hydropower or
systems with an installed capacity of less than 50 MW, using the definition of ‘small’ contained
in the Canadian regulations. It is important to describe the different types of hydropower
generation in order to allow for comparison. Further references are provided later in this document.
The classifications are as follows:
• Run-of-river usually does not have storage capacity, and its generation depends on the
river flow.
• Reservoir (Storage) has the ability to store water using a dam to control the water flow
to provide consistent supply of electricity.
• Pumped Storage commonly used to pump water during times of low-peak electricity,
storing water in a reservoir so that water can be used during high-peak.

7
All of these hydropower systems can be built in a variety of sizes and capacities. Which
size or capacity is chosen will ultimately depend on the location and hydrological characteristics
of the site, as well as whether there is availability for connection to the grid or opportunity for use
in remote locations
2.2 Turbine technologies
Turbine selection will have a direct effect on the capital cost of the project as well as in the
sizing of the system. Turbines play an important role in the process of converting the energy of
water flow to mechanical energy. Turbines can be divided into two major categories, reaction and
impulse. The main difference between the two, is the way they absorb the energy from water.
Impulse turbines are driven by high velocity jets of water produced by a high head of water, a good
example of an impulse turbine is the Pelton turbine. Reaction turbines on the other hand, react to
the weight of the water flowing through the turbine; Francis and Kaplan turbines are examples of
this type of hydropower generation. Figure 3 shows the three main types of turbines technologies.
Figure 3. (A) Pelton wheel; (B) Francis turbine; (C) Kaplan turbine
Source: (Oregon State University, 2018)
8
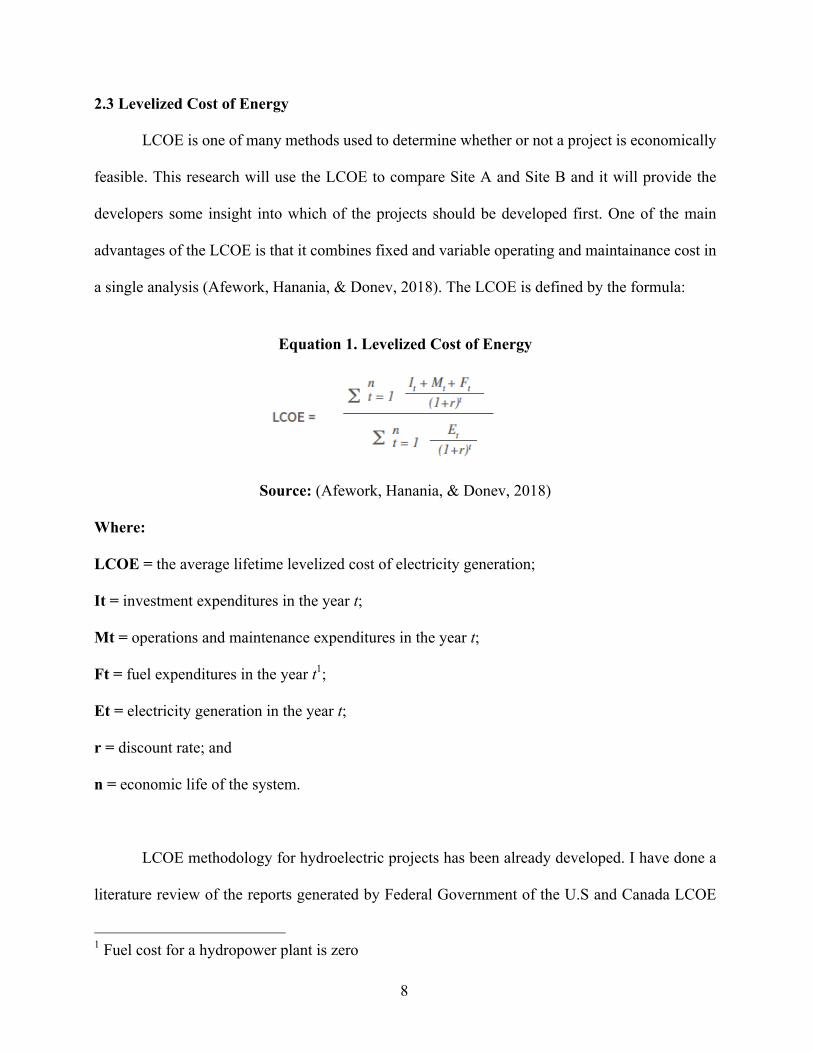
2.3 Levelized Cost of Energy
LCOE is one of many methods used to determine whether or not a project is economically
feasible. This research will use the LCOE to compare Site A and Site B and it will provide the
developers some insight into which of the projects should be developed first. One of the main
advantages of the LCOE is that it combines fixed and variable operating and maintainance cost in
a single analysis (Afework, Hanania, & Donev, 2018). The LCOE is defined by the formula:
Equation 1. Levelized Cost of Energy
Source: (Afework, Hanania, & Donev, 2018) Where:
LCOE = the average lifetime levelized cost of electricity generation;
It = investment expenditures in the year t;
Mt = operations and maintenance expenditures in the year t;
Ft = fuel expenditures in the year t1;
Et = electricity generation in the year t;
r = discount rate; and
n = economic life of the system.
LCOE methodology for hydroelectric projects has been already developed. I have done a
literature review of the reports generated by Federal Government of the U.S and Canada LCOE
1 Fuel cost for a hydropower plant is zero

9
reports for hydropower, to assist in the evaluation of how the performance of this potential project
would compare to similar hydropower projects in Canada and around the world.

10
Chapter 3 Methodology
This research project evaluates the economic and environmental impacts of building a
small hydropower plant in two different sites in Alberta. In Canada, any hydropower generation
between 1 – 50 Megawatts (MW) of installed capacity is considered a small hydropower plant
(Natural Resources Canada, 2016), installations at both of the sites under consideration would fall
into this category. In order to assess the technical feasibility of each site, the hydrology reports of
the last 10 years were reviewed. These reports were found in the Canadian Government page
(Government of Canada, 2018), and are generated by taking the flow rate readings at the discharge
point of each location. The hydrology reports contain information on the monthly and daily river
flow rate mainly for the Spring, Summer and part of the Fall season. These reports were critical in
determining the amount of energy available, which is defined as the capacity that can be generated
from the river using a turbine as explained in Chapter 2. This flow rate combined with the height
or head of the flow will determine wich specific turbine system is most appropriate for use. Further
explanation of the methods used for energy calculations will be given in Chapter 4.
There are two scenarios to be considered for each location:
• For Site A: electricity will be generated from the surplus water falling over the dam
spillway. A spillway is a specific structure in a Dam that allows the water to make its
way downstream when the dam storage capacity is full.
• For Site B: electricity will be generated from the surplus water falling over the weir. A
weir is a small obstruction that raises the level of the stream of a river, this allows the
river to store some of the water behind it while still allowing water to flow.
The other main focus of the project will be the LCOE, as this parameter would be the driver to
choose which of the two projects is better to be developed first. The LCOE is determined by factors

11
that include the installed capital cost of each project, capacity factor, cost per Megawatt-hour
($/MWh), operations and maintainance costs and the discount rate. Some of these variables will
depend also on the system size, therefore, a sensitivity analysis was also needed to evaluate which
system was more cost effective.
Lastly, a literature review of the environmental impacts was undertaken by comparing the
lifecycle GHG emissions of a large dam (a system greater than 50 MW) and a small hydro (a
system less than 50 MW). The impacts for land use, wildlife and aquatic ecosystems was also
discussed.
12
Chapter 4 System size and energy calculations
The energy that can be expected from a hydropower site is one of the most important
aspects used to determine its feasibility for development. The potential energy generated will
depend on aspects such as river flow at the discharge point (also know as catchment area),
topography and system efficiencies.
Run-of-river hydroelectric facilities use the water flow and elevation drop (i.e. head) of
streams to generate power. These hydroelectric projects can be contructed with a small diversion
dam and send the water through a penstock to the power house where the turbine and the generator
will transform the kenetic energy of the water flow into electricity.
For this study, I looked at the flow rates of the Bow River in both Site A and Site B
locations, as well as the technical specifications of the site such as the head height (spillway and
weir) and the system efficiencies.
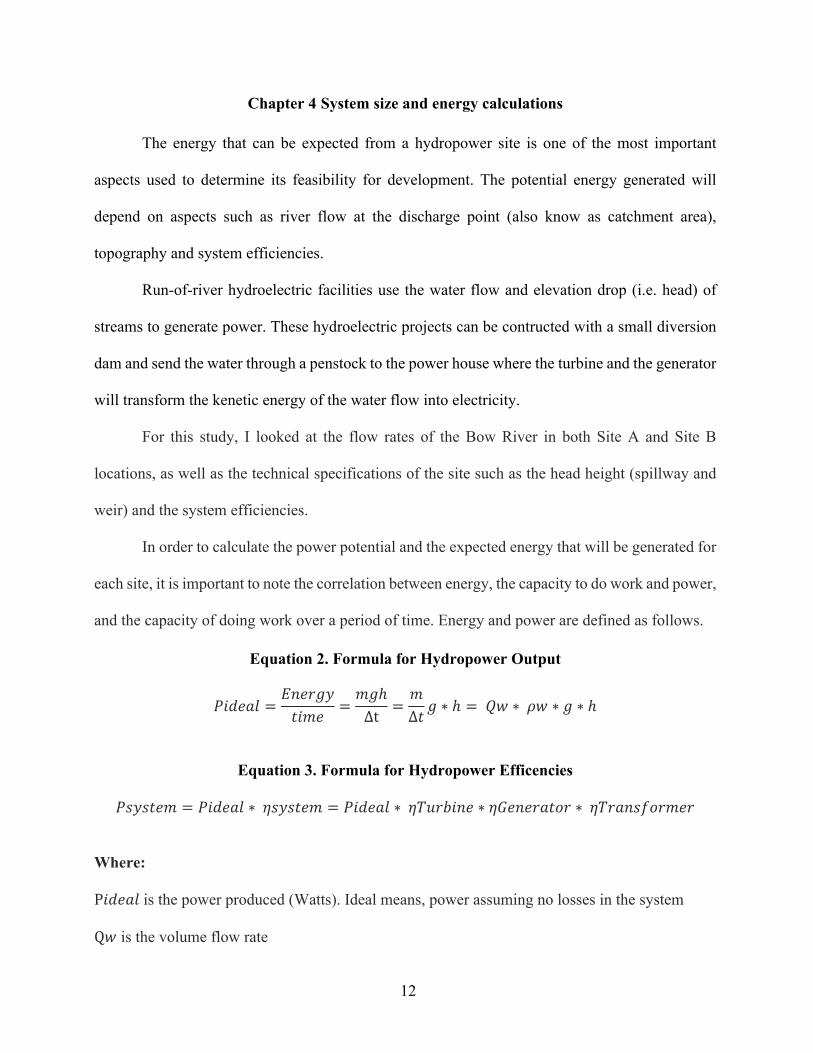
In order to calculate the power potential and the expected energy that will be generated for
each site, it is important to note the correlation between energy, the capacity to do work and power,
and the capacity of doing work over a period of time. Energy and power are defined as follows.
Equation 2. Formula for Hydropower Output
!"#$%& =()$*+,-".$ =
.+ℎΔt =
.∆- + ∗ ℎ = 56 ∗ 76 ∗ + ∗ ℎ
Equation 3. Formula for Hydropower Efficencies
!8,8-$. = !"#$%& ∗ 98,8-$. = !"#$%& ∗ 9:;*<")$ ∗ 9=$)$*%->* ∗ 9:*%)8?>*.$*
Where:
P"#$%&is the power produced (Watts). Ideal means, power assuming no losses in the system
Q6 is the volume flow rate

13
76 is the water density (1000 Kg/m3)
+ is the acceleration due to gravity (m/s2)
ℎ is the net head (m)
hsystem is the product of multiplying all the efficiencies from the turbine to the transformer
Therefore, if you have a relatively low gross head of 5 metres, and a turbine that could
take a maximum flow rate of 5 m3/s, the maximum power output of the system (replacing in
equation 2 and 3) would be:
!8,8-$. B = 5D5D9.8D85%D95%D93%D90%2
!8,8-$. B = 165.5 4.1 Hydrology
The first step in the power calculations is to estimate the annual river flow in each station
at the discharge point. It is important to take the the station information as it is the actual flow that
will run through the run-of-river hydroelectric facility when built. Appendix A, Figure 15 and
Figure 16 show the average annual flow for Site A and Site B for the last 11 years.
The flow rate for both sites is similar with an average flowrate per year of 96 m3/s for site A
and 117 m3/s for site B for the past eleven years. Having that information, it was possible to
determine the annual power capacity for each site. However, the turbine selection and LCOE
calculations were not only based on the average annual flow rate, because months such as June or
July have higher volumes of flow due to the spring run off, that increases flow during those months,
this effect significantly increases the annual average value. Furtheremore, in order for the system
to maximize the operation by running the full year, a minimum discharge flow of the river needs
to be calculated for each site.
2 Typical efficiency values for hydropower
14
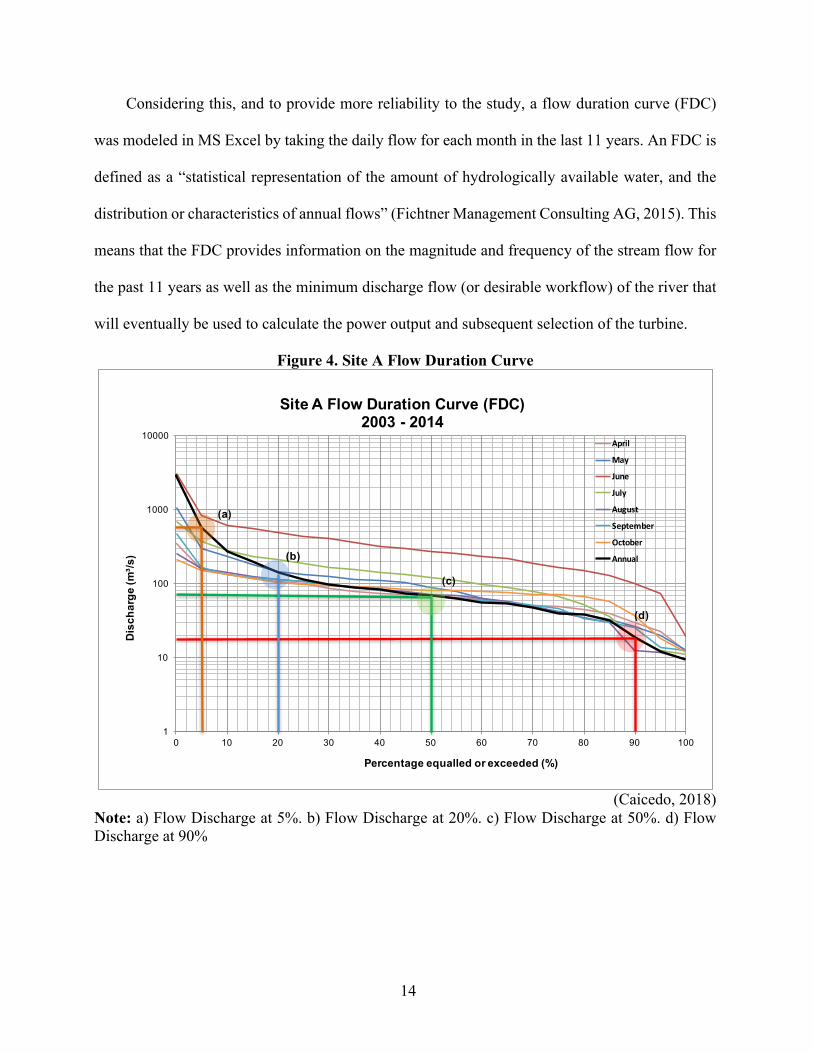
Considering this, and to provide more reliability to the study, a flow duration curve (FDC)
was modeled in MS Excel by taking the daily flow for each month in the last 11 years. An FDC is
defined as a “statistical representation of the amount of hydrologically available water, and the
distribution or characteristics of annual flows” (Fichtner Management Consulting AG, 2015). This
means that the FDC provides information on the magnitude and frequency of the stream flow for
the past 11 years as well as the minimum discharge flow (or desirable workflow) of the river that
will eventually be used to calculate the power output and subsequent selection of the turbine.
Figure 4. Site A Flow Duration Curve
(Caicedo, 2018)
Note: a) Flow Discharge at 5%. b) Flow Discharge at 20%. c) Flow Discharge at 50%. d) Flow Discharge at 90%
1
10
100
1000
10000
0 10 20 30 40 50 60 70 80 90 100
Disc
harg
e (m
³/s)
Percentage equalled or exceeded (%)
Site A Flow Duration Curve (FDC)2003 - 2014
April
May
June
July
August
September
October
Annual
(a)
(b)
(c)
(d)

15
Figure 5. Site B Flow Duration Curve
(Caicedo, 2018)
Note: a) Flow Discharge at 5%. b) Flow Discharge at 20%. c) Flow Discharge at 50%. d) Flow Discharge at 90%
Looking at the values of the minimum discharge flow and P50 3 flow, what those values
represent for the case of Site A means that a flow of 18 m3/s was equalled or exceeded at least
90% of the time in the last 11 years, and for the case of Site B a flow of 53 m3/s was equalled or
exceeded at least 90% of the time in the last 11 years.
It is important to point out that there are no records for the winter season (from November
to March) for the last ten years, therefore, it was necessary to assume an average value for those
3 P50 refers to the percentile 50. This value represents that at least 50% of the time that flow rate was equaled or exceeded.
1
10
100
1000
10000
0 10 20 30 40 50 60 70 80 90 100
Disc
harg
e (m
³/s)
Percentage equalled or exceeded (%)
SiteBFlowDurationCurve(FDC)2003- 2014
April
May
June
July
August
September
October
Annual
(a)
(b)
(d)(c)
16
months based on offset information from more than 100 years. Recent reports have shown that
little flow variation has occurred for winter over the years (Government of Canada, 2018).
The values chosen from FDC are within the area where the curve is flatter, suggesting low
flow fluctuations. These values will be later optimized with the LCOE.
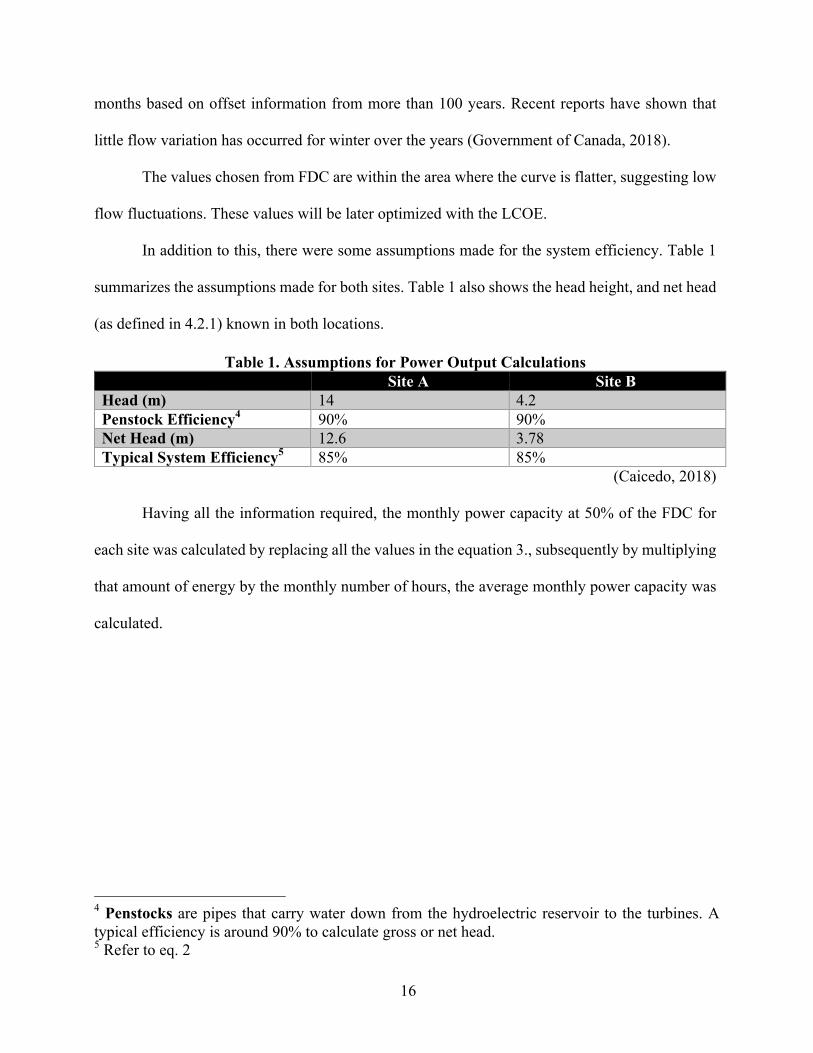
In addition to this, there were some assumptions made for the system efficiency. Table 1
summarizes the assumptions made for both sites. Table 1 also shows the head height, and net head
(as defined in 4.2.1) known in both locations.
Table 1. Assumptions for Power Output Calculations Site A Site B Head (m) 14 4.2 Penstock Efficiency4 90% 90% Net Head (m) 12.6 3.78 Typical System Efficiency5 85% 85%
(Caicedo, 2018)
Having all the information required, the monthly power capacity at 50% of the FDC for
each site was calculated by replacing all the values in the equation 3., subsequently by multiplying
that amount of energy by the monthly number of hours, the average monthly power capacity was
calculated.
4 Penstocks are pipes that carry water down from the hydroelectric reservoir to the turbines. A typical efficiency is around 90% to calculate gross or net head. 5 Refer to eq. 2

17
Table 2. Site A and B Power Capacity (MW)
Average Energy Output (MW)
Site A Site B Jan 3.5 1.7 Feb 3.5 1.8 Mar 4.9 2.0 Apr 6.4 2.2 May 8.4 3.3 Jun 24.9 8.1 Jul 11.3 4.5 Aug 6.7 2.8 Sep 6.4 2.5 Oct 7.5 2.4 Nov 5.0 1.7 Dec 3.6 1.8
(Caicedo, 2018)
Table 3. Site A and B Monthly Power Output (MWh) Power Output (MWh)
per Month
Site A Site B Jan 2607.15 1268.40 Feb 2593.35 1359.44 Mar 3662.42 1496.01 Apr 4724.59 1608.78 May 6228.18 2451.96 Jun 18553.51 6031.61 Jul 8414.60 3341.70 Aug 5003.93 2110.55 Sep 4772.87 1869.49 Oct 5614.33 1782.59 Nov 3717.60 1284.95 Dec 2680.26 1303.57
(Caicedo, 2018)
18
4.2 Turbine selection
Turbines play an important role in any type of hydroelectric project, as mentioned before,
the turbines and the generators convert the kenetic energy coming from the river flow into
mechanical energy. Turbine selection depends on how much flow and net head height are available
for the site. Turbine selection also depends on other factors such as rotational speed and cavitation.
However, to simplify this research, only flow and head were considered.
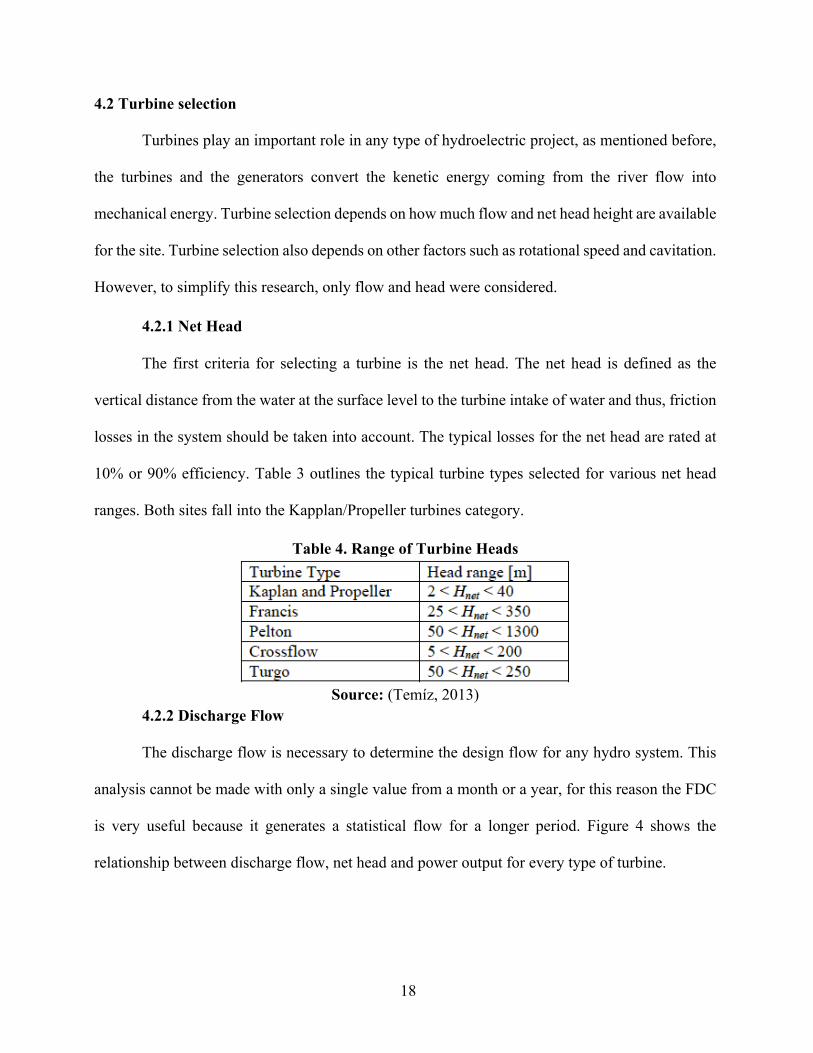
4.2.1 Net Head
The first criteria for selecting a turbine is the net head. The net head is defined as the
vertical distance from the water at the surface level to the turbine intake of water and thus, friction
losses in the system should be taken into account. The typical losses for the net head are rated at
10% or 90% efficiency. Table 3 outlines the typical turbine types selected for various net head
ranges. Both sites fall into the Kapplan/Propeller turbines category.
Table 4. Range of Turbine Heads
Source: (Temíz, 2013)
4.2.2 Discharge Flow
The discharge flow is necessary to determine the design flow for any hydro system. This
analysis cannot be made with only a single value from a month or a year, for this reason the FDC
is very useful because it generates a statistical flow for a longer period. Figure 4 shows the
relationship between discharge flow, net head and power output for every type of turbine.

19
Figure 4. Turbine Selection – Typical Flow Ranges vs. Net Head
Source: (Santos Alves Pereira, Magahaes Sobrinho, & Luz Silveira, 2015)
After reviewing both sites characteristics, the most suitable turbine is the Kaplan for Site
A. For Site B a Kaplan turbine could be suitable as well, but due to the the head height a smaller
variation of the Kaplan, it is expected that a bulb-turbine would work better and would also
represent a lower cost for the project.
4.2.3 Kaplan Turbines
Kaplan turbines are propeller turbines that have adjustable blades, this characteristic allows
these turbines to have higher efficiencies. Kaplan turbines are widely used for power generation
where conditions are variable but mostly where there is low hydraulic head (Renewables First,
2014). There are a wide variety of Kaplan turbines: Propeller, Bulbs, Pit, Straflo, S, VLH, and
Tyson.

20
Figure 5. (a) Basic layout of a Kaplan turbine. (b) turbines normalized efficiency curves (b)
Source: (Renewables First, 2014)
After civil work, the cost associated with the electrical equipment (turbine, generators, etc.)
could represent, in some cases, up to 50% of the total capital cost of the project (Helston & Farris,
2017). Selecting the type of turbine is important, but it is also important to determine the number
of units required to achieve the requirements of the system at a lower cost.
If only one turbine unit is installed, the system will have the disadvantage of having
disruptions when the discharge flow is low, resulting in no power generation. On the other hand,
if a fourth turbine is installed, it can only be used for less than 33% of the time and the project will
have a higher capital cost. Considering the nature of Site A and B during the winter season, where
the streamflow tends to decrease, it is recommended that two to three units are used to guarantee
a more constant level of power generation throughout the whole year, even when the streamflow
is low.
It was necessary to estimate the quantity of turbines versus the power output per month
(MWh) to determine whether two units or three units were appropriate for the system.
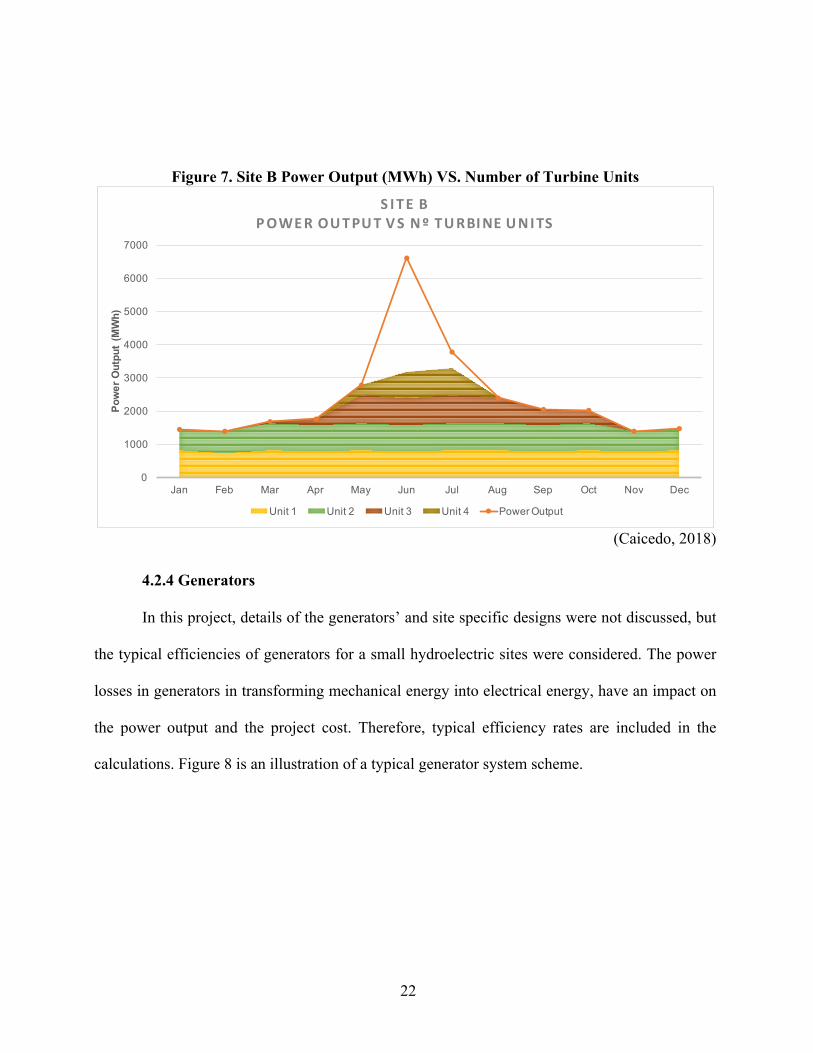
From Figures 6 and 7 it can be inferred that in order for both sites to generate electricity for
a full year, two or three units should be used. Months with low streamflow could easily generate

21
adequate power with only one turbine, but the flow discharge for months like June, July and
August will be significantly higher, having the capacity to produce more energy.
Regardless of what design is chosen, the results of power output must also be compared with
the associated cost before making a final decision. As observed in Figures 6 and 7, two turbines
can be used 80% - 100% of the time in both sites but a third or fourth turbine can be only used
15% - 35% of the time. Adding more turbines will increase the capital cost but this will not
necesarly translate into more efficiency or energy generation.
Figure 6 and 7 show the power that could be generated in each location (dot line) versus the
amount of turbines needed (shaded area) to generate that power. In both cases between May and
July, more than 4 turbines units could be utilized, but for the reasons explained before in this
chapter, more than 4 turbines represent higher capital cost. The unshaded area shown below
represents the power that would not be generated or that would be “lost”.
Figure 6. Site A Power Output (MWh) VS. Number of Turbine Units
(Caicedo, 2018)
0
5000
10000
15000
20000
25000
Jan Feb Mar Apr May Jun Jul Aug Sep Oct Nov Dec
Pow
er O
utpu
t (M
Wh)
S ITE APOWEROUTPUTVS Nº TURBINEUNITS
Unit 1 Unit 2 Unit 3 Unit 4 Power output
22
Figure 7. Site B Power Output (MWh) VS. Number of Turbine Units
(Caicedo, 2018)
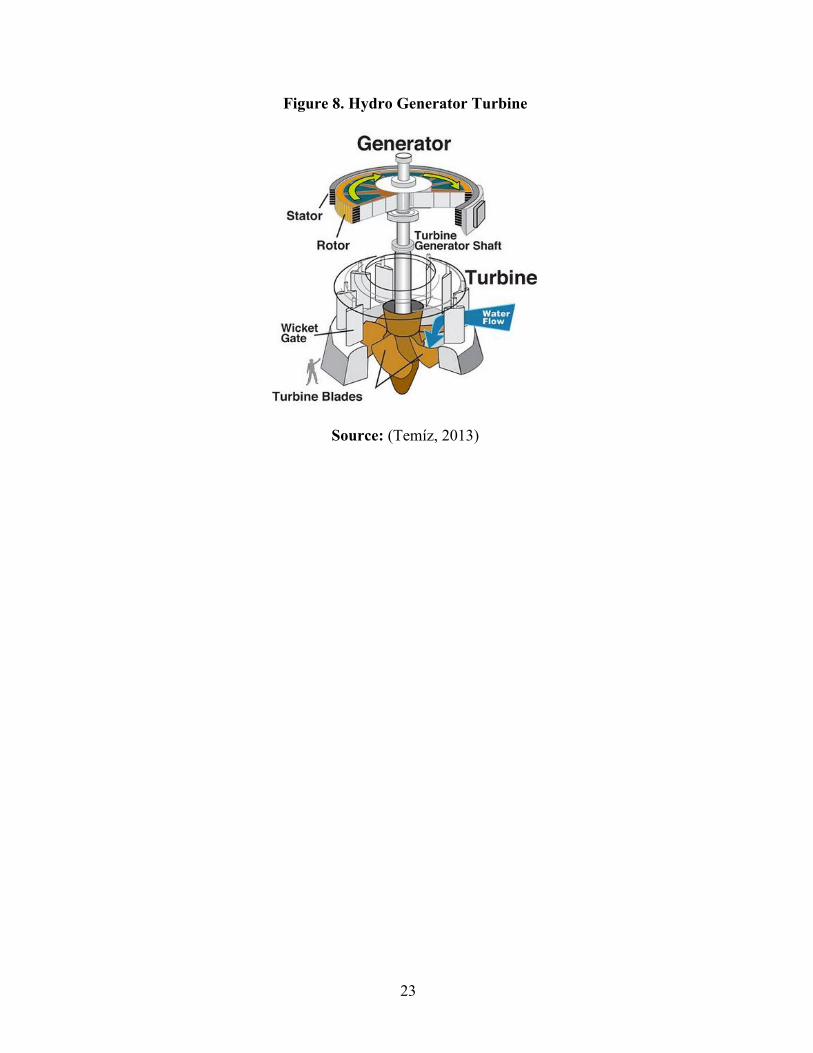
4.2.4 Generators
In this project, details of the generators’ and site specific designs were not discussed, but
the typical efficiencies of generators for a small hydroelectric sites were considered. The power
losses in generators in transforming mechanical energy into electrical energy, have an impact on
the power output and the project cost. Therefore, typical efficiency rates are included in the
calculations. Figure 8 is an illustration of a typical generator system scheme.
0
1000
2000
3000
4000
5000
6000
7000
Jan Feb Mar Apr May Jun Jul Aug Sep Oct Nov Dec
Pow
er O
utpu
t (M
Wh)
S ITE BPOWEROUTPUTVS Nº TURBINEUNITS
Unit 1 Unit 2 Unit 3 Unit 4 Power Output
23
Figure 8. Hydro Generator Turbine
Source: (Temíz, 2013)

24
Chapter 5 Financial Analysis
A Levelized Cost of Electricity (LCOE) is used as a simplified representation of the cost
per megawatt hour of building and operating a power generation plant over an assumed lifespan
or lifecycle (EIA, 2018). The cost analysis for a run-of-river hydro generator has multiple variables
that must be considered, these include the net power, capital cost and the operating costs (fixed
and variables).
Before continuing with the LCOE analysis, it is important to clarify some of the terms and
costs.
5.1 Capital Cost
The capital cost of a hydroelectric plant depends on different factors, however, the typical
range is between $1000 US/kW and $3500 US/kW (International Renewable Energy Agency
(IRENA), 2012). Small projects with a capacity of less than 1 MW tend to have higher initial
investments usually driven by the electromechanical equipment. Nonetheless, there is also a direct
relationship between the head height and the installed capacity (International Renewable Energy
Agency (IRENA), 2012); this means that when the head height is high and the capacity is below
1 MW the cost per megawatt of capacity of the plant and initial investment cost can be lower due
to an increase on the load of the water flowing through the turbine, therefore increasing the power
generation. In Appendix B, Figure 17 illustrates the total installed hydropower capacity cost ranges
by country.
The two major factors that impact the capital cost of a hydroelectric plant are the civil work
and the electromechanical equipment needed. The amount of civil works is site-specific and
depends mainly on the site of installation, the size or scale of the project and the technology used.

25
The electromechanical equipment cost will be directly related to the capacity installed. The
capacity will depend on the combination and the quantity of turbines used as well as the generator
selected. To some extent, the decision to use more or fewer units will also depend on the resource
availability of resources, the FDC and occurences of streamflows below show the required amount
for power generation. Therefore, the decision on how much should be spent on electromechanical
equipment was undertaken with a view to striking a balance between minimizing the capital cost
while maximizing the efficiency. The electromechanical equipment cost was determined as shown
in Appendix C.
Figure 9. Total installed cost breakdown by component and capacity weighted
averages for 25 hydropower projects in Asia
Source: (IRENA, 2018)

26
5.2 Operation and Maintanance Cost
Operation and Maintanance (O&M) costs are usually low for hydropower plants, after all
the equipment is installed. Usually, O&M costs are expressed as a percentage of the initial capital
cost. It is estimated that for large scale hydropower plants the percentage is 2% and for small
hydropower plants it is between 3% and 4% (International Renewable Energy Agency (IRENA),
2012).
5.3 LCOE
For each site, the values summarized in the tables below were taken to calculate the LCOE
replacing them in equation 1. It is important to note the main difference between Site A and Site
B is the installed capacity, therefore, the capacity factor6 (CF) is also different.
In comparison with a water storage system such as a dam, a run-of-river system has very
little storage. Hence, when the river flow is low due to water diversion for agriculture irrigation
(this is the case for both sites), the system will not have enough water to produce energy, thus, its
CF will be between 40% to 80%. In comparison, this CF value in a dam could be between 85%
and 90% (Helston & Farris, 2017). The low CF in run of the river projects has a substantial impact
on the LCOE.
The other variables were maintained to have a comparable scenario as much as possible.
6 Capacity factor is defined as the ratio of the power output over the installed capacity

27
5.3.1 LCOE Hydroelectric Model Outputs
Table 5. Site A LCOE Analysis Output
4 TURBINE
UNITS 3 TURBINE
UNITS 2 TURBINE
UNITS Capacity Factor (%) 50% 59% 78% Installed Capacity (MW) 16 12 8 I: Investment Upfront Cost ($) 56,000,000 42,000,000 28,000,000 M: Maintenance & Operations Cost7 ($/year) 4% 4% 4% E: Electricity Production (MWh/year) 71,481.60 62,020.80 54,662.40 r: Discount Rate (%) 8.25% 8.25% 8.25% n: Lifetime (years) 50 50 50 LCOE ($/MWh) 88.17 76.21 57.65 Electrical Energy Produced over Lifetime (MWh/Lifetime)
945,950.66
820,751.30
723,374.03
(Caicedo, 2018)
Table 6. Site B LCOE Analysis Output
4 TURBINE UNITS
3 TURBINE UNITS
2 TURBINE
UNITS Capacity Factor (%) 35% 43% 53% Installed Capacity (MW) 8 6 4 I: Investment Upfront Cost ($) 28,000,000 21,000,000 14,000,000 M: Maintenance & Operations Cost ($/year) 4% 4% 4% E: Electricity Production (MWh/year) 24,528.00 22,600.80 18,571.20 r: Discount Rate (%) 8.25% 8.25% 8.25% n: Lifetime (years) 50 50 50 LCOE ($/MWh) 128.47 104.57 84.84 Electrical Energy Produced over Lifetime (MWh/Lifetime)
324,590.91
299,087.34
245,761.69
(Caicedo, 2018)
7 4% of Upfront Investment per year

28
Figure 10. LCOE Site A and Site B Comparison
(Caicedo, 2018)
The range of LCOE for small hydro in North America ranges from 50 – 170 ($US/MWh).
Based on Figure 10 we can see that both sites are within that range, nevertheless, the LCOE shows
better results for Site A than for Site B. Even though, the capital cost for Site A is higher than for
Site B (mainly due to the installed capacity), in a lifespan of 50 years, more energy can be
generated in site A because it has a higher CF. These results were compared and contrasted with
the Net Present Value (NPV) curve and the Internal Return Rate (IRR) to provide a better
understanding of each project before deciding whether or not to proceed.
88.17 76.21
57.65
128.47
104.57
84.84
$0
$20
$40
$60
$80
$100
$120
$140
4 UNITS 3 UNITS 2 UNITS
LCOESITEAANDSITEBCOMPARISONSITE A LCOE ($/MWh) SITE B LCOE ($/MWh)

29
Figure 11. 4 Turbines units scenario NPV VS. IRR and PBP
(Caicedo, 2018)
NOTE: Payback Period Site A – 11.25 years. Payback Period Site B – 22.26 years
Figure 12. 3 Turbines Scenario NPV VS. IRR and PBP
(Caicedo 2018)
NOTE: Payback Period Site A – 9.1 years. Payback Period Site B – 14.9 years
$(40,000,000)
$(30,000,000)
$(20,000,000)
$(10,000,000)
$-
$10,000,000
$20,000,000
$30,000,000
$40,000,000
$50,000,000
$60,000,000
$70,000,000
$80,000,000
$90,000,000
$100,000,000
$110,000,000
$120,000,000
$130,000,000
0% 1% 2% 3% 4% 5% 6% 7% 8% 9% 10% 11% 12% 13% 14% 15% 16% 17% 18% 19% 20%
4 TURBINE UNITSNPV VS. DISCOUNT RATE
NPV Site ANPV Site B
$(40,000,000)
$(30,000,000)
$(20,000,000)
$(10,000,000)
$-
$10,000,000
$20,000,000
$30,000,000
$40,000,000
$50,000,000
$60,000,000
$70,000,000
$80,000,000
$90,000,000
$100,000,000
$110,000,000
$120,000,000
$130,000,000
0% 1% 2% 3% 4% 5% 6% 7% 8% 9% 10% 11% 12% 13% 14% 15% 16% 17% 18% 19% 20%
3 TURBINE UNITSNPV VS. DISCOUNT RATE
NPV Site ANPV Site B

30
Figure 13. 2 Turbines Scenario NPV VS. IRR and PBP
(Caicedo, 2018)
NOTE: Payback Period Site A – 6.2 years. Payback Period Site B – 10.6 years
NPV, IRR and Payback Period (PBP) also showed a better performance for Site A giving
a broader range of turbine units that could be built in the location. Having two or three turbines
with an approximate installed capacity of 12 MW, gives a positive NPV and the PBP is less than
10 years. For Site B, the options are limited to two turbine units and even then, the NPV for the
project is below 2 Million dollars with a PBP above the 10 years.
After evaluating all the variables for each project, Site A has shown better results in terms
of power and energy output as well and in the LCOE analysis which indicates that Site A is
recommended as the site to be developed first.
$(20,000,000)
$(10,000,000)
$-
$10,000,000
$20,000,000
$30,000,000
$40,000,000
$50,000,000
$60,000,000
$70,000,000
$80,000,000
$90,000,000
$100,000,000
$110,000,000
$120,000,000
$130,000,000
$140,000,000
0% 1% 2% 3% 4% 5% 6% 7% 8% 9% 10% 11% 12% 13% 14% 15% 16% 17% 18% 19% 20%
2 TURBINE UNITSNPV VS. DISCOUNT RATE
NPV Site ANPV Site B
31
Chapter 6 Environmental assessment and Social Benefit 6.1 Environmental Assesment
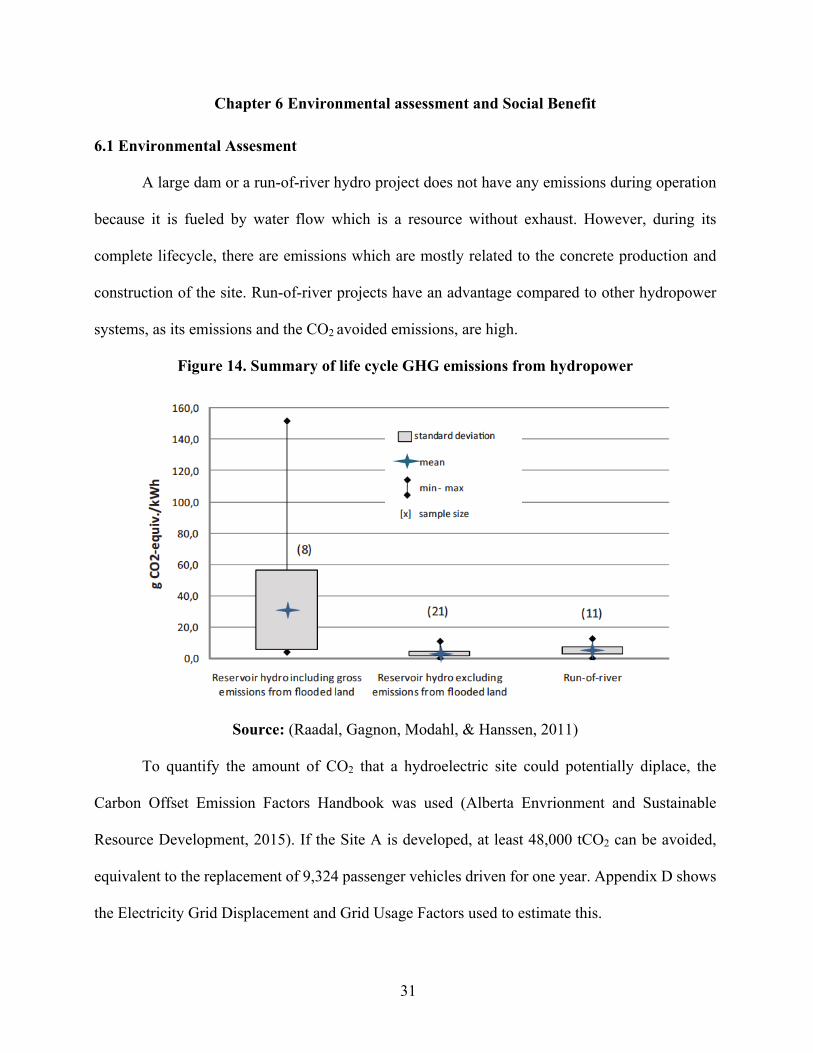
A large dam or a run-of-river hydro project does not have any emissions during operation
because it is fueled by water flow which is a resource without exhaust. However, during its
complete lifecycle, there are emissions which are mostly related to the concrete production and
construction of the site. Run-of-river projects have an advantage compared to other hydropower
systems, as its emissions and the CO2 avoided emissions, are high.
Figure 14. Summary of life cycle GHG emissions from hydropower
Source: (Raadal, Gagnon, Modahl, & Hanssen, 2011)
To quantify the amount of CO2 that a hydroelectric site could potentially diplace, the
Carbon Offset Emission Factors Handbook was used (Alberta Envrionment and Sustainable
Resource Development, 2015). If the Site A is developed, at least 48,000 tCO2 can be avoided,
equivalent to the replacement of 9,324 passenger vehicles driven for one year. Appendix D shows
the Electricity Grid Displacement and Grid Usage Factors used to estimate this.
32
Other type of environmental issues to be considered are the cumulative effects that this
type of projects could bring where a dam already exists. The key issues that should be looked at
are related to the impact on land, because building new structures such as powerhouses, turbines
installation and roads could increase the existing environmental footprint. Moreover, these new
structures could also represent barriers to the ecosystem. Water use and water quality can
considerably affect the fish population and aquatic vegetation by increasing species mortality or
leading to an imbalance in biodiversity (IUCN, 2012).
Mitigation of these impacts can be achieved by measures such as building ladders to allow
fish to move through the system without being harmed, returning the water to the catchment area
and continuous maintainance of the system (Clean Energy BC, 2016). It is also important to have
public consultations in the area with communities nearby the locations, to adequately evaluate the
impact and mitigation strategies for each site regarding the specific details of the hydroelectric
plant to be built. This will ensure minimal impact on the environment.
6.2 Social benefit
The indigenous (first nations) communities in this area should be given equal opportunity
to invest in this project which will provide a much needed, ongoing source of revenue for them.
Through both federal and provincial programs they could raise the funds necessary to participate
in this project to sell power into the Alberta grid.
This opportunity would also allow the community to participate from the beginning of the
project and could potentially create employment opportunities for their members in every stage of
the project. They could contribute, for example, with their unique traditional ecologic knowledge
(TEK) in the pre-feasibility phase of the environmental impact assessment, provide an important
source of local labor during the construction phase and finally during the ongoing operation and

33
maintainance phase to ensure the correct operation of all the equipment and the hydroelectric plant
in general.

34
Chapter 7 Conclusions, Limitations and Future Research 7.1 Conclusions
In this research the technical, economical, environmental and social aspects for a small
hydroelectric plant in two different locations were assessed.
Site A has shown better results in terms of power and energy output as well and in the
LCOE analysis which indicates that Site A is recommended as the site to be developed first. Site
B did not show a high technical potential as Site A, still has a lot of potential to generate electricity
and should still be considered as a project to be develop in the future.
LCOE is a widely used method not only to determine the cost of different power plants but
also to make a comparison between them. In this report the LCOE was used as it was considered
to be a good indicator, and provided significant insight for the company regarding which project
to focus on first. In this case, the most appropriate site to be developed first was determined to be
Site A. Nonetheless, it is important to constrast these results with other economic and social
variables that give a broader understanding and can help with decision making on both sites in
the future.
Hydroelectric plants in general are a reliable source of electricity and have a low environmental
footprint. However, individual environmental assessments should be conducted for each project
on the site-specific details, especially the cumulative effects that could come with building this
project in existing dams.
There is a high potential for First Nation participation, ideally through a partnership that can
help them and the company to sustainably develop their local natural resources.
Finally, prior to making a final investment decision, it would be beneficial to evaluate, review
and adjust all the information obtained from this research at the feasibility stage, when constant

35
flow rate measurements have been made and reports are available, and when final technical
specifications (i.e. head height) of each location is available and the actual turbine units and other
electromechanical equipment have been selected.
7.2 Limitations
The main limitations of this project research were related to data collection and some of the
assumptions made. The flow discharge data was taken from the Government of Canada webpage,
however, in the last 11 years, the measurement for part of Fall and Winter season has not been
made. For this paper, it was necessary to take an average value of the last 100 years. Once the
company starts the designs to build the hydropower site, actual measurements need to be taken.
The LCOE values taken were based on typical values from the literature review combined with
the values obtained from the calculations like the capacity factor; also based on the literature
research. Some LCOE models consider the cost associated with construction of transmision and
distribution lines which were not considered in this paper. LCOE results should be computed
again, once the actual values of the design are determined. Although it is expected that the results
are close to the ones presented in this report, final results may differ from the projections
presented..
7.3 Future Research
In order to gather all the aspects that could potentially influence the final investment decision
on this hydroelectric project, there are several aspects that should be included in the research.
Although Site B does not have as high technical potential as Site A, it still has a lot of potential
to generate electricity. Cost-effective models for Site B that could potentially drive down the cost
of the construction of this hydroelectric site in the future should be examined. Furthermore, other
areas in Alberta with similar conditions should be explored and evaluated regarding their potential

36
for being developed as new hydroelectric sites. As mentioned at the beginning of this project
hydroelectric sites could significantly help Alberta achieve the goals in its Climate Leadership
Plan. Any and all projects that could potentially have socio-economic and environmental benefits
for the communities and the province should be considered.
In any hydroelectric project in Alberta, First Nations participation, including equity
participation, should be strongly considered. With the current government programs in place, it is
possible that a First Nation may be able to utilize grants as one method to fund their economic
participation in the project. It is important to contact a First Nation communities which are near
potential hydroelectric projects to collaborate on them. Items which could be discussed include the
energy demand of their community and other nearby communities, their social and economic needs
and how projects like this could potentially meet those needs and create a sustainable development
model for them.
Finally, a project of this magnitude is subject to the province’s regulations, these regulations
can include rules for conducting Environmental Impact Assessments as well as criteria for
obtaining permits. The process to go through before a project is approved for development could
be from two to three years. Research into the relevant regulations must be conducted before the
start of any project.

37
References
Afework, B., Hanania, J., & Donev, J. (2018, May 18). Levelized cost of energy. Retrieved August
9, 2018, from Energy Education:
http://energyeducation.ca/encyclopedia/Levelized_cost_of_energy
Alberta Electric System Operator. (2017). AESO 2017 Long-term Outlook, 19. Retrieved June 4,
2018, from www.aeso.ca
Alberta Envrionment and Sustainable Resource Development. (2015). Carbon Offset Emission
Factors Handbook. Specified Gas Emitters Regulation, (1), 16. Retrieved April 17, 2018, from
http://aep.alberta.ca/climate-change/guidelines-legislation/specified-gas-emitters-
regulation/documents/CarbonEmissionHandbook-Mar11-2015.pdf
Battery and Energy Technologies. (2005). Retrieved April 13, 2018, from Hydroelectric Power
Generation: http://www.mpoweruk.com/hydro_power.htm
Clean Energy BC. (2016). Run-of-river Hydropower. Retrieved July 10, 2018, from
https://www.cleanenergybc.org/wp-content/uploads/2015/12/CEBC_Run-of-
River_Fact_Sheet.pdf
EIA. (2018). Levelized Cost and Levelized Avoided Cost of New Generation Resources in the
Annual Energy Outlook 2018, (March), 1–20. Retrieved April 19, 2018, from
https://www.eia.gov/outlooks/aeo/pdf/electricity_generation.pdf
Fichtner Management Consulting AG. (2015). Hydroelectric Power. Retrieved July 9, 2018, from
https://www.opg.com/generating-power/hydro/Pages/hydro.aspx
George, C., Tymensen, W., & Rood, S. B. (2002). Recreational Flows for the Bow River and its
tributaries , Alberta.
Government of Alberta. (2016). Climate Leadership Plan. Retrieved March 23, 2018, from
https://www.alberta.ca/climate-leadership-plan.aspx
38
Government of Canada. (2018, March 14). Daily Discharge Data Availability for Bow River below
Bassano dam (05BM004). Retrieved June 27, 2018, from Environment and natural resources:
https://wateroffice.ec.gc.ca/report/data_availability_e.html?type=historical&station=05BM004&
parameter_type=Flow+and+Level
Helston, C., & Farris, A. (2017, February). Energy BC. Retrieved July 10, 2018, from Run of River
Power: http://www.energybc.ca/runofriver.html
International Renewable Energy Agency (IRENA). (2012, June). Renewable Energy
Technologies: Cost Analysis Series. Retrieved July 12, 2018, from:
https://www.irena.org/documentdownloads/publications/re_technologies_cost_analysis-
hydropower.pdf
International Renewable Energy Agency (IRENA). (2018). Renewable Power Generation Costs
in 2017. Retrieved July 5, 2018, from http://www.irena.org/publications/2018/Jan/Renewable-
power-generation-costs-in-2017
IUCN. (2012, May 21). International Union for Conservation of Nature. Retrieved July 17, 2018,
from Small scale hydro power: impacts on nature and people: https://www.iucn.org/content/small-
scale-hydro-power-impacts-nature-and-people
Natural Resources Canada. (2016, August 04). Retrieved April 17, 2018, from Small Hydropower:
https://www.nrcan.gc.ca/energy/renewable-electricity/small-hydropower/7363)
Natural Resources Canada. (2017, December 13). Retrieved from About Renewable Energy:
https://www.nrcan.gc.ca/energy/renewable-electricity/7295
Oregon State University. (2018). Retrieved April 12, 2018, from River Engineering & Restoration
at OSU: http://rivers.bee.oregonstate.edu/turbine-sizing
Raadal, H. L., Gagnon, L., Modahl, I. S., & Hanssen, O. J. (2011). Life cycle greenhouse gas
(GHG) emissions from the generation of wind and hydro power. Renewable and Sustainable

39
Energy Reviews, 15(7), 3417–3422. https://doi.org/10.1016/j.rser.2011.05.001
Renewables First. (2014). Kaplan Turbines. Retrieved June 28, 2018, from
http://www.renewablesfirst.co.uk/hydropower/hydropower-learning-centre/kaplan-turbines/
Santos Alves Pereira, B., Magahaes Sobrinho, P., & Luz Silveira, J. (2015). Energetic and
Economic Efficiency Analysis of a Hydraulic Potential Using Different Types of Turbines.
Retrieved from
http://energy.kth.se/compedu/webcompedu/S2_Turbomachinery/B7_Hydraulic_Turbines/C1_Int
roduction_to_Hydraulic_Turbines/S2B7C1_files/Turbine_selection_chart.htm
Southern Alberta. (2018). About Bassano Dam. Retrieved June 26, 2018, from
http://www.southernalberta.com/profile.asp?bPageID=1072
Temíz, A. (2013). Decision Making on Turbine Types And Capacities For Run-Of-River
Hydroelectric Power Plants. A Case Study On Eglence-1 Hepp. İzmir Institute of Technology.
United States Energy Information Administration. (2018). Levelized Cost and Levelized Avoided
Cost of New Generation Resources.

40
APPENDIX A. Site A and B Annual Average Flow Rate
Figure 15. Site A Annual Average Flow Rate
Source: (Government of Canada, 2018)
Figure 16. Site B Annual Average Flow Rate
Source: (Government of Canada, 2018)

41
APPENDIX B. Total Installed Hydropower Capacity
Figure 17. Total Installed Hydropower Capacity Cost Ranges By Country
Source: (International Renewable Energy Agency (IRENA), 2012).
Note: In Canada the initial installed cost can vary between 500 USD/kW and 4500 USD/kWh

42
APPENDIX C. Relationship between costs, power and head of a small hydropower scheme
Figure 18. Formula to describe the relationship between costs, power and head of a small hydropower scheme
Source: (International Renewable Energy Agency (IRENA), 2012)

43
APPENDIX D. Electricity Grid Displacement and Grid Usage Factors
Figure 19. Electricity Grid Displacement and Grid Usage Factors
Source: (Alberta Envrionment and Sustainable Resource Development, 2015)