Embed Size (px)
Citation preview

C:\RICHARD\Google Drive\Docs - Work\ECA\Projects worked on\Kenya RES 386\Docs\Richard Work in
Progress\Deliverables\Kenya Small Scale Renewables - Draft Final Report.doc 22/6/12
Economic Consulting Associates Limited
41 Lonsdale Road, London NW6 6RA, UK
tel: +44 20 7604 4545, fax: +44 20 7604 4547
email: [email protected]
Technical and Economic Study
for Development of Small Scale
Grid Connected Renewable
Energy in Kenya
Draft Final Report
June 2012
Submitted to the Ministry of Energy
through the Energy Regulatory
Commission by:
Economic Consulting Associates
Ramboll

Contents
Kenya Small Scale Renewables: Draft Final Report June 2012
Economic Consulting Associates, Ramboll ii
Contents
Tables iv
Figures iv
Abbreviations and acronyms v
1 Introduction and Overview 7
1.1 Conduct of the Study 7
1.2 Overview of the Small-Scale Renewables sector 8
1.3 Overview of the approach 10
1.4 Overview of the report and the deliverables 12
2 Categories for promoting small-scale grid connected renewables 13
2.1 Study objectives and principles adopted 13
2.2 Category 1- Electricity Banking 14
2.3 Category 2 - Net Metering 14
2.4 Recommendations and procedures for Categories 1& 2 15
2.5 Category 3 - Standardised non-negotiable PPA 16
2.6 Larger renewable projects (>10 MW) 16
3 Report on TOR tasks 21
3.1 Task 1 - Standardised PPAs 21
3.1.1 Standardised Non-negotiable PPA (Category 3) 21
3.1.2 Standardised PPA template (Category 4) 22
3.1.3 Task 1 Recommendations 22
3.2 Task 2 - Feed-in Tariffs 22
3.2.1 Key elements of Feed-in Tariff Policy 22
3.2.2 Revised FiT Model and the data assumptions made 24
3.2.3 Proposed FiT values 29
3.2.4 Comparison with international FiT values 36

Contents
Kenya Small Scale Renewables: Draft Final Report June 2012
Economic Consulting Associates, Ramboll iii
3.2.5 Task 2 Recommendations 38
3.3 Task 3 - Engineering standards 40
3.3.1 Guidelines for Grid Connection of Small Renewable Generators 40
3.3.2 Guidelines content 40
3.3.3 Task 3 Recommendations 42
3.4 Task 4 - Grid integration – operations 42
3.4.1 Operational integration of small renewables 42
3.4.2 Task 4 Recommendations 43
3.5 Task 5 - Isolated grids 43
3.5.1 The load characteristics of isolated grids 43
3.5.2 Task 5 Recommendations 46
3.6 Task 6 – Monitoring and Planning Tool 47
3.6.1 Relationship between monitoring and planning 47
3.6.2 Task 6 Recommendations 49
3.7 Task 7 - Management of FiT Approval Process 50
3.7.1 Task 7 Deliverables 50
3.7.2 Task 7 Recommendations 51
3.8 Additional elements of the TOR and other topics covered 53
3.8.1 Items identified at start of Section 3 of TOR 53
3.8.2 Wheeling 54
4 Conclusion and agenda for final workshops 56
4.1 Conclusion 56
4.2 Agenda for final workshops 56

Contents
Kenya Small Scale Renewables: Draft Final Report June 2012
Economic Consulting Associates, Ramboll iv
Tables
Table 1 Pipeline projects 2012-2018 9
Table 2 RTAP project pipeline as of mid May 2012 10
Table 3 Main elements of FiT policy for on-grid projects 23
Table 4 FiT Model assumptions, not technology specific 25
Table 5 Summary of FiT values 34
Table 6 Standard FiT by capacity increment 35
Table 7 Front Loaded FiT by capacity increment 35
Table 8 Indexed Component by capacity increment 36
Figures
Figure 1 Projected contribution of small-scale renewables to generation capacity 9
Figure 2 Overview of FiT Model structure 24
Figure 3 Load factors by technology 27
Figure 4 Investment costs (construction + transmission costs) by technology 28
Figure 5 Operating costs (fixed + variable) by technology 29
Figure 6 Standard FiTs 30
Figure 7 Front Loaded FiT - wind 31
Figure 8 Linear tariffs – hydro 1-10 MW 32
Figure 9 Indexed component as a percentage of Standard FiT 33
Figure 10 Comparison with FiTs internationally - wind 37
Figure 11 Comparison with FiTs internationally - biomass 37
Figure 12 Comparison with FiTs internationally - solar 38
Figure 13 Comparison with FiTs internationally - hydro 38
Figure 14 Typical daily load profile of an isolated centre 44

Abbreviations and acronyms
Kenya Small Scale Renewables: Draft Final Report June 2012
Economic Consulting Associates, Ramboll v
Abbreviations and acronyms
a.g.l. above ground level
CEB Ceylon Electricity Board
CPI Consumer Price Index
DNI Direct Normal Irradiation
DNO Distribution Network Operator
EGAT Thai state-owned power company
EOI Expression of Interest
ERC Energy Regulatory Commission
ESDP Energy Services Delivery Project (Sri Lanka)
ESIA Environment and Social Impact Assessment
EWURA Energy and Water Utilities Regulatory Authority (Tanzania)
FiT feed-in tariff
GDC Geothermal Development Company
GoK Government of Kenya
IPP independent power producer
kWh kilowatt hour (unit of electrical energy)
kWp peak capacity in kW
LCPDP Least Cost Power Development Plan
LOI Letter of Intent
LRMC long run marginal cost
MWe megawatts applying to electrical capacity
MWh megawatt hour (unit of electrical energy)
PPA Power Purchase Agreement
PUCL Public Utilities Commission of Sri Lanka
PV (Solar) photo voltaic
RE renewable energy

Abbreviations and acronyms
Kenya Small Scale Renewables: Draft Final Report June 2012
Economic Consulting Associates, Ramboll vi
RES renewable energy sources
REA Rural Energy Authority
RERED Renewable Energy for Rural Economic Development
RPS renewable portfolio standards
SEA Sustainable Energy Authority (Sri Lanka)
SPP Small Power Producer
SPPA Standard/Small Power Purchase Agreement
SPPT Small Power Purchase Tariff
SREP Scaling-up Renewable Energy Programme
STM Standardised Tariff Methodology (Tanzania)
T&D transmission and distribution
TANESCO Tanzanian state-owned power company
TGC tradable green certificates
TOR Terms of Reference
VSPP Very Small Power Producers (as defined in Thailand’s support programme)

Kenya Small Scale Renewables: Draft Final Report June 2012
Economic Consulting Associates, Ramboll 7
Introduction and Overview
1 Introduction and Overview
1.1 Conduct of the Study
The Government of Kenya has placed considerable importance on the Technical and Economic Study for Development of Small Scale Grid Connected Renewable Energy in Kenya. Since 2008, feed-in tariffs (FiTs) have been on offer to encourage investment in renewable energy (RE) generation projects, but there has to date been a rather limited response as measured by numbers of projects implemented under the FiT mechanism.
The Government seeks now, with the assistance of the World Bank, to create a framework which will encourage greater RE investment, thereby relieving the capacity constraint and allowing more Kenyans to connect to the grid, but at the same time avoiding high tariff increases being imposed on existing electricity consumers.
The study commenced in February 2012. The project schedule has been adhered to and the milestones have been:
Project Kick-off Meeting – 16 February
Inception Report - 16 March
Inception Workshop – 30 March
Mini Workshop on Technical Issues – 13 April
Mini Workshop on Feed in Tariffs – 18 April
Mid-Term Report – 14 May
Mid-Term Workshop – 7 June
One of the immediate achievements of the study has been the degree of active participation in researching topics, debating options and forging a consensus around recommendations which are appropriate for Kenya. A Steering Committee was formed after the Kick-off Meeting, consisting of a contact and a counterpart in each of the key organisations on the Government side (Ministry of Energy, ERC, KPLC, KenGen, KETRACO, GDC and REA). Fruitful discussions and exchanges have taken place with Steering Committee members and also with colleagues from their institutions. The exchanges have been through one-on-one meetings, email and telephone exchanges, as well as via the mini and main workshops. These interactions have all had a training element, the consultant team keeping constantly in mind the training requirements of the study.
In addition to exchanges with people in public sector institutions with responsibility for renewables, the study has also drawn in private sector players, and this has served to further sharpen the debates and raise the level of
Kenya Small Scale Renewables: Draft Final Report June 2012
Economic Consulting Associates, Ramboll 8
Introduction and Overview
recommendations being made. The main workshops have been attended by project promoters, bankers and technical experts. We have also had extensive exchanges via email with private companies and support organisations (such as RTAP - the Renewable Energy and Energy Efficiency Financing Programme, and Greening the Tea Industry in East Africa).
The scheduled timetable for the remaining steps of the study is as follows:
Draft Final Report – 22 June
Final Workshop – Thursday 19 July, with associated discussion/training sessions on engineering aspects and use of the FiT Model
Final Report – 2 August
1.2 Overview of the Small-Scale Renewables sector
The electricity sector in Kenya is in many respects performing well. In the generation segment, there are independent power producers (IPPs) providing around 27% of the generated energy. The listed companies – Kenya Power1 and KenGen – are well run and financially sound, able to raise money through share and bond issues. Investment resources are also provided by government and donors, these being channelled in part through the Rural Electrification Authority.
The main problems in the sector are that existing capacity is barely able to meet demand, especially when hydrological conditions dip, and the electrification rate is only about 23%. Installed capacity in 2011 was only 1,590 MW, which is very low for a country of 40 million people (40 W per capita – South Africa’s figures are roughly 40,000 MW for 50 million people or 800 W per capita). Kenya’s Vision 2030 ambition is to be a middle income country in 18 years’ time: this will require system capacity to grow to 15,000 MW by 2030. Rapid growth in capacity is required both to underpin the GDP growth targets and to allow universal access to electricity to be achieved.
The overwhelming priority right now is to expand capacity in pace with economic growth, maintaining an adequate reserve margin so that security of supply can be assured. There is a well-established least cost power development plan (LCPDP) process in place. Two of the major upcoming developments identified in the LCPDP will be in renewables – large-scale geothermal generation to provide base load, and a high capacity (2,000 MW) direct current regional interconnector which will make it possible for Kenya to import low cost hydropower from Ethiopia.
Small-scale renewables also have a role to play. The Inception Report included a detailed annex which analyses the substantial renewable energy resource potential in Kenya. While researching this potential, it became evident that the impression of
1 Kenya Power is the trading name of the company. The listed name on the Nairobi Stock Exchange is Kenya Power & Lighting Co. Limited. The company is often referred to as KPLC.
Kenya Small Scale Renewables: Draft Final Report June 2012
Economic Consulting Associates, Ramboll 9
Introduction and Overview
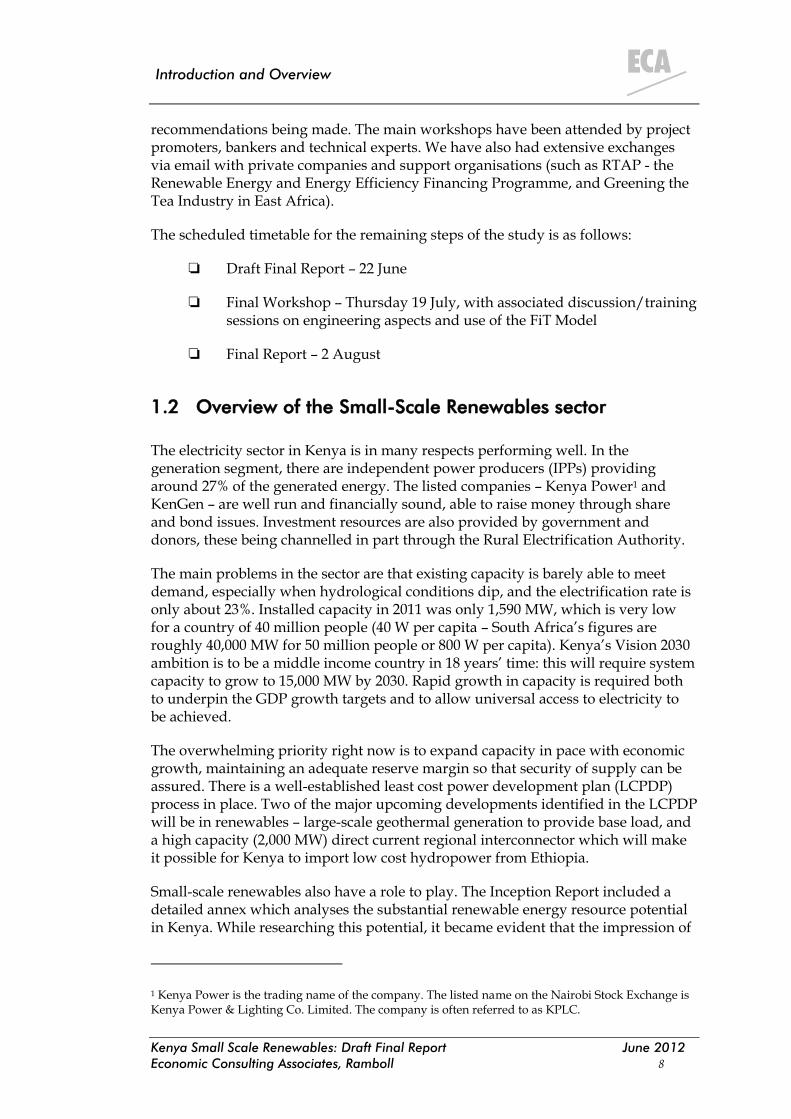
a lack of up-take of the FiTs is belied by the existence of a significant pipeline of projects. Taking ‘small-scale’ as being less than 10 MW, it is noted that small-scale renewables presently contribute only 3% of installed capacity, but this proportion has grown rapidly from around 1% in 2005. Our analysis of the pipeline of projects indicates that installed small-scale capacity will grow from the current level of under 50 MW to 350 MW in 2018, constituting at that stage around 6% of total system capacity. The pipeline projects are assumed to be up to 30 MW, with 60% of the capacity increment being derived from small hydro and biomass – see Table 1. The evolution of the contribution of small-scale renewables is illustrated in Figure 1.
Table 1 Pipeline projects 2012-2018
Type (<30 MW) Total MW No. of sites By when
Small hydro 119 35+ 2018
Biomass 65 8 2016
Small wind 51 2 2014
Small geothermal 36.5 8 2016
Biogas 22 4 2018
Solar PV 10 1 2015
Source: Inception Report
Figure 1 Projected contribution of small-scale renewables to generation capacity
0.0%
1.0%
2.0%
3.0%
4.0%
5.0%
6.0%
7.0%
8.0%
0
50
100
150
200
250
300
350
400
2005 2006 2007 2008 2009 2010 2011 2012 2013 2014 2015 2016 2017 2018
MW
Wind Geothermal
Solar PV Hydro
Biomass Biogas
Sshare of small scale renewables

Kenya Small Scale Renewables: Draft Final Report June 2012
Economic Consulting Associates, Ramboll 10
Introduction and Overview
The number of projects would be about 12 per annum, with an average size of 3.6 MW, which sounds manageable from the viewpoint of the administrators of the FiT system. The underlying assumption for the overall electricity system growth is the LCPDP forecasts based on reaching the ambitious Vision 2030 targets. The required growth rate for the system capacity is an annual average of 22% per annum, or in absolute terms an average increment of 660 MW each year.
The existence of a significant pipeline of projects is confirmed by other sources. The Regional Technical Assistance Project that is based in the Kenya Association of Manufacturers s of 18 May 2012 had a pipeline of 79 projects, of which 66 had been reviewed. Of these, 26 are classified as predominantly energy efficiency projects (including cogeneration, fuel and electricity cost abatement). Details of the remaining 40 renewable energy generation projects are given in Table 2. These projects are all targeted for implementation by as soon as 2014. One bottleneck is likely to be funding: the $155 million debt finance requirement for the 66 projects is nearly four times the financing capacity of the subsidised AFD credit line for Kenya. Other concessional loan financing is being sought.
Table 2 RTAP project pipeline as of mid May 2012
RE Technology No. sites Total MW Investment US$ m Unit cost US$/kW
Hydro 27 59 158 2,678
Biomass 2 6 6 1,000
Wind 3 10 25 2,500
Geothermal 2 5 19 3,800
Biogas 3 5 7 1,400
Solar PV 3 3 11 3,667
Totals 40 88 226 2,568
Source: RTAP project database
Another potential bottleneck is the administrative procedures required for project approval and implementation. To ensure that the pipeline of projects actually move into implementation in the timescale envisaged, it is imperative that means be found to speed up and streamline the procedures for project approval and financing. The structures and procedures currently in place will not be able to cope with the large increase in demand for approvals that is expected to be coming through shortly.
1.3 Overview of the approach
The main objective of this study is precisely to reduce the transactions costs involved in project start-up and in the operational phase of small power producers

Kenya Small Scale Renewables: Draft Final Report June 2012
Economic Consulting Associates, Ramboll 11
Introduction and Overview
(SPPs). The first few projects to have been introduced under the FiT mechanism have involved significant transactions costs, particularly for the project promoters and for KPLC in the phase of negotiating a power purchase agreement (PPA). The most important element of the approach adopted in this study to the minimisation of transactions costs has been to introduce the idea of a Standardised Non-Negotiable PPA which would be based on a fixed, non-negotiable FiT for each technology. Cutting out negotiation altogether is clearly a major step forward, and the standardisation of the PPA also implies that there is no monitoring to be done during the PPA implementation; so on-going as well as up-front transactions costs are being dramatically reduced.
However, a standardised non-negotiable PPA can only be applied in certain circumstances and there are certain costs and limitations which result:
There is no bidding for renewable sites and resources – a first come, first served system applies.
The plants are ‘embedded’, that is not despatchable by the National Control Centre.
They are connected at distribution voltages of up to 33 kV and operate on a ‘must run, must take’ basis at a feed-in tariff which is fixed for each technology type and capacity level.
Given the physical limitations of distribution systems and the implications of non-despatchability, the plant capacity for the embedded plants is to be limited to a maximum of 10 MW.
These limitations are to be traded off against the simplicity and efficiency of the standardised non-negotiable PPA, and the direct economic gains (to sponsors and the electricity sector as a whole) of projects being implemented and generating returns much sooner than would be the case if each and every PPA had to be separately negotiated. The factors listed above do not preclude small-scale renewables playing a significant role in national electricity supplies, as well as offering local advantages (notably voltage support when the generators are located at the end of long distribution lines). A country such as Sri Lanka provides an important example of successfully implementing the standardised non-negotiable approach. The scheme was introduced in 1996 and has grown since that time. Embedded small-scale renewable generators presently have a combined capacity equivalent to 10% of Sri Lanka’s national maximum demand. The plants have operated without technical problems arising, despite their being non-despatchable.
The standardised non-negotiable PPA for embedded generators of less than 10 MW is not the only support framework that is presented in this report. After considering all the combinations of aspects of (project scale, technologies, support instruments, transmission interconnection costs, feed-in tariffs), various different packages or ‘Categories’ of support for small scale renewables are proposed. The recommended categories are:
Category 1 – Electricity Banking
Kenya Small Scale Renewables: Draft Final Report June 2012
Economic Consulting Associates, Ramboll 12
Introduction and Overview
Category 2 – Net Metering
Category 3 – Standardised Non-negotiable PPA
These are discussed further in Section 2. At an earlier point in the study, support frameworks for renewable projects larger than 10 MW but still relatively ‘small’ were presented, but after thorough discussion this category has been replaced by a set of guidelines for larger projects, rather than a specific incentive framework. This is discussed further in Section 2 below.
1.4 Overview of the report and the deliverables
The main part of this report (Section 3) examines key aspects of the implementation of these categories, relating these to the seven main tasks laid out in the Terms of Reference (TOR) for the study:
Task 1: Regulatory instruments for SPPs connected to the national grid
Task 2: Tariffs for SPP sales into the interconnected system
Task 3: Grid Integration - Connections
Task 4: Grid Integration - Operations
Task 5: Regulatory instruments for SPPs supplying isolated grids
Task 6: Planning potential for SPPs in Kenya and private sector participation
Task 7: Management of FiT approval process
This draft Final Report is a relatively brief and succinct document, the objective of which is to lay out the main arguments to back the recommendations. The substantive deliverables are associated documents:
Separate Deliverable 1: Draft Revised FiT Policy
Separate Deliverable 2: Standardised Non-Negotiable Power Purchase Agreement
Separate Deliverable 3: Connection Guidelines for Small-Scale Renewables
Separate Deliverable 4: FiT Model
Separate Deliverable 5: Application and Implementation Guidelines
Separable deliverable 6: Monitoring & Planning Tool
Separate Deliverable 7: PPA Template for Projects larger than 10 MW
Kenya Small Scale Renewables: Draft Final Report June 2012
Economic Consulting Associates, Ramboll 13
Categories for promoting small-scale grid connected renewables
2 Categories for promoting small-scale grid connected
renewables
2.1 Study objectives and principles adopted
As the number of small renewable generation project applications grows and subsequently the number of small generators on the grid grows, it will become imperative to have procedures and operational practices which are as simple and as easy to manage as possible.
The primary objective of the study, as laid out in the TOR, is to minimise the transaction costs for the utility and the small power producers. The principles adopted to achieve the primary objective relate both to the start-up and the implementation phases of a small renewable project:
Start-up transactions costs: The transactions costs associated with submitting a proposal for a small renewable project, having it approved, obtaining all the necessary agreements and permits, should be as simple and as streamlined as possible.
On-going transactions costs: The transaction costs during the implementation phase should also be minimised. As far as possible, arrangements which require data to be collected and processed about the operation of small generating plants are to be avoided.
This immediate objective is cast in the context of objectives of the Electricity Expansion Project of which it is a part:
Improve the quality and availability of power in Kenya
Make power available to all Kenyans.
The broad national goal is to increase the supply of renewable energy into the interconnected and isolated grids.
Making these principles operational involves standardisation of procedures and automation in operation, for example, having a standardised PPAs and making small generators non-despatchable and not having penalties either for non-performance of the generator or non-availability of the transmission lines needed to evacuate the power.
These examples of standardisation and automation are intended as a preview of the discussion in this report: the framework this study is to recommend has to cater for a wide variety of situations and technologies. The main aspects which have been considered during the study are:
Project scale – different capacity limits for standardised arrangements

Kenya Small Scale Renewables: Draft Final Report June 2012
Economic Consulting Associates, Ramboll 14
Categories for promoting small-scale grid connected renewables
Technologies – wind, biomass (grown and waste considered separately), small hydro, geothermal, biogas and solar
Support instruments – different forma of net metering, standardised approaches for first come, first served approaches, solicited competitive bidding.
Transmission interconnection costs – whether these should be paid by the developer or the offtaker, or some sharing mechanism
Feed-in tariffs (FiTs) – whether technology-specific and cost reflective, or avoided cost based, and what capacity of project should be eligible.
From these issues, a number of ‘categories’ of support have been distilled and refined during the course of the study. These have been briefly previewed in Section 1.3 and are described in turn in more detail in the remainder of this section.
2.2 Category 1- Electricity Banking
Category 1 is a variant of net metering, but one which does not involve any payment being made by KPLC for surplus electricity that may be supplied into the grid. Essentially, this model is limited to customers of KPLC signing up to be generators as well as consumers of electricity. The customers continue to pay monthly fixed charges and in months when they consume more than they generate, they are charged for the net amount. In months when they generate more than they consume, they are allowed a free banking facility. By this is meant that the surplus electricity fed into the grid is recorded and this ‘saved’ balance can be drawn down and used in subsequent months. To keep things simple and minimise administrative costs, there is no charge for this banking service.
The size of the generator is limited by the fact that the existing customer connection is used for the interconnection. All types of customer should be eligible – commercial and industrial customers as well as domestic customers. The non-domestic customers could invest in relatively large generators, but given that no customer will ever be paid for any surplus, the size of a generator will tend to be scaled so that an electricity banking customer, whether domestic, commercial or industrial, will be roughly in balance over the longer run.
A single reversible meter is adequate for Electricity Banking, but in order to maintain comprehensive records of the grid-connected renewable energy generation, we recommend that Electricity Banking customers be required to install a separate meter to record the electricity generated.
2.3 Category 2 - Net Metering
Category 2 is similar to Category 1, except that the customer is paid for the net electrical energy supplied to the grid. In the simplest form of Net Metering, the customer has a reversible meter and is paid at the retail tariff for any surplus that is

Kenya Small Scale Renewables: Draft Final Report June 2012
Economic Consulting Associates, Ramboll 15
Categories for promoting small-scale grid connected renewables
produced. This arrangement is generous to the customer, because the utility continues to have to provide capacity backup and network services to evacuate the electricity that is produced, and these services are not paid for when the net surplus is bought at the retail tariff. This arrangement is offered in some countries as an incentive to encourage net metering, but is not acceptable in Kenya, where an additional concern is the loss of contribution of the net metering customers to the ‘pot’ that is used for cross-subsidising poor households.
The on-going Cost of Service (COSS) study will determine the capacity and the energy costs incurred at each voltage level and for each customer category. We recommend that the payment for net metering should be the energy charge for that customer category. It is further recommended that net metering from the start be established on a two meter system, that is separate meters for the energy that the customer draws from the grid and for the energy that is supplied to the grid. A single meter would be more in keeping with the ‘simplicity first’ mantra of this study, but in this case separate meters would have several advantages for KPLC:
Separate meters would allow for a precise estimate to be made of the renewable energy being produced by net meter customers: a single reversible meter would give net balances only.
Separate meters would allow the customer to be charged at a full rate for the energy consumed, including incorporating the rising block tariff structure. The contribution to the cross-subsidy ‘pot’ would thereby be preserved.
Separate meters would also make it possible to introduce tradable green certificates, if this was ever thought desirable for Kenya.
2.4 Recommendations and procedures for Categories 1& 2
We recommend that Electricity Banking (Category 1) by implemented immediately and Net Metering (Category 2) introduced as soon as the COSS study has generated the necessary information to set the net metering tariff for each category of consumer at the level of the energy costs of supplying that category, and has established the rules for indexation.
Electricity Banking (no payments) and Net Metering (payments for surpluses) can be facilitated in a very simple and straightforward manner:
Agreement: a simple form of agreement between the customer and the utility, which is executed at the local KPLC office, will be adequate. Allowable capacity is to be up to the existing capacity customer has with the utility.
Light handed regulation: no formal license is to be required from ERC, but ERC is to be provided with a register of Electricity Banking and Net Metering customers and is to have powers (through a regulation) with regard to safety and access to data.

Kenya Small Scale Renewables: Draft Final Report June 2012
Economic Consulting Associates, Ramboll 16
Categories for promoting small-scale grid connected renewables
Electricity banking credits: there should be full ownership of credits by electricity banking customers (ie they can carry forward credits indefinitely, and can take their credits with them when moving house provided they remain customers of KPLC).
Net metering surplus energy: Net Metering customers are to have separate meters for their purchases from the grid and for the electricity they supply into the grid. They are to be paid on a quarterly basis for surplus energy, at the agreed tariff (equivalent to the level of the energy costs of supplying that category of consumer).
2.5 Category 3 - Standardised non-negotiable PPA
Category 3 is the main focus of this study. As already explained in Section 1.3, to minimise up-front and on-going transactions costs for projects of up to 10 MW, there is to be a standardised, non-negotiable PPA, based on fixed FiT values. The projects are to be non-despatchable and will operate on a ‘best endeavours’ basis with the minimum of requirements for penalties to cater for the risk that either the small renewable or the offtaker (KPLC) will fail to perform as planned.
The detailed implications and requirements for Category 3 projects are covered under the task headings in Section 3. The seven separate deliverables are also fundamentally oriented to providing what is needed to implement renewable projects of less than 10 MW via the standardised non-negotiable PPA mechanism.
Recommendation: We recommend that the changes in FiT policy that are captured in the revised July 2012 draft be accepted. These entail the introduction of the Standardised Non-Negotiable PPA, new values for the FiTs from an updated FiT Model, Connection Guidelines for connection and operation of the generators, new application and acceptance Procedures, and the adoption of a Monitoring and Planning Tool by the FiT Committee.
2.6 Larger renewable projects (>10 MW)
Large renewable projects, which will involve the utilisation of unique natural resources, should be developed for the benefit of Kenya as a whole. An efficient way to ensure this outcome is for the Government of Kenya to identify and develop the projects up to some early point in the project cycle and then invite competitive bids from project developers. This principle has already been adopted in respect of large-scale geothermal resources, where GoK has established the Geothermal Development Company (GDC), which undertakes the upstream drilling to identify the resource and then sells on to developers, who have to bid for the sites. This is a useful way of government taking on the upstream development risks and of maximising the value of the national renewable resources that have been identified. Whenever possible, the same principle is to be adopted for other large-scale renewable resources. Careful design of the bidding process is needed in order to ensure that it is successful, an important measure of success being that the chosen

Kenya Small Scale Renewables: Draft Final Report June 2012
Economic Consulting Associates, Ramboll 17
Categories for promoting small-scale grid connected renewables
project is actually implemented (unless there are adequate bid bonds in place, projects with low bids may be abandoned).
In some cases, a bidding process would not be possible. This applies in particular to some of the wind projects where the proving of the resource has involved substantial investments being made by project sponsors, even though the Ministry of Energy has also invested significantly in wind data collection. In the case of biomass or biogas, often the feedstock is already captive on site or already owned/controlled by a private company or parastatal and a bidding process would not be appropriate.
For such projects, the cut-off of 10 MW for Category needs to be justified, given that it is to some extent arbitrary – it could be set at a somewhat higher or lower level. Taking into account the requirement that the embedded generators be connected to the distribution network, the figure of 10 MW has been chosen in part because this would be the limit for efficient transfer of power over a reasonable distance (such as 10 km). Beyond the 10 MW limit, bigger generators should be connected at higher voltage levels, and the National Control Centre really needs these bigger plants to be despatchable. Once the plants are despatchable, many of the ‘normal’ provisions of a PPA must be restored and there is no longer the basis for a standardised, non-negotiable PPA. In particular, there is need to make provision for compensation to be paid when the plant is not available, and conversely when KPLC lines are down and the electricity being generated cannot be bought.
The remaining element of standardisation is the FiT itself. Under the present FiT policy, solar and small hydro are limited to 10 MW, but a feed-in tariff is offered up to much higher limits for other technologies (40 MW for biogas, 70 MW for geothermal and 100 MW for wind and biomass). We have considered providing fixed FiTs for large projects, but after carefully reviewing the available data for each technology, have concluded that this would be an unnecessarily risky approach. The problem is that there are simply not enough projects to work from to have a reasonable level of confidence about the data that goes into the FiT Model. Offering a FiT that is based on data from a few projects which may or may not be representative would be most unsatisfactory. Once incorporated into a PPA, the FiT would be in place for a 20 year period. An inappropriately high tariff would impose a considerable burden on electricity consumers, while an inappropriately low tariff would result in a curtailment of investment at a time when new capacity relieving supply constraints on the system would have significant economic benefits.
A fairer approach is to require that tariffs be set on a project-specific basis. This will involve the use of the standard FiT Model, but with the data inputs that are specific to the project being considered. The US dollar-denominated tariff that is calculated through this approach will therefore be tailor-made to deliver the agreed 18% before tax rate of return on equity (ROE). The standardised FiT based on an ‘average’ project may or may not deliver 18% ROE in an actual project situation. Some projects will have exceptional resources or are located much closer to the grid so that the interconnection cost provision is overly large, and these should do better than 18% ROE. Other projects will be less fortunate, but their sponsors may still decide they are worth pursuing even though the ROE may be projected to be less than 18% even at the planning stage.

Kenya Small Scale Renewables: Draft Final Report June 2012
Economic Consulting Associates, Ramboll 18
Categories for promoting small-scale grid connected renewables
What is proposed for the larger projects is an assured 18% ROE before tax. This will reassure developers who have been responding to the existing framework and who may at first be disconcerted to find that a fixed FiT is in future going to be limited to 10 MW. On the KPLC side, there is need to develop the capability to carefully scrutinise and to the extent possible benchmark the proposals for larger projects. Under a system of project-specific FiTs, there is an incentive for proposers to ‘gold plate’ their projects (unnecessarily increase the capital base that forms the basis of the tariff calculation). The box below provides guidelines on identifying and dealing with the threat of gold plating.
Box – Guidelines on identifying and dealing with gold plating
Gold plating of project proposals by project promoters may be attempted through several different channels:
Inflating expected capital and operating costs
Inflating expected borrowing costs
Underestimating the available project leverage, as decreased debt:equity ratios result in lower ultimate returns to equity
Underestimating load factors
The cost factors vary for different renewables. All have in common that the costs are largely contained in the capital costs. Inflating expected costs can be accomplished through contracts with affiliates for installation and maintenance services: allocation of overhead costs and labor rates can make third-party services inflated for reporting purposes. At the construction stage, there can be discounts provided after-the-fact from the invoiced purchase price, in return for volume purchases or prompt payment. There can also be certain equipment vendor incentives above and beyond the base invoice or publicly reported cost. If there is a significant developer that does more than one project, or operates in more than one country, expenses can be allocated to certain projects and not others.
One way to limit this is to have equipment acquisition ranges that are acceptable for purposes of return calculations. Another way to do this is to ask to see pro forma invoicess with a certification by the Seller that these are the correct and only pro formas. Although these documents are typically considered confidential, this is getting more common in countries that provide certain renewable energy certificates or other virtual incentives for renewable power. Here, it could be made a condition for eventual receipt of the FiT tariff. Penalties could be linked to receipt of the full FiT value, with reduction going forward in the FiT if there is not transparency up front.
Other than cost, the key variable to change revenue projections is decreasing expected kWh output, in other words decreasing the expected load factor. With PV units, if solar data is available, it is fairly straightforward to model and calculate irradiance and corresponding kWh output by hour for different regions of Kenya. Wind and hydro technologies are less exact. With biomass and biogas projects, the economics are less intermittent and more predictable for purposes of vetting actual output.
Before large unsolicited projects can be accepted, it will have to be confirmed that they can be absorbed into the national grid without technical problems arising – a full despatch and load flow analysis may be required. There are particular concerns

Kenya Small Scale Renewables: Draft Final Report June 2012
Economic Consulting Associates, Ramboll 19
Categories for promoting small-scale grid connected renewables
about the level of wind capacity on the system, an issue which is being studied in detail as part of the preparations for the 300 MW Turkana wind project.
A further requirement for considering an unsolicited project proposal is that the project should contribute to minimising the overall costs of meeting Kenya’s demand for electricity over the life of the project. In conformity with established national LCPDP procedures, all plants of more than 30 MW should be put forward as candidate projects, and accepted for investment if they form part of the least cost development sequence that emerges from the runs of the optimisation model. The LCPDP framework can also be used to optimise project design, for example to indicate whether a hydro project should be designed as a relatively low capacity energy project or as a higher capacity peak power project. An example of this is provided by the Karura Hydropower project being promoted by KenGen. The feasibility study identified two configurations, both of which are to be treated as candidates in the LCPDP – a 67 MW energy project or a 90 MW peaking project. The best option to choose cannot be decided through the feasibility study analysis, but has to be determined in the system-wide context via the LCPDP process.
Recommendations: For large projects involving utilisation of significant national renewable resources, we recommend that Government carry out preliminary identification studies and then initiates a solicitation process. For this, a model Request for Proposal (RFP), which includes a model PPA appropriate for the scale of such projects, should be prepared, early and clear information regarding Government intentions should be publicly communicated and a phased approached may be required in sectors such as wind where many private developers in and outside of the FIT Policy have already invested significant resources. The objective would be to ensure not just a good outcome for electricity consumers but the best use of Kenya’s renewable energy resources. Projects in this category must form part of the national least cost development plan and meet loadflow/dispatch requirements and stability checks. If the Government wants the project to be developed as an IPP, interested developers have to competitively bid for the levelised price. With all the resource information given, and the bidding restricted to competent developers, the real competition will be for the lowest financing costs (best lender for the debt component and the lowest ROE).
Bidding is a solicited process over which Government has control. Care should always be exercised with unsolicited proposals for renewable projects larger than 10 MW. As for the competitive projects, these should only be considered if the projects form part of the national least cost development plan and meet loadflow/dispatch requirements and stability checks. In practical terms, the LCPDP checks will have to be made at a pre-feasibility stage and confirmed when the final costs have been confirmed in the feasibility study. Candidate renewable projects should not be made to wait for the next full iteration of the LCPDP, which has recently been put on a two year cycle. The optimisation models should be regularly run with updated lists of candidate projects (with costs measured in economic terms, that is free of any taxes), but other inputs held the same as in the previous model iteration. A project should be allowed to proceed to feasibility stage (and later to PPA negotiation) if the models show that it would contribute to a reduction in the overall national costs of meeting the current demand growth profile.

Kenya Small Scale Renewables: Draft Final Report June 2012
Economic Consulting Associates, Ramboll 20
Categories for promoting small-scale grid connected renewables
As regards tariffs, we recommend that there should be provision to offer fixed tariffs calculated to deliver 18% ROE before tax for unsolicited renewable generation projects greater than 10 MW that meet the LCPDP criterion. There is to be a standardised way of calculating these project-specific tariffs, which is the same as the method used for the FiT calculations for projects with capacities of less than 10 MW. We recommend that the excel model we have developed in this study be used for this purpose. Training in the use of the model will be given at the time of the Final Workshop (Thursday 19 July).
The PPA for a despatchable generator has to be more complex that a Category 3 PPA, as there is need to have much more detailed provisions for risks and penalties. The objective is nonetheless to keep the PPA Template as standardised as possible, thereby limiting the time and the transactions costs of the negotiation process. Our team is considering how the standard KPLC PPA template can be adapted to make this appropriate for renewable projects, limiting as far as possible the items which are open to negotiation. This is will be submitted as Separate Deliverable 7 as soon as it is available.

Kenya Small Scale Renewables: Draft Final Report June 2012
Economic Consulting Associates, Ramboll 21
Report on TOR tasks
3 Report on TOR tasks
The sections below present the results of work that has been carried out on the various tasks in the TOR. Each section is followed by recommendations, which are to be discussed and endorsed at the Final Workshop (Thursday 19 July).
3.1 Task 1 - Standardised PPAs
3.1.1 Standardised Non-negotiable PPA (Category 3)
A revised draft of the Standardised Non-negotiable PPA, which includes the purchase obligation of the offtaker, is presented as a separate deliverable attached to this report. It is based on a careful assessment our team of the following PPAs and a distillation of what is most suitable for each subject in the PPA:
Tanzania Standard SPPA (Standardised Power Purchase Agreement for Purchase of Grid- connected Capacity and Associated Electrical Energy for the Republic of Tanzania);
Sri Lanka SPPA (The standardized Small Power Purchase Agreement for the sale of Non- Conventional Renewable Energy-Based Power Plants for the Democratic Socialist Republic of Sri Lanka);
Gura Power SPPA (A Power Purchase Agreement between a tea factory in Kenya (Gura Power Company Limited) and Kenya Power and Lighting Company Limited (KPLC) for a five megawatt small hydro-electric power generation plant under the Feed –in- Tariffs Policy);
Stanbic Draft SPPA v.3 (A sample PPA from an infrastructure finance provider, Stanbic Bank).
The draft of the Standardised Non-negotiable PPA was presented at the Mid Term Workshop and the revised version incorporates all the comments and concerns raised there. It was drafted by the team’s lawyer, Catherine Kola. Comments have also been provided by Professor Steve Ferrey, an international expert in PPAs, who worked with Dr Tilak Siyambalapitiya on the standardised PPA in Tanzania.
In response to inputs from stakeholders, the Kenyan standardised non-negotiable PPA has some key provisions intended to give comfort to those financing renewable projects, which are not present in the Tanzanian and Sri Lankan standardised PPAs. These provisions, relating to payments for Deemed Energy in the event of a prolonged KPLC failure to receive supplies, and the Transfer Amount in event of premature project termination, deserve particular attention. (Paras 6.14, 6.16, 7.7.3, 11.3 and Appendix F refer).

Kenya Small Scale Renewables: Draft Final Report June 2012
Economic Consulting Associates, Ramboll 22
Report on TOR tasks
3.1.2 Standardised PPA template (Category 4)
For renewable projects larger than 10 MW, a more conventional PPA, with take-or-pay provisions, will be appropriate, but the size of the projects and the need to streamline procedures still dictates that the PPA should have as many standardised, non-negotiable clauses as possible. The negotiable clause will mainly have to do with the dispatch arrangements and payments for either party (seller or buyer) failing to meet their obligations.
The existing PPA template which was developed some years back is being assessed with a view to simplifying and standardising it as far as possible for a template to minimise the amount of negotiation needed to conclude a PPA for larger renewable projects.
3.1.3 Task 1 Recommendations
It is recommended that the Standardised Non-Negotiable PPA, which is being made available with this report as the Separate deliverable 1, be endorsed at the Final Workshop and made available immediately for PPAs being signed for projects of less than 10 MW.
Provision has been made for a Separate Deliverable 7, which in the Final Report will be the Standardised PPA Template for larger renewable projects. This is not being issued with this Draft Final Report, but will be circulated before the Final Workshop (Thursday 19 July), and is to be discussed and endorsed there.
3.2 Task 2 - Feed-in Tariffs
3.2.1 Key elements of Feed-in Tariff Policy
The starting point for the FiT concept is the idea of offering a standardised rate for the purchase of electricity which will be remunerative enough for developers to invest in a renewable energy generator which feeds into the grid. The FiT value is the result of a calculation made on the basis of assumed ‘average’ conditions which for those conditions would produce some agreed level of rate of return on equity. ‘Standardised’ implies that the tariff that is offered is not tailor-made to each project which is financed under the FiT. Projects which, relative to the assumed average conditions, have better resources, are closer to the grid, achieve lower capital and operating costs will achieve higher rates of return. Conversely, less favourably endowed projects will receive lower rates, but may still go ahead of the project promoters are willing to accept a lower rate of return than the benchmark set in the FiT calculation.
In many countries, the FiT calculations are made on the basis of the avoided costs of fossil fuel generation, and a single FiT applies for all renewable technologies. This gives a big incentive for investment in the lower cost renewable technologies. In Kenya, it has become established practice that the FiT calculation is based on a technology-specific analysis, giving rise to a range of FiT values which are

Kenya Small Scale Renewables: Draft Final Report June 2012
Economic Consulting Associates, Ramboll 23
Report on TOR tasks
calculated to deliver the same agreed rate of return on equity. This study has endorsed and expanded upon the technology-specific, average-cost approach.
Following extensive discussions during the course of the study, the main high level elements of FiT policy in Kenya which have emerged are summarised in Table 3.
Table 3 Main elements of FiT policy for on-grid projects
# Policy Element Comment / Justification
1 FiT values are calculated on a technology-specific basis
The alternative of avoided cost-based FiTs would give windfall profits to certain technologies
2 Where the calculated value exceeds the generation LRMC, as calculated in the LCPD process, the FiT that is offered for that technology will be the LRMC (currently 11.86 USc/kWh).
The LRMC cap on FiT values means that electricity consumers will not be financially penalised through the introduction of small-scale renewables onto the grid. While the situation in the power sector at present is such that any new capacity that is brought on will help to reduce the power deficit, reserve margins will have been restored to reasonable levels by as early as 2014.
3 The FiT is denominated in US dollars or alternatively Euros or Kenya Shillings as agreed.
A hard currency denominated tariff reflects the normal capital and operational cost and financing structure of RE projects in Kenya. A pass-through charge neutralises any impact on the offtaker.
4 The FiT is calculated for certain specific capacities, with a linear interpolation being used to set the FiT based on the actual capacity of the project
Linear interpolation is appropriate where technologies exhibit large economies of scale. Linear interpolation rather than broad size categories avoids providing incentives for developers to opt for smaller capacities than they could, wasting national RE resources
5 The project developer can choose a single FiT value to apply for the duration of the PPA (the Standard FiT option) or can choose to have a FiT which is higher in the early years and drops to a (fixed) lower value thereafter (the Front Loaded FiT option)
The Front Loaded option is calculated to give approximately the same ROE to the investor, but permits higher cash flows in early years so that the DSCR requirements of the banks can be met. Banks may not lend under the Standard FiT if this means low DSCRs in early years. The choice is offered only at the start of the project and cannot be changed thereafter.
6 The FiT applicable at the time a PPA is signed is the fixed value which will apply over the 20 year life of the PPA, except for that the O&M component of the FiT will be subject to annual indexation using the Consumer Price Index corresponding to the currency in
Due to a current lack of local expertise and equipment for most project technologies, a large portion of O&M costs will be tied to imported goods and services. The investor is offered indexation on the full O&M component, denominated in US dollars, at

Kenya Small Scale Renewables: Draft Final Report June 2012
Economic Consulting Associates, Ramboll 24
Report on TOR tasks
which the tariff is denominated (i.e. US CPI for a US denominated FiT)
the US CPI rate of inflation.
For off-grid projects, we argue in the next section that there may be (limited) scope for renewables, particular solar PV. In this case, the cap on the calculated FiT is not applied, given that the avoided cost of diesel generation is significantly higher (currently in excess of 30 USc/kWh) than the cost of renewables.
3.2.2 Revised FiT Model and the data assumptions made
Model structure
Building on the cash flow approach already adopted by the FiT Committee in the past, we have developed a refined model that has the following features:
a single sheet for the data inputs;
a calculation sheet with a drop-down menu to choose the technology;
an outputs sheet where the full set of results for all technologies can be recorded by running some simple macros.
The structure of the model is illustrated in the Figure 7 below.
Figure 2 Overview of FiT Model structure
The calculation sheet provides a full cash flow analysis over the construction period (2 years) and the PPA period (20 years as default, but this can be changed). The ‘bottom line’ is the returns to the equity investor. The FiT is calculated as the value of the tariff needed to provide the required ROE. A similar calculation is required to calculate the two values for the Front Loaded FiT option, except that it also ensures a minimum Debt Service Coverage Ratio (DSCR)2 is achieved.
2 The DSCR indicates the extent to which project cash flows cover debt servicing requirements. More specifically, it is calculated as net operating cash flows (after interest paid) divided by the principal paid on loan. The DSCR provides only an approximate indication given that the model forecasts cash

Kenya Small Scale Renewables: Draft Final Report June 2012
Economic Consulting Associates, Ramboll 25
Report on TOR tasks
Generic assumptions
The generic assumptions (those not associated with a particular technology) which are made in the current version of the model are summarised in Table 4.
Table 4 FiT Model assumptions, not technology specific
Item Value Comment
FiT duration 20 years This is set in the PPA, but the model still has the flexibility to calculate FiTs of a duration up to 50 years.
Cost of debt 8.0% This assumes some concessional financing (which will typically vary between 6 and 10%) on the basis that there is significant amounts currently available in Kenya and more potentially becoming available in the future. The estimate can be revised upwards towards commercial lending terms once concessional financing is no longer available in Kenya.
Loan period 10 years Loan periods are likely to be between 8-12 years for most investments receiving concessional financing. Strictly commercial terms may be less and therefore (as above) this estimate should be revised once concessional financing is no longer available in Kenya.
Cost of equity
18% pre-tax Investors have been calling for 18% post tax to be used in setting FiTs. Given current depreciation allowances and other tax breaks for energy investments and or renewables, we expect that the realised post-tax return of equity will be at least 18% for the first 10 years of the project.
Initial gearing
70% The share of debt in investments is expected to be between 60% and 80%.
Residual value
- No residual value is included. Most renewable technologies have an asset life of around 20 years and any revenues post-20 years are not especially significant once discounting is applied. Post PPA arrangements will take account of residual value.
Technology specific assumptions
To estimate load factors and the costs of different RES technologies for different size categories we use data from prospective RES investors in Kenya. In-country experts have reviewed and commented on our estimates, including staff at the Kenya Association of Manufacturers that have reviewed over 66 prospective renewable projects in Kenya. We have also used studies where available, for example the GIZ study on biogas in Kenya. The reliability of our estimates varies somewhat by
flows on a pre-tax basis – actual tax paid will vary significantly from year to year depending on the tax laws of the day.

Kenya Small Scale Renewables: Draft Final Report June 2012
Economic Consulting Associates, Ramboll 26
Report on TOR tasks
technology – we have data on over 30 different prospective hydro projects to rely on, but significantly fewer for the other technologies with around 5 for wind and only a handful for biomass, biogas, geothermal, and solar. The assumptions should be updated and refined based on data from actual investments in Kenya as it becomes available.
Our technology-specific assumptions are as follows:
Reference capacity size – This is the size of the generator that we assume when estimating load factors and cost inputs. For wind, geothermal, and solar we use 5MW because it is the midpoint of the 0-10MW capacity range. Economies of scale in this size range is low for these technologies so the chosen reference capacity is not especially significant. For biogas, biomass, and hydro we use different reference capacities as there is strong economies of scale. For the 0-1 MW category we use a reference of 1MW, given that we want to avoid encouraging costly micro-generators. For the 0-10 MW range we use a reference of 10MW, as tariffs are calculated as linear interpolation between 1 the FiTs at 1 MW and 10 MW.
Load factors – The load factors we assume are shown in Figure 3 below, alongside approximate averages observed in Europe. It shows that most load factors are broadly in line with those in Europe, although wind and hydro load factors in Kenya are particularly high by international standards, reflecting the good wind flow and hydrology3 in Kenya.
3 The high load factors in Kenya may also reflect that fact that many European hydro load factors are based on storage dams with lower capacity factors but higher energy output/ability to meet peaking demand

Kenya Small Scale Renewables: Draft Final Report June 2012
Economic Consulting Associates, Ramboll 27
Report on TOR tasks
Figure 3 Load factors by technology
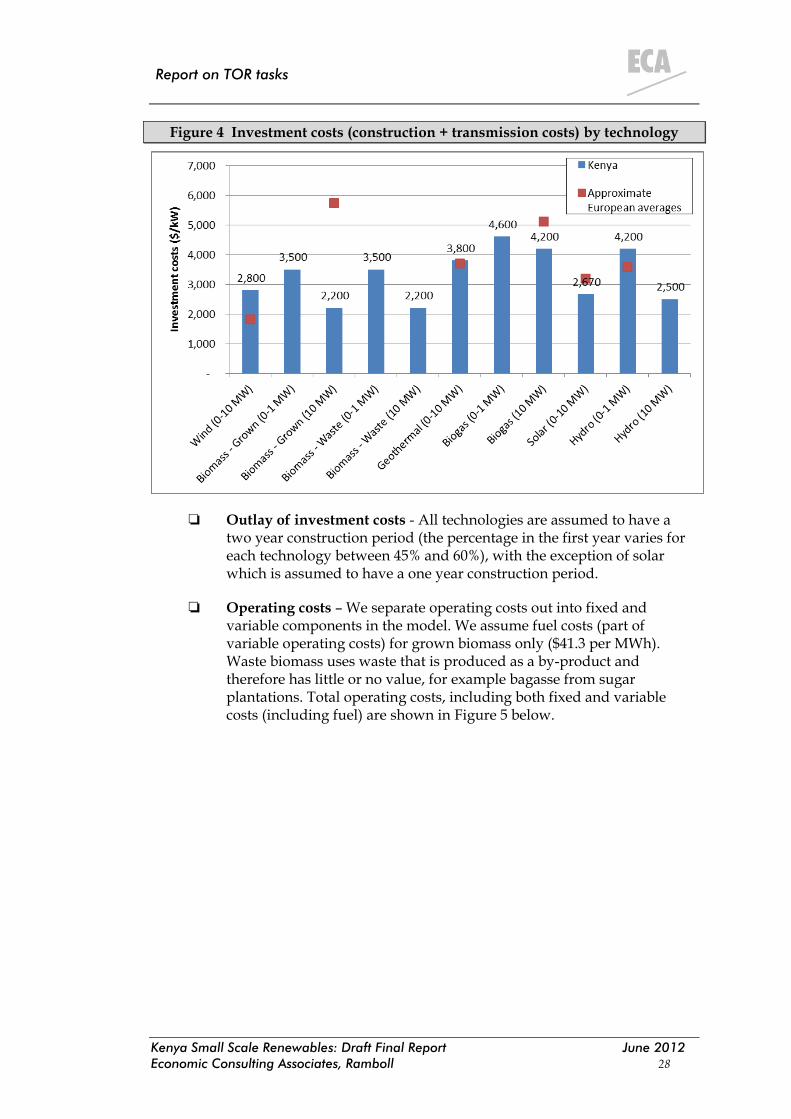
Construction costs – The estimates we use vary between $2,000 and $4,000 per kW of installed capacity by technology. These estimates include the costs of feasibility studies, development of the site, and construction of the generating facility. Costs also include any applicable taxes and waivers (VAT, import duties etc.). We explicitly add interest during construction on to both construction and transmission costs in the model. Figure 4 below shows total costs (including transmission costs but excluding interest during construction) alongside approximate averages observed in Europe. One observation is that the construction costs of wind are significantly higher in Kenya than Europe owing primarily to the fact that specialized transport and installation equipment is not normally available in the country. Concrete and steel prices are also significantly higher in Kenya. By contrast biomass costs are significantly lower, likely due to the source of equipment used in biomass power plants in Kenya.
Transmission costs - Transmission line costs are based on an assumption of 10km of 33kv line for every technology at a cost of $50,000 per km. Substation costs are based on assumed costs of 0.5m for a 1 MVA substation, 1.0m for a 5 MVA substation, and 1.5m for a 10 MVA substation.
Kenya Small Scale Renewables: Draft Final Report June 2012
Economic Consulting Associates, Ramboll 28
Report on TOR tasks
Figure 4 Investment costs (construction + transmission costs) by technology
Outlay of investment costs - All technologies are assumed to have a two year construction period (the percentage in the first year varies for each technology between 45% and 60%), with the exception of solar which is assumed to have a one year construction period.
Operating costs – We separate operating costs out into fixed and variable components in the model. We assume fuel costs (part of variable operating costs) for grown biomass only ($41.3 per MWh). Waste biomass uses waste that is produced as a by-product and therefore has little or no value, for example bagasse from sugar plantations. Total operating costs, including both fixed and variable costs (including fuel) are shown in Figure 5 below.

Kenya Small Scale Renewables: Draft Final Report June 2012
Economic Consulting Associates, Ramboll 29
Report on TOR tasks
Figure 5 Operating costs (fixed + variable) by technology
3.2.3 Proposed FiT values
Standard FiTs
The Standard FiTs calculated by the model, using the data assumptions and approaches described in the previous section, are summarised in Figure 6 below. The policy that the offered FiTs must not exceed the LRMC implies that the standard FiTs for wind and solar will be capped at 11.86 c/kWh, alongside grown biomass, biogas, and hydro which will be capped at certain sizes (depending on the linear interpolation between 1 and 10 MW,).

Kenya Small Scale Renewables: Draft Final Report June 2012
Economic Consulting Associates, Ramboll 30
Report on TOR tasks
Figure 6 Standard FiTs
Front Loaded FiTs
The Front Loaded tariff is calculated to improve debt service coverage while ensuring that the investor’s return on equity is the same as under the standard tariff – in other words, the initial increase in the tariff is offset by a commensurate decrease in the latter years.
To achieve a minimum debt service coverage ratio of approximately 1.5, the Front Loaded tariff is equal to the Standard Tariff multiplied by the following adjustments:
Years 1 to 10 = 110% (i.e. 10% above the standard tariff).
Years 11 to 20 = 50% (i.e. 50% below the standard tariff)
These adjustments ensure that a return of equity of approximately 18% is still achieved.4
The Front Loaded FiT for wind is shown in Figure 7 below. Note that the Standard FiT is capped at 11.86 and the front load adjustments of 110% and 50% are applied to this capped figure.
4 The exact adjustments required to achieve the minimum DSCR do differ somewhat by technology, but not significantly enough to warrant the complexity of varying adjustments by technology. At these standardised adjustments all technology categories are within 1 percentage point of the target return on equity and a minimum DSCR of 1.4 or greater is achieved in all cases.

Kenya Small Scale Renewables: Draft Final Report June 2012
Economic Consulting Associates, Ramboll 31
Report on TOR tasks
Figure 7 Front Loaded FiT - wind
Based on the existing cost inputs and parameters, achieving a minimum DSCR of 1.7 or greater cannot be achieved through a Front Loaded tariff, as the tariff in years 11 to 20 would need to be negative to make up for the large initial increase. This is highly sensitive to assumptions about lending terms.
Linear tariffs
Linear tariffs are used for technologies which exhibit strong economies of scale and therefore the tariff should depend on the size of the installation, otherwise larger installations will make windfall profits. Linear tariffs are preferable to fixed size categories which distort investor incentives when sizing their generating plant.
The equations for linear FiTs (before the cap is applied) are as follows:
Biomass – Grown: 14.41 - 0.349*capacity
Biomass - Waste: 10.12 - 0.347*capacity
Biogas: 14.24 - 0.259*capacity
Hydro: 13.03 - 0.41*capacity
FiTs are to be calculated using 1 MW increments of installed capacity. In other words, the calculated FiT for a 9.4MW generator is based on 9MW, whereas a 1.6MW generator has a calculated FiT based on the 2MW increment. An illustration of the linear tariff for hydro generators between 1 and 10 MW is shown in the figure below.

Kenya Small Scale Renewables: Draft Final Report June 2012
Economic Consulting Associates, Ramboll 32
Report on TOR tasks
Figure 8 Linear tariffs – hydro 1-10 MW
Indexed Component
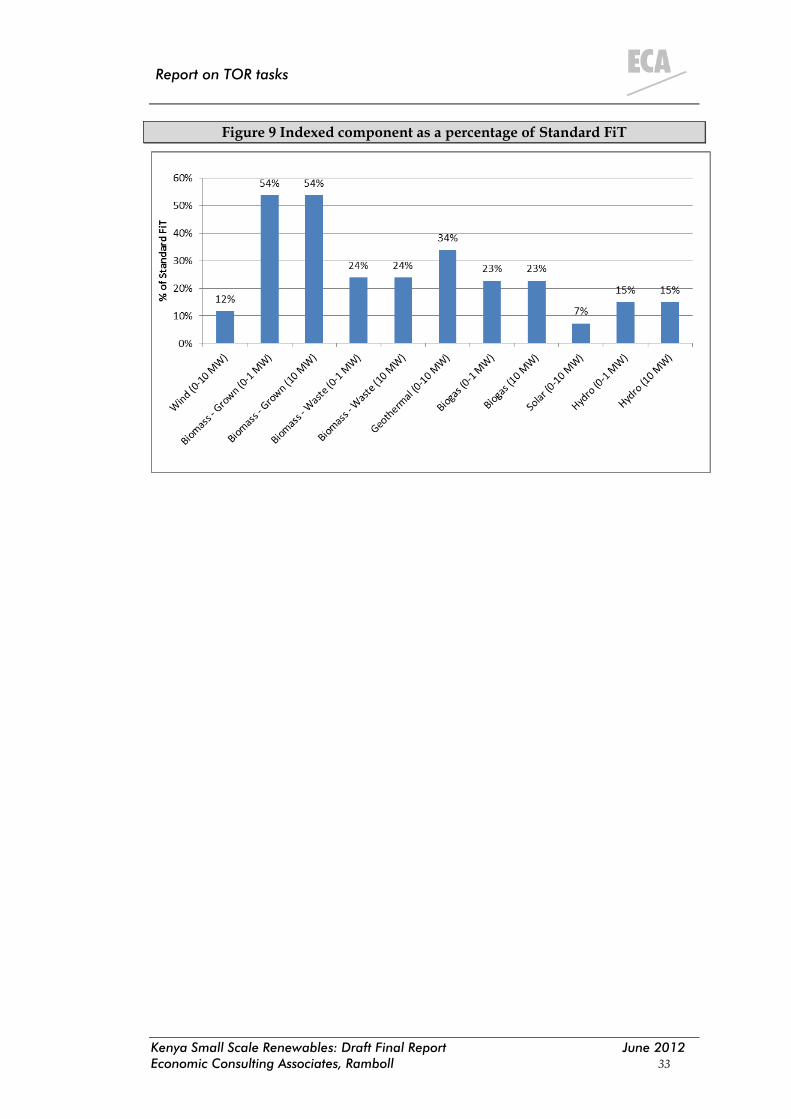
As discussed earlier in this section, a US dollar FiT will be subject to annual indexation using the US Consumer Price Index. Only the portion of the tariff that relates to operating costs is indexed. The Indexed Component5 as a percentage of the Standard FiT is shown in Figure 9 below.
5 The Indexed Component is calculated as the Standard FiT (after the cap is applied) multiplied by operating costs as a percentage of the calculated (uncapped) FiT.
Kenya Small Scale Renewables: Draft Final Report June 2012
Economic Consulting Associates, Ramboll 33
Report on TOR tasks
Figure 9 Indexed component as a percentage of Standard FiT
Kenya Small Scale Renewables: Draft Final Report June 2012
Economic Consulting Associates, Ramboll 34
Report on TOR tasks
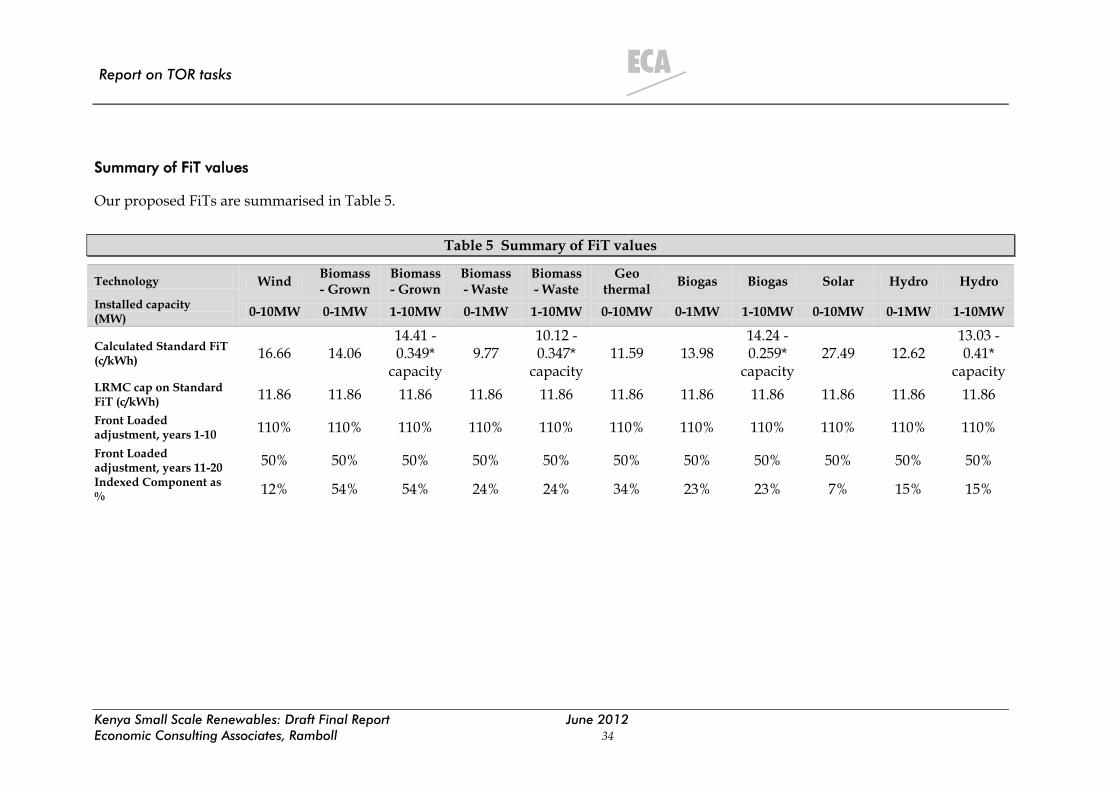
Summary of FiT values
Our proposed FiTs are summarised in Table 5.
Table 5 Summary of FiT values
Technology Wind Biomass - Grown
Biomass - Grown
Biomass - Waste
Biomass - Waste
Geo thermal
Biogas Biogas Solar Hydro Hydro
Installed capacity (MW)
0-10MW 0-1MW 1-10MW 0-1MW 1-10MW 0-10MW 0-1MW 1-10MW 0-10MW 0-1MW 1-10MW
Calculated Standard FiT (c/kWh)
16.66 14.06 14.41 - 0.349*
capacity 9.77
10.12 - 0.347*
capacity 11.59 13.98
14.24 - 0.259*
capacity 27.49 12.62
13.03 - 0.41*
capacity LRMC cap on Standard FiT (c/kWh)
11.86 11.86 11.86 11.86 11.86 11.86 11.86 11.86 11.86 11.86 11.86
Front Loaded adjustment, years 1-10
110% 110% 110% 110% 110% 110% 110% 110% 110% 110% 110%
Front Loaded adjustment, years 11-20
50% 50% 50% 50% 50% 50% 50% 50% 50% 50% 50%
Indexed Component as %
12% 54% 54% 24% 24% 34% 23% 23% 7% 15% 15%

Kenya Small Scale Renewables: Draft Final Report June 2012
Economic Consulting Associates, Ramboll 35
Report on TOR tasks
The resulting FiT values in 1MW capacity increments are summarised in the tables below.
Table 6 Standard FiT by capacity increment
Standard FiT (c/kWh)
Installed capacity
(MW) Wind
Biomass - Grown
Biomass - Waste
Geo thermal
Biogas Solar Hydro
1 11.86 11.86 9.77 11.59 11.86 11.86 11.86 2 11.86 11.86 9.43 11.59 11.86 11.86 11.86 3 11.86 11.86 9.08 11.59 11.86 11.86 11.80 4 11.86 11.86 8.73 11.59 11.86 11.86 11.39 5 11.86 11.86 8.39 11.59 11.86 11.86 10.98 6 11.86 11.86 8.04 11.59 11.86 11.86 10.57 7 11.86 11.86 7.69 11.59 11.86 11.86 10.16 8 11.86 11.62 7.34 11.59 11.86 11.86 9.75 9 11.86 11.27 7.00 11.59 11.86 11.86 9.34
10 11.86 10.92 6.65 11.59 11.65 11.86 8.93
Table 7 Front Loaded FiT by capacity increment
Front Loaded FiT, years 1-10 (c/kWh)
Installed capacity
(MW) Wind
Biomass - Grown
Biomass - Waste
Geo thermal
Biogas Solar Hydro
1 13.05 13.05 10.75 12.75 13.05 13.05 13.05 2 13.05 13.05 10.37 12.75 13.05 13.05 13.05 3 13.05 13.05 9.99 12.75 13.05 13.05 12.98 4 13.05 13.05 9.61 12.75 13.05 13.05 12.53 5 13.05 13.05 9.22 12.75 13.05 13.05 12.08 6 13.05 13.05 8.84 12.75 13.05 13.05 11.63 7 13.05 13.05 8.46 12.75 13.05 13.05 11.18 8 13.05 12.78 8.08 12.75 13.05 13.05 10.73 9 13.05 12.40 7.70 12.75 13.05 13.05 10.27
10 13.05 12.01 7.32 12.75 12.82 13.05 9.82

Kenya Small Scale Renewables: Draft Final Report June 2012
Economic Consulting Associates, Ramboll 36
Report on TOR tasks
Front Loaded FiT, years 11-20 (c/kWh)
Installed capacity
(MW) Wind
Biomass - Grown
Biomass - Waste
Geo thermal
Biogas Solar Hydro
1 5.93 5.93 4.89 5.80 5.93 5.93 5.93
2 5.93 5.93 4.71 5.80 5.93 5.93 5.93
3 5.93 5.93 4.54 5.80 5.93 5.93 5.90
4 5.93 5.93 4.37 5.80 5.93 5.93 5.70
5 5.93 5.93 4.19 5.80 5.93 5.93 5.49
6 5.93 5.93 4.02 5.80 5.93 5.93 5.29
7 5.93 5.93 3.85 5.80 5.93 5.93 5.08
8 5.93 5.81 3.67 5.80 5.93 5.93 4.88
9 5.93 5.63 3.50 5.80 5.93 5.93 4.67
10 5.93 5.46 3.33 5.80 5.83 5.93 4.47
Table 8 Indexed Component by capacity increment
Indexed component (c/kWh)
Installed capacity
(MW) Wind
Biomass - Grown
Biomass - Waste
Geo thermal
Biogas Solar Hydro
1 1.38 6.36 2.33 3.93 2.69 0.86 1.77
2 1.38 6.36 2.25 3.93 2.69 0.86 1.77
3 1.38 6.36 2.17 3.93 2.69 0.86 1.76
4 1.38 6.36 2.08 3.93 2.69 0.86 1.70
5 1.38 6.36 2.00 3.93 2.69 0.86 1.64
6 1.38 6.36 1.92 3.93 2.69 0.86 1.58
7 1.38 6.36 1.83 3.93 2.69 0.86 1.52
8 1.38 6.23 1.75 3.93 2.69 0.86 1.45
9 1.38 6.05 1.67 3.93 2.69 0.86 1.39
10 1.38 5.86 1.59 3.93 2.64 0.86 1.33
3.2.4 Comparison with international FiT values
The figures below show our proposed Standard FiT values for Kenya (after caps are applied) in comparison with those used internationally.

Kenya Small Scale Renewables: Draft Final Report June 2012
Economic Consulting Associates, Ramboll 37
Report on TOR tasks
Figure 10 Comparison with FiTs internationally - wind
Figure 11 Comparison with FiTs internationally - biomass

Kenya Small Scale Renewables: Draft Final Report June 2012
Economic Consulting Associates, Ramboll 38
Report on TOR tasks
Figure 12 Comparison with FiTs internationally - solar
Figure 13 Comparison with FiTs internationally - hydro
3.2.5 Task 2 Recommendations
Our recommendations on the key policy provisions that should be adopted are encapsulated in the Revised Draft FiT Policy which is attached to this report as a separate deliverable. They include the following:
Technology-specific FiT values are offered for all small-scale renewable projects (capacity up to 10 MW);

Kenya Small Scale Renewables: Draft Final Report June 2012
Economic Consulting Associates, Ramboll 39
Report on TOR tasks
FiT values (for grid-connected projects) are capped at the national LRMC as calculated as part of the Least Cost Power Development Plan process;
Developer can choose a single FiT value to apply for the duration of the PPA (the Standard FiT option) or can choose to have a FiT which is higher in the early years and drops to a (fixed) lower value thereafter (the Front Loaded FiT option);
The FiT value/s (applicable at the time a PPA is signed) is fixed for the life of the PPA, except for the O&M component (the Indexed Component) of the FiT which will be indexed to inflation;
FiTs for small renewable projects (up to 10 MW) do not differentiate between firm and non-firm energy;
FiT values vary depending on the capacity of the power plant for biomass, biogas, and hydro given that these technologies exhibit strong economies of scale. Linear interpolation of tariffs between 1 and 10 MW is used to prevent distorting developer’s decisions about the size of plant to install. FiTs apply to the closest 1 MW increment of installed capacity;
Different FiTs are offered for two different types of biomass – waste and grown. This is because ‘Biomass – Waste’ plants using agricultural waste (including bagasse) or municipal waste have zero or low fuel cost, whereas ‘Biomass – Grown’ plants using agricultural products (grown specifically for the purpose of burning as fuel for power plants), bio-fuels and fuel wood do have significant fuel costs.
The cost inputs and assumptions used to calculate FiT values are based on past and planned small renewable projects in Kenya, after review and comparison with costs internationally.
We also recommend that the new FiT Model be used to update and revise FiT values in the future. They should be updated on a semi-regular basis (every 2 to 3 years) to reflect:
Changes in the underlying cost of technologies. For example solar PV investment costs have been decreasing rapidly in recent years, by as much as 20% per year, although the calculated FiT for solar is unlikely to fall below the LRMC cap any time soon;
The availability of renewable resources in Kenya. For example, once all the very good hydro sites are developed the assumed load factor may need to be decreased;
The availability of input data. As new renewable investments are made, data on the actual costs of investments and the amount of energy supplied will help refine the assumptions in the model;

Kenya Small Scale Renewables: Draft Final Report June 2012
Economic Consulting Associates, Ramboll 40
Report on TOR tasks
Changes in the LRMC of electricity. The cap (and therefore FiTs) should be adjusted each time it is updated as part of the LCPD process.
Policy makers should make clear that regular adjustments to FiTs will be based on the same methodology and model, thereby avoiding creating too much uncertainty for prospective investors. The FiT Policy itself need not be automatically reviewed on a regular basis.
The FiT Model and the methodology it applies should also be used to calculate FiTs for renewable investments larger than 10MW. This FiT Model has the functionality to do so.
3.3 Task 3 - Engineering standards
3.3.1 Guidelines for Grid Connection of Small Renewable Generators
Standalone Deliverable 2 is entitled Guidelines for the Connection of Small Renewable Generating Plant to the Electrical Distribution Networks of Kenya. The purpose of the Guidelines is to establish procedures and equipment to protect personnel, equipment, and network operator’s systems from any harmful effects arising from connection and operation of generators supplied and operated by others. They are intended to inform the owners of generators of the host network operator’s requirements for Generating Plant being connected to its System.
The main focus of the Guidelines is on the embedded Category 3 generators. An embedded generator is a single generator or a group of generating plant with a total export capacity below 10 MW, connected to a distribution network at 33 kV or below and not under the direct control of the systems operator. The Guidelines also, however, deal with requirements for Category 1 and 2 generators (Electricity Banking and Net Metering).
The Guidelines provide a comprehensive analysis of issues that may arise when connecting embedded generators to distribution networks in Kenya, dealing with types of interconnection, voltages, studies required, protection requirements, and the testing and certification procedure of embedded generators. These guidelines are for information only and are subsidiary to the mandatory requirements governing the connection of Generators set out in the Kenyan Grid Code (once this is formally adopted).
3.3.2 Guidelines content
The introductory sections of the Guidelines deal with the scope, definitions of technical terms and legal aspects. The substantive sections are as follows:
Capacity limits and connection voltage
This short section sets out the limits on generator capacity which can normally be accommodated at each system voltage.

Kenya Small Scale Renewables: Draft Final Report June 2012
Economic Consulting Associates, Ramboll 41
Report on TOR tasks
Connection application
This section sets out the information exchange between the prospective generator and the host network operator.
Connection arrangements
This section describes the different operational modes of generating plant at each connection, focussing primarily on long-term parallel operation i.e. operation principally for exporting energy to the grid.
Generating plant connection, design and operation
This section explains the quality of supply parameters within which the network operator controls his system. Generators must support the safe and secure operation of the network.
Protection
This section gives details of the protection systems which must be in place and tested prior to energisation such that generators can assist in the management of disturbances on the network. This section forms a major part of the Guidelines.
Earthing
Appropriate earthing is a critical safety issue. The different earthing arrangements for HV and LV connected generators is discussed.
Installation, operation and control interface
The installation is largely covered by local legislation and international standards. It is important that both the equipment and its installation are compliant. Use of a Site Responsibility Schedule agreed between the network operator and the generator is recommended.
Testing and commissioning
There are significant differences in the testing and commissioning processes between very small generating plant, where type testing and approval applies, and larger systems where site-specific testing is required.
Reference standards (provided as an Appendix)
These are provided as a guide to UK/European approved standards.
The Guidelines are based on internationally recognised standards which have been adapted to the specific circumstances of Kenya and includes a reference table for UK and European standards. They also include example line diagrams.
Kenya Small Scale Renewables: Draft Final Report June 2012
Economic Consulting Associates, Ramboll 42
Report on TOR tasks
3.3.3 Task 3 Recommendations
There is need for the Guidelines to be discussed, both at the Final Workshop and at the Technical Training Session which is to be held in the same week. It is anticipated that further refinement may be required to fully reflect the specific circumstances of small scale renewables in Kenya. Issues raised in these discussions will be incorporated in the final version of the Guidelines.
3.4 Task 4 - Grid integration – operations
3.4.1 Operational integration of small renewables
When considering a generator from an operational information perspective there are three factors to consider:
How big is it?
How predictable is it?
Can it be controlled?
Is this an accurate control of its output; or
Just the ability to shut it down in an emergency?
For systems operators, the worst case is a large uncontrollable and unpredictable generator. A fully controllable generator is ideal, while a predictable generator is acceptable.
At the Mid Term report stage, we considered the above questions for generators of up to 100 MW and discussed the implications of a growing share of national demand being met from large-scale renewables, with particular attention to wind. This discussion was necessarily at a rather high level, because we have not had sight of the detailed load flow and stability studies which have been carried out in connection with the 350 MW Lake Turkana project.
Given that agreement emerged to limit the FiT mechanism to embedded generators of less than 10 MW, the room for manoeuvre of the system operators in relation to the questions in the first paragraph is sharply reduced. The embedded, non-despatchable generators are not controllable and not individually predictable but once experience is gained, become reasonably predictable in aggregate. However, some limit needs to be set on non-despatchable capacity, and a figure of 10% of maximum demand is proposed. This is discussed further in the next sub-section.
For a renewable energy project with a capacity of more than 10 MW, we are recommending (see Section *) that it be permitted to go ahead with a tailor-made tariff only if it contributes to the least cost power development sequence and passes load flow and stability tests. There is thus no need to specify an overall cap on any particular technology type, because each project that is put forward will be

Kenya Small Scale Renewables: Draft Final Report June 2012
Economic Consulting Associates, Ramboll 43
Report on TOR tasks
examined in relation to the existing and upcoming generation mix. The approach recommended will instead allow the continuous reassessment of the ability of the grid to absorb increasing quantities of specific renewable resources, notably wind.
Besides the systems operator, concerns about the absorption of increasing numbers of small renewable generators have also been raised by existing electricity users, who fear that the embedded generators may exacerbate the already significant stability and voltage problems with which the KPLC distribution system is plagued. In addressing these concerns, it has to be noted that there may occasionally be specific local circumstances where problems could occur, but in general it is likely that the embedded generators will improve conditions on the distribution lines rather than worsening them. In particular, generators located at the far end of long distribution lines will help to provide voltage support on those lines.
3.4.2 Task 4 Recommendations
For the embedded, non-despatchable Category 3 generators, we recommend that an aggregate capacity limit of 10% of system-wide maximum demand be set. Setting the limit in this way allows the absolute number of MW of embedded capacity to grow in tandem with overall system growth.
The figure of 10% is at this stage somewhat arbitrary, but is a level with which the National Control Centre feels comfortable and is the level achieved in Sri Lanka without any technical problems arising. As experience is gained, the 10% figure should be reviewed. The Monitoring and Planning Tool (see Task 6) will be used to monitor the growth in total installed capacity of the embedded generators. When this approaches the 10% limit, and if there is at that time a significant pipeline of small renewable projects which would take the total over 10%, we would recommend that a comprehensive study should then be carried out to examine whether a higher level of embedded capacity could be accommodated.
3.5 Task 5 - Isolated grids
3.5.1 The load characteristics of isolated grids
To date, there is approximately 18 MW of installed off-grid capacity, which is operated mainly by KPLC. The basic generation is mostly small diesels at present, and hence the variable operating cost of these grids is high (reportedly between 35 USc/kWh and over 60 USc/kWh. However customers on these grids are charged at national tariffs, so there is a significant cross subsidy in place. The tariff mechanism is such that all grid-connected customers contribute to subsidising the off-grid customers.
The heavy subsidies provide a prima facia case for examining whether some of the diesel generation can be replaced by renewables. The immediate problems that are faced, however, are as follows:
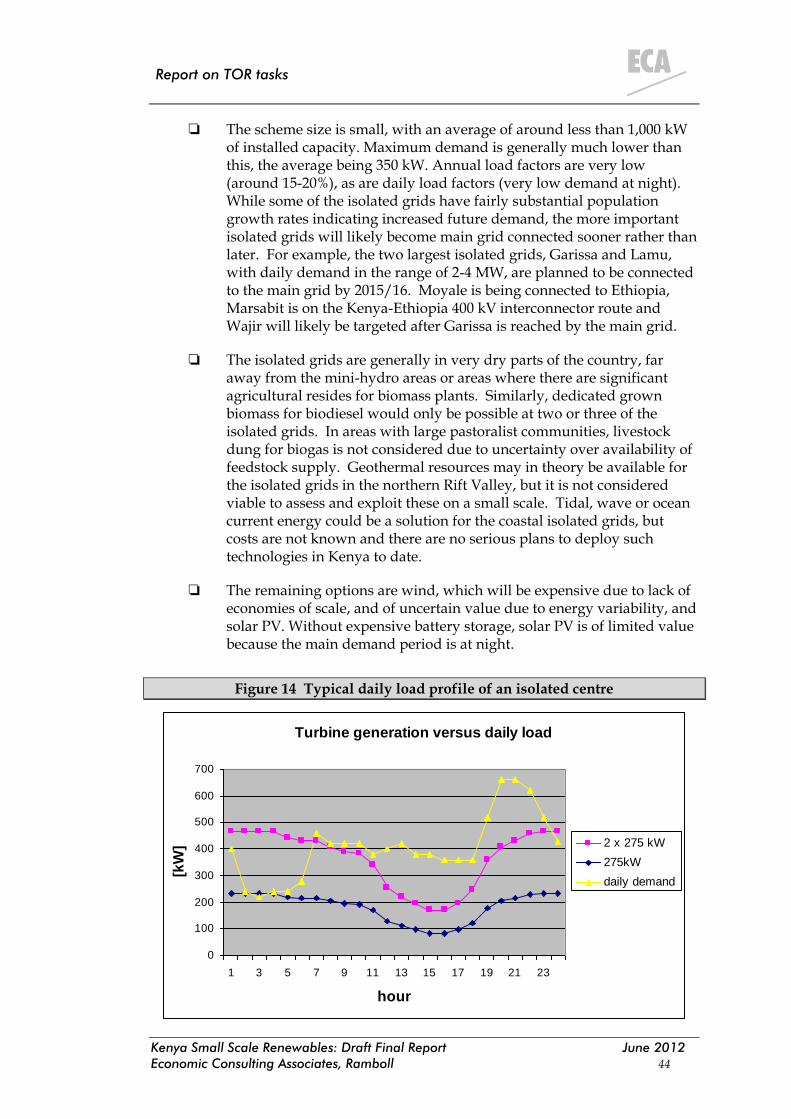
Kenya Small Scale Renewables: Draft Final Report June 2012
Economic Consulting Associates, Ramboll 44
Report on TOR tasks
The scheme size is small, with an average of around less than 1,000 kW of installed capacity. Maximum demand is generally much lower than this, the average being 350 kW. Annual load factors are very low (around 15-20%), as are daily load factors (very low demand at night). While some of the isolated grids have fairly substantial population growth rates indicating increased future demand, the more important isolated grids will likely become main grid connected sooner rather than later. For example, the two largest isolated grids, Garissa and Lamu, with daily demand in the range of 2-4 MW, are planned to be connected to the main grid by 2015/16. Moyale is being connected to Ethiopia, Marsabit is on the Kenya-Ethiopia 400 kV interconnector route and Wajir will likely be targeted after Garissa is reached by the main grid.
The isolated grids are generally in very dry parts of the country, far away from the mini-hydro areas or areas where there are significant agricultural resides for biomass plants. Similarly, dedicated grown biomass for biodiesel would only be possible at two or three of the isolated grids. In areas with large pastoralist communities, livestock dung for biogas is not considered due to uncertainty over availability of feedstock supply. Geothermal resources may in theory be available for the isolated grids in the northern Rift Valley, but it is not considered viable to assess and exploit these on a small scale. Tidal, wave or ocean current energy could be a solution for the coastal isolated grids, but costs are not known and there are no serious plans to deploy such technologies in Kenya to date.
The remaining options are wind, which will be expensive due to lack of economies of scale, and of uncertain value due to energy variability, and solar PV. Without expensive battery storage, solar PV is of limited value because the main demand period is at night.
Figure 14 Typical daily load profile of an isolated centre
Turbine generation versus daily load
0
100
200
300
400
500
600
700
1 3 5 7 9 11 13 15 17 19 21 23
hour
[kW
] 2 x 275 kW
275kW
daily demand

Kenya Small Scale Renewables: Draft Final Report June 2012
Economic Consulting Associates, Ramboll 45
Report on TOR tasks
To illustrate, see Figure 14, which is the daily load curve for the Marsabit isolated grid (one sample day in July 2008 as provided by Kenya Power for the Rural Electrification Master Plan update). On that day, the total demand was about 30% higher than the average demand in 2008. Nevertheless the curve is considered as typical and representative for Marsabit. It is compared with forecasted wind turbine generation. Since then, the wind turbines have been installed and commissioned, but it is not known how their actual performance compares with this forecast. The relevant aspect is the yellow line that indicates the daily demand curve at the Marsabit isolated grid.
In order to ensure security of supply, diesels will still be necessary, so the issue is whether hybrid systems, with renewables playing some role in reducing the diesel consumption, can be made viable. Through retrofitting wind and solar, the Government of Kenya has taken the initiative in developing pilot hybrid projects. In Marsabit, for example, which has maximum demand of 600 kW, 500 kW of wind has been installed alongside 4 diesel generators with a capacity range of 120 kW to 600 kW. In Hola, which has a maximum demand of 280 kW, 60 kW of solar PV has been installed alongside 2 diesel generators each with a capacity of 400 kW. Habaswein has 30 kW solar PV array to complement the 360 kW of diesel and in Merti a 10 kW solar system is integrated with the 128 kW of diesel.
The preferred approach to small scale renewables that has been developed in this study – of RE generators operating on a must run, must take basis – is possible in the national grid (at least up to some proportion of maximum demand, this initially being set at 10%), but is not tenable in a small system of less than 1 MW. If the renewable generator is designed to have a capacity larger than the daytime demand trough in the isolated system, there would be times when the renewable capacity would have to be shed. Conversely, generation may sometimes be unexpectedly inadequate, for example, in a solar system there may be problems of low afternoon generation due to overheating, although fortunately in many locations wind speeds also pick up I the afternoon, providing useful cooling. To date the Kenya Power off-grid stations department reports no issues with the newly integrated solar PV systems, although these were only commissioned recently. In a wind hybrid, diesel will have to be kept in operation to cover the risk of the wind generation tripping, in particular the case where the trip is due to too high a wind speed. When a wind trip occurs there is a significant shock to the diesels – the governors must be correctly designed to pick-up quickly (ie, electronic governors, not pneumatic ones).
The detailed management that is required to achieve reliable and least cost operation of a small isolated hybrid system does not preclude a role for renewable IPPs, but makes it impossible to supply a simple integration formula that would work in all circumstances. In the face of these realities, the approach that the Government has been advocating, of offering centres to private operators on a concession basis, with the expectation that these be run as hybrid systems, seems very relevant at this juncture. PPP or ESCO approach rather than IPP is the best way to go, being relevant to the small system size.
A PPP approach removes the need for government to micro-manage the penetration of renewables into isolated grid supply and we understand that the Ministry of Energy has commissioned a separate study to investigate this possibility. The operators are left to make both the investment and the despatch
Kenya Small Scale Renewables: Draft Final Report June 2012
Economic Consulting Associates, Ramboll 46
Report on TOR tasks
decisions. The bid could be designed in different ways to achieve efficiency and cost-effectiveness, an obvious approach being bids based on the lowest subsidy required to achieve certain levels of connection and performance standards in electricity supply, with penalties applying for failure to meet the targets. Hopefully the bids would be sufficiently competitive for the subsidy level to be significantly less than the level projected under the current KPLC/Kengen predominantly diesel operations. The targets should not be impossibly stringent, as achievable targets would give an incentive for the winning operator to outperform the targets and thereby increase profitability above the levels expected at the bid acceptance stage.
The very high costs of diesel in remote locations should be sufficient to ensure that the concessionaires will invest in renewables and run the facilities on a hybrid basis. Furthermore, the Ministry of Energy and Rural Electrification Authority have budgeted plans to incorporate solar PV in more of the existing and new isolated grids, so by the time a concessioning framework is in place more renewable assets will likely be operational. However, some sort of additional incentive for renewables could be added, such as a cash payment for the residual value of well-maintained renewable generators.
3.5.2 Task 5 Recommendations
We recommend that one or more centres which are not soon to be absorbed into the national grid be packaged as concessions and offered to private operators on a competitive basis. These would be pilot projects and one of the concession conditions should be that concessionaires provide data on the capital and operating costs of the different elements of the system, and document how the systems have actually been operated in practice to meet demand.
In planning for concessioning, important lessons can be learned from:
Mpeketoni isolated grid in coastal Kenya, which was privately operated but later taken over by Kenya power due to poor economic viability, and where there were plans to use part biodiesel but the existing gensets only use diesel.
Mtwara isolated grid and distribution network in southeastern Tanzania, where a private natural gas IPP was given a generation concession and built a 12 MW power plant but different expectations regarding licencing and grid extension resulted in delays and the IPP exiting and the Tanzanian government utility buying the project.
West Nile Electrification Project in northwestern Uganda, where a private operator, owned by a Kenyan company, was given a 20-year generation, distribution and electricity sales concession for an isolated diesel grid where hydro resources are available but delays in implementing a small hydropower plant to reduce electricity costs means the operator has faced insolvency.
Where private sector participation in renewable energy projects in isolated grids is concerned, either under an IPP or concessioning approach, the likelihood and
Kenya Small Scale Renewables: Draft Final Report June 2012
Economic Consulting Associates, Ramboll 47
Report on TOR tasks
timing of such grids being connected to the main grid in the future needs to be considered. For example, at Garissa and Lamu, where the possibility of integrating a ~1 MW solar generator is technically viable due to the higher daily demand, and hence a small IPP could be attracted, the fact that these will in the next five years be connected to the main grid presents an uncertainty for investors. Thus a regulatory framework to account for the eventuality for main grid interconnection would be required.
While we believe that the concessioning approach is likely to be most productive for isolated minigrids, we do not want to preclude privately financed renewable generators playing a role in complementing diesel supplies in existing minigrids operated by KPLC. For these we recommend:
The calculated FiTs should apply, without being restricted to the LRMC tariff. This would imply for solar PV a FiT of * USc/kWh.
PPA/interconnection requirements should be negotiated on a case by case basis .
Allowing case-by-case negotiation is contrary to the overall approach we have adopted in this study. However, this is justified in this case by the variety of circumstances and the small number of projects that would be developed. While the main grid the project pipeline indicates more than 100 MW of small-scale renewable energy producers, our estimate is that for the isolated grids, this would be at most 3-4 MW in aggregate. The specificity to be considered in each case includes the scaling of the projects and the payment arrangements which would be acceptable to both sides in a situation where ‘must run, must take’ cannot apply.
3.6 Task 6 – Monitoring and Planning Tool
3.6.1 Relationship between monitoring and planning
Coherent planning of small-scale renewable investments requires that future investments build on the experience that has been gained to date. It therefore makes sense to have a single tool that provides a unified framework for monitoring and for planning.
It is assumed that the proposed tool would be held and managed by the secretariat of the FiT Committee, although a different institutional home could be chosen for this. The main features of the proposed tool are as follows:
Geo-spatial database - the location of small-scale renewables is important and the basis of the tool should therefore be a GIS-based system which would show the location of existing and planned generators in relation to each other and to substations and grid connections. When receiving new applications, planners will immediately be alerted to likely up-coming grid interconnection issues, depending on where the proposed project is to be located in relation to

Kenya Small Scale Renewables: Draft Final Report June 2012
Economic Consulting Associates, Ramboll 48
Report on TOR tasks
existing generators and what the loading and load flow implications would be in that part of the grid.
Project development/implementation status – for the assessment and monitoring of FIT EOI applications, more information should be collected and recorded. This would need to be updated regularly with the specific status of each project to enable the FIT Committee to better understand how projects are progressing. It is useful, for example, to know how long it has in fact taken for projects to move from conceptualisation to commissioning. This will help the Committee to decide if and when an EOI approval for a site should be revoked. Data such as exact geographical coordinates is also important where the FIT Committee may have received more than one application for a certain area and needs to consider whether to issue an approval for one, both or neither project developer.
Performance data – it is also important to track the actual performance of small scale renewable generators, compare this with predicted performance at the time of project acceptance, and therefore be in a position to make an informed judgment about the latest project applications in the various technologies.
The sources of information and models on which the above components can be built are as follows:
Transmission and distribution system GIS model – the on-going Distribution Planning study includes a component which will result in an up-to-date, accessible GIS model of the Kenyan T&D network becoming available. This model can and should be used for related purposes, including the planning of small-scale renewables. However, there needs to be coordination between different uses. The FiT Committee can use a version of the model for its high level planning purposes, but when the project moves to implementation it needs to be integrated into the distribution planning process. Implemented projects need to be reflected accurately and candidate projects which have not gone to full implementation dropped.
Rural Electrification Master Plan update GIS model – the 2008 update to the Rural Electrification Master Plan includes a GIS database with layers for power infrastructure (existing and planned grid, substations and distribution transformers), population, load centres, roads, other geographic data (protected areas, lakes) and basic renewable energy resource potential maps. While the distribution planning study results will be more recent, as the Rural Electrification GIS database already includes an overlay of the renewable resource potential and it should be investigated if this can form the basis for the planning tool.
Renewable resource potential maps – the Ministry of Energy is currently undertaking wind resource studies from more than 40 wind measurement masts installed around the country. The Ministry has also recently tendered for the development of a small hydropower atlas for

Kenya Small Scale Renewables: Draft Final Report June 2012
Economic Consulting Associates, Ramboll 49
Report on TOR tasks
Kenya. Data from these and other exercises can be fed into the planning and monitoring tool against which the FIT Committee can assess new applications and track the performance of existing projects.
FiT Committee and project developer records – records should be kept along the way by the FiT Committee of the time taken to reach the milestones for which it is responsible. When the project is commissioned, the FiT Committee milestone information should be confirmed with the project sponsors and additional information added (for example how long before the EOI application to the FiT Committee the project was identified). The time required for financial closure is of particular interest.
KPLC Energy Purchasing Department records - Part of the transactions cost-minimising approach that is advocated in this study includes the idea that small scale generators will not be required to collect and provide data on an on-going basis. The main source of information for monitoring purposes will therefore be the KPLC accounting system. The records of the KPLC Energy Purchasing Department will provide data on the energy produced and paid for each month. Problems can be flagged in the data if there have been interruptions. Investigation of the causes of interruptions will further enrich the information available for future planning.
3.6.2 Task 6 Recommendations
We recommend that a Small-scale Renewable Monitoring and Planning Tool be established and maintained within KPLC, on behalf of and for the use of the FiT Committee. The information collected would be useful also to the Kenyan government in tracking greenhouse gas emission reductions from renewable electricity generation. The main features of the model would need to be developed in parallel:
The geo-spatial database aspect will have to wait for work on the on-going Distribution Planning Study to be completed but the possibility of building on the existing Rural Electrification Master Plan database can already be investigated.
The implementation time is already being monitored together with the number of EOI applications. This is to be brought in line with the steps being defined in the revised Procedures.
On the performance monitoring side, although there are to date only two projects that have been brought into operation under the FiT mechanism, the data monitoring system should nonetheless be established. From the month of first operation of the plant, data should be made available by the Energy Purchasing Department of the energy produced, the amount paid and any indications of interruptions or other problems.
Kenya Small Scale Renewables: Draft Final Report June 2012
Economic Consulting Associates, Ramboll 50
Report on TOR tasks
3.7 Task 7 - Management of FiT Approval Process
A review and assessment of the existing FIT approval and implementation process has been conducted by the consultant with inputs from study counterparts and other stakeholders. The initial findings and questions were presented and discussed at the Mid-Term Workshop.
The general conclusion is that the existing FIT approval and implementation process is performing relatively well, and that delays in project development are due primarily to other factors: (a) land issues, (b) delays in obtaining project ancillary approvals, (c) lack of project developer expertise, (d) low tariff levels in some cases and (e) broader regulatory uncertainty.
Nevertheless, certain improvements may be considered to better facilitate and standardise the FIT approval and implementation procedures and provide more clarity to project applicants, which in turn will help to reduce transaction costs and regulatory uncertainty.
3.7.1 Task 7 Deliverables
In this regard, the following draft documents have been provided as deliverables under Task 7. The documents focus on small-scale renewable energy projects of up to 10 MW but could also be used, with some modification, for larger projects applying under the FIT Policy.
Feed-in-Tariff Policy Application and Implementation Guidelines. These draft guidelines have been developed based on the existing implementation procedures section of the FIT Policy, the FIT Policy Guide for Investors, the consultants’ own understanding of the actual process in Kenya and experience from other countries such as Sri Lanka, South Africa and Tanzania. The Guidelines are intended to replace the current “Guide for Investors” with a document that is of use to both Government and project developers to provide more clarity on FIT application and implementation procedures and guidelines.
EOI Feed-in-Tariff Policy Application Form. As an appendix to the draft FIT Application and Implementation Guidelines, a standard Expression of Interest (EOI) application form has been prepared. The form requires more information to be provided by project applicants and makes it mandatory that all requested sections be completed before the EOI application is processed. This should help the FIT Committee to better assess the application.
Feed-in-Tariff Policy Project Progress Report Form. As per the current EOI procedures, approved project applicants are required to provide progress reports every 6 months during the two-year exclusivity period they have to assess and develop their proposed project under the FIT Policy. The Project Progress Report Form makes it clear the information that EOI approved applicants must provide in their reports and gives indicative milestones against which progress can be assessed.

Kenya Small Scale Renewables: Draft Final Report June 2012
Economic Consulting Associates, Ramboll 51
Report on TOR tasks
Feed-in-Tariff Policy Project Progress Assessment Criteria. In order to help the FIT Committee evaluate progress made and provide transparent criteria on how this is done, a progress assessment checklist with proposed scoring for achievement of different project development milestones has been prepared.
The draft Guidelines and procedural forms require further feedback from study counterparts before being shared with wider stakeholders for comments at the Final Workshop. Hence it is suggested to circulate the draft Task 7 deliverables only to the immediately relevant internal stakeholders (Ministry of Energy, ERC and KPLC) as a first step.
3.7.2 Task 7 Recommendations
As an accompaniment to the Task 7 deliverables, a note on some of the main recommendations with a brief explanation in support of each is provided herein. Other minor changes are found in the draft FIT Application and Implementation Guidelines. Certain recommendations may require (minor) changes to the FIT application and implementation procedures or may add to the responsibilities of different members of the FIT Committee and should be considered in this light.
Information sharing. It is suggested that for transparency and to reduce time spent by FIT Committee members on assessing EOI applications and explaining procedures to different project developers, that the following be posted and regularly updated on the Ministry of Energy and ERC websites:
(a) The FIT Application and Implementation Guidelines, FIT Application and Progress Report Forms, FIT Project Progress Assessment Criteria, Standard Non-Negotiable PPA and Guidelines for Grid Connection.
(b) A list of EOI approved projects including the information suggested in the draft FIT Application and Implementation Guidelines.
(c) A list or map of “no go” areas that EOI applicants should avoid due to Ministry of Energy planning, such as a location of the Ministry wind masts in Kenya and a 50km exclusion zone around each
(d) A list of all approvals and consents that a small renewable energy power producer will be required to obtain to meet legal and regulatory requirements to help applicants better plan their project development activities.
Requirements for EOI applications. The proposed FIT EOI Application Form if completed in full should be sufficient to enable the FIT Committee to approve or reject an EOI application. It is not recommended at this time to require project applicants to submit a prefeasibility study since in many cases sufficient data is unavailable and a developer may delay the EOI applicant in order to assess the

Kenya Small Scale Renewables: Draft Final Report June 2012
Economic Consulting Associates, Ramboll 52
Report on TOR tasks
resource, only to find that another applicant was granted the EOI for the site. Furthermore, it is not recommended to include an application fee with the EOI request so as not to exclude project applicants with minimal resources or add an extra administrative step to the EOI procedures.
Automatic offer of Standardised Non-Negotiable PPA for projects up to 10 MW when pre-determined milestones are reached. It is suggested that the FIT procedures clearly state that a PPA will be automatically offered to EOI approved applicants who (a) demonstrate project technical and economic viability, (b) obtain necessary consents and approvals (d) agree to a grid connection plan and (d) secure or show that they will secure the financing requirement for the project. This should provide certainty to developers and financiers that the project will receive a PPA offer and also ensure that KPLC is not bombarded with requests for PPA signing until a project applicant has shown significant progress. Alternatively, in principle after a certain amount of progress is achieved/milestones met, KPLC could consider to offer a Letter of Intent for PPA signing or even initial (but not sign) the PPA offered. Alternatively, the milestones could be inserted as Conditions Precedent in the PPA and the parties could sign once the grid connection plan is agreed. In whichever case, clarity should be provide on (a) when an EOI approved applicant should request a PPA and (b) at what stage it should expect the PPA to be signed.
Grid connection study. The grid interconnection arrangements are one of the critical aspects that determine project viability and grid system operator acceptance of the proposal project. Under the small-scale renewable energy power producer procedures, the grid connection aspect is really the only part of the standard PPA that requires discussion. Hence, it is suggested as part of the EOI application procedure that the project developer already provide a proposed grid connection point and power line routing clearly identified on a map. Then, as part of the FIT project planning and monitoring tool to address potential grid connection constraints and requirements at an early stage, it is recommended that when the FIT Committee approves an EOI applicant, KPLC provide a quick and preliminary Grid Connection Opinion. This can be a very basic letter of one page indicating KPLC’s brief opinion on the proposed connection point and any considerations that the project applicant should take into account, such as alternative routing or expected reinforcements, when developing the project. While this recommendation might add a burden to KPLC staff upfront and some time might be wasted on projects that will not achieve viability, overall such a procedure will be useful for the implementation of the FIT project planning and monitoring tool, and may also inform some applicants immediately that their proposed project is not viable, thus saving time in the long run. Later, once the project is conducting or has completed a full feasibility study (usually 6-18 months after EOI approval), the detailed grid connection arrangements can be studied, discussed, agreed and inserted into the standard PPA template.

Kenya Small Scale Renewables: Draft Final Report June 2012
Economic Consulting Associates, Ramboll 53
Report on TOR tasks
Support for EOI project ancillary approvals. It has been suggested by some stakeholders that an EOI-approved project either be subject to less stringent regulatory requirements, in particular regarding the Environmental Impact Assessment, or should have a streamlined process for obtaining all necessary ancillary approvals. While in principle a good proposal, this study does not recommend this approach for two main reasons. Firstly, changes to any legislation such as the EMCA Impact Assessment and Audit Regulations may be difficult to achieve for a “niche” sector (e.g. small renewable energy projects under 10 MW) unless the Government is very supportive. Secondly, steamlining the process for all related approvals will require much consultation and liaison with a large number of line agencies on behalf of a large number of projects, which may place undue additional responsibility on the Ministry of Energy or ERC, and in any case the Kenya Investment Authority may be the appropriate body to facilitate such approvals. Instead, the study recommends that the Ministry of Energy project letters of support as reasonably requested to help EOI approved applicants obtain other consents.
Legal status of EOI approval. The legal status and implications for revocation/transfer of an EOI approval should be considered if FIT Policy is to be gazetted.
Affect of changes to the FIT Policy on EOI approved projects. Some suggestions have been provided in the draft FIT Application and Implementation Guidelines that require further discussion but are important in order to provide certainty for investors.
3.8 Additional elements of the TOR and other topics covered
3.8.1 Items identified at start of Section 3 of TOR
The bulk of Section 3 of the TOR is taken up with describing the 7 tasks, but there are also some other items which are mentioned before the tasks. The way in which these have been met is described below:
Assessment of the renewable energy resource potential in Kenya – a thorough piece of work was done on this, and presented as Annex 4 of the Inception report.
Challenges and constraints to low implementation – the Inception Report reported that the low implementation to date was not reflective of the strong response to the FiT policy, which had produced a significant pipeline of projects. The thrust of the study was therefore very relevant to streamline the acceptance and implementation procedures in advance of a large expected increased in projects coming forward.

Kenya Small Scale Renewables: Draft Final Report June 2012
Economic Consulting Associates, Ramboll 54
Report on TOR tasks
Recommend minimum system sizes/capacities – the previous policy specified minimum sizes for each technology. The study concluded that there is no strong reason to automatically preclude very small generators. Project promoters would not find it economic to put forward very small projects which would have to be subject to the same procedures as projects up to 10 MW – in future, very small generators are likely to be catered for under Electricity Banking and Net Metering, where the procedures are extremely straightforward.
Recommend cap values for installed capacity of various grid connected generation plants – for the reasons given in detail in Section 2, under the proposed arrangements it is more appropriate to have a cap on the overall capacity of embedded, non-despatchable small-scale (less than 10 MW) renewable generators. We have recommended that this be set at 10% of system installed capacity in the first instance and reviewed through a thorough study once the 10% level is reached. Currently the limit would be around 160 MW, but the system is expected to grow rapidly in the next few years, and the cap will grow with it (350 MW by 2015).
Renewable energy premium tariff scheme for isolated grids – after considering a number of options, the recommended approach for isolated grids does not depend on an energy premium tariff. It is to concession them out to operators who would make the decisions about the type and level of renewables in the hybrid generation mix, and how best these would be despatched. The bids for the concessions would be on the basis of minimising the subsidy requirements. See Section 3.5.
Develop a monitoring plan – this has been combined with the GIS-based planning tool, as planning has to take account of what is already in place and where, and how previous cohorts of generators have performed in practice. See Section 3.6.
Overview of international experience of small power producer regulatory systems – this was presented as Annex 4 of the Inception Report.
The final point, to “propose regulatory instruments and guidelines for integrating small-scale renewable energy systems into the interconnected and isolated grids, based on full technical and economic analysis and international best practice” leads directly into the 7 Tasks analysed in detail in Section 3.
3.8.2 Wheeling
The team was also asked to comment and give advice on other topics, wheeling being one which involved significant debate with stakeholders. Wheeling over the national network between a privately owned generator and an earmarked customer is permitted under the Energy Act. What is yet to be determined, however, is the applicable wheeling tariff and hence the viability of wheeling for the entities involved. The parties involved do not seek to isolate themselves from KPLC – the

Kenya Small Scale Renewables: Draft Final Report June 2012
Economic Consulting Associates, Ramboll 55
Report on TOR tasks
utility is to be relied upon to provide continuity of supply when there are problems in the upstream supply system. KPLC loses a customer, but in the current constrained situation, should be able to find a new customer and hence may not have a reduction in revenue.
There is currently strong interest from the tea industry to develop small hydro-power projects on certain estates and wheel the power to tea factories located elsewhere. GTIEA has prepared a specific proposal, proposing a methodology for wheeling charges which would have both capital and energy components.
Wheeling charges are to be examined in detail and recommendations made by the team currently carrying out the electricity cost of service / tariff study for ERC. Suffice it here for use to make a few observations on what should be included in the wheeling cost methodology:
Direct costs (operating and maintaining the transmission and/or distribution equipment and lines involved)
Careful assessment of losses (inversely proportional to the square of the voltage and hence important to wheel at as high a voltage as possible)
These costs should be assessed on a zonal basis so as to minimise prejudice to other consumers from congestion
Indirect costs for the utility – costs of maintaining back-up capacity, and payment to offset the probable loss in the contribution to the cross-subsidy pot through the loss of the earmarked customer.
Recommendation: The wheeling charge must await the outcome of the COSS study. The team performing that study will recommend a tariff that is consistent with the system-wide costs. The structure of the wheeling tariff is also to be decided as part of the COSS study, ranging from a simple ‘postage stamp’ formulation to a three component structure:
A charge for supporting the load in the case that generation is not available - this can become more complicated when over the year generation is not equal to demand;
A zonal charge for generation entering the system; and/or
A zonal charge for demand exiting the system.

Kenya Small Scale Renewables: Draft Final Report June 2012
Economic Consulting Associates, Ramboll 56
Conclusion and agenda for final workshops
4 Conclusion and agenda for final workshops
4.1 Conclusion
The study has provided the opportunity for an intensive period of research and debate on key issues pertaining to the development of renewable energy resources in Kenya. In response to the forward-looking FiT policy introduced in 2008, there is a significant pipeline of projects waiting to be approved and implemented. To ensure that there will be no unwarranted hold-ups, it is important that the Revised
FiT Policy, incorporating the results of this study, be gazetted as soon as possible.
The implementation of the revised policy will require the separate deliverables that have been prepared:
Standardised Non-Negotiable Power Purchase Agreement
Connection Guidelines for Small-Scale Renewables
FiT Model
Application and Implementation Guidelines
Monitoring & Planning Tool
PPA Template for Projects larger than 10 MW
Together, once finalised after the Final Workshop on Thursday 19 July, the Revised FiT Policy and the above items constitute a package for immediate implementation.
4.2 Agenda for final workshops
Given the significant number of deliverables that have been produced and should be discussed amongst stakeholders, we suggest a full day be dedicated to the Final Workshop. During this workshop we propose to focus first on the Revised FiT Policy before a relatively brief discussion on each of the other deliverables. We will propose a detailed schedule for the workshop in the near future.
During the same week we propose two detailed training sessions, one on the FiT Model and another on the technical guidelines (the Connection Guidelines and the Application and Implementation Guidelines). These sessions can be run in parallel given that each will likely be of interest to a different set of stakeholders.
These training sessions will include mock examples to work through in order to encourage interaction from the participants and generate constructive feedback
A proposed format for the training session on the FiT Model is as follows:
Introduction to model structure;

Kenya Small Scale Renewables: Draft Final Report June 2012
Economic Consulting Associates, Ramboll 57
Conclusion and agenda for final workshops
Discussion on existing assumptions and inputs;
Explanation of detailed calculations;
Worked FiT example;
Updating and changing outputs;
Q/A session.
A proposed format for the training session on the technical guidelines is as follows:
Introduction and arrangement of guidelines;
How to apply the Connection Guidelines and considerations for differing sizes of renewables;
How to apply the Application and Implementation Guidelines;
Worked application examples;
The commissioning process and sign off;
Q/A session.