Embed Size (px)
Citation preview

Technical Assistance Consultant’s Report
Project Number: 46380-005 October 2016
Indonesia: Green Cities: A Sustainable Urban Future in Indonesia (Financed by the Government of Australia) (Part 2 of 2)
Prepared by Robert van der Hoff, John Sutton, and Niels van Dijk Urban Solutions BV in association with PT Ciriajasa Rancangbangun Mandiri (CRM) Indonesia)
Indonesia
For Asian Development Bank
This consultant’s report does not necessarily reflect the views of ADB or the Government concerned, and ADB and the Government cannot be held liable for its contents. (For project preparatory technical
assistance: All the views expressed herein may not be incorporated into the proposed project’s design.

CURRENCY EQUIVALENTS (as of 20 October 2016)
Currency Unit – Indonesian rupiah (IDR)
IDR1.00 = $ 0.0000766 $1.00 = IDR13050
ABBREVIATIONS ADB – Asian Development Bank AfD – Agence Française de Développement AFM – Alternative Financing Mechanisms APBD – Anggaran Pendapatan dan Belanja Daerah (regional/municipal
budget) APBN – Anggaran Pendapatan dan Belanja Nasional (national budget) APEKSI – Asosiasi Pemerintah Kota Seluruh Indonesia (association of
Indonesian municipalities) ASEAN – Association of South East Asian Nations AusAID – Australian Government Overseas Aid Program BAPPENAS – Badan Perencanaan Pembangunan Nasional (national
development planning BDA – Batam Development Authority BIFZA – Batam Indonesia Free Zone Authority BLU – Badan Layanan Umum (public service agency) BLUD – Badan Layanan Umum Daerah (regional public service
agency) BOT – Build Operate Transfer BRT – Bus Rapid Transit BUMN – Badan Usaha Milik Negara (state owned enterprise – SOE) CAPEX – Capital Expenditure CBO – Community Based Organization CDIA – Cities Development Initiative for Asia CDTA – Capacity Development Technical Assistance CIIPP – City Infrastructure Investment Programming and Prioritization CPS – Country Partnership Strategy CSR – Corporate Social Responsibility DAK – Dana Alokasi Khusus (special allocation fund) DAU – Dana Alokasi Umum (general allocation fund) DBH – Dana Bagi Hasil (revenue sharing fund) DED – Detailed Engineering Design DGHS – Directorate General of Human Settlements, Ministry of Public
Works DMF – Development Monitoring Framework DKP – Dinas Kebersihan dan Pertanaman (city sanitation and
landscaping agency) DPR – Dewan Pewakilan Rakyat (national parliament) DPRD – Dewan Perwakilan Rakyat Daerah (regional parliament) DSCR – Debt Service Coverage Ratio 3E – Environmental, Economic, Equitable

EA – Executing Agency ESCO – Energy Savings/Service Company FAR – Financial Analysis Report FS – Feasibility Study GCAP – Green City Action Plan (see also RAKH) GCP – Green Cities Program (also: Green City Profile) GIS – Geographic Information System GOI – Government of the Republic of Indonesia GT – Green Team IA – Implementing Agency IIF – Indonesia Infrastructure Fund IIGF – Indonesia Infrastructure Guarantee Fund IMT-GT – Indonesia Malaysia Thailand Growth Triangle IndII – Indonesia Infrastructure Initiative IPAL – Instalasi Pengolaan Air Limbah (see also WWTP) IPP – Independent Power Producer IUWASH – Indonesia Urban Water, Sanitation, and Hygiene JICA – Japan International Cooperation Agency KfW – Kreditanstalt für Wiederaufbau (German Development Bank) FGD – Focus Group Discussion KSPPN – Kebijakan dan Strategi Pembangunan Perkotaan Nasional
(National Urban LCF – Livable City Framework LGE – Local Government Enterprise LGOE – Local Government Owned Enterprise MDG – Millennium Development Goals SPV – Special Purpose Vehicle SWM – Solid Waste Management TA – Technical Assistance TOR – Terms of Reference UNDP – United Nations Development Programme WSS – Water Supply and Sanitation WTE – Waste to Energy
NOTE
In this report, "$" refers to US dollars.

City of Kendari G‘EEN CITY ACTION PLAN 0 5

1
Foreword by the Mayor
Assalamuallaikum, Wr. Wb.
The City of Kendari s Green City Action Plan (GCAP) is an initiative that
serves as a roadmap towards improving the quality of life in the city
appl i g gree attri utes generally known as green planning and
design, green open space, green building, green energy, green
transportation, green waste, green water, and green industry &
commerce, all significantly based on and supported by a green
community.
The basic reason for the City of Kendari to prepare a GCAP is to help
achieve development that is sustainable, fair and profitable at the
same time because we are convinced that green development can
realize economic and social equity as it will be able to suppress and
manage conflicts between economic interests on the one side and
the need for environmental preservation on the other side.
The GCAP succinctly describes our priority programs as a reference for any citizens who want to
understand our framework for aspiring to become a Green City, including external parties interested
in participating in our Green City development.
The government of the City of Kendari commits itself to continuing the process of capacity
development for greening the city through a multi-year and multi-stakeholder rolling green action
planning process led by the Green Team to stre gthe the Cit s Mediu Ter De elop e t Pla
(RPJMD). The Green City Action Planing process is supported by an appropriate resource allocation
based on a Mayoral Decision.
Hopefully we will all be blessed with the help of the Almighty God in transforming the City of Kendari
into a Green City. Amin.
Wassalam,
Kendari, May 2016
Ir. H. Asrun, M.Eng.Sc.
Walikota Kendari
2
Table of Contents
Foreword by the Mayor .......................................................................................................................... 1
Table of Contents .................................................................................................................................... 2
Introduction ............................................................................................................................................. 4
What is a GCAP? ...................................................................................................................................... 4
Summary of GCAP Preparation Process .................................................................................................. 4
Green City Profile .................................................................................................................................... 8
Green Water: Drainage & Flood Control ........................................................................................... 11
Green City Development Strategy to 2035 ........................................................................................... 14
Kendari Green Urban Development Strategy until 2035 .................................................................. 15
From Long List to Short List ................................................................................................................... 16
Long List of 12 Ranked Green Programs ........................................................................................... 16
Priority Green Programs ........................................................................................................................ 17
Final Selection of Priority Programs ...................................................................................................... 18
Introduction .......................................................................................................................................... 19
The Next Five Years – Priority Programs, Projects & Actions ................................................................ 19
I stitutio al E a li g A tio s for Gree Tea a d PMUs ................................................................ 21
The Five Priority Programs – Action Plans ............................................................................................. 22
Green Waste – Action Plan.................................................................................................................... 24
Program: Improvement of on-site sanitation system (LLTT) ............................................................. 24
Green Water – Action Plan .................................................................................................................... 29
Program: Urban Drainage & Flood Control ....................................................................................... 29
Green Water – Action Plan .................................................................................................................... 35
Program: Increasing the efficiency and supply of drinking water ..................................................... 35
Green Waste – Action Plan.................................................................................................................... 43
Program: Community Solid Waste Management ............................................................................. 43
Green Energy – Action Plan ................................................................................................................... 48
Program: Tidal electric power generation in Kendari Bay (pilot) ...................................................... 48
The Five Priority Programs - Implementation Plan ................................... Error! Bookmark not defined.
The Five Priority Programs – Finance Actions ....................................................................................... 52

3

4
Introduction This GCAP supports the National Urban Development Policy and Strategy (NUDPS) for the period
2015-2045. The long-term vision is to realize sustainable and competitive ities for people s prosperity based on physical characteristics, economic advantages, and local culture by 2045. This
vision will be achieved in three phases: (i) creating a national urban system, (ii) having urban areas
meet national service standards and creating sustainable cities that are green, livable, smart and
competitive, and (iii) strengthen governance and government institutions.
I additio , the GCAP is ased o the Gree Visio of the Ma or of Ke dari stated elo :
TO ACTUALIZE KENDARI BY 2020 AS A GARDEN CITY THAT IS PROGRESSIVE, DEMOCRATIC, AND
AFFLUENT
This vision is a broad statement, consistent with national urban development policies and strategies,
and able to accommodate a number of green development goals.
One of the pillars for implementing the NUDPS is the Green Cities Program (GCP)1 which is
implemented with the National Development Planning Board (Bappenas) as the Executing Agency,
and the Directorate General of Human Settlements in the Ministry of Public Works and Housing
(MPWH) as the Implementing Agency. The City of Kendari has been participating in the GCP since
. It fo used pri aril o i ple e tatio of three attri utes Gree Pla i g a d Desig , Gree Open Space and Green Community). With the new National Development Plan period that started in
2015, the City of Kendari e dea ored to s ale up its GCP pro oti g so e of the hea ier gree attributes such as Green Water, Green Waste, etc. by preparing a Green City Action Plan (GCAP) with
technical assistance by the ADB.2
What is a GCAP? A GCAP is a time scaled green investment plan for a city. It includes specific actions for preparing and
implementing prioritised investments over short/medium term, which covers urban management
and institutional aspects, capacity development, and financing. Where appropriate, performance
i di ators are pro ided to e a le o itori g a d updati g. While a tio s fo us o the short to ediu ter , it also pro ides a strateg for a hie i g the Cit of Ke dari s gree isio o er lo ger-
term time scales. This integrated action plan complements the Cit of Ke dari s statutor pla i g process, notably the Medium Term Development Plan (RPJMD). Successful implementation of the
GCAP ould allo the Cit of Ke dari to e o e a ha pio for Gree Cities i I do esia.
The GCAP uses the ter Gree as a etaphor for ities that are lea , health , safe a d e erg -
efficient so as to become liveable and sustainable. It also reflects efforts to balance the economy
and the environment with social inclusiveness.
Summary of GCAP Preparation Process In 2015, the Mayor issued a Decision (SK 800/449.k/2015) to create an inter-disciplinary municipal
Gree Tea that ould e o e respo si le for prepari g the GCAP a d allo ated a udget for its operatio s. The Gree Tea as haired the Head of the Municipal Development Planning
Agency (Bappeda) and intermittently facilitiated by ADB consultants.
1 Program Pengembangan Kota Hijau (P2KH)
2 TA-8518 INO: Green Cities: A Sustainable Urban Future in Indonesia - 2 Capacity Development (46380-005)

5
To realise this Green City Action Plan, it was essential to start with a vision for green development to
guide the development of priority programs, projects, and manageable actions. The GCAP is the
result of a pro ess of ide tif i g it de elop e t aspiratio s through a gree le s to for ulate a framework for sustainable development, and subsequently narrowing it down through a process of
further analysis and selection to result in the formulation of several priority programs, which were
then developed into detailed program briefs.
The Programs that will help the City achieve its vision for green development are shown in the
Gree De elop e t “trateg 5 o page 6. Based on further considerations of
implementability including current capacity limitations, the Green Team subsequently shortened the
list to focus on five priority Programs: Water Supply, Urban Drainage & Flood Control, Community-
based SWM, On-site Sanitation, and Tidal Energy Generation (pilot). Green Education (Sekolah
Adiwiyata) and Green Open Space development are included as continuous programs. Because the
GCAP is a rolling plan, programs, projects and actions may be added and modified periodically.
The Priority Programs were used to prepare a list of Actions in the form of a spreadsheet as shown in
The Ne t Fi e Years – Progra s, Proje ts a d A tio s .
The Cit of Ke dari s Gree Tea ill prepare a ual updates of the GCAPs as a rolling plan by
addi g e gree proje t proposals i order to gree up the it s future ediu -term and annual
development plans.
To larif the GCAP for ulatio pro ess, the t o ta les elo sho the step approa h a d tool o used the Gree Team to systematically prepare its GCAP. This section serves to explain
the intermediate steps and products that led to GCAP formulation..

6

7
The first (administrative) step was to establish a multi-stakeholer Gree Tea Ma oral De isio . The Green Tea the started isio i g a gree future, a d used the tools fro the Tool o diagra shown above to proceed from vision to aspirations and expected results.
O e the Gree Tea o pleted the “OA‘ “tep , it pro eeded to gree i g up the it s e isting
Mediu Ter De elop e t Pla ‘PJMD appl i g a gree le s usi g the Li a le Cities Framework and a Multi Criteria Analysis (MCA) to develop and prioritise programs (Step 3). The
purpose of this exercise was to identify where existing and planned infrastructure developments fell
short of achieving green objectives, and could be improved by adding components that would
increase their green development content. This process will be repeated to inform the next RPJMDs
to sensitize decision makers and graduall stre gthe the gree alue or gree ess of de elop e t plans. Although the Green Team was free to introduce new ideas (for example MRT for Green
Transportation, and LED street lighting for Green Energy), it opted not to do so because of other
more pressing needs that needed to be addressed first. This was a deliberate strategy because
existing plans already proposed in municipal plans should have priority.
At the sa e ti e, the Gree Tea started orki g o a Gree Cit Profile “tep ith the aim of
developing a baseline for performance measurement. The Green City Profile includes the results of
“tep a d . It also i ludes a ‘oad ap spreadsheet for gree de elop e t, a e iro e tal profile ith the ati GI“ aps used for i tegrated rolli g pla de elop e t, as ell as a i e tor of urre t a d pla ed gree i itiati es. The Gree Tea used the ‘oad ap to rate the it s gree performance and progress towards green development objectives as part of a rolling plan process.
The Roadmap uses generic green performance indicators that the Green Team can use to formulate
short (2015-2019), medium (2020-2034), and long-term (2035-2045) targets toward sustainable
de elop e t. The ‘oad ap s aggregate s ore for all i di ators o i ed a e red, yellow, or
green. By objectively rating the Roadmap using 2015 as the baseline, the Green Team concluded
that Ke dari s aggregate s ore as still i the red zo e. The se tio elo is a su ar ersio of the Cit s e iro e tal profile take from the Green City Profile including current and planned
initiatives from the Green City Profile. The full Green City Profile is attached to the GCAP.
In line with Step 5, 6, 7, the Green Team prepared a number of Project Briefs, undertook a fiscal
capacity analyisis for green infrastructure investment, and scoped options for alternative modes of
financing. As all four Programs were adopted for action, there was no need anymore for prioritizing
projects (Step 8). Step 9 has resulted in this GCAP, while Step 10 will be done to monitor
performance when the next update of the GCAP is due.

8
Green City Profile The section below is a summary of the full Green
City Profile developed by the Green Team as
part of the action planning process, which is
appended to the GCAP. It is shortened here to
provide a brief introduction.
The City of Kendari is the capital of the Province
of South-East Sulawesi, with an area of 295 km2.
The City is divided into 10 districts and 64 sub-
districts. In the year 2014 the population of
Kendari was 322,000 inhabitants, with an
estimated annual population growth of 1.97%.
Population density is 1,175 people per km2
(2014).
City government envisions Kendari 2020 as a
Garden City that is progressive, democratic and
afflue t . The result ill e a li a le it . This vision is enshrined in Local Regulation
No.10/2001 as well as in the it s spatial development pla . The ter Garde Cit is understood to be a city with ample green open
space to protect the environment and public
facillities. The Regional Spatial Development
Plan (RTRW 2010-2030) defines its spatial
mission as defending and strengthening
environmental quality, equilibrium, and
harmony.
To realize its vision, the city government
prepared a program to improve conditions in
slum areas and deliver adequate public services
(Renstra Dinas Tarkim 2013-2017). It also
prepared a detailed spatial development plan
(RDTR), a plan for built-up area and environment
development (RTBL), and a zoning plan (Renstra
2013-2017)
As described in the medium-term development
plan 2013-2017, the city government is
implementing a forest protection and land
rehabilitation plan. The Department of Public
Works is implementing a plan to overcome
coastal erosion and landslides, primarily along
rivers and steep slopes near residential areas.
The environmental agency (BLH) has allocated
funds to enable the city to participate in the
national Clean City Award (ADIPURA)
competition (award won in 2013), and the
Green School Award (ADIWIYATA). All schools in
the city have already reached advanced levels of
green management.
Kendari does not have a formal action plan to
deal with climate change, but is already
implementing demonstration projects to reduce
methane emissions in its final waste disposal site
(TPA) (see Green Solid Waste below). The city
also has allocated funds for climate change
mitigation, but so far its main output has been
the creation of green parks. The national
budget (APBN) has provided a special allocation
fund (DAK) for this purpose. The disaster
prevention agency (BPBD) has allocated funds
for disaster prevention for the period 2013-
2017. However, Kendari has serious natural and
human resource limitations that hamper
development, which can only to some extent be
addressed by the GCAP.
Climate Change Average temperature in Kendari is 25-27oC.
Climate change is primarily driven by
greenhouse emissions resulting from population
growth and economic development. The profile
of Kendari is based on the scenario used by the
World Bank Climate Research Program. The
regional projection from this database is based
on results of nine global climate models that
have statistically been regionalized for areas of
around 50x50 km (2,500 km2).
The Indonesia Climate Change Projection Portal
Source:
http://climatewizard.ciat.cgiar.org/outputs1/Indonesia_annual/
The climate change pattern predicted for
Indonesia shows increased variability and
seriousness of change, as well as increased
likelihood of extreme events in the coming
decades including heat waves, dry spells, intense
rainfall, etc. This projection is consistent with

9
the South East Asia Climate Change Study (ADB
2009a). The World Bank database also
reinforces an assessment by the UNDP in
Indonesia. 3
As explained in the National Climate Change
Adaptation Action Plan (RAN-API), seawater
level rises (SLR) o stitutes I do esia s ai threat because of its large number of coastal
settlements, including Kendari. In 2050, SLR in
Indonesia could reach 175 cm in the year 2100
(Bappenas, 2010b).
As shown on the map below, this has
implications for Kendari because higher flood
levels will hamper river outflow into the Kendari
Bay and estuary. A heavy flood in 2013 was
caused by a combination of high seawater and
rainfall (see Drainage & Flood Control below).
Another consequence will be increased water
salinity in the rivers, which in turn will affect
water supply, agriculture, and urban farming in
Kendari.
Source: Estimated rate of sea level rise in the Indonesian archipelago (Bappenas, 2010b)
As mentioned, the City has initiated an action
plan for Climate Change Mitigation and
Adaptation, even though the scale of activities
implemented by the Environmental Agency
(BLH) is still limited. The National Agency for
Regional Disaster Prevention (BNPB) has
introduced a Disaster Reduction and
Management Program for the it s Disaster Management Agency (BPBD) to help the City
prevent and respond to emergency disasters.
These activities are still being developed.
3 Karmalkar, A., et al. n.d. UNDP Climate Change
Profiles: Indonesia. Retrieved from http://country-
profiles.geog.ox.ac.uk.
Spatial Development & Green Open
Space
Built-up area and settlement patterns in Kendari
aggregate around the west side of the Kendari
Bay, which in fact is the estuary of the Wanggu
River. The main environmental threat to the city
centre is flooding caused by the overflowing of
the Wanggu into the Kendari Bay area that is
already heavily sedimented. This, combined with
water outflow from the 22 streams from the
surrounding hills during the rainy season, causes
more flooding.
The mangrove areas bordering the Wanggu
estuary have decreased dramatically during the
last 50 years. It has gone down from around 500
ha in the sixties to about 28 ha at present. The
city is now considering steps to preserve the
remaining mangrove, as well as to replant 33 ha.
Also, low-lying areas and swamps around the
Kendari Bay that in the past functioned as flood
breakers have now been filled up with soil, and
in some areas have become residential and
commercial areas, but will remain under
constant threats from flooding. In addition,
about 20 ha of land in the Kendari Bay itself has
been reclaimed using sediment dredged from
the bottom.
The Spatial Development Plan (RTRW 2012-
2032) identified 6 main development areas: (1)
the central commercial district bordering the
Bay: (2) the central industrial area in Abeli near
the container port; (3) the seaport on
Bongkutoko island; (4) restoration of the Old
Town on the coast; (5) zoning in the town
centre; and (6) development of a transport
terminal, including warehouses along the
corridor connecting airport and seaport. 4
The pattern of urban development does not
correspond with official plans, primarily around
the central business area and the fisherman
settlement in Abeli along the southern coast of
the Kendari Bay. Houses along the beach are
regularly inundated, and firm zoning control is
required to settle in those areas – especially
4 Development Dynamics of Kendari City, published
by the local government, 2014.
10
because with oncontrolled settlement growth
caused by nearby seaport development, it will
become that much more expensive to take
protective measures against rising seawater rise
levels.
Green open space is part of the Cit s “patial
Development Plan until 2032, although there is
constant pressure on available green open space
that is needed for environmental protection.
According to Law No. 26 year 2007 on Spatial
Planning, ideally green open space (RTH) in
Kendari City (10 sub-districts, total area 29,500
ha) shall be 30% of the total area or equal to
8,850 ha consisting of 20% public open space
(1,770 ha) and 10% private open space (885 ha).
At present, RTH stands at 50%, but there are
plans to acquire more private land to convert
into public green open space.
According to the Ministry of Public Works
Regulation No. 5/PRT/2008, the City shall
provide an open space of 250m2 at
neighbourhood level (RT) (= 1 m2/capita), 1,250
m2 at community level (RW) (= 0.5 m2/capita),
9,000 m2 at village level (Kelurahan) (= 0.3
m2/capita) and 24,000 m2 at sub-district level
(Kecamatan) (= 0.2 m2/capita). This, however, is
not a guideline that can be easily applied in
practice.
The overall target is to achieve 30% green open
space (20% public and 10% Private). Presently its
primary concern is to ensure that green open
area is not further reduced. It advocates for
making good use of the open space for a
number of social and small economic activities
to reduce the chances for a possible change of
function.
Green Energy Development of Kendari as a municipality and
provincial capital is hampered by insufficient
power supply and water supply. Regular
interruptions in power supply affect a.o. the
public water enterprise PDAM because its
pumps depend on electricity supply (see Green
Water “uppl elo . The it s diesel-fueled
power plant (Cabang PLN) supplies 66 MW, but
should be able to supply at least 71 MW in order
to serve the surrounding districts (Kolaka, Kolaka
Utara, Unaaha, Konawe Utara, Konawe Selatan
and Bombana) with a total of 220,000
customers. In 2013, Kendari had 86,613
connections, and 89% of those were household
connections. Demand for new connections
increases at 18% per year, twice the national
average.
The Cabang PLN currently does not have a
concrete plan to increase power supply.
Although energy supply is beyond municipal
authority and its statutory development
planning process, this GCAP includes a proposal
for tidal energy generation. As the situation is
serious, it is hoped that the interested parties
including provincial government, PLN, MPWH,
together with an independent power supplier,
will be able to agree on a plan of action.
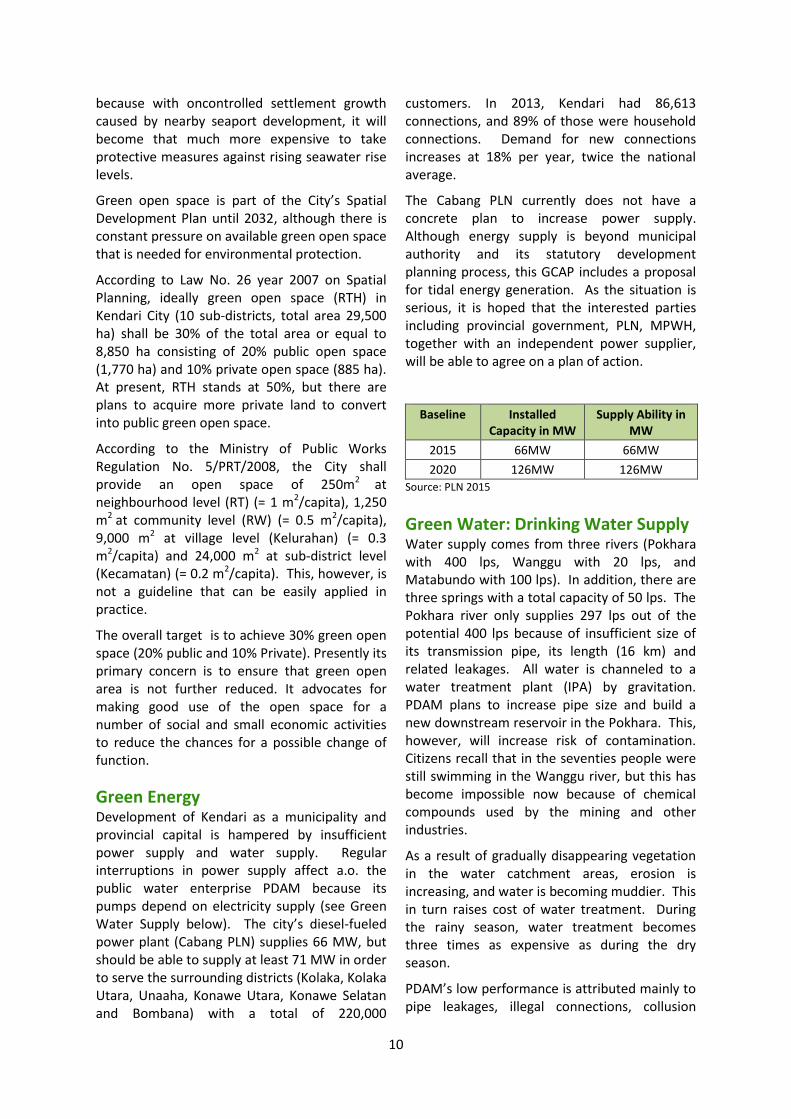
Baseline Installed
Capacity in MW
Supply Ability in
MW
2015 66MW 66MW
2020 126MW 126MW
Source: PLN 2015
Green Water: Drinking Water Supply Water supply comes from three rivers (Pokhara
with 400 lps, Wanggu with 20 lps, and
Matabundo with 100 lps). In addition, there are
three springs with a total capacity of 50 lps. The
Pokhara river only supplies 297 lps out of the
potential 400 lps because of insufficient size of
its transmission pipe, its length (16 km) and
related leakages. All water is channeled to a
water treatment plant (IPA) by gravitation.
PDAM plans to increase pipe size and build a
new downstream reservoir in the Pokhara. This,
however, will increase risk of contamination.
Citizens recall that in the seventies people were
still swimming in the Wanggu river, but this has
become impossible now because of chemical
compounds used by the mining and other
industries.
As a result of gradually disappearing vegetation
in the water catchment areas, erosion is
increasing, and water is becoming muddier. This
in turn raises cost of water treatment. During
the rainy season, water treatment becomes
three times as expensive as during the dry
season.
PDAM s lo perfor a e is attri uted ai l to pipe leakages, illegal connections, collusion
11
between customers and water meter readers,
and broken water meters. In 2012, installed
capacity was 7,489,700 m3, but PDAM received
revenue on 3,623,900 m3 only, corresponding
with 53% NRW. In the following years, NRW
remained stable at around 50%, whereas 25% is
considered good. In 2012, water was supplied to
20,202 connected customers for 304,862
inhabitants. Supply per capita, therefore,
amounted to 40 liters per day (lpcd), far below
the national urban standard of 130 lpd. In 2014,
only 2,939,655 m3 was supplied to 18,789
connections, while the population had increased
to 322,607 inhabitants. This corresponded with
a daily rate of 25 lpcd, with only 5.8% of the
population served. In some parts of town, water
is available only for 3 days per week. This is in
part caused by power outages that hamper
PDAM s operatio s. Ma usto ers ere disconnected because of non-payment of bills.
Many citizens and companies have reverted to
prive sources water supply, including wells and
water trucks. Because of seawater intrusion,
water from shallow wells contain high
concentrations of calcium and magnesium that
can only be used for non-consumptive purposes.
As PDAM water costs IDR 6,500 m3 (basic tariff),
water supplied by trucks and retailers can cost
IDR 50,000 pe m3, so this is clearly not a
sustainable solution. At present, estimates of
the volume of ground water extraction are not
available.
In an effort to improve the situation, the GCAP
proposed a project for reducing NRW to the
standard of 25% by 2020.
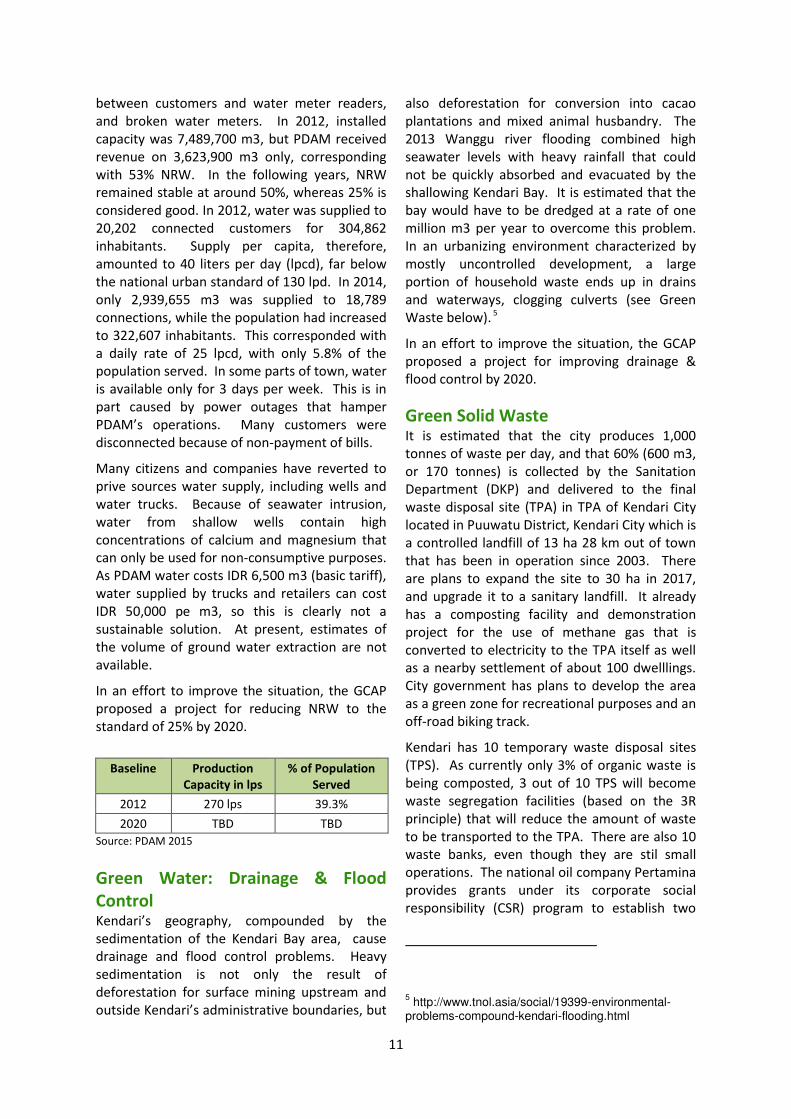
Baseline Production
Capacity in lps
% of Population
Served
2012 270 lps 39.3%
2020 TBD TBD
Source: PDAM 2015
Green Water: Drainage & Flood
Control Ke dari s geograph , compounded by the
sedimentation of the Kendari Bay area, cause
drainage and flood control problems. Heavy
sedimentation is not only the result of
deforestation for surface mining upstream and
outside Ke dari s administrative boundaries, but
also deforestation for conversion into cacao
plantations and mixed animal husbandry. The
2013 Wanggu river flooding combined high
seawater levels with heavy rainfall that could
not be quickly absorbed and evacuated by the
shallowing Kendari Bay. It is estimated that the
bay would have to be dredged at a rate of one
million m3 per year to overcome this problem.
In an urbanizing environment characterized by
mostly uncontrolled development, a large
portion of household waste ends up in drains
and waterways, clogging culverts (see Green
Waste below). 5
In an effort to improve the situation, the GCAP
proposed a project for improving drainage &
flood control by 2020.
Green Solid Waste It is estimated that the city produces 1,000
tonnes of waste per day, and that 60% (600 m3,
or 170 tonnes) is collected by the Sanitation
Department (DKP) and delivered to the final
waste disposal site (TPA) in TPA of Kendari City
located in Puuwatu District, Kendari City which is
a controlled landfill of 13 ha 28 km out of town
that has been in operation since 2003. There
are plans to expand the site to 30 ha in 2017,
and upgrade it to a sanitary landfill. It already
has a composting facility and demonstration
project for the use of methane gas that is
converted to electricity to the TPA itself as well
as a nearby settlement of about 100 dwelllings.
City government has plans to develop the area
as a green zone for recreational purposes and an
off-road biking track.
Kendari has 10 temporary waste disposal sites
(TPS). As currently only 3% of organic waste is
being composted, 3 out of 10 TPS will become
waste segregation facilities (based on the 3R
principle) that will reduce the amount of waste
to be transported to the TPA. There are also 10
waste banks, even though they are stil small
operations. The national oil company Pertamina
provides grants under its corporate social
responsibility (CSR) program to establish two
5 http://www.tnol.asia/social/19399-environmental-
problems-compound-kendari-flooding.html

12
more waste banks, all managed by the
community.
Baseline
Tons of
Waste
Installed
Waste management
Capacity
% of SW
treated
2015 300 M3/day 50%
2020 455 M3/day 55%
Source: DKP Kendari City (2015)
Green Human Waste Kendari has no integrated sanitation system.
84% of the population uses individual septic
tanks. The rest, mainly people living along the
Kendari Bay or rivers, use pit latrines that
discharge directly into the water.
The Sanitation Department (DKP) has two trucks
to desludge septic tanks and take the waste to a
treatment plant (IPLT). There are no reports
about the proper functioning of the plant, and
no records of the volume of treated waste.
At present, most septic tanks are estimated to
not function correctly because of defective
inlets, insufficient size, overflowing, and leakage.
The GCAP proposes a project to improve and
expand on-site sanitation, provide a regular
desludging service, and provide proper
treatment of waste.
Baseline
Daily volume of
human waste in
ton/day
% access to
sanitation
2015 59 ton/day 2%
2020 83 ton/day TBD
Source: DKP Kendari City (2015)
Green Buildings Green buildings have not yet become an
important attribute for green development in
Kendari, but that is likely to change in the future
because of its potentially significant contribution
to saving energy (see section on Green Energy)
and other resources such as water, as well as
improving environmental health, thus providing
a safer, environmentally friendly, and more
productive environment. Initially, public
buildings can acquire green certification
provided by third parties to help make the
concept familier. In the future, certification
should become a prerequisite for issuing
building permits for any type of construction.
The province of DKI Jakarta has issued the
Governor Regulation No. 38 Year 2012 on Green
Buildings that can be used as an example for
Kendari City. So far, Kendari City has no Green
Building regulations.
Green Transportation In 2014, Kendari had 641 km of roads, and
148,122 vehicles. Since 2011, the number of
vehicles has increased by 60%, or 7% annually.
In the same period the number utility vehicles
increased by 17% annually, while the number of
motorbikes increased by 17.5% annually. The
number of minibuses increased by 21% annually
during the same period. The municipality
operates four passenger buses along the main
corridor circling the Kendari Bay, and there is no
indication as yet that this operation is
commercially viable.
The old seaport near the entrance to the
Kendari Bay will be developed to accommodate
more passenger traffic, while cargo shipment
will be moved to a new container terminal on
the island of Bungkutoko. The southern ring
road will connect the city center with the
container port.
Plans exist to build a bridge connecting the
north and south side of the narrow estuary on
the eastern end of the Kendari Bay. This would
create a ring road and cut travel time
significantly, but implementation is still under
review.
Green Community Kendari s Gree Co u it as esta lished i
i li e ith the Go er e t s Gree Cit Program (P2KH). Its Forum undertook a series of
promotional actvities that were packaged under
the theme of Green Festival. It stimulated a
number of green communities to participate in
green planning and design, and to create green
open spaces in their communities. Several other
initiatives promoting resilient communities are
ongoing, including green education (Sekolah
Adiwiyata).

13
Resources The City of Kendari currently does not have all
human, financial, institutional, regulatory, and
other resources needed to simultaneously
address all of its green development problems,
but hopes that this GCAP will adequately
address some of the urgent issues that hamper
sustainable development. The main resource
issues are summarized below.
FISCAL RESOURCES
Kendari is still highly dependent on high level
government transfers to their cities budgets.
63% of total budgets came from transfers
between 2011 and 2014. Kendari spends only
little over 20% of the budgets available for
capital investments.
Curre tl Ke dari s earl udgets are ot sufficient to finance the preparation of green
apital proje ts. For illustratio , Ke dari s budget available for capital expenditures in 2014
was 784 billion Rupiah (~60 million USD). As part
of this GCAP Kendari has looked into ways to
improve this situation by:
Increasing own local revenue
Attracting loans (municipal lending)
Use available funds more efficient towards
green capital projects
Attracting alternative sources of finance to
projects, for example by setting-up Joint
Ventures with the private sector, BOT
contracts, involving communities through
cooperatives, etc.
INSTITUTIONAL RESOURCES
Related to attracting infrastructure development
projects and alternative sources of finance,
Kendari has had little experience, and therefore
needs to develop its institutional capacity to
generate much-needed investments.
REGULATORY RESOURCES
Kendari also needs regulations that will allow it
to effectively implement and enforce the
environmental issues it wants to address, such
as regulations on water management and waste
management. These will be part of the GCAP.
Conclusion Based on the City Profile, as well as agreed
priorities based on the existing situation and
capabilities, the City of Kendari has defined
actions related to prioritised programs and more
generic actions focusing on the short term to
make these programs and projects more
achievable. In the GCAP, actions are formulated
to help improve fiscal and institutional capacity,
create more durable partnerships, strengthen
the regulatory framework and ability to finance
projects, and potentially increase impact of such
projects.
The Profile signals that electricity supply, water
supply, sanitation, and waste management are
the key focus areas for the City at the moment
and justifies selection of these programs. In
parallel, Kendari should prioritize increasing the
budgets they have available for green capital
expenditures and improve their institutional
capacity and ability (human resources) to
prepare projects so that they can be offered to
involve the private sector and others (such as
national government programs and
development banks) to finance. This will be
further addressed in the next sections of this
GCAP.
14
Green City Development Strategy to 2035

15
Kendari Green Urban Development Strategy until 2035
After o pleti g the “OA‘, gree le si g pro ess, sele tio of priorit Progra s goi g fro a lo g list to a short list, the Matrix below summarizes
Ke dari s green urban development strategy until 2035, showing green attributes and the rough time frame for realizing them. This GCAP specifies green
development actions for the current plan period until 2019, but will be expanded and rolled over to future plan periods.
GREEN ATTRIBUTES 2015-2019 (this GCAP) 2020-2024 2025-2029 2030-2034 2035-2045
1 Green Planning, Finance, and
Implementation Management Continuous
2
Green Open Space (RTH)
(public parks, burial grounds, water
retention areas, greenbelts,etc.)
Continuous Program for urban forest development including mangrove areas
Continuous effort to acquire private green open space to meet legal requirements (RTH)
3
Green Community (Resilient
Community)
(includes health care and education)
Continuous (including Program for Green Schools (Sekolah Adiwiyata) and resilient kampungs (PROKLIM)
4 Green Transport & Urban Mobility
(motorized & non-motorized)
To be designed in next
phase of the CGAP
5A Green Waste
(sanitation)
On-site sanitation system
development
Program for acceleration of house connections to
central sewerage system
5B Green Waste
(solid waste) Community-based SWM
6A Green Water
(water supply)
Water supply system
development
6b Green Water
(urban drainage & flood control)
UDFC Masterplan, Database,
Local Regulation,
Sedimentation Control, etc
Program for normalization of streams and drains, enlargement of
drainage network, construction of water reservoirs, retention areas,
water absorption wells, etc.
7 Green Building
(energy efficiency, climate resilience)
Program for green certification of buildings, including promotion of roof gardens, hanging
gardens
8 Green Energy
(clean, efficient & renewable)
Tidal electric power
generation (pilot project)
Expansion of tidal electric power generation
project
9 Green Industry & Commerce
(sound environmental management)
To be designed in next
phase of the GCAP
10 Green Air (Blue Sky)
(emission reduction & control)
To be designed in next
phase of the GCAP

16
From Long List to Short List A long list of proposed programs (Step 5) was given a code number and ranked with the help of a
Multi-Criteria Analysis (MCA) (Step 6) based on criteria for liveability and sustainability developed by
the Green Team. It subsequently attributed weights to the long list. The result of the weighted MCA
scoring provides a ranked list of 12 Programs as shown below, which was discussed with the Green
Cities Steering Committee. Based on this discussion, the list was appraised rearranged to identify the
top 4 programs to be included in the Listed programs. Proposals that could not be accommodated in
this version of the GCAP will be further specified and incorporated into future versions. It should be
noted, however, that during this process a new program for tidal power generation was proposed
and subsequently included in a list of top 5 priorities.
Long List of 12 Ranked Green Programs
Ranking Program
1 On-site sanitation with septic tanks and periodical desludging service (LLTT)
2 Development of urban drainage and flood control system
3 Efficient municipal water supply (PDAM)
4 Community-based SWM including waste banks
5 Tidal electric power generation in Kendari Bay
6 City slum eradication
7 On-and-off site sanitation
8 Green City (Eco) tourism development in Kendari Bay area including mangrove expansion
9 Urban farming as contribution to economy, resilience, and green open space
10 Energy efficiency in public buildings, industries, street lighting, and communities
11 Expansion of green education program (Sekolah Adiwiyata)
12 Environmentally friendly public transport and urban mobility including NMT

17
Priority Green Programs
From the above list, the top eight (5) priority Programs were selected based on their strategic
importance to green development (Step 6).
Ranking Program
1 Expansion of on-site sanitation with septic tanks and periodical desludging service (LLTT)
2 Development of urban drainage and flood control system
3 Efficient municipal water supply (PDAM)
4 Community-based SWM including waste banks
5 Tidal electric power generation in Kendari Bay
1. On-site sanitation with septic tanks and periodical desludging service (LLTT)
The aim of this program is to respond to an urgent need for better sanitation. One way to
protect groundwater from contamination is to free the soil from E.Coli bacteria. It is estimated
that in Kendari only 5% of all existing septic tanks are watertight while a centralized sewerage
system still has very limited coverage, with the result that groundwater is polluted. On-site
septic tanks not only need to be made watertight, but their number needs to be greatly
increased to provide access to all low-income citizens. In addition, a regular desludging service
needs to be made available to empty septic tanks.
To achieve this, the community has to be persuaded to install new septic tanks, and repair or
replace unsafe septic tanks to meet national health standards (Standar Nasional Indonesia -SNI)
through advocacy, institutional development, and regulations concerning on-site sanitation
management. In addition, on-site sanitation should be developed as a potentially profitable
private enterprise. As an initial step, the municipality of Kendari will build septic tanks that meet
SNI standards in public municipal buildings in Kendari as well as in low-income communities
(Masyarakat Berpenghasilan Rendah -MBR).
2. Urban drainage and flood control system
The aim of this program is to respond to an urgent need to reduce, and if possible, eliminate
floods, inundations, and stagnant water that degrade roads and buildings in built-up areas. A
Masterplan needs to be drafted, a Local Regulation enacted to implement it, and infrastructure
needs to be developed. In addition, dredging of the Kendari Bay will be required to allow
quicker discharge of rainwater.
3. Municipal Water Supply
The aim of this program is to respond to an urgent need for reduction of NRW from over 50% to
5%, a d a orporatizatio of the PDAM s operatio s. A Masterplan (RISPAM) exists but has
not yet been implemented, in part due to lack of human and financial resources. A cooperation
agreement needs to be made between national government, provincial government, and the
municipality of Kendari that divides responsibilities between the parties, and strengthens
capacity of the Municipal Water Enterprise (PDAM). Considering that current local capability is
insufficient, while at the same time itize s ability and willingness to pay has sufficient
elasticity, the intended turnaround is likely to require the participation of a third party.

18
4. Community-based solid waste management
At present, solid waste is already managed quite well, but as the landfill site is increasingly
expensive to operate and expand as the population is growing, there is an urgent need to
reduce the amount of waste that is going to the final disposal site by giving more impetus to
management at community level through waste bank.
5. Tidal electrical energy generation in the Kendari Bay
Even though electricity supply is not a municipal responsibility, there is an urgent need to
identify and promote additional sources of power generation that may reduce the shortages in
Kendari and surrounding areas, thus reactivating economic development and improving the
delivery of public services. In addition, the city needs to promote more efficient use of available
energy including energy-efficient public buildings, factories, street lighting and community solar
panels. Construction of a waste-to-energy plant may be considered in the future if the volume
of waste produced warrants it. The initiative will start with the preparation of an Energy
Masterplan, to be followed by a Pre-Feasibility Study (PFS) for a pilot tidal energy plant. This will
require the engagement of several stakeholders at local, provincial and natioinal level, as well
as advice from independent power providers.
Final Selection of Priority Programs
After selecting five priority Programs, the Green Team reported the result to the GCAP Steering
Committee including the Heads of all local government agencies (SKPD) involved, and finally had a
consultation with the Regional Secretary (SekDa Kota Kendari) as the representative of the Mayor.
After final consideration of financial, regulatory and institutional risks for implementing each project
and the interfaces and possible synergies between projects, it was concluded that four out of five
Programs were implementable but required provincial, national and/or international intervention.
Only the community-based SWM program could be implemented through the local budget (APBD)
without external help. Programs 6 to 12 would also require external assistance and be formulated in
a next stage of GCAP development

19
The Next Five Years – Priority Programs, Projects & Actions

20
Introduction This section describes the prioritized programs, projects and actions Kendari will undertake in the
next five years. It also describes the institutional set-up we will implement to ensure informed and
timely decision making and careful management of the interfaces between different projects. To
avoid misunderstandings, we include a short list of definitions of key terms used in this section.
Program A i itiati e for pro oti g gree de elop e t ha i g stated goals that at h the it s vision and
mission. A program normally comprises a number of projects that have clear interfaces, and is
formulated in a Program Brief or Digest.
Project An investment in a physical infrastructure project, or the creation of a new organization, or a policy
revision, or a local regulation, to be formulated in a Project Brief. If the project (such as establishing
a new body or policy) is subsidiary to another project, it is understood to be a sub-project or action.
Action In the context of the GCAP, actions comprise one or more activities required to meet the conditions
for project implementation, such as setting up a Project Management Unit (PMU), preparing a
project implementation plan (PIP), preparing Terms of Reference, identifying sources of financing,
acquiring land, etc.
Project Management Unit (PMU) A temporary organizational unit created for the purpose of preparing a project implementation plan,
and managing the project on a day to day basis. A PMU is headed by the agency responsible for the
project. An operational budget for the PMU needs to be allocated. Representatives of relevant
SKPDs, other agencies and possibly representatives of the community can also be members of the
PMU. The PMU will consider whether or not alternative implementing mechanisms (BOT, Joint
venture, CSR, etc.) will be considered in the feasibility study, but also the actions related to changing
or implementing regulations (Perda), issuing permits, etc.
Project Implementation Plan (PIP) A document that describes in detail the actions needed for implementing the project, including
preparatory activities. The PMU should be in charge of preparing and managing it. It covers the
project cycle -a sequence of events and activities usually starting with a feasibility study, project
design, financing, land acquisition, tendering, procurement, construction supervision, monitoring
and evaluation, as well as operation and maintenance. It clearly describes the division of
responsibilities, timeline and budgets needed. It specifies what decisions are needed, when, and by
whom. A project is normally undertaken by a contractor, government department, a combination of
public and private actors, a consortium, etc. Different actors can be responsible for different parts
of the project cycle. The PMU will update the PIP over the course of developing the project. At the
start, the PIP will focus on the activities to prepare a detailed design, feasibility study and tender
strategy. Based on the choices made related to the implementing mechanisms (traditional, PPP, joint
venture, communities, etc.), the PIP can be further detailed for procurement, construction and
O&M.

21
Institutional Ena ling A tions for Green Tea and PMUs We will use the results of the Green Cities Program (Asian Development Bank, Bappenas,
Kementerian PUPR) as a starting point to further intensify our efforts to transform Kendari into the
greenest city in Indonesia. On top of the specific actions we have formulated for prioritized
programs and projects, we intend to further improve the institutional set-up needed for a well-
informed and timely decision making process.
A Steering Committee (SC) will monitor and guide the progress on GCAP and actions on a quarterly
basis. The Mayor will chair the SC that further consists of heads of SKPDs in the field of green
attributes, and other stakeholders. As hair of the Gree Tea , the head of Bappeda will keep the
Mayor informed about the progress to enable the Mayor to make decisions when needed.
The Gree Tea ill oordi ate progra s a d proje ts a d the i terfa es et ee progra s a d
proje ts. The ill also update the GCAP e er ears. The Gree Tea ill eet i-weekly to
monitor progress on specific projects and actions. Those in charge of specific programs and projects
ill i for the Gree Tea a out their progress a d spe ific issues, decisions or guidance they
eed. The Gree Tea ill deter i e the age da for eeti gs ith the “C a d prepare these meetings. Specific taskforces (PMU) will be set-up to drive the implementation of programs and
projects on a day to day basis. The taskforces will be made up of representatives of relevant SKPDs
and other agencies and led by the agency/ body responsible for the sector.
Institutional Enabling Actions What? Who? When?
Mayoral Decree on set-up a d i stallatio of “C a d Gree Tea i l. des riptio of roles, “OP, e ership a d budgets
Mayor Update in 2106
Co ti uatio of Ma or s de ree i ludi g udget allo atio Head of Bappeda annually
Work-pla Gree Tea i ludi g i itiati g the set-up of
specific taskforces/ PMUs for agreed projects
Gree Tea as and when
required
E aluatio of perfor a e of Gree Tea Steering Committee bi-yearly
Steering
Committee
Gree Tea
Taskforce / PMU
– Waste
Taskforce / PMU
– Water
Taskforce / PMU
– Green taxes
Monitoring
/ guidance
Progress/
reporting
Taskforce GCAP
Mayor Informs / key
decisions
Monitoring/ guidance Progress/ reporting

22
The Five Priority Programs – Action Plans The Action Plans that were included in the GCAP are shown on the following pages.
Ranking Program
1 Expansion of on-site sanitation with septic tanks and periodical desludging service (LLTT)
2 Development of urban drainage and flood control system
3 Efficient municipal water supply (PDAM)
4 Community-based SWM including waste banks
5 Tidal electric power generation in Kendari Bay

23
Green Waste – Action Plan
Program: Improvement of on-site sanitation system
(LLTT)

24
Green Waste – Action Plan
Program: Improvement of on-site sanitation system (LLTT)
Why? Currently Kendari has limited sewage network and uptake of on site sanitation is limited. Open
defication and untreated waste entering the the environment is common and less than 50% of
households have acceptable toilet facilities. This is creating an impact on the groundwater, surface
water and bay environments and is unacceptable in terms of Kendais Green City objectives.
Current status To increase coverage, the City Government of Kendari has already decided to develop a new
city-wide sanitation strategy, and has drafted a law related to wastewater management which is
currently under discussion.
A waste water treatment plant is planned for the densely populated area and a suitable location for
this has already been identified.
Goal The main objective of this program is to provide by 2020 regular services to desludge human waste
(septage) from individual septic tanks and improve facilities for individual household and communal
septic tanks which are viable and meet technical and environmental requirements. A number of
parallel activities are required to support this main goal including the provision of a fleet of septage
pumping trucks, and institutional strengthening.
Results 1. Provision of 4,000 impermeable septic tanks in 5 years.
2. Increasing the fleet of septage pumping vehicles.
3. A waste water treatment plant to receive domestic waste and pumped septage.
Benefits 1. Reduces the sanitation impact on both groundwater and surface water and thus on human
health.
2. Strengthens resistance to ecological hazards.
3. Provides a public service that is efficient and reliable.
Success indicators (targets)
Indescriminate defication
2015 11%
2020 0%
Regular septage pumping (% of households)
2015 0.7%
2020 10%
Household sanitation facilities
2015 46%
2020 100%
25
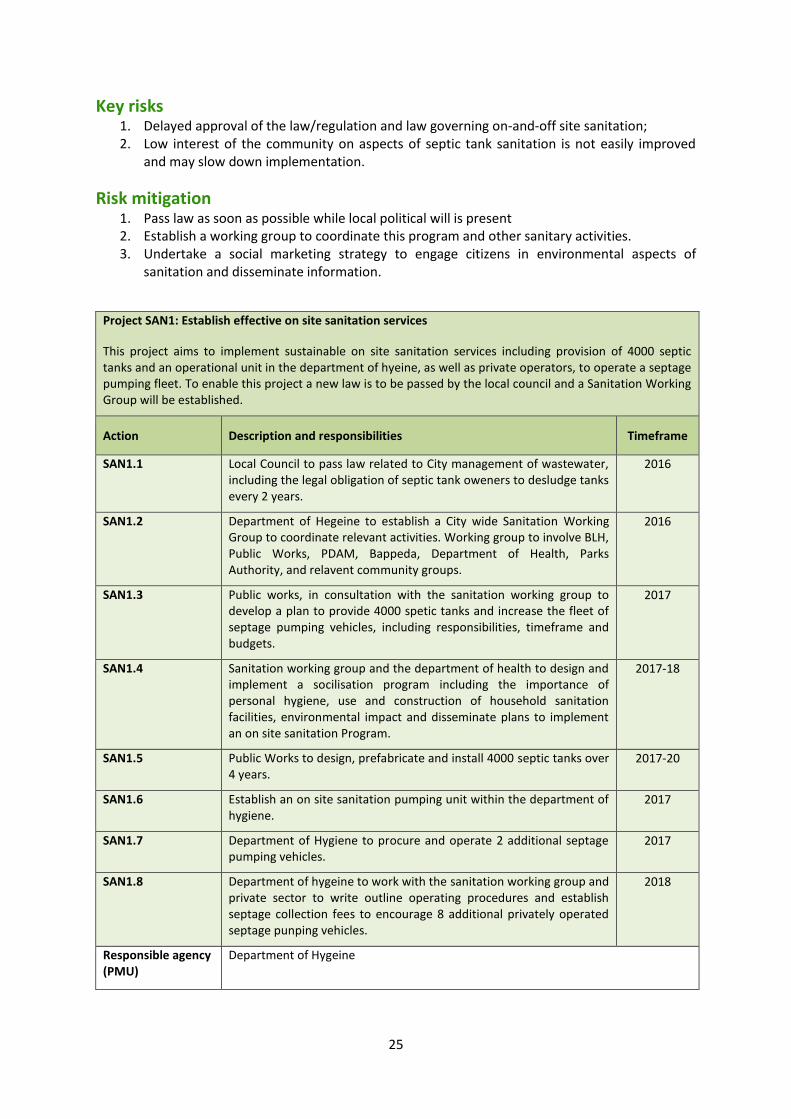
Key risks 1. Delayed approval of the law/regulation and law governing on-and-off site sanitation;
2. Low interest of the community on aspects of septic tank sanitation is not easily improved
and may slow down implementation.
Risk mitigation 1. Pass law as soon as possible while local political will is present
2. Establish a working group to coordinate this program and other sanitary activities.
3. Undertake a social marketing strategy to engage citizens in environmental aspects of
sanitation and disseminate information.
Project SAN1: Establish effective on site sanitation services
This project aims to implement sustainable on site sanitation services including provision of 4000 septic
tanks and an operational unit in the department of hyeine, as well as private operators, to operate a septage
pumping fleet. To enable this project a new law is to be passed by the local council and a Sanitation Working
Group will be established.
Action Description and responsibilities Timeframe
SAN1.1 Local Council to pass law related to City management of wastewater,
including the legal obligation of septic tank oweners to desludge tanks
every 2 years.
2016
SAN1.2 Department of Hegeine to establish a City wide Sanitation Working
Group to coordinate relevant activities. Working group to involve BLH,
Public Works, PDAM, Bappeda, Department of Health, Parks
Authority, and relavent community groups.
2016
SAN1.3 Public works, in consultation with the sanitation working group to
develop a plan to provide 4000 spetic tanks and increase the fleet of
septage pumping vehicles, including responsibilities, timeframe and
budgets.
2017
SAN1.4 Sanitation working group and the department of health to design and
implement a socilisation program including the importance of
personal hygiene, use and construction of household sanitation
facilities, environmental impact and disseminate plans to implement
an on site sanitation Program.
2017-18
SAN1.5 Public Works to design, prefabricate and install 4000 septic tanks over
4 years.
2017-20
SAN1.6 Establish an on site sanitation pumping unit within the department of
hygiene.
2017
SAN1.7 Department of Hygiene to procure and operate 2 additional septage
pumping vehicles.
2017
SAN1.8 Department of hygeine to work with the sanitation working group and
private sector to write outline operating procedures and establish
septage collection fees to encourage 8 additional privately operated
septage punping vehicles.
2018
Responsible agency
(PMU)
Department of Hygeine

26
Estimated costs
(budget needs)
Preparation (design, procure): Rp. 1 Billion
Realization (CAPEX): Rp. 3 billion/year (4 years)
Maintenance & operation: to be determined
Implementing
mechanism,
funding & financing
ABPN and APBD. Prvate operators of 8 septage pumping vehicles.
Other partners Kendari: Sanitation Working Group, Public Works, Bappeda, BLH
National Government: Ministry of Public Works and Ministry of Health
Social/ communities: WAHLI, AKKOPSI, ressidents and community groups
Project 2: Establish public toilets in public parks
It has been proposed to pilot composting (dry) toilets in public parks in Kendari. This will require establishing
a pilot project and if successful upsaling this to other public areas.
Action Description and responsibilities Timeframe
SAN2.1 Establish PMU in Public Works department, with members of the
Sanitation Working Group.
2017
SAN2.2 Identify suitable pilot project location. 2017
SAN2.3 Finalise design of composting toilets based on best practice
international literature.
2017
SAN2.4 Construct bio-toilets. 2018
SAN2.5 Scale up project to all public parks if pilot project is successful. 2019
SAN2.6 Establish an operaions unit in the City Parks Agency. 2019
Responsible agency
(PMU)
Public Works Deparment
Estimated costs
(budget needs)
Realization (CAPEX): Rp. 500 M
Implementing
mechanism,
funding & financing
City Budget
Other partners Kendari: Department of Hygiene, Parks Agency.
Project SAN3: Construct 6 Communal WWTPs in the densely populated coastel regions of Kendari Bay
Provide wastewater treatment plant to serve these densely populated and poor areas wich discharge
effluent directly to the bay.
Action Description and responsibilities Timeframe
SAN3.1 Establish a PMU in Public Works for developing large septage storage
facilities inclusing secondary treatment of liquid effluent before
discharge to the bay
2106
SAN3.2 Public Works Department to Identify suitable sites and liaise with
Bappeda on land aquisition
2017
SAN3.3 Undertake a feasibility study to establish an appropriate and replicable
desing for these small treatment facilities:
2017

27
Consider large communcal septic tanks with secondary treatment for
liquid effluent.
SAN3.4 Commission detailed design 2018
SAN3.5 Ovesee construction 2018
SAN3.6 Include operation of these facilities in the technical operaions unit of
the department of hygiene.
2018
Responsible agency
(PMU)
Public Works
Estimated costs
(budget needs)
Preparation (design, procure): Rp. 500 Million
Realization (CAPEX): Rp. 2 Billion
Maintenance & operation: to be determined
Implementing
mechanism,
funding & financing
Not applicable
Other partners Kendari: Department of Hygeine, Santiation Working Group
Social/ communities: RW/RT of selected communities.

28
Green Water – Action Plan
Program: Urban Drainage & Flood Control

29
Green Water – Action Plan
Program: Urban Drainage & Flood Control
Why? It is forecast that because of insufficient drainage & flood control infrastructure, Kendari will
increasingly suffer from floodings as a result of continuous population growth, deforestation,
sedimentation, and climate change. The recurring floods in the city cause disruptions to traffic,
health hazards, and risks to the local economy. If no remedial action is taken, these disruptions will
continue to grow in importance. Kendari needs improved resilience to flooding through improved
infrastructure, planning and management.
Current status Kendari has no Masterplan and Local Regulation on drainage and flood control yet, even though they
are urgently needed. At present, response to floodings is ad-hoc, mainly by engaging citizens in
periodical cleaning of drains, and dredging canals to remove excessive sediment. Detailed
Engineering Designs have been prepared for 5 sub-catchments without an integrated approach to
urban flood risk management, and construction has yet commenced. There is insufficient
enforcement of discipline in properly disposing of household, commercial, and industrial waste (this
is addressed under the Waste Banks Program).
The Kendari Bay is becoming increasingly shallow because of sedimentation. This is caused by the 22
rivers and creeks flowing into the Bay, and aggravated by the gradual disappearance of the coastal
mangrove forest, surface mining in the upstream area outside the Kendari city boundary (that also
introduces poisonous minerals into the sediments), and increased deforestation. It is estimated that
1 million m3 of sediment needs to be dredged from the Bay annually to prevent it from disappearing
altogether.
Goal The main objective of this program is to provide by 2020 an adequate drainage and flood control
system that is able to prevent all but the most extreme floods, will safeguard the Kendari Bay as a
Green Belt and potential area for eco-tourism, can be periodically upgraded and improved to
anticipate future drainage and flood control problems, and enforces compliance with environmental
regulations on cleanliness.
In addition, adequate annual dredging of the Kendari Bay will have a significant impact on the
feasibility and effectiveness of another proposed program, the Green Tidal Energy Generation Pilot
that requires the tidal current from the Kendari Bay to be as large as possible in order to maximize
power. Because of its importance, dredging is listed as one of the projects in the urban drainage &
flood control program.
Results 1. Kendari Masterplan for Drainage & Flood Control 2017-2035
2. A Local Regulation (Perda) to implement the Masterplan and enforce compliance
3. Budgets acquired to implement the Masterplan
4. Infrastructure built according to the Masterplan
5. Management capacity established to operate and maintain the D&FC system

30
Benefits 1. Reduced flooding
2. Increased cleanliness
3. Reduced health hazards
4. Improved business and reduced economic loss
5. Kendari Bay safeguarded as a potential area for eco-tourism and tidal energy generation
Success indicators (targets) Regular inundation area
2015 6,500Ha
2020 5,500Ha
Key risks 1. Delayed design, approval, and funding of the Masterplan & Local Regulation
2. Insufficient cooperation between municipal agencies to implement and enforce the
Masterplan & Local Regulation
3. Continued low citizen commitment to proper waste management
4. Potential displacement of staff in related agencies to manage the program.
Risk mitigation 1. Implement regulatory updates as soon as possible while local political will is present (before
policy / regime changes occur in 2017).
2. Establish a working group to coordinate this program.
3. Undertake a social marketing strategy to engage citizens in environmental aspects of
drainage & flood control, and disseminate information periodically.
Project FL1: Establish integrated database for the Kendari Drainage & Flood Control System
To develop an integrated system to manage urban flooding in Kendari, particularly with respect to planning
infrastructure and asset management, a database should be established incorporating all existing data. This
should use an integrated GIS platform, such as that used by the Spatial Planning Agency.
Action Description and responsibilities Timeframe
FL1.1 Establish a drainage and flood data unit in Kendari Public works
department
2016
FL1.2 Liaise with Spatial Planning Agency on GIS capacity and best approach
to data management
2016
FL1.3 Assemble hard soft and electronic data for digitising into GIS layers,
including topography and natural drainage network, hard drainage
assets, embankments, inundation areas, issues reported etc
2017
FL1.4 Maintain GIS database platform with assistance from City Planning
Agency
ongoing
Responsible agency
(PMU)
Public Works Department
Estimated costs
(budget needs)
Preparation (design, procure): ~Rp. 500 Million
Implementing
mechanism,
funding & financing
APBD Kendari

31
Other partners Kendari: Bappeda, BLH, Spatial Planning Agency
National Government: Ministry of Public Works
Project FL2: Prepare Kendari Urban Drainage & Flood Control Masterplan
Currently drainage improvements and flood risk mitigation measures are implemented in an ad hoc manner.
There is some capacity to procure detailed engineering designs for drainage, and construct and maintan such
infrastructure but there is little strategic planning and coordication to ensure infrastructure is implemented
effectively and efficiently in improving urban resilience. The Terms of Reference for this will include (not
limited to):
Considering sustainable urban drainage principles including Kendari s aki g spa e for ater . This ill require liaising with the spatial planning agency.
Consideration of Climate Change.
Develop short term priority investments, medium term projects, and longer term programs to reduce
flood risk in an integrated way.
The masterplan should propose institutional and budgetary requirements for implementing the short
medium and long term investments.
Participative planning with the City Green Team to ensure a coordinated and integrated approach.
Action Description and responsibilities Timeframe
FL2.1 Public works to commission of a drainage and flood risk mitigation
masterplan for Kendari.
2017
FL2.2 Public works to commission any additional technical assessments and
surveys to enable the masterplanning process, including hydrological
monitoring, modelling, and updated topographic surveying.
2017-18
FL2.3 Provide counterpart staff to work with consultants to develop capacity,
and update outputs into GIS database.
2018
Responsible agency
(PMU)
Public Works Department
Estimated costs
(budget needs)
Preparation (design, procure): ~Rp. 250 Million
Implementing
mechanism,
funding & financing
APBD Kendari
Other partners Kendari: Bappeda, BLH, City Planning Agency, Green Team
National Government: Ministry of Public Works
Project FL3: Draft and enact a Local Regulation (bylaw, Perda) on the Kendari Masterplan for urban
drainage & flood control
To implement the drainage masterplan a local regulation is needed to legalise the masterplan and thus
enable budget allocation for implementation. The regulation should be based on the recommendations of
the master plan and cover:
Budget allocation and approval.
Responsibilities for design, procurement, construction and maintenance of drainage assets.
Regulation of impermeable surface construction % on new developments (to reduce surface runoff).
Responsibility of developers for maintaining drainage assets adjacent to their land.
Public participation in drain maintenance.
Regulation of dischardes (effluents) to drains.
Sanctions for interrupting the local drainage system.

32
Action Description and responsibilities Timeframe
FL3.1 Draft Academic paper with Perda recommendations and outline. 2018
FL3.2 Public Works draft Perda and Submit Perda to Council for approval. 2018
FL3.3 Enact the local regulation by implementing priority drainage
infrastructure detailed in the masterplan.
FL3.4 Public works to coordinate with Bappeda to resolve land acquisition
issues, obtain permits, arrange funding etc.
2018
FL3.5 Detailed design and construction supervision. 2019
FL3.6 Allocate human resources and budget for a sustainable urban drainage
maintenance and regulation team within public works. To work with
GIS operators, spatial planners, other infrastructure development
agencies, private sector, and communities in an integrated asset
management approach.
2019
Responsible agency
(PMU)
Public Works Department
Estimated costs
(budget needs)
Realization (CAPEX): est Rp. 15 Billion/year (5 years)
Maintenance & operation: est Rp. 1 Billion/year
Implementing
mechanism,
funding & financing
ABPD, ABPN, provincial and national funding
Other partners Kendari: Bappeda, BLH, City Planning Agency, Sanitation Agency
National Government: Ministry of Public Works
Project FL4: Control sedimentation in the Kendari Bay area to safeguard its potential role as an eco-
tourism area and its potential for future tidal energy production
The Bay represents an important economic asset to our City, including tourism and commercial potential as
well as the possibility for future tidal energy generation. Managing sedimentation requires a coordinated
approach to manage development and land use within the drainage catchments, as well as local issues
related to sediment mobilization and other local solutions (sediment capture, dredging).
Action Description and responsibilities Timeframe
FL4.1 Public works to establish a Kendari Bay Catchment management
committee for controlling Bay sedimentation including regional
governments, landowners, private sector.
2016
FL4.2 Dredging of rivers and shallow/strategic Bay areas 2016-
ongoing
FL4.3 Commission bathymetric survey to determine the depth and contours
of Kendari bay.
2017
FL4.4 Check dams constructed in tributaries of the main river channels
(Wanggu, Tipulu, Mandonga and Sodohoa rivers).
2017
FL4.5 Participation with provincial authorities, private sector (mining
companies), and farmers within the catchment to reduce sediment
production.
2017
FL4.6 ‘eha ilitatio of a gro e forest as a e ologi al apital solutio to retain sediment in the bay fringes and provide other benefits related to
climate change, habitat creation and tourism.
2017

33
Responsible agency
(PMU)
Public Works, Kendari Bay Catchment Management Committee
Estimated costs
(budget needs)
Realization (CAPEX): Rp. 1.5 Billion
Maintenance & operation: to be determined
Implementing
mechanism,
funding & financing
ABPD
Other partners Kendari: Bappeda, BLH
Provincial: Provincial and regional governments
National Government: Ministry of Public Works and Ministry of Health
Social/ communities: Farmers and landowners and communities in the catchment
Private sector: Minerals operators
34
Green Water – Action Plan
Program: Increasing the efficiency and supply of
drinking water

35
Green Water – Action Plan
Program: Increasing the efficiency and supply of drinking water
Why? Due to population growth in Kendari, and lack of recent investment (since year 2000 under the
World Ba k s loa fi a ed proje t, called Sulawesi Urban Development Project) in water supply
infrastructure, particularly in the distribution system, there are large un-serviced areas within the
city, many urban residents lack access to adequate and safe water supply and sanitation services.
The current service coverage provides drinking water to 35% (20,202 house connections, 2015) of
the total population. PDAM Tirta Anoa, our City water utility enterprise, operates unsustainably and
delivers substandard services. Currently maintenance of systems is restricted by a lack of funding
and limited revenues from treated water, 56% non-revenue water (NRW).
To meet national government targets (100% access to clean drinking water), improve liveability in
our City, human health, and facilitate economic growth, the City needs to work with PDAM to
improve efficiency and management in water supply, reduce losses, and the coverage and reliability
of treated water supply.
Current status The total value of lost water produced by PDAM Tirta Anoa is estimated as Rp. 38 Billion/year and
total revenue is 34 Rp. Billion/year. A NRW study was undertaken in 2015 which suggested physical
leakage reaches 2.3 million m3/year due to poor maintenance and over-pressurisation of the
distribution network; over 0.5 million m3/year is caused by errors in water meter data management
and 0.78m3/year is lost through illegal connections.
The NRW issue creates a negative feedback cycle as lost revenues result in poor operating and
management practices and inability to undertake maintenance. Energy supply issues create
unreliability which in turn creates reluctance in bill paying, and many complaints to PDAM office.
There is currently sufficient raw water supply, the pressing issue is improving management and
operation and maintaining distribution netowrks to create a sustainable water supply organisation.
For this, PDAM requires support form a number of City stakeholders, hence its inclusion in this GCAP
to allow for better management of institutional partnerships for implementation, particularly
coordination between Bappeda, Department of Housing, and PDAM. It is also necessary for PDAM to
coordinate with Central Government stakeholders.
A water supply masterplan has been produced.
Goal The project aims to address the most urgent needs of the urban water sector by improving and
e pa di g ser i es; a d to o tri ute to the Go er e t s target of achieving 100% piped water
supply coverage in urban areas by 2020 by (i) rehabilitating and improving existing water treatment
plants, (ii) augmenting or replacing existing distribution pipelines to increase system pressure and
improve service delivery, and (iii) providing new transmission and distribution pipelines, (iii)
providing improved 24-hour service coverage and better water quality, as well as (iv) making the
PDAM more autonomous and therefore more financially sustainable and (v) providing capacity
development support to PDAM.
Water security actions and an additional Water treatment plant are included in the water supply
masterplan, and are thus included in this action plan. While, our priority is to increase customers,

36
reliability, operation and management, we should not forget about securing the future water needs
of our City.
Results I. Rehabilitation and installation of new distribution pipelines.
II. Increased 20,000 additional household connections and marketing to increase PDAM
customers to 40,000 by 2020.
III. Improve energy efficiency of the water supply system and reduce non-revenue water (NRW)
– specifically reducing unaccounted for water (NRW) from 46% in 2015 to 30% in 2020.
IV. Improve PDAM management system.
Benefits I. An improvement of public service infrastructure in water supply.
II. Improvement of health and hygiene of residents, and productivity and liveability in the City.
III. Access to drinking water for the urban poor.
IV. Promotion of energy efficiency, reducing carbon footprint.
V. Better revenue generation to improve the financial performance of PDAM.
Success indicators (targets)
Coverage piped water supply services to residents
2015 35%
2020 50%
Reduction in Non-Revenue Water
2015 56%
2020 30%
House connections
2015 20,200 HCs
2020 40,000 HCs
Key risks Even though the projects are relatively well defined, the technology is straightforward, key risks are:
1. Raw water sources are depleted. Government does not implement regulatory changes to
protect the catchment areas.
2. Funding availability.
3. Lack of human resources for project management and implementation may cause delays in
project implementation.
4. Private sector agreements may be difficult to finalise.
Risk mitigation 1. Decision making by the City Mayor and implementing agencies (i.e. PDAM, Bappeda, Dinas
PU) is timely.
2. Institutional coordination between the City Government and PDAM (through green team) in
implementing network expansions in line with increases in treated water supply.
3. Kendari should seek technical assistance from Jakarta to assist in arrangements with private
sector.
4. O&M is prioritized and sufficient funds are allocated by PDAM in their annual budget.
5. Appropriate tariffs i posed for PDAM s ost re o er .

37
6. Provide specific support and on the-job training to mitigate these risks and the PDAM will
ensure that additional qualified staff are recruited.
Project WAT1: Prepare to implement an integrated Non-Revenue Water (NRW) reduction program
Non-revenue water reduction requires many integrated components from technical design and installation
of appropriate infrastructure (including pumping, networks, and meters), through to operational asset
management, financial management, information management, marketing to new customers, and
enforcement.
Feasibility study should consider:
detection and reduction of leakage and a leakage repair/maintenance program
gradually introducing improved district metering areas and data-basing to evaluate losses
Installation of pressure reduction valves
Replacement of customer water meters, phasing in digital water meters
The possibility to involve private sector to undertake an energy efficiency audit and implement energy
efficiency improvements (re-specification of pumps etc) through a ESCO type arrangement.
Tariffs and financial management improvements
Regulatory issues and enforcement
Currently the PDAM is receiving technical assistance from Public Works in Jakarta. PDAM Tirta Anoa will use
this wisely and develop a plan for an integrated feasibility study for NRW reduction. PDAM can start by
undertaking necessary tasks.
A realistic business plan then needs to be established.
Preparation for this program includes developing a marketing strategy, and in house capacity development.
PDAM will require support from the City in preparing a NRW program.
Action & planning
(action completed)
Description and responsibilities Timeframe
WAT1.1 PDAM consults with BPPSPAM department of Ministry of Public
Works to develop the NRW study into a feasibility study for
improvements
2016
WAT1.2 Bappeda allocates budget for a feasibility study into NRW
improvements
2016
WAT1.3 PDAM conducts initial studies:
Identify physical and non-physical water losses
Measure water pressure in house connections
Metering analysis to update NRW baseline.
WAT1.4 PDAM drafts comprehensive Terms of References (ToR) and allocate
the funds within their business plan 2017
2016
WAT1.5 PDAM in collaboration with Bappeda processes the procurement and
support consultants in implementation of the FS for NRW reduction
program activities. PDAM provides transparent financial data.
2017
WAT1.6 PDAM (with assistance of Bappeda and BPPSPAM) approves the FS
and holds public consultation together with PDAM and the
Consultant to ensure public acceptance and implementation.
2017
WAT1.7 PDAM develop a business plan for 2018 inline with the findings of
the approved feasibility study, allocating budgets for projects 2, 3
and 4 (below).
2017

38
WAT1.8 Investment in staff is critical and budgets need to be allocated for
hiring, retaining and training quality staff. Human resources is a key
issue for PDAM and needs to be addressed as soon as possible,
through an in house Human Resources Development Program which
maps skills gaps throughout the organisation and identifies external
and internal training courses to develop skills. Training with PDAM
Malang has already commenced.
2017
WAT1.9 Marketing to new and existing customers to socialise water tariffs,
increase customer base, and reduce illegal connections.
2017
Responsible agency
(PMU)
PDAM Tirta Anoa
Estimated costs
(budget needs)
Preparation (design, procure): Rp. 750 million
Realization (CAPEX): ~ to be determined based on the feasibility study
Maintenance & operation: to be determined based on the feasibility study
Implementing
mechanism,
funding & financing
Not applicable
Other partners Kendari: Bappeda Office, Green Team
National Government: Ministry of Public Works & Housing, BPPSPAM
Social/ communities: Customer consultation.
Project WAT2: Implement Non revenue water (NRW) reduction (from 45% to 30% by 2020)
This project is a result of project 1 and needs to be integrated with project 3 because rehabilitating and
expanding networks should consider leakage reduction and metering/zoning; and, project 4 because new
household connections should be metered and affordable tariffs set and collected.
Actions & planning
(action completed)
Description and responsibilities Timeframe
WAT2.1 PDAM to assign a PMU to develop a detailed project implementation
plan (based on NRW aspects of the business plan) including
coordination strategy. Green teams and Bappeda can act in a
coordinating role. Initial consultation with specialist energy efficiency
companies.
2017
WAT2.2 PDAM undertakes procurement of all necessary supplies (leak
detection equipment, piping and accessories, meters, pressure
meters, etc.) to rehabilitate existing networks and reduce water losses
in coordination with Project 3.
2018
WAT2.3 PDAM commissions a specialist firm to undertake an Energy efficiency
audit, with the view to engage private sector (through an ESCO
arrangement) in financing energy efficiency measures to produce
savings.
2018
WAT2.4 Gradual phasing of District metered areas in coordination with Project
3.
2018-2020
WAT2.5 Evaluation of excessive pressure and procurement and installation of
pressure reduction valves. Replacement of inefficient pumps.
2018-2020
WAT2.6 Social marketing of payment for water to reduce illegal connections
and prosecutions.
2018-2020
Responsible agency
(PMU)
PDAM: Responsible for delivering NRW reductions and energy efficiency
improvements

39
Estimated costs
(budget needs)
Preparation (design): Rp. 750 million
Realisation (construction): Estimated in Project 1.
Implementing
mechanism, funding
& financing
Traditional procurement, ESCO
Other partners Social/ communities: PDAM customers
Project WAT3: Extension of distribution network of SPAM PDAM
Kendari City Public works Agency (Dinas PU), in partnership with PDAM, will add to existing networks where
capacity is insufficient due to increased population in those areas, and provide new distribution networks in
un-serviced areas.
Bappeda of Kendari City should coordinate the planning of this action as it requires a number of inputs,
surveys and social data. The Dinas PU and PDAM will evaluate existing networks and a staged plan to
implement these improvements will be developed. PDAM will evaluate the existing conveyance of water
transmission pipelines and propose upgrades necessary to meet future requirements in all water supply
zones - and specify the necessary improvements. The Dinas PU Agency is responsible for design and
construction. Operation and maintenance responsibilities are transferred to PDAM on completion.
Actions & planning
(action completed)
Description and responsibilities Timeframe
WAT3.1 Green team to set-up project management unit (PMU) to be led by
Bappeda, including the Dinas PU and PDAM.
2017
WAT3.2 Dinas PU, Bappeda, and the City Spatial Planning Agency undertake
initial survey of potential suitably populated areas for the water
distribution network expansion plan.
2017
WAT3.3 PDAM evaluate conveyance of existing networks, identifying required
upgrades in pipe diameter.
2017
WAT3.4 The Department of Public Works drafts a workplan for implementing
the required expansion/upgrades to the distribution network, including
detailed activities, responsibilities, timeline, need for external
assistance (consultants), budget etc.
2018
WAT3.5 Approve project implementation plan and budget 2018
WAT3.6 The Department of Public Works undertakes procurement of detailed
design, cost estimates,
2018
WAT3.7 Detailed consultation phase with all relevant stakeholders, City
Agencies – housing, environment, highways – and communities and
landowners affected by easements and construction.
2019
WAT3.8 Excavation permits issued by Highways Agency and EIA approved by
Environment Agency (BLH)
2019
WAT3.9 Public works tenders construction, and supervises project
implementation.
2019
WAT3.10 Project completion and transfer of infrastructure to PDAM. 2020
Responsible agency
(PMU)
Dinas PU Agency: Responsible for construction of water distribution networks
Estimated costs
(budget needs)
Preparation (design): Rp. 1.200 million
Realization (construction): Rp. 60 billion

40
Implementing
mechanism,
funding & financing
Traditional procurement
Funding by ABPD I and APBD II
Other partners Kendari: Bappeda, Spatial Planning, BLH, Highways, Police department and
transportation agency (for mitigating construction impacts on traffic), partnership
with other utilities to improve efficiency in utility network expansions.
Regional: PDAM
Social/ communities: Affected communities, businesses, social services (schools,
hospitals etc.)
Project WAT4: Installation of metered house connections with a target of 40,000 HCs (2020)
To increase the customer base and thus revenue, in line with network expansions and provide water supply
to residents, PDAM will increase the number of household connections from 20,000 to 40,000 by 2020..
Action & planning
(action completed)
Description and responsibilities Timeframe
WAT4.1 In coordination with Project 3, PDAM maps potential for new
customers
2018
WAT4.2 PDAM prepares payment scheme for new connections 2018
WAT4.3 PDAM undertakes socialization and promotion to potential new
water supply customers
2018
WAT4.4 PDAM undertakes procurement and installation of new water
connection. PDAM replaces faulty water meters of existing
customers.
2018-2020
WAT4.5 Establish new customers in existing billing register/database, and
integrated with GIS system.
2020
Responsible agency
(PMU)
PDAM Tirti Anoa
Estimated costs
(budget needs)
Preparation (design, procure): ~ Rp. 500 million
Realization (CAPEX): ~ Rp. 3 million/connection
Maintenance & operation: to be determined
Implementing
mechanism,
funding & financing
Not applicable
Other partners Kendari: Bappeda Office
National Government: Ministry of Public Works (it would be PDAM can get a Water
Hibah fund from APBN source)
Social/ communities: customers
Project WAT5: Prepare a Water Supply Safety Plan (RPAM)
To improve resilience, and safeguarding of future water supply PDAM will develop a water safety plan for
existing and potential new sources.
Actions & planning
(action completed)
Description and responsibilities Timeframe
WAT5.1 PDAM prepares inventory of water sources and their catchment
areas
2106

41
WAT5.2 PDAM commissions hydrological water resources (low flow)
assessments for sources, with consideration of climate change.
2017
WAT5.3 PDAM evaluates the inventory and compares it with water supply
targets in the master plan.
2017
WAT5.4 If necessary PDAM investigates and safeguards possible new water
sources
2017
WAT5.5 PDAM and City Government liaise with provincial government and
catchment based stakeholders, to develop a catchment management
plan for each water source, including point and diffuse source
pollution reduction measures as well as water retention and
promotion of recharge.
2017-18
WAT5.6 These catchment management plans should be implemented and
enforced through collaboration with provincial government and
integrated with the flood control and drainage program in this action
plan.
2018-20
Responsible agency
(PMU)
PDAM Tirti Anoa
Estimated costs
(budget needs)
Preparation (design, procure): To be determined.
Implementing
mechanism,
funding & financing
Not applicable
Other partners Kendari: Bappeda Office
Provincial: Provincial governments, landowners, agriculture, industry and
communities.
eNational Government: Ministry of Public Works and Ministry of Health
Social/ communities:

42
Green Waste – Action Plan
Program: Community Solid Waste Management

43
Green Waste – Action Plan
Program: Community Solid Waste Management
Why? To improve the environment in Kendari and reduce the pressure on final waste sites, waste
reduction, reuse and recycling activities are to be introduced in our City, so that all levels of society,
including government and business sector, limit the production of waste, by recycling and reuse
waste, or better known as the Reduce, Reuse and Recycle (3R).
These 3R activities still face a major obstacle, which is the lack of public awareness for waste
sorting. One solution to overcome that problem is through the development of "Waste Bank" which
is a "social engineering" type of activity that teaches people to sort waste and raises public
awareness in waste management. This activity will reduce the waste that is sent to landfill.
The Mayor of Kendari has encouraged the formation of waste banks to promote 3Rs in 64 villages in
Kendari through the issueance of a Mayoral Decree on the establishment of waste banks in each
village.
Currently only 2 waste banks are operational so there is a need to raise awareness of waste banks
and acale up the program in a phased manner, through initial pilot projects.
Waste banks accept pre sorted waste from communities and convert these into savings for each
waste contributor. The type of savings can be through:
Regular savings, can be taken at any time, within a minimum of one month;
Lebaran Savings, can be taken at a time before Eid to fulfil the needs of the celebration;
School Savings, can be taken for the new school year students' needs;
Grocery Savings, can be taken in the form of basic food in accordance with the value of savings;
Environmental savings, can be taken in the form of waste management tools such as trash cans,
plants, composter, carts, etc;
Social savings, the value of savings will be distributed to orphanages, boarding school, and other
social institutions by customer demand.
Current status The coverage of waste management services in Kendari in 2015 reaches 53 villages in 10
districts. Ke dari it s aste produ tio ased o the assu ptio of . kg/perso /da aste production, reaches 215.45 tonnes per day. Meanwhile, based on the data from the weight bridge,
the total transported waste to the landfill in Puuwatu district reaches 150.7 tonnes / day or 69.8% of
the total waste generation of Kendari.
As an illustration of the economic value of the 3R management, in December 2015, Haji Seno village
managed to sell 36.8 tonnes of sorted waste an estimated value of 140.8 million rupiahs.
To e ourage the appli atio of the ‘, Ke dari s go er e t origi all uilt I tegrated Waste Management Site (TPST), 21 are still functioning, and only two are equipped with waste banks
applying 3R principles.
Normatively, Mayor of Kendari has encouraged the formation Waste Bank in 64 villages in Kendari
through the issuance of Mayors Decree on the establishment of Waste Bank in each village. Despite
that effort, there are only two Waste Ba k that are still i operatio , hi h are the TP“T s mentioned above. Also, through the Adiwiyata awards event held by the Ministry of Environment
and Forestry, Kendari city also has Waste Banks in 88 Adiwiyata school with varying operational

44
level. The existence of the Waste Banks should make it easier for the city of Kendari to implement
the 3R principles on the urban scale.
Goal Economically sustainable waste banks in all Kendari villages and schools.
Results VI. A cleaner City.
VII. A more educated and proactive community in managing waste and benefiting from waste
banks.
Benefits I. Promotes a clean City and reduces environmental impact and flood risk
II. Increases community assets and economic resilience.
III. Bahavioural change in 3Rs.
IV. Environemtnal education promotes a caring society.
V. Community empowerment.
VI. Job creation.
Success indicators (targets)
Waste
Project
Coverage
Projection
2015 2016 2017 2018 2019 2020
Σ populatio i Kendari
347 496 356.552 367.356 378.487 389.955 401.770
Σ aste ser i e coverage
69.8% 75% 87% 92 97% 100%
Σ ‘ management
3% 4% 6% 10% 15% 18%
Σ Pu li Waste Bank (active)
2 4 6 8 10 12
Σ “ hool Waste Bank
88 100 120 150 180 225
Key risks 1. Lack of skills and practice in operating waste banks effectively
2. Land availability
3. Waste delivery quantities / low community participation in the waste bank scheme.
Risk mitigation 1. Capacity development through City to City learning (with Malang)
2. Larger waste banks can be used for multiple districts, upgrade existing TPSTs to include
waste banks.
3. Marketing to communities.
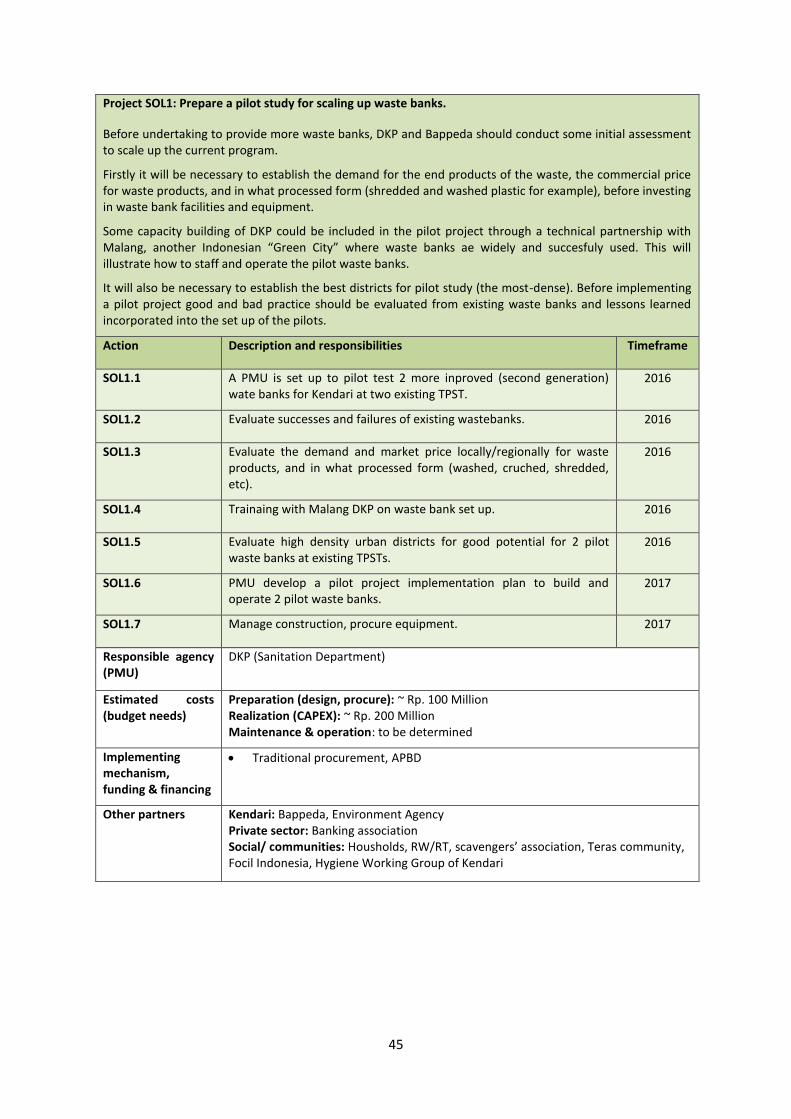
45
Project SOL1: Prepare a pilot study for scaling up waste banks.
Before undertaking to provide more waste banks, DKP and Bappeda should conduct some initial assessment
to scale up the current program.
Firstly it will be necessary to establish the demand for the end products of the waste, the commercial price
for waste products, and in what processed form (shredded and washed plastic for example), before investing
in waste bank facilities and equipment.
Some capacity building of DKP could be included in the pilot project through a technical partnership with
Mala g, a other I do esia Gree Cit here aste a ks ae idel a d su esful used. This ill illustrate how to staff and operate the pilot waste banks.
It will also be necessary to establish the best districts for pilot study (the most-dense). Before implementing
a pilot project good and bad practice should be evaluated from existing waste banks and lessons learned
incorporated into the set up of the pilots.
Action Description and responsibilities Timeframe
SOL1.1 A PMU is set up to pilot test 2 more inproved (second generation)
wate banks for Kendari at two existing TPST.
2016
SOL1.2 Evaluate successes and failures of existing wastebanks. 2016
SOL1.3 Evaluate the demand and market price locally/regionally for waste
products, and in what processed form (washed, cruched, shredded,
etc).
2016
SOL1.4 Trainaing with Malang DKP on waste bank set up. 2016
SOL1.5 Evaluate high density urban districts for good potential for 2 pilot
waste banks at existing TPSTs.
2016
SOL1.6 PMU develop a pilot project implementation plan to build and
operate 2 pilot waste banks.
2017
SOL1.7 Manage construction, procure equipment. 2017
Responsible agency
(PMU)
DKP (Sanitation Department)
Estimated costs
(budget needs)
Preparation (design, procure): ~ Rp. 100 Million
Realization (CAPEX): ~ Rp. 200 Million
Maintenance & operation: to be determined
Implementing
mechanism,
funding & financing
Traditional procurement, APBD
Other partners Kendari: Bappeda, Environment Agency
Private sector: Banking association
Social/ communities: Housholds, RW/RT, s a e gers association, Teras community,
Focil Indonesia, Hygiene Working Group of Kendari
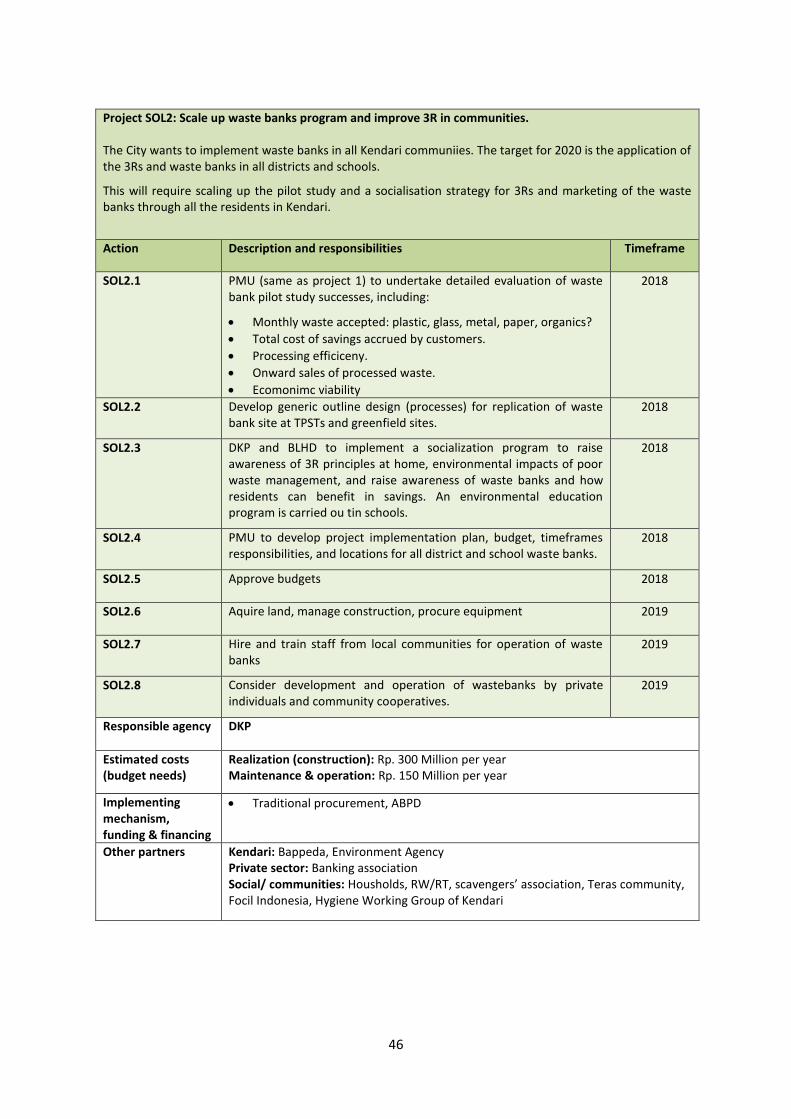
46
Project SOL2: Scale up waste banks program and improve 3R in communities.
The City wants to implement waste banks in all Kendari communiies. The target for 2020 is the application of
the 3Rs and waste banks in all districts and schools.
This will require scaling up the pilot study and a socialisation strategy for 3Rs and marketing of the waste
banks through all the residents in Kendari.
Action Description and responsibilities Timeframe
SOL2.1 PMU (same as project 1) to undertake detailed evaluation of waste
bank pilot study successes, including:
Monthly waste accepted: plastic, glass, metal, paper, organics?
Total cost of savings accrued by customers.
Processing efficiceny.
Onward sales of processed waste.
Ecomonimc viability
2018
SOL2.2 Develop generic outline design (processes) for replication of waste
bank site at TPSTs and greenfield sites.
2018
SOL2.3 DKP and BLHD to implement a socialization program to raise
awareness of 3R principles at home, environmental impacts of poor
waste management, and raise awareness of waste banks and how
residents can benefit in savings. An environmental education
program is carried ou tin schools.
2018
SOL2.4 PMU to develop project implementation plan, budget, timeframes
responsibilities, and locations for all district and school waste banks.
2018
SOL2.5 Approve budgets 2018
SOL2.6 Aquire land, manage construction, procure equipment 2019
SOL2.7 Hire and train staff from local communities for operation of waste
banks
2019
SOL2.8 Consider development and operation of wastebanks by private
individuals and community cooperatives.
2019
Responsible agency DKP
Estimated costs
(budget needs)
Realization (construction): Rp. 300 Million per year
Maintenance & operation: Rp. 150 Million per year
Implementing
mechanism,
funding & financing
Traditional procurement, ABPD
Other partners Kendari: Bappeda, Environment Agency
Private sector: Banking association
Social/ communities: Housholds, RW/RT, s a e gers association, Teras community,
Focil Indonesia, Hygiene Working Group of Kendari

47
Green Energy – Action Plan
Program: Tidal electric power generation in Kendari
Bay (pilot)

48
Green Energy – Action Plan
Program: Tidal electric power generation in Kendari Bay (pilot)
Why? It is estimated that the power company (PLN Kendari Branch) currently supplies 65 MW of daily
electricity to Kendari with diesel-fueled generators, which are unreliable. Actual demand is
approximately 75 MW, and expected to increase 30% by 2020.
Because of high operation costs of HSD & MFO diesel-fueled engines and low billing collection rate
(account receivable amounted Rp. 400 billion per annum), low tariffs as well as lack of capital
investment, the Company is operating at an unsustainable loss, and is unable to invest in improved
services.
Kendari Bay is seen as particularly advantageous site for tidal power generation due to the narrow
neck of the bay creating high velocity tidal flows.
Current status Electricity prices paid by end-users are regulated by the GOI under the Presidential Decree No.
8/2011. The average selling price in year 2013 was US$ 7.1 cents per kWh while the cost of
production was US$ 10.5 cents. The shortfall is funded through a Government subsidy currently
running at Rp. 1 trillion per annum. This results in numerous problems. Not only do citizens suffer
from power cuts each day, public services such as the water enterprise PDAM cannot operate its
plants at full capacity, with the result that water supply is erratic. Further, many businesses are
forced to invest in private backup power generators. The economy of Kendari will remain stunted if
the energy shortage cannot be overcome within reasonable time.
The supply of electricity at an affordable cost to the Government is therefore emerging as a
pote tial o strai t o Ke dari s lo g ter gro th a d de elop e t a itio s. Co se ue tl , the Government has banned the use of expensive diesel fuel for new power plant and is actively

49
promoting private sector investment in alternative feed stocks to reach its power generated targets.
The Government also has to plans to progressively increase electricity prices in coming years.
Even though the proposed pilot project for tidal energy is not under the authority of the municipality
of Kendari but rather under provincial and central government, and therefore not part of the
mandate of the Green Cities Program, it still is proposed as part of this GCAP because of its
enormous potential impact on all aspects of life in the City of Kendari, including green development
The experience of constructing, deploying and operating the devices will facilitate the development
of turbines that can be considered for commercial deployment in the Kendari Bay and elsewhere in
Indonesia.
Tidal Power Generation in Indonesia:
Atlantis, a global leader in the tidal power sector, is pleased to announce that it has entered into a
Me orandu of Understanding the Agree ent with “B“, a privately owned international marine, subsea and renewable energy developer which has been studying the potential of ocean
energy resources for tidal-stream devices around the Indonesian archipelago since 2013.
Under this Agreement, Atlantis and SBS will work together to establish a joint venture to develop a
150MW tidal stream site in Indonesia. The total cost of this commercial array has been estimated at
US$750 million and will be constructed over a number of stages. SBS has completed a feasibility
study and the project will be supported by a 25-year power purchase agreement with the state-
owned Electricity co pany, Perusahaan Listrik Negara PLN .
Atlantis has the largest portfolio of tidal power projects in the United Kingdom, which represent a
combined potential capacity of almost 700MW, in addition to its other development projects
throughout China, Canada, India and a number of other parts of the world.
Goal The main objective of this program is to implement by 2020 a pilot to provide tidal energy from the
Kendari Bay. This is closely related to the proposed program on Green Urban Drainage and Flood
Control, because significant sedimentation in the Bay may affect the feasibility of tidal power
generation.
The experience of constructing, deploying and operating the tidal turbines will facilitate the
development of turbines that can be considered for commercial deployment in the Kendari Bay and
elsewhere in Indonesia. The pilot will enable monitoring and research associated with the
deployment, installation, and operation of tidal turbines for the purposes of: (a) supporting
improvement of this technology, and (b) providing an understanding of its potential environmental
impacts.
Results I. Pre-feasibility study on tidal power generation in Kendari Bay
II. If feasible, permit, construct and operate a pilot tidal energy facility in the Kendari Bay.
Benefits I. Meeti g I do esia s GHG ‘edu tio Co it e ts a d ‘e e a le Ele tri it Produ tio
Commitment by 2020 by accelerating the renewable energy instead of fossil fuel derived
energy.
II. Providing the opportunity to acquire the know-how to deploy, service, and grid-integrate
tidal turbines just as a world market opens up.
III. Improving the sustainable supply of energy to Kendari and enabling economic development.

50
Success indicators (targets)
PFS completed, Tidal Energy pilot deemed viable
Tidal Energy pilot ready for implementation
Key risks 1. Ke dari Ba does t ha e suffi ie t tidal urre t for the i stallatio of a ia le po er pla t;
the pilot is deemed unfeasible;
2. If deemed feasible, insufficient investor appetite, due to local capacity and other risks in
development and construction;
3. Delayed approval of permits and contracts etc.;
4. Low interest shown by the new provincial and municipal leadership from 2017 onward;
Risk mitigation 1. Implement regulatory updates as soon as possible while local political will is present (before
policy / regime changes occur in 2017).
2. Establish a working group to coordinate this program with other activities.
3. Train staff to manage the program.

51
Project POW1: Prepare Pre-Feasibility Study (PFS) for the generation of tidal energy (electricity) in the
Kendari Bay
The pre-feasibility study will cover:
Legal, Institutional, Technical aspects, Cost estimation, Evaluation of the existing national feed in Tariff for
renewable energy, Financial feasibility including development of an outline business case, Economic
feasibility, Initial Environmental impact scoping, modes of PPP, risk allocation, Market sounding, government
support, and public consultation.
Action Description and responsibilities Timeframe
POW1.1 Kendari Green Team, Bappeda and PLN establish a Tidal Energy Pilot
task force to liaise with National government, coordinate local
assistance in PFS development, coordinate local consultations and
surveys, and assist with market/investor sounding
2017
POW1.2 The responsible National Government agency (MEMR) allocates
funds for a PFS on the generation of electricity in the Kendari Bay,
There is the possibility to involve private renewables investors in the
PFS, and existing operators should be approached.
2017
POW1.3 MEMR selects and appoints a Consultant for the PFS 2018
POW1.4 Tidal Energy Task Force to coordinate with the Drainage and Flood
Control Project PMU on a bathymetric survey of the Bay and
development site.
2018
POW1.5 City Government allocates counterpart funds for preparing the PFS 2018
POW1.6 City Government supervises and assists the work of the Consultant
implementing the PFS
2019
POW1.7 The responsible National Government agency approves the PFS 2019
POW1.8 MEMR and local Tidal Energy Pilot task force make yes/no decision
based on pre-feasibility study, particularly with respect to Market
Sounding and potential downstream investment.
2019
POW1.9 If Yes, Pilot project preparation will include further detailed
feasibility study (costing, financial feasibility, environmental impact).
To utilise technical skills the pilot project could be implemented on a
build operate transfer mechanism with an experienced developer.
Without private sector interest and international technical capacity
the pilot project should not go ahead.
2020
Responsible agency
(PMU)
Tidal Energy Task Force and MEMR (National)
Estimated costs
(budget needs)
Preparation (design, procure): ~ Rp. 12 billion
Realization (CAPEX): to be determined based on the PFS
Maintenance & operation: to be determined based on the PFS
Implementing
mechanism,
funding & financing
Traditional procurement, Potential BOT
Other partners Kendari: Dinas Energi dan Pertambangan Office
Provincial: BLH, Provincial Government, PLN
National Government: Ministry of Energy and Mineral Resources

52
The Five Priority Programs – Finance Actions
Fiscal Capacity The Green Team concluded that there are possibilities to further increase own local income (PAD).
Possible specific actions to increase PAD that were brought up by the Green Team are:
- Introduce electronic tax collection system. This will increase collection rates, for example for
restaurant tax and entertainment tax
- Improve database for IMB (building permits) and PBB (property tax)
The Green Team intends to develop a RIAP (revenues improvement action plan) to further explore
these and other options and to formulate specific actions to achieve this.
To improve budgets available for capital expenditures, the Green Team sees opportunities to
decrease annual unused cash balances by improving procurement and planning. This could partly
free up funds for capital projects. Possible specific actions identified are:
- Advanced procurement: Kendari can start procurement procedures before the local budget
(APBD) is officially formalized. By this Kendari can avoid delays.
Green Team will discuss with high level decision makers, the possibility of attracting loans for green
actions and projects that do add value to Kendari s e o o and liveability but for which no budgets
are currently available and actions to further explore this opportunity. The city will put special
attention to its low classification (score 0,25) according to MoF Regulation no.33/PMK.07/2015 on
Map of Local Government Fiscal Capacity.
Alternative Mechanisms to attract finance Table 1 below summarizes the result of exploring the potential for applying alternative mechanisms
to priority programs. The Green Team learned that alternative mechanisms can be applied to a BOT
contract for new bulk water treatment facility, Waste to Energy and BRT. Actions aimed at further
exploring and applying these models have been incorporated in the action plans for these priority
programs.

53
Table 1 – Summary of Kendari Action Plans
Project & owner
(rows)/ financing
options (columns)
(A)
Financing
(B)
Funding
(C)
Implementing
mechanism
(D)
Financing sources
(options)
(E)
Funding sources
(options)
Human Waste
Management – PLT2
No Kendari city: sceptic
tanks
PDAM: trucks
Green Water – SPAM
(Drinking Water
Supply Distribution
Network expansion
PDAM Significant
availability
payments could
attract private
sector
investments.
Lessons learned
from ATB (Batam)
and BOT Contract
with PT Tirta
Lyonnaise Medan,
a joint venture
between The
Suez Group of
France (85%) and
PDAM Tirtanadi
(15%).
PDAM, city budgets
Tidal energy
To be
explored
To be explored To be explored
Urban Drainage &
Flood Control
tbd no APBN, APBD

City of Malang
G‘EEN CITY ACTION PLAN 0 5

1
Foreword by the Mayor
Assalamuallaikum, Wr. Wb.
The City of Malang s Green City Action Plan (GCAP) is an
initiative that serves as a roadmap towards improving the
quality of life in the city appl i g gree attri utes generally
known as green planning and design, green open space, green
building, green energy, green transportation, green waste,
green water, and green industry & commerce, all significantly
based on and supported by a green community.
The basic reason for the City of Malang to prepare a GCAP is to
help achieve development that is sustainable, fair and profitable
at the same time because we are convinced that green
development can realize economic and social equity as it will be
able to suppress and manage conflicts between economic
interests on the one side and the need for environmental
preservation on the other side.
The GCAP succinctly describes our priority programs as a reference for any citizens who want to
understand our framework for aspiring to become a Green City, including external parties interested
in participating in our Green City development.
The government of the City of Malang commits itself to continuing the process of capacity
development for greening the city through a multi-year and multi-stakeholder rolling green action
planning process led by the Green Board to stre gthe the Cit s Medium Term Development Plan
(RPJMD). The Green City Action Planing process is supported by an appropriate resource allocation
based on a Mayoral Decision.
Hopefully we will all be blessed with the help of the Almighty God in transforming the City of Malang
into a Green City. Amin.
Wassalam,
Malang, June 2016
Mochamad Anton
Walikota Malang
2
Table of Contents
Foreword by the Mayor .......................................................................................................................... 1
Table of Contents .................................................................................................................................... 2
Introduction ............................................................................................................................................. 4
What is a GCAP? ...................................................................................................................................... 4
Summary of GCAP Preparation Process .................................................................................................. 4
Green City Profile .................................................................................................................................... 8
Malang Green Urban Development Strategy until 2035 ...................................................................... 15
From Long List to Short List ................................................................................................................... 16
Priority Green Programs ........................................................................................................................ 17
Final Selection of Priority Programs ...................................................................................................... 18
Introduction ........................................................................................................................................... 20
I stitutio al E a li g A tio s for Gree Board a d PMUs ................................................................ 21
The Five Priority Programs – Action Plans ............................................................................................. 22
Green Waste – Action Plan.................................................................................................................... 24
Program: Improvement of on-site sanitation system (OSS) ............................................................. 24
(domestic waste water management service – periodical septage desludging service LLTT) .......... 24
Green Waste Action Plan ...................................................................................................................... 32
Program: Waste to Energy (WtE) Processing Plant ........................................................................... 32
Green Water – Action Plan .................................................................................................................... 40
Program: Adaptation and mitigation of climate change – Flooding and water resources
management ..................................................................................................................................... 40
Benefits .............................................................................................................................................. 40
Green Transport – Action Plan .............................................................................................................. 45
Program: Study and Policy on Public Transport & Urban Mobility ................................................... 45
The Five Priority Programs – Finance Actions ....................................................................................... 52
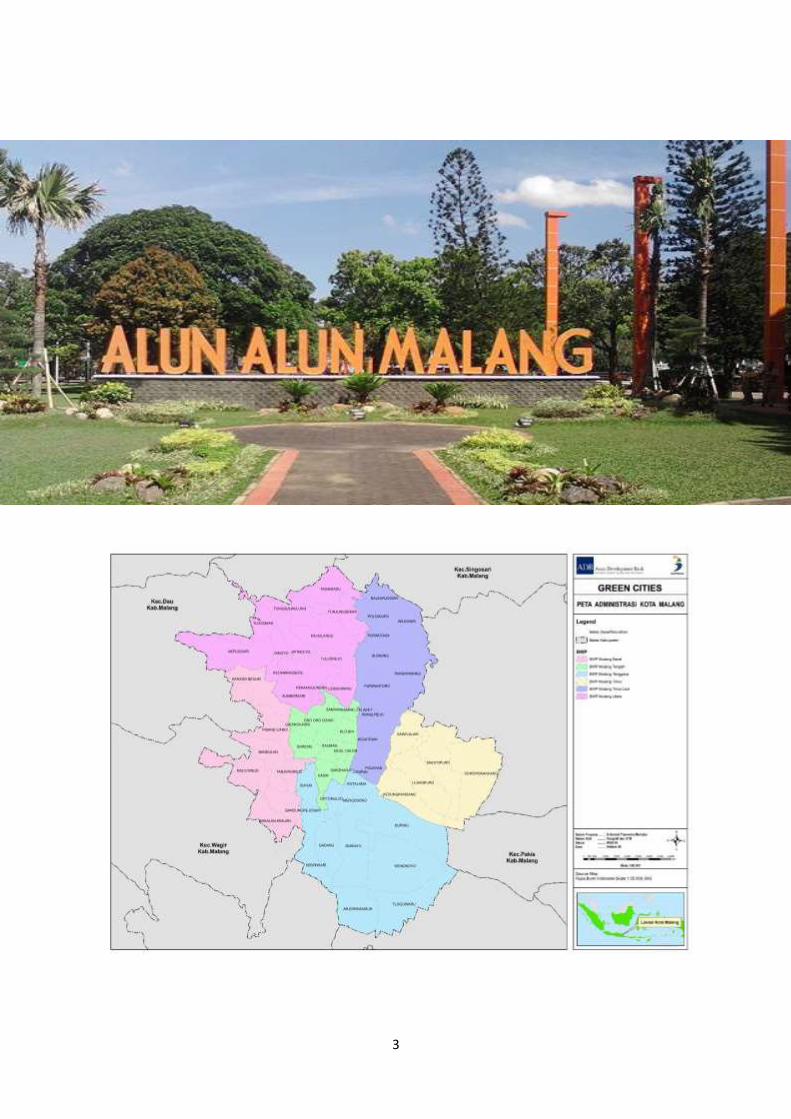
3

4
Introduction This GCAP supports the National Urban Development Policy and Strategy (NUDPS) for the period
2015-2045. The long-ter isio is to realize sustai a le a d o petiti e ities for people s
prosperity based on physical characteristics, economic advantages, and local culture by 2045. This
vision will be achieved in three phases: (i) creating a national urban system, (ii) having urban areas
meet national service standards and creating sustainable cities that are green, livable, smart and
competitive, and (iii) strengthen governance and government institutions.
In additio , the GCAP is ased o the Gree Visio of the Ma or of Malang stated below:
MALANG WILL BECOME A DIGNIFIED CITY
This vision is a broad statement, consistent with national urban development policies and strategies,
and able to accommodate a number of green development goals.
One of the pillars for implementing the NUDPS is the Green Cities Program (GCP)1 which is
implemented with the National Development Planning Board (Bappenas) as the Executing Agency,
and the Directorate General of Human Settlements in the Ministry of Public Works and Housing
(MPWH) as the Implementing Agency. The City of Malang has been participating in the GCP since
2010. It focused pri aril o i ple e tatio of three attri utes Gree Pla i g a d Desig , Gree Open Space and Green Community). With the new National Development Plan period that started in
2015, the City of Malang endeavored to scale up its GCP by promoting so e of the hea ier gree attributes such as Green Water, Green Waste, etc. by preparing a Green City Action Plan (GCAP) with
technical assistance by the ADB.2
What is a GCAP? A GCAP is a time scaled green investment plan for a city. It includes specific actions for preparing and
implementing prioritised investments over short/medium term, which covers urban management
and institutional aspects, capacity development, and financing. Where appropriate, performance
indicators are provided to enable monitoring and updating. While a tio s focus on the short to
medium term, it also provides a strategy for achieving the City of Malang s gree isio o er lo ger-
term time scales. This integrated action plan complements the City of Malang s statutory planning
process, notably the Medium Term Development Plan (RPJMD). Successful implementation of the
GCAP would allow the City of Malang to e o e a ha pio for Gree Cities i I do esia.
The GCAP uses the ter Gree as a etaphor for ities that are lea , health , safe a d e erg -
efficient so as to become liveable and sustainable. It also reflects efforts to balance the economy
and the environment with social inclusiveness.
Summary of GCAP Preparation Process In 2015, the Mayor issued a Decision (SK 188.45/95/35.73.112/2015) to create an inter-disciplinary
u i ipal Green Board (Dewan Hijau) that would become responsible for preparing the GCAP and
allo ated a udget for its operatio s. The Green Board as haired the Head of the Mu i ipal Development Planning Agency (Bappeda) and intermittently facilitiated by ADB consultants.
1 Program Pengembangan Kota Hijau (P2KH)
2 TA-8518 INO: Green Cities: A Sustainable Urban Future in Indonesia - 2 Capacity Development (46380-005)

5
To realise this Green City Action Plan, it was essential to start with a vision for green development to
guide the development of priority programs, projects, and manageable actions. The GCAP is the
result of a process of identifying city development aspirations through a gree le s to for ulate a framework for sustainable development, and subsequently narrowing it down through a process of
further analysis and selection to result in the formulation of several priority programs, which were
then developed into detailed program briefs.
The Programs that will help the City achieve its vision for green development are shown in the
Gree De elop e t “trateg 5 on page 17. Based on further considerations of
implementability including current capacity limitations, the Green Board subsequently shortened the
list to focus on five priority Programs (Waste to Energy, Public Transportation Management Study,
Non-motorized Transport (NMT), Drainage & Flood Control, and On-site Sanitation). Green Education
(Sekolah Adiwiyata) and Green Open Space/Urban Forests are included as continuous programs.
Because the GCAP is a rolling plan, programs, projects and actions may be added and modified
periodically.
The four Priority Programs were used to prepare a list of Actions in the form of a spreadsheet as
shown in The Ne t Fi e Years – Progra s, Proje ts a d A tio s .
The City of Malang s Green Board will prepare annual updates of the GCAPs as a rolling plan by
addi g e gree proje t proposals i order to gree up the it s future edium-term and annual
development plans.
To clarify the GCAP formulation process, the t o ta les elo sho the step approa h a d tool o used the Green Board to systematically prepare its GCAP. This section serves to explain
the intermediate steps and products that led to GCAP formulation.

6

7
The first (administrative) step was to establish a multi-stakeholer Green Board Ma oral Decision. The Green Board then started visioning a green future, and used the tools from the
Tool o diagram shown above to proceed from vision to aspirations and expected results.
Once the Green Board completed the SOAR (Step 2), it pro eeded to gree i g up the it s e isti g Medium Term Development Plan (RPJMD appl i g a gree le s using the Livable Cities
Framework and a Multi Criteria Analysis (MCA) to develop and prioritise programs (Step 3). The
purpose of this exercise was to identify where existing and planned infrastructure developments fell
short of achieving green objectives, and could be improved by adding components that would
increase their green development content. This process will be repeated to inform the next RPJMDs
to se sitize de isio akers a d graduall stre gthe the gree alue or gree ess of de elop e t plans. Although the Green Board was free to introduce new ideas (for example MRT for Green
Transportation, and LED street lighting for Green Energy), it opted not to do so because of other
more pressing needs that needed to be addressed first. This was a deliberate strategy because
existing plans already proposed in municipal plans should have priority.
At the same time, the Green Board started orki g o a Gree Cit Profile (Step 4) with the aim of
developing a baseline for performance measurement. The Green City Profile includes the results of
Step 2 and 3. It also includes a ‘oad ap spreadsheet for green development, an environmental
profile with thematic GIS maps used for integrated rolli g plan development, as well as an inventory
of current and planned green initiatives. The Green Board used the Roadmap to rate the it s gree performance and progress towards green development objectives as part of a rolling plan process.
The Roadmap uses generic green performance indicators that the Green Board can use to formulate
short (2015-2019), medium (2020-2034), and long-term (2035-2045) targets toward sustainable
development. The ‘oad ap s aggregate s ore for all i di ators combined can be red, yellow, or
green. By objectively rating the Roadmap using 2015 as the baseline, the Green Board concluded
that Malang s aggregate score was still in the red zo e. The section below is a summary version of
the Cit s e iro e tal profile taken from the Green City Profile including current and planned
initiatives from the Green City Profile. The full Green City Profile is attached to the GCAP.
In line with Step 5, 6, 7, the Green Board prepared a number of Project Briefs, undertook a fiscal
capacity analyisis for green infrastructure investment, and scoped options for alternative modes of
financing. As all four Programs were adopted for action, there was no need anymore for prioritizing
projects (Step 8). Step 9 has resulted in this GCAP, while Step 10 will be done to monitor
performance when the next update of the GCAP is due.
The Fiscal Analysis spreadsheet can be found in Appendix A.
The list of original Project Briefs can be found in Appendix B.
The full Green City Profile can be found in Appendix C.

8
Green City Profile The section below is a summary of the full Green
City Profile developed by the Green Board as
part of the action planning process, which is
appended to the GCAP. It is shortened here to
provide a brief introduction.
The City of Malang is the second largest city in
the province of East Java after Surabaya. It is
divided into 5 subdistricts and covers an area of
little over 110 km2, at an altitude varying
between 440 and 667 metres above sea level.
Mala g s populatio i 4 was 845,073,
growing at a rate of 0,31% annually. As
Mala g s ge eral e o o ic development
potential is promising, I do esia s Natio al
Spatial Development Plan has assigned it the
function of National Activity Centre.
Urbanization Malang has always been a green resort town for
people wanting to escape the heat of Surabaya,
ut the it s a ilit to a o odate i reasi g numbers of recreationists has come under
serious pressure. Urbanization and geography
has caused a shortage of land to build on, and a
corresponding rise in land and property prices,
which in turn has had a negative effect on
economic growth as well as environmental
preservation. It has become increasingly
diffi ult to preser e the it s gree er . For example, spaces previously reserved for water
cartchment and retention areas have
disappeared to make place for real estate. At
present, 19 water retention areas remain with a
total capacity of 20,540 m3.
Also, vehicular traffic between Surabaya and
Malang has increased rapidly over the years, and
this is compounded by the construction of a toll
road connecting the two cities. Provision of
public transport in Malang has not kept pace,
resulting in traffic jams, especially in its
downtown narrow and winding roads during the
weekend.
Climate Change Average temperature in Malang is 22-25o C.
Climate change is primarily driven by
greenhouse emissions resulting from population
growth and economic development. The profile
of Malang is based on the scenario used by the
World Bank Climate Research Program. The
regional projection from this database is based
on result of nine global climate models that have
statistically been regionalized for areas of
around 50x50 km (2,500 km2).
The Indonesia Climate Change Projection Portal
Sumber:
http://climatewizard.ciat.cgiar.org/outputs1/Indonesia_annual/
The climate change pattern predicted for
Indonesia shows increased variability and
seriousness of change, as well as increased
likelihood of extreme events in the coming
decades including heat waves, dry spells, intense
rainfall, etc. This projection is consistent with
the South East Asia Climate Change Study (ADB
2009a). The World Bank database also
reinforces an assessment by the UNDP in
Indonesia. 3
As explained in the National Climate Change
Adaptation Action Plan (RAN-API), seawater
le el rises “L‘ o stitutes I do esia s ai threat because of its large number of coastal
settlements. In 2050, SLR in Indonesia could
reach 175 cm in the year 2100 (Bappenas,
2010b). SLR will not affect Malang, but
increases in rainfall will a.o. overburden the
drainage and flood control infrastructure, make
supply of clean water in the Greater Malang
area vulnerable to shortages, and lead to
increased traffic congestion.
3 Karmalkar, A., et al. n.d. UNDP Climate Change
Profiles: Indonesia. Retrieved from http://country-
profiles.geog.ox.ac.uk.

9
The City has initiated an action plan for Climate
Change Mitigation and Adaptation, even though
the scale of activities implemented by the
Environmental Agency (BLH) is still limited. The
National Agency for Regional Disaster
Prevention (BNPB) has introduced a Disaster
Reduction and Management Program for the
it s Disaster Ma age e t Age BPBD to help the City prevent and respond to emergency
disasters. These activities are still being
developed.
Spatial Development
Mala g s spatial de elop e t is problematic
because the city is surrounded by steep hills on
the north, east and west side, which in fact only
leaves the south side open to expansion.
Green Open Space (RTH) “i e the egi i g of I do esia s Gree Cities Program (P2KH), Malang has been a
demonstration town for green open space
management, a ed Gree Cit Best Pra ti e , as ell as o e of I do esia s Gree Pio eer Cities . It features revitalisation of public parks,
community participation, and partnerships with
the private sector.
Current data on green open space show that
Malang has 33 ha of forest, 183 ha of public
parks, 58 ha of open fields, 183 ha of
graveyards, and 218 ha of road separators.
Remaining open space consists of riversides that
cover around 1,170 ha. This corresponds with
approximately 15.9% of total city area.
Green open spa e is part of the Cit s “patial Development Plan until 2030, although there is
constant pressure on available green open space
that is needed for environmental protection.
Malang has ambitious plans to increase RTH to
30% by developing more public and private
spaces, heritage sites, and increasing the
number and size of road separators. It also
wants to convert some forest areas to public
parks.
According to Law No. 26 year 2007 on Spatial
Planning, ideally open space in Malang City (with
5 sub-districts, total area 11,000 ha) shall be
30% of the total area or equal to 3,300 ha
consisting of 20% public open space (2,200 ha)
and 10% private open space (1,100 ha).
According to the Ministry of Public Works
Regulation No. 5/PRT/2008, the City shall
provide an open space of 250m2 at
neighbourhood level (RT) (= 1 m2/capita), 1,250
m2 at community level (RW) (= 0.5 m2/capita),
9,000 m2 at village level (Kelurahan) (= 0.3
m2/capita) and 24,000 m2 at sub-district level
(Kecamatan) (= 0.2 m2/capita). However, this
standard is difficult to apply in practice.
The overall target of the Malang Green
Community is to achieve 30% green open space
(20% public and 10% Private). Presently its
primary concern is to ensure that green open
area is not further reduced. It advocates for
making good use of the open space for a
number of social and small economic activities
to reduce the chances for a possible change of
function.
Green Energy The primary sources of energy are electrical
power, liquid propane gas (LPG), oil-based fuel
(BBM), and biomass. At present, Malang has
663,500 registered electricity users with a total
annual consumption of 1,211,053,438 KWH.
The City does not yet have a formal policy or
regulation to increase energy efficiency, but
several initiatives are underway. Solar panels
are being used to operate street lights including
automatic brightness controllers on main
intersections, gradual replacement of light bulbs
with efficient ones, and collection of methane
gas (CH4) in the final waste disposal site (TPA) in
Supit Urang to be used as a source of electric
power and fuel for more than 500 house
connections in the neighborhood. Early 2016,
Supit Urang started using the gas to fire a
Waste-to-Energy (WTE) plant that delivers 10
KVA (KW) that is used for offices and a blower by
day, and lighting of the TPA and public park by
night.
As centralized energy supply currently is beyond
municipal authority and its statutory
development planning process, this GCAP only
proposes installing a larger WTE plant to provide
greener energy and reduce consumption. Other

10
actions will be proposed for the next phase of
the GCAP.
Baseline Installed
Capacity (MW)
% Supply Ability
2015 1.753,1, MW 1.284,6 MW (73%)
2020 TBD TBD
Source: PLN Business Plan 2015-2024
Green Water: Drinking Water Supply Malang obtains is clean water primarily from 3
main wells that only require chlorine treatment
to meet quality standards. Together they
contribute around 67% of total production. Two
other ells lo ated i Batu outside the Cit s municipal boundaries) provide around 18%.
Another 5% is contributed by some minor other
wells.
According to the municipal water enterprise
PDAM, service coverage in Malang exceeds
national standards. In 2013, piped water
production reached 40 milion m3 (MCM) or
, 7 lps, suppl i g arou d 9 % of the it s 753,000 inhabitants with 126,382 registered
connections. NRW stood at 21%, resulting in an
average per capita amount of 110 litres per day
at a basic rate of IDR 2,00 per m3.
At prese t PDAM s i stalled apa it is 1,660 lps
or 52.7 MCM, mainly as a result of improved
pumping capacity. As a result of improved
metering, asset management, eradication of
illegal connections, and repair of pipe leakages,
PDAM is expect to reach 16% NRW by the end of
2016.
A number of small private producers of well
water operate in Malang, organized in a
cooperative (HIPPAMS). Together they supply
around 1% of total need. Also, two private
companies taking water from wells supply
around 5 % of total need. In addition, around
467 households have their own well. Total
production is estimated at 160 lps. The price of
this groundwater is competitive, but PDAM is
concerned about contamination of the wells.
In conclusion, it can e said that Malang’s water
supply already qualifies as Green .
However, anticipating possible future shortages
resulting from the effects of climate change and
increased urbanization, it has been proposed to
start taking water (by 2020) from the rather
polluted Brantas river that crosses the City,
despite the high cost of treatment.
Baseline Production
Capacity
% of Population
Served
2015 5.700 lps 70%
2020 TBD TBD
Source: PDAM Business Plan 2015-2019
Green Water: Drainage & Flood
Control Natural waterways crossing the City (Brantas
river, Amporong river, Bango river, Metro river
and Sukun river) would appear to provide
sufficient outlets for rainwater. In reality,
however, their combined capacity has been
significantly reduced by factors such as
insufficient dredging, cleaning, sedimentation,
and illegal constructions. The number of natural
and artificial water reservoirs has also declined
over the years. Old drains (especially in Ijen and
the City centre) are closed but prone to
sedimentation, while the open ones are
regularly being used for dumping household
waste (especially in Klojen and Sawojajar).
Uncollected waste that finds its way into drains
causes clogging and flooding. In Lowokwaru and
Purwantoro, the drainage system cannot handle
rainfall anymore and creates floods up to 50 cm
deep. Drains and walkways along main streets
are also damaged by the roots of old trees, and
the only solution would be to remove the trees.
The situation is bound to worsen in the coming
decades.
The GCAP, therefore, proposes a program for
improving urban drainage and flood control in
Malang.
Green Solid Waste Since 2011, Malang manages waste based on
the 3R principle (reduce, reuse, recycle). It does,
ho e er, ot et appl the th ‘ refusi g the poduction or use of materials that become
waste, such as plastic bags.
A ooperati e a ed The Yello Troops because of their yellow uniforms collect waste
using motorized carts and take it to the 70

11
temporary disposal sites (TPS) spread out over
the City. The Sanitation Department (DKP)
operates over 30 trucks to transport waste from
the PFS to the TPA. There the waste is sorted
for recycling. The municipal government
manages its own innovative Malang Waste Bank
(BSM) system. It classifies waste into 70 types.
Individual customers take their waste to the
BSM, but organized groups can have their waste
collected by the BSM without charge.
Customers have no administration costs to pay,
and can take their money right away, or create
an interest-bearing account. The sorted waste is
sold to private companies that have an
agreement and/or implement a CSR program
with the BSM. The total number of customers in
2016 is estimated at 20,000.
It is estimated that the BSM reduces the amount
of waste to be transported to the TPA by 2
tonnes out of 450 tonnes/day. Even though this
amounts to less than 0.5%, it is an important
change in mindset, and the system is catching
on.
Also, twelve composting locations have been
created, one of them near the TPA. The finished
compost is distributed to local communities, but
is not yet viable as a commercial product.
The controlled landfill TPA in Supit Urang
currently covers 15 ha. Its capacity will be fully
used up in the coming years, and the City has
plans to expand the site to 25 ha of sanitary
landfill with external assistance. It is expected
that the expanded facility will not only serve
Malang, but also the City of Batu and other
nearby towns. The new facility is expected to
produce 725 tonnes per day by 2020, which
makes a WTE plant feasible. The advantages will
include the production of electricity, reduction
of the area of the TPA, and safe disposal of
noxious methane.
Supit Urang harvests methane gas from the
controlled landfill that provides energy to
around 400 households. Most of them belong
to the group of around 300 scavengers that
inhabit the area.
The GCAP includes a proposal for a WTE plant
that is needed for the operation of the
expanded TPA.
Baseline
Tons of
Waste
Installed
Waste management
Capacity
% of SW
treated
2015 TPA Terjun (14 ha)
1,400 tons/day
Open
dumping
2020 TBD TBD
Source: DKP Malang City (2015)
Green Human Waste In 2008, there were 114,624 households (or
97.6% of the total) that used latrines, but only
75% of those met safety standards (including a
water lock, septic tank, and infiltration wells,
sumur resapan). The existing centralized
sewerage system that was built several decades
ago only serves 3% of the population. In slum
areas along the rivers, people defecate directly
into the river, or have pit latrines that do the
same. Some urban villages (Mergosono,
Ciptomulyo, Tlogomas) use communal septic
tanks.
Many septic tanks are poorly designed and
maintained, resulting in overflowing and leaking.
Mu h of I do esia s ur a grou d ater pollution is caused by defective on-site
sanitation.
In 2012, 67% of households had a septic tank
with periodical desludging service (LLTT) by the
Sanitation Department (DKP), while 5.5% had
access to communal septic tanks. The City
wants to increase both rates. Every day around
5 m3 of sludge is transported to the treatment
facility (IPLT) in Supit Urang, but no data are
available whether the capacity of the IPLT is
sufficient.
The GCAP includes a proposal to increase the
capacity of on-and-offsite sanitation.
Green Buildings Green buildings have not yet become an
important attribute for green development in
Malang, but that is likely to change in the future
because of its potentially significant contribution
to saving energy (see section on Green Energy)
and other resources such as water, as well as
improving environmental health, thus providing
a safer, environmentally friendly, and more
productive environment. Initially, public
buildings can acquire green certification

12
provided by third parties to help make the
concept familier. In the future, certification
should become a prerequisite for issuing
building permits for any type of construction.
The province of DKI Jakarta has issued the
Governor Regulation No. 38 Year 2012 on The
Green Buildings that can be used as an example
for Malang City. So far, Malang City has no
Green Building regulations.
Green Transportation The total length of City roads is 191 km. In 2013,
there were 487,187 registered vehicles in town,
95% of which were privately owned. The largest
group consists of motorbikes, with a total of
392,559 units, or 80% of the total number of
vehicles. It is estimated that around 200
additional motorbikes hit the road each day.
One of the reasons for this is the large number
of students in Malang that use motorbikes as
their preferred means of transport to reach the
38 universities. They are a prime source of
traffic jams during peak hours.
As mentioned before, the large number of
people from Surabaya that likes to spend the
weekend in Malang creates additional
bottlenecks, especially in the Blimbing area.
Since 2007, Malang has installed 15 automatic
traffic control systems (ACTS) on main roads
that use CCTV cameras. Eleven of those already
use solar panels for energy supply.
The City has issued 2,216 permits to minibus
operators in recent years, even though only
1,600 units are on the road, as most operate at a
loss because of the steadily growing number of
private vehicles. The Transport Department
(DisHub) believes that a BRT system with large
buses is not feasible in Malang because of its
many narrow winding roads.
To overcome traffic congestion and related
problems of pollution, public health, road safety
and security, Malang in 2016 will start preparing
for conversion to public transport that is
environmentally friendly. Therefore, the GCAP
proposes a program to create an alternative
mass transportation system that is based on
minibuses, pedestrian walkways and bicyle
paths, and has the potential to wean people
away from private modes of transportation.
Mala g s detailed spatial de elop ent plan
(RDTRK 2015-2035) already specifies a network
of joined pedestrian and bicycle paths that
connect to key locations for a total of more than
93 km. As a pilot project, a road near the airport
has been provided with separate lanes using
concrete separators to give bicycles, motorbikes
and becak operators their own lane. This is
expected to make traffic considerably safer.
Green Community Malang s Gree Community was established in
2011 i li e ith the Go er e t s Gree Cit Program (P2KH). Its Forum undertook a series of
promotional actvities that were packaged under
the theme of Green Festival. It stimulated 30
green communities to participate in green
planning and design, and to create green open
spaces in their communities. Public parks with a
total area of 23,970 m2 are being revitalized
using CSR funds from The Bank Rakyat Indonesia
(BRI). Several other initiatives promoting
resilient communities are ongoing including
PROKLIM and Sekolah Adiwiyata.
Resources The City of Malang currently does not have all
human, financial, institutional, regulatory, and
other resources needed to simultaneously
address all of its green development problems,
but hopes that this GCAP will adequately
address some of the urgent issues that hamper
sustainable development. The main resource
issues are summarized below.
FISCAL RESOURCES
Malang is still highly dependent on high level
government transfers to their cities budgets.
63% of total budgets came from transfers
between 2011 and 2014. Malang spends only
little over 20% of the budgets available for
capital investments.
Currently Malang s earl udgets are ot enough to finance the preparation of green
capital projects such as BRT dedicated busway
infrastructure, Waste to Energy and others. For
illustration, Malang s udget a aila le for apital expenditures in 2014 was 784 billion Rupiah
(~60 million USD). Little over 8% of these
budgets were allocated to transportation (64,2

13
billion Rupiah or ~ 4.9 million USD). Estimated
CAPEX for the first phase of BRT is estimated to
be Rupiah 668 billion (~51 million USD) or 85%
of CAPEX available in 2014. In other words,
Malang would need to spend 10 times its
allocated budget for 2014 to realize the BRT.
As part of this GCAP Malang has looked into
ways to improve this situation by:
Increasing own local revenue
Attracting loans (municipal lending)
Use available funds more efficient towards
green capital projects
Attracting alternative sources of finance to
projects, for example by setting-up Joint
Ventures with the private sector, BOT
contracts, involving communities through
cooperatives, etc.
INSTITUTIONAL RESOURCES
Related to attracting alternative sources of
finance Malang has experience with specific
proje ts ater suppl , earl s ut did ot yet use this experience to further expand the
gained knowledge and experience, for example
by setting-up a dedicated unit to advise city
sector departments on opportunities and ways
to apply such mechanisms. While the knowledge
and experience in Malang is considerably higher
than in many other cities, Malang faces the
danger of losing this experience over time after
preparation of specific projects has been
completed.
REGULATORY RESOURCES
Malang still needs regulations that will allow it
to effectively implement and enforce the
environmental issues it wants to address, such
as regulations on water management, transport
management, and waste management. These
will be part of the GCAP.
Conclusion Based on the City Profile, as well as agreed
priorities based on the existing situation and
capabilities, the City of Malang has defined
actions related to prioritised programs and more
generic actions focusing on the short term to
make these programs and projects more
achievable. In the GCAP, actions are formulated
to help improve fiscal and institutional capacity,
create more durable partnerships, strengthen
the regulatory framework and ability to finance
projects, and potentially increase impact of such
projects.
The Profile signals that water supply, sanitation,
transport and waste management are the key
focus areas for the City at the moment and
justifies selection of these programs. In parallel,
Malang should prioritize increasing the budgets
they have available for green capital
expenditures and improve their institutional
capacity and ability (human resources) to
prepare projects so that they can be offered to
involve the private sector and others (such as
national government programs and
development banks) to finance. This will be
further addressed in the next sections of this
GCAP.

14
Green City Development Strategy to 2035
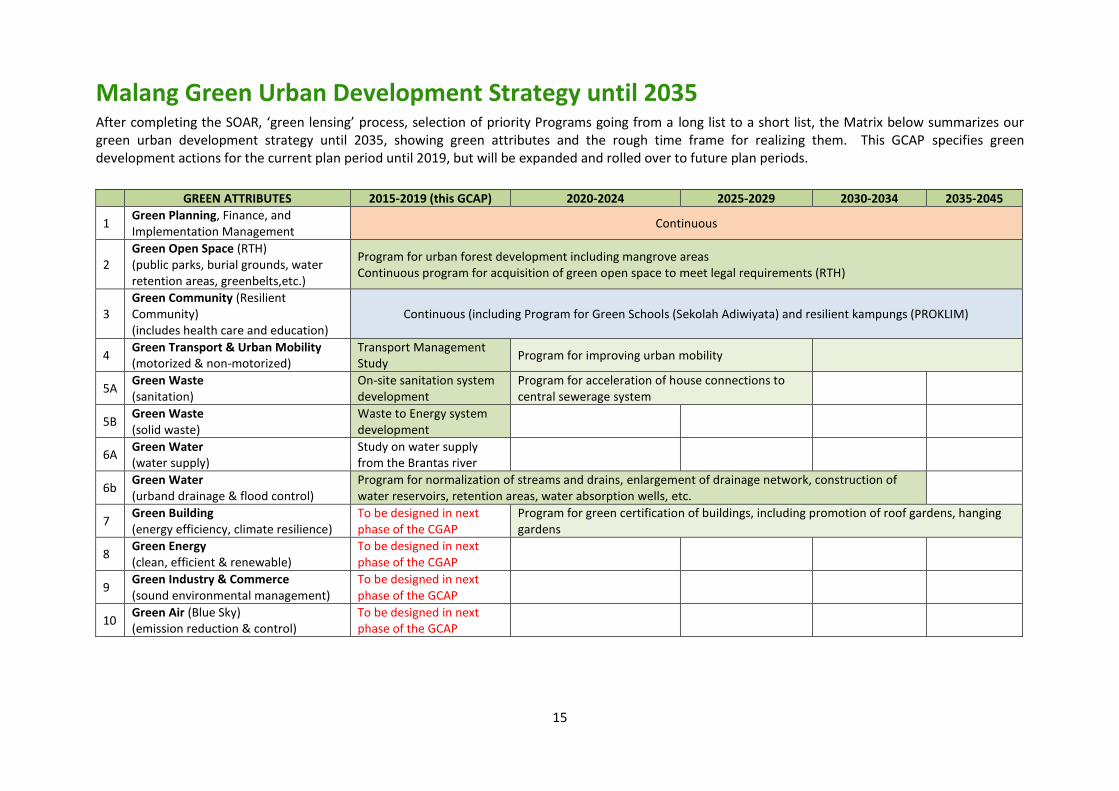
15
Malang Green Urban Development Strategy until 2035 After o pleti g the “OA‘, gree le si g pro ess, sele tio of priorit Progra s goi g fro a long list to a short list, the Matrix below summarizes our
green urban development strategy until 2035, showing green attributes and the rough time frame for realizing them. This GCAP specifies green
development actions for the current plan period until 2019, but will be expanded and rolled over to future plan periods.
GREEN ATTRIBUTES 2015-2019 (this GCAP) 2020-2024 2025-2029 2030-2034 2035-2045
1 Green Planning, Finance, and
Implementation Management Continuous
2
Green Open Space (RTH)
(public parks, burial grounds, water
retention areas, greenbelts,etc.)
Program for urban forest development including mangrove areas
Continuous program for acquisition of green open space to meet legal requirements (RTH)
3
Green Community (Resilient
Community)
(includes health care and education)
Continuous (including Program for Green Schools (Sekolah Adiwiyata) and resilient kampungs (PROKLIM)
4 Green Transport & Urban Mobility
(motorized & non-motorized)
Transport Management
Study Program for improving urban mobility
5A Green Waste
(sanitation)
On-site sanitation system
development
Program for acceleration of house connections to
central sewerage system
5B Green Waste
(solid waste)
Waste to Energy system
development
6A Green Water
(water supply)
Study on water supply
from the Brantas river
6b Green Water
(urband drainage & flood control)
Program for normalization of streams and drains, enlargement of drainage network, construction of
water reservoirs, retention areas, water absorption wells, etc.
7 Green Building
(energy efficiency, climate resilience)
To be designed in next
phase of the CGAP
Program for green certification of buildings, including promotion of roof gardens, hanging
gardens
8 Green Energy
(clean, efficient & renewable)
To be designed in next
phase of the CGAP
9 Green Industry & Commerce
(sound environmental management)
To be designed in next
phase of the GCAP
10 Green Air (Blue Sky)
(emission reduction & control)
To be designed in next
phase of the GCAP
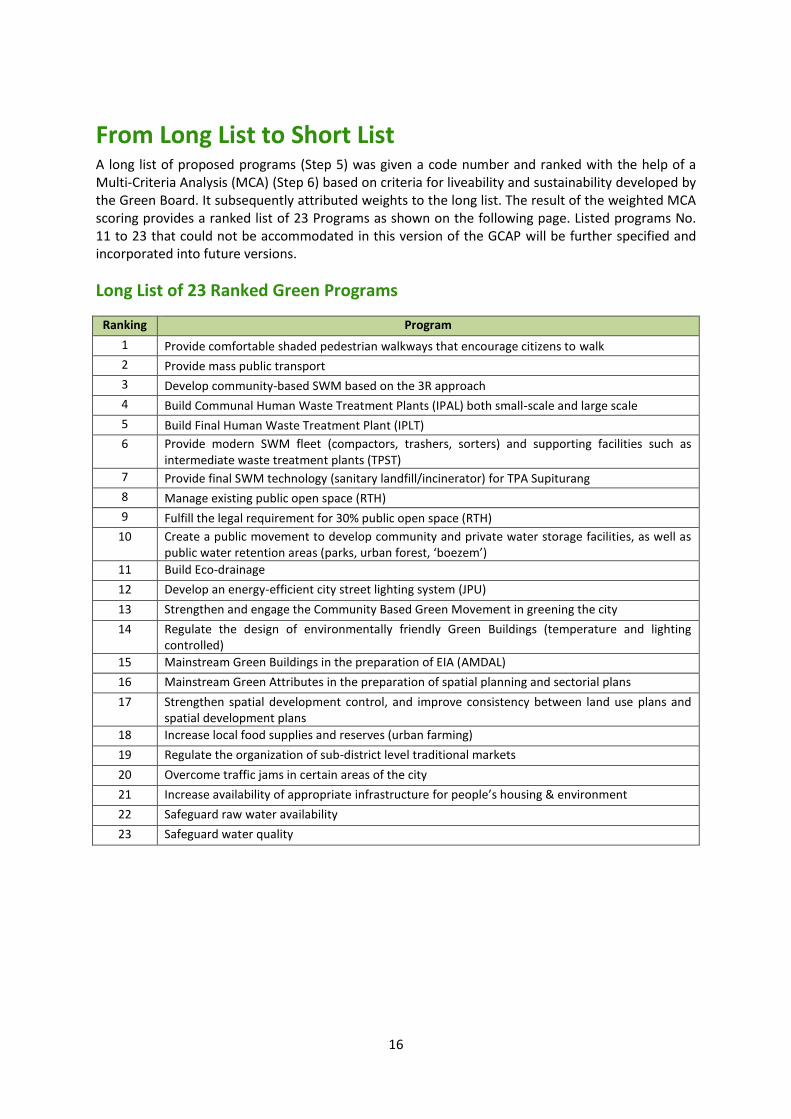
16
From Long List to Short List A long list of proposed programs (Step 5) was given a code number and ranked with the help of a
Multi-Criteria Analysis (MCA) (Step 6) based on criteria for liveability and sustainability developed by
the Green Board. It subsequently attributed weights to the long list. The result of the weighted MCA
scoring provides a ranked list of 23 Programs as shown on the following page. Listed programs No.
11 to 23 that could not be accommodated in this version of the GCAP will be further specified and
incorporated into future versions.
Long List of 23 Ranked Green Programs
Ranking Program
1 Provide comfortable shaded pedestrian walkways that encourage citizens to walk
2 Provide mass public transport
3 Develop community-based SWM based on the 3R approach
4 Build Communal Human Waste Treatment Plants (IPAL) both small-scale and large scale
5 Build Final Human Waste Treatment Plant (IPLT)
6 Provide modern SWM fleet (compactors, trashers, sorters) and supporting facilities such as
intermediate waste treatment plants (TPST)
7 Provide final SWM technology (sanitary landfill/incinerator) for TPA Supiturang
8 Manage existing public open space (RTH)
9 Fulfill the legal requirement for 30% public open space (RTH)
10 Create a public movement to develop community and private water storage facilities, as well as
pu li ater rete tio areas parks, ur a forest, oeze
11 Build Eco-drainage
12 Develop an energy-efficient city street lighting system (JPU)
13 Strengthen and engage the Community Based Green Movement in greening the city
14 Regulate the design of environmentally friendly Green Buildings (temperature and lighting
controlled)
15 Mainstream Green Buildings in the preparation of EIA (AMDAL)
16 Mainstream Green Attributes in the preparation of spatial planning and sectorial plans
17 Strengthen spatial development control, and improve consistency between land use plans and
spatial development plans
18 Increase local food supplies and reserves (urban farming)
19 Regulate the organization of sub-district level traditional markets
20 Overcome traffic jams in certain areas of the city
21 Increase availability of appropriate i frastru ture for people s housi g & e iro e t
22 Safeguard raw water availability
23 Safeguard water quality

17
Priority Green Programs
From the above long list, the top ten priority Programs were selected based on their strategic
importance to green development (Step 6).
Ranking Program
1 Provide comfortable shaded pedestrian walkways that encourage citizens to walk
2 Provide mass public transport
3 Develop community-based SWM based on the 3R approach
4 Build Communal Human Waste Treatment Plants (IPAL) both small-scale and large scale
5 Build Final Human Waste Treatment Plant (IPLT)
6 Provide modern SWM fleet (compactors, trashers, sorters) and supporting facilities such as
intermediate waste treatment plants (TPST)
7 Provide final SWM technology (sanitary landfill/incinerator) for TPA Supiturang
8 Manage existing public open space (RTH)
9 Fulfill the legal requirement for 30% public open space (RTH)
10 Create a public movement to develop community and private water storage facilities, as well as
public water retention areas (parks, ur a forest, oeze

18
Final Selection of Priority Programs
After selecting the 10 priority Programs, the Green Board (Dewan Hijau) reported the result to the
GCAP Steering Committee including the Heads of all local government agencies (SKPD) involved
(Kepala Bappeda, Dinas Kebersihan, Dinas Perumahan dan Permukiman, Dinas Pekerjaan Umum,
Dinas Tata Ruang and Tata Bangunan, Badan Lingkungan Hidup, the Direksi PDAM Tirtanadi), and
finally had a consultation with the Regional Secretary (Sekda Kota Malang) as the representative of
the Mayor.
After final consideration of financial, regulatory and institutional risks for implementing each project
and the interfaces and possible synergies between projects, it was concluded that the four Programs
listed below were the most likely to be supported with clear and realistic actions, and therefore
should constitute the GCAP. During its workshop from 11-17 March 2016, the Green Board made
some adjustments to the nomenclature of the priority programs without affecting their substance
and agreed on the five programs listed below.
KOTA MALANG: 5 PRIORITY PROGRAMS
Ranking Program
1 On-site Sanitation: Scheduled Desludging Services (LLTT)
2 Waste-to-Energy conversion
3 Urban Drainage & Flood Control System (for adaptation and mitigation of climate change)
4 Study and Policy on Transportation Management
5 Development of Non-Motorized Transport (NMT) network

19
The Next Five Years – Priority Programs, Projects &
Actions

20
Introduction This section describes the prioritized programs, projects and actions we will undertake in the next
five years. It also describes the institutional set-up we will implement to ensure informed and timely
decision making and careful management of the interfaces between different projects. To avoid
misunderstandings, we include a short list of definitions of key terms used in this section.
Program A i itiati e for pro oti g gree de elop e t ha i g stated goals that at h the it s vision and
mission. A program normally comprises a number of related and mutually dependent projects, and is
formulated in a Program Brief or Digest.
Project Investment in a physical infrastructure project, or the creation of a new organization, or a policy
revision, or a local regulation, to be formulated in a Project Brief. If the project (such as establishing
a new body or policy) is subsidiary to another project, it is understood to be a sub-project or action.
Action In the context of the GCAP, actions comprise one or more activities required to meet the conditions
for project implementation, such as setting up a Project Management Unit (PMU), preparing a
project implementation plan (PIP), preparing Terms of Reference, identifying sources of financing,
acquiring land, etc.
Project Management Unit (PMU) A temporary organizational unit created for the purpose of preparing a project implementation plan,
and managing the project on a day to day basis. A PMU is headed by the agency responsible for the
project. An operational budget for the PMU needs to be allocated. Representatives of relevant
SKPDs, other agencies and possibly representatives of the community can also be members of the
PMU. The PMU will consider whether or not alternative implementing mechanisms (BOT, Joint
venture, CSR, etc.) will be considered in the feasibility study, but also the actions related to changing
or implementing regulations (Perda), issuing permits, etc.
Project Implementation Plan (PIP) A document that describes in detail the actions needed for implementing the project, including
preparatory activities. The PMU should be in charge of preparing and managing it. It covers the
project cycle -a sequence of events and activities usually starting with a feasibility study, project
design, financing, land acquisition, tendering, procurement, construction supervision, monitoring
and evaluation, as well as operation and maintenance. It clearly describes the division of
responsibilities, timeline and budgets needed. It specifies what decisions are needed, when, and by
whom. A project is normally undertaken by a contractor, government department, a combination of
public and private actors, a consortium, etc. Different actors can be responsible for different parts
of the project cycle. The PMU will update the PIP over the course of developing the project. At the
start, the PIP will focus on the activities to prepare a detailed design, feasibility study and tender
strategy. Based on the choices made related to the implementing mechanisms (traditional, PPP, joint
venture, communities, etc.), the PIP can be further detailed for procurement, construction and
O&M.

21
Institutional Ena ling A tions for Green Board and PMUs The Green Board will use the results of the Green Cities Program (Asian Development Bank,
Bappenas, Kementerian PUPR) as a starting point to further intensify our efforts to transform Malang
into the greenest city in Indonesia. On top of the specific actions we have formulated for prioritized
programs and projects, we intend to further improve the institutional set-up needed for a well-
informed and timely decision making process.
A Steering Committee (SC) will monitor and guide the progress on GCAP and actions on a quarterly
basis. The Mayor will chair the SC that further consists of heads of SKPDs in the field of green
attri utes, a d other stakeholders. As hair of the Gree Board , the head of Bappeda will keep
the Mayor informed about the progress to enable the Mayor to make decisions when needed.
The Green Board will coordinate programs and projects and the interfaces between programs and
projects. They will also update the GCAP every 2 years. The Green Board will meet bi-weekly to
monitor progress on specific projects and actions. Those in charge of specific programs and projects
will inform the Green Board about their progress and specific issues, decisions or guidance they
need. The Green Board will determine the agenda for meetings with the SC and prepare these
meetings. Specific taskforces (PMU) will be set-up to drive the implementation of programs and
projects on a day to day basis. The taskforces will be made up of representatives of relevant SKPDs
and other agencies and led by the agency/ body responsible for the sector.
Institutional Enabling Actions What? Who? When?
Mayoral Decree on set-up a d i stallatio of “C a d Gree Board i l. des riptio of roles, “OP, membership and
budgets
Mayor Update in 2106
Co ti uatio of Ma or s de ree i ludi g udget allo atio Head of Bappeda annually
Work-pla Gree Board i ludi g i itiati g the set-up of
specific taskforces/ PMUs for agreed projects
Gree Board as and when
required
E aluatio of perfor a e of Gree Board Steering Committee bi-yearly
Steering
Committee
Gree Board
Taskforce / PMU
– Waste
Taskforce / PMU
– Water
Taskforce / PMU
– Green taxes
Monitoring
/ guidance
Progress/
reporting
Taskforce GCAP
Mayor Informs / key
decisions
Monitoring/ guidance Progress/ reporting

22
The Five Priority Programs – Action Plans The Action Plans that were included in the GCAP are shown on the following pages.

23
Green Waste – Action Plan
Program: Improvement of on-site sanitation system (OSS)

24
Green Waste – Action Plan
Program: Improvement of on-site sanitation system (OSS)
(domestic waste water management service – periodical septage desludging
service LLTT)
Why? To improve groundwater quality, environmental impact of our city, and improve public health, this
program is prposed to Government policy requires 100% sanitation coverage by the year 2020. The
direct relationship between diseases such as cholera, hepatitis and dysentery and the unrestricted
discharge of residential sewage is well documented.
Current status It is estimated that currently Malang has and estimated 120,000 septic tanks for domestic
wastewater treatment covering 63% of the population of over 898,000 citizens (2016).
Currently, there is no effective regulation in place to ensure that septic tanks are properly
constructed in sufficient numbers, that sludge (or septage) is removed (pumped) at regular intervals,
and that the operation of tankers for septage pumping is well managed. Therefore, the City
Government of Malang has decided to enact a regional regulation to enforce proper installation and
maintenance of septic tanks and define the tariffs for pumping. PDAM in Malang has the capacity to
continue to operate septage pumping programme and will coordinate a project management unit to
implement this programme.
DKP are currently intensively campaigning about domestic wastewater treatment, and this needs to
be maintained as it is clear our residents to not fully understand the benefits of imporved sanitation.
Households in dense neighbourhoods, where there is t suffi ie t spa e for septi ta ks are connected to 6 communal wate wate treatment facilities (serving approximately 150 households
each), which are operating effectively through community based organisations (with DKP guidance).
These plants require desludging every 10 years).
Goal This program aims to improve the City wide system for management of on-site sanitation in
response to an urgent need for improved sanitation. An increased number of on-site septic tanks
and communal waste water treatment plants is needed to provide access to all citizens. In addition,
a regular desludging service needs to be made available to empty septic tanks.
To achieve this, the community has to be persuaded to install new septic tanks, and repair or replace
unsafe septic tanks to meet national health standards (Standar Nasional Indonesia -SNI) through
advocacy and regulations concerning on-site sanitation management.
As an initial step, the municipality of Malang will build septic tanks that meet SNI standards in public
municipal buildings in Malang as well as in low-income communities (Masyarakat Berpenghasilan
Rendah -MBR) installing 36,000 units over the next 3 years.
By 2020 PDAM will provide regular services to desludge human waste (septage) from all individual
septic tanks and communcal.

25
Results 1. Provision of 36,000 impermeable septic tanks in 3 years
2. PDAM organization strengthened (i.e. Directorate of Wastewater) to implement regular
desludging management system for the entire City
3. Educated population of Malang through social media to use, and pay for, the septage
desludging services
4. 15 new communal wastewater treatment plants.
5. A new septage treatment facility to receive pumped septage
6. Regulatory and management oversight for septic tank design, construction, and use of septic
tanks as well as septage transportation, treatment and disposal
Benefits 1. Contributes to improved human health
2. Reduces ecological hazards
3. Provides an efficient and reliable public service for low-income communities
Success indicators (targets)
Availability of impermeable septic tanks
2015 63%
2020 100%
Communal WWTP
2015 6
2020 21
Key risks Even though the projects are relatively well defined, the technology is straightforward, and the
capacity is there to deliver them, key risks are:
1. Delayed approval of the regulation and law governing off site sanitation
2. Shortage of trained human resources
3. Low interest of the community on aspects of septic tank sanitation.
Risk mitigation These risks can be mitigated to the extent possible by prioritizing the following measures and
allocating sufficient resources to their implementation:
1. Implement regulatory updates as soon as possible while local political will is present
2. Establish strong PMU to coordinate implementation and share relavant knowledge
3. Undertake a social marketing strategy to engage citizens in environmental aspects of
sanitation and disseminate information.

26
Project SAN1: Provision of improved on site sanitation services for Malang
In less densely populated area, septic tanks will remain the most effective way of providing sanitation services
to the majority of our residents. A coordinated program is required to improve efficiency of management of
the City wide sanitation system, enact a suitable regional regulation, install septic tanks, increase the number
of septage pumping customers, and set reasonable tariffs, and improve the sustainability of the system.
Action Description and responsibilities Timeframe
SAN1.1 Establish a PMU led by PDAM including DKP, Bappeda, Housing
Agency for coordinating and implementing the actions defined
below.
2016
SAN1.2 Prepare project and sub-project implementation plans and
timeframes, allocate and approve budgets.
2016
SAN1.3 Bappeda and Regional government draft and adopt, a local
regulatio Perda detaili g Mala g it s “eptage Ma age e t System. The regulation will state the rationale, user fees, operation,
management (roles and responsibilities), and penalties.
2017
SAN1.4 Councillors approve local regulation 2017
SAN1.5 Establish a Memorandum of Agreement between the City and PDAM
that future septage pumping (collection) and management will be
undertaken by PDAM.
2017
SAN1.6 PDAM will establish an internal operation unit to manage and
conduct septage collection (every 2 years) and disposal
2017
SAN1.7 PDAM to develop and implement an online application and
scheduling system for septic tank pumping custimers.
2017-18
SAN1.8 PDAM to aquire 2 septage pumping trucks through APBN budget 2017
SAN1.9 PDAM will prepare and approve standard operational procedures
(SOP) in PDAM for septage management.
2018
SAN1.10 PDAM will coordinate with the City government to review and set
tariffs (including for adjoining municipalities) and establish a system
to recover operational costs from user fees (septage pumping).
2018
SAN1.11 The PMU works with DKP, the department of health, and community
based organisations to coordinate a social marketing and public
awareness campaign with PDAM to raise awareness of the benefits
of improved sanitation, ensure public acceptability of regulations and
tariffs, and ease project implementation.
2018
SAN1.12 PDAM will consider utilising private sector companies to provide
efficient septage collection and transport services.
2019
Responsible agency PDAM
Estimated costs
(budget needs)
Preparation (design): Rp. 5 billion
Implementing
mechanism, funding
& financing
Traditional procurement
Funding by ABPD and ABPN (trucks)
Other partners Malang: DKP, Bappeda, Dept. Health
Regional: Regional government

27
Social/ communities: Community based organisations
Project SAN2: Provision of 36,000 units of watertight septic tank within 3 years using the Output Based
Approach (OBA) (2016, 2017, 2018)
The procurement, production and installation of 36,000 impermeable septic tanks (and more after that)
requires considerable preparation and organization. For that reason, project No.7 proposes that the DKP
shares this responsibility with one or more private sector operators who have the financial and management
capacity to deliver a sustained service while recovering the cost from the customers after the initial OBA
funding has expired.
Action Description and responsibilities Timeframe
SAN2.1 DKP to coordinate the project and work with Bappeda to secure OBA
central government funding for the project (i.e. sources from APBN
and DFAT [Indii-Ausaid])
2017
SAN2.2 DKP selects most suitable impermeable septic tank design(s) from
products that are readily available on the market
2017
SAN2.3 DKP identifies qualified contractors to fabricate the most suitable
septic tank design(s)
2017
SAN2.4 DKP to implement public tender for hiring one or more qualified
contractors to fabricate and install 36,000 impermeable septic tank
units (based on SNI Number: 03-2398-2002) within a period of 3
years
2017
SAN2.5 DKP obtains construction permits and installs approximately 12,000
septic tanks per year, with an initial focus on poor and vulnerable
households (MBR)
2018-2020
SAN2.6 DKP periodically controls quality of septic tanks and their installation 2018-2020
SAN2.7 DKP periodically monitors progress and evaluates results 2018-2020
SAN2.8 DKP continues to allocate funds for installing more impermeable
septic tanks to reach the target of 100% coverage.
2019-2020
SAN2.9 Working in coorditnation with Project 1 regarding socialisation, DKP
works with pricate sector to establish a mechanism to promote
future customer purchasing of septic tanks. Request technical
assistance to establish micro-financing opportunities for housholds
to purchase septic tanks in future.
2020
Responsible agency DKP
Estimated costs
(budget needs)
Preparation (design): Rp. 5 Billion
Realization (construction): Rp. 108 Billion
Maintenance & operation: Project 1
Implementing
mechanism, funding
& financing
Traditional procurement, OBA
Funding by ABPD I, APBD II, ABPN, grant
Other partners Malang: Bappeda, PDAM, Dept. Health
Social/ communities: Customers

28
Project SAN3: Construction of 15 units of Communal Waste Water Treatment Plant (IPAL) within 5 years
In densely populated urban areas with suitable location, it is proposed to build 15 additional (to the existing
6) community waste water treatment plans, each to serve approximately 150 housholds.
They are simple low maintenance gravity fed systems including a sedimentation tank, an anaerobic baffled
reactor (like a large septic tank) and a simple biofilter.
The systems are operating relatively effectively and managed by the community with the support of DKP.
Solids require pumping every 10-15 years, and effluent quality should be monitored by the Environment
Agency.
Their operation should be undertaken by the comminuty with the assistance of community based groups
which require ongoing training and an effective knowledge sharing platform.
Action Description and responsibilities Timeframe
SAN3.1 DKP establish a PMU to prepare a project implementation plan and
coordinates with City Agencies and other stakeholders
2017
SAN3.2 DKP allocates sufficient budgets for PMU to implement the plan 2017
SAN3.3 PMU to undertake community consultations to identify willingness
and suitable locations.
2017
SAN3.4 PMU to support recent research (Hendriarianti & Karnaningroem,
2016 - Evaluation of Communal Wastewater Treatment Plant
Operating Anaerobic Baffled Reactor and Biofilter) by National
Institute of Technology to evaluate effectiveness of existing systems
and provide MSc/PHd funding to produce an improved standard
design, cost estimates, and specific requirements to be adapted to
each of the 15 sites.
2017
SAN3.5 The PMU will obtain approval of the project and ABPN (Sanitation
Specific Allocation Budget - DAK) grant funding in coordination with
Bappeda
2018
SAN3.6 PMU will obtain EIA and construction permits 2018
SAN3.7 PMU will tender the project and award the contract(s) 2018
SAN3.8 PMU will supervise construction of the WWTPs 2018-2020
SAN3.9 PMU will coordinate with the Environment Agency will prepare an
eefluent quality monitoring plan and a plan for reporting to
communities and DKP
2019
SAN3.10 PMU will strengthen the association of community based
organisations responsible for management and allocate budget for
knowledge sharing sessions to exchange their experience in
managing the operation of communal WWTPs
2018
SAN3.11 PMU to establish solids pumping schedule with PDAM. 2018
Responsible agency DKP
Estimated costs
(budget needs)
Realization: Rp. 7.5 Billion
Implementing
mechanism, funding
& financing
ABPN - DAK

29
Other partners Malang: Bappeda, Environment Agency
Social/ communities: Community Based Organisations
Other: National Institute of Technology, Malang, Department of Environmental
Engineering
Project SAN4: Construction of 2 city scale Fecal Sludge Treatment Plant (IPLT) to handle scheduled fecal
sludge collection from western and eastern regions
Two independently managed septage treatment plant (STP) will be designed and built by qualified
contractors. Factors influencing the design include climate, septic tank size, design, user habits, pumping
frequency, water supply characteristics, piping material, and the use of water-conservation fixtures, garbage
disposals, and household chemicals.
By liaising with Bappeda to ensure this project is in the medium term development plan (RPJMD) for the City,
national (ABPN) government funding can be obtained if a feasible project proposal is prepared. Collaboration
between the Provincial Government, the City Government and PDAM is therefore necessary.
The normal project cycle including feasibility study, design, permitting, procurement and construction
processes should be followed in implementing this project.
Environmental impact of outflows shall be mitigated through thorough EIA and design, and land acquisition
and social impact should be considered in early project development.
Action Description and responsibilities Timeframe
SAN4.1 PDAM to establish a PMU to prepare a project implementation plan
and coordinate with Provincial Government (as necessary), Regional
Gvernment, City Agencies and other stakeholders.
SAN4.2 PMU allocates sufficient budgets to implement the plan
SAN4.3 PMU to draft the specific requirements of the 2 treatment plants and
TOR for undertaking a Feasibility Study, including outline design and
cost estimates; if applicable, standard designs shall be considered
and evaluated
SAN4.4 PMU to commission FS including outline design and cost estimates.
The feasibility study will include consideration of tipping fees for
private operators (for disposal of septage through PDAM, and
potentially future private operators) as well as EIA and social impact
assessments
SAN4.5 Obtain approval of the project and ABPN grant funding in
coordination with Bappeda
SAN4.6 PMU will obtain EIA and construction permits
SAN4.7 Provincial/Regional Government will implement land acquisition and
clearance.
SAN4.8 PMU will tender the project and award the design and build
contract(s)
SAN4.9 PMU will supervise construction and commission the 2 IPLT plants
SAN4.10 PMU will periodically monitor and evaluate performance of the
treatment plants
Responsible agency PDAM Malang

30
Estimated costs
(budget needs)
Preparation (design): Rp 1 Billion
Realization (construction): Rp 10 Billion
Maintenance & operation: to be determined
Implementing
mechanism, funding
& financing
Traditional procurement, Design and build
Funding by ABPN
Other partners Malang: Bappeda, DKP, Environemtn Agency
Regional: Malang Regency, East Java Province
Private Sector: Design consultants and construction contractors
Social/ communities: Landowners

31
Green Waste – Action Plan
Program: Waste to Energy (WtE) Processing Plant

32
Green Waste Action Plan
Program: Waste to Energy (WtE) Processing Plant
Why? The volume of garbage in Malang has increased in recent years. It is estimated that five years from
now the Supit Urang landfill site will no longer be able to accommodate the Cit s gar age as about
75% area of Supit Urang landfill site has been occupied. Current waste production of the city is 650
tons/day, which is disposed in the Supit Urang landfill site with a total area of 30 hectares. The
ratio ale of i trodu i g WtE i “WM is to help tur a pu li ser i e fro a Cost Ce ter i to a Profit Ce ter a d e te d the lifeti e of la dfill i frastru ture, a d eet our Gree goals.
Given the limited land resource for landfills, and the cost of investment and operating of landfill site,
the City of Malang with support from the Central Government, would like to partner with a
competent investor in the bid to convert municipal waste-to-energy using an appropriate technology
that converts municipal waste into energy, therefore reducing waste entering landfill. To achieve
this, a minimum daily production of 500 tons of waste is required, and the waste in Malang is
already greater than that number. It is important to note that, when considering waste-to-energy as
a sustainable way of managing both waste and providing energy, no single technology dominates –
there is o o e size fits all solutio – and therefore a detailed feasibility study is required before
moving forwards. A common stumbling block (which has been noted in Batam) is approving the local
regulation to guarantee tipping fees and power purchasing, and viability gap funding if required.
The Green Board of Malang has several compelling reasons for the construction of a WtE plant:
WtE plant has the ability to reduce waste volume significantly (70-90%);
WtE plant does t require large areas as compared to non WTE methods, thus it is suitable to be
implemented in urban landfill area;
The product of garbage processing in the form of electrical energy can be sold to PLN, therefore
it can decrease the load of Local Government in financing waste management.
PPP concept:
Investor of WtE project is generally required to provide a minimum equity of 20% from the
estimated value of the Project;
The project is guaranteed by the Government, in order to earn revenue from at least two main
sources, which are: (a) Waste Management Services Fee (Tipping Fee) from local government
and (b) Purchases of electricity by PT PLN. From PLTSa in Bandung experience, SPC income from
the tipping fee covers 44% and from the sale of electricity to PLN covers 56%.
Local government ensures a minimum supply of garbage per day is ready to be processed by the
Investor of the Project;
Generally, after concession time, the project will generate revuew from electricity sales only,
reducing City waste managemen budget.
Current status A series of legislations and policies has been enacted in Indonesia in order to effectively manage
MSW, promote its utilization as a source of energy, and protect the environment. The City of
Malang, supported by the Government of the Republic of Indonesia has identified the investment in
a Waste-to-Energy plant as a viable alternative and a priority for an integrated municipal waste
management.
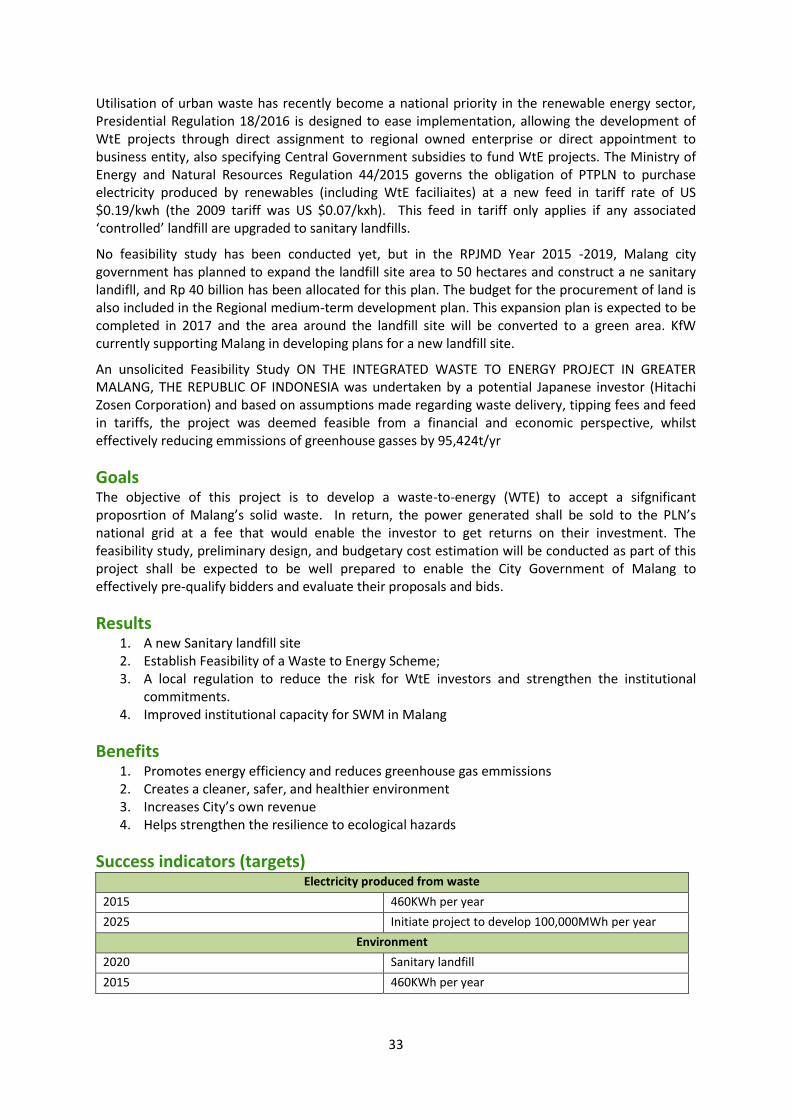
33
Utilisation of urban waste has recently become a national priority in the renewable energy sector,
Presidential Regulation 18/2016 is designed to ease implementation, allowing the development of
WtE projects through direct assignment to regional owned enterprise or direct appointment to
business entity, also specifying Central Government subsidies to fund WtE projects. The Ministry of
Energy and Natural Resources Regulation 44/2015 governs the obligation of PTPLN to purchase
electricity produced by renewables (including WtE faciliaites) at a new feed in tariff rate of US
$0.19/kwh (the 2009 tariff was US $0.07/kxh). This feed in tariff only applies if any associated
o trolled la dfill are upgraded to sa itar la dfills.
No feasibility study has been conducted yet, but in the RPJMD Year 2015 -2019, Malang city
government has planned to expand the landfill site area to 50 hectares and construct a ne sanitary
landifll, and Rp 40 billion has been allocated for this plan. The budget for the procurement of land is
also included in the Regional medium-term development plan. This expansion plan is expected to be
completed in 2017 and the area around the landfill site will be converted to a green area. KfW
currently supporting Malang in developing plans for a new landfill site.
An unsolicited Feasibility Study ON THE INTEGRATED WASTE TO ENERGY PROJECT IN GREATER
MALANG, THE REPUBLIC OF INDONESIA was undertaken by a potential Japanese investor (Hitachi
Zosen Corporation) and based on assumptions made regarding waste delivery, tipping fees and feed
in tariffs, the project was deemed feasible from a financial and economic perspective, whilst
effectively reducing emmissions of greenhouse gasses by 95,424t/yr
Goals The objective of this project is to develop a waste-to-energy (WTE) to accept a sifgnificant
proposrtio of Mala g s solid aste. In return, the power generated shall e sold to the PLN s national grid at a fee that would enable the investor to get returns on their investment. The
feasibility study, preliminary design, and budgetary cost estimation will be conducted as part of this
project shall be expected to be well prepared to enable the City Government of Malang to
effectively pre-qualify bidders and evaluate their proposals and bids.
Results 1. A new Sanitary landfill site
2. Establish Feasibility of a Waste to Energy Scheme;
3. A local regulation to reduce the risk for WtE investors and strengthen the institutional
commitments.
4. Improved institutional capacity for SWM in Malang
Benefits 1. Promotes energy efficiency and reduces greenhouse gas emmissions
2. Creates a cleaner, safer, and healthier environment
3. I reases Cit s o revenue
4. Helps strengthen the resilience to ecological hazards
Success indicators (targets) Electricity produced from waste
2015 460KWh per year
2025 Initiate project to develop 100,000MWh per year
Environment
2020 Sanitary landfill
2015 460KWh per year

34
Environment
2015 Expanding controlled landfill
2020 Non-expanding clean sanitary landfill
Key risks A number of challenges face WTE Project Feasibility using KPBU (PPP) schemes. These will require
consideration in a thorough Feasibility study:
1. The reliability of 500 tons/day waste supply – estimated minimum required for feasibility.
2. National Banks are still reluctant to fund PLTSa Project due to the low "credit worthiness" of
Regional Government
3. Commitment and ability of regional budget on paying "Tipping fee" to the private investor
4. The conversion of controlled landfill to sanitary the landfill to ensure feed in tariff
5. Community acceptance of the project
6. Fly ash management (hazardous waste)
7. Dalays in local regulation on tipping fee and feed in tariff.
Risk mitigation These risks can be mitigated by prioritizing the following measures and allocating sufficient
resources to their implementation:
1. Implement regulatory updates as soon as possible while local political will is present (before
policy / regime changes occur).
2. Establish a Project Managament Unit or taskforce to coordinate the program.
3. Undertake a social marketing strategy to engage citizens in environmental aspects of SWM
and disseminate information to reduce illegal dumping and produce a reliable waste stream.
4. Upgrade the existing landfill sites to sanitary.
5. Undertake a thorough feasibility study evaluating all project risks.

35
Project WTE1: Develop sanitary landfill system in Supit Urang controlled landfill site
To reduce local environmental degradation, secure future landfill needs of the City, and ensure feasibility of
WTE project a sanitary landfill is required. This project is in the current Medium term development plan and
Regional budget has been allocated for land acquisition.
A sanitary landfill includes a liner which isolates waste from the surrounding environment and a leachate
collection and treatment system.
Action Description and responsibilities Timeframe
WTE1.1 BLH, DKP and Malang Green Board set up a Project Management
Unit to develop a project implementation plan (PIP) including
detailed activities, responsibilities, timeline, need for external
assistance (consultants), budget etc. This should also map relevant
stakeholder and the need for coordination with regional, provincial
and national government.
2016
WTE1.2 PMU allocates sufficient budgets to prepare and implement the plan 2016
WTE1.3 PMU to liaise with KfW (and consultants) who are providing support
in detailed engineering design of site layout and sanitary landfill.
2016
WTE1.4 PMU to hire specialist AMDAL and LARP consultants 2017
WTE1.5 Malang Regency to aquire land and manage land acquisition and
resettlement
2017
WTE1.6 PMU to tender and manage construction 2018-20
WTE1.7 Landfill operational team to receive training in management of new
infrastructure including leachate treatment plamnt.
2019
WTE1.8 BLH develop environmental monitoring scheme 2019
Responsible agency DKP
Estimated costs
(budget needs)
Realization (construction): Rp. 300 Million
Maintenance & operation: Rp. 500 Million / year
Implementing
mechanism, funding
& financing
Traditional procurement
External assistance KfW
ABPD for land aquisition
Funding by APBN for construction
Other partners Malang: Bappeda, BLH
Regional: Malang Regency, East Java Province
International: KfW
Social/ communities: Affected local communities

36
Project WTE2: Pre-Feasibility Studies of "Waste to Energy" project
Preparation of the PFS for Waste into Energy Conversion through the construction of Waste Fuel Power Plant
(PLTSa) aims to assess the feasibility of the project, in terms of investment feasibility, technology feasibility
and other aspects, such as EIA, Social, Regulatory and Tipping Fee. PFS can be done by selecting technically
qualified consultants to review, verify, and update the unsolicited feasibility study already undertaken. The
results of the PFS are going to be studied further by the competent KPBU Malang (PPP) Board. Once the
evaluation is completed, that KPBU (PPP) project will be openly auctioned according to Presidential Decree
No. 38/2015.
Action Description and responsibilities Timeframe
WTE2.1 PMU (same as Project 1) commissions Pre-Feasibility Study (PFS) on
WtE and landfill including preparation of ToR, identification &
recruitment of qualified consultants, PFS implementation
2017
WTE2.2 PMU supervises PFS work done by consultants 2018
WTE2.3 PMU decides if the WtE is feasibleand Project 3 and 4 will move
ahead in parallel, with detailed feasibility studies, design, costing,
financing etc being undertaken by the potential investors.
2018-20
Responsible agency DKP
Estimated costs
(budget needs)
Preparation (design): Rp. 1 Billion
Implementing
mechanism, funding
& financing
Traditional procurement
Funding by ABPD I and APBD II
Other partners Malang: Bappeda, BLH
Regional: Malang Regency, East Java Province, PLN
Private: Consultants
National: MONRE/PLN (regarding energy tariffs)
Social/ communities: Waste collectors, community waste banks, residents

37
Project WTE3: Initiation of KPBU (PPP) Board and Preparation of KPBU Tender Documents in order to
select business entity that will invest on Waste to Energy proje t
If the WtE proje t is feasi le, the KPBU usi ess tra sa tio odel for PLT“a of Mala g s la dfill is:
Action Description and responsibilities Timeframe
WTE3.1 Green Board to set up a PPP task force to be led by DKP (PJPK, the
agency in charge of the project) and Bappeda
2017
WTE3.2 PJPK establishes KPBU Bidding Committee 2018
WTE3.3 PJPK liaises with Bappenas (PPP Unit) and Minisrty of finance (Risk
Management Unit) to develop capacity and training of KPBU auction
procedures.
2018
WTE3.4 PJPK preparesKPBU tender documents including: (a) PFS Document,
(b) Announcement of KPBU Auction, (c) PQ Document, (d)
determination of the short list, (e) the Auction document (Request
for Proposal).
2019
WTE3.5 PJPK evaluates bids and awards contract to business entity that will
undertake the WtE project if proven feasible, and is supported by a
Local Regulation on the Tipping Fee (see Project No.4)
2019
Responsible agency DKP
Estimated costs
(budget needs)
Preparation (design): Rp. 1 Billion
Realization (construction): to be determined
Maintenance & operation: to be determined
Implementing
mechanism, funding
& financing
BOT arrangement with private sector. Private sector arranges finance. PT PII can
provide project guarantees.
Other partners Malang: Bappeda,
Regional: Malang Regency, East Java Province, PLN
National: Ministry of Finance, Bappenas
Social/ communities: Affected communities

38
Project WTE4: Prepare Local Government Regulation for Malang City’s Tipping Fee (High Te hnology Based Waste Management Service Fee)
To enable private sector investment and detailed project financial feasibility assessment (undertaken by the
potential investor) a transparent process is required to determine and guarantee appropriate tipping fees, as
this is an important futre revenue which against which feasibility will be determined.
This Local Regulation (bylaw, Perda) is needed as a basis for the PJPK, based on Government Regulation on
Environmentally Friendly Technology Based Waste Processing Service Expenses through the Mechanism of
Local Government Cooperation with Business Entities. The Local Regulation needs to mention that for the
next 20-25 years (2018-2038), Malang will use its APBD to pay for the "tipping fee" of the private sector that
manages the PLTSa (Waste to Energy) Plant. The value of the tipping fee and other budgeting and institutional
considerations will have been calculated in the PFS study in Project No.2.
Action Description and responsibilities Timeframe
WTE4.1 PMU allocates sufficient budget for drafting Academic Paper on
Tipping Fee
2017
WTE4.2 PMU allocates sufficient budget for drafting a Local Regulation on
the Tipping Fee
WTE4.3 Based on the choice of appropriate technology and financial analysis
in the PFS, PMU drafts a Local Regulation on the Tipping Fee,
through consultation with relevant working groups including
Bappeda, finance, dinas DKP and others
Responsible agency DKP
Estimated costs
(budget needs)
Preparation (design): Rp. 800 Million
Implementing
mechanism, funding
& financing
APBD
Other partners Malang: Bappeda, BLH, City Council
Regional: Malang regency,

39
Green Water – Action Plan
Program: Adaptation and mitigation of climate
change – Flooding and water resources management

40
Green Water – Action Plan
Program: Adaptation and mitigation of climate change – Flooding and water
resources management
Why? The urban drainage and flood control system in Malang has deteriorated to the extent that it cannot
properly fulfil its role anymore. Uncontrolled growth has resulted in gradual encroachment,
replacement of water retention areas by real estate, mixing of irrigation and drainage channels, and
other u a ted de elop e ts that a ause la dslides a d u der i e the Cit s resilie e agai st climate change. The City recognizes that the system needs a major overhaul.
Natural waterways crossing the City (Brantas river, Amporong river, Bango river, Metro river and
Sukun river) would appear to provide sufficient outlets for rainwater. In reality, however, their
combined capacity has been significantly reduced by factors such as insufficient dredging, cleaning,
sedimentation, and illegal construction. The number of natural and artificial water storage areas has
also declined over the years. Old drains (especially in Ijen and the City centre) are closed but prone
to sedimentation, while the open ones are regularly being used for dumping household waste
(especially in Klojen and Sawojajar). Uncollected waste that finds its way into drains causes clogging
and flooding. In Lowokwaru and Purwantoro, the drainage system cannot handle rainfall anymore
and creates regularly floods up to 50 cm deep. Drains and walkways along main streets are also
damaged by the roots of old trees, and the only solution would be to remove the trees. The
situation is bound to worsen in the coming decades.
Current status The Government of Indonesia, through the Ministry of Environment and with support from AusAID
and GIZ, has conducted a Risk and Adaptation Assessment to Climate Change for the Greater Malang
Area. The greates risks to Malang City were in relation to water resources, floods and landslides.
Generic adaptation measures have been developed without definition of projects and how or where
to implement these measures to reduce flood and landslide risk.
Goals In order to realize the third mission of Malang which is "Realising Environmentally Friendly City
De elop e t", the Gree Board pla s to o du t a series of a ti ities u der the a er of Adaptation and Mitigation of Climate Change, which include various measures to prevent and slow
down climate change / global warming and reducing the impact of climate change / global warming.
It will include a drinking water safety plan..
Results The Program is expected to have the following results:
1. GIS-mapping capabilities and projections of climate change
2. City Water Resources Management Master plan
3. Improved flood control
4. Drinking water safety plan
Benefits 1. Increased resilience against the effects of climate change
2. Reduced economic and social damage caused by flooding

41
3. Improved water safety
4. Improved public health
Success indicators (targets) Proje tio of li ate ha ge i du ed Ver High flood risk Area k 2
)
2015 89.48
2025 75
Key risks Although the projects are relatively well defined, the technology is straightforward, and the capacity
is there to deliver them, there are key risks including:
1. Difficulty in obtaining sufficient funds for the necessary improvements
2. Difficulty in enforcing citizen discipline in dumping waste
3. Difficulty in enforcing building codes and regulations and preventing illegal construction
Risk mitigation These risks can be mitigated to the extent possible by prioritizing the following measures and
allocating sufficient resources to their implementation:
1. Implement regulatory updates as soon as possible while local political will is present (before
policy / regime changes occur); integrate the program into the statuary planning progress.
2. Establish a permanent working group to coordinate the program.
3. Undertake a social marketing strategy to engage citizens in environmental aspects of climate
change mitigation, and disseminate information.

42
Project WAT1: Development of a drainage and flooding database using GIS
Before commissioning consultants for development of a Masterplan, the City should focus on development
of a drainage system and water resources management databse in GIS format. Consider using ILWIS
(Integrated Land and Water Information System) an open source GIS program used in the previous Risk and
Adaptation Assessment to Climate Change for Greater Malang.
Action Description and responsibilities Timeframe
WAT1.1 Liaise with the spatial planning agency on the best platform for data
management and GIS
2016
WAT1.2 Consider the benefits of ILWIS as used by the Ministry of
Environment Climate Risk Assessment Study for mapping risk
baselines and projections.
2016
WAT1.3 Develop a GIS training program and budget (potential for
collaboration with Ministry of Environment / National Disaster
Management Office for training from Twente University in ILWAS
and its applications.
2017
WAT1.4 Assemble hard soft and electronic data for digitising into GIS layers,
including topography and natural drainage network, watersheds,
hard drainage assets, embankments, inundation areas, flood risk
baselines and projections, climate stations, flow gauging, etc
2017
WAT1.5 Develop an operational system for monitoring and recording
inundation events to validate existing inundation baselines.
2017
WAT1.6 Maintain GIS database platform with assistance from City Spatial
Planning Agency
2018
Responsible agency Public Works Department
Estimated costs
(budget needs)
Preparation (design, training): ~Rp. 300 Million
Implementing
mechanism, funding
& financing
Funding by APBD Malang
Other partners Malang: Bappeda, Disaster Management Office, BLH, Spatial Planning Agency, DKP
Regional: PDAM Malang
National: Ministry of Environment, Disaster Management Office
Social/ communities: Affected communities
Project WAT2: Development of the Master Plan for Integrated Water Resources and Flood Management
System
An integrated plan is necessary as water resources management (conservation) and flood risk management
are linked through retention of water, storage, infiltration, and reduction of runoff both in upstream areas
and Malang City and Regency. The Terms of Reference for this will include (not limited to):
Consideration of Climate Change.
Considering integrated and sustainable urban drainage principles such as infiltration features, and
aki g spa e for ater
Creating conservation areas to provide a legal basis ope spa e alo g ur a ri ers a d i stor retention areas;
Rrehabilitation of existing storm water retention areas (in Malabar urban forest area);
Creation of new storm water retention areas (in Kauman, Pulosari, Rolag/Gribig, and Splendid);
“eparati g the irrigatio a als fro the Cit s drai age et ork

43
Catchment management, reforestation, promoting surface water retention and recharge;
Drinking water safety plan including water source protection and water conservation measures;
Develop short term priority investments, medium term projects, and longer term programs to reduce
flood risk in an integrated way.
The masterplan should propose institutional and budgetary requirements for implementing the short
medium and long term investments.
Mai te a e pla s foir Mala g s drai age et ork
Participative planning with the City Green Team to ensure a coordinated and integrated approach.
Current required drainage system repairs in Malang can be focused in these areas: (i) Langsep road (DAS
Metro), Gajayana Road until MT Haryono road (DAS Brantas), Sukarno Hatta road (DAS Bango), Borobudur
road to Blimbing market (DAS Bango); (ii) create diversions to primary drains from problematic drains, for
example : DI Panjaitan road and MT Haryono road drainage diverted into Brantas River, Ki Ageng Gribig road
drainage diverted into Amprong River, Gatot Subroto road into Branta River, Metro Sudanco road drainage
diverted to Supriya River; (iii) Removing other utilities from drainage channels - drinking water pipes,
telecommunication cables, etc.
Action Description and responsibilities Timeframe
WAT2.1 Green Board work with Bappenas to establish a PMU to prepare a
project implementation plan (PIP). PMU to include Bappenas, City
Disaster management office, Malang Public Works Department,
PDAM Malang, Spatial planning, DKP
2016
WAT2.2 PMU allocates sufficient budgets to manage implementation of the
PIP.
2017
WAT2.3 PMU prepares ToR for preparing a Drainage Masterplan 2017
WAT2.4 PMU identifies, selects and appoints qualified consultants to prepare
the Masterplan for Integrated Water Resources and Flood
Management
2017
WAT2.5 Public works to commission any additional technical assessments
and surveys to enable the masterplanning process, including
hydrological monitoring, modelling, and updated topographic
surveying.
2017-18
WAT2.6 Provide counterpart staff to work with consultants to develop
capacity, and update outputs into GIS database.
2017-18
WAT2.7 Recommendations are adopted into the stator planning process
(Medium Term Development Plan) and budget is allocated for works.
2018
Responsible agency Public Works Department
Estimated costs
(budget needs)
Preparation (design): Rp. 1 Billion
Capital costs (construction): 25 Billion (flood control and drainage)
Implementing
mechanism, funding
& financing
Traditional procurement
Funding by ABPD I and APBD II
Other partners Malang: Bappeda, Disaster Management Office, BLH, Spatial Planning Agency, DKP
Regional: PDAM Malang
Social/ communities: Affected communities
Private: Consultants

44
Green Transport – Action Plan
Program: Study and Policy on Public Transport & Urban Mobility

45
Green Transport – Action Plan
Program: Study and Policy on Public Transport & Urban Mobility
Why? The aim of this program is to respond to an urgent need for convenient urban mass transportation.
The existing public transport system of small privately operated minibuses shows continuously
decreasing rates of occupancy because of inadequate service quality. This alienates citizens from
using public transport, as demonstrated by a modal shift to private motorized vehicles, which causes
further traffic issues. This study and policy development is expected to be able to revive and restore
citizen s i terest i pu li tra sport, a d e e tuall redu e traffi ja s a d tra el ti e a d therefore boost the local economy and liveability. It is clear that the initiative has to be supported by quality
transport services and infrastructure.
Current status Our City currently does not have a reliable and efficient public transport system. The modes
of transportation used in Malang are motorcycles (80%), private cars (15%), and public transport-
ation (5%). It is estimated that around 200 additional motorbikes take to the roads each day! One of
the reasons for this is the tens of thousands of students in Malang that use motorbikes as their
preferred means of transport to reach the 38 university campuses, which is a prime source of traffic
jams. Integrating this university network with improved transportation is a key consideration in
designing an improved transport system. The large and increasing number of people from Surabaya
that likes to spend the weekend in cooler Malang creates additional bottlenecks, especially in the
Blimbing area. Added to an unsurmountable lack of parking space for private vehicles in the densely
built city, the situation is quicly becoming unsustainable.
Since 2007, Malang has installed 15 automatic traffic control systems (ACTS) on main roads that use
CCTV cameras. Eleven of those already use solar panels for energy supply. The City has issued 2,216
permits to minibus operators in recent years, even though only 1,600 units are on the road, as most
operate at a loss because of the steadily growing number of private vehicles. The Transport
Department (DisHub) believes that a BRT system with large buses is not feasible in Malang because
of its many narrow winding roads, however two strategic BRT routes (where road widths permit)
could be an option to connect parking in the suburbs to the City Centre, and also serve to connect
the Greater Malang Area, and the possible new Eastern ring road.
Mala g s detailed spatial de elop e t pla ‘DT‘K 5-2035) already specifies a network of joined
pedestrian and bicycle paths that connect to key locations for a total of more than 93 km. As a pilot
project, a road near the airport has been provided with separate lanes using concrete separators to
give bicycles, motorbikes and becak operators their own lane. This is expected to make traffic
considerably safer.
Goals To overcome traffic congestion and related problems of pollution, public health, road safety and
security, Malang in 2016 will start preparing for conversion to public transport that is
environmentally friendly. This program (Sarana Angkutan Umum Massal or SAUM) proposes to
create an alternative mass transportation system that is based on improving the existing informal
minibus system (potentially separating them from existing traffic), linking these networks to edge of
city tourist parking, University campuses and residencies, pedestrian walkways and bicyle paths, and
has the potential to wean people away from private modes of transportation.

46
Results The Program is expected to have the following results:
1. A successful demonstration project for environmentally friendly and reliable public transport
that can be replicated city-wide
2. Increased citizen willingness to use more non-motorized transport
3. Improved willingness of private operators to operate public transport service
Benefits 1. Contributes to a healthier environment (less pollution, improved physical fitness)
2. Contributes to a safer environment (fewer accidents, safer transport for women and
children)
3. Improved urban mobility (fewer traffic jams, better connections and access)
4. Reduces greenhouse gas emmissions
Success indicators (targets)
Public transport share of transportation
2015 5%
2020 15%
Private minibuses operating successfully
2015 1600
2020 3000
Key risks Although the projects are relatively well defined, the technology is straightforward, and the capacity
is there to deliver them, there are key risks including:
1. Failure to persuade citizens to use the new approach
2. Failure to persuade transport operators to use the new system
3. Failure to mobilize the necessary resources to introduce and replicate the new sy
Risk mitigation These risks can be mitigated to the extent possible by prioritizing the following measures and
allocating sufficient resources to their implementation:
1. Implement regulatory updates as soon as possible while local political will is present (before
policy / regime changes occur)
2. Establish a permanent working group to coordinate program preparation and
implementation
3. Undertake a social marketing strategy to engage citizens in environmentally friendly and
non-motorized transportation, and disseminate information.

47
Project TRAN1: Re-Establish a Malang Traffic Forum
The existing Malang Traffic Forum should be re-established by Mayoral decree to discuss, plan, and
coordinate improvement of the traffic situation in the City. The Mayoral decree should outline membership,
provide Multi-year APBD funding and provide a mandate for the forum to discuss integrated City wide
planning solutions developed by the Transport Agency, with a clear agenda and deliverables.
The Traffic Forum should be led by Malang Transport Agency, and should include Bappeda, Public Works,
DKP, BLH, Traffic police, Brawijaya University (who have produced a number of studies on City transport
improvements including public and non-motorised transport) other Universities.
Action Description and responsibilities Timeframe
TRAN1.1 Green Board coordinate with Mayors office to update the existing
Mayor Decision (SK Walikota) to make it multi-year, with a
representative membership, and sufficient APBD funds every year to
make it effective
2016
TRAN1.2 Each year, the MTF drafts and agrees on an agenda for discussing
and implementing improved urban mobility, including deliverables
and accountabilities. Including overall responsibility for coordinating
this Program.
2016
TRAN1.3 MTF allocates sufficient budget for drafting academic paper on
integrated local transportation
2018
TRAN1.4 MTF establishes a team to draft a Local Regulation based on
concepts developed in Project 2 (Street Engineering) Project 3
(Public Transportation Improvements) and Project 4 (Non Motorised
Transport Improvements)
2018
TRAN1.5 City Council approves and enacts local regulation on improved
integrated transportation
2018
TRAN1.6 MTF assist in coordinating implementation of the local regulation 2018
TRAN1.7 MTF periodically monitors and evaluates its own performance, and
makes adjustments as required
2020
Responsible agency Green Board, MTF
Estimated costs
(budget needs)
Preparation (design): Rp. 100 Million / year
Implementing
mechanism, funding
& financing
APBD
Other partners Malang: Bappeda, Transport Agency, Public Works, DKP, BLH, Traffic police
Regional: Greater Malang Regency, East Java Province
Social/ communities: Universities, schools, student groups, residents

48
Project TRAN2: Develop imporved street engineering
A system is needed that is able to overcome traffic jams caused by deficient infrastructure and a network of
intersections that are not designed to accommodate large volumes of traffic. This project deals with the
engineering activities that help reduce traffic jams, based on improvements to existing networks including
auto ated s art sig ali g, i terse tio i pro e e ts, e o e a streets a d route refor , a d potentially segregation of motorbikes.
This needs to be undertaken in close collaboration with traffic enforcement officers and a socialization
program, to ensure compliance which can undermine good street engineering.
Action Description and responsibilities Timeframe
TRAN 2.1 A PMU is established in the Transport Agency, with representatives
from Public Works.
TRAN 2.2 PMU allocates sufficient budgets to manage implementation of the
PIP, and regularly coordinate with / report to the Malang Traffic
Forum.
TRAN 2.3 PMU commissions monthly traffic survey for 1 year, prepares traffic
bottlenecks inventory.
TRAN 2.4 PMU prepares TOR and selects a suitably qualified consultant to
undertake outline design and feasibility study for street engineering
improvements verified through traffic flow modelling studies.
2017
TRAN 2.5 Based on the result of the design work, and pending approval of a
Local Regulation on Imporved Integrated Transportation, PMU
mobilizes sufficient resources to implement the traffic engineering
works
TRAN 2.6 PMU identifies, selects and appoints qualified consultants to
undertake Detailed Engineering Design including route reform,
modification of intersections to increase flow and capacity, road
widening and segregation, building of new roads, installation of
signaling and monitoring facilities to reduce traffic jams, an eastern
bypass/ring road, including the design of routes for Goi g to “ hool “afel ‘A““
TRAN 2.7 PMU supervises the work of the consultants
TRAN 2.8 PMU coordinates construction between responsible agencies: Public
Works, DKP etc
Responsible agency PMU: Transport Agency, Public Works
Estimated costs
(budget needs)
Preparation (design):
Realization (construction):
Maintenance & operation: to be determined
Implementing
mechanism, funding
& financing
Traditional procurement
Funding by ABPD I and APBD II
Other partners Malang: Malang Trafic Fourm, Bappeda,
Social/ communities: Affected communities businesses and land owners required
for easements.

49
Project TRAN3: Prepare a Feasibility Study (FS) for a sustainable public transportation system
The purpose of the FS is to overcome organizational bottlenecks in public transport management and also
formulate a new public transport service strategy.
It is important to provide regulation and enforcement of minibuses to ensure the fleet of private operators
are able to make profits, this will require improving efficiency in routes and policies to incentivize public
transport over private. Minibus only routes and lane separation will be an important consideration in hgigh
traffic areas.
After establishing such routes, it is meant to gradually introduce a fleet of clean and energy-efficient buses
of appropriate design that are able to navigate the narrow city streets, operated by a (single or multiple)
professional organization(s) dedicated to providing quality service.
Consideration of suburban and tourist park and ride schemes will be integrated into the public transport
strategy as well as improved mobility for students between residencies and campuses.
The feasibility study should make recommendations on regulatory and institutional requirements as well as
provide a plan for implementation.
Action Description and responsibilities Timeframe
TRAN 3.1 Establish a PMU to prepare a project implementation plan (PIP),
including timeframes, responsibilities, budgets. The PMU should
include representatives from Transport Agency, Bappeda, Public
Works, and sufficient budget a paid part time position for a technical
specialist from a local university traffic planning / civil engineering
department.
TRAN 3.2 PMU mobilizes sufficient resources for obtaining technical assistance
to prepare FS for a sustainable public transport system.
TRAN 3.3 PMU drafts ToR, selects and appoints qualified consultants to
implement the FS
TRAN 3.4 PMU supervises and evaluates the work of the consultant, providing
surveys, data, and resources where necessary.
TRAN 3.5 Based on the result of the approved FS, and pending approval of a
Local Regulation on integrated local transportation, PMU mobilizes
sufficient resources to implement the public transport
imporvemetns.
TRAN 3.6 PMU Develops a Project Implementation Plan with budgets and
responsibilities, including a phased approach, particularly with
respect to introducing new small and green buses.
TRAN 3.7 The Project implementation plan Integrated with the statutory
planning process, particularly the medium term development plan.
TRAN 3.8 PMU and Trafic Forum work with Bappeda to integrate the plans
with the the spatial development plan and results of Project 4.
TRAN 3.9 PMU monitors progress and reports to the Malang Traffic Forum
TRAN 3.10 Malang Traffic Forum promotes the use of the public transport
through a social advertising campaign
Responsible agency

50
Estimated costs
(budget needs)
Preparation (feasinility study): Rp. 1 billion
Realization (construction): Rp. to be determined (depends on the public modality
choices, BRT-LRT-Feeder system, etc)
Maintenance & operation: to be determined
Implementing
mechanism, funding
& financing
Traditional procurement
Funding & financing: APBD Malang City
Other partners Bappeda, Dinas Perhubungan, Dinas PU under City government
Directorate General of Land Transportation (DJ Hubdar)
Urban Planners from Universities
Police Department
Public Transport Owners Organization (Organda)
NGO – Walhi and
NGO – ITDP (Institute for Transportation & Development Policy)
https://www.itdp.org/where-we-work/indonesia/
Project TRAN4: Develop and implement a masterplan for non motorised transport
Based on the outputs of project 3, a masterplan for non-motorised transport will be developed which will
integrate with the central public transport routes, linking important educational, commercial, touristic, and
park areas with the improved publis transport system The masterplan will provide imporved pedestrian
walkways and pedestrian only areas and bicycle lanes, with appropriate landscaping and street scaping, such
as trees, other shading, street furniture and signage. A socialization program is required to advertise the
benefits of non-motorised transport to our citizens.
Action Description and responsibilities Timeframe
TRAN 4.1 Department of Public works establish a PMU for Non-Motorised
Transport
TRAN 4.2 Malang Traffic Forum review existing non motorized transport
newtorks and the network proposed in the current spatial
development plan and report back to PMU
TRAN 4.3 Malang Traffic Forum holds consultations with citizens to explore
and respond to pedestrian and cycling needs. Report back to PMU.
TRAN 4.4 PMU mobilizes sufficient resources for obtaining technical assistance
to prepare DED for a phased pedestrian and bicycle network
development and associated facilities and street furtniture
TRAN 4.5 PMU supervises, assists and evaluates the work of the consultant
TRAN 4.6 PMU develops detailedphased construction plan with budgets and
responsibilities (eg. DKP for public toilets and landscaping)
TRAN 4.7 PMU mobilizes sufficient resources to implement the NMT network
TRAN 4.8 PMU tenders the project for building the pedestrian and bicycle
network
TRAN 4.9 PMU supervises construction of the pedestrian and bicycle network
TRAN 4.10 Malang Traffic Forum promotes the use of the pedestrian and bicycle
network through regular public campaigns, car free days, city walks,
cycling competition, social media campaigns, etc
Responsible agency

51
Estimated costs
(budget needs)
Preparation (design): Rp. 750 million
Realization (construction):
Maintenance & operation: to be determined
Implementing
mechanism, funding
& financing
Traditional procurement
Funding & financing: APBD Malang City
Other partners Dinas PU, Dinas Tata Kota, Dinas Kebersihan & Pertamanan (DKP)
Directorate General of Land Transportation (DJ Hubdar)
Urban Planners from Universities
Police Department
NGO – Walhi .

52
The Five Priority Programs – Finance Actions
Fiscal Capacity The Green Board concluded that there are possibilities to further increase own local income (PAD).
Possible specific actions to increase PAD that were brought up by the Green Board are:
- Introduce electronic tax collection system. This will increase collection rates, for example for
restaurant tax and entertainment tax
- Improve database for IMB (building permits) and PBB (property tax)
The Green Board intends to develop a RIAP (revenues improvement action plan) to further explore
these and other options and to formulate specific actions to achieve this.
To improve budgets available for capital expenditures, the Green Board sees opportunities to
decrease annual unused cash balances by improving procurement and planning. This could partly
free up funds for capital projects. Possible specific actions identified are:
- Advanced procurement: Malang can start procurement procedures before the local budget
(APBD) is officially formalized. By this Malang can avoid delays.
- Malang is already making use of E-procurement system (electronic).
An intitial analysis of the potential borrowing capacity showed that Malang could potentially borrow
over 3.000 billion Rupiah (~230 million USD) in 2016 and over 5.000 trillion Rupiah (~424 million
USD) between 2016 and 2020. The Green Board indicates that this looks promising. The Green Board
will discuss with high level decision makers, the possibility of attracting loans for green actions and
proje ts that do add alue to Mala g s e o o a d li ea ilit ut for hi h o udgets are currently available and actions to further explore this opportunity. The city will put special attention
to its low classification (score 0,25) according to MoF Regulation no.33/PMK.07/2015 on Map of
Local Government Fiscal Capacity.
The following pages show the result of the Fiscal Analysis and Financial Assessment Report.
Alternative Mechanisms to attract finance Table 1 below summarizes the result of exploring the potential for applying alternative mechanisms
to priority programs. The Green Board learned that alternative mechanisms can be applied to a BOT
contract for new bulk water treatment facility, Waste to Energy and BRT. Actions aimed at further
exploring and applying these models have been incorporated in the action plans for these priority
programs.
Table 1 – Summary of Malang Action Plans
Project & owner
(rows)/ financing
options (columns)
(A)
Financing
(B)
Funding
(C)
Implementing
mechanism
(D)
Financing sources
(options)
(E)
Funding sources
(options)
Waste to Energy
BOT (contract);
(ii) BU Joint
Venture
(company
public &
private)
Not yet explored Tipping fee: no
number mentioned
Human Waste
Management – PLT2
Malang city:
septic tanks
PDAM: trucks
No Malang city: sceptic
tanks
PDAM: trucks

City of Medan
G‘EEN CITY ACTION PLAN 0 5

1
Foreword by the Mayor
Assalamuallaikum, Wr. Wb.
The Cit of Meda s Green City Action Plan (GCAP) is an initiative
that serves as a roadmap towards improving the quality of life in
the city appl i g gree attri utes generally known as green
planning and design, green open space, green building, green energy,
green transportation, green waste, green water, and green industry
& commerce, all significantly based on and supported by a green
community.
The basic reason for the City of Medan to prepare a GCAP is to help
achieve development that is sustainable, fair and profitable at the
same time because we are convinced that green development can
realize economic and social equity as it will be able to suppress and
manage conflicts between economic interests on the one side and
the need for environmental preservation on the other side.
The GCAP succinctly describes our priority programs as a reference for any citizens who want to
understand our framework for aspiring to become a Green City, including external parties interested
in participating in our Green City development.
The government of the City of Medan commits itself to continuing the process of capacity
development for greening the city through a multi-year and multi-stakeholder rolling green action
planning process led by the Green Team to stre gthe the Cit s Medium Term Development Plan
(RPJMD). The Green City Action Planning process is supported by an appropriate resource allocation
based on a Mayoral Decision.
Hopefully we will all be blessed with the help of the Almighty God in transforming the City of Medan
into a Green City. Amin.
Wassalam,
Medan, May 2016
Drs. H. Dzulmi Eldin, S, Msi
Walikota Medan

2
Table of Contents
Foreword by the Mayor .......................................................................................................................... 1
Table of Contents .................................................................................................................................... 2
Introduction ............................................................................................................................................. 5
What is a GCAP? ...................................................................................................................................... 5
Summary of GCAP Preparation Process .................................................................................................. 5
Green City Profile .................................................................................................................................... 9
Green City Development Strategy to 2035 ........................................................................................... 14
Medan Green Urban Development Strategy until 2035 ....................................................................... 15
From Long List to Short List ................................................................................................................... 16
Priority Green Programs ........................................................................................................................ 17
Final Selection of Priority Programs ...................................................................................................... 20
Introduction ........................................................................................................................................... 22
I stitutio al E a li g A tio s for Gree Tea a d PMUs ................................................................ 23
Green Waste – Action Plan.................................................................................................................... 25
Program: Improvement of on-site sanitation system ....................................................................... 25
Green Transport – Action Plan .............................................................................................................. 33
Progra : De elop e t of Meda s Bus ‘apid Tra sit “ ste B‘T ............................................... 33
Green Waste Action Plan ...................................................................................................................... 40
Program: Waste to Energy Plant ....................................................................................................... 40
Green Water – Action Plan .................................................................................................................... 46
Program: Increasing the efficiency and supply of drinking water ..................................................... 46
Finance Actions ..................................................................................................................................... 52
3
INTRODUCTION

4

5
Introduction This Green City Action Plan (GCAP) supports the National Urban Development Policy and Strategy
(NUDPS) for the period 2015-2045. The long-term vision is to realize sustainable and competitive
ities for people s prosperity based on physical characteristics, economic advantages, and local
culture by 2045. This vision will be achieved in three phases: (i) creating a national urban system, (ii)
having urban areas meet national service standards and creating sustainable cities that are green,
livable, smart and competitive, and (iii) strengthen governance and government institutions.
I additio , the GCAP is ased o the Gree Visio of the Ma or of Meda stated elo :
THE CITY OF MEDAN WILL BECOME A COMPETITIVE, COMFORTABLE, CARING AND PROSPEROUS
METROPOLITAN AREA
This vision is a broad statement, consistent with national urban development policies and strategies,
and able to accommodate a number of green development goals.
One of the pillars for implementing the NUDPS is the Green Cities Program (GCP)1 which is
implemented with the National Development Planning Board (Bappenas) as the Executing Agency,
and the Directorate General of Human Settlements in the Ministry of Public Works and Housing
(MPWH) as the Implementing Agency. The City of Medan has been participating in the GCP since
2010. It focused pri aril o i ple e tatio of three attri utes Gree Pla i g a d Desig , Gree Open Space and Green Community). With the new National Development Plan period that started in
2015, the City of Medan endeavored to scale up its GCP by promoting so e of the hea ier gree attributes such as Green Water, Green Waste, etc. by preparing a Green City Action Plan (GCAP) with
technical assistance by the ADB.2
What is a GCAP? A GCAP is a time scaled green investment plan for a city. It includes specific actions for preparing and
implementing prioritised investments over a short to medium term, which covers urban
management and institutional aspects, capacity development, and financing. Where appropriate,
performance indicators are provided to enable monitoring and updating. While a tio s focus on the
short to medium term, it also provides a strategy for achieving the City of Medan s gree isio o er longer-term time scales. This integrated action plan complements the City of Meda s statutory
planning process, notably the Medium Term Development Plan (RPJMD). Successful implementation
of the GCAP ould allo the Cit of Meda to e o e a ha pio for Gree Cities i I do esia.
The GCAP uses the ter Gree as a etaphor for cities that are clean, healthy, safe and energy-
efficient so as to become liveable and sustainable. It also reflects efforts to balance the economy
and the environment with social inclusiveness.
Summary of GCAP Preparation Process In 2015, the Mayor issued a Decision (SK 800/449.k/2015) to create an inter-disciplinary municipal
Green Team that ould e o e respo si le for prepari g the GCAP a d allo ated a udget for its
1 Program Pengembangan Kota Hijau (P2KH)
2 TA-8518 INO: Green Cities: A Sustainable Urban Future in Indonesia - 2 Capacity Development (46380-005)

6
operatio s. The Green Team as haired the Head of the Mu i ipal De elop ent Planning
Agency (Bappeda) and intermittently facilitiated by ADB consultants.
To realise this Green City Action Plan, it was essential to start with a vision for green development to
guide the development of priority programs, projects, and manageable actions. The GCAP is the
result of a pro ess of ide tif i g it de elop e t aspiratio s through a gree le s to for ulate a framework for sustainable development, and subsequently narrowing it down through a process of
further analysis and selection to result in the formulation of several priority programs, which were
then developed into detailed program briefs.
The Programs that will help the City achieve its vision for green development are shown in the
Gree De elop e t “trateg 5 on page 16. Based on further considerations of
implementability including current capacity limitations, the Green Team subsequently shortened the
list drastically to focus on four priority Programs (Water Supply, Waste to Energy, Public
Transportation, and On-site Sanitation) for the short term, and on four secondary priority Programs
(Drainage & Flood Control, Green Open Space, Urban Forests, and a Central Sewerage system) for the
medium-to-long term. Green Education (Sekolah Adiwiyata) is included as a continuous program (see
the Green Development Strategy chart on page 23). Because the GCAP is a rolling plan, programs,
projects and actions may be added and modified periodically.
The four Priority Programs were used to prepare a list of Actions in the form of a spreadsheet as
shown in The Ne t Fi e Years – Progra s, Proje ts a d A tio s section starting on page 23.
The Cit of Meda s Green Team will prepare annual updates of the GCAPs as a rolling plan by adding
e gree proje t proposals i order to gree up the it s future ediu -term and annual
development plans.
To larif the GCAP for ulatio pro ess, the t o ta les elo sho the step approa h a d tool o used the Green Team to systematically prepare its GCAP. This section serves to explain
the intermediate steps and products that led to GCAP formulation.

7

8
The first (administrative) step was to establish a multi-stakeholer Green Team Ma oral De isio . The Green Team then started visioning a green future, and used the tools from the Tool o diagram
shown above to proceed from vision to aspirations and expected results.
Once the Green Team completed the SOAR (Step 2), it pro eeded to gree i g up the it s e isti g Medium Term Development Plan (RPJMD appl i g a gree le s using the Livable Cities
Framework and a Multi Criteria Analysis (MCA) to develop and prioritise programs (Step 3). The
purpose of this exercise was to identify where existing and planned infrastructure developments fell
short of achieving green objectives, and could be improved by adding components that would
increase their green development content. This process will be repeated to inform the next RPJMDs
to se sitize de isio akers a d graduall stre gthe the gree alue or gree ess of de elop e t plans. Although the Green Team was free to introduce new ideas (for example MRT for Green
Transportation, and LED street lighting for Green Energy), it opted not to do so because of other
more pressing needs that needed to be addressed first. This was a deliberate strategy because
existing plans already proposed in municipal plans should have priority.
At the same time, the Green Team started orki g o a Gree Cit Profile (Step 4) with the aim of
developing a baseline for performance measurement. The Green City Profile includes the results of
Step 2 and 3. It also includes a ‘oad ap spreadsheet for green development, an environmental
profile with thematic GIS maps used for integrated rolli g plan development, as well as an inventory
of current and planned green initiatives. The Green Team used the Roadmap to rate the it s gree performance and progress towards green development objectives as part of a rolling plan process.
The Roadmap uses generic green performance indicators that the Green Team can use to formulate
short (2015-2019), medium (2020-2034), and long-term (2035-2045) targets toward sustainable
development. The ‘oad ap s aggregate s ore for all i di ators combined can be red, yellow, or
green. By objectively rating the Roadmap using 2015 as the baseline, the Green Team concluded
that Meda s aggregate score was still in the red zo e. The section below is a summary version of
the Cit s e iro e tal profile taken from the Green City Profile including current and planned
initiatives from the Green City Profile. The full Green City Profile is attached to the GCAP.
In line with Step 5, 6, 7, the Green Team prepared a number of Program Briefs, undertook a fiscal
capacity analyisis for green infrastructure investment, and scoped options for alternative modes of
financing. As all four Programs were adopted for action, there was no need anymore for prioritizing
projects (Step 8). Step 9 has resulted in this GCAP, while Step 10 will be done to monitor
performance when the next update of the GCAP is due.
The Result of the Fiscal Capacity Analysis can be found in Appendix A.
The list of original Project Briefs can be found in Appendix B.
The full Green City Profile can be found in Appendix C.
9
Green City Profile The section below is a summary of the full Green
City Profile developed by the Green Team as
part of the action planning process, which is
appended to the GCAP. It is shortened here to
provide a brief introduction.
Medan is the largest Metropolitan area outside
the island of Java. Because of its strategic
location along the Straits of Malaka, the City of
Medan is the main port of call for western
Indonesia for domestic as well as international
trade and industry. Medan has an area of 265
km2 with a current population of 2,970,032
corresponding with an average population
density of 11,200/km.
Medan feels the impact of rapid urbanisation.
The City is becoming densely populated with
newcomers and seasonal workers. On top of
that, the City has an average in-and-outflow of
500,000 daily commuters.
Meda s ge eral e o o i de elop e t potential is promising. The city functions as an
export hub from Indonesia to South and
Southeast Asia, the Middle East, Europe, and
Africa. Medan also is a transit point for goods
and passengers to those regions from all over
Indonesia. The cities of Kuala Lumpur, Penang
and Singapore are ithi a hour s air tra el from Medan s Kuala Na u I ter atio al Airport.
On the downside, urbanization has caused a
shortage of land to build on, and a corres-
ponding rise in land prices, which in turn has had
a negative effect on economic growth as well as
environmental preservation.
It also suffers from environmental problems
such as insufficient waste management, traffic
congestion, and pollution of air and ground-
water. The City has a program for the
improvement of water and air quality, named
the Clean River Program and the Blue Sky
Program, respectively. The City also initiated an
action plan for Climate Change Mitigation and
Adaptation, even though the scale of activities
implemented by the Environmental Agency
(BLH) is still limited. The National Agency for
Regional Disaster Prevention (BNPB) has
introduced a Disaster Reduction and
Ma age e t Progra for the it s Disaster Management Agency (BPBD) to help the City
prevent and respond to emergency disasters.
These activities are still being developed.
Spatial Development
Meda s spatial de elop e t is still u e e . There is a de elop e t gap et ee the Cit s northern and southern parts caused by the
general lack of public services and infrastructure
in the northern part. As an example, there are
only few roads to the northern area (Jl. Yos
Sudarso and Jalan Tol Balmera) while the
southern part is better served. This is influenced
by the fact that the south is closer to the city
centre, and therefore more attractive to
investors. Among others, the City aims to
address this imbalance through its Spatial
Development Plan until 2030.
Green Open Space (RTH) Gree ope spa e is also part of the Cit s Spatial Development Plan until 2030, although
there is constant pressure on available green
open space that is needed for environmental
protection.
According to Law No. 26 year 2007 on Spatial
Planning, ideally open space in Medan City (21
sub-districts, total area 26,510 ha) shall be 30%
of the total area or equal to 7,953 ha consisting
of 20% public open space (5,302 ha) and 10%
private open space (2,651 ha).
However, according to the Municipal Cleaning
Agency (DKP) data on year 2015, the public open
space managed by DKP was 86 ha, river
corridors 866 ha, mangrove forest 1,029 ha,
paddy field 4,304 ha, while no data were
available for private open space.
According to the Ministry of Public Works
Regulation No. 5/PRT/2008, the City shall
provide an open space of 250m2 at
neighbourhood level (RT) (= 1 m2/capita), 1,250
m2 at community level (RW) (= 0.5 m2/capita),
9,000 m2 at village level (Kelurahan) (= 0.3
m2/capita) and 24,000 m2 at sub-district level
(Kecamatan) (= 0.2 m2/capita).
The overall target of the Medan Green
Community is to achieve 30% green open space
(20% public and 10% Private). Presently its
primary concern is to ensure that green open

10
area is not further reduced. It advocates for
making good use of the open space for a
number of social and small economic activities
to reduce the chances of a possible change in
function.
Green Energy The condition of the electrical system in North
Sumatra is experiencing a power deficit caused
by an imbalance in plant additions, load growth
and generation deficiency. Rolling blackouts
imposed by state power company PT PLN have
increased in frequency, disrupting daily
economic and social activities. Taking place
three times a day, the blackouts have also
contributed to the rising number of fires in the
city. Medan City is the largest load center in
North Sumatra (almost 60% of total demand)
with a high growth rate.
Electricity supply to Medan City is provided by
interconnection of several plants. According to
the PLN usi ess pla 5-2024 (RUPTL), the
existing power plants in both Belawan area (15
plants; PLTU-PLTGU-PLTG-PLTD) and Medan
area (12 plants; PLTG, PLTD) are interconnected.
Bela a po er pla ts ha e i stalled apa it of 1.527,3 MW and operation of 1.092,4 MW
7 % , a d Meda po er pla ts ha e i stalled capacity of 225,8 MW and operation of 192,2
MW (85%) respectively. The year 2015 peak
load for Medan City was 1.415 MW, and
projected for year 2020 will be 1.740 MW, and
year 2024 will be 2.805 MW respectively.
In October 2015, Indonesian state energy
company Pertamina has signed on with
Japanese trading group Sojitz and North
Sumatra local government firm Pembangunan
Prasarana Sumatera Utara to build a $250
million gas-fired power plant in Medan by 2019.
North Sumatra needs an additional 700 to 800
megawatts of capacity to avoid rolling blackouts.
The planned Medan plant will have an output of
250 MW.
According to one energy study 3 , there is
potential to produce an additional 72 GWh of
electricity per annum from biomass (organic
waste) that is expected to reach 1.190 ton/day
by 2025.
As energy supply currently is beyond municipal
authority and its statutory development
planning process, this GCAP has not yet
attempted to specify actions to provide greener
energy and reduce consumption. It is expected
to become an important component of the next
GCAP.
Baseline Installed
Capacity (MW)
% Supply Ability
2015 1.753,1, MW 1.284,6 MW (73%)
Source: PLN Business Plan 2015-2024
Green Water: Drinking Water Supply Topografically, Medan is situated between 37,5
and 2,5 meters above sea level in an area
sloping off towards the north coast. Four rivers
cross the City, which are Sungai Belawan, Sungai
Kera, Sungai Deli and Sungai Percut. River water
is taken upstream for water supply.
In addition there are one natural water source
and one deep well, with a total capacity of 5.247
lps (litres per second). In December 2014,
production was measured at 4.947 lps.
The Provincial Water Enterprise (PDAM)
Tirtanadi serves around 70% of the Medan area
with a piped water system. In 2014, the number
of connections stood at 415,000. Areas not
served by the PDAM get their water from the
ground through wells.
Current water production is 178 metric cubic
meters (MCM) per annum, 130 MCM of which is
sold to customers, leaving 48 MCM per annum
unsold, corresponding to approximately 27%
3 Kukuh Siwi Kuncoro, Bidang Studi Teknik Sistem Tenaga,
Jurusan Teknik Elektro, Fakultas Teknologi Industri, Institut Teknologi Sepuluh Nopember in http://digilib.its.ac.id/public/ITS-Undergraduate-16528-2208100660-Paper.pdf : In Medan, biomass potency from organic waste in 2025 reach 1,190 tons/day, could produce 72,42 GWh / year

11
non revenue water (NRW). Even though
performance is good compared to the majority
of other Indonesian PDAMs, NRW should be
further reduced to counter continuously rising
demand.
Baseline Production
Capacity
% of Population
Served
2015 5.700 lps 70%
Source: PDAM Business Plan 2015-2019
Green Water: Drainage & Flood
Control Meda s drai age a d flood o trol s ste has insufficient capacity to handle floods.
Substantial flooding regularly affects several
subdistricts, engulfing hundreds of houses and
paralyzing traffic along a number of roads. The
worst flood-hit areas are Aur subdistrict and
Medan Maimun district, where the water can
rise to shoulder height. Meanwhile, in other sub-
districts such as Padang Bulang subdistrict and
Medan Baru subdistrict, water can reach one
meter high.
The previous Medan Flood Control and Urban
Drainage Master plan comprised (a) Engineering
Service: Medan City Flood Control Plan Study
(JICA, 1996) and (b) Master Plan: Medan Urban
Drainage Development Program (ADB, 1978).
The Medan floodway was built in the year 2000
through a JICA loan project with a length of 3.9
km located at Titi Kuning at Deli River to
Tembakau area at Percut River, and the Percut
River along 28 km from the estuary with the
flood control scale of a 25-year return period.
Meanwhile, some improvements works of the
Deli River have been executed under the Second
Medan Urban Development Project (MMUDP II)
funded by the ADB loan (1997 – 2002).
A flood control system exists in Medan City as
fllows:
Deli River: from river mouth to Babura River
(24 km), Q design = 465 m3/sec (Q15);
Deli River: from intersection with Babura
River to upstream at DPRD Office, Q design =
230 m3/sec (Q10)
Sikambing River (18 km), Q design = 84
m3/sec (Q10);
Putih River (8 km), Q design = 24 m3/sec
(Q10);
Kera River (4.5 km), Q design = 118 m3/sec
(Q10);
Badera River (17.3km), Q design = 87m3/sec
(Q10);
Serdang River (8.3 km), Q design = 793
m3/sec (Q25).
Green Solid Waste Since 2004, City government has issued various
regulations on solid waste management. Local
enterprises have to submit periodical reports on
the performance of their solid waste
management.
Based on records from the Municipal Cleaning
Agency (DKP) for the first quarter of 2015, the
average daily volume of solid waste stands at
around 1.700 tonnes. It is estimated that about
82% (1.400 tonnes/day) is collected and dumped
in open dump sites. The it s fi al disposal site (TPA) at Terjun area located at Medan Marelan
sub-district has an area of 14 ha, of which about
10 ha has been used up. Waste is piling up to 15
meters above ground level, while part of it has
sunk underneath ground level.
Approximately 500 scavengers operate at the
dump site to collect recyclable plastic and
metals.
There are 30 waste banks in Medan. In those
waste banks, scavengers can deposit a d sa e up aste for money. However, until now the
City has not enacted a policy to force
households to segregate their waste at home,
which would greatly increase the effectiveness
of the waste banks. According the the Ministry
of Environment & Forestry recently, the
Government of Indonesia also aims to establish
parent waste banks in six cities (i.e. Makassar,
Jakarta, Surabaya, Semarang, Surakarta, and
Medan) to coordinate all other subordinate
banks and waste management services in 2016.
Baseline
Tons of
Waste
Installed
Waste management
Capacity
% of SW
treated
2015 TPA Terjun (14 ha)
1,400 tons/day
Open
dumping
Source: DKP Medan City (2015)

12
Green Human Waste About 11,200 customers are connected to the
sewer pipeline system, which is about 2.6% of
the it s population. Wastewater treatment
plant and sewer systems are designed for
60,000m3/day or 30,000 customers.
Currently, wastewater is treated at a rate of
16,000m3/day or 27% of the capacity. This
means that only 33% of the sewer system is
used and 67% is idle. The sewer system is
covering an area of 520 Ha which is also about
2% of the city area. PDAM Tirtanadi has around
300,000 customers for clean water and only 3%
of these customers discharge their wastewater
to the sewer.
Medan City is currently estimated to have about
400,000 septic tank units for domestic
wastewater treatment (bathrooms/WCs/out-
houses). There is currently no effective
regulation in place to ensure that sludge is
siphoned at regular intervals in accordance with
proper waste management standards.
Based on the "Study on Septage Management in
Asia" by USAID (2010), it was found that about
16% of septic tanks in the city of Medan do not
have a watertight base (open bottom), and 40%
of septic tanks are less than 10m from a well or
pumped ground water which are used for
drinking. It is also estimated that about 70% of
septic tanks have contaminated the ground
water. The Indonesian Urban Water, Sanitation
and Hygiene Project (IUWASH - USAID) built
arou d . “ANIMA“ o u al s ste s of communal bio-filter septic tanks in 2012 and
another 4.000 units in 2013.
For a long term program, it also plans to build a
central wastewater treatment plant (WWTP) for
17.000 customers with a daily capacity of 60.000
m3/day that will be managed by PDAM Tirtanadi.
In addition Medan wants to expand on-site
sanitation by building 280 modular human
waste management units (IPAL Komunal)
designed to group householdes into clusters.
Each module will be connected to a disposal
pipe for a cluster of around 100 households. The
contents of the modular septic tanks will be
collected by a desludging truck to be
transported to the WWTP. With this system, it is
hoped that access to sanitation will increase to
60% by the year 2019 by serving around 60,000
households.
Baseline
Daily volume of
human waste (est.)
% access to
sanitation
2015 1.930 ton/day (no data
available)
Source: -
Green Buildings Green buildings have not yet become an
important attribute for green development in
Medan, but that is likely to change in the future
because of its potentially significant contribution
to saving energy (see section on Green Energy)
and other resources such as water, as well as
improving environmental health, thus providing
a safer, environmentally friendly, and a more
productive environment. Initially, public
buildings can acquire green certification
provided by third parties to help make the
concept familiar. In the future, certification
should become a prerequisite for issuing
building permits for any type of construction.
The province of DKI Jakarta has issued Governor
Regulation No. 38 Year 2012 on The Green
Buildings that can be used as an example for
Medan City. So far, Medan City has no Green
Building regulations.
Green Transportation In 2014, there were 5.531.777 registered
motorized vehicles in Medan, almost five times
the number registered in 2000. During the past
14 years, the average annual increase has been
about 12%, with the annual increase between
4% and 17%.
Baseline Number of
Motorized Vehicles
% Of Citizens Using
Public Transport
2015 5.531.777 3.0
Source: BPS Statistics 2015
Green Community Meda s Gree Co u it as esta lished i
i li e ith the Go er e t s Gree Cit Program (P2KH). Its Forum undertook a series of
promotional activities that were packaged under
the theme of Green Festival. It stimulated 30
green communities to participate in green
planning and design, and to create green open

13
spaces in their communities. Several other
initiatives promoting resilient communities are
ongoing including PROKLIM, Sekolah Adiwiyata,
Medan Berhias, Medan Berkebun, and
Komunitas Taman.
Resources The City of Medan currently does not have all
human, financial, institutional, regulatory, and
other resources needed to simultaneously
address all of its green development challenges,
but hopes that this GCAP will adequately
address some of the urgent issues that hamper
sustainable development. The main resource
issues are summarized below.
FISCAL RESOURCES
Medan is still highly dependent on high level
government transfers to their cities budgets.
63% of total budgets came from transfers
between 2011 and 2014. Medan spends only
little over 20% of the budgets available for
capital investments.
Curre tl Meda s yearly budgets are not
enough to finance the preparation of green
capital projects such as BRT dedicated busway
infrastructure, Waste to Energy and others. For
illustration, Medan s udget a aila le for apital expenditures in 2014 was 784 billion Rupiah
(~60 million USD). Little over 8% of this budget
was allocated to transportation (64,2 billion
Rupiah or ~ 4.9 million USD). Estimated CAPEX
for the first phase of BRT is estimated to be
Rupiah 668 billion (~51 million USD) or 85% of
CAPEX available in 2014. In other words, Medan
would need to spend 10 times its allocated
budget for 2014 to realize the BRT.
As part of this GCAP Medan has looked into
ways to improve this situation by:
Increasing own local revenue;
Attracting loans (municipal lending);
Use available funds more efficient towards
green capital projects; and
Attracting alternative sources of finance to
projects, for example by setting-up Joint
Ventures with the private sector, BOT
contracts, involving communities through
cooperatives, etc.
INSTITUTIONAL RESOURCES
Related to attracting alternative sources of
finance Medan has experience with specific
proje ts ater suppl , earl s ut did ot yet use this experience to further expand the
gained knowledge and experience, for example
by setting-up a dedicated unit to advise city
sector departments on opportunities and ways
to apply such mechanisms. While the knowledge
and experience in Medan is considerably higher
than in many other cities, Medan faces the
danger of losing this experience over time after
preparation of specific projects has been
completed.
REGULATORY RESOURCES
Medan still needs regulations that will allow it to
effectively implement and enforce the
environmental issues it wants to address, such
as regulations on water management, transport
management, and waste management. These
will be part of the GCAP.
Conclusion Based on the City Profile, as well as agreed
priorities based on the existing situation and
capabilities, the City of Medan has defined
actions related to prioritised programs and more
generic actions focusing on the short term to
make these programs and projects more
achievable. In the GCAP, actions are formulated
to help improve fiscal and institutional capacity,
create more durable partnerships, strengthen
the regulatory framework and ability to finance
projects, and potentially increase impact of such
projects.
The Profile signals that water supply, sanitation,
transport and waste management are the key
focus areas for the City at the moment and
justifies selection of these programs. In parallel,
Medan should prioritize increasing the budgets
they have available for green capital
expenditures and improve their institutional
capacity and ability (human resources) to
prepare projects so that they can be offered to
involve the private sector and others (such as
national government programs and
development banks) to finance.
This will be further addressed in the next
sections of this GCAP.

14
Green City Development Strategy to 2035

15
Medan Green Urban Development Strategy until 2035 After o pleti g the “OA‘, gree le si g pro ess, sele tio of priorit Progra s goi g fro a lo g list to a short list, the Matrix below summarizes
Meda s green urban development strategy until 2035, showing green attributes and the rough time frame for realizing them. This GCAP specifies green
development actions for the current plan period until 2019, but will be expanded and rolled over to future plan periods.
GREEN ATTRIBUTES 2015-2019 (this GCAP) 2020-2024 2025-2029 2030-2034 2035-2045
1 Green Planning, Finance, and
Implementation Management Continuous
2
Green Open Space (RTH)
(public parks, burial grounds, water
retention areas, greenbelts,etc.)
Program for urban forest development including mangrove areas
Program for acquisition of green open space to meet legal requirements (RTH)
3
Green Community (Resilient
Community)
(includes health care and education)
Continuous (including Program for Green Schools (Sekolah Adiwiyata) and resilient kampungs (PROKLIM)
4 Green Transport & Urban Mobility
(motorized & non-motorized)
BRT system development
Phase 1 (*) BRT system development Phase 2 (**)
5A Green Waste
(sanitation)
On-site sanitation system
development
Program for acceleration of house connections to
central sewerage system
5B Green Waste
(solid waste)
Waste to Energy system
development
6A Green Water
(water supply)
Water supply system
development
6b Green Water
(urban drainage & flood control)
Program for normalization of streams and drains, enlargement of
drainage network, construction of water reservoirs, retention areas,
water absorption wells, etc.
7 Green Building
(energy efficiency, climate resilience)
Program for green certification of buildings, including promotion of roof gardens, hanging
gardens
8 Green Energy
(clean, efficient & renewable)
To be designed in next
phase of the CGAP
9 Green Industry & Commerce
(sound environmental management)
To be designed in next
phase of the GCAP
10 Green Air (Blue Sky)
(emission reduction & control)
To be designed in next
phase of the GCAP
(*) Includes bus lanes, bus stations with digital information displays, ITS, pedestrian walkways and bicyle paths, solar cells traffic lights, solar cell street lighting
(**) Includes additional bus lanes, bus stations with digital information displays, walkways & bicycle paths, and off-street park-and-ride facilities

16
From Long List to Short List A long list of proposed programs (Step 5) was given a code number and ranked with the help of a
Multi-Criteria Analysis (MCA) (Step 6) based on criteria for liveability and sustainability developed by
the Green Team. It subsequently attributed weights to the long list. The result of the weighted MCA
scoring provides a ranked list of 23 Programs as shown on the following page. Listed programs No. 9
to 23 that could not be accommodated in this version of the GCAP will be further specified and
incorporated into future versions.
Long List of 23 Ranked Green Programs
Program
Code Program Title
MCA
weight Ranking
12 On-site sanitation with septic tanks and periodical desludging service 2,84 1
3 Phased conversion to BRT system within 5 years 2,82 2
14 Municipal water supply 2,68 3
1
Pilot project for creating network of pedestrian walksways and
bicycle lanes in shopping centres, educational centres, and city
tourism areas
2,68 4
7 Development of an urban forest including coastal mangrove areas 2,65 5
4 Development of an Intelligent Transport System (ITS) 2,61 6
13 Acceleration of house connections to off-site sanitation 2,57 7
11 PPP for conversion of solid waste to energy using appropriate
technology 2,49 8
23 Establish and Sustain a People Who Care A out the Deli ‘i er movement
2,45 9
15 Normalization of rivers and construction of primary and secondary
drains (Medan Flood Control and Urban Drainage System) 2,41 10
10 Construction of integrated temporary waste disposal sites (TPST)
applying 3R in each village & subdistrict 2,41 11
5 Public transport revitalization 2,39 12
6 Acquisition of land for public green open space (RTH) 2,35 13
21 Development of climate-resillient kampungs (PROKLIM) 2,16 14
9 Green building pilot projects for 10 local government agencies
(SKPD) during 5 years 2,07 15
16 Construction of water reservoirs, retention/detention ponds, and
rainwater absorption wells 1,94 16
2 Advocacy and construction of off-street parking facilities in office
centres, hotels, and commercial centres 1,93 17
20 Education, advocacy and action planning for Green Communities 1,85 18
8 Education, advocacy and planning to persuade citizens to build roof
gardens and hanging gardens 1,83 19
19 Construction of traffic lights using solar cells 1,83 20
18 Conversion to street lighting (LPJU) using solar cells 1,67 21
17 Advocacy for construction of an embankment for the Belawan river
to prevent water intrusion (ROB) 1,63 22
22 Development of schools that apply a green curriculum (Sekolah
Adiwiyata) 1,33 23

17
Priority Green Programs
From the above long list, the top eight (8) priority Programs were selected based on their strategic
importance to green development (Step 6).
Ranking Program
1 On-site sanitation with septic tanks and periodical desludging service (LLTT)
2 Phased conversion to a public Bus Rapid Transit (BRT) system within 5 years
3 Municipal water supply
4 Pilot project for creating network of pedestrian walksways and bicycle lanes in shopping centres,
educational centres, and city tourism areas
5 Development of an urban forest including coastal mangrove areas
6 Development of an Intelligent Transport System (ITS)
7 Acceleration of house connections to off-site sanitation
8 PPP for conversion of solid waste to energy using appropriate technology
1. On-site sanitation with septic tanks and periodical desludging service (LLTT)
The aim of this program is to respond to an urgent need for better sanitation. One way to
protect groundwater from contamination is to free the soil from E.Coli bacteria. It is estimated
that in Medan only 2% of all existing septic tanks are watertight while a centralized sewerage
system still has very limited coverage, with the result that groundwater is polluted. On-site
septic tanks not only need to be made watertight, but their number needs to be greatly
increased to provide access to all low-income citizens. In addition, a regular desludging service
needs to be made available to empty septic tanks.
To achieve this, the community has to be persuaded to install new septic tanks, and repair or
replace unsafe septic tanks to meet national health standards (Standar Nasional Indonesia -SNI)
through advocacy, institutional development, and regulations concerning on-site sanitation
management. In addition, on-site sanitation should be developed as a potentially profitable
private enterprise. As an initial step, the municipality of Medan will build septic tanks that meet
SNI standards in public municipal buildings in Medan as well as in low-income communities
(Masyarakat Berpenghasilan Rendah -MBR) installing 100.000 units in the next 5 years.
2. Phased conversion to a BRT system within 5 years
The aim of this program is to respond to an urgent need for convenient urban mass
transportation. The proposed BRT system is more modern, comfortable, and effective
compared to existing public transport systems that show continuously decreasing rates of
occupancy because of inadequate service quality. This alienates citizens from using public
transport, as demonstrated by a modal shift to private motorized vehicles.
If sufficiently attractive, the proposed program is expected to be able to revive and restore
citizen s i terest i pu li tra sport. It is clear that the initiative has to be supported by quality
transport services and infrastructure.
3. Municipal Water Supply
The aim of this program is to respond to an urgent need for more clean water. Total clean
water production in Medan stands at 5.700 lps, while need for the next 5 years is estimated at
7.500 lps. In the next 2 years an additional 700 lps will be produced, but the shortfall will still be

18
1.100 lps. Thus, water supply needs to be accelerated even though the rivers that cross Medan
do not have sufficient debit anymore to be used as raw water sources.
A new Water Treatment Plant (WTP) is needed outside Medan as part of a regional system
(Sistem Penyediaan Air Minum (SPAM) Regional - MEBIDANG (Medan – Binjai – Deli Serdang) in
the Bingei river with a capacity of 2.000 lps, to be shared between the municipality of Medan
(1.200 lps), the municipality of Binjai (300 lps) and the district of Deli Serdang (300 lps). A
cooperation agreement needs to be made between national government, provincial
government, the municipality of Medan, the municipality of Binjai, and the district of Deli
Serdang (MEBIDANG) that divides responsibilities between the parties, and strengthens
capacity of the Municipal Water Enterprise (PDAM). Development of a Regional Water Supply
System (SPAM) for MEBIDANG requires an investment of Rp. 700 billion, which in turn requires
the participation of a third party considering that current local capability is insufficient, while at
the same time itize s ability and willingness to pay has sufficient elasticity.
4. Pilot project for creating network of pedestrian walksways and bicycle lanes in shopping
centres, educational centres, and city tourism areas
The aim of this project is to respond to an urgent need for better public transport, and to
stimulate the citizens of Medan to use motorized public transport as it becomes more available,
as well as non-motorized transport as an alternative to private motorized vehicles. This will
reduce fuel consumption and improve air quality. The pilot project is part of a broad mass
transportation Program being developed for the City. With the help of IndII Ausaid, the
municipality of Medan will build pedestrian walkways that meet safety standards along main
roads such as Jl. Diponegoro, Jl. K.H. Zainul Arifin, Jl. Sudirman, and Jl. Patimura. Next, the
municipality of Medan is going to expand the pedestrian network as specified in its Spatial
Development Plan (RTRW).
5. Development of an urban forest including coastal mangrove areas
The aim of this program is to respond to an urgent need for more geen public open space in the
densely built city. Development of green open space (RTH) to meet legal requirements will be
done through the creation of urban forest including 110 ha of mangrove area. The problem will
be that a considerable part of that area is in the hands of private enterprises that want to use it
for industrial development. There is need for a clear regulation through a Detailed Spatial Plan
and local regulation (Perda) to protect mangrove areas as urban forest, combined with a clear
roadmap to develop it. If neglected, the area will gradually be used for other purposes.
6. Development of an Intelligent Transport System (ITS)
The aim of this program is to respond to an urgent need to reduce traffic congestion. During
the last five years, the number of motorized vehicles has grown on average 15 % per year. The
problem has now assumed alarming proportions. If there is no significant change in policy and
practice, it is estimated that in the year 2024 traffic will come to a total standstill.
One of the efforts to reduce traffic congestion is to introduce an Intelligent Transport System
(ITS) at intersections. This technology is a continuation and expansion of the ATCS (Area Traffic
Controll System) that has already been installed in 50 intersections in Medan, and is expected
to make a significant contribution to effective traffic management.
7. Acceleration of house connections to off-site sanitation
The aim of this program is to respond to an urgent need for improved sanitation. Human waste
management in Medan currently barely serves 4% of its population, whereas it endeavours to
rea h u i ersal a ess to sa itatio . Meda s target is to ser e 10% of the population with a
piped system by 2019, focusing on the City centre and commercial centres. Swift action is
required to reach this target.
19
Acceleration of service provision is to be achieved by establishing cooperation between national
government, provincial government, and the municipal government to share responsibilities for
planning and construction in 3 areas: Development Area I in East Medan (4 zones from a total of
12 zones), Area II in West Medan (almost 1.200 ha, area based), and Area III in North Medan
(community based). Areas to be developed are selected based on their technical feasilbility to
add 6% service coverage. There will be capacity development in the areas of agency technical
competence in managing sewerage, planning capability, contractor qualifications in system
de elop e t a d ai te a e, as ell as itize s i terest i getti g o e ted.
8. PPP for conversion of solid waste to energy using appropriate technology
The aim of this program is to respond to an urgent need for improved solid waste management.
Introduction of new technologies is expected to become a part of effective solutions in reducing
waste volumes and keeping the environment safe. A mountain of waste in the Terjun final
waste disposal site (TPA Terjun) has reached a hight of 15 metres in an area of 10 hectares.
There is need for waste destruction in Terjun through incineration, with the additional benefit
of creating thermal energy, as sanitary landfill in that location is not a feasible option anymore.
The first step to realizing such a solution is a feasibility study, the second step is to prepare a
public-private partnership, the third step to build an integrated system that ensures sustainable
solid waste management based on waste-to-energy technology for Medan.

20
Final Selection of Priority Programs
After selecting eight priority Programs, the Green Team reported the result to the GCAP Steering
Committee including the Heads of all local government agencies (SKPD) involved (Kepala Bappeda,
Dinas Kebersihan, Dinas Perumahan dan Permukiman, Dinas Pekerjaan Umum, Dinas Tata Ruang
and Tata Bangunan, Badan Lingkungan Hidup, the Direksi PDAM Tirtanadi), and finally had a
consultation with the Regional Secretary (Sekretaris Daerah Kota Medan) as the representative of
the Mayor.
After final consideration of financial, regulatory and institutional risks for implementing each project
and the interfaces and possible synergies between projects, it was concluded that the four Programs
listed below were the most likely to be supported with clear and realistic actions, and therefore
should constitute the GCAP. Only a program on urban forests and coastal mangrove areas, was not
included from the 8 programs initially identified. The 7 other programs were combined in the below
4 projects because the city acknowledged the synergies between them (between BRT, ITS and
pedestrian walkways; SPAM and off-site sanitation house connections).
Ranking Program
1 Construction of a domestic human waste management system with on-site septic tanks and
periodical desludging by trucks (L2T2)
2 Development of an urban Bus Rapid Transit System (BRT) including the programs for ITS and
pedestrian walkways
3 Construction of a solid waste management system using Waste to Energy te h olog
4 Increase the regional supply of clean water (SPAM Regional Medan – Binjai – Deli Serdang
(Mebidang)

21
The Next Five Years – Priority Programs,
Projects & Actions

22
Introduction This section describes the prioritized programs, projects and actions we will undertake in the next
five years. It also describes the institutional set-up we will implement to ensure informed and timely
decision making and careful management of the interfaces between different projects. To avoid
misunderstandings, we include a short list of definitions of key terms used in this section.
Program An initiative for pro oti g gree de elop e t ha i g stated goals that at h the it s vision and
mission. A program normally comprises a number of projects that have clear interfaces, and is
formulated in a Program Brief or Digest.
Project An investment in a physical infrastructure project, or the creation of a new organization, or a policy
revision, or a local regulation, to be formulated in a Project Brief. If the project (such as establishing
a new body or policy) is subsidiary to another project, it is understood to be a sub-project or action.
Action In the context of the GCAP, actions comprise one or more activities required to meet the conditions
for project implementation, such as setting up a Project Management Unit (PMU), preparing a
project implementation plan (PIP), preparing Terms of Reference, identifying sources of financing,
acquiring land, etc.
Project Management Unit (PMU) A temporary organizational unit created for the purpose of preparing a project implementation plan,
and managing the project on a day to day basis. A PMU is headed by the agency responsible for the
project. An operational budget for the PMU needs to be allocated. Representatives of relevant
SKPDs, other agencies and possibly representatives of the community can also be members of the
PMU. The PMU will consider whether or not alternative implementing mechanisms (BOT, Joint
venture, CSR, etc.) will be considered in the feasibility study, but also the actions related to changing
or implementing regulations (Perda), issuing permits, etc.
Project Implementation Plan (PIP) A document that describes in detail the actions needed for implementing the project, including
preparatory activities. The PMU should be in charge of preparing and managing it. It covers the
project cycle -a sequence of events and activities usually starting with a feasibility study, project
design, financing, land acquisition, tendering, procurement, construction supervision, monitoring
and evaluation, as well as operation and maintenance. It clearly describes the division of
responsibilities, timeline and budgets needed. It specifies what decisions are needed, when, and by
whom. A project is normally undertaken by a contractor, government department, a combination of
public and private actors, a consortium, etc. Different actors can be responsible for different parts
of the project cycle. The PMU will update the PIP over the course of developing the project. At the
start, the PIP will focus on the activities to prepare a detailed design, feasibility study and tender
strategy. Based on the choices made related to the implementing mechanisms (traditional, PPP, joint
venture, communities, etc.), the PIP can be further detailed for procurement, construction and
O&M.

23
Institutional Ena ling A tions for Green Tea and
PMUs We will use the results of the Green Cities Program (Asian Development Bank, Bappenas,
Kementerian PUPR) as a starting point to further intensify our efforts to transform Medan into the
greenest city in Indonesia. On top of the specific actions we have formulated for prioritized
programs and projects, we intend to further improve the institutional set-up needed for a well-
informed and timely decision making process.
A Steering Committee (SC) will monitor and guide the progress on GCAP and actions on a quarterly
basis. The Mayor will chair the SC that further consists of heads of SKPDs in the field of green
attri utes, a d other stakeholders. As hair of the Gree Tea , the head of Bappeda will keep the
Mayor informed about the progress to enable the Mayor to make decisions when needed.
The Gree Tea ill oordi ate progra s a d proje ts a d the i terfa es et ee progra s a d projects. They will also update the GCAP e er ears. The Gree Tea will meet bi-weekly to
monitor progress on specific projects and actions. Those in charge of specific programs and projects
ill i for the Gree Tea a out their progress a d spe ifi issues, de isio s or guida e they
eed. The Gree Tea ill deter i e the age da for eeti gs ith the “C a d prepare these meetings. Specific taskforces (PMU) will be set-up to drive the implementation of programs and
projects on a day to day basis. The taskforces will be made up of representatives of relevant SKPDs
and other agencies and led by the agency/ body responsible for the sector.
Institutional Enabling Actions
What? Who? When?
Mayoral Decree on set-up a d i stallatio of “C a d Gree Tea i l. des riptio of roles, SOP, membership and
budgets.
Mayor Update in 2106
Co ti uatio of Ma or s de ree i ludi g udget allo atio Head of Bappeda annually
Work-pla Gree Tea i ludi g i itiati g the set-up of
specific taskforces/ PMUs for agreed projects
Gree Tea as and when
required
E aluatio of perfor a e of Gree Tea Steering Committee bi-yearly
Steering
Committee
Gree Tea
Taskforce / PMU
– Waste
Taskforce / PMU
– Water
Taskforce / PMU
– Green taxes
Monitoring
/ guidance
Progress/
reporting
Taskforce GCAP
Mayor Informs / key
decisions
Monitoring/ guidance Progress/ reporting

24
Green Waste – Action Plan
Program: Improvement of on-site
sanitation system

25
Green Waste – Action Plan
Program: Improvement of on-site sanitation system
Why? It is estimated that currently our city has 400,000 septic tanks for domestic wastewater treatment.
However, based on the "Study on Septage Management in Asia" by USAID (2010), it was found that
around 16% of septic tanks in the city are not properly constructed (and are essentially acting as
soak-pits), and 40% of septic tanks are less than 10m from a well or pumped ground water which are
used for drinking. Currently, there is no effective regulation in place to ensure that sludge (or
septage) is removed (pumped) at regular intervals, and the operation of tankers for septage
pumping is not well managed. As a result of both poor construction and operation, it is also
estimated that about 70% of septic tanks have contaminated the ground water. The direct
relationship between diseases such as cholera, hepatitis and dysentery and the unrestricted
discharges of residential sewage is well documented and therefore this program aims to improve a
city-wide system for management of on-site sanitation.
Current status To increase coverage, the City Government of Medan has already decided to develop a new
city-wide sanitation strategy, and will reactivate its Sanitation Working Group that has existed since
2010. It is planned that in 2016 the responsibility for septage pumping is transferred from the City
Cleaning and Landscaping Agency (DKP) to the Provinvial water supply company, PDAM Tirtanadi, in
order to improve management by combining collection of drinking water and wastewater (sewerage
system) and septage management (regular septic tank desludging management).
Goal The main objective of this program is to provide by 2020 regular services to desludge human waste
(septage) from individual septic tanks and improve facilities for individual household and communal
septic tanks which are viable and meet technical and environmental requirements. A number of
parallel activities are required to support this main goal including the passage of a septage
management law, the provision of a fleet of septage pumping trucks, construction of a new STP
(Septage Treatment Plant), some restructuring of institutional responsibilities, and capacity
development. A further objective is to provide full cost recovery of staff and operational expenses.
Results I. A sanitation baseline and monitoring plan for Medan City to evaluate on-site sanitation
services and other environmental conditions.
II. Provision of 100,000 impermeable septic tanks in 5 years.
III. PDAM Tirta adi s orga izatio stre gthened (i.e. Directorate of Wastewater) to implement
regular desludging management system for the entire City.
IV. Educated population of Medan through social media to use, and pay for, the septage
desludging services.
V. A new septage treatment facility to receive pumped septage.
Benefits I. Reduces the sanitation impact on both groundwater and surface water and thus on human
health.
II. Strengthens resistance to ecological hazards.
III. Provides a public service that is efficient and reliable.

26
IV. Provides regulatory and management oversight for the septic tank design, construction, and
use of septic tanks as well as septage transportation, treatment and disposal.
Success indicators (targets)
Unsealed septic tanks
2010 16%
2020 0%
Septage pumping customers
2015 9,000
2020 40,000
Key risks Even though the projects are relatively well defined, the technology is straightforward, and the
capacity is there to deliver them, key risks are:
1. Delayed approval of the regulation and law governing off-site sanitation;
2. Cooperation between the City, PDAM and the Provincial Government of North Sumatra is
not guaranteed yet
3. Low interest of the community on aspects of septic tank sanitation is not easily improved
and may slow down implementation.
4. Potential displacement of trained staff from one unit to another unit or moving to another
Department may slow down implementation. The process for training staff members is very
slow.
Risk mitigation These risks can be mitigated to the extent possible by prioritizing the following measures and
allocating sufficient resources to their implementation:
1. Implement regulatory updates as soon as possible while local political will is present (before
policy / regime changes occur).
2. Establish a working group to coordinate this program and other sanitary activities.
3. Undertake a social marketing strategy to engage citizens in environmental aspects of
sanitation and disseminate information.
Project SAN1: Prepare a Sanitation Baseline, Monitoring Plan, and establish a Sanitation Working Group to
coordinate monitoring and related projects.
It is necessary to create and establish a sanitation baseline for the City to help evaluate progress under this
program and develop projects to address other specific issues which become apparent to reduce the
environmental impact of the City and help achieve our Green Vision.
This project will be led by Bappeda and future annual monitoring will occur according to an agreed monitoring
plan.
The indicators under this program (percent of sealed septage tanks, and number of septage desludging
customers) will be included, and the following indicators may also be established:
Number of households using flush toilets
Connections to piped sewerage
Number and construction type of septic tanks
Water quality (biological and chemical) monitoring at selected indicator wells/boreholes and/or streams.
Occurrence of waterborne diseases among residents.
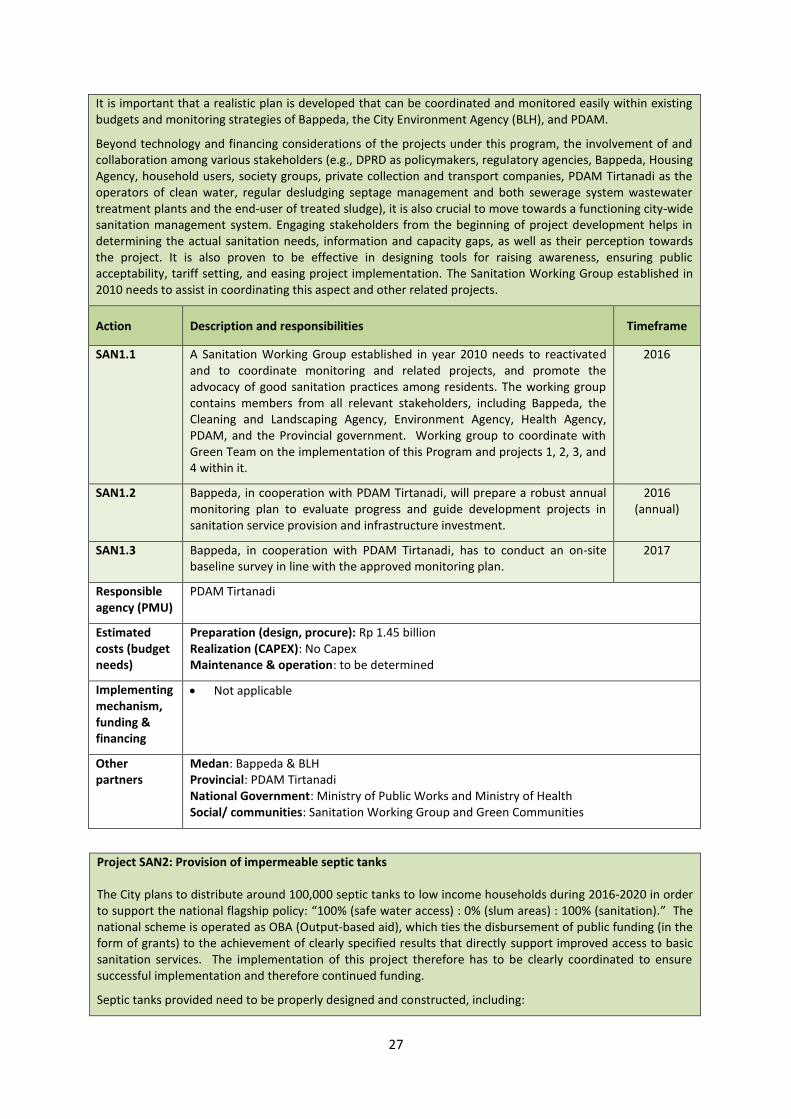
27
It is important that a realistic plan is developed that can be coordinated and monitored easily within existing
budgets and monitoring strategies of Bappeda, the City Environment Agency (BLH), and PDAM.
Beyond technology and financing considerations of the projects under this program, the involvement of and
collaboration among various stakeholders (e.g., DPRD as policymakers, regulatory agencies, Bappeda, Housing
Agency, household users, society groups, private collection and transport companies, PDAM Tirtanadi as the
operators of clean water, regular desludging septage management and both sewerage system wastewater
treatment plants and the end-user of treated sludge), it is also crucial to move towards a functioning city-wide
sanitation management system. Engaging stakeholders from the beginning of project development helps in
determining the actual sanitation needs, information and capacity gaps, as well as their perception towards
the project. It is also proven to be effective in designing tools for raising awareness, ensuring public
acceptability, tariff setting, and easing project implementation. The Sanitation Working Group established in
2010 needs to assist in coordinating this aspect and other related projects.
Action Description and responsibilities Timeframe
SAN1.1 A Sanitation Working Group established in year 2010 needs to reactivated
and to coordinate monitoring and related projects, and promote the
advocacy of good sanitation practices among residents. The working group
contains members from all relevant stakeholders, including Bappeda, the
Cleaning and Landscaping Agency, Environment Agency, Health Agency,
PDAM, and the Provincial government. Working group to coordinate with
Green Team on the implementation of this Program and projects 1, 2, 3, and
4 within it.
2016
SAN1.2 Bappeda, in cooperation with PDAM Tirtanadi, will prepare a robust annual
monitoring plan to evaluate progress and guide development projects in
sanitation service provision and infrastructure investment.
2016
(annual)
SAN1.3 Bappeda, in cooperation with PDAM Tirtanadi, has to conduct an on-site
baseline survey in line with the approved monitoring plan.
2017
Responsible
agency (PMU)
PDAM Tirtanadi
Estimated
costs (budget
needs)
Preparation (design, procure): Rp 1.45 billion
Realization (CAPEX): No Capex
Maintenance & operation: to be determined
Implementing
mechanism,
funding &
financing
Not applicable
Other
partners
Medan: Bappeda & BLH
Provincial: PDAM Tirtanadi
National Government: Ministry of Public Works and Ministry of Health
Social/ communities: Sanitation Working Group and Green Communities
Project SAN2: Provision of impermeable septic tanks
The City plans to distribute around 100,000 septic tanks to low income households during 2016-2020 in order
to support the national flagship policy: 100% (safe water access) : 0% (slum areas) : 100% (sanitation). The
national scheme is operated as OBA (Output-based aid), which ties the disbursement of public funding (in the
form of grants) to the achievement of clearly specified results that directly support improved access to basic
sanitation services. The implementation of this project therefore has to be clearly coordinated to ensure
successful implementation and therefore continued funding.
Septic tanks provided need to be properly designed and constructed, including:

28
Proper sizing for appropriate detention time and volume;
Suitable elevation above groundwater level
Suitable inlet and outlet structures;
At least one baffle separating the tank into multiple compartments; and
Sealed tanks with access to each compartment to allow for inspection and pumping.
Action Description and responsibilities Timeframe
SAN2.1 Establish a project management unit (PMU) within the Housing Agency to
coordinate the project and work with Bappeda to secure OBA central
government funding for the project (i.e. sources from APBN and DFAT [Indii-
Ausaid])
2016
SAN2.2 Housing Agency (with support from Bappeda) to prepare TOR for design
study for appropriate impermeable septic tanks design.
2017
SAN2.3 Tender and appoint a specialist consultant to develop appropriate generic
designs for a variety of real situations. Consultant to work with relevant City
stakeholders in developing designs, including the environment agency,
highways agency, social groups etc.
2017
SAN2.4 Housing Agency to hire a specialist contractor to fabricate 100,000
impermeable septic tank units following SNI Number: 03-2398-2002.
2017
SAN2.5 Achieve construction permits and install 20,000 septic tanks per year, with
an initial focus on poor and vulnerable households.
2017-20
Responsible
agency
Medan Housing Agency
Estimated
costs (budget
needs)
Preparation (design): Rp 1.75 billion
Realization (construction): Rp 5 billion
Maintenance & operation: See Project SAN3
Implementing
mechanism,
funding &
financing
Traditional procurement
Funding by ABPD I and APBD II
Other
partners
Medan: Bappeda, Sanitation Working Group.
Private sector: Design consultants, Fabrication company.
Provincial: PDAM regarding design for pumping access.
Social/ communities: Poor communities and households regarding appropriate design.
Project SAN3: Establish regular septage pumping (desludging) and management system
The provision of regular septage desludging management services is one of the development challenges for
the a hie e e t of the 7 “DG “ustai a le De elop e t Goals a d the I do esia s atio al flagship 100%:0%:100%. In the short term, septic tanks will remain the principal form of urban sanitation in Medan as
the sewer network is not extensive. Septic tanks require regular removal of septage. Without coordinated
septage management, Project 2 (provision of improved tanks), will not result in improved sanitation, health,
and environmental protection – as monitored under project 1.
It is important that these services are implemented in a coordinated and holistic way including institutional
and cost recovery aspects to provide a sustainable service to the residents of Medan. It is planned to transfer
the responsibility for collection and disposal of waste to PDAM, as they are best placed to manage such
operational activities from a technical perspective.

29
Action Description and responsibilities Timeframe
SAN3.1 To promote sustained operation and enable this off site sanitation program,
Medan city government will draft and adopt, through its legislative body
(DPRD), a local regulation (Perda detaili g Meda it s “eptage Management System. The regulation will state the rationale, user fees,
operation, management (roles and responsibilities), and penalties. Unless
otherwise repealed or amended, the septage management ordinance
remains valid, thereby ensuring sustained operation.
2016
SAN3.2 Establish a Memorandum of Agreement between the City and PDAM that
future septage pumping (collection) and management will be undertaken by
PDAM Tirtanadi.
2016
SAN3.3 In 2016, the City Cleaning and Landscaping Agency (DKP) will transfer
responsibilities for the management of domestic septage waste to PDAM
Tirtanadi, which currently manages off-site sanitation (centralized sewage).
This includes the transfer of their existing septage pumping trucks to PDAM.
2016
SAN3.4 The City government will acquire additional septage pumping trucks (2 per
year) from The Ministry of Public Works under a grant to the City who will
then hand them over to PDAM Tirtanadi.
2017
(annual)
SAN3.5 PDAM Tirtanadi will establish an internal operation unit to manage and
conduct septage collection (every 2 years) and disposal.
2017
SAN3.6 PDAM will prepare and approve standard operational procedures (SOP) in
PDAM for septage management.
2017
SAN3.7 PDAM will train staff in latest septage management and disposal options,
including developing managerial capacity particularly with respect to asset
management, cost recovery, and efficient service delivery - according to
performance targets and in responding to customer concerns. Technical
training will also need to be delivered to the operation unit in the physical
operation of the truck and ancillary equipment (valves, pumps etc).
2017
SAN3.8 The Sanitation Working Group, established under project 1, will coordinate a
social marketing and public awareness campaign with PDAM to raise
awareness of the benefits of improved sanitation, ensure public acceptability
of regulations and tariffs, and ease project implementation.
2017
SAN3.9 PDAM will coordinate with the City government to review and set tariffs
(including for adjoining municipalities) and establish a system to recover
operational costs from user fees (septage pumping).
2017
SAN3.10 Explore the opportunity to establish household sanitation revolving funds for
low costs septic tank and construction and public toilets.
2017
SAN3.11 Consider utilising private sector companies to provide efficient septage
collection and transport services.
2018
SAN3.12 PDAM Tirtanadi will establish wastewater and septage quality testing
facilities and trained staff at PDAM Tirtanadi
2018
SAN3.13 It is planned that the Province of North Sumatra will develop a new
independent septage treatment facility (Project 4) at the Cemara area. In the
interim PDAM will utilize Cemara WWTP for septage disposal, which has
been using only ±30 % of its design capacity of 60,000 cubic metres per day.
2017
Responsible
agency
PDAM Tirtanadi

30
Estimated
costs
Preparation (design): Rp 1.65 billion
Realization (construction): Rp 6 billion
Implementing
mechanism,
funding &
financing
OBA (Government Grant) for equipment
Improved cost recovery for financing operational improvements
International Technical Assistance for Capacity Development and Training.
Private sector contractors to provide efficient septage pumping and transport services.
Other
partners
Medan: Sanitation Working Group, Bappeda, DKP (transfer of vehicles and responsibilities),
Environment Agency (regarding advocacy)
Regional: Other municipalities (regarding tariff setting)
Social/ communities: Green Communities, social groups such as the Lions Club and AKKOPSI,
users, poor households.
Private sector: for septage collection and transport.
International: Technical assistance for capacity development and training.
Project SAN4: Build a new Septage Treatment Facility and Disposal
An independently managed septage treatment plant (STP) will be designed and built by Dinas Tarukim of the
Province of North Sumatera. Factors influencing the design include climate, septic tank size, design, user
habits, pumping frequency, water supply characteristics, piping material, and the use of water-conservation
fixtures, garbage disposals, and household chemicals.
By liaising with Bappeda to ensure this project is in the medium term development plan (RPJMD) for the City,
national (ABPN) government funding can be obtained if a feasible project proposal is prepared. Collaboration
between the Provincial Government, the City Government and PDAM is therefore necessary.
The normal project cycle including feasibility study, design, permitting, procurement and construction
processes should be followed in implementing this project.
Environmental impact of outflows shall be mitigated through thorough EIA and design, and land acquisition
and social impact should be considered in early project development.
Action Description and responsibilities Timeframe
SAN4.1 Establish a PMU to prepare a project implementation plan and coordinate
with City Agencies and other stakeholders.
2016
SAN4.2 PMU to draft the specific requirements of the facility and TOR for
undertaking a feasibility study, including outline design and cost estimates.
2017
SAN4.3 PMU to commission feasibility study including outline design and cost
estimates. The feasibility study will include consideration of tipping fees (for
disposal of septage through PDAM, and potentially future private operators)
as well as EIA and social impact assessments.
2017
SAN4.4 Obtain approval of the project and ABPN grant funding in coordination with
Medan Bappeda.
2017
SAN4.5 Provincial Government will implement land acquisition and clearance 2017
SAN4.6 Preparation, tendering and award of Design and build contract. 2018
SAN4.7 Endorsement of construction permits. 2018
SAN4.8 Construction management and commissioning of new septage treatment
facility.
2018-20

31
Responsible
agency
Dinas Tarukim of the Province of North Sumatera
Estimated
costs (budget
needs)
Preparation (design): Rp 1.5 billion
Realization (construction): Rp 15 billion
Maintenance & operation: to be determined
Implementing
mechanism,
funding &
financing
Traditional procurement
Funding by ABPN
Other
partners
Medan: Medan Bappeda
Regional: PDAM Tirtanadi
Private Sector: Design consultants and construction contractors
Social/ communities: Landowners

32
Green Transport – Action Plan
Program: Develop ent of Medan’s Bus Rapid Transit System (BRT)

33
Green Transport – Action Plan
Progra : Develop e t of Meda ’s Bus Rapid Tra sit “yste BRT
Why? Our city is suffering from growing traffic congestion and air pollution. This is caused by a rapid
increase of motorized vehicles (currently over 5 million, fivefold in comparison to 2000) and a low
share of public transport (1.3% of total vehicles). The situation is urgent given the expected
population growth from 2.76 million in 2015 to 4 million in 2025.
Medan does not have a public transport company. Small buses (angkots), motor- and car taxis are
owned by small companies and individuals. This decentralized system makes it impossible to work
on solutions that can improve the public transport system in a structural way. A solution is needed
that will improve traffic conditions and allow our citizens to travel comfortably, safely and reliably.
Continued reliance on private motorized transportation is deemed unsustainable. The SOAR analysis
done as part of GCAP preparation concluded that citizens want clean, safe and healthy public
transport as part of local economic and social development as well as environmental sustainability.
The green benefits include reduced congestion, reduced pollution, improved road safety, and
improved mobility.
Current status of planning and decision-making on the proposed BRT We prepared a Mass ‘apid Tra sport “ ste “AUM for Meda Cit i a d a transport
master plan Sustainable Urban Transport Improvement Project “UTIP i 2014. The Masterplan
showed that a city wide Bus Rapid Transit system (BRT) is an important pillar to structurally improve
traffic conditions. It enables citizens to reach key destinations by means of air-conditioned buses
that use dedicated bus lanes and have traffic light priority (ITS system) thus allowing comfortable
and reliable travel. The masterplan contains a lay-out for the city-wide BRT that can serve as a
blueprint for its phased implementation.
Goal Based on the masterplan, we decided to prepare implementation of the first phases for BRT in the
coming years. In parallel, we want to set-up a public transport company that will manage and
operate the BRT as well as the fleet of buses.
Expected Results When the Program is completed comprising Phase 1 & 2, the proposed BRT will have three main
components: (I) physical infrastructure, (II) a BRT management body, and (III) an operational fleet of
buses.
1. Infrastructure with the following components:
A. Phase I: The corridor Masjid Raya – Carrefour (12 km of bus lanes); Phase 2: expansion
from Masjid Raya to Amplas (6 km) and from Carrefour to Pinang Baris section (5 km).
B. Pedestrian paths along the BRT corridor that provide easy access to the stations (around
46 km of new walkways for Phase 1 & 2).
C. Phase 1: 32 bus stations with digital public information displays for corridor Masjid Raya
– Carrefour; Phase 2: 22 additional bus stops with digital public information displays.
D. A auto ated s art traffi light s ste IT“ prioritizi g uses to e sure relia le
travel times for Phase 1 & 2.

34
E. Off-street Park & Ride facilities that will allow citizens and commuters to continue their
journey by BRT and reach their destination quicker (a pilot project in Amplas and Pinang
Baris will be part of Phase 2).
2. Public transport organization with the following components:
A. A usi ess pla ased o the Dire t “er i e s ste . B. An electronic ticketing system (smart payment system) based on the Direct Service
system to optimize service efficiency.
C. A company (Medan Public Transport Company or MPTC) responsible for operating the
bus services and marketing with the aim of optimizing service levels and use of the
system. The existing Medan Municipal Enterprise (BUMD) "PD Pembangunan" is a
possible candidate because it already has experience with managing 2 stations in Amplas
and Pinang Baris (1970-1991). If ticket sales revenues allow for it, responsibilities might
include maintenance of stations and bus lanes.
3. Efficient bus fleet and unified operating system operated by the MPTC, with the intention
of modernizing and increasing the fleet over time, and gradually replacing diesel-fuelled
buses with hybrid ones or buses running on electricity or gas only. Current operators of
smaller vehicles (angkot, becak bermotor and taksi) will be incentivized (and regulated) to
join the new public transport company. They should benefit from this change, for example
by a financing mechanism that would make it possible for small operators to join forces and
jointly operate new bigger buses on the dedicated lanes.
Expected Benefits 1. Improved urban mobility both for long distances (buses) and short distances (pedestrian
walkways) for citizens. This will improve time spent on travel, and improve access to places
of employment. There are 600,000 commuters per day to Medan from surrounding cities
that can be considered as potential BRT customers;
2. Improved road safety and security for passengers and pedestrians alike with a positive
impact on quality of life;
3. Reduced air pollution with a positive impact o the ualit of life a d itize s health; 4. ‘edu ed ar o e issio s o tri uti g to I do esia s o it e t to the UN-FCCC; and
5. Economic opportunities for lower and middle class citizens, for example better business
outlooks for current operators of angkot and taksi as well as economic activities around
stations in transit-oriented development (TOD).
Key Risks and Mitigation An initial risk assessment informed us about the key risks of introducing the BRT in Medan:
1. BRT is new for Medan. Limited knowledge and capacity to implement a BRT can result in
delays, cost overruns and poor implementation. To mitigate this risk, the management of
interfaces between different technical projects and between infrastructure delivery and
setting up the Transport Company deserves special attention. The need for capacity building
and consultant assistance will be further detailed in the project implementation plan (PIP).
2. The B‘T has sig ifi a t i pa t o Meda s o u ities, espe iall urre t operators of smaller vehicles (angkot, taksi) that has the potential to cause considerable resistance. To
mitigate this risk, the project implementation plan (PIP) for the Medan Public Transport
Company needs to involve them in designing appropriate mechanisms for association and/or
integration into the BRT system.
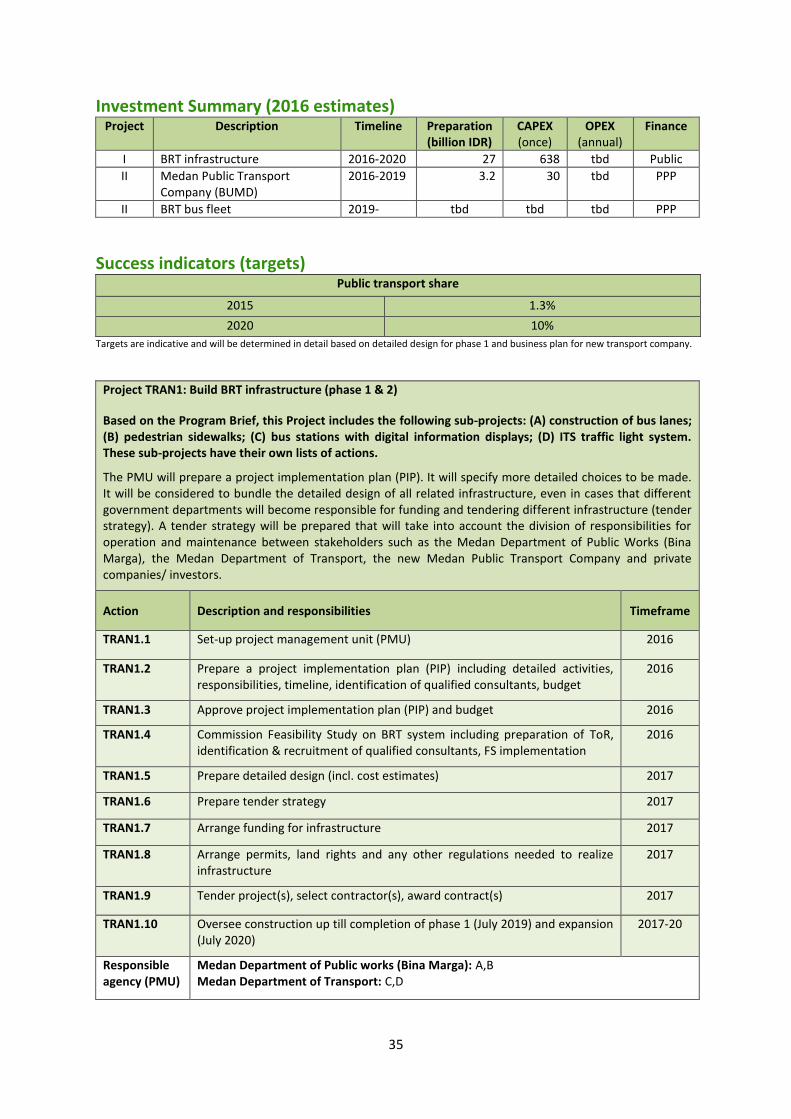
35
Investment Summary (2016 estimates) Project Description Timeline Preparation
(billion IDR)
CAPEX
(once)
OPEX
(annual)
Finance
I BRT infrastructure 2016-2020 27 638 tbd Public
II Medan Public Transport
Company (BUMD)
2016-2019 3.2 30 tbd PPP
II BRT bus fleet 2019- tbd tbd tbd PPP
Success indicators (targets) Public transport share
2015 1.3%
2020 10%
Targets are indicative and will be determined in detail based on detailed design for phase 1 and business plan for new transport company.
Project TRAN1: Build BRT infrastructure (phase 1 & 2)
Based on the Program Brief, this Project includes the following sub-projects: (A) construction of bus lanes;
(B) pedestrian sidewalks; (C) bus stations with digital information displays; (D) ITS traffic light system.
These sub-projects have their own lists of actions.
The PMU will prepare a project implementation plan (PIP). It will specify more detailed choices to be made.
It will be considered to bundle the detailed design of all related infrastructure, even in cases that different
government departments will become responsible for funding and tendering different infrastructure (tender
strategy). A tender strategy will be prepared that will take into account the division of responsibilities for
operation and maintenance between stakeholders such as the Medan Department of Public Works (Bina
Marga), the Medan Department of Transport, the new Medan Public Transport Company and private
companies/ investors.
Action Description and responsibilities Timeframe
TRAN1.1 Set-up project management unit (PMU) 2016
TRAN1.2 Prepare a project implementation plan (PIP) including detailed activities,
responsibilities, timeline, identification of qualified consultants, budget
2016
TRAN1.3 Approve project implementation plan (PIP) and budget 2016
TRAN1.4 Commission Feasibility Study on BRT system including preparation of ToR,
identification & recruitment of qualified consultants, FS implementation
2016
TRAN1.5 Prepare detailed design (incl. cost estimates) 2017
TRAN1.6 Prepare tender strategy 2017
TRAN1.7 Arrange funding for infrastructure 2017
TRAN1.8 Arrange permits, land rights and any other regulations needed to realize
infrastructure
2017
TRAN1.9 Tender project(s), select contractor(s), award contract(s) 2017
TRAN1.10 Oversee construction up till completion of phase 1 (July 2019) and expansion
(July 2020)
2017-20
Responsible
agency (PMU)
Medan Department of Public works (Bina Marga): A,B
Medan Department of Transport: C,D

36
Estimated
costs (budget
needs)
Preparation (design, procure): ~ Rupiah 27 billion
Realization (CAPEX): ~ Rupiah 638 billion
Maintenance & operation: to be determined
Impl.
mechanisms,
funding &
finance
Traditional procurement (no alternative mechanism)
Public funding by APBN, Ausaid (Indii, for pedestrian walkways) and APBD II
Other
partners
Medan: Medan Bappeda, Office of Bina Marga, Office of Perkim, Environmental Agency,
Department of Housing and Settlement (builds park & ride facilities), Department of Parks
(prunes the trees along the BRT corridor), Environmental Agency (environmental
documents and environmental permits)
Central government: National Transport Authority, Department of land transportation
(Ministry of transportation), Organda (Land Transport Organization)
Private sector/ government enterprises: newly formed Medan public transport
organization (BUMD PD Pembangunan), private operators (BRT Bus Manager, parking
management)
Social/ communities: citizens of Medan (transport master plan and detailed design of
phase 1 infrastructure)
Project TRAN2: Establish Medan Public Transport Company (BUMD)
Based on the Program Brief (attached), this Project includes the following sub-projects: (A) Medan Public
Transport Co pany (MPTC ; (B Business Plan for B‘T Dire t “ervi e’ system (expanded in Project 3); (C)
“ art Pay ent’ syste to i ple ent the Dire t “ervi e’ syste ; and (D Pu li ‘elations & Infor ation system. These sub-projects have their own lists of actions.
The MPTC will manage, operate, promote and market the BRT service and bus fleet The business plan for the
company will include details about the goals, responsibilities, management structure and operating
procedures including possibly managing, maintaining and operating bus stations and bus lanes. The smart
payment system will optimize service efficiency and effectiveness. Choices made by the PMU have a direct
relation with the tender strategy for infrastructure (Project 1) and buses (Project 3) and will be monitored by
the Green Team for consistency.
Action Description and responsibilities Timeframe
TRAN2.1 Set-up project management unit (PMU) 2016
TRAN2.2 Prepare project implementation plan (PIP) for preparing (a) business plan
ased o dire t ser i e odel, s art pa e t s ste , pu li relatio s & information system, and (d) creating Transport Company including
detailed activities, responsibilities, timeline, need for consultants, budget
2016
TRAN2.3 Approve project implementation plan (PIP) and budget 2016
TRAN2.4 As far as not yet done (see GIZ support below), commission preparation of a
Business Plan for the MPTC including preparation of ToR, identification and
recruitment of qualified consultants, implementation of FS
2016-17
TRAN2.5 Commission the drafting of an Academic Paper as the basis for drafting a
Local Regulation on BRT and the MPTC
2017
TRAN2.6 Get Local Regulation on BRT and the MPTC approved by City Council 2017
TRAN2.7 Prepare selection mechanisms for operating Transport Company 2017

37
TRAN2.8 Arrange funding for the MPTC (both upfront investments for set-up, office
infrastructure, as well as electronic ticketing system for operational budgets;
funding requirement is subject to results of the business plan; possibly MPTC
will be responsible for maintaining infrastructure as well)
2017
TRAN2.9 Public tender and selection of MPTC operator 2018
TRAN2.10 Set-up the MPTC so that it is able to manage and operate the BRT system
phase 1 in July 2019.
2018-19
Responsible
agency
Medan Department of Transportation: Prepare business plan and select operating entity
(Director of newly formed Medan Public Transport Company (BUMD PD Pembangunan?):
set-up Medan Public Transport Company including operating procedures with other
stakeholders involved (Public Transport Department Bina Marga, private sector bus
operators, etc.)
Estimated
costs (budget
needs)
Preparation (business plan, selection): ~ Rupiah 3,2 billion
Realization (start-up capital for Transport Company): ~ Rupiah 30 billion
Maintenance & operation: to be determined
Impl.
mechanisms,
funding &
finance
GIZ is supporting the preparation of the business plan for the BUMD.
Local Government Enterprise: BUMD (alternative mechanism)
Funding by APBN, and APBD II. Business plan will be used to research if private sector
investments in buses and stations are possible
Other
partners
Medan: Bappeda of Medan City, Dinas Perhubungan(Transport Department) of Medan
City;
Central government: Directorate General of Land Transportation
Private sector/ government enterprises: private operators (BRT Bus Manager, parking
management)
Social/ communities: citizens of Medan (market research)
Project TRAN3: Manage BRT fleet as a unified system
Based on the Program Brief (attached), this Project includes the following sub-projects: (A) bus fleet
management by the MPTC); (B) engagement of private sector partners/operators; (C) investments in new
technology (clean propulsion, digital information). These sub-projects have their own lists of actions.
This project is an integral part of the business plan for the MPTC described in Project 2, and part of its
responsibility to manage the bus fleet. We include this as a separate project to emphasize its importance.
It is our ambition to increase profitability of the fleet, as well as the number of green buses (running on
electricity or gas) over time as part of our continuous effort to improve fleet management.
Action Description and responsibilities Timeframe
TRAN3.1 As part of the business plan, the MPTC sets up a project management unit
(PMU) to develop a unified fleet operation system for the BRT
2016-17
TRAN3.2 Approve project implementation plan (PIP) and budget 2017
TRAN3.3 Identify and hire consultants to design a system for unifying existing formal
and informal operators within the overall public transport system
2017
TRAN3.4 Negotiate with, and prepare interested informal smaller operators to join
the MPTC to become part of the BRT system under MPTC management
2017-18
TRAN3.5 Create a network of feeder buses for informal operators who do not want to
join the BRT system, and regulate these operators through a system of
incentives and disincentives to bind them contractually into the overall
public transport system
2018-19

38
TRAN3.6 Commission the drafting of an Academic Paper as the basis for drafting a
Local Regulation on unified bus fleet operation
2017
TRAN3.7 Get Local Regulation on unified bus fleet operation approved by City Council 2018
TRAN3.8 Promote engagement of new qualified private sector operators interested in
operating buses or managing other parts of the BRT system
2018-19
TRAN3.9 Acquire buses as needed on a grant basis from the Ministry of
Transportation, BPJS and Medan City
2018-20
TRAN3.10 Renew and expand the bus fleet as required, and invest in new technology
such as clean engines and smart digital systems to keep the fleet clean, safe
and healthy
2019-20
Responsible
agency
Medan Department of Transportation: Prepare this project as an integral part of the
business plan for the Public Transport Company and select operating entity
(Director of newly formed Medan Public Transport Company (BUMD PD Pembangunan?):
set-up Medan Public Transport Company including expansion strategy, mechanisms,
regulations and procedures for bus fleet
Estimated
costs (budget)
See project 2 (Medan Public Transport Company)
Implementati
on
mechanisms,
funding &
finance
GIZ is supporting the preparation of the business plan for the BUMD.
Local Government Enterprise: BUMD (alternative mechanism)
Funding by APBN, and APBD II. Business plan will be used to research if private sector
investments in buses and stations are possible
Other
partners
Medan: Dinas Perhubungan(Transport Department) of Medan City
Central government: Directorate General of Land Transportation
Private sector/ government enterprises: private operators (BRT Bus Manager, parking
management)
Social/ communities: citizens of Medan (market research)

39
Green Waste - Action Plan
Program: Waste To Energy Plant
40
Green Waste Action Plan
Program: Waste to Energy Plant
Why? Meda s la dfills are o at a riti al poi t a d it is esti ated that ithi 5 ears, there ill e o more space for Medan City to dump its waste. Therefore, a solution is needed so that our it s solid
waste disposal needs can continue to be met. As the amount of waste in Medan has grown to an
almost unmanageable level, it is believed that the investment costs of such a project is feasible and
can be offset through revenue.
Utilisation of urban waste is one of the national priorities in the new and renewable energy area as
stipulated in the National Research Agenda 2010-2014. Municipal solid waste can potentially be
converted to electricity (Waste to Energy plant - WtE). Such an approach would decrease the future
demand for extra landfills and contribute to the national priorities for utilization of urban waste.
Waste to energy is especially interesting for Medan City in view of its commercial and industrial base
that has a high energy use (energy intensity).
Current status A series of legislations and policies has been enacted in Indonesia in order to effectively manage
municipal solid waste (MSW), promote its utilization as a source of energy, and protect the
environment. The City of Medan, supported by the Central Government has identified the
investment in a Waste-to-Energy plant as an option. No feasibility study has been conducted yet.
Goals The objective is to realize a WtE plant that maximizes the useful utilization of MSW in Medan/
greater Medan. The WtE plant will produce clean energy from waste and reduce the pressure on
Meda s la dfills.
Medan would like to explore if a cooperation with the private sector can be beneficial. Waste to
Energy technology has hardly been applied in Indonesia so the private sector is needed to contribute
technologic knowledge and experience. Depending on the local context, the kind of waste flows and
the wishes and conditions of Medan city, the private sector can advise on the appropriate WtE
technology to be applied. No single technology dominates – there is o o e size fits all solutio . The on-going WTE projects worldwide have shown various technological approaches based on
varying criteria, needs, limitations, opportunities and public acceptability.
The private sector could also invest in a WtE plant if the investments can be earned back from the
sale of electricity and possibly a tipping fee (paid by the city per ton waste accepted).
For the sale of electricity, a –subsidized - Feed in Tariff applies (FiT). A condition to qualify for the FiT
is that the landfills are environmentally sound (sanitary landfills).
The city of Medan needs to prepare a local regulation (Perda) to make a tipping fee possible. It is
important that a maximum tipping fee is set before starting the tender for the selection of the
private sector developer.

41
Results The Program is expected to have the following results:
1. Terjun landfill: upgrade of existing open dump landfill to sanitary landfill (10 ha) and
expansion with 4 ha of extra sanitary landfill
2. WtE plant operational
3. Perda for tipping fee as a condition for the private sector to invest in WtE and landfill
upgrade.
Benefits 1. Less pollution from landfills because of the conversion of existing landfills to sanitary landfills
and surpressed waste supply because of improved utilization of waste in WtE plant.
2. Co tri utes to I do esia s o it e ts to i rease the use of lea , renewable natural
resources.
3. Reduces greenhouse gas emissions by as much as 1,792,625 tons of CO2.
Success indicators (targets)
Electricity produced from waste
2015 -
2020 60GWh per year
Reduction greenhouse gas emissions
2015 -
2020 1,792,625 tons of CO2
Environment
2015 Polluted open dump landfills (Terjun)
2020 Clean sanitary landfills
Key Risks and Mitigation An initial risk assessment informed us about the key risks of introducing the WtE in Medan:
1. Sanitary landfill is not realized. Feed in Tariff (FiT) only applies if existing open dump landfills
are upgraded to sanitary landfills (financial risk for WtE plant)
2. Perda about tipping fee and maximum tariff is not set. The private sector will not be willing
to bid.
3. Selected private sector is unexperienced risking the WtE plant to fail from a technological
point of view.
4. Available MSW (and its characteristics) does not match the WtE technology.
5. Supply of MSW is unreliable (quantity/ quality)
Actions Actions have been identified to achieve the 3 key results. It is advisable to manage the realization of
the results as 1 integrated package because the successful realization of the WtE plant is dependent
on the other key results (sanitary landfill and Perda for tipping fee). The prepation of an integrated
project like this is challenging. The green team realizes that significant investments in the PMU and
external consultants are a condition to be successful.

42
Project WTE1: Expansion of sanitary landfill system in Terjun landfill site (4 ha) and upgrade of existing
Terjun landfill site (10 ha, to sanitary landfill)
This activity is considered urgent because the Terjun landfill site needs to be expanded by 4 ha. A detailed
design (4ha) has been prepared in 2012 that can serve as a starting point. The scope needs to be expanded
to include an upgrade of the existing 10has. Maintenance and operation of the sanitary landfill needs to be
considered, also as part of the implementing mechanisms and tender strategy.
A sanitary landfill is a condition to qualify for a FiT for the WtE plant. If the private sector will invest in and
operate the WtE plant, it can be considered to include the upgrade of the landfill in their scope (to be further
examined as part of the feasibility study).
A Perda (local regulation) is required as a basis for PJPK about the Environmentally Friendly Technology
Based Waste Processing Service Expenses through the Mechanism of Local Government Cooperation with
Business Entities. The regulation needs to mention that for the next 20- 5 ears, Meda ill spe d it s APBD (2018-2038) for the "tipping fee" of the private sector that manages PLTSa (Waste to Energy) Plant. The
value of the tipping fee will be calculated in the Feasibility study.
Action Description and responsibilities Timeframe
WTE1.1 Set-up project management unit (PMU) 2016
WTE1.2 Prepare a project implementation plan (PIP) including detailed activities,
responsibilities, timeline, identification of qualified consultants, budget
2016
WTE1.3 Approve project implementation plan (PIP) and budget 2016
WTE1.4 Commission Feasibility Study on WtE and landfill including preparation of
ToR, identification & recruitment of qualified consultants, FS
implementation
2017
WTE1.5 Prepare detailed design (incl. cost estimates) including environmental
impact assessment (EIA)
2017
WTE1.6 Prepare tender strategy 2017
WTE1.7 Arrange permits, land rights and any other regulations needed to realize
infrastructure
2018
WTE1.8 Prepare and draft tipping fee Perda as a result of financial analysis in the
feasibility study, through relevant working groups including Bappeda,
finance, dinas DKP and other relevant stakeholders.
2017-18
WTE1.9 Tender project(s), select contractor(s), award contract(s) 2018
WTE1.10 Oversee construction up till completion of phase 1 (July 2019) and expansion
(July 2020)
2018-20
Responsible
agency (PMU)
Dinas Kebersihan dan Pertamanan (DKP)
Estimated
costs (budget
needs)
Preparation (design, procure): Rp 2.9 billion
Realization (CAPEX): Rp 121.25 billion
Maintenance & operation: Rp 28.25 billion
Implementing
mechanism,
funding &
financing
Options:
Traditional procurement and ABPN budgets
BOT contracts with private sector where possible (combined with WtE plant)
Other
partners
Medan: Medan Bappeda, Environmental Agency (environmental documents and issues the
environmental permit)
Provincial: Provincial Government of North Sumatra
National Government: Ministry of Public Works, Bappenas (PPP book), PT SMI.
Social/ communities: Existing landowners

43
Project WTE2: Waste to Energy plant
Feasibility study (FS) has to be started in order to examine the feasibility of the WtE plant within the
framework of commercial business. Based on the results, Medan city can start the tender and select the best
bidding private sector partner. The (pre)-FS can be done by the Meda s Go er e t (solicited proposals) or
by private company (unsolicited proposals). The tender will follow the procedures and rules laid down in
Presidential Decree No. 38/2015.
It is essential that the maximum tipping fee is laid down in a local regulation (Perda) before start of the
tender.
PLTSa within the framework of the commercial business:
PLTSa within the framework of the commercial business:
Investor of PLTSa Project is generally required to provide a minimum equity of 20% from the
estimated value of the Project;
The project is guaranteed by the Government, in order to earn revenue from at least two main
sources, which are: (a) Waste Management Services Fee (Tipping Fee) from local government; and
(b) Purchases of electricity by PT PLN. From PLTSa in Bandung experience, SPC income from the tipping
fee covers 44% and from the sale of electricity to PLN covers 56%.
Local government ensures a minimum supply of garbage per day is ready to be processed by the
Investor of the Project;
The power generation can be done by combustion / thermal or biological method. The conversion process
through thermal methods can be achieved through several means of generation, namely by the method of
pyrolysis, combustion, Plasma Arc Gasification, and thermal gasification.12
Typical model of PLTSa is presented in Figure below.
Action Description and responsibilities Timeframe
WTE2.1-10 Actions and planning same with actions WTE1. Feasibility study will show the
advantages and conditions (tipping fee, contract duration, etc.) of combining
this project with WTE1 and tendering WTE1 and WTE2 as 1 package to
private developers/ operators.
See above
Responsible
agency
Dinas Kebersihan dan Pertamanan (DKP)
Estimated
costs (budget
needs)
Preparation (design): Rp 4.85 billion
Realization (construction): Rp 1,500 trillion
Maintenance & operation: to be determined

44
Implementing
mechanism,
funding &
financing
Options:
Traditional procurement and ABPN budgets
BOT contracts with private sector where possible (combined with sanitary landfill)
Other
partners
Medan: Bappeda,
Regional: PDAM
Social/ communities: Affected communities

45
Green Water – Action Plan
Program: Increasing the efficiency and
supply of drinking water

46
Green Water – Action Plan
Program: Increasing the efficiency and supply of drinking water
Why? Due to population growth in our city and lack of recent investment in water supply infrastructure,
particularly in distribution (very little investment since 1995), there are large unserviced areas within
the city. The current service coverage provides drinking water to 73% (2015) of the total population.
If not addressed now, further population growth will result in an estimated 5000l/s shortfall in water
supply by 2020. Currently maintenance of systems is restricted by a lack of funding and
approximately 26% of water treated is non revenue water (NRW).
Current status of Project PDAM Tirtanadi (the Provincial Water Supply Company – North Sumatra) prepared a water supply
masterplan for Medan 2015-2035 and a business plan for 2015-2019 which outline many of the
issues covered in this Program. Some feasibility studies exist, and some of this work is underway
already, but a coordinated approach is required for successful city-wide implementation. For this,
PDAM requires support from a number of city stakeholders, hence its inclusion in this GCAP to allow
for better management of institutional partnerships for implementation, particularly coordination
between Bappeda, Department of Housing, and PDAM. It is also necessary for PDAM to coordinate
with surrounding municipalities, Provincial, and Central Government stakeholders.
Goal The objective of the program is to implement all planned raw water development and water
treatment projects to meet projected demand, in combination with improved water distribution and
household connections to keep up with the supply side (water treatment) - which has historically
been an issue in the Medan area. New customers will be added to increase revenues and
operational efficiencies are proposed to further improve the sustainability of the system and provide
a additio al gree i g ele e t to this progra .
Results 1. Expansion of raw water production and treatment capacity from 5,700l/s in 2014 to 7,600l/s
in 2020.
2. Rehabilitation and installation of new distribution pipelines amounting to 95km.
3. Increased household connections and marketing to increase PDAM customers to 500,000 by
2020.
4. Improve energy efficiency of the water supply system and reduce non-revenue water (NRW)
from 26% in 2014 to 22% in 2020.
Benefits 1. An improvement of public service infrastructure in water supply.
2. Improvement of health and hygiene of residents, and productivity and liveability in the City.
3. Access to drinking water for the urban poor.
4. Promotion of energy efficiency.
5. Better revenue generation to improve the financial performance of PDAM.
Success indicators (targets)

47
Treated water production
2015 5700l/s
2020 7600l/s
Water supply to residents
2015 73%
2020 82%
Reduction in Non-Revenue Water
2015 26%
2020 22%
Increased customers
2015 415,200
2020 500,000
Key risks The projects are relatively well defined, the technology is straightforward, and the capacity is there
to deliver them, key risks are:
1. Funding availability.
2. Providing sufficient distribution infrastructure inline with increased water production
capacity. As PDAM Tirtanadi is under the Provincial Government of North Sumatra
historically there has been limited engagement from the Medan City Government.
3. Private sector agreements may be difficult to finalise.
Risk mitigation 1. Involve the private sector where possible (in water treatment plant design, construction,
finance, and operation).
2. Institutional coordination between the City Government and PDAM (through green team) in
implementing network expansions inline with treated water supply increases.
3. Medan is a pioneer in water PPPs and have a track record since 1996, however risks still exist
and technical assistance from Jakarta to assist in arrangements with private sector can be
sought.
Project WAT1: Increase raw water production and treatment capacity
PDAM Tirtanadi has limited capital budget for investment, however the company has been a pioneer in PPP
contracts in Indonesia and there is an ongoing BOT contract with PT TLM since 2001. This BOT approach and
their experience with these mechanismss, along with ABPN (Central Government) budgets is expected to
mobilise the necessary funding and project finance.
By liaising with Bappeda to ensure expansion projects are in the medium term development plan (RPJMN)
government funding can be maximised. Collaboration between City Government and PDAM is therefore
important, and presenting projects in an integrated manner (i.e. with the necessary upgrades to water
distribution) will improve the probability of ABPN funding.
All of the subprojects below are included in the PDAM business plan and their feasibility has been
established, and will provide an additional 2700l/s of treated water. PDAM will liaise closely with Bappeda
and continue to deliver these water supply upgrades inline with their Business plan. The existing
management team within PDAM can develop projects in enough detail to engage the private sector and
obtain funding where necessary. Treatment plants can be packaged together if this makes it more attractive
for private sector investments, in this sense, a tender strategy will need to be developed.
Environmental impact of water abstraction shall be mitigated through thorough EIA and land aquisition

48
should be considered in early project development as this is a significant risk to the private sector. The
Provincial Government of North Sumatra can support land aquisition.
Proposed sub-projects include:
WTP Martubung (additional 200l/s) – project ongoing
WTP Sunggal (additional 500l/s) ABPN budget – project ongoing
WTP Belumai (BOT contract) – project commencing
New WTP Mebidang 1500l/s (Raw water source: Bingei River in Binjai area) – expected to be BOT
contract
Action Description and responsibilities Timeframe
WAT1.1 Engage key contacts in Bappeda and the Provincial Government of North
Sumatra.
2016
WAT1.2 Prepare project plan for all sub-projects until realization including detailed
activities, responsibilities, timeline, need for external assistance
(consultants), budget, funding sources and implementation mechanism.
2016
WAT1.3 Approve project plan and budget estimates. 2016
WAT1.4 Undertake EIA, arrange permits, land rights and any other regulation needed
to realize the sub-projects.
2017
WAT1.5 Prepare designs/specifications (including cost estimates), and technical
options (sale purchase agreements etc) in sufficient detail for tendering
(through various mechanisms).
2017
WAT1.6 Prepare tender strategy for design/construction and private sector
engagement (tender) strategy (including risk minimisation). Undertake
market sounding and meeting with potential bidders. Establish GCA
(Government Contracting Agency) and procurement committee.
2017
WAT1.7 Competitively tender and select contractor(s) or BOT firms. 2018
WAT1.8 Oversee construction of WTPs 2018-20
Responsible
agency (PMU)
PDAM Tirtanadi
Estimated
costs (budget
needs)
Preparation (design, procure): Rp 50 billion
Realization (CAPEX): Rp 616 billion
Maintenance & operation: to be determined
Implementing
mechanism,
funding &
financing
Traditional procurement and ABPN budgets
BOT (design Build Operate Transfer) contracts with private sector
Other
partners
Medan: Medan Bappeda, Environmental Agency (environmental documents and issues the
environmental permit).
Regional: Regional Government of Binjai and Deli Serdang.
Provincial: Provincial Government of North Sumatra
Central Government: Ministry of Public Works, Bappenas (PPP book), PT SMI. BBWS (River
Basin Management Authority) to issue abstraction license (SIPPA).
Social/ communities: Existing landowners

49
Project WAT2: Rehabilitation and extension of distribution networks
To meet targets, as well as increasing raw and treated water supply, Medan City Housing Agency (Dinas
Perkim), in partnership with PDAM Tirtanadi, will improve/upgrade existing networks where capacity is
insufficient due to increased population in those areas, and provide new distribution networks in un-
serviced areas.
Bappeda of Medan City should coordinate the planning of this action as it requires a number of inputs,
surveys and social data. The Housing Agency and PDAM will evaluate existing networks and a staged plan to
implement these improvements will be developed. PDAM will evaluate the existing conveyance of water
transmission pipelines and propose upgrades necessary to meet future requirements in all water supply
zones - and specify the necessary improvements. The Housing Agency is responsible for design and
construction. Operation and maintenance responsibilities are transferred to PDAM on completion.
Action Description and responsibilities Timeframe
WAT2.1 Green team to set-up project management unit (PMU) to be led by Bappeda.
Including the Housing Agency and PDAM.
2017
WAT2.2 Prepare project plan including detailed activities, responsibilities, timeline,
need for external assistance (consultants), budget etc.
2018
WAT2.3 Approve project implementation plan and budget 2017
WAT2.4 Bappeda to coordinate evaluation of existing networks and development
planning.
2017
WAT2.5 Detailed consultation phase with all relevant stakeholders, City Agencies –
housing, environment, highways – and communities and landowners
affected by easements and construction.
2018
WAT2.6 Procurement of detailed design and cost estimates by engineering
consultants by Dinas Perkim (Housing Agency)
2018
WAT2.7 Excavation permits issued by Highways Agency and EIA approved by
Environment Agency (BLH)
2019
WAT2.8 Construction supervision (tendered by Housing Agency) and project
completion and transfer to PDAM.
2019-20
Responsible
agency
Medan Housing Agency: Responsible for construction of water distribution networks
Estimated
costs (budget
needs)
Preparation (design): Rp 1.2 billion
Realization (construction): Rp 144 billion
Maintenance & operation: to be determined
Implementing
mechanism,
funding &
financing
Traditional procurement
Funding by ABPD I and APBD II
Other
partners
Medan: Bappeda, Police department and transportation agency (for mitigating
construction impacts on traffic), partnership with other utilities to improve efficiency in
utility communication network expansions.
Regional: PDAM
Social/ communities: Affected communities, businesses, social services (schools, hospitals
etc.)

50
Project WAT3: Increased household connections and PDAM customers
This project aims to supply 400,000 new residents, through 75,000 new household customers within the
existing and expanded networks. This also requires a social marketing program. This is under the existing
business plan of PDAM. Housing Department will provide non- piped water kiosks to remote, low density,
low income areas.
The project will be managed and implemented by PDAM through existing expansion management structure.
It will be delivered in close coordination with Project 2. The City of Medan, through Bappeda, has a
responsibility to agree final plans, facilitate consultations and construction permits.
Action Description and responsibilities Timeframe
WAT3.1 PDAM to establish a project plan in coordination with project 2 teams.
Coordinate with Bappeda to integrate spatial data in order to discuss existing
situation and future spatial planning.
2017
WAT3.2 Socialization and advocacy of the project in coordination with community
groups, particularly low income groups and female voices – especially for
planning water kiosks.
2017
WAT3.3 PDAM to establish final designs, and finalise required permits. 2018
WAT3.4 PDAM to procure materials and construct new metered household
connections in coordination with new customers. Establish new customers in
existing billing register/database, and integrated with GIS system.
2020
WAT3.5 Department of Housing to install water kiosks for low income communities
in coordination with PDAM.
2020
Responsible
agency
PDAM Tirtanadi
Estimated
costs (budget)
Preparation (design): Rp 5 billion
Realization (construction): Rp 60.7 billion
Maintenance & operation: to be determined
Implementing
mechanism,
funding &
financing
Traditional project mechanisms
Other
partners
Medan: Bappeda, Housing Agency
Social/ communities: RW (hamlet), RT (ward), Kelurahan (village) leaders and committees.
Female heads of household.
Other community groups
Consider potential partnerships with NGOs working in urban water supply and sanitation
Project WAT4: Non revenue water (NRW) reduction and energy efficiency improvement
Reducing non-revenue water and energy efficiency in water treatment and distribution will increase
available budgets for operation and maintenance, supporting a sustainable water operator (PDAM) supply
for the residents of Medan.
This project should be coordinated/integrated with project 1 because new treatment plants should consider
energy efficient technology; project 2 because rehabilitating and expanding networks should consider
leakage reduction and metering/zoning; and, project 3 because new household connections should be
metered and affordable tariffs set and collected.
The project includes an energy efficiency audit, detection and reduction of leakage, gradually introducing
improved district metering areas and data-basing to evaluate losses, Installation of pressure reduction

51
valves, replacement or re-specification of inefficient pumps, continual replacement of customer water
meters.
Action Description and responsibilities Timeframe
WAT4.1 PDAM to prepare detailed project plan including coordination strategy with
projects 1, 2, and 3. Green teams and Bappeda can act in a coordinating role.
Initial consultation with specialist energy efficiency companies.
2018
WAT4.2 Energy efficiency audit and updated NRW baseline. This can be undertaken
by a specialist consulting firm.
2018
WAT4.3 Procurement of leak detection equipment if necessary. 2018
WAT4.4 Gradual phasing of District metered areas in coordination with Project 2. 2019
WAT4.5 Evaluation of excessive pressure and procurement and installation of
approximately 100 pressure reduction valves. Replacement of inefficient
pumps.
2019
WAT4.6 Installation of up to 36,000 replacement customer meters per year.
Calibration of existing meters.
2020
WAT4.7 Socialisation of payment for water to reduce illegal connections and
prosecutions.
2020
Responsible
agency
PDAM: Responsible for delivering NRW reductions and energy efficiency improvements
Estimated
costs (budget
needs)
Preparation (design): Rp 3 billion
Realization (construction): Rp 25 billion
Maintenance & operation: to be determined
Implementing
mechanism,
funding &
financing
Performance based contract
Other
partners
Social/ communities: PDAM customers

52
Finance Actions
Fiscal Capacity The Green Team concluded that there are possibilities to further increase own local income (PAD).
Possible specific actions to increase PAD that were brought up by the Green Team are:
- Introduce electronic tax collection system. This will increase collection rates, for example for
restaurant tax and entertainment tax
- Improve database for IMB (building permits) and PBB (property tax)
The Green Team intends to develop a RIAP (revenues improvement action plan) to further explore
these and other options and to formulate specific actions to achieve this.
To improve budgets available for capital expenditures, the Green Team sees opportunities to
decrease annual unused cash balances by improving procurement and planning. This could partly
free up funds for capital projects. Possible specific actions identified are:
- Advanced procurement: Medan can start procurement procedures before the local budget
(APBD) is officially formalized. By this Medan can avoid delays.
- Medan is already making use of E-procurement system (electronic).
An intitial analysis of the potential borrowing capacity showed that Medan could potentially borrow
over 3.000 billion Rupiah (~230 million USD) in 2016 and over 5.000 trillion Rupiah (~424 million
USD) between 2016 and 2020. The Green Team indicates that this looks promising. The Green Team
will discuss with high level decision makers, the possibility of attracting loans for green actions and
proje ts that do add alue to Meda s e o o a d li ea ilit ut for hi h o udgets are currently available and actions to further explore this opportunity. The city will put special attention
to its low classification (score 0,25) according to MoF Regulation no.33/PMK.07/2015 on Map of
Local Government Fiscal Capacity.
The following pages show the result of the Fiscal Analysis and Financial Assessment Report.
Alternative Mechanisms to attract finance Table 1 below summarizes the result of exploring the potential for applying alternative mechanisms
to priority programs. The Green Team learned that alternative mechanisms can be applied to Waste
to Energy and BRT. Actions aimed at further exploring and applying these models have been
incorporated in the action plans for these priority programs.

53
Table 1 – Summary of Medan Action Plans
Project & owner
(rows)/ financing
options (columns)
(A)
Financing
(B)
Fundin
g
(C)
Implementing
mechanism
(D)
Financing sources
(options)
(E)
Funding sources
(options)
Human Waste
Management
Medan city:
septic tanks
PDAM
Tirtanadi:
trucks
No Medan city: sceptic
tanks
PDAM Tirtanadi:
trucks
Bus Rapid Transit
BUMD/ BLUD
(own company)
Private sector:
buses and
possibly stations
International
National and city
budgets: dedicated
bus lines
National budgets:
buses
development
institutes: business
plan BUMD (GiZ),
detailed design
buslanes (ITDP)
Waste to Energy
BOT (contract);
(ii) BU Joint
Venture
(company
public &
private)
Not yet explored Tipping fee: no
number mentioned
Water Supply
PDAM Tirtanadi Significant
availability
payments could
attract private
sector
investments.
Lessons learned
from ATB (Batam)
and BOT Contract
with PT Tirta
Lyonnaise Medan,
a joint venture
between The
Suez Group of
France (85%) and
PDAM Tirtanadi
(15%).
PDAM Tirtanadi,
making use of city
budgets

APPENDIX B.1
Municipal Financial Assessment
Review of Medan
TA-8518 INO: Green Cities
A Sustainable Urban Future in Indonesia 2 - Capacity
Development

Appendix B.1 1
MUNICIPAL FINANCES OF THE CITY GOVERNMENT OF MEDAN
This report assesses various aspects of the city government of Medan City budgets. It raises
questions that have been shared with the Green Team to encourage considering options and
actions to: increase revenues, spent budgets more efficient and effective, and attract loans. It
provides insight in the views of the Green Team and forms the basis for possible actions the
Green Team formulated in the GCAP.
1 Objective
Analysis of the public budget is undertaken with the objective:
To be better able to assess if Medan city has funds available to finance specific
programs / projects aimed at improving Medan’s green profile (Medan city budgets)?
To identify opportunities to increase availability of funds for green urban projects by:
o Increasing availability of general city budgets by – for example – improving the financial efficiency of the city administration, increasing tax collection rates or introducing new local taxes and levies;
o Increasing availability of city budgets by prioritizing budgets specifically for green investments by – for example – shifting budgets towards green projects.
o Borrowing
2 Actual Budget
Description of financial management for Medan Local financial management operation is
stipulated by Ministry of Home Affairs no.13/2006 (“Guidelines for Management of Local Finances”) and no.21/2011.
The table below provides general insight in the actual budget realization between 2011 to
2014: what revenues were generated? how much was spent? Was there money left (surplus/
deficit)? And what is the SILPA at the end of each year (unused budgets on cash balance
city)?
This chapter calculates average shares based on summarized totals of the years considered.

Appendix B.1 2
Actual Budget Realization – revenues & expenditures of the City of Medan 2011-2014
and Budget 2015 (in Rp. billion)
2011 2012 2013 2014 Average yearly growth
Share (of revenues/
expenditures)
a. Revenue 2.742,6 2.998,2 3.276,3 4.042,1 13,8% 100,0%
i. Local Income (PAD)
990,3 1147,9 1206,2 1384,2 11,8% 36,2%
ii. High level government transfer
1.718,7 1.822,7 2.060,8 2.657,9 15,6% 63,3%
iii. Other Income 33,6 27,6 9,3 0 -100,0% 0,5%
b. Expenditure 3.032,8 3.021,2 3.224,4 3.723,6 7,1% 100,0%
i. Operating Expense
2.350,0 2.462,7 2.593,1 2.939,2 7,7% 79,6%
ii. Capital Expense 681,9 558,4 630,8 783,9 4,8% 20,4%
iii. Contingencies 0,9 0,1 0,6 0,5 -17,5% 0,0%
c. Surplus/(deficit) -290,2 -23,0 51,9 318,5
d. Financing in 386,0 80,7 33,8 73,0
e. Financing out 15,1 35,2 12,7 20,8
f. SILPA 80,7 22,5 73,0 370,7
Source: Actual Budget Report 2012-2014
Revenues
The total city revenues are between 2,742 billion Rupiah and 4,042 billion Rupiah. Transfers
from high level government made up 63.3% of the total revenue, local income (PAD) 36.2%
and other income 0.5%. This means Medan is for a large part dependent on national
financial policy.
Local income (PAD) is made up of local tax, levies (for city services), the result of natural
resources, and other legal local income (Law No. 33 year 2004). When looking at the share
of PAD on the total revenues (36.2%), Medan is doing better than Malang and Kendari
(18.8% and 12.9%). However, these figures can be misleading because both Malang and
Kendari have significant higher “other income”. In terms of high level transfers, Medan (63.3%) is still doing better with Malang and Kendari scoring 71.8% and 72.4%).
The city revenues have grown with 13.8% on average. Growth of high level government
(15.6%) transfers contributed more than growth of own income (11.8%). This could indicate
that Medan does not want to decrease its dependency on high level government transfers.
Other income has a small share in revenues and was 0 in 2014.
Questions raised
How can Medan increase its local income (PAD)?
Opportunities identified
Related to local government revenues (PAD), the green team concluded that there are
possibilities to further increase PAD. The green team will include a short term action in the
GCAP to develop a RIAP (revenues improvement action plan). Possible specific actions to
increase PAD that were brought up by the green team are:

Appendix B.1 3
Introduce electronic tax collection system. This will increase collection rates, for
example for restaurant tax and entertainment tax
Improve database for IMB (building permits) and PBB (property tax)
Expenditures
The yearly growth of expenditure was 7.1% so lower than revenue growth. Revenue growth
was higher with 13.8 %. This has resulted in a growing budget surplus (from a 290 billion
Rupiah deficit in 2010 to a 318 billion Rupiah surplus in 2014). Operating expenditures grew
faster than capital expenditures. This means the city is not increasing its effectiveness in
terms of CAPEX spending. The operating expense (OPEX) mainly consist out of expenses
for personnel, goods and services for city administration (such as energy bill, office supplies,
furniture, etc.), maintenance and operation of city infrastructure. OPEX dominated the city
spending (around 79.6 %).
Questions raised
1. How can Medan its capital expenditures? 2. How are expenditures in Medan divided over the year? Are most of the expenditures
(and revenues) at the end of the year? How does this influence the impact of expenditures on the quality of the city? Can this be improved?
Opportunities identified
The green team indicates it is difficult to increase expenditures for CAPEX (without
increasing revenues). The number of city employees cannot be decreased. Personnel
expenses will rise at least with inflation. However, the green team sees opportunities to
decrease SILPA (unused cash balances) by improving procurement and planning. For
example:
Advanced procurement: Medan can start procurement procedures before the APBD
is officially formalized. By this Medan can avoid delays.
Medan is already making use of E-procurement system. In the green team’s opinion this does not shorten procedures. E-procurement is aimed at increasing
transparency. Also in case of E-procurement, transactions above 200 Juta take 45
days. Smaller transactions can be faster.
On the other hand, it is noted that much of the SILPA is unspent in year <x> but already
reserved for outstanding payments like:
Social security
Teacher incentives
Outstanding payments to contractors.
3 Ratios
A number of ratios have been used to assess the financial condition of the city.
The independency from central government funding measured by local income as %
of high level government transfers (independency) and of total revenues (fiscal
decentralize). The higher this percentage, the more independent a city is.

Appendix B.1 4
The effectiveness of the city measured by percentage of capital expenditures
(CAPEX), goods and services and personnel expenditures as % of the total
expenditures. The higher the % of CAPEX, the better, the lower the % for personnel
expenditures, the better.
The average ratios in this chapter are based on the yearly ratios (in contrary to the average
of the summarized totals as in the previous chapter). Numbers will slightly differ with
percentages calculated in the previous chapter.
Major Financial Ratios of the City of Medan for 2011 – 2014
Ratio 2011 2012 2013 2014 Average
Independency: (Local Income/
Transfer) 57,6% 63,0% 58,5% 52,1% 57,8%
Fiscal Decentralize: (Local
Income / Total Revenues) 36,1% 38,3% 36,8% 34,2% 36,4%
Effectiveness for Infra Assets
(lifetime > 12 months):
(Capital expenses / Total
expenses)
22,5% 18,5% 19,6% 21,1% 20,4%
Effectiveness for Goods &
Services (lifetime < 12
months): (Non personnel
expenses / Total Expenses)
26,0% 23,8% 21,1% 23,9% 23,7%
Own Revenue vs Personnel
Ratio (own revenue/ personnel
expenses)
63,4% 65,8% 63,1% 67,6% 65,0%
Personnel expenses ratio:
(Personnel expenses/ total
expenses)
51,5% 57,7% 59,3% 55,0% 55,9%
Operating expenses ratio:
(Operating expenses / total
expenses)
77,5% 81,5% 80,4% 78,9% 79,6%
Source: Actual Budget of Kota Medan 2011-2014
3.1 Independency & Fiscal Decentralization
Fiscal Decentralization reflects the local income as a percentage of total revenues.
Between 2011 and 2014, the average ratio was 36.4%. High level government transfers were
63 % of the total revenues. The table indicates that the Independency (indicated by the
Local Income to High Level Government Transfer ratio) is 57.8% on average.
The ratios indicate that the city has been largely dependent from the national government for
funding its development, although Medan is doing much better than Malang, Kendari and
slightly better than Batam. However, Batam is performing better in recent years.

Appendix B.1 5
Questions raised
- Are possibilities to further increase local income?
- Does the Green Team know the collection rate of existing taxes and levies?
- Can collection rates or taxes and levies be improved? (intensifikasi)
- Can new taxes and levies be implemented? (ekstensifikasi)
The Annex to the DFR on “Municipal Urban Finance System in Indonesia” provides more
background on taxes and levies.
Opportunities identified
The green team indicated to see opportunities to increase PAD further (see previous
section).
It is suggested to look for possibilities to implement so-called green incentives. For example,
property owners could be charged higher property taxes (PBB) if their property does not
meet “green standards” (green building codes, energy and water efficiency, waste management, etc.).
3.2 Effectiveness
The ratio between capital expense and total expenditures (20.4% - the effectiveness for infra
assets with a lifetime > 12 months) shows that most of the expenditures are for operating
expenses (79.6%). Of operating expenses 70.2% goes to personnel (equalling 55.9% of total
expenditures). A maximum of 23.7% of total expenditures could theoretically have been used
for maintaining local government assets for transport, waste, buildings, etc.) (the
effectiveness of goods and services with a lifetime < 12 months, minus other expenses)
Questions raised
The efficiency ratio suggests that relatively little of the available budgets end up where they
are most needed, being capital and operating expenditures to improve and maintain the city’s infrastructure.
- How can the city improve such ratios?
- Can expenditures for CAPEX be increased?
- What are the main hurdles to do so?
- And how can these hurdles be overcome?
Opportunities identified
The Green Team did not identify possible actions. The Green Team indicated that expenses
for personnel are hard to decrease, also due to Indonesian regulations that give a lot of rights
to government employees (see also previous section).
Local Government Fiscal Capacity (MoF Reg. No 33/PMK/2015)
According to MoF Regulation no.33/PMK.07/2015 on Map of Local Government Fiscal
Capacity, the city of Medan scored 0,25. This is classified as Low and worse than the City of
Kendari (0.72 in 2015 - medium), the city Malang City (0.70 – medium), and Batam City (0.85
- medium). Point 21 in the Annex to this Financial Assessment Report provides more
information on the way the score is determined (looking at income item’s such as DAU, personnel expenses, and number of poor people living in the city.

Appendix B.1 6
4 Real Financing Capacity
Real financing capacity is ability of the city to finance its needs after paying non-discretionary
expenses, mainly personnel expenses and other high priority expenses. The real financing
capacity is the amount that can be used for flexible expenses, including investment,
maintenance and operation of green infrastructure.
Real Financing Capacity of the City of Medan (in billion Rp)
y2011 y2012 y2013 y2014
Average yearly growth
1 Revenue 2.742,6 2.998,2 3.276,3 4.042,1 13,8%
2 Previous SILPA 389,5 80,7 22,5 73,0 -42,8%
Sub total Revenue
3.132,1 3.078,9 3.298,8 4.115,1 9,5%
Deducted by non-discretionary and high priority expense:
3 Personnel expense 1.561,2 1.743,3 1.912,2 2.049,0 9,5%
4 Other expense 352,5 369,4 389,0 440,9 7,7%
Sub Total 1.913,7 2.112,7 2.301,2 2.489,9 9,2%
5 Real Financing Capacity (RFC)
1.218,3 966,1 997,6 1.625,2 10,1%
% RFC / total Revenues
38,9% 31,4% 30,2% 39,5% 0,5%
Source: Actual Budget of Medan 2011-2014 and Consultant Assessment
The table shows that the real financing capacity of the city by 2014 was Rp. 1,625 billion in
2011. The average yearly increase from 2011 – 2014 was little over 10%. This is more than
inflation meaning the city can achieve more. It is noted that the RFC decreased in 2012 –
2013 and increased with almost 65% year on from 2013 – 2014. The real financing capacity
grows less than the average growth of revenues (see 1.1: 13.8%). This is worrying because
it indicates that extra revenues are not used efficiently for green infrastructure investments.
Analysis of the real financing capacity shows that the Real Financing Capacity is relatively
stable as a percentage of total revenues, from 38.9% in 2011 to 39.5% in 2014. In terms of
growth, Medan is doing worse than Batam, Malang and Kendari. Based on the analysis
done, Medan is not expected to increase the percentage of funds available for CAPEX and
OPEX of key green infrastructures. However, the amount of real financing capacity is slightly
increasing yearly.
Questions raised
1. Can the Real Financing Capacity can be increased? (by increasing revenues or decreasing non-discretionary expenses)?
2. Does the slightly increasing Real Financing Capacity provide opportunities to allocate extra budgets to green investments related to realizing and maintaining green urban infrastructures?
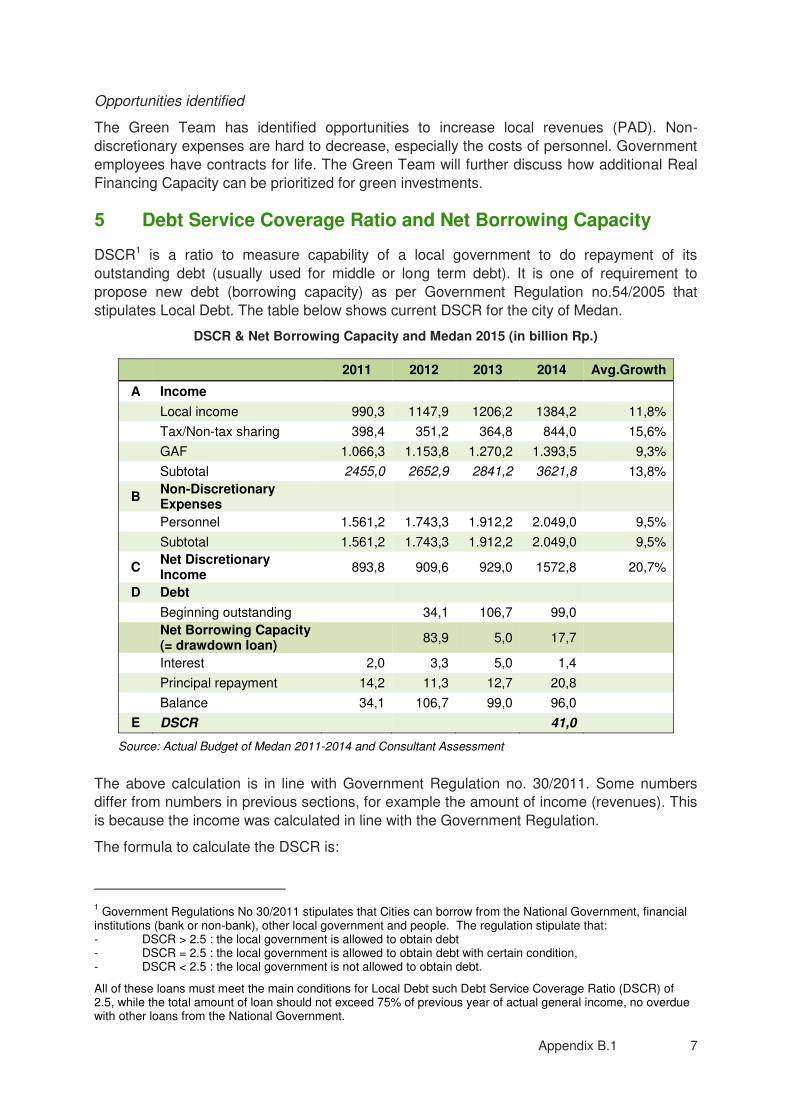
Appendix B.1 7
Opportunities identified
The Green Team has identified opportunities to increase local revenues (PAD). Non-
discretionary expenses are hard to decrease, especially the costs of personnel. Government
employees have contracts for life. The Green Team will further discuss how additional Real
Financing Capacity can be prioritized for green investments.
5 Debt Service Coverage Ratio and Net Borrowing Capacity
DSCR1 is a ratio to measure capability of a local government to do repayment of its
outstanding debt (usually used for middle or long term debt). It is one of requirement to
propose new debt (borrowing capacity) as per Government Regulation no.54/2005 that
stipulates Local Debt. The table below shows current DSCR for the city of Medan.
DSCR & Net Borrowing Capacity and Medan 2015 (in billion Rp.)
2011 2012 2013 2014 Avg.Growth
A Income
Local income 990,3 1147,9 1206,2 1384,2 11,8%
Tax/Non-tax sharing 398,4 351,2 364,8 844,0 15,6%
GAF 1.066,3 1.153,8 1.270,2 1.393,5 9,3%
Subtotal 2455,0 2652,9 2841,2 3621,8 13,8%
B Non-Discretionary Expenses
Personnel 1.561,2 1.743,3 1.912,2 2.049,0 9,5%
Subtotal 1.561,2 1.743,3 1.912,2 2.049,0 9,5%
C Net Discretionary Income
893,8 909,6 929,0 1572,8 20,7%
D Debt
Beginning outstanding
34,1 106,7 99,0
Net Borrowing Capacity (= drawdown loan)
83,9 5,0 17,7
Interest 2,0 3,3 5,0 1,4
Principal repayment 14,2 11,3 12,7 20,8
Balance 34,1 106,7 99,0 96,0
E DSCR 41,0
Source: Actual Budget of Medan 2011-2014 and Consultant Assessment
The above calculation is in line with Government Regulation no. 30/2011. Some numbers
differ from numbers in previous sections, for example the amount of income (revenues). This
is because the income was calculated in line with the Government Regulation.
The formula to calculate the DSCR is:
1 Government Regulations No 30/2011 stipulates that Cities can borrow from the National Government, financial
institutions (bank or non-bank), other local government and people. The regulation stipulate that: - DSCR > 2.5 : the local government is allowed to obtain debt - DSCR = 2.5 : the local government is allowed to obtain debt with certain condition, - DSCR < 2.5 : the local government is not allowed to obtain debt.
All of these loans must meet the main conditions for Local Debt such Debt Service Coverage Ratio (DSCR) of 2.5, while the total amount of loan should not exceed 75% of previous year of actual general income, no overdue with other loans from the National Government.

Appendix B.1 8
(average of audited Net Income of previous 3 years)/ (sum of interest plus principal repayment in
current year)
The numbers show that DSCR is very high because Medan is hardly borrowing money. This
means that Medan potentially can borrow to cover additional investments in green
infrastructure or even give out municipal bonds.
The formula to calculate the potential borrowing capacity is:
1. Maximum 75% of the total revenues (see 1.1.) in the previous year (audited) 2. Projected DSCR in years of debt repayment cannot go below 2.5. Interest rate of
government loan is 11.75% and loan duration is 20 years.
Cities that have failed to pay interest and principal in the year they want to borrow, can not
borrow.
The table below shows the calculated maximum borrowing capacity of Medan from 2015 –
2019. It shows Medan can borrow little over Rp 3 billion in 2015 and a total of over Rp 5,5
billion from 2015 – 2019.
Questions raised
1. What is Medan’s policy for borrowing? What is needed for the Parliament (DPRD) to approve?
2. Medan has a low score of 0,25 according to MoF Regulation no.33/PMK.07/2015 on Map of Local Government Fiscal Capacity. How does this influence Medan’s borrowing capacity?
3. What actions can be formulated related to borrowing? Would capacity building in the field of preparing loan agreements help?
Opportunities identified
It could be beneficial for Medan to look into the opportunities to borrow. Borrowed money
could be used to fund improvement of green city infrastructure. As long as the city can meet
the loan requirements and projects invested in deliver economic, environmental and social
benefits for the city, it is recommended to look into this possibility. Cities have expressed that
procedures to attract government loans are complex and that this is a barrier to start
borrowing procedures. It is suggested to formulate actions in the green city action plan aimed
at increasing the city’s capacity to attract loans. Such actions would include capacity building to increase Medan’s ability to prepare loan agreements, including financial analysis and economic cost benefits analysis of (green) investment projects for which cities intend to
attract government loans.
The green team indicated that the outcome of the analysis looks promising. The green team
will discuss the possibility of attracting loans for green actions and projects that do add value
to Medan’s economy and liveability but for which no budgets are available.

Appendix B.1 9
Projection of DSCR & Net Borrowing Capacity for Medan 2016-2020 (in billion Rp.)
% Growth Assume
d
2015 2016 2017 2018 2019
A Income
Local income 13% 1.564,1 1.767,3 1.996,8 2.256,2 2.549,4
Tax/Non-tax sharing 12% 945,3 1.058,8 1.185,8 1.328,1 1.487,5
GAF 8% 1.505,0 1.625,4 1.755,4 1.895,8 2.047,5
Subtotal 4.014,4 4.451,4 4.938,1 5.480,2 6.084,4
B Non-Discretionary Expenses
Personnel 15,0% 2.356,4 2.709,8 3.116,3 3.583,8 4.121,3
Subtotal 2.356,4 2.709,8 3.116,3 3.583,8 4.121,3
C Net Discretionary Income
1.658,0 1.741,6 1.821,8 1.896,4 1.963,0
D Debt
Beginning outstanding
96,0 3.084,3 4.196,0 4.933,4 5.086,4
Max. Drawing Down New Loan
3.031,6 1.176,9 822,1 251,1 242,2
Interest (assuming 11.75% pa)
356,2 489,4 578,3 597,9 614,8
Principal repayment 43,3 65,2 84,6 98,2 113,1
Balance
3084,3 4196,0 4933,4 5086,4 5215,5
E DSCR 2,85 2,50 2,50 2,50 2,50
Source: Consultant Assessment
6 Green Development Program
While the Green Team provided initial estimates on expenditures that can be labelled as
green, the Green Team indicated they needed to review this analysis during the final
workshops held in Medan. The Green Team did not come up with new estimates in the final
months of this TA. No actions have been identified.
Questions raised
The above table makes it possible to discuss if budget allocations should be changed in
order to reflect the priority for Green Actions and Green Investments. Questions for Green
Teams are:
1. To what extent can expenditures identified be labelled as green? Why? 2. Are the expenditures identified fully spent for CAPEX and OPEX of new and existing
infrastructures? If no: for what else? For what percentage? 3. Do budgets spent sufficiently reflect the city’s green ambitions and priorities? Or do
reasons exist to shift budgets to Green Attributes?
Cities should challenge themselves to critically look at their budget allocation and look for
opportunities to allocate sufficient budgets to prioritized green attributes (short term) and also
to other green attributes (medium term).

APPENDIX B.2
Municipal Financial Assessment
Review of the City of Batam
TA-8518 INO: Green Cities
A Sustainable Urban Future in Indonesia 2 - Capacity
Development

Appendix B.2 1
This report assesses various aspects of the city government of Batam City budgets. It raises
questions that have been shared with the Green Team to encourage considering options and
actions to: increase revenues, spent budgets more efficient and effective, and attract loans. It
provides insight in the views of the Green Team and forms the basis for possible actions the
Green Team formulated in the GCAP.
1 Objective
Analysis of the public budget is undertaken with the objective:
To be better able to assess if Batam city has funds available to finance specific
programs / projects aimed at improving Batam’s green profile (Batam city budgets)?
To identify opportunities to increase availability of funds for green urban projects by:
o Increasing availability of general city budgets by – for example – improving the financial efficiency of the city administration, increasing tax collection rates or introducing new local taxes and levies;
o Increasing availability of city budgets by prioritizing budgets specifically for green investments by – for example – shifting budgets towards green projects.
o Borrowing
2 Actual Budget
Description of financial management for Batam local financial management operation is
stipulated by Ministry of Home Affairs no.13/2006 (“Guidelines for Management of Local Finances”) and no.21/2011.
The table below provides general insight in the actual budget realization between 2010 to
2015: what revenues were generated? how much was spent? Was there money left (surplus/
deficit)? And what is the SILPA at the end of each year (unused budgets on cash balance
city)?
This chapter calculates average shares based on summarized totals of the years considered.
MUNICIPAL FINANCES OF THE CITY GOVERNMENT OF BATAM

Appendix B.2 2
Actual Revenue and Expenditure of the City of Batam 2011-2015 (in Rupiah billion)
2010 2011 2012 2013 2014 2015*
Average
yearly
growth
Share (of
revenues/
expenditures)
a. Revenue 1.061,8 1.279,1 1.490,0 1.749,1 2.021,6 1.936,3 12,8% 100,0%
i. Local Income
(PAD) 159,0 324,5 413,2 606,3 779,9 840,6 39,5% 32,7%
ii. High level
government
transfer
845,0 845,7 1.028,9 1.049,4 1.194,3 1.088,8 5,2% 63,5%
iii. Other Income 57,8 108,9 47,9 93,4 47,3 6,9 -34,6% 3,8%
b. Expenditure 1.211,8 1.196,6 1.378,4 1.675,1 1.967,6 2.154,0 12,2% 100,0%
i. Operating
Expense 915,0
1.049,1
1.135,0
1.318,9
1.473,8
1.628,0 12,2% 78,5%
- Personnel 584,3 660,6 735,2 814,1 917,8 670,9 2,8% 45,7%
- Non-personnel 330,7 388,5 399,8 504,7 556,0 957,1 23,7% 32,7%
ii. Capital Expense 289,4 139,9 242,5 353,9 492,8 524,3 12,6% 21,3%
iii. Contingencies 7,4 7,6 0,9 2,4 1,1 1,7 -25,7% 0,2%
c. Surplus/(deficit) -150,0 82,5 111,6 74,0 53,9 -217,7 7,74%
d. Financing in 1061,4 1280,7 1490,7 1750,6 2022,3 1936,6
e. Financing out 1211,8 1196,6 1378,4 1675,1 1967,6 2154,0
f. SILPA -300,4 166,7 224,0 149,5 108,7 -435,1
Source: Actual Budget Report 2010-2015
Revenues
The table above shows that the city revenue has been growing by around 12.8% average per
year since 2010. It is noteworthy that growth is mainly made up of local income (with an
average yearly increase of 39.5%). Transfers from high-level government only increased with
a yearly average of 5.2%. The green team indicated that efforts to increase revenues from
taxes and levies have been successful, which explains the growth.
Transfers from high level government made up 63.5% of the total revenues. 32.7% of
revenues are made up of local income (PAD) and 3.8% of other income (all on average).
This means dependency to the national government is considerably high. However – just like
Medan - Batam is performing better than Malang and Kendari, where government transfers
are above 70% of total revenues.
Based on PAD analysis for 2010 – 2015 below, it can be concluded that taxes have by far
the biggest share (77.5%) followed by levies (10.5%). Contributions from local BUMDs (such
as PDAM, Hospitals, etc.) are low, only 0.4% of the total local revenues.

Appendix B.2 3
Actual Revenue splits 2010-2015 (in Rupiah billion)
2010 2011 2012 2013 2014 2015 Average yearly growth
Average (made up of..)
Revenue Income 1.061,
8 1.279,
1 1.490,
0 1.749,
1 2.021,
6 1.936,
3 12,8% 100,0%
a. Local Income (PAD) 159,0 324,5 413,2 606,3 779,9 840,6 39,5% 32,7%
i. Tax 127,5 280,4 335,22 475,17 580,86 620,4 37,2% 77,5%
ii. Retribution (levies) 17,9 25,5 41,4 71,03 86,5 84,47 36,4% 10,5%
iii. Separated Local Asset Mgt Result BUMD)
1,7 1,7 1,5 1,96 2,62 3,2 13,5% 0,4%
iv. Other Local Income 11,9 16,9 35,1 58,18 109,95 132,54 61,9% 11,7%
b. Transfer 845,0 845,7 1.028,
9 1.049,
4 1.194,
3 1.088,
8 5,2% 63,5%
i. Tax/Non-tax Sharing 505,51 375,93 463,45 392,13 354,13 207,05 -8,1% 38,0%
ii. General Allocated Fund
230,2 316,6 429,7 528,8 559,1 530,0 32,0% 42,9%
iii. Specific Allocated Fund
39,85 39,16 46,46 59,43 56,7 112,78 14,3% 5,9%
iv. Adjustment Fund 69,4 113,9 89,4 69,0 224,3 238,9 -0,2% 13,3%
c. Other Income 57,8 108,9 47,9 93,4 47,3 6,9 -34,6% 3,8%
Source: Actual Budget Report 2010-2015
Questions raised
How can Batam increase its local income (PAD)? What are the opportunities to increase
levies, retributions and revenues from BUMD? (see point 14 of Annex on Municipal Finance
for reference and inspiration).
Actions identified
Batam sees opportunities to further increase PAD. This will be necessary to achieve the
current mayor’s goal to increase total revenues to Rupiah 4.000 billion (from around 2.000 now). A specific opportunity mentioned is to implement electronic tax and levies system. The
green team says this can significantly increase local income (PAD). Revenues from parking
levies, solid waste levies and restaurant taxes are specific examples mentioned. Related to
waste levies it is mentioned that the potential is Rupiah 75 – 80 billion, while the current
revenue is (only) Rupiah 22 billion.
Batam is not yet looking into the possibilities of implementing green tax incentives and levies. For example, tax deductions (PBB) for green buildings, and higher taxes for polluting buildings
Expenditures
The average yearly growth of expenditures was 12.2% per year from 2010. Revenue growth
was slightly higher with 12.8% leaving a stable budget surplus. Except in 2015, where

Appendix B.2 4
revenues went down and expenditures up in comparison to the previous year. Especially the
“non-personnel” expenses in that year went up significantly with over Rupiah 400 billion.
The growth % of CAPEX expenditures from 2010 was higher than the total growth (12.6%
versus 12.2%). This means the city is increasing its effectiveness in terms of CAPEX
spending, but only slightly. The operating expense (OPEX) mainly consist out of expenses
for personnel, goods and services for city administration (such as energy bill, office supplies,
furniture, etc.), maintenance and operation of city infrastructure. OPEX dominated the city
spending which amount to 78.5 % leaving 21.3% for capital expenses and 0.2% for other
expenses. It is also noteworthy that based on the numbers Batam’s personnel expenses only grew 2.8% on average between 2010 – 2015, so less than average inflation. However, this
low growth is only caused by a steep decrease in 2015. That steep decrease might have a
link with a steep increase in non-personnel expenses in the same year, but the Green Team
did not confirm this.
Questions raised
1. How can Batam increase its capital expenditures? 2. How are expenditures in Batam divided over the year? Are most of the expenditures
(and revenues) at the end of the year? How does this influence the impact of expenditures on the quality of the city? Can this be improved?
Actions identified
Batam did not discuss possible actions aimed at increase its capital expenditures. Also, the
possibility of improving the timing of expenditures to avoid delays and budget underspending,
was not discussed.
No actions were identified.
3 Ratios
A number of ratios have been used to assess the financial condition of the city.
The independency from central government funding measured by local income as %
of high level government transfers (independency) and of total revenues (fiscal
decentralize). The higher this percentage, the more independent a city is.
The effectiveness of the city measured by percentage of capital expenditures
(CAPEX), goods and services and personnel expenditures as % of the total
expenditures. The higher the % of CAPEX, the better, the lower the % for personnel
expenditures, the better.
The average ratios in this chapter are based on the yearly ratios (in contrary to the average
of the summarized totals as in the previous chapter). Numbers will slightly differ with
percentages calculated in the previous chapter.

Appendix B.2 5
Major Financial Ratios of the City of Batam for 2010 – 2015
Ratio 2010 2011 2012 2013 2014 2015 Averag
e
Independency: (Local Income/ Transfer)
18,8% 38,4% 40,2% 57,8% 65,3% 77,2% 49,6%
Fiscal Decentralize: (Local Income / Total Revenues)
15,0% 25,4% 27,7% 34,7% 38,6% 43,4% 30,8%
Effectiveness for Infra Assets (lifetime > 12 months): (Capital expenses / Total expenses)
23,9% 11,7% 17,6% 21,1% 25,0% 24,3% 20,6%
Effectiveness for Goods & Services (lifetime < 12 months): (Non personnel expenses / Total Expenses)
27,3% 32,5% 29,0% 30,1% 28,3% 44,4% 31,9%
Own Revenue vs Personnel Ratio (own revenue/ personnel expenses)
27,2% 49,1% 56,2% 74,5% 85,0% 125,3% 69,5%
Personnel expenses ratio: (Personnel expenses/ total expenses)
48,2% 55,2% 53,3% 48,6% 46,6% 31,1% 47,2%
Operating expenses ratio: (Operating expenses / total expenses)
75,5% 87,7% 82,3% 78,7% 74,9% 75,6% 79,1%
Source: Actual Budget of Kota Batam 2010-2015
3.1 Independency & Fiscal Decentralization
Fiscal Decentralization reflects the local income as a percentage of total revenues.
Between 2010 and 2015, the ratio is 30.8% on average. The table indicates that the
Independency (indicated by the Local Income to High Level Government Transfer ratio) is
49.6% on average. Both indicators are good as compared to Malang and Kendari and
comparable (a bit less) than for Medan.
High level government transfers were 65% of the total revenues (on average). The ratios
indicate that the city is still largely dependent on the national government for funding its
development, however is performing better than other cities like Malang and Kendari. Finally,
it should be noted that the significant improvements have been made over the past years.
Especially, the city managed to increase own local revenues (PAD) a lot. The independency
ratio in 2015 was 77.2% (average 49.6%) and fiscal decentralization 43.4% (30.8% on
average). Currently, Batam is outperforming all other cities in this TA.
Questions raised
- Are possibilities to further increase local income?
- Does the Green Team know the collection rate of existing taxes and levies?
- Can collection rates or taxes and levies be improved? (intensifikasi)
- Can new taxes and levies be implemented? (ekstensifikasi)
Opportunities identified
The green team indicated to see opportunities to increase PAD further (see previous
section).

Appendix B.2 6
The Annex to the DFR on “Municipal Urban Finance System in Indonesia” provides more background on taxes and levies.
It is suggested to look for possibilities to implement so-called green incentives. For example,
property owners could be charged higher property taxes (PBB) if their property does not
meet “green standards” (green building codes, energy and water efficiency, waste management, etc.).
3.2 Effectiveness
The ratio between capital expense and total expenditures (20.6% - the effectiveness for infra
assets with a lifetime > 12 months) shows that most of the expenditures are for operating
expenses (79.1 %). Of operating expenses 59.5% goes to personnel (equalling 47.2% of
total expenditures). A maximum of 31.9% of total expenditures could theoretically have been
used for maintaining local government assets for transport, waste, buildings, etc.) (the
effectiveness of goods and services with a lifetime < 12 months, minus other expenses)
Questions raised
Although Batam outperforms other cities in this TA, the efficiency ratio suggests that
relatively little of the available budgets end up where they are most needed, being capital
and operating expenditures to improve and maintain the city’s infrastructure.
- How can the city improve such ratios?
- Can expenditures for CAPEX be increased?
- What are the main hurdles to do so?
- And how can these hurdles be overcome?
Opportunities identified
The Green Team did not identify possible actions. The Green Team indicated that expenses for personnel are hard to decrease, also due to Indonesian regulations that give a lot of rights to government employees.
Local Government Fiscal Capacity (MoF Reg. No 33/PMK/2015)
Furthermore, according to MoF Regulation no.33/PMK.07/2015 on Map of Local Government
Fiscal Capacity, the city of Batam has scored 0,85. This is classified as Medium and in the
same range as the City of Kendari (0.72 in 2015 - medium), and Malang City (0.70 -
medium). Medan scores only 0.25 (low).
Point 21 in the Annex to the DFR on “Municipal Urban Finance System in Indonesia” provides more information on the way the score is determined (looking at income item’s such as DAU, personnel expenses, and number of poor people living in the city.
4 Real Financing Capacity
Real financing capacity is ability of the city to finance its needs after paying non-discretionary
expenses, mainly personnel expenses and other high priority expenses. The real financing
capacity is the amount that can be used for flexible expenses, including investment,
maintenance and operation of green infrastructure. For 2009, it has been assumed that the
SILPA was 150 billion.
Real Financing Capacity of the City of Batam (in billion Rp)

Appendix B.2 7
y2010 y2011 y2012 y2013 y2014 y2015*
1 Revenue 1.061,8 1.279,1 1.490,0 1.749,1 2.021,6 1.936,3
2 Previous year SILPA 150,0 -300,4 166,7 224,0 149,5 108,7
Sub total Revenue 1.211,8 978,7 1.656,7 1.973,1 2.171,0 2.045,0
Deducted by non-
discretionary and high
priority expense:
3 Personnel expense 584,3 660,6 735,2 814,1 917,8 670,9
4 Other expense 137,3 157,4 170,3 197,8 221,1 244,2
Sub Total 721,6 818,0 905,5 1.011,9 1.138,9 915,1
5 Real Financing Capacity 490,2 160,7 751,3 961,2 1.032,2 1.129,9
Source: Actual Budget of Kota Batam 2010-2015
The table shows that the real financing capacity of the city by 2015 is little over Rp. 1.1
trillion. The average growth is 18.2% yearly between 2010 – 2015. The real financing
capacity grew more than the average growth of revenues (12.8%, see 1.1.). Total revenues
grew faster that non-discretionary expenses. The Real Financing Capacity increased as a
percentage of total revenues, from 40,5% in 2010 to 55.3% in 2015, but the growth has not
been stable.
Questions raised
3. Can the Real Financing Capacity be increased? (by increasing revenues or decreasing non-discretionary expenses)?
4. Does the increasing Real Financing Capacity provide opportunities to allocate extra budgets to green investments related to realizing and maintaining green urban infrastructures?
Opportunities identified
The Green Team has identified opportunities to increase local revenues (PAD). Non-
discretionary expenses are hard to decrease, especially the costs of personnel. Government
employees have contracts for life. The Green Team will further discuss how additional Real
Financing Capacity can be prioritized for green investments.
5 Debt Service Coverage Ratio and Net Borrowing Capacity
DSCR1 is a ratio to measure capability of a local government to repay its outstanding debt
and interest (usually used for middle or long term debt). It is one of the requirements to
1 Government Regulations No 30/2011 stipulates that Cities can borrow from the National Government, financial
institutions (bank or non-bank), other local government and people. The regulation stipulate that:
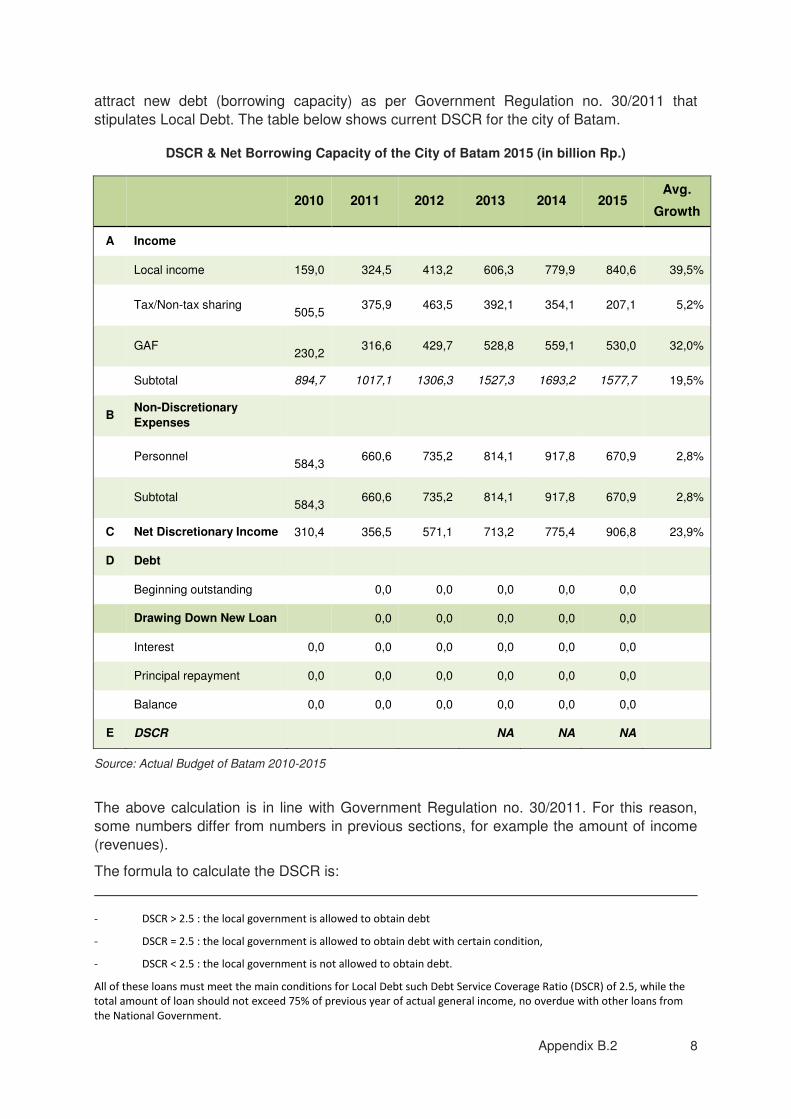
Appendix B.2 8
attract new debt (borrowing capacity) as per Government Regulation no. 30/2011 that
stipulates Local Debt. The table below shows current DSCR for the city of Batam.
DSCR & Net Borrowing Capacity of the City of Batam 2015 (in billion Rp.)
2010 2011 2012 2013 2014 2015 Avg.
Growth
A Income
Local income 159,0 324,5 413,2 606,3 779,9 840,6 39,5%
Tax/Non-tax sharing
505,5 375,9 463,5 392,1 354,1 207,1 5,2%
GAF
230,2 316,6 429,7 528,8 559,1 530,0 32,0%
Subtotal 894,7 1017,1 1306,3 1527,3 1693,2 1577,7 19,5%
B Non-Discretionary
Expenses
Personnel
584,3 660,6 735,2 814,1 917,8 670,9 2,8%
Subtotal
584,3 660,6 735,2 814,1 917,8 670,9 2,8%
C Net Discretionary Income 310,4 356,5 571,1 713,2 775,4 906,8 23,9%
D Debt
Beginning outstanding 0,0 0,0 0,0 0,0 0,0
Drawing Down New Loan 0,0 0,0 0,0 0,0 0,0
Interest 0,0 0,0 0,0 0,0 0,0 0,0
Principal repayment 0,0 0,0 0,0 0,0 0,0 0,0
Balance 0,0 0,0 0,0 0,0 0,0 0,0
E DSCR NA NA NA
Source: Actual Budget of Batam 2010-2015
The above calculation is in line with Government Regulation no. 30/2011. For this reason,
some numbers differ from numbers in previous sections, for example the amount of income
(revenues).
The formula to calculate the DSCR is:
- DSCR > 2.5 : the local government is allowed to obtain debt
- DSCR = 2.5 : the local government is allowed to obtain debt with certain condition,
- DSCR < 2.5 : the local government is not allowed to obtain debt.
All of these loans must meet the main conditions for Local Debt such Debt Service Coverage Ratio (DSCR) of 2.5, while the
total amount of loan should not exceed 75% of previous year of actual general income, no overdue with other loans from
the National Government.

Appendix B.2 9
(average of audited Net Income of previous 3 years)/ (sum of interest plus principal
repayment in current year)
The numbers show that DSCR is “NA” because Batam has not borrowed in recent years.
This means that Batam potentially can borrow to cover additional investments in green
infrastructure or even give out municipal bonds.
The formula to calculate the potential borrowing capacity is:
- Maximum 75% of the total revenues (see 1.1.) in the previous year (audited)
- Projected DSCR in years of debt repayment cannot go below 2.5. Interest rate of
government loan is 11.75% and loan duration is 20 years.
Cities that have failed to pay interest and principal in the year they want to borrow, cannot
borrow.
The table below shows the calculated maximum borrowing capacity of Batam from 2016 –
2020. It shows Batam can borrow around Rp 1.45 trillion in 2016 and a total of over Rp 3.5
trillion from 2016 – 2020. The city could borrow money from public institutions such as LPPI
or the Ministry of Finance.
Questions raised
1. What is Batam’s policy for borrowing? What is needed for the Parliament (DPRD) to approve?
2. Batam has a medium score of 0,85 according to MoF Regulation no.33/PMK.07/2015 on Map of Local Government Fiscal Capacity. How does this influence Batam’s borrowing capacity?
3. What actions can be formulated related to borrowing? Would capacity building in the field of preparing loan agreements help?
Opportunities identified
It could be beneficial for Medan to look into the opportunities to borrow. Borrowed money It
could be beneficial for Batam to look into the opportunities to borrow. Borrowed money could
be used to fund improvement of green city infrastructure. As long as the city can meet the
loan requirements and projects invested in deliver economic, environmental and social
benefits for the city, it is recommended to look into this possibility. Cities have expressed that
procedures to attract government loans are complex and that this is a barrier to start
borrowing procedures. It is suggested to formulate actions in the green city action plan aimed
at increasing the city’s capacity to attract loans. Such actions would include capacity building to increase Batam’s ability to prepare loan agreements, including financial analysis and economic cost benefits analysis of (green) investment projects for which cities intend to
attract government loans.
The Green Team showed interest in the significant borrowing potential resulting from this
initial assessment. However, the Green Team did not take a clear position on what to do with
this knowledge. No actions were formulated so far. The city could consider to develop an
action plan for public borrowing can be developed together with decision makers. This should
be combined with training and technical assistance in the field of public borrowing.

Appendix B.2 10
Projection of DSCR & Net Borrowing Capacity for the City of Batam 2016-2020 (in billion Rp.)
% Growth
Assumed 2016* 2017* 2018* 2019* 2020*
A Income
Local income 13% 950,7 1.075,1 1.215,9 1.375,1 1.555,1
Tax/Non-tax sharing 12% 231,9 259,7 290,9 325,8 364,9
GAF 8% 572,4 618,2 667,6 721,0 778,7
Subtotal 1.755,0 1.953,0 2.174,4 2.421,9 2.698,7
B Non-Discretionary
Expenses
Personnel 15,0% 771,5 887,3 1.020,4 1.173,4 1.349,4
Subtotal 771,5 887,3 1.020,4 1.173,4 1.349,4
C Net Discretionary
Income 983,4 1.065,8 1.154,1 1.248,5 1.349,3
D Debt
Beginning outstanding
- 1.431,5 2.634,3 2.879,0 3.069,8
Max. Drawing Down
New Loan 1.452,2 1.243,7 294,7 250,2 268,6
Interest (assuming
11.75% pa) 170,6 314,3 344,2 367,7 392,3
Principal repayment 20,7 41,0 50,0 59,4 70,2
Balance
1431,5 2634,3 2879,0 3069,8 3268,2
E DSCR 4,17 2,50 2,50 2,50 2,50
Source: RPJMD of Kota Batam and assessment.
6 Green Development Program
The tables below show Batam city expenditures between 2011 and 2015 labelled as fitting
Green City Attributes (based on RPJMD, by the Green Team), as well as green expenditures
as percentages of total expenditures and of real financing capacity. The tables show that:
Green expenditures have increased significantly over the past year, from little over 77
billion in 2011 to 273.5 billion in 2015 (on average 43.2% yearly growth). Green
expenditures also increased as percentage of total expenditures, from 6.5% in 2011
to 12.7% in 2015 (on average 18.4% yearly growth).
The majority of green expenditures are identified in green waste (solid waste
management, 31.5%), green transportation (roads and bridges, 42.5%) and green
water (drainage and flood control).
On average, 10.3% of yearly total expenditures is labelled as green, of which 4.57%
for green transportation and 3.48% for green waste.

Appendix B.2 11
When considering the real financing capacity, on average green expenditures make
up over 25% yearly.
Questions raised
The above tables make it possible to discuss if budget allocations should be changed in
order to reflect the priority for Green Actions and Green Investments. Questions for Green
Teams are:
1. To what extent can expenditures identified be labelled as green? Why? 2. Do budgets spent sufficiently reflect the city’s green ambitions and priorities? Or do
reasons exist to shift budgets to Green Attributes?
Cities should challenge themselves to critically look at their budget allocation and look for
opportunities to allocate sufficient budgets to prioritized green attributes (short term) and also
to other green attributes (medium term).
Opportunities identified
It is hard to judge the implication of the numbers and percentages in the tables below. For
this, the Green Team needs to discuss the numbers in more depth. Such an exercise could
start with going over the numbers and explaining why they are labelled as green, then
determining if the expenditures are for CAPEX or OPEX. Once the Green Team fully
understands the current status of green expenditures, the green team can really start
discussing where they think more budgets are needed, and if there is room to shift certain
budgets from current “non-green” budget lines, to green expenditures. It is advised that the green team takes this analysis as a basis for further discussing this as part of preparing the
GCAP 2018.
No actions have been formulated at this point.
Actual Expenditure of Green Development Program
Field Sector 2011 2012 2013 2014 2015 Total Avg
yearly Growth
% of Total
Green Community 6,3 8,1 9,7 7,8 14,0 45,8 22,2% 5,0%
Green Planning and Design 0,8 1,7 2,4 2,9 2,3 10,1 31,0% 1,1%
Urban Planning
-
0,0%
Development Planning - 0,0%
Green Open Space 1,6 4,1 6,3 5,7 6,3 24,0 40,6% 2,6%
Green Waste 31,3 45,8 72,1 74,7 72,1 295,9 23,2% 32,6%
Solid Waste Management 30,6 45,0 68,7 71,1 70,4 285,8 23,2% 31,5%
Environment 0,7 0,8 3,4 3,6 1,7 10,1 25,5% 1,1%
Green Transportation and Urban Mobility
28,3 53,6 66,0 126,4 133,9 408,3 47,4% 45,0%
Road & Bridge 28,1 51,6 61,2 118,0 126,5 385,5 45,6% 42,5%
Transportation 0,2 2,0 4,8 8,4 7,4 22,8 144,7% 2,5%
Green Water (incl. sanitation / flood control)
9,0 9,6 19,6 40,2 44,9 123,2 49,5% 13,6%

Appendix B.2 12
Water Supply 2,4 1,7 5,1 7,6 9,2 26,1 40,1% 2,9%
Sanitation 1,4 2,3 1,4 - 5,0 10,1 36,5% 1,1%
Drainage and flood control 5,2 5,6 13,1 32,6 30,7 87,1 56,2% 9,6%
Green Energy (inc. environment)
- 0,0%
Green Industry
-
0,0%
Green Building - 0,0%
Housing
-
0,0%
Total 77,3 122,9 176,0 257,7 273,5 907,4 37,2% 100,0%
% Green expenditures/ total expenditures
6,5% 8,9% 10,5% 13,1% 12,7% 10,8% 18,4%
% Green expenditures/ Real Financing Capacity
48,1% 16,4% 18,3% 25,0% 24,2% 22,5% -15,8%
Comparison Actual Expenditure of Green Development Program to Total Expenditures
(CALCULATED)
Field Sector 2011 2012 2013 2014 2015 Average
growth yearly
Average
Green Community 0,52% 0,59% 0,58% 0,40% 0,65% 5,46% 0,55%
Green Planning and Design 0,07% 0,12% 0,14% 0,15% 0,11% 13,12% 0,12%
Green Open Space 0,13% 0,30% 0,38% 0,29% 0,29% 21,39% 0,28%
Green Waste 2,61% 3,32% 4,30% 3,80% 3,35% 6,37% 3,48%
Green Transportation and Urban Mobility
2,37% 3,89% 3,94% 6,43% 6,22% 27,29% 4,57%
Green Water (incl. sanitation / flood control)
0,75% 0,70% 1,17% 2,04% 2,08% 29,07% 1,35%
Green Energy (incl environment) 0,00% 0,00% 0,00% 0,00% 0,00% NA 0,00%
Green Industry 0,00% 0,00% 0,00% 0,00% 0,00% NA 0,00%
Green Building 0,00% 0,00% 0,00% 0,00% 0,00% NA 0,00%
Total 6,5% 8,9% 10,5% 13,1% 12,7% 18,4% 10,3%
Comparison Actual Expenditure of Green Development Program to Real Financing
Capacity (CALCULATED)
Field Sector 2011 2012 2013 2014 2015 Average
growth yearly
Average
Green Community 3,9% 1,1% 1,0% 0,8% 1,2% -24,98% 1,6%
Green Planning and Design 0,5% 0,2% 0,3% 0,3% 0,2% -19,53% 0,3%
Green Open Space 1,0% 0,5% 0,7% 0,5% 0,6% -13,65% 0,7%
Green Waste 19,5% 6,1% 7,5% 7,2% 6,4% -24,33% 9,3%
Green Transportation and Urban 17,6% 7,1% 6,9% 12,2% 11,9% -9,45% 11,1%

Appendix B.2 13
Mobility
Green Water 5,6% 1,3% 2,0% 3,9% 4,0% -8,18% 3,4%
Green Energy 0,0% 0,0% 0,0% 0,0% 0,0% NA 0,0%
Green Industry 0,0% 0,0% 0,0% 0,0% 0,0% NA 0,0%
Green Building 0,0% 0,0% 0,0% 0,0% 0,0% NA 0,0%
Total 48,1% 16,4% 18,3% 25,0% 24,2% -15,8% 26,4%
APPENDIX B.3
Municipal Financial Assessment
Review of the City of Kendari
TA-8518 INO: Green Cities
A Sustainable Urban Future in Indonesia 2 - Capacity
Development

Appendix B.3 1
MUNICIPAL FINANCES OF THE CITY GOVERNMENT OF KENDARI
This report assesses various aspects of the city government of Kendari City budgets and
raises questions for the Green Team aimed at considering options and actions to: increase
revenues, spent budgets more efficient and effective, and attract loans.
1 Objective
Analysis of the public budget is undertaken with the objective:
To be better able to assess if Kendari city has funds available to finance specific
programs / projects aimed at improving Kendari’s green profile (Kendari city budgets)?
To identify opportunities to increase availability of funds for green urban projects by:
o Increasing availability of general city budgets by – for example – improving the financial efficiency of the city administration, increasing tax collection rates or introducing new local taxes and levies;
o Increasing availability of city budgets by prioritizing budgets specifically for green investments by – for example – shifting budgets towards green projects.
o Borrowing funds
2 Actual Budget
Description of financial management for Kendari local financial management operation is
stipulated by Ministry of Home Affairs no.13/2006 (“Guidelines for Management of Local Finances”) and no.21/2011.
The table below provides general insight in the actual budget realization between 2010 to
2015: what revenues were generated? how much was spent? Was there money left (surplus/
deficit)? And what is the SILPA at the end of each year (unused budgets on cash balance
city)?
This chapter calculates average shares based on summarized totals of the years considered.
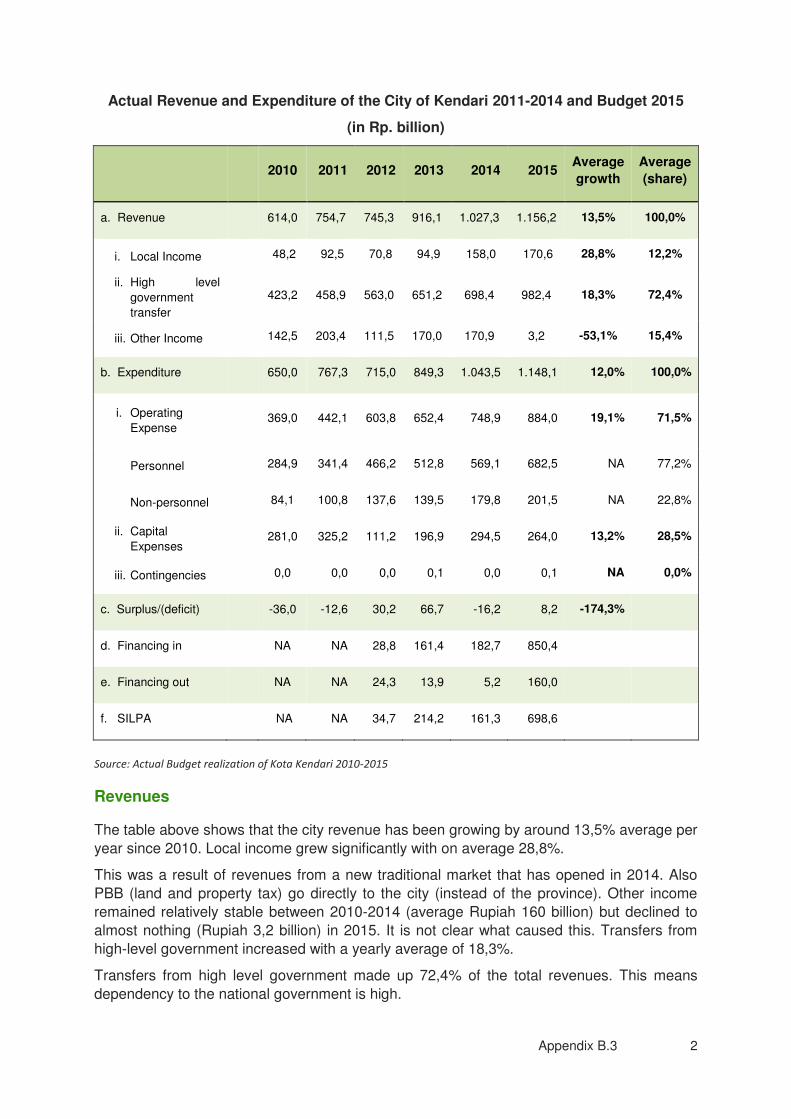
Appendix B.3 2
Actual Revenue and Expenditure of the City of Kendari 2011-2014 and Budget 2015
(in Rp. billion)
2010 2011 2012 2013 2014 2015 Average
growth
Average
(share)
a. Revenue 614,0 754,7 745,3 916,1 1.027,3 1.156,2 13,5% 100,0%
i. Local Income 48,2 92,5 70,8 94,9 158,0 170,6 28,8% 12,2%
ii. High level
government
transfer
423,2 458,9 563,0 651,2 698,4 982,4 18,3% 72,4%
iii. Other Income 142,5 203,4 111,5 170,0 170,9 3,2 -53,1% 15,4%
b. Expenditure 650,0 767,3 715,0 849,3 1.043,5 1.148,1 12,0% 100,0%
i. Operating
Expense
369,0 442,1 603,8 652,4 748,9 884,0 19,1% 71,5%
Personnel 284,9 341,4 466,2 512,8 569,1 682,5 NA 77,2%
Non-personnel 84,1 100,8 137,6 139,5 179,8 201,5 NA 22,8%
ii. Capital
Expenses 281,0 325,2 111,2 196,9 294,5 264,0 13,2% 28,5%
iii. Contingencies 0,0 0,0 0,0 0,1 0,0 0,1 NA 0,0%
c. Surplus/(deficit) -36,0 -12,6 30,2 66,7 -16,2 8,2 -174,3%
d. Financing in NA NA 28,8 161,4 182,7 850,4
e. Financing out NA NA 24,3 13,9 5,2 160,0
f. SILPA NA NA 34,7 214,2 161,3 698,6
Source: Actual Budget realization of Kota Kendari 2010-2015
Revenues
The table above shows that the city revenue has been growing by around 13,5% average per
year since 2010. Local income grew significantly with on average 28,8%.
This was a result of revenues from a new traditional market that has opened in 2014. Also
PBB (land and property tax) go directly to the city (instead of the province). Other income
remained relatively stable between 2010-2014 (average Rupiah 160 billion) but declined to
almost nothing (Rupiah 3,2 billion) in 2015. It is not clear what caused this. Transfers from
high-level government increased with a yearly average of 18,3%.
Transfers from high level government made up 72,4% of the total revenues. This means
dependency to the national government is high.

Appendix B.3 3
Based on PAD analysis for 2010 – 2015 below, it can be concluded that taxes and levies
made up the majority of local income and also grew most. This is based on the numbers
available for 2013 and 2014. Contributions from local BUMDs (such as PDAM, Hospitals,
etc.) are low, only 1,7% of the total local revenues.
Actual Revenue splits 2010-2015 (in Rupiah billion)
2010 2011 2012 2013 2014 2015 Average yearly growth
Average (made up of..)
Revenue Income 614,0 754,7 745,3 916,1 1.027,
3 1.156,
2 13,5% 100,0%
a. Local Income (PAD)
48,2 92,5 70,8 94,9 158,0 170,6 28,8% 12,2%
i. Tax NA NA NA 45,6 72,1 77,9 30,8% 46,6%
ii. Retribution (levies) NA NA NA 35,9 50,4 54,4 23,2% 34,1%
iii. Separated Local Asset Mgt Result BUMD)
NA NA NA 2,3 2,0 2,1 -2,8% 1,7%
iv. Other Local Income NA NA NA 11,1 33,5 36,1 80,0% 17,6%
b. Transfer 423,2 458,9 563,0 651,2 698,4 982,4 18,3% 72,4%
i. Tax/Non-tax Sharing NA NA NA 41,2 31,8 44,8 4,3% 5,4%
ii. General Allocated Fund
NA NA NA 555,7 611,2 859,7 24,4% 86,5%
iii. Specific Allocated Fund
NA NA NA 54,3 55,4 77,9 19,8% 8,1%
iv. Adjustment Fund 142,5 203,4 111,5 170,0 170,9 3,2 -53,1% 15,4%
c. Other Income 614,0 754,7 745,3 916,1 1.027,
3 1.156,
2 13,5% 100,0%
Source: Actual Budget Report 2010-2015
Questions raised
How can Kendari increase its local income (PAD)? What are the opportunities to increase
levies, retributions and revenues from BUMD? (see point 14 of Annex on Municipal Finance
for reference and inspiration).
Opportunities identified
It was mentioned that a Kadaster could help to increase the collection rate of PBB (land and
property tax). Also, Kendari is implementing automatic portal system and electronic parking.
Expenditures
The average yearly growth of expenditures was 12% per year from 2010. Revenue growth
was slightly higher with 13,5%. However, because of yearly fluctuations there are years with
a small deficit.
The growth % of CAPEX expenditures from 2010 was higher than the total growth (13,2%
versus 12%). This means the city is increasing its effectiveness in terms of CAPEX spending,
but only slightly. The operating expense (OPEX) dominated the city spending which amount
to 71,5 % leaving 28,5% for capital expenses. OPEX mainly consists out of expenses for
personnel (77,2% based on numbers available for 2013 and 2014). Kendari has around 7
thousand civil servants. Civil servants usually have an appointment for life. This makes
personnel costs hard to control. However, policies of phasing out personnel could be
considered. Expenses for salaries increased 26% yearly on average over the past 6 years

Appendix B.3 4
(2010-2015). This is not necessarily a bad sign given that salaries were low. High personnel
costs leaves a maximum of 16,3% of total OPEX budget for maintaining infrastructure.
This spending applies principally to capital expenditure and the purchase of goods and
services from third party vendors. CAPEX spending in Kendari is concentrated in the last few
months of the fiscal year. This partly causes a high SILPA (unused budgets, including
outstanding payments). In Kendari:
About half of all procurement is done in the last three months of the fiscal year. It has
even happened that over 40%-50% of expenditures were disbursed in December
(last month).
Delays in procurement are mainly caused by poor project preparation. Projects come
to a halt at the end of each budget year. In some cases, funding for projects can only
continue later. The delays appear to reflect caution resulting from the government’s anti-corruption efforts.
Questions raised
1. How can Kendari increase its capital expenditures? 2. How are expenditures in Kendari divided over the year? Are most of the expenditures
(and revenues) at the end of the year? How does this influence the impact of expenditures on the quality of the city? Can this be improved?
Opportunities identified
Non-discretionary expenses are hard to decrease, especially the costs of personnel.
Government employees have contracts for life. Not further discussed by Green Team
because of lack of time/ priority. No actions have been identified.
3 Ratios
A number of ratios have been used to assess the financial condition of the city.
The independency from central government funding measured by local income as %
of high level government transfers (independency) and of total revenues (fiscal
decentralize). The higher this percentage, the more independent a city is.
The effectiveness of the city measured by percentage of capital expenditures
(CAPEX), goods and services and personnel expenditures as % of the total
expenditures. The higher the % of CAPEX, the better, the lower the % for personnel
expenditures, the better.
The average ratios in this chapter are based on the yearly ratios (in contrary to the average
of the summarized totals as in the previous chapter). Numbers will slightly differ with
percentages calculated in the previous chapter.
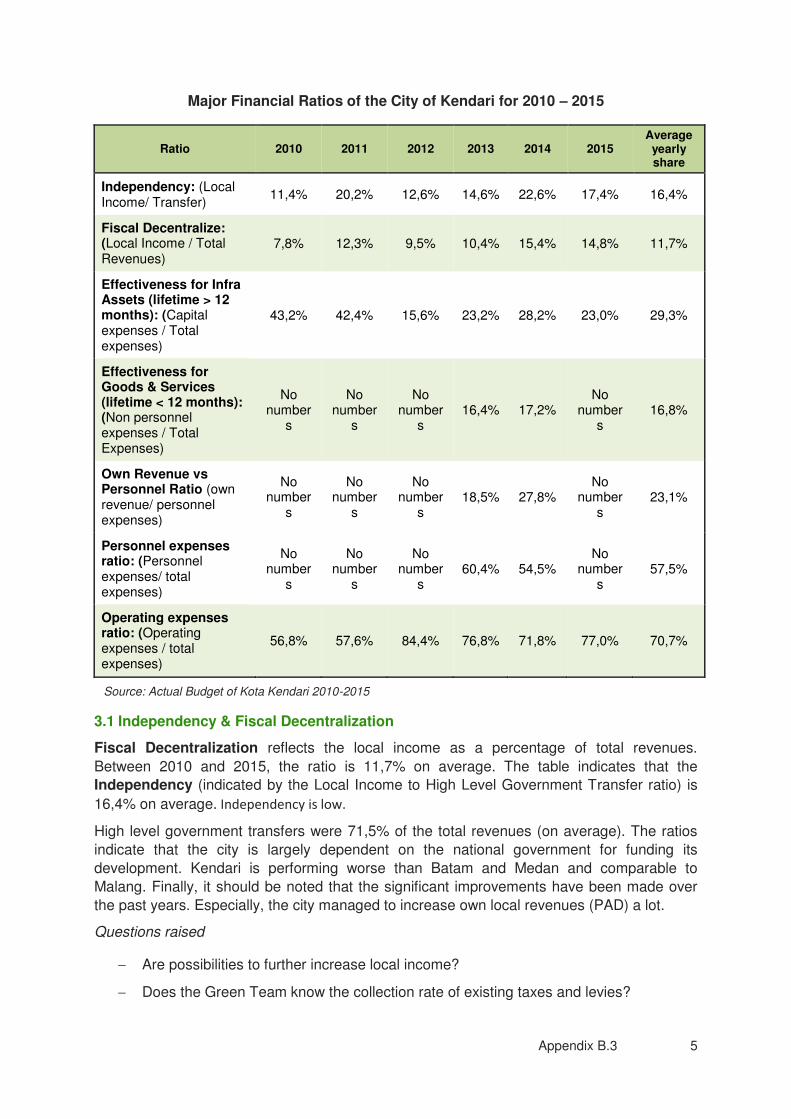
Appendix B.3 5
Major Financial Ratios of the City of Kendari for 2010 – 2015
Ratio 2010 2011 2012 2013 2014 2015 Average yearly share
Independency: (Local Income/ Transfer)
11,4% 20,2% 12,6% 14,6% 22,6% 17,4% 16,4%
Fiscal Decentralize: (Local Income / Total Revenues)
7,8% 12,3% 9,5% 10,4% 15,4% 14,8% 11,7%
Effectiveness for Infra Assets (lifetime > 12 months): (Capital expenses / Total expenses)
43,2% 42,4% 15,6% 23,2% 28,2% 23,0% 29,3%
Effectiveness for Goods & Services (lifetime < 12 months): (Non personnel expenses / Total Expenses)
No number
s
No number
s
No number
s 16,4% 17,2%
No number
s 16,8%
Own Revenue vs Personnel Ratio (own revenue/ personnel expenses)
No number
s
No number
s
No number
s 18,5% 27,8%
No number
s 23,1%
Personnel expenses ratio: (Personnel expenses/ total expenses)
No number
s
No number
s
No number
s 60,4% 54,5%
No number
s 57,5%
Operating expenses ratio: (Operating expenses / total expenses)
56,8% 57,6% 84,4% 76,8% 71,8% 77,0% 70,7%
Source: Actual Budget of Kota Kendari 2010-2015
3.1 Independency & Fiscal Decentralization
Fiscal Decentralization reflects the local income as a percentage of total revenues.
Between 2010 and 2015, the ratio is 11,7% on average. The table indicates that the
Independency (indicated by the Local Income to High Level Government Transfer ratio) is
16,4% on average. Independency is low.
High level government transfers were 71,5% of the total revenues (on average). The ratios
indicate that the city is largely dependent on the national government for funding its
development. Kendari is performing worse than Batam and Medan and comparable to
Malang. Finally, it should be noted that the significant improvements have been made over
the past years. Especially, the city managed to increase own local revenues (PAD) a lot.
Questions raised
Are possibilities to further increase local income?
Does the Green Team know the collection rate of existing taxes and levies?

Appendix B.3 6
Can collection rates or taxes and levies be improved? (intensifikasi)
Can new taxes and levies be implemented? (ekstensifikasi)
Opportunities identified
It was mentioned that a Kadaster could help to increase the collection rate of PBB (land and
property tax). Also, Kendari is implementing automatic portal system and electronic parking.
3.2 Effectiveness
The ratio between capital expense and total expenditures (29,3% - the effectiveness for infra
assets with a lifetime > 12 months) shows that most of the expenditures are for operating
expenses (70.7 %). Of operating expenses 77,3% goes to personnel (equalling 57,5% of
total expenditures). No measures are taken to control personnel expenses. Expenses for
salaries increased 26% yearly on average over the past 6 years (2010-2015).
This means a maximum of 16,8% of total expenditures could theoretically have been used
for maintaining local government assets for transport, waste, buildings, etc.) (the
effectiveness of goods and services with a lifetime <12 months, minus other expenses)
Questions
Kendari spends little of the available budgets end up where they are most needed, being
capital and operating expenditures to improve and maintain the cities infrastructure.
- How can the city improve such ratios?
- Can expenditures for CAPEX be increased?
- What are the main hurdles to do so?
- And how can these hurdles be overcome?
Opportunities identified
Non-discretionary expenses are hard to decrease, especially the costs of personnel.
Government employees have contracts for life. Not further discussed by Green Team
because of lack of time/ priority. No actions have been identified.
Local Government Fiscal Capacity (MoF Reg. No 33/PMK/2015)
Furthermore, according to MoF Regulation no.33/PMK.07/2015 on Map of Local Government
Fiscal Capacity, the city of Kendari has scored 0,72. This is classified as Medium and in the
same range as the City of Batam (0,85 in 2015 - medium), and Malang City (0,70 - medium).
Medan scores only 0,25 (low).
Point 21 in the Annex to the DFR on “Municipal Urban Finance System in Indonesia” provides more information on the way the score is determined (looking at income item’s such as DAU, personnel expenses, and number of poor people living in the city.
While the score is good. It is worrisome that Kendari is very dependent on high level
government transfers and doesn’t spend much budget on capital projects and maintenance.
4 Real Financing Capacity
Real financing capacity is ability of the city to finance its needs after paying non-discretionary
expenses, mainly personnel expenses and other high priority expenses. The real financing
capacity is the amount that can be used for flexible expenses, including investment,

Appendix B.3 7
maintenance and operation of green infrastructure. Personnel expenses for 2010, 2011 and
2015 are based on the % of total operating expenses in 2013 and 2014 (77,2% on average).
Other expenses are calculated as 15% of operating expenditures. Because no information
about SILPA for 2010-2012 was received, the Real Financing Capacity is only calculated for
2013-2015.
Real Financing Capacity of the City of Kendari (in billion Rp)
2010 2011 2012 2013 2014 2015
1 Revenue 614,0 754,7 745,3 916,1 1.027,3 1.156,2
2 Previous
Surplus/Deficit
(SILPA)
NA NA NA 34,7 214,2 161,3
Sub total
Revenue NA NA NA 950,8 1.241,5 1.317,5
Deducted by non-
discretionary and high
priority expense:
3 Personnel expense 284,9 341,4 466,2 512,8 569,1 682,5
4 Other expense 55,4 66,3 90,6 97,9 112,3 132,6
Sub Total 340,3 407,7 556,8 610,7 681,5 815,1
5 Real Financing
Capacity NA NA NA 340,1 560,0 502,4
Source: Actual Budget of Kota Kendari 2013-2014, calculatios and assumptions Green Team
The table shows that the real financing capacity of the city between 2013 and 2015 is
between Rp. 340,1 billion and Rp. 502,4 billion. However, this increase is mainly cause by
SILPA (unused budgets) from previous years.
Questions raised
1. Can the Real Financing Capacity can be increased? (by increasing revenues or decreasing non-discretionary expenses)?
2. Does the increasing Real Financing Capacity provide opportunities to allocate extra budgets to green investments related to realizing and maintaining green urban infrastructures?
Opportunities identified
It was mentioned that a Kadaster could help to increase the collection rate of PBB (land and
property tax). Also, Kendari is implementing automatic portal system and electronic parking.

Appendix B.3 8
5 Debt Service Coverage Ratio and Net Borrowing Capacity
Debt Service Coverage ration (DSCR)1 is a ratio to measure capability of a local government
to repay its outstanding debt and interest (usually used for middle or long term debt). It is one
of the requirements to attract new debt (borrowing capacity) as per Government Regulation
no. 30/2011 that stipulates Local Debt. The table below shows current DSCR for the city of
Kendari.
DSCR & Net Borrowing Capacity of the City of Kendari 2015 (in billion Rp.)
2010 2011 2012 2013 2014 2015 Avg.Growth
A Income
Local income 48,2 92,5 70,8 94,9 158,0 170,6 28,8%
Tax/Non-tax sharing NA NA NA 41,2 31,8 44,8 4,3%
GAF NA NA NA 555,7 611,2 859,7 24,4%
Subtotal NA NA NA 691,8 801,0 1075,1
B Non-Discretionary
Expenses
Personnel
284,9 341,4 466,2 512,8 569,1 682,5 NA
Subtotal
284,9 341,4 466,2 512,8 569,1 682,5 19,1%
C Net Discretionary Income NA NA NA 178,9 231,9 392,6 NA
D Debt
Beginning outstanding 0,0 0,0 0,0 0,0 0,0
Drawing Down New Loan 0,0 0,0 0,0 0,0 0,0
Interest 0,0 0,0 0,0 0,0 0,0 0,0
Principal repayment 0,0 0,0 0,0 0,0 0,0 0,0
Balance 0,0 0,0 0,0 0,0 0,0 0,0
E DSCR NA NA NA
Source: Actual Budget of Kendari 2011-2015, and Consultant Assessment
The above calculation is in line with Government Regulation no. 30/2011. For this reason,
some numbers differ from numbers in previous sections, for example the amount of income
(revenues).
1 Government Regulations No 30/2011 stipulates that Cities can borrow from the National Government, financial
institutions (bank or non-bank), other local government and people. The regulation stipulate that:
- DSCR > 2.5 : the local government is allowed to obtain debt
- DSCR = 2.5 : the local government is allowed to obtain debt with certain condition,
- DSCR < 2.5 : the local government is not allowed to obtain debt.
All of these loans must meet the main conditions for Local Debt such Debt Service Coverage Ratio (DSCR) of 2.5, while the
total amount of loan should not exceed 75% of previous year of actual general income, no overdue with other loans from
the National Government.

Appendix B.3 9
The formula to calculate the DSCR is:
(average of audited Net Income of previous 3 years)/ (sum of interest plus principal
repayment in current year)
The table shows that Kendari is not borrowing money. This means that Kendari potentially
can borrow to cover additional investments in green infrastructure or even give out municipal
bonds.
The formula to calculate the potential borrowing capacity is:
Maximum 75% of the total revenues (see 1.1.) in the previous year (audited)
Projected DSCR in years of debt repayment cannot go below 2.5. Interest rate of
government loan is 11.75% and loan duration is 20 years.
Cities that have failed to pay interest and principal in the year they want to borrow, cannot
borrow.
The table below shows the calculated maximum borrowing capacity of Kendari from 2016 –
2020. It shows Kendari can borrow little over Rp 800 billion in 2016 and almost 1.600 billion
from 2016 - 2010.
Questions raised
1. What is Kendari’s policy for borrowing? What is needed for the Parliament (DPRD) to approve?
2. Kendari has a medium score of 0,72 according to MoF Regulation no.33/PMK.07/2015 on Map of Local Government Fiscal Capacity. How does this influence Kendari’s borrowing capacity?
3. What actions can be formulated related to borrowing? Would capacity building in the field of preparing loan agreements help?
Opportunities identified
It could be beneficial for Kendari to look into the opportunities to borrow. Borrowed money
could be used to fund improvement of green city infrastructure. As long as the city can meet
the loan requirements and projects invested in deliver economic, environmental and social
benefits for the city, it is recommended to look into this possibility. Cities have expressed that
procedures to attract government loans are complex and that this is a barrier to start
borrowing procedures. It is suggested to formulate actions in the green city action plan aimed
at increasing the city’s capacity to attract loans. Such actions would include capacity building to increase Kendari’s ability to prepare loan agreements, including financial analysis and economic cost benefits analysis of (green) investment projects for which cities intend to
attract government loans.
The Green Team did not discuss possible actions to further explore this opportunity.
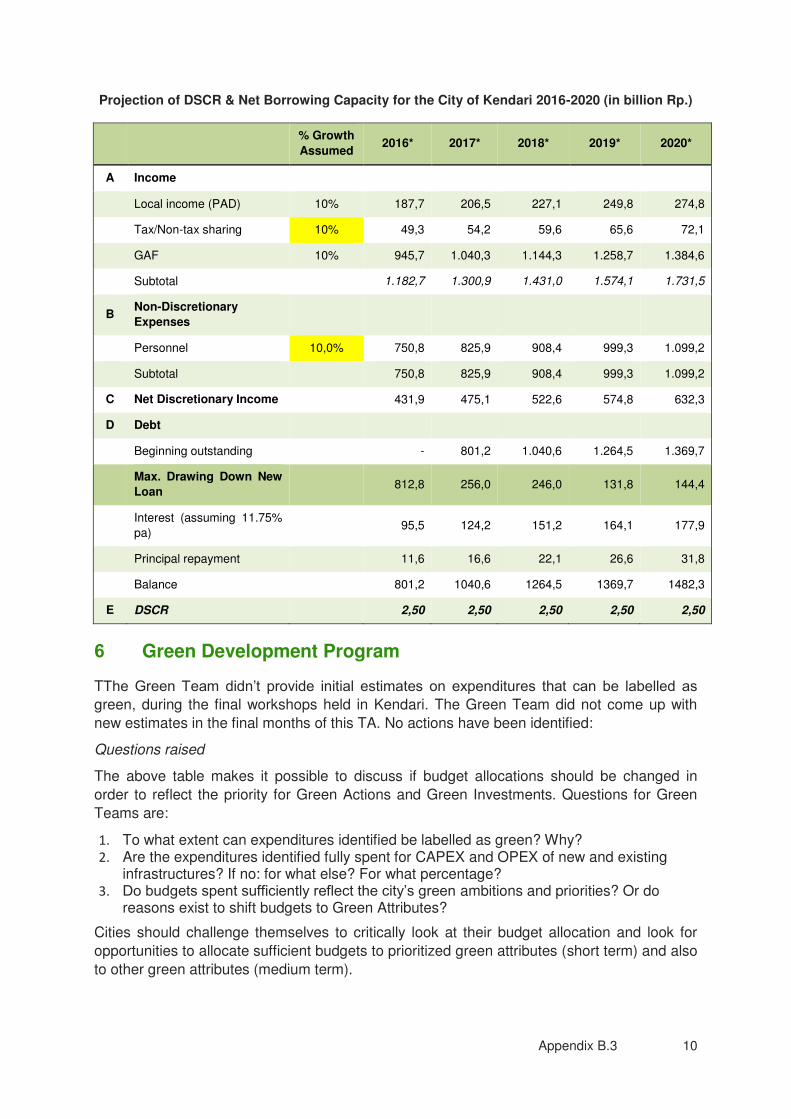
Appendix B.3 10
Projection of DSCR & Net Borrowing Capacity for the City of Kendari 2016-2020 (in billion Rp.)
% Growth
Assumed 2016* 2017* 2018* 2019* 2020*
A Income
Local income (PAD) 10% 187,7 206,5 227,1 249,8 274,8
Tax/Non-tax sharing 10% 49,3 54,2 59,6 65,6 72,1
GAF 10% 945,7 1.040,3 1.144,3 1.258,7 1.384,6
Subtotal 1.182,7 1.300,9 1.431,0 1.574,1 1.731,5
B Non-Discretionary
Expenses
Personnel 10,0% 750,8 825,9 908,4 999,3 1.099,2
Subtotal 750,8 825,9 908,4 999,3 1.099,2
C Net Discretionary Income
431,9 475,1 522,6 574,8 632,3
D Debt
Beginning outstanding
- 801,2 1.040,6 1.264,5 1.369,7
Max. Drawing Down New
Loan 812,8 256,0 246,0 131,8 144,4
Interest (assuming 11.75%
pa) 95,5 124,2 151,2 164,1 177,9
Principal repayment 11,6 16,6 22,1 26,6 31,8
Balance
801,2 1040,6 1264,5 1369,7 1482,3
E DSCR 2,50 2,50 2,50 2,50 2,50
6 Green Development Program
TThe Green Team didn’t provide initial estimates on expenditures that can be labelled as green, during the final workshops held in Kendari. The Green Team did not come up with
new estimates in the final months of this TA. No actions have been identified:
Questions raised
The above table makes it possible to discuss if budget allocations should be changed in
order to reflect the priority for Green Actions and Green Investments. Questions for Green
Teams are:
1. To what extent can expenditures identified be labelled as green? Why? 2. Are the expenditures identified fully spent for CAPEX and OPEX of new and existing
infrastructures? If no: for what else? For what percentage? 3. Do budgets spent sufficiently reflect the city’s green ambitions and priorities? Or do
reasons exist to shift budgets to Green Attributes?
Cities should challenge themselves to critically look at their budget allocation and look for
opportunities to allocate sufficient budgets to prioritized green attributes (short term) and also
to other green attributes (medium term).

APPENDIX B.4
Municipal Financial Assessment
Review of Malang
TA-8518 INO: Green Cities
A Sustainable Urban Future in Indonesia 2 - Capacity
Development

Appendix B.4 1
MUNICIPAL FINANCES OF THE CITY GOVERNMENT OF MALANG
This report assesses various aspects of the city government of Malang City budgets and
raises questions for the Green Team aimed at considering options and actions to: increase
revenues, spent budgets more efficient and effective, and attract loans.
1 Objective
Analysis of the public budget is undertaken with the objective:
To be better able to assess if Malang city has funds available to finance specific
programs / projects aimed at improving Malang’s green profile (Malang city budgets)?
To identify opportunities to increase availability of funds for green urban projects by:
o Increasing availability of general city budgets by – for example – improving the financial efficiency of the city administration, increasing tax collection rates or introducing new local taxes and levies;
o Increasing availability of city budgets by prioritizing budgets specifically for green investments by – for example – shifting budgets towards green projects.
o Borrowing
2 Actual Budget
Description of financial management for Malang local financial management operation is
stipulated by Ministry of Home Affairs no.13/2006 (“Guidelines for Management of Local Finances”) and no.21/2011.
The table below provides general insight in the actual budget realization between 2011 to
2015: what revenues were generated? how much was spent? Was there money left (surplus/
deficit)? And what is the SILPA at the end of each year (unused budgets on cash balance
city)?
This chapter calculates average shares based on summarized totals of the years considered.

Appendix B.4 2
Actual Revenue and Expenditure of the City of Malang 2011-2015 (in Rupiah billion)
2011 2012 2013 2014 2015*
Average
yearly
growth
Share (of
revenues/
expenditures)
a. Revenue 1.103,0 1.356,4 1.524,8 1.764,9 1.927,1 14,97% 100,00%
i. Local Income 185,8 230,3 317,9 372,6 353,4 17,44% 19,02%
ii. High level
government
transfer
752,3 919,6 1.164,4 1.329,1 1.347,9 15,70% 71,82%
iii. Other Income 164,9 206,5 42,6 63,2 225,8 8,18% 9,16%
b. Expenditure 1.048,4 1.252,3 1.486,4 1.603,0 1.803,2 14,52% 100,00%
i. Operating
Expense 885,7 983,4 1.133,0 1.284,4 1.494,8 13,98% 80,37%
ii. Capital Expense 160,2 268,3 353,3 318,5 306,3 17,59% 19,55%
iii. Contingencies 2,5 0,6 0,1 0,1 2,1 -4,34% 0,08%
c. Surplus/(deficit) 54,6 104,1 38,5 161,9 123,9 22,75% 6,29%
d. Financing in 20,1 58,3 161,4 182,7 119,8 56,25% 7,06%
e. Financing out 7,6 65,0 17,2 21,6 18,0 23,93% 1,69%
f. SILPA 67,1 97,4 182,7 323,0 225,7 35,45% 11,67%
Source: Actual Budget Report 2011-2015
Revenues
The table above shows that the city revenue has been growing by around 14.97% average
per year since 2011. Growth is made up of local income (strongest growth with 17.44%),
transfers from high-level government (15.70%) and other income (8.18%).
Transfers from high level government made up 71.82% of the total revenue, 19.02% of local
income (PAD) and 9.16% of other income. This means dependency to the national
government is considerably high. Malang is performing less than Medan (transfers from high
level government made up 63.2%) and Batam (63.5%).
Based on PAD analysis for 2011 - 2015, it can be concluded that taxes have by far the
biggest share (73.4%) followed by levies (13.1%). Contributions from local BUMDs (such as
PDAM, Hospitals, etc.) are low 4.7% of the total local revenues.

Appendix B.4 3
Actual Revenue splits 2010-2015 (in Rupiah billion)
2011 2012 2013 2014 2015 Average yearly growth
Average (made up of..)
Revenue Income 1.103,0 1.356,4 1.524,8 1.764,9 1.927,1 15,0% 100,0%
a. Local Income (PAD)
185,8 230,3 317,9 372,6 353,4 17,4% 19,0%
i. Tax 125,3 159,1 238,5 278,9 270,0 21,2% 73,4%
ii. Levies & Retribution
31,2 35,6 38,5 45,6 40,3 6,6% 13,1%
iii. Separated Local Asset Mgt Result (BUMD)
13,3 14,4 16,6 13,4 11,7 -3,2% 4,7%
iv. Other Local Income
16,0 21,2 24,3 34,7 31,4 18,4% 8,7%
b. Transfer 752,3 919,6 1.164,4 1.329,1 1.347,9 15,7% 71,8%
i. Tax/Non-tax Sharing
202,9 231,8 387,4 489,4 528,6 27,0% 33,4%
ii. General Allocated Fund
533,8 665,9 746,7 808,4 818,8 11,3% 64,8%
iii. Specific Allocated Fund
15,6 21,9 30,3 31,3 0,6 -56,0% 1,8%
c. Other Income 164,9 206,5 42,6 63,2 225,8 8,2% 9,2%
Source: Actual Budget Report 2011-2015
Questions raised
How can Malang increase its local income (PAD)? What are the opportunities to increase
levies, retributions and revenues from BUMD? (see point 14 of Annex on Municipal Finance
for reference and inspiration).
Actions identified
Related to local government revenues (PAD), the green team mentioned a number of
ongoing actions to improve PAD, such as:
Introduction of E-tax to increase collection rate
Set-up of 1-stop shop with easier procedures so that more people will apply for
licenses
Introduction of new taxes (extensification) for example for advertising
Tariff adjustment (for example street parking, from 1k to 2k)
Increase licenses provided by mobile desks (for example for small businesses)
Start public campaign to create awareness about tax obligations (sosialisasi)
Improve database building permit (IMB, currently 70%). This will also help to improve
revenues from property taxes (PBB).

Appendix B.4 4
Malang is not yet looking into the possibilities of implementing green tax incentives and
levies. For example, tax deductions (PBB) for green buildings, and higher taxes for polluting
buildings.
No additional actions have been identified. Existing actions can be highlighted in the GCAP.
Expenditures
The yearly growth of expenditures was 14.52% per year from 2011. Revenue growth was
slightly higher with 14.97% leaving a stable budget surplus. SILPA (cashflow balance from
unused budgets) has gone up as percentage of total revenues.
The growth % of CAPEX expenditures from 2011 was higher than the total growth (17.59%
versus 14.52%). This means the city is increasing its effectiveness in terms of CAPEX
spending. The operating expense (OPEX) mainly consist out of expenses for personnel,
goods and services for city administration (such as energy bill, office supplies, furniture, etc.),
maintenance and operation of city infrastructure. OPEX dominated the city spending which
amount to 80.5 % leaving 19.5% for capital expenses.
Malang City government does not fully use all of their budget allocations as we can see from
the year on year budget surplus (between 4.9% and 6.4% of yearly revenues between 2011
– 2015). Such under spending applies principally to capital expenditure and the purchase of
goods and services from third party vendors. A yearly financing surplus results in an
increasing SILPA (cash flow balance reflecting unused budgets). Main explanation for SILPA
and financing surplus (financing in – financing out) is that city’s expenditures take time to prepare. About half of the expenditures fall in the last three months of the fiscal year. Delays
can be decreased by:
Improving budget planning (RPJMD/ APBD) and decision making. The city of Malang
is implementing actions for this (SAKIP).
Procure and implement projects more timely and efficient. The green team has
indicated that the current technical capacity of involved city officials is sufficient. It
could be worthwhile to review the current decision making structures: can decision
making about Green Team proposals be improved? (including budget allocation.
Questions raised
1. How can Malang increase its capital expenditures? 2. How are expenditures in Malang divided over the year? Are most of the expenditures
(and revenues) at the end of the year? How does this influence the impact of expenditures on the quality of the city? Can this be improved?
Opportunities identified
Malang is applying Performance-based development planning. This is based on Perwal 30,
2015. Personnel expenses cannot be decreased. Rising local income (PAD) can result in
increased capital expenditures. Also, expenditures can be increased by looking for
alternative sources (private investments, CSR, crowdfunding, etc.).
Malang is working to improve its planning and budgeting processes. The most important
point of attention is to start the planning process and the preparation of projects and
procurement already in the year before the budgets become available.
The city already has taken action to improve planning and procurement to reduce SILPA.
The actions are bundled under SAKIP. The technical capacity of public officials is already

Appendix B.4 5
sufficient to plan and procure timely. It could be worthwhile to review the current decision
making structures: can decision making about Green Team proposals be improved?
(including budget allocation)
The Green Team indicated to consider reviewing and improving decision making structure
related to planning, budgeting, project preparation and procurement (CAPEX related). Also,
existing actions can be highlighted in the GCAP.
3 Ratios
A number of ratios have been used to assess the financial condition of the city.
The independency from central government funding measured by local income as %
of high level government transfers (independency) and of total revenues (fiscal
decentralize). The higher this percentage, the more independent a city is.
The effectiveness of the city measured by percentage of capital expenditures
(CAPEX), goods and services and personnel expenditures as % of the total
expenditures. The higher the % of CAPEX, the better, the lower the % for personnel
expenditures, the better.
The average ratios in this chapter are based on the yearly ratios (in contrary to the average
of the summarized totals as in the previous chapter). Numbers will slightly differ with
percentages calculated in the previous chapter.
Major Financial Ratios of the City of Malang for 2011 –2015
Ratio 2011 2012 2013 2014 2015 Average
Independency: (Local Income/ Transfer)
24,7% 25,0% 27,3% 28,0% 26,2% 26,3%
Fiscal Decentralize: (Local Income / Total Revenues)
16,8% 17,0% 20,8% 21,1% 18,3% 18,8%
Effectiveness for Infra Assets (lifetime > 12 months): (Capital expenses / Total expenses)
15,3% 21,4% 23,8% 19,9% 17,0% 19,5%
Effectiveness for Goods & Services (lifetime < 12 months): (Non personnel expenses / Total Expenses)
26,7% 22,4% 24,6% 25,4% 28,0% 25,4%
Own Revenue vs Personnel Ratio (own revenue/ personnel expenses)
30,7% 32,7% 41,4% 42,5% 35,7% 36,6%
Personnel expenses ratio: (Personnel expenses/ total expenses)
57,8% 56,2% 51,6% 54,7% 54,9% 55,0%
Operating expenses ratio: (Operating expenses / total expenses)
84,5% 78,5% 76,2% 80,1% 82,9% 80,5%
Source: Actual Budget of Kota Malang 2011-2015

Appendix B.4 6
3.1 Independency & Fiscal Decentralization
Fiscal Decentralization reflects the local income as a percentage of total revenues.
Between 2011 and 2015, the ratio is 18.8% on average. The table indicates that the
Independency (indicated by the Local Income to High Level Government Transfer ratio) is
26.3% on average. This means the Malang City has improved their status from “as instructive by Central Government (FY 2010-2011), independency ratio <25%”, increased to “consultative level, ratio 27.3% - 26.2%” (FY 2013, 2014, 2015).
High level government transfers were 71.5% of the total revenues. The ratios indicate that
the city has been largely dependent from the national government for funding its
development. Its performance is comparable to Kendari. Medan is doing better (transfers are
63.3% of total revenues), just as Batam (65%).
Questions raised
Are possibilities to further increase local income?
Does the Green Team know the collection rate of existing taxes and levies?
Can collection rates or taxes and levies be improved? (intensifikasi)
Can new taxes and levies be implemented? (ekstensifikasi)
The Annex to the DFR on “Municipal Urban Finance System in Indonesia” provides more background on taxes and levies.
Opportunities identified
The green team indicated that waste levies will be increased just as parking tariffs.
It suggested to look for possibilities to implement so-called green incentives. For example,
property owners could be charged higher property taxes (PBB) if their property does not
meet “green standards” (green building codes, energy and water efficiency, waste management, etc.)..
3.2 Effectiveness
The ratio between capital expense and total expenditures (19.5% - the effectiveness for infra
assets with a lifetime > 12 months) shows that most of the expenditures are for operating
expenses (80.5 %). Of operating expenses 68.36% goes to personnel (equalling 55% of total
expenditures). This means a maximum of 25.5% of total expenditures could theoretically
have been used for maintaining local government assets for transport, waste, buildings, etc.)
(the effectiveness of goods and services with a lifetime < 12 months). Partly related to
independency, it is noteworthy that the city needs significant central government transfers
only to cover personnel expenses.
Questions raised
The efficiency ratio suggests that relatively little of the available budgets end up where they
are most needed, being capital and operating expenditures to improve and maintain the
cities infrastructure.
- How can the city improve such ratios?
- Can expenditures for CAPEX be increased?
- What are the main hurdles to do so?
- And how can these hurdles be overcome?

Appendix B.4 7
Opportunities identified
The Green Team indicated to consider reviewing and improving decision making structure
related to planning, budgeting, project preparation and procurement (CAPEX related). Also,
existing actions can be highlighted in the GCAP.
Local Government Fiscal Capacity (MoF Reg. No 33/PMK/2015)
Furthermore, according to MoF Regulation no.33/PMK.07/2015 on Map of Local Government
Fiscal Capacity, the city of Malang has scored 0,70. This is classified as Medium and in the
same range as the City of Kendari (0.72 in 2015 - medium), and Batam City (0.85 - medium).
Point 21 in the Annex to the DFR on “Municipal Urban Finance System in Indonesia” provides more information on the way the score is determined (looking at income item’s such as DAU, personnel expenses, and number of poor people living in the city.
4 Real Financing Capacity
Real financing capacity is ability of the city to finance its needs after paying non-discretionary
expenses, mainly personnel expenses and other high priority expenses. The real financing
capacity is the amount that can be used for flexible expenses, including investment,
maintenance and operation of green infrastructure.
Real Financing Capacity of the City of Malang (in billion Rp)
y2011 y2012 y2013 y2014 y2015*
1 Revenue 1.103,0 1.356,4 1.524,8 1.764,9 1.927,1
2 Previous Surplus/Deficit 67,6 60,2 97,4 182,8 323,0
Sub total Revenue 1.170,5 1.416,6 1.622,2 1.947,6 2.250,1
Deducted by non-
discretionary and high
priority expense:
3 Personnel expense 606,1 715,3 767,3 857,6 962,8
4 Other expense 29,1 37,7 17,9 32,9 36,9
Sub Total 635,2 752,9 785,2 890,5 999,7
5 Real Financing Capacity 535,3 663,7 837,0 1.057,2 1.250,5
Source: Actual Budget of Kota Malang 2011-2015
Estimate for Real Financing Capacity of the City of Malang (in billion Rp)
y2016 y2017 y2018 y2019 y2020
1 Revenue 2.176,4 2.462,4 2.791,4 3.170,5 3.608,0
2 Previous SILPA 225,7 220,7 215,0 209,0 203,4

Appendix B.4 8
Sub total Revenue 2.402,1 2.683,2 3.006,4 3.379,5 3.811,4
Deducted by non-
discretionary and high
priority expense:
3 Personnel expense 1.080,8 1213,4 1362,2 1529,3 1716,8
4 Other expense 41,4 46,5 52,2 58,6 65,8
Sub Total (3+4) 1122,3 1259,9 1414,4 1587,9 1782,6
5 Real Financing
Capacity 1.279,8 1.423,3 1.592,0 1.791,6 2.028,8
Source: RPJMD Kota Malang 2013-2018 and consultant assessment
The shows that the real financing capacity of the city by 2015 is little under Rp. 1.3 trillion.
The average growth is 23.6% yearly between 2011 – 2015. The real financing capacity grew
more than the average growth of revenues (see 1.1.) mainly because of a growing SILPA.
Total revenues grew faster that non-discretionary expenses.
A forecast is made for 2016 – 2020 assuming an average revenue growth from 2011 – 2016
of 13.4% and a growth in personnel and other expenses of 12.3%. Also assumptions on
SILPA have been made (slightly decreasing over the years).
The Real Financing Capacity is estimated to become little over Rp. 2 trillion by the year
2020.
Analysis of the real financing capacity shows that the Real Financing Capacity is expected to
increase as a percentage of total revenues, from 49% in 2011 to 65% in 2015 and a
forecasted 56% in 2020. Based on the analysis in the previous paragraph 20.5% of total
revenues (budgets) were allocated to capital expenses. This would leave between 28.5%
(2011), 44.5% (2015) and 35.5% (2020) for other discretionary expenses such as
maintaining local government assets for transport, waste, buildings, etc.
Questions raised
1. Can the Real Financing Capacity can be increased? (by increasing revenues or decreasing non-discretionary expenses)?
2. Does the increasing Real Financing Capacity provide opportunities to allocate extra budgets to green investments related to realizing and maintaining green urban infrastructures?
Opportunities identified
The Green Team has identified opportunities to increase local revenues (PAD). Non-
discretionary expenses are hard to decrease, especially the costs of personnel. Government
employees have contracts for life. The Green Team will further discuss how additional Real
Financing Capacity can be prioritized for green investments.
5 Debt Service Coverage Ratio and Net Borrowing Capacity

Appendix B.4 9
DSCR1 is a ratio to measure capability of a local government to repay its outstanding debt
and interest (usually used for middle or long term debt). It is one of the requirements to
attract new debt (borrowing capacity) as per Government Regulation no. 30/2011 that
stipulates Local Debt. The table below shows current DSCR for the city of Malang.
DSCR & Net Borrowing Capacity of the City of Malang 2015 (in billion Rp.)
2010 2011 2012 2013 2014 2015 Avg.Growth
A Income
Local income 48,2 92,5 70,8 94,9 158,0 170,6 28,8%
Tax/Non-tax sharing NA NA NA 41,2 31,8 44,8 4,3%
GAF NA NA NA 555,7 611,2 859,7 24,4%
Subtotal NA NA NA 691,8 801,0 1075,1
B Non-Discretionary
Expenses
Personnel 284,9 341,4 466,2 512,8 569,1 682,5 NA
Subtotal 284,9 341,4 466,2 512,8 569,1 682,5 19,1%
C Net Discretionary
Income NA NA NA 178,9 231,9 392,6 NA
D Debt
Beginning outstanding 0,0 0,0 0,0 0,0 0,0
Drawing Down New
Loan 0,0 0,0 0,0 0,0 0,0
Interest 0,0 0,0 0,0 0,0 0,0 0,0
Principal repayment 0,0 0,0 0,0 0,0 0,0 0,0
Balance 0,0 0,0 0,0 0,0 0,0 0,0
E DSCR NA NA NA
Source: Actual Budget of Malang 2011-2014, Budget of Malang 2015 and Consultant Assessment
The above calculation is in line with Government Regulation no. 30/2011. For this reason
some numbers differ from numbers in previous sections, for example the amount of income
(revenues).
1 Government Regulations No 30/2011 stipulates that Cities can borrow from the National Government, financial
institutions (bank or non-bank), other local government and people. The regulation stipulate that:
- DSCR > 2.5 : the local government is allowed to obtain debt
- DSCR = 2.5 : the local government is allowed to obtain debt with certain condition,
- DSCR < 2.5 : the local government is not allowed to obtain debt.
All of these loans must meet the main conditions for Local Debt such Debt Service Coverage Ratio (DSCR) of 2.5, while the
total amount of loan should not exceed 75% of previous year of actual general income, no overdue with other loans from
the National Government.
Appendix B.4 10
The formula to calculate the DSCR is:
(average of audited Net Income of previous 3 years)/ (sum of interest plus principal
repayment in current year)
The numbers show that DSCR is very high because Malang is hardly borrowing money. This
means that Malang potentially can borrow to cover additional investments in green
infrastructure or even give out municipal bonds.
The formula to calculate the potential borrowing capacity is:
Maximum 75% of the total revenues (see 1.1.) in the previous year (audited)
Projected DSCR in years of debt repayment cannot go below 2.5. Interest rate of
government loan is 11.75% and loan duration is 20 years.
Cities that have failed to pay interest and principal in the year they want to borrow, cannot
borrow.
The table below shows the calculated maximum borrowing capacity of Malang from 2016 –
2020. It shows Malang can borrow little under Rp 1.5 trillion in 2016 and a total of over Rp
3.5 trillion from 2016 – 2020. The city could borrow money from public institutions such as
LPPI or the Ministry of Finance.
Questions raised
1. What is Malang’s policy for borrowing? What is needed for the Parliament (DPRD) to approve?
2. Malang has a medium score of 0,7 according to MoF Regulation no.33/PMK.07/2015 on Map of Local Government Fiscal Capacity. How does this influence Malang’s borrowing capacity?
3. What actions can be formulated related to borrowing? Would capacity building in the field of preparing loan agreements help?
Opportunities identified
It could be beneficial for Malang to look into the opportunities to borrow. Borrowed money
could be used to fund improvement of green city infrastructure. As long as the city can meet
the loan requirements and projects invested in deliver economic, environmental and social
benefits for the city, it is recommended to look into this possibility. Cities have expressed that
procedures to attract government loans are complex and that this is a barrier to start
borrowing procedures. It is suggested to formulate actions in the green city action plan aimed
at increasing the city’s capacity to attract loans. Such actions would include capacity building
to increase Malang’s ability to prepare loan agreements, including financial analysis and economic cost benefits analysis of (green) investment projects for which cities intend to
attract government loans.
The Green Team sees this as an interesting opportunity and will discuss this with relevant
public officials in the city. An action plan for public borrowing can be developed together with
decision makers. This should be combined with training and technical assistance in the field
of public borrowing.

Appendix B.4 11
Projection of DSCR & Net Borrowing Capacity for the City of Malang 2016-2020 (in billion Rp.)
%
Growth
Assumed
2016* 2017* 2018* 2019* 2020*
A Income
Local income 13% 400,1 452,8 512,6 580,2 656,7
Tax/Non-tax sharing 20% 634,3 761,2 913,4 1.096,1 1.315,3
GAF 10% 900,6 990,7 1.089,8 1.198,7 1.318,6
Subtotal
1.935,0 2.204,7 2.515,7 2.875,0 3.290,6
B Non-Discretionary
Expenses
Personnel 6.3% 1.080,8 1.213,4 1.362,2 1.529,3 1.716,8
Subtotal
1.080,8 1.213,4 1.362,2 1.529,3 1.716,8
C Net Discretionary Income
854,1 991,3 1.153,5 1.345,7 1.573,8
D Debt
Beginning outstanding
- 1.424,7 2.375,3 2.511,1 2.876,7
Max. Drawing Down New
Loan 1.445,4 987,8 179,9 420,9 497,6
Interest (assuming 11.75%
pa) 169,8 283,5 300,2 344,5 396,5
Principal repayment
20,6 37,2 44,1 55,3 68,9
Balance
1424,7 2375,3 2511,1 2876,7 3305,4
E DSCR 3,91 2,50 2,50 2,50 2,50
Source: RPJMD of Kota Malang 2013-2018 and assessment.
6 Green Development Program
The Green Team didn’t provide initial estimates on expenditures that can be labelled as green, during the final workshops held in Malang. The Green Team did not come up with
new estimates in the final months of this TA. No actions have been identified:
Questions raised
The above table makes it possible to discuss if budget allocations should be changed in
order to reflect the priority for Green Actions and Green Investments. Questions for Green
Teams are:
1. To what extent can expenditures identified be labelled as green? Why? 2. Are the expenditures identified fully spent for CAPEX and OPEX of new and existing
infrastructures? If no: for what else? For what percentage? 3. Do budgets spent sufficiently reflect the city’s green ambitions and priorities? Or do
reasons exist to shift budgets to Green Attributes?

Appendix B.4 12
Cities should challenge themselves to critically look at their budget allocation and look for
opportunities to allocate sufficient budgets to prioritized green attributes (short term) and also
to other green attributes (medium term).

APPENDIX D Guide to Alternative Mechanisms, Financing &
Funding Sources
TA-8518 INO: Green Cities
A Sustainable Urban Future in Indonesia 2 - Capacity
Development

Appendix C 1
GUIDE TO ALTERNATIVE MECHANISMS, FINANCING &
FUNDING SOURCES
1 Introduction and Objective
Many Indonesian cities face challenges to fund investments to improve their key infrastructures. Cities that are interested to explore possibilities to attract alternative modes of financing or funding can use this guide to help them in this process. This guide is written for city officials and others involved in the preparation of action plans, that describe how the city can realize identified goals and projects. It aims to guide strategic choices to consider alternative implementing mechanisms such as joint ventures, BOT, or community cooperatives. It is not aimed at the development and detailed design and financial engineering of specific implementing mechanisms.
Once city officials have formulated their goals and projects, this guide can help them to determine if there are opportunities to apply alternative implementing mechanisms to realize the projects and attract financing and funding outside the city’s own budgets. If alternative mechanisms are possible, cities can determine next steps. For example, cities can further explore identified options in a feasibility study or improve relevant regulations that support the application of the alternative mechanism. This guide also helps cities to consider the benefits of setting-up a knowledge centre with people trained to assist policy officers in different sectors in considering alternative mechanisms.
The objective of this guide is to assist responsible persons:
To identify options to apply alternative implementing mechanisms to realize projects.
To identify possible sources of finance and funding that match the mechanisms and projects.
To determine next steps towards implementation.
Section 1.2 introduces some key knowledge and terms that will make it easier to use this guide. Section 1.3 explains why alternative mechanisms can add value. It is certainly not only about attracting new sources of finance (outside city budgets). Section 1.4 introduces the 4-step approach to determine whether financing mechanisms are an option. The guiding questions in step 2 form the core of the approach. Sections 1.5-1.7 describe step 2 to 4 in more detail.
The methodology have been tested in 4 cities to assess whether alternative mechanisms are an option for identified green city projects.
2 Key Knowledge & Terms
Before introducing the 4-step approach some key terms are introduced. Understanding of these terms will make it easier to use this guide
2.1 Implementing mechanisms, financing and funding
A clear distinction is made between implementing mechanisms on one hand and financing and funding on the other.
“Implementing mechanisms reflect the way stakeholders co-operate to implement a project and the way risks and responsibilities are allocated between stakeholders.”

Appendix C 2
In the traditional way, cities take on most risks and responsibilities and involve the private sector to carry out detailed tasks. For example a bridge and connecting roads are designed to make it possible for citizens to cross in an easy and comfortable way. The city designs the bridge from own resources and funds and selects a contractor to build the bridge. Once the bridge is built, the city is responsible for the maintenance of the bridge. If an alternative implementing mechanisms is applied, the stakeholders – the city, designers and engineers, contractors and maybe also banks – cooperate in a different way. For example, the city only selects a group of companies that design and build the bridge in such a way that it can handle a certain number of users each day, and to make sure the bridge is maintained to its quality standards for a number of years. This changes the way stakeholders co-operate. In this case, the private sector takes on more responsibility for the quality of design and construction.
“Financing and funding reflects how the investments are paid for”
In the traditional way, cities pay projects from their own city budgets. In Indonesia, this include funds from high level government transfers, so from the Provinces or the State. In Indonesia, international development organizations are not allowed to directly finance or fund city projects. This is arranged through the central government. The central government receives loans or grants from international development organizations (including banks as the ADB). The loans and grants are usually provided based on development plans for infrastructure, policies and regulations. The central government disburses the funds to cities as grants or loans to be used for projects that fit the development plans.
If alternative implementing mechanisms are applied, this could open the way to attract other sources of finance. If we take the example of the bridge, the group of companies could also finance the bridge if they are allowed to collect toll for each crossover, or if the city pays them a yearly fee if the bridge is functioning as agreed.
Funding and financing are different concepts. In case of funding, a project is paid for without the expectations of financial returns, for example in case of grants or Corporate Social Responsibility (CSR). In case of financing, a project is paid for with the expectation of financial returns. This means the project needs to generate revenues for the investors and banks.
2.2 Overview of alternative mechanisms
The table below provides an overview of possible alternative implementing mechanisms. A distinction is made between mechanisms that could attract financing – investors and banks expect financial returns - and mechanisms that are only based on funding. The table also shows that different groups of stakeholders can apply different mechanisms. This guide is mainly focussed on cities. However, cities that intend to stimulate others to take action and implement green projects can consider taking actions that will incentivize other stakeholders to do this, and support them in applying alternative mechanisms. For example, by raising property taxes for non-green buildings, it could become more attractive for building owners to invest in greener technologies. Annex A provides additional information about implementing mechanisms., and Annex B provides a table illustrating possible sources of funding and finance.

Appendix C 3
FINANCING FUNDING
Cities (public sector)
(Set-up) State or Local Government Owned Enterprise (SOE/ LGOE)
Design Build Fund Maintain Operate
Joint Venture (JV) Combinations (DB, DBM, DBO)
Contract (Built Operate Transfer (BOT), Concession, Independent Power Producer (IPP), Energy Performance Contract (EnPC), …
Private Sector/ SOE/ LGOE
Own investments (such as IPP) Contract for Design Build Maintain Operate (and/ or)
Contract (BOT, Concession, EnPC, etc.); Joint Venture
Contract combinations (DB, DBM, DBO)
Communities & co-operatives NGO/ development agencies/ CSR programs
Energy co-operative Technical assistance
Housing co-operative Lobbying
Developing own projects (and funding)
Private individuals
Own individual initiative Own individual initiative
3 Why alternative implementing mechanisms?
Alternative implementing mechanisms make it possible to attract alternative sources of finance and funding. Another important reason to apply alternative mechanisms – and in many cases more important – is that this could result in a more effective and efficient delivery of public projects (Value for Money). Stakeholders can optimize the Value of Money because alternative mechanisms allow them to allocate risks, tasks and responsibilities in such a way that they can be best mitigated. In other words, risks are allocated to the stakeholders that are best able to manage those risks. In case of the bridge example, it could make sense to transfer the design risk to the private sector because they have more experience with bridges also in other cities. This is likely to result in a better design with fewer chances of cost overruns.
International best practices illustrate that the main motif for public stakeholders to apply alternative mechanisms such as PPP, is to improve quality and performance of the project/ public service. If revenues of contractors and service providers are tied to use or operational performance indicators, cost and benefits are optimized over the life of the project. This incentive is stronger if the services include up front financing.

Appendix C 4
Figure: added value of private sector financing in the development of infrastructure
4 Approach
The above figure shows the 4 steps in the approach. A well-defined project along the lines of a project or program brief is a key condition to start looking for alternative implementing mechanisms and sources of finance or funding (step 1). As a next step, a number of guiding questions will help to determine what mechanisms and funding sources are promising. Step 3 and 4 are merely to select these mechanisms and determine next steps towards realization.
4.1 Guiding questions
The guiding questions are the core of the approach. This is illustrated in the figure below.

Appendix C 5
Cities can carry out the options analysis along the lines of three guiding questions:
1. Is the project financially sound?: is the project attractive from a financial perspective? And is it affordable from the perspective of its users and the city budgets?
2. What is the capacity and experience with applying possible options?: what implementing mechanisms can be realized? What sources of finance can be accessed?
3. What is the reason to fund or finance?: why would banks, investors or others consider to fund or finance the finance the project? Is it possible to identify a shortlist of stakeholders to discuss the project with?
Additionally, legal considerations have to be considered. Is it legally possible to apply a promising alternative mechanism?
The decision tree in the figure below serves as a tool to help with the guiding questions. It shows the key questions to determine if financing mechanisms can be applied. It also shows that capacity and experience with the identified options should be taken into account when selecting options.
3.Reasontofund/or
finance(banks/
companies/others)?
2.Capacityand
experience:how?
1.Financials:bankable/
affordable?/risks?
Implemen ng
mechanisms
&
sourcesof
funding/
finance
LEGAL L
EGAL
LEGAL
B.Sources
(funding/
finance)
A.Mecha-
nisms

Appendix C 6
Figure: decision tree to determine if finance mechanisms are an option
4.2 Guiding question 1: financials
The extent to which the business case of a project is attractive for investors and lenders is relevant to determine what financing mechanisms can be applied. Affordability, bankability and risks are at the core of the financial analysis.
Affordability
To determine the affordability, an estimate should be made of user fees or availability payments that are affordable from the perspective of the project owner or users (e.g. in case of a toll road or water supply project). Possible savings (energy, water, etc.) can also be taken into account. The affordability assessment can be strongly political of nature in case of availability payments (what are project owners – in many cases city administrations - willing to pay?) but can also be related to technical parameters (in case of for example savings on energy, fuel or water) or end users’ ability to pay (relation with income of targeted user groups, also political sensitive). The Financial Assessment Reports – the result of the Fiscal Capacity Analysis (cities’ budgets)– can serve as a basis to discuss the affordability as can information about the average income per inhabitant.
Availability payments
Availability payments are periodical payments from the government to the private sector. Availability payments are tied to performance indicators that the private sector needs to meet. For the example of the bridge such indicators could for example be related to the quality and level of maintenance or the numbers of hours that the bridge is (not) available. Availability payments serve as stable revenues for the private sector over the project/ contract duration. They differ from other revenues in the sense that they are not dependent
& COMBINATIONS (DB, DBM, DBO)
PROJECT
Istheprojectbankable?
Redesigntheproject
No No No
Ba
nka
bil
ity
R
isk
-M
ig
ao
n
Yes
Caniden fiedriskbemi gated?
(regulatory,financial,capacity?)
Yes
Yes
PrivateSectorLed PublicSectorLed
Yes
Ris
k
-A
llo
cao
n
Canprivatesector/othersmanage
risksbe er?(especiallyO&M)
Affordability:canCAPEXbe
decreased?Orrevenuesincreased?
(subsidies?Availabilitypayments?)
No
No
No
Aretherisksacceptable?
Istheprojectini atedbythe
government?
Yes
Pro
ject
ow
ne
r
Yes
CommunityLed IndividualLed
FUNDINGMECHANISM FINANCEMECHANISM
No
Isthereaclearnon-financial
mo vetopursuetheproject?
(Environmental,Economic,Social)
IPP
ESCOWater
company
Concession
Imp
lem
en
ng
Me
cha
nis
m
BOT(PPP)
Joint
Venture
SOE/
LGOECoopera
ves
Design Build Fund
Maintain Operate
Imp
lem
en
ng
Me
cha
nism
CAPACITYAND
EXPERIENCETOAPPLY
MECHNISMS?
FINANCIALS
Yes
Cantheriskbemi gated?
(regulatory,financial,capacity?)
Aretherisksacceptable?
No

Appendix C 7
on the use of the infrastructure. Availability payment schemes are less risky for the private sector and can provide the right incentives to ensure the realization of sustainable infrastructure that serves its purpose on the long term. The new PPP law (“Presidential Regulation (PerPres) number 38/2015 on PPPs”) makes it possible to use availability payments in Indonesia. By-laws that allow cities to apply availability payments are still being prepared.
Figure: user charges and availability payments
Bankability
The bankability is an assessment of the potential returns investors and lenders of the project. To be able to provide a first assessment of a project’s bankability, the following data should be available from the project briefs:
Data/ questions Answers Comment
1. Does the project generate revenues or cost savings? What is the expected size of revenues (+/- 50%)?
Yes or no
Expected size (+/- 50%)
Relation with affordability
Take into account OPEX (operational expenses) as part of this analysis
2. Is the project owner willing and able to pay availability payments? What is the expected size of revenues from availability payments (+/- 50%)?
Yes or no
Expected size (+/- 50%)
Relation with affordability
3. What are the investments needed? (+/- 50%)
IDR … Only relevant when 1 or 2 is “yes”
4. What is the Simple Payback Period (SPP) of the investments?
… years Investments / (yearly revenues + cost savings + availability payments)
5. Could the project fit the conditions of lenders and investors?
Yes or no (or maybe) - Contract Duration?: rule of thumb is 2 X SPP
- Minimum investment size?:
User Charge
• Private sector bears construction AND demand risk
• Demand risk could be mitigated through government guarantees (contingent liability)
Availability Payments
• Private sector bears construction AND
performance risk
• Government guarantees unitary
payments subject to performance
condition (contingent liability)

Appendix C 8
Istheprojectbankable? No
Yes
Affordability:canCAPEXbe
decreased?Orrevenuesincreased?
(subsidies?Availabilitypayments?)
depending on sector and investor (local? International?)
- Risk appetite?
6. What options exist to make the project more attractive for investors?
For example: i) partial grant; ii) subsidize revenues; iii) division or risks; iv) guarantees
Go back to previous questions
Table: data/ questions for initial assessment of bankability
Risks play an important role too and will be considered separately.
Bankability can be assessed by calculating:
The Simple Payback Period (SPP): for example, if an investment is Rupiah 260 billion (~ USD 20 million) and the yearly revenues are Rupiah 26 billion (~ USD 2 million), the SPP is 10 years.
The contract duration: a rule of thumb for required project duration is 2 times the SPP, so in this case 20 years. This means that for example a BOT contract should be 20 years or more. This rule of thumb is dependent on the returns the private sector wants but generally applies for Indonesia. Required returns are between 10 – 15% in case of loans (debt) and 20 – 30% in case of investments (equity). So in case of a joint venture the contract duration could be less, because governments can accept lower returns than commercial investors and banks. The acceptable project duration varies depending on the project. For bigger infrastructure investments, a duration of 15 – 25 years is acceptable and applied in Indonesia.
The investment size: usually investors and banks require a minimum investment size to be interested in urban projects. This depends on the sector, but generally a minimum of between Rupiah 130 -260 billion (~USD 10 – 20 million) is required.
The investment size and contract duration are a good reference to determine if projects can be bankable. If the result is that a project is not financially feasible, cities can reconsider affordability. Maybe cities are willing to co-invest in the CAPEX, or to support the project with availability payments or tipping fees or maintenance budgets? This is illustrated in the figure below.
Figure: financial feasibility (bankability/ affordability)
Risks
Risks should be taken into account when considering the bankability of identified projects. The figure below illustrates the key questions:
Can the identified risks be mitigated?
Can the private sector (or others) manage certain risks better?

Appendix C 9
If risks cannot be mitigated to an acceptable level, it is advised to reconsider the project and see how it can be changed in such a way that its risk profile is decreased to an acceptable level. The second question is important to determine if a financing mechanism makes sense from the perspective of Value for Money. This is the case if other stakeholders involved (than the public sector) can manage the risks they take on better than the public sector. If that is not the case, applying the alternative mechanism, delivers less Value for Money than the traditional approach. In other words, attracting private or other sources of finance, comes at an extra cost for the public sector. The public sector should only consider this if it is really impossible to free up public budgets to realize the project and the costs of not realizing the project are higher than realizing it with the alternative mechanism.
“Value for Money means that a project is realized in the most efficient and effective way. The impact of a Rupiah of public money spent is maximized. Value for Money considers the
Life Cycle Cost (instead of the Investment Costs)”
Figure: risk analysis, mitigation and allocation
Risk analysis
The table below provides a framework for risk analysis. The framework allows analysing risks for different stages a project. For the bankability assessment one should focus on implementation, operation & maintenance.
The table provides examples of different risk categories such as political, technical, financial and legal risks and examples of risks for each category. Furthermore, the table shows the two key indicators determining a risk: the likelihood of the risk occurring, and the impact on the project when the risk occurs: (RISK = LIKELIHOOD X IMPACT). Finally, the table includes a column that describes how risks can be mitigated. Risk mitigation can decrease risks by decreasing its likelihood of occurring and possible impact.
Risks
Example Likelihood Impact Mitigation
PREPARATION (FEASIBILITY STUDY, PROCUREMENT, DECISION MAKING
Political No/ little political support
% Delays; no-go decision; time/ money lost
Convince mayor and other key decision makers; involve key stakeholders from start
Resources (knowledge, institutions,
People, knowledge; money; time; land; organization/
% Delays; cost overruns; badly prepared projects result in badly executed
Allocate/ hire capable people, train people, allocate budget, allocate land

Appendix C 10
organisation) institutions; management
projects
Legal Land issues, permits, user fees
% Delays, cost overruns, no/ less revenues
Take into account in feasibility study; allocate/ hire capable resources
Social No/ little support from citizens/ communities
% Delays; no-go decision; time/ money lost
Convince citizens/ communities; involve key stakeholders from start
Environmental Increased pollution, carbon emissions
% Delays; no-go decision; time/ money lost
Take environmental criteria into account
IMPLEMENTATION
Resources (knowledge, institutions, organisation, land)
People, knowledge; money; time; land; organization/ institutions; management
% Delays; cost overruns; badly prepared projects result in badly executed projects
Hire people, train people, allocate budget, allocate land
Technical Design errors, bad quality materials
% Delays; cost overruns Good project preparation; sufficient budgets (funding/ finance); sufficient resources; consider contractors ability to implement during procurement (not only price!)
Financial Exchange rates (USD/ IDR), inflation
% Cost overruns Good quality feasibility study and procurement
OPERATION & MAINTENANCE (O&M)
Technical Design errors, bad quality materials, bad organisation/ resources
% Cost overruns (OPEX); Project does not deliver results desired (revenues, environment, social, improved public service)
Good project preparation and implementation
Financial Exchange rates (USD/ IDR), inflation, less users, higher costs
% Cost overruns, less revenues
Good project preparation and implementation
….etc….
Table: risk analysis
A risk analysis is a science in itself. For the purpose of the analysis in this stage of policy and project development, it is recommended to focus on the top 3 to 5 risks. For example for the bridge this could be:
Design risk (implementation phase): risk that design mistakes will result in cost overruns and delays in the implementation stage. This is an often occurring risk with in many cases a significant impact. Cost overruns of 50% are not uncommon for infrastructure projects.
Design risk (O&M phase): risk that design mistakes will result in higher cost of maintenance and more “down time” during which the bridge is closed for maintenance. This could partly be caused because the design does not focus on the total life cycle cost of the project over for example 20 years. This is an often-occurring risk, also in Indonesia.
Technical/ managerial risks (O&M phase): risk that operation and maintenance is not prioritized and badly planned resulting in high maintenance costs and/ or deteriorating infrastructure.
Land issues (implementation phase): risk that land issues and permits will hinder construction resulting in delays and cost overruns. This is an often-occurring risk.

Appendix C 11
Risk allocation
The table below can serve as a tool for risk allocation between involved stakeholders. It should answer the question which stakeholder is best positioned to manage the risk. For the example of the bridge the table shows that certain risks – such as the design risk - can be managed better by the private sector. Other risks – such as land issues – can be better managed by the public sector. Other risks – such as those related to operation and maintenance could both be managed well by the public as by the private sector. The same counts for the financial risks in case toll applies. It could be explored if guarantees or insurance are available to cover certain risks such as damage from accidents, or even to cover financial risks related to the use.
Risk Example Public sector
Private sector
Insurance? / guarantees?
Technical (implementation)
Design (CAPEX cost overruns & delays)
Technical (O&M) Design (OPEX cost overruns, down time)
Technical / managerial (O&M)
Bad planning of O&M (OPEX cost overruns, deteriorating infra)
Legal/ land issues (implementation)
Land issues, permits = delays
Financial Low willingness to pay, for example toll
….
Table: risk allocation
Finance mechanisms only make sense if the private sector can manage the risks assigned to them better than the public sector. Risks in the O&M phase are especially important.
Result
If the result of this analysis is that the project is not financially feasible, it can be concluded that it is not possible to apply alternative finance mechanisms. Besides funding the project from own budgets, options to involve stakeholders with non-financial motives remain (grants, CSR).
4.3 Guiding question 2: capacity and experience (how?)
Importance of proper project preparation
Proper project preparation and implementation is key to realize results that match their green ambitions. This includes:
Preparation of (pre) feasibility studies
Tendering and negation of works and services contracts
Monitoring and managing the maintenance and operation of the projects over the years
Proper preparation and implementation should not be taken lightly. International experiences show the result of poorly prepared and implemented projects:
Cost overruns
Late delivery

Appendix C 12
Bad quality standards resulting in a project that is not sustainable in the sense that it delivers the desired results over the longer term
Poorly prepared projects will put a cost to cities budget on the short term in case of cost overruns and late delivery. On the long term the extra costs can grow exponential due to higher maintenance and operation costs and less contribution to the cities’ economy and quality caused by less functionality.
Capacity and complexity
Cities or other project owners should consider their experience and capacity to implement possible implementing mechanisms in a sector:
What is the experience of the city administration and sector units with preparing and implementing specific implementing mechanisms?
How is the preparation of projects organized within the city administration? Is there a knowledge centre or special unit of experienced experts?
The figure below illustrates project characteristics that influence the complexity of project preparation. The more complex a project is, the more important to organize the preparation and implementation carefully.
Figure: project characteristics and complexity
Projects are more complex if they include alternative financing mechanisms. Big investments with often a wide scope are attractive for investors with financial motives but also increase the level of complexity. Projects in sectors that are new for cities and using new, innovative technologies or implementing mechanisms increase the complexity.
Cities that consider entering into more complex projects, should make available sufficient own resources and if needed hire external experts to support them. Big infrastructure projects will always be complex in the sense that significant resources are needed to prepare them properly.
Project Implementation Unit?
Especially when projects are complex it is desirable to have a special unit or knowledge centre (PIU – Project Implementation Unit) within the city administration that is involved in preparing and implementing projects. By having such a unit, cities create intrinsic knowledge and experience. PIUs can align with and guide the actions of other city officials involved.
Cities should not limit themselves in pursuing to prepare and implement complex projects. This is actually the best way to learn and gain experience. But it is recommendable to set-up PIU(s) in parallel.

Appendix C 13
Analysis & result
The table below shows a simple questionnaire that helps to assess the current capacity and experience within the city administration to prepare and implement projects. Based on the analysis cities can judge whether or not to pursue certain mechanisms, especially if their experience is limited. Capacity and experience are the main criteria to rule out certain specific implementing mechanisms.
Question related to preparing and implementing
projects Answers (1= poor…
5 = Excellent)
Comment
1. Experience within the sector/ technologies? Describe experience
2. Experience with comparable size? Describe experience
3. Experience with comparable scope (e.g. multiple technologies)?
Describe experience
4. Experience with possible implementing mechanisms?
Describe experience
5. Experience with projects of comparable complexity?
Describe experience
6. Current knowledge and experience within the city administration with projects of comparable complexity?
Who has the experience?
7. Intrinsic knowledge? (PIU)? Describe
Table: simple questionnaire to assess experience and capacity to prepare and implement
projects
4.4 Guiding question 3: reason to fund or finance (who?)
Once possible implementing mechanisms have been identified, it is useful to already consider who could finance (or fund) the project.
Financing mechanisms
When financing mechanisms are considered the main criteria for banks, investors or others to finance is if the project matches their financial conditions (returns, risks, size). However, it makes sense to consider which sectors they prefer and have most experience in. Some banks and investors will be especially interested in water & sanitation, others in energy and others in transport infrastructure. There are also banks with a special interest for cooperatives and financing social enterprises.
Funding mechanisms
When funding mechanisms are considered, it makes sense to be aware that:
Private companies will be willing to contribute from CSR budgets if the projects fit their CSR objectives. It is advisable for cities to have regular meetings with a selection of key companies to understand their motives, budgets and link them to green city projects. Private companies will be more likely to contribute if they are already aware of the cities ambitions and progress to prepare prioritized projects. Private companies often have clear objectives such as improving the quality of life or surrounding communities, improving certain basic needs such as access to clean

Appendix C 14
drinking water, or reducing their environmental footprint. Many private companies have specific divisions or set-up foundations for their CSR.
NGOs also have specific areas of interest, comparable to those of private companies. It helps to have a good overview.
Communities will most likely be willing to contribute to projects that serve their purpose (better housing, improved public space, etc.). Communities such as wealthy individuals, sports clubs or religious groups can also be willing to contribute to help other communities.
Analysis & results
When exploring opportunities to fund and finance projects, project owners should consider the main reasons for banks, companies and others to finance or fund and match them with the objectives of the project/ activities. This can result in a shortlist of potential funders, lenders and investors. It is recommended to organize regular meetings with shortlisted stakeholders to keep them up to date about the city’s policies and prioritized projects. This will increase their understanding of the projects, the way they can financially support the projects and what this means for achieving their own – financial and other – goals.
Figure: actions related to stakeholders’ reasons to fund or finance
4.5 Legal considerations
Cities and other project owners need to consider the legal and regulatory context in which they operate. If the legal framework limits cities in applying implementing mechanisms they believe are promising, they can:
1. Implement regulations on a city level that pave the way to pilot the option. In many cases there are legal ways to ensure implementing mechanisms to be applied, even if there is no specific legislation about the mechanism itself.
2. Lobby for the amendment of laws and regulations on a provincial and national level
The alignment of national and city regulations is seen as a challenge by all cities and needs to be addressed by specific working groups and legal improvement programs.
This paragraph describes some relevant legislations and identifies challenges for cities.
PPP Law
With respect to applying private financing options the new PPP Law - Presidential Regulation (PerPres) number 38/2015 on PPPs -, which replaces the previous 67/2005 regulation, provides additional opportunities to pursue options. Most importantly:
The law introduces availability payment as a payment mechanism to the investment vehicle.
It broadens the scope of PPPs, explicitly including 'social' infrastructure such as education, health, tourism, housing and others. Previously the PPP regulation only covered 'hard' infrastructure such as roads, railways, energy, water, etc.
It loosens restrictions on unsolicited proposals. Previously, unsolicited proposals were not allowed for schemes already included in the government plans. The new regulation allows the private sector to propose innovations on any projects (planned

Appendix C 15
or unplanned) as long as the proposal is coherent with the sector master plan, financially and economically feasible and the proponent has the capacity to finance and operate it.
However, uncertainties remain towards the PPP framework. For example reorganizations in Bappenas have been announced1. Such uncertainties could drive cities to wait taking action.
Land Act
The Land Act has been changed. This is expected to lower the number of land issues hindering infrastructure and other spatial projects.
Fuel subsidies and Feed in Tariffs
The Jokowi administration lowered subsidies on fossil fuels significantly and is expected to continue this policy. This is beneficial for green projects such as renewable energy and energy saving projects. For renewable energy Feed in Tariffs are in force to stimulate investments.
1 Reorganization may put PPP projects at risk, Jakarta Post, 11 May 2015

Appendix C 16
Regulations supporting solar for homes2
Recently, the Ministry of Mining and Mineral Resources (ESDM) put in place regulations that allow Indonesian households to sell electricity from renewable sources, most notably solar, to PLN. Households can become independent power producers by selling the excess electricity generated from their solar cells, to PLN.
Direct investment incentives3
Indonesia plans direct renewable energy investment incentives. Local news from Indonesia inform that the country's government plans by the end of 2015 to offer more incentives to local and foreign investors who use technology that reduces pollution and conserves energy.
Challenges for cities
Challenges in city level regulations remain, such as:
Cities can only enter into 1-year maintenance contracts. Options that involve private sector investments in city infrastructure (financial motive) usually include maintenance by the private sector for a number of years. This is of interest to private sector partners as the quality of services often influences their revenues (for example with toll roads or in case of availability payments). However, current ESCO projects for street lighting (Megatan, Kendal, Pati and Tulungagung) show that there are possibilities (using common law).
100% public entities such as city administrations are not allowed to charge certain fees such as toll4. This can be solved by setting-up LGOEs or SOEs.
The annulment of the Water Law No. 7 of 2004 hinders private involvement in water supply and management5.
5 Results
The table below illustrates the result of the analysis. For each project/ activity considered under the GCAP it shows:
If the project qualifies for financing mechanisms, funding mechanisms or a combination of those.
What implementing mechanisms could fit the project? Annex <X> provides an overview of possible mechanisms.
What sources of funding and finance could fit? Annex <Y> identifies possible sources and gives a brief description. The annex can serve as a starting point for cities to build and maintain an overview of the instruments available.
2 http://blogs.wsj.com/indonesiarealtime/2015/05/07/peoples-power-could-be-coming-to-indonesia/
3 https://www.linkedin.com/grp/post/1770756-5999999304943546371
4 According to Kepala Bappeda Medan, 6 May 2015.
5 http://canadians.org/blog/win-indonesian-court-rules-against-world-bank-water-law

Appendix C 17
Project & owner (rows)/
financing options (columns)
(A) Financing
(B) Funding
(C) Implementing mechanism
(D) Financing sources
(options)
(E) Funding sources
(options)
Project 1 (City)
Joint Venture (JV); Contract
(PPP)
JV: City budget and private investments; PPP: private equity
and debt
Not needed
Project 2 (City)
SOE, Contract (PPP)
SOE: City budget and bank loan SOE; PPP:
private equity and debt
SOE: investment grant; PPP:
investment grant
Project 3 (City)
City designs and hires
contractor; D&B
NA Own budgets, CSR (company x),
NGO…
Project 4 (Private sector)
D&B; EPC (ESCO)
Private equity and debt
-
Project 5 (LGOE)
LGOE Debt (bank or MDB) APBN
Project 6 (Communities)
Communities - CSR (company x), NGO…
Project 7 (National Gvt)
Contract (PPP) Private equity and debt (bank or MDB)
Availability payment
…
Table: result of option analysis: implementing mechanisms
If the analysis shows that multiple options are possible, decision makers should decide which options to pursue while further developing the project. The guiding questions make it possible to fill in the table (results) above. However, other considerations such as political preferences can also play a role.
6 Next steps
Once it is clear what implementing mechanisms could be applied, responsible policy officers should determine what actions the city can take to further prepare the projects. Such actions could be:
Carry out (pre-) feasibility studies including further exploration of possible implementing mechanisms identified:
o Prepare Terms of Reference (ToR) for (pre-) feasibility study. The ToR describes what needs to be further explored.
o Hire consultants or appoint own staff to carry out the project with the ToR as a starting point
Prepare procurement strategy. The feasibility study should result in the final preference to apply a certain implementing mechanisms. Next step is to determine the procurement strategy. It is recommendable to consult the private sector in this stage so that they raise concerns and suggest modifications. This will ensure effective competitive bidding.
Procure the project.
Ensure decision-making. Responsible policy officers should inform decision makers timely and carefully in each step of developing the project. Also for this, an approach should be prepared including the division of roles and responsibilities.
Build capacity. When applying alternative and new mechanisms, capacity building should be an integral part of the approach. It is recommended to consider setting-up

Appendix C 18
a dedicated Project Implementation Unit (PIU) that can support city’s sector divisions (Dinas/ Badan) to explore and apply alternative mechanisms
Change or improve regulations and legislations.
Engage with financing-/ funding institutions to raise their intention to get involved in preparing and realizing the project (and financing that).

Appendix C 19
Annex A: Alternative implementing mechanisms: options
This Annex provides additional information about alternative implementing mechanisms. A distinction is made between mechanisms that could attract financing and mechanisms that are only based on funding. This guide focuses on cities, but it is relevant to understand that also other stakeholders can contribute to green cities and apply alternative mechanisms.
FINANCING FUNDING
Cities (public sector)
(Set-up) State or Local Government Owned Enterprise (SOE/ LGOE)
Design Build Fund Maintain Operate
Joint Venture (JV) Combinations (DB, DBM, DBO)
Contract (Built Operate Transfer (BOT), Concession, Independent Power Producer (IPP), Energy Performance Contract (EnPC), …
Private Sector/ SOE/ LGOE
Own investments (such as IPP) Contract for Design Build Maintain Operate (and/ or)
Contract (BOT, Concession, EnPC, etc.); Joint Venture
Contract combinations (DB, DBM, DBO)
Communities & co-operatives NGO/ development agencies/ CSR programs
Energy co-operative Technical assistance
Housing co-operative Lobbying
Developing own projects (and funding)
Private individuals
Own individual initiative Own individual initiative
Table: overview of possible mechanisms
Financing mechanisms
Investors and lenders will be willing to finance projects and activities if its business case meets their requirements. These are usually projects with clear financial benefits:
Revenue generating projects such as: water and energy supply, waste collection and incineration (waste to energy), public transport, toll roads, real estate development, etc.
Cost saving projects such as energy and water efficiency projects.
Performance based fee projects such as real building/ rehabilitation and management of real estate, roads, parks or public transport. Payments are based on quality standards achieved (availability payments6).
Depending on the “project owner” different mechanisms are possible. Relevant project owners are cities, private sector, communities and individuals.
Cities
6 The new PPP law Presidential Regulation (PerPres) number 38/2015 on PPPs, which replaces the previous 67/2005 regulation introduces
availability payment as a payment mechanism to the investment vehicle.

Appendix C 20
a. Set-up a LGOE or SOE: the public sector sets-up a (local) government owned enterprise and attracts private sector loans based on its business case. Depending on the business case, strategy and structure of the enterprise, lenders will be more willing to contribute. A LGOE (Local Government Owned Enterprise) or SOE (State Owned Enterprise) can also be set-up to be able to collect user fees (such as toll fees) as is currently done for a new toll road in Tangerang by Kabupaten Tangerang and – SOE - PT Jasa Marga.
b. Joint ventures: the public sector cooperates with investors and lenders by setting up a legal entity – a joint venture - to develop projects and deliver public services. The conditions of cooperation are laid down in the shareholders agreement and rules of engagement of the joint company. The joint venture possibly receives funding instruments to improve the attractiveness of its business case. The joint venture can also attract loan instruments, guarantees and carbon finance to improve its business case
c. Contractual relation: public sector co-operates with the private sector through conditions laid down in a contractual relation. Through the contract the private sector provides a public service and earns back its investments over a number of years7. A range of contract forms is possible such as:
o BOT (Build Operate Transfer): the private sector builds, funds and operates a project. After a number of years the assets are transferred to the government
o Concessions: the private sector is granted the rights to provide a public service (public transport, energy production)
o Independent Power Producer (IPP): the private sector produces and supplies energy. Similar with concession especially in case of exploiting natural resources
o EPC (Energy Performance Contract). The private sector invests in energy savings measures and earns back its investments from the energy cost savings achieved
o (Many) variations on these mechanisms are possible
Private sector & Government Owned Enterprises
The private sector can make cities greener by carrying out their activities in a greener way. For example, private real estate owners can invest in greening their property, or private real estate developers can apply a certain percentage of open space to “green” their activities. The public sector can incentivize the private sector to do this for example by implementing green regulations, tax incentives, subsidies or providing finance (revolving fund)
The private sector can apply comparable “alternative” mechanisms as the public sector (as described under “cities” above. Energy Performance Contracts (EnPC) are a good example of service contracts that the private sector can apply (Energy Service Companies – ESCOs). This mechanism is currently being piloted in Indonesia. A good example is a hospital project in Surabaya. Synergy Efficiency Solutions – an Indonesian ESCO – is saving energy and costs since January 2015.
Communities & co-operatives
City inhabitants, businesses (SME), religious groups and others can make cities greener by jointly developing greener living areas for example through renewable energy projects (solar fields), improved waste collection or sustainable housing and building methods (for example making use of waste).
7 Usually such options are referred to as PPP (Public Private Partnerships).

Appendix C 21
Communities can set-up co-operatives to achieve this. Co-operatives are private initiatives but usually have public goals. Environmental, economic and social goals of co-operatives can interest investors and lenders to support these co-operatives against attractive conditions (for example long term, low interest, low risk). Joining forces with a long-term perspective could enable communities to realize projects it cannot realize on an individual basis. Possible options are:
a. Energy co-operative: communities jointly improve their access to (clean) energy for example by developing a solar field, or a water turbine in the river, or energy
b. Housing co-operative: communities jointly build houses. They pay a monthly fee to the co-operation used for maintenance, possibly paying back a loan and other costs. The long-term perspective allows a smaller monthly payment and provides the opportunity to build better houses and house ownership (for the poor). Our financial expert is currently involved in a research for application of such a co-operative approach in Bandung
The public sector can incentivize communities to set-up “green” co-operatives for example by assisting them (technical assistance/ funding consultants) or providing finance (revolving fund)
Private individuals
Individuals – city inhabitants – can make cities greener by investing in greening the way they live, work and play. For example individuals can choose to shift to public transport, install solar panels on their houses, replacing home equipment, or stop littering. Depending on the activity, individuals can also benefit financially from this. A simple example is the purchase of a water purifying system. A small investment (around IDR 300k) that can easily be earned back from avoided costs of purchasing drinking water. Cities can use new policies and regulations to stimulate investments.
Funding mechanisms
Projects with other motives are for example:
Economic motives: Improve working conditions for employees for example via improved public transport, less polluted working environment; improve economic conditions urban communities for example via energy and water cost savings; improve business opportunities SMEs for example by “green” business activities; improve housing; improve companies’ marketing value
Environmental motives: reduce emissions from energy, waste and transport for example by improved waste processing, public transport and renewable energy
Social motives: improve education and other social services; improve open spaces and create meeting places
Depending on the “project owner” different mechanisms are possible. Relevant project owners are cities, private sector, communities, NGOs/ development agencies and individuals.
Public sector
Implementing mechanisms based on funding only are for example:
a. Build: City designs projects itself in detail and possibly hires contractors to carry out the works
b. Design & Build (DB): city sets criteria and design guidelines and hires contractors to design and build the works
c. DB & maintain/ operate: contractors are also responsible for maintenance and/ or operation. This allows performance based payment mechanisms

Appendix C 22
d. (Many) variations on these mechanisms are possible
Private sector
The private sector can apply comparable mechanisms as the public sector.
NGOs/ development agencies/ philanthropist
Non-governmental organisations (NGOs), development agencies and philanthropist can make cities greener. They don’t have financial objectives other than achieving as much value for their target groups as possible. Depending on their specific goals, they can initiate or support any activities that they can add value to with their offerings. Possible mechanisms are:
a. Technical Assistance to develop skills and improvement plans b. Lobbying for improved policies, regulations, etc. c. Funding of own initiatives or other initiatives. NGOs can choose similar mechanisms
to co-operate with contracts as mentioned before (Build, DB,..)
Private Individuals:
private individuals can make cities greener by investing in greening the way they live, work and play. For example individuals can choose to shift to public transport, install solar panels on their houses, replacing home equipment, or stop littering. Private individuals can decide to invest in this for other than financial reasons, for example because they value a clean and green living environment.

Appendix C 23
Annex B: Sources of Funding, Finance, Guarantees and Insurance
Overview
The table below categorizes instruments, identifies possible sources and gives a brief description. The table can serve as a starting point for cities to build and maintain an overview of the instruments available
Table: Sources of funding and financing: a categorization (Urban Solutions, Gideon van Toledo)

Appendix C 24
Instruments Sources of funding and financing Description
FUNDING
Grant instruments
Viability Gap Fund (VGF) Ministry of Finance (MoF) VGF provides investment grants up to 50% of the total investment. VGF sets boundaries to potential profit margins for investors
1
Investment grants NGOs, development agencies, philanthropist, Government of Indonesia (GoI)
…cities can add
Technical Assistance Grants
NGOs, development agencies, philanthropist, Government of Indonesia (GoI)
…cities can add
Subsidies
Feed in Tariffs (FiT) GoI Electricity producers can sell electricity produced for an agreed subsidized price to PLN
Availability payments Project owners/ project users (such as cities) Payments from “project owners” related to the performance delivered by service providers (performance criteria)
Tax incentives
Property tax GoI …cities can add. Link with Public Finance analysis
Vehicle tax GoI …cities can add. Link with Public Finance Analysis
….tax …cities can add. Link with Public Finance Analysis
FINANCING
Equity
Equity (preferential) Indonesian Development Banks, Multilateral or Bilateral Development Banks (MDBs) or funds
Investors’ conditions are usually more attractive. Investors have other motives (economic, environmental, social)
Equity Indonesian and international commercial banks, funds and institutional investors, private investors (including individuals)
Crowd Funding …cities can add …cities can add
Loans (debt)
Revolving funds Public entities …cities can add
Loans (preferential) Indonesian Development Banks (LPPI, IIF..), Multilateral or Bilateral Development Banks (MDBs), private lenders
Preferential loans usually are more attractive than commercial bank loans. Loan providers have other motives (economic, environmental, social)
Loans (senior, mezzanine, junior debt)
Indonesian and international commercial banks, private lenders
Bonds Institutional investors Project owners (cities or other) can give out bonds to attract debt
Micro finance BRI, Bank Sumut, others For example for water projects (loans to urban poor to connect to PDAMs)
Crowd Funding …cities can add …cities can add
Guarantees & insurance
Political risk (guarantees) Public entities, MDBs, MIGA – Multilateral Investment Guarantee Agency (World Bank), Indonesian Infrastructure Guarantee Fund (IIGF)
MIGA and IIGF provide guarantees to private sector investors for “non-performance” of contractual obligations by public bodies
Other risks (insurance) Insurance companies
CARBON FINANCE
Mandatory markets (Clean Development Mechanism – CDM)
Facilitating entities such as VCS (Verified Carbon Standard) and trading platforms such as APX VCS Registry and Carbon Trade Exchange
Current carbon prices are low. Procedures are usually lengthy but it is possible.
Voluntary markets Idem as for mandatory

Appendix C 25
Sources: institutions, banks and others
The section provides an overview of possible sources of funding, finance and guarantees/ insurance in Indonesia. This section is based on a large number of interviews conducted from January – March 2015 with most institutes mentioned. The overview can serve as a starting point for cities to build and maintain an overview of useful sources. Cities can expand the overview focusing on the kind of funding/ financing sources that fit the green projects, actions and implementing mechanisms they are pursuing.
Indonesian public institutions or Indonesian owned institutions
Indonesia has a range of public institutions and publicly owned (financing) institutions aimed at increasing access to funding and finance for public projects. Instruments available should increase:
a. Access to funding: o Grants to cities or others to realize their ambitions (e.g. via ICCTF) o Loans to cities to realize their ambitions (e.g. via LPPI). Cities can use such loans
to fund projects b. Access to finance:
o Loans and investments to the private sector to invest in public projects (e.g. via LPPI and IIF)
o Guarantees to decrease risks for the private sector (e.g. via IIGF) o Credit ratings to enable cities to attract loans through municipal bonds (PEFINDO)
Ministry of Finance (MoF)
The Ministry of Finance can provide investment grants and subsidies.
a. A specific grant facility is the Viability Gap fund. This fund can provide up to 50% of the investments if this is needed to attract private investments. Private investors have to prove that their expected Return on Investment (ROI) is below 15%
b. For energy Feed in Tariffs are in place and function reasonably well for biomass and hydropower
Lembaga Pendanaan Pembangunan Infrastruktur (LPPI/ Infrastructure Development Finance Institute (IDFI)
The LPPI is a new government owned Indonesian Financing Institution that is currently being set-up. LPPI is the result of merging two parastatals, the Indonesia Infrastructure Guarantee Fund (IIGF) and the multi-Infrastructure financing facility PT. SMI (Sarana Multi Infrastruktur). While the LPPI is being set up, PT. SMI, now is working on its new mandate. This mandate is envisaged to include support to the Regional Infrastructure Development Fund (RIDF) currently being set-up by the World Bank. The RIDF will provide support to local governments in preparing bankable project proposals and assist them in managing the projects (tender preparation, procurement, contract management over the lifetime of the project)
Because the exact mandate of LPPI is not yet clear when writing this this section provides information about the former PIP and PT SMI.
Pusat Investasi Pemerintah (PIP/ Indonesian Investment Agency8)
a. Public finance: PIP gives long-term loans to regional governments in order to accelerate the improvement of the quality of public services and economic growth. PIP can protect itself against non-performing loans by decreasing DAK/ DAU payments to regional
8 Interview with Muhammed Ferian, head of investment analysts and Julia Rahmi, 21 January 2015

Appendix C 26
governments that don't meet their loan payback and interest requirements. Conditions/ criteria: interest rates between 9 – 13% (IDR); well-prepared feasibility studies. PIP does not provide technical assistance grants to prepare feasibility studies. The newly formed LPPI will probably provide technical assistance grants ensuring a well-prepared project pipeline for its loan instruments b. Private finance: PIP has instruments amongst others aimed at renewable energy
and energy efficiency. It is unclear how much has been disbursed
PT SMI (Sarana Multi Infrastructur (Persero))9
GoI is the main shareholder in PT SMI.
a. Public finance: PT SMI currently does not provide public finance. This might change for example resulting from the set-up of LPPI
b. Private finance: PT SMI provides senior debt, mezzanine loans and equity to private sector, LGOE and SOE. PT SMI does provide limited recourse project finance to SPVs with little (but some) collateral available. Conditions/ criteria are a liable project sponsor that contributes own equity (30 - 50%). PT SMIs finance ranges between USD 10 – 50 million. PT SMI prefers cooperating with other investors or lenders (syndication/ club deal) but this is no criterion.
c. Experience: mini hydro (5 MW), water supply, wastewater treatment, transportation (BRT, MRT, toll roads). Possibly new scopes in the future (housing, energy efficiency).
d. Best practices: private sector investments in public projects and infrastructure are usually done via SOE or as concessions.
Indonesian Infrastructure Funds (IIF)10
a. General: PT Indonesia Infrastructure Finance (IIF) is a private non-bank financial institution under the Ministry of Finance of the Republic of Indonesia, Regulation (PMK) No. 100/2009
b. Shareholders: GOI through Sarana Multi Infrastruktur (PT SMI) along with the Asian Development Bank (ADB), International Finance Corporation (IFC), Deutsche Investitions -und Entwicklungsgesellschaft mbH (DEG) and Sumitomo Mitsui Banking Corporation (SMBC). In addition, IIF has received support in the form of loans from the World Bank and ADB (25 years subordinated loan on-lending facilities).
c. Goal: The establishment of IIF is a key element of strategic development by Government of Indonesia and development partners among international financial institutions to address the constraints on the flow of private investment in infrastructure. Main driver for set-up (2005-2005) was to make available long-term Rupiah finance and enabling institutional investors to step in (project bonds)
d. Private finance to i) private (commercial) companies; ii) State owned enterprises (like Jasa Marga (toll roads) and Pertamina are attractive both from an environmental as economic perspective); iii) companies closer to Government (PLN; PDAM). Sustainability is one of IIF’s focus areas (IIF has 8 social environmental principles). Conditions/ criteria are attractive: commercial Indonesian banks generally don’t provide equity (PIP 25% of total investment mainly through corporate finance). For debt: tenor is long term (10-15 years), minimum debt size is USD 20 – 30 million.
Indonesian Infrastructure Guarantee Fund (IIGF)11
a. Shareholders: 100% state owned
9 Interview with Jatmiko K. Santosa, head of project preparation, 28 January 2015
10 Interview with Harold Tjiptadjaja, Managing Director, Head of Domestic Investment Clients, 22 January 2015
11 Interview with Emil Elastianto Dardak, executive vice president, 10 April 2015

Appendix C 27
b. Goal: i) to decrease the risk profile for investors and lenders for projects (partly) depending on payments from public Indonesian entities (including cities); ii) by giving guarantees against infrastructure risks and non-performance on contract obligations by the public sector; iii) To facilitate deal flow for Contracting Agencies (ministries, state-owned enterprises, local government) by providing guarantees to well-structured PPP projects; iv) To ring-fence government contingent liability and minimize sudden shock to government budget; v) To assist Indonesian public entities that want to attract private investments in building their capacity.
c. Guarantees: against infrastructure risks and non-performance on contract obligations by the public sector
PEFINDO – credit rating agency12
a. General: PEFINDO was established 20 years ago b. Shareholders: 90 institutions (capital market players such as Bank Indonesia,
Indonesian Stock Exchange; pension funds; insurance companies; security houses; commercial banks; all Indonesian entities but could be part of international consultants). PEFINDO co-operates with Standard and Poors
c. Goal/ mission: PEFINDO focuses on Indonesian scale credit rating. Activities comparable to Standard and Poors, Moody’s, Fitch and ICCRA (UK) but they focus on global players/ markets. Cities with a credit rating will be able to issue municipal bonds to attract debt. PEFINDO only rates institutions that ask for it (and –so- want to take a loan)
d. Instruments: credit rating for municipal bonds; municipal project bonds (connected to PIP funding); or private sector project bonds (no BKP opinion needed)
e. Criteria: i) BKP rating “qualified” is the minimum to be able to get a PEFINDO rating. BKP is mainly looking at compliance (with law) and operational efficiency;
f. Relevant regulations: i) local and national parliament (DGPK -MoF-) have to approve a city to take a loan; governments can only guarantee through IIGF; iii) only since 2011 cities can borrow (only in IDR and not from development bank).
ICCTF - Indonesian Climate Change Trust Fund13
a. Goal: the Fund seeks to mobilise, manage and allocate funding in alignment with Indonesian development priorities in order to efficiently and effectively contribute to: (i) the implementation of GHG emission mitigation measures and climate change adaptation activities; and (ii) the mainstreaming of climate change issues into national, provincial and local development planning
b. Shareholders & management: (Currently) grants from UK-CCU, AUSAID, SIDA, UNDP; TA from GIZ (future?) APBN, REDD+, ….; Budget: USD 11.4 million; USD 4.85 million capacity building. Management: UNDP interim administrator; transition to Mandiri.
c. Disbursement regulations: ICCTF designed to work through national financial systems, while seeking to meet the standards expected by international donors.
d. Instruments available: Grants for climate change projects and research implemented by national and sub-national governments, CSOs, academia and the private sector. In a later stage other instruments should become available (loans, investments) so that also funding sources that want to make loans/ investments available could work through the fund; Criteria: Consistency with RAN-GRK (National Climate Change Plan);
Multilateral Development Banks / Bi-lateral Development Banks (MDBs)
12 Interview with Ronald T. Andi Kasim, president director and Endi Roswendi, director, 21 January 2015
13 The effectiveness of climate finance: a review of the ICCTF, ODI, april 14

Appendix C 28
Many MDBs see Indonesia as one of their most important countries. Indonesia is big and improvements in many fields will significantly impact global scores. “Green” is high on the agenda with all MDBs, especially related to the transition to zero carbon economies.
Interviews have been conducted with a number of representatives of MDBs14. While focus and operating procedures of MDBs differ – for example ADB focuses a lot on water, AfD on energy and KfW on waste and regional transport - observations are:
a. General: MDBs are banks with public goals such as i) contribution to sustainable growth; ii) improved local living conditions; iii) contribute to preserving the planet and help stabilize fragile or post-conflict countries. Their financing conditions incorporate these public goals and in view of this MDBs are able to offer more attractive conditions than commercial banks. However, MDBs are banks and a decision to invest or provide a loan is only taken if MDBs are confident to get their financial return. For EE and RE they can access large funds (Climate Investment Funds, Global Environment Facility, Green Climate Fund, Adaption Fund).
b. Grants for Technical Assistance: The World Bank is preparing the Regional Infrastructure Development Fund (RIDF) with a mandate (among others) to support the LPPI. These initiatives are soon to be included in the public infrastructure investment portfolio (aka Blue Book) that is managed by Bappenas and MoF.
c. Public finance: providing finance to public institutions is the core activity of MDBs. MDBs can only finance central government (aside from exceptions like Aceh (other laws), Papua and DKI Jakarta (MRT). Public branches of MDBs can advise to apply PPP but SPVs should be financed from their private branches. Instruments/ criteria/ conditions: o AfD loans: Sovereign loans (to public entities) and non-sovereign loans (SOE,
local authorities, NGOs); sovereign loans need state guarantees, non-sovereign loans don't. Conditions are market rate (non-concessional) and subsidized loans (soft loans)
o AfD credit lines: credit lines to Indonesian public banks (Mandiri, Bukopin) aimed at financing Renewable Energy and Energy Efficiency projects. Criteria (Mandiri): tenor > 5 years, market rate interests (≈ 10% IDR or 16% USD), smaller investment size (than USD 5 million) possible. Sectors: mainly hydropower, biogas and combined cycle power
o ADB credit line to Indonesian Exim Bank: labelled for energy efficiency loans15 d. Private finance: For private finance banks like KfW, AfD and World Bank have
separate branches (KfW-DEG, Proparco, IFC). Instruments/ criteria/ conditions: o KfW: project finance (SPV): long-term financing, risk and equity capital and
mezzanine finance, guarantees; tenor minimum (4 – 7) - 10 years; minimum loan amount USD 10 – 20 million; corporate finance: history of 3 years
o ADB: PPP is mainly project finance. IPP is mainly corporate finance (just as ESCOs); Size of contribution: > USD 10, preferably 20 million. ADB finances max 25% of assets (syndication)
o FMO: provides debt and equity. No equity investments so far in Indonesia (should be highly subsidized). Criteria: preference on private sector; critical on projects that largely depend on government revenues; loan/ investment size: > USD 10 million (e.g. ESCO projects of around USD 1 million = too small)
e. Guarantees: most notably MIGA (Multilateral Investment Guarantee Facility)16 that provides political risk insurance guarantees (comparable to IIGF). MIGA is active in Indonesia and is currently being applied for Rajamandala Hydropower Project17.
14 KfW, Antun Hidayat, Sector Coordinator Urban Infrastructure and Transport, 23 January 2015; Asian Development Bank, Lazeena
Rahman, Private Sector Operations, ADB; KfW-DEG, Bobby Mangaratua, 12 February 2015; AfD, Andre Hue, 12 February 2015; FMO,
Cathalijn Naafs, investment officer, FMO, 6 January 2015
15 http://www.thejakartapost.com/news/2014/01/25/eximbank-starts-energy-financing-program.html

Appendix C 29
Development Agencies/ Grant Facilities
A wide range of development agencies and dedicated grant facilities are in place. For EE and RE they can access large funds (Climate Investment Funds, Global Environment Facility, Green Climate Fund, Adaption Fund). Examples of facilities that can provide investment grants are:
a. Millennium Challenge Account: USD 332,5 million. Goal to increase the incomes of poor households in targeted districts (incl. South/ South East Sulawesi for renewables) and sectors (participatory land use planning/ improved land-use practices, renewable energy; sustainable natural resources management). Possibly interesting for Kendari.
b. AusAid IndII (Indonesian Infrastructure Improvement): water and sanitation program c. UCCRTF (Urban Climate Change Resilience Trust Fund): USD 150 million.
Instruments available: i) policy/ planning (20%); ii) Project Investment (TA FS; Viability Gap Funding; iii) Knowledge. The UCCRTF aims to scale up urban climate change resilience especially for the urban poor across 25 medium sized cities in Asia. This fund is administered by ADB.
Other grants – such as TA – are provided by for example CDIA (Cities Development Initiative Asia), ACCCRN (Asian Cities Climate Change Resilience Network), SUEEP (Sustainable Urban Energy and Emissions Planning).
Private sector
The private sector can finance projects. Depending on their goals and mission, private sector players can provide:
Funding: grants and donations
Financing:
o Equity o Debt o Guarantees
Funders
The private sector can support green projects and activities by:
a. CSR budgets from their running operations b. Separate organizations set-up to contribute to social, environmental, economic or
other goals. Good examples of such funds or organizations are the Bill Gates Foundation and Ford Foundation.
Investors
A distinction can be made between:
a. Investors who provide equity to projects or companies. A range of investors is active in Asia, some of them supported by MDBs. A number of investors focus on low carbon markets, for example: o ReExCapitalAsia18: set-up with support of REEEP and KfW-DEG o Armstrong Asset Management19
16 http://www.miga.org
17 http://www.miga.org/projects/index.cfm?pid=1367
18 http://www.reexasia.com/about-us
19 http://www.armstrongam.com/

Appendix C 30
o Asia Climate Partners (involvement of ADB, UK Government) o Renewable Energy Asia Fund
b. Commercial project developers such as: o Asia Green Capital20 (IFC is one of their shareholders) o Indonesian real estate developers (Sinarmas Land, Ciputra, Summarecon and
others) o (Smaller) – SME - project developers such as Harsari (street lighting ESCOs),
Synergy Efficiency Solutions, WMD (water), and many others c. Investing through crowd funding 21
Lenders
a. Loans: there are 120 commercial banks in Indonesia who can to more or lesser extent offer loans to green projects
b. Bonds: Mandiri Sekuritas22 is an important player here and provides access to finance from institutional investors. They can provide project bonds, corporate bonds but also municipal and provincial bonds. Examples are project bonds for Java Industrial Estate (J.V. between port authority and private developer) and a provincial bond for an airport (in development). Municipal bonds have not been given out yet. Criteria: A PEFINDO rating is not obligatory if MDBs provide partial guarantees; minimum project size USD 50 million; guarantees on long term paybacks (Power Purchase Agreement (PPA); IIGF; ..); rating: minimum single A)
c. Also, SMBC (Sumitomo Bank) is said creating a vehicle to give create/ buy municipal bonds (source: PEFINDO)
d. Micro-finance for example provided by BRI (Bank Rakyat Indonesia) and Bank Sumut23
e. Crowd funding could be another source of private debt
Challenges of involving the private sector
Like many other countries, Indonesia is facing a number challenges with regards to involving the private sector in (urban energy) infrastructure:
a. Capacity o To develop projects and bankable feasibility studies o To interpret bankable feasibility studies and to assess the risks (access to
finance) b. Access to finance & insurance
o Many loan instruments require a minimum size of USD 10-20 million. This is a challenge in an urban context
o No guarantees available. IIGF is in place and its use should be intensified c. Regulation
o Public entities cannot enter into multi-annual (maintenance) contracts with the private sector
d. Policies o Need for more ambitious targets o Need for better enforcement of environmental regulations
Carbon Finance24
20 http://www.agcp.com.sg/index.php?option=com_content&view=article&id=88&Itemid=533
21 https://www.techinasia.com/crowdfunding-future-indonesia-crowdfunding-sites/
22 Interview with Iman Rachman, managing director and Shery Juwita Lestari, Associate Director Investment Banking, 23 January 2015
23 Funding the flow, microcredit finance for water connections, USAID, 2010

Appendix C 31
Carbon finance is an option to fund projects. Companies and individuals undertaking projects/ activities that save carbon emissions can create credits. In theory an Indonesian city could qualify for carbon finance (e.g. for a public transport project). Carbon credits are tradable units (usually equivalent of one tonne CO2 use).
There is a distinction between the Compliance Carbon Market (Clean Development Mechanism, ETS, Joint Implementation) and the Voluntary Carbon Market (such as Gold Standard). 'Gold standard' in the voluntary market is an opportunity to get good prices but is hard to get, timely (2 years) and costly to get certified for (Program of Activities - POA - UNFCC - around USD 80k). For standardized approaches it is possible to get certified for multiple projects/ deals (e.g. chillers). Carbon credits are verified by certified bodies such as VCS (Verified Carbon Standard) and traded on trade platforms such as APX and Carbon Trade Exchange.
Current compliance carbon prices (CDM) are too low to be attractive (< USD 1/ tonne). There are institutions like Sweco and Nefco (Norway) that have programs to buy credits (CDM) upfront for better prices but procedures are long and costly. A number of Indonesian projects are currently benefiting from CDM and voluntary credits for example Bantargebang Landfill Gas & Power Generation (Tangerang), a number of hydro and other power projects25.
24 Interview Steve Piro, director Synergy Efficiency Solutions, January 2015
25 http://www.vcsprojectdatabase.org/#/projects

Appendix C 32
Annex C: Best Practices
Mechanism Experience
FINANCING
Cities (public sector)
(Set-up) SOE/ LGOE - Set-up of SOE in Tangerang to operate toll road (together with Jasa Marga). Investments done by city of Tangerang. Joint Venture to collect toll fees.
Joint Venture - Project bonds (Mandiri Sekuritas) for Java Industrial Estate (J.V. between port authority and private developer. The JV SPV attracts a loan for CAPEX and bonds for land acquisition
Contract (BOT, Concession, IPP, EPC…)
- Water Concession Acuatico: Water Treatment Plant (WTP) and distribution network for 72.000 connections (potable quality
26). Quality in
line with international standards (< 10%)
- ESCO: EPC Street Lighting27
in Megatan, Kendal, Pati and Tulungagung
Private Sector/ SOE/ LGOE
Own investments (such as IPP) - PT Pertamina and PT Navigat Organic Energy Indonesia (PT NOEI): Bantargebang Landfill Gas & Power Generation (Tangerang) including carbon finance. Off-take agreement with PLN
28. Current status:
expansion is technically possible but investors are hesitant (Feed in Tariff too low)
(Set-up) SOE/ LGOE - Bali Mandara (Nusa Dua) waterfront development
Joint Venture - Joint Venture WDM (Dutch subsidiary) with PDAMs in Sorong, Manado, Merauke and Biak, supported by microcredits for end-users
- Joint Venture ATB Batam (water)
- Joint Venture PT Tirta Leonis Medan (Bulk Water Supply, 2004)
Contract (BOT, Concession, EPC/ ESCO…)
- ESCO: EPC hospital Surabaya; hotel Jakarta (savings 40%)
- BOT: PT Tirta Leonis Medan (Bulk Water Supply, 2004)
Communities & co-operatives
Energy co-operative
Housing co-operative Design research undertaken in Bandung, Cigondewah
Private individuals
FUNDING
Cities (public sector)
Build, Design & Build, DBM, …
Private Sector/ SOE/ LGOE
Develop and fund green project development
Waste banks (Unilever, Pertamina)
Only funding
NGO/ development agencies
Technical assistance
Lobbying
Funding & developing (own or other’s projects)
Biogas program Hivos29
, waste; waste banks: since 2010, Unilever developed 40 waste banks processing over 160,000 kg of waste including in Medan
30, Pertamina in Batam.
Private individuals
26
http://www.recapital.co.id/index.php/en/our-business/view/12
27 Interview with Ibu Ita, Harsari, 1 April 2015
28 http://www.thejakartapost.com/news/2012/10/24/pertamina-build-waste-fired-power-plant.html ;
http://www.lovetheworld.com/en/agir-ensemble/bantargebang/
29 https://www.hivos.nl/nieuws/indonesia-celebrates-4000th-biogas-digester/
30 http://www.unilever.co.id/aboutus/yayasanunileverindonesia/yuienvironment/

APPENDIX D International Green City Action Plans Literature
Review
TA-8518 INO: Green Cities
A Sustainable Urban Future in Indonesia 2 - Capacity
Development
Appendix D 1
Contents
1 GCAPs: A Necessary Investment............................................................................................ 3
2 Defining Green Cities and GCAPs .......................................................................................... 3
3 Existing Indonesian Green Cities Strategy and Policy ............................................................ 4
3.1 National Framework .............................................................................................................. 4
3.2 Green Growth Initiatives ....................................................................................................... 5
4 Green City Action Plans ......................................................................................................... 6
5 GCAP Target Areas and Objectives ........................................................................................ 7
6 Case studies of successful green city practices ..................................................................... 8
6.1 Air Management – EU Emissions Trading Scheme ................................................................ 8
6.2 Climate Change Adaptation – Green City Action Plans, Climate Mitigation Plans & DRR
Plans ...................................................................................................................................... 8
6.3 Community Participation and Ownership – Vancouver, Canada; public participation in
GCAP planning ....................................................................................................................... 9
6.4 Ecology Management – Si gapore; Palau Se akau La dfill ............................................... 9
6.5 Energy Management – Kunming, China; ESCO Contract ....................................................... 9
6.6 Food Management – Portland, USA; Reducing the consumption of carbon intensive foods
............................................................................................................................................. 10
6.7 Green Economy Management – Copenhagen, Denmark; Export of wind turbines ............ 10
6.8 Green Fiscal Planning – Thanh Hoa Province, Vietnam; Charging concrete producers to pay
for mangrove plantations .................................................................................................... 11
6.9 Green/Blue Spaces Management, Singapore; Skyscraper gardens ..................................... 11
6.10 Solid Waste Management – Cebu, Philippines; Solid Waste Management Board.............. 11
6.11 Transport Management – London, UK; Congestion Charge ................................................ 12
6.12 Urban Building Management – Italy; Preservation of heritage sites .................................. 12
6.13 Water Management – Phnom Penh, Cambodia; Increase of coverage and reliability of
water supply ........................................................................................................................ 13
6.14 A note on cross-sectoral initiatives – Manila, Philippines; Pasig River Rehabilitation
Commission ......................................................................................................................... 13
7 Methods for Developing GCAPs .......................................................................................... 13
8 Focus on Methodologies ..................................................................................................... 15
8.1 ADB – grEEEn Cities.............................................................................................................. 15
8.2 IDB – Emerging Sustainable Cities Initiative (ESCI) .............................................................. 16
8.3 ICLEI – GreenClimateCities (GCC) Program .......................................................................... 16
8.4 EU – Reference Framework for Sustainable Cities (RFSC) ................................................... 17
8.5 World Bank – Planning, Connecting and Financing Cities ................................................... 17
8.6 European Commission – Mayors Adapt Initiative & the Urban Adaptation Support Tool .. 18
Appendix D 2
8.7 EU – GRaBS: Climate Change Adaptation Action Plan ......................................................... 19
8.8 Asia Green Camp – Kitakyushu Model Initiative ................................................................. 19
9 A brief note on financing green city development .............................................................. 20
10 A concluding note on implementation and monitoring ...................................................... 21
11 Selected Bibliography .......................................................................................................... 22

Appendix D 3
1 GCAPs: A Necessary Investment
Urban population growth throughout Asia has exponentially increased over the last several
decades. This has led some to estimate that Asia’s urban population will overtake its rural population by 2022. In light of these statistics, there is a strong need to move forward with
the creation of Green City Action Plans (GCAPs) to help mitigate the negative consequences
of urban sprawl. ADB recently highlighted that, “If urban expansion goes unchecked in the developing world the environmental impact will be catastrophic.”1
Once viewed simply as engines of economic growth, cities and their environments are being
drastically rethought. Governments have come to understand the link between unplanned
urban growth and heavy economic loss. GCAPs can help prevent these losses by protecting
the urban environment while improving citizens’ quality of life by transforming the urban landscape into a ‘Green City’.
2 Defining Green Cities and GCAPs
Although several ideas exist about what it means to be a Green City, there is no universally
accepted definition. Instead, Vancouver, Portland, San Francisco, Copenhagen, Bogota and
Reykjavik, cities that constantly appear in rankings of the world’s greenest cities, are found to implement some or all of the below practices:
1. Ambitious, well defined goals, and regular reporting of progress 2. Electricity generation using renewable resources 3. Strict building codes favouring green technology 4. Investment in public transportation 5. Efforts and policies to cut waste, reduce water 6. Increased density 7. Encourage knowledge-based, creative economies 8. Access to affordable, healthy food 9. City government who leads by example 10. Encourage grassroots efforts to engage citizen consumption
Green cities however are not just about environmental issues and
Vancouver, beyond wanting to become the greenest city in the
world by 2020, has a concise and powerful vision statement which
supports their green objectives:
“Our vision is to create opportunities today while building a strong local economy, vibrant and inclusive neighborhoods, and an internationally
recognized city that meets the needs of generations to come”
The Asian Green Cities Index provides a useful overview of the Green Cities dynamic within
the region. The index has an environmental focus and establishes a rating through its 8
categories: Energy & CO2, Transport, Water, Air quality, Land use & buildings, Waste,
Sanitation, Environmental governance.
Although most countries and cities in the region are still in the early stages of developing
green strategies, especially with regard to renewable energies, there has been a marked
shift towards understanding the importance of going ‘green’. For example, Shanghai which currently only produces 2% of its energy from renewable sources is now constructing the
largest off-shore wind farm in the world.
1 B.N. Lohani, I o ati e Solutio s to Help Asia Cities Gro , Climate Action Programme, ADB, 22 January 2014, available
at http://www.adb.org/news/op-ed/innovative-solutions-help-asian-cities-grow-green, accessed 10 October 2014.
Gree cities axi ize the use of their
resources by ultimately
doing more with less -
they generate revenue
and reduce future costs
by engaging with
sustainable practices.

Appendix D 4
The Asian Green Cities Index provides a more pragmatic approach (and target) for Asian
Cities which generally focusses on more traditional infrastructure provision, and ‘greening this up, in line with the main issues which Asian, and Indonesian, cities face.
Green cities can also be understood as smart cities. While emphasis has been placed on the
use of technology in enabling cities to become ‘smart’, green cities are ultimately based on
smart investments. Innovative technologies can play a role in developing green cities but
their use must be limited to achieving a means to an end rather than just an end in itself. For
example, green cities can use smart technology to charge drivers who enter a city’s congested zone, improving urban congestion and reducing air pollution, whilst also
generating revenue. Essentially, green cities are smart cities because their philosophy
revolves around ‘doing more with less’. Examples include the 15 tons of CO2 reduction using
underground landfills to generate electricity in Vancouver and the use of smart apps and
facilities allowing residents to access a bicycle every 300m in Paris.2
Although Green Cities are intrinsically linked to improving the urban environment, if well
managed, they can have a huge positive impact on the economy. A green city should not
‘save’ the environment – they generate revenue and reduce future costs by engaging with
sustainable practices; and they provide opportunities for local businesses and
entrepreneurship. As argued by Portland’s Sustainability Chief, “We’re not doing [sustainability] just to be altruistic. Part of the reason we’re doing a lot of this: There’s money to be made, to be crass.”3
3 Existing Indonesian Green Cities Strategy and Policy
3.1 National Framework
Indonesia has a national framework for urban development based on the National Urban
Development Policy and Strategy for 2015-2025 that aims to achieve sustainable urban
development by 2045. The National Framework is also based on the National Long-Term
Development Plan 2015-2025 and the National Medium-Term Development Plan 2015-2019.
Furthermore it is guided by the National Spatial Development Plan 2005-2025, and the
Masterplan for Acceleration and Expansion of Economic Development in Indonesia 2011-
2025 (MP3EI).
Several laws deal with ‘green’ issues. For instance, the law on Spatial Planning and Development stipulates that each Indonesian city must allocate at least 30% of its jurisdiction
to green open space, 20% of which is public, and 10% private. This policy statement is
included in local spatial plans as a legally binding local regulation, to be attained within 20
years from its enactment, but most cities are still far from achieving it. Another law stipulates
that by the end of 2013, all regions in Indonesia must have a fully operational sanitary landfill
to replace open dumping, but this is also still far from becoming a reality. Quite a few cities
don’t have infrastructure masterplans yet in sectors such as sanitation, drainage & flood control, and transportation. The problem with sectorial masterplans is that –for no clear
reason- no requirement exists to make them legally binding through a LG Regulation, with
the result that their budgeting and implementation is not ensured.
2 A. Vogl, S art Co epts for Gree er Cities , i M. Li dfield a d F. Stei erg ed. , Green Cities, Mandaluyong City, Asian
Development Bank, 2012, pp. 373-405.
3 D.M. S ith Breaki g: Portla d sustai a ilit hief ad its Portla dia is t reall a parod , Grist, 2 November 2012,
available at http://grist.org/cities/breaking-portland-sustainability-chief-admits-portlandia-isnt-really-a-parody/, accessed
10 October 2014.
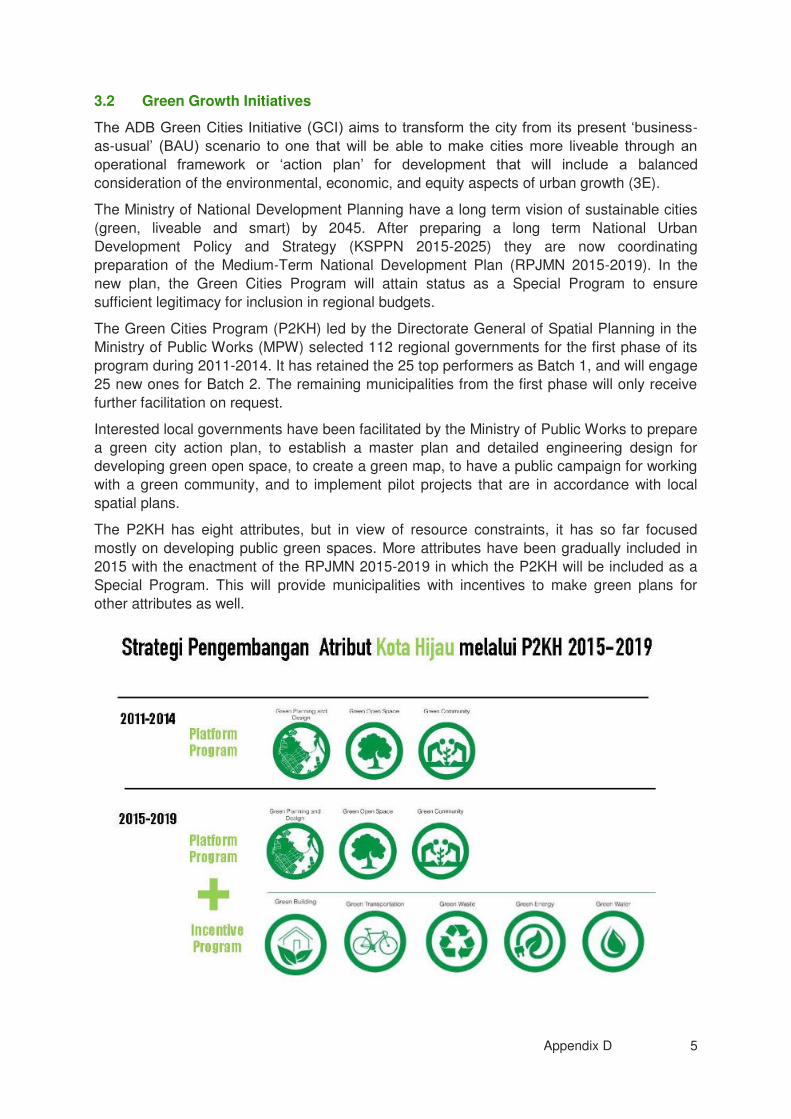
Appendix D 5
3.2 Green Growth Initiatives
The ADB Green Cities Initiative (GCI) aims to transform the city from its present ‘business-
as-usual’ (BAU) scenario to one that will be able to make cities more liveable through an operational framework or ‘action plan’ for development that will include a balanced
consideration of the environmental, economic, and equity aspects of urban growth (3E).
The Ministry of National Development Planning have a long term vision of sustainable cities
(green, liveable and smart) by 2045. After preparing a long term National Urban
Development Policy and Strategy (KSPPN 2015-2025) they are now coordinating
preparation of the Medium-Term National Development Plan (RPJMN 2015-2019). In the
new plan, the Green Cities Program will attain status as a Special Program to ensure
sufficient legitimacy for inclusion in regional budgets.
The Green Cities Program (P2KH) led by the Directorate General of Spatial Planning in the
Ministry of Public Works (MPW) selected 112 regional governments for the first phase of its
program during 2011-2014. It has retained the 25 top performers as Batch 1, and will engage
25 new ones for Batch 2. The remaining municipalities from the first phase will only receive
further facilitation on request.
Interested local governments have been facilitated by the Ministry of Public Works to prepare
a green city action plan, to establish a master plan and detailed engineering design for
developing green open space, to create a green map, to have a public campaign for working
with a green community, and to implement pilot projects that are in accordance with local
spatial plans.
The P2KH has eight attributes, but in view of resource constraints, it has so far focused
mostly on developing public green spaces. More attributes have been gradually included in
2015 with the enactment of the RPJMN 2015-2019 in which the P2KH will be included as a
Special Program. This will provide municipalities with incentives to make green plans for
other attributes as well.

Appendix D 6
4 Green City Action Plans
Creating a Green City requires substantial planning coordination which brings together
citizens, businesses and the government. Many cities have found that creating GCAPs has
allowed them to better coordinate the different actions required to achieve their Green City
vision.
Where GCAPs differ from individual green initiatives is in the overall scope, coordination and
facilitation that they provide across several sectors, and they should be drafted relevant to
the existing planning and regulatory setting, and in line with available capacity to implement
projects locally. Although individual green initiatives may be helpful in their own respect, they
are largely limited to short or medium term successes and can sometimes be the result of ill-
thought out policies. For example, Bangkok’s bicycle scheme to encourage green mobility
was unaccompanied by bike lanes or legislation to protect cyclists from the car-dominated
traffic on the city’s roads.
Yet if GCAPs facilitate coordination, they also require a dedicated government and local
community willing to make sacrifices and follow through with plans. Unfortunately, becoming
a Green City often means standing for a vision that is unpopular for economic reasons. This
is particularly true in developing countries where ‘greening’ can require short term economic sacrifices in order to create long term benefits. For example, Bangkok’s latest green plan for the city was met with strong opposition from property developers for displacing the value of
real estate. The benefits of GCAPs often appear in the longer term and allow cities to avoid
the costs of pursuing economic development without regard for the environment – as China
has now painfully learnt.
GCAPs are structured to provide a framework promoting a specific vision for a Green City.
For Vancouver, this was to become the ‘greenest’ city in the world by 2020. The vision is
then broken down into broad target areas where the city hopes to affect change. These
target areas are separated into specific and measureable objectives underlined by
projects/investments which define how the city will achieve these goals over the short,
medium and long term. These have included doubling the number of workers in the green
economy or having the cleanest drinking water in the world by a certain date. This process is
visually outlined below. It is unsurprising that some of the most successful GCAPs have been
brief and included measurable, realistic and actionable goals.
One of GCAPs most important aspects relates to their financing. As previously stated,
GCAPs must adapt to local conditions but more particularly, must utilise those conditions to
increase revenue. To this end, Vancouver’s GCAP highlighted the role of the green economy in providing economic benefits while the BRT system in Bogota, Colombia is completely
unsubsidised, allowing the government to spend money on other necessary resources. This
is particularly true of GCAPs in developing countries where cities tend to face financial
deficits and are unable to levy funds for green initiatives. For example, Thanh Hoa province,
Viet Nam, instituted a carbon tax on concrete producers allowing the city to fund reforestation
and mangrove improvements. Other examples of local solutions in developing countries
Vision Target Areas Objectives Projects/
Investments Actions

Appendix D 7
involve the use of Public Private Partnerships (PPPs) to overcome financial deficits. Actions
related to financing projects and initiatives should be included in GCAPs
GCAPs exist under varying timescales which aim for goals anywhere between 5 years
(Bangkok), 10 years (Vancouver) or 20 years (Portland). The importance however, is not in
their implementation timescales but rather monitoring practices, and re-drafting frequency.
Without proper monitoring, GCAPs are essentially useless. This dictates that any
profiling/baselining should be based on available data, and actions should be aligned with
making improvements to these indicators. Wider monitoring can be done sectorally, but in
Indonesia, for example the GCAP should be evaluate based on a very simple set of
indicators which are achievable measured annually or biannually.
While the IDB’s methodological guide favours local civic organisations or NGOs to independently monitor results, many countries instead choose to monitor implementations
themselves, leading to distorted results. Vancouver and Portland both implement yearly
monitoring reports and repeatedly claim success, yet critics in Vancouver point to wasteful
programs which do little to reduce GHGs. Although Vancouver’s yearly reports claim
success, GHGs were only reduced by 4% in the first five years implying 29% need to be
reduced over the next six years for Vancouver to achieve its targets. Thus selection of
indicators should be transparent and standardized (within a country such as Indonesia).
5 GCAP Target Areas and Objectives
Asian cities have implemented GCAPs or green initiatives in the past, yet these are usually
focused by sector e.g. exclusively. on ‘greening’ the environment or increasing public transport. Although these measures are individually appropriate, they do little to generate
revenue from ‘greening’, nor provide long term solutions to rapid urbanisation (resilience) –
as is the case of Indonesia’s current green city initiative. Having said that, based on the
current capacity for integrated planning, a sectoral approach is probably appropriate in
Indonesia for the time being.
This review has analysed several GCAPs and found 13 different target areas covered across
the literature. They have been summarised in the table below.
Target Areas Details
1) Air Management Reduction of GHGs through a range of measures (usually the end point objective of GCAPs)
2) Climate Change Adaptation
Making changes to the urban natural (and business) environment to help protect against (and consequently adapt to) future climate changes
3) Community Participation & Ownership
Community focused meetings to understand citizens' aspirations for a greener city and involve them as stakeholders in the GCAPs
4) Ecology Management Allowing biodiversity to thrive within large urban areas
5) Energy Management Switching to renewable energies while ensuring energy efficiency and energy use reduction
6) Food Management Prefer consumption of local foods over high carbon producing foods

Appendix D 8
7) Green Economy Management
Promoting a green workforce, knowledge solutions and serving as an example to other cities
8) Green Fiscal Planning Part of all GCAPs and closely related to the green economy - funding for green initiatives
9) Green/Blue Spaces Management
Facilitating easy access to green/blue spaces for the population within walking distance
10) Solid Waste Management
Creating energy from waste incineration & recycling to reduce overall waste production
11) Transport Management Eco-transport and easy mobility within cities
12) Urban Building Management
Upgrade buildings to use less energy and/or favour carbon neutral structures
13) Water Management Increasing efficiency of water networks and encouraging water conservancy
6 Case studies of successful green city practices
The following section provides examples of each of the 13 categories taken from the above
table.
6.1 Air Management – EU Emissions Trading Scheme
The EU emissions trading scheme is a central part of the EU’s policy to combat climate change. It aims to reduce industrial greenhouse gas emissions cost-effectively. It is the
largest international carbon trading system in the world and covers more than 11,000 power
stations and industrial plants in 31 countries, including airlines.
The EU operates a cap a trade system – the EU Commission sets a limit on the amount of
carbon emissions allowed per year and allocates a set amount of emission allowances to
every concerned company. Any emissions a company does not use can either be kept for
future use or be ‘sold’ to other companies who may need to produce more emissions. Companies can also buy credits on the international market from emission-saving project.
Companies who emit more than their allowance are heavily fined. This system ensures that
companies ensure that their production costs are as efficient as possible while rewarding
companies who reduce their outputs.
The general idea behind the scheme is that the total amount of emission allowances are
gradually reduced, allowing for an improvement of air quality. The scheme covers around
45% of emissions produced by industries operating within the EU.
6.2 Climate Change Adaptation – Green City Action Plans, Climate Mitigation Plans
& DRR Plans
Climate change management covers a wide variety of different actions taken by a city to
mitigate the social, economic and political effects of climate change. As such, there is no one
single project which covers climate change adaptation.
The best example of climate change adaptation are the numerous cities around the world
which have undertaken intensive planning efforts in order to better plan their cities in
anticipation of eventual environmental changes.

Appendix D 9
Importantly, planning for climate change must be a forward planning rather than a ‘reactive’ measure. This is a key determinant of the success of climate change adaptation. The plans
must include a range of short, medium and long term plans for the city to develop. Examples
of this can include: building code upgrades to ensure resistance to earthquakes in cities such
as San Francisco; ensuring good upstream river management to deliver clean water to urban
centers further downstream in New York and; regulating harmful environmental practices
(mining) which exacerbate negative changes to the environment.
6.3 Community Participation and Ownership – Vancouver, Canada; public
participation in GCAP planning
GCAPs and other climate adaptation plans must benefit from public input, participation or
support in order to ensure their success. Most planning activities receive support from the
population because they can see concrete changes. However, it is also important for the
plans to benefit from real ‘ownership’ not just from the government but within the public.
Public deliberations, such as those which occurred in Vancouver during the GCAP planning
process, provided government leaders with a better idea of what the population’s key concerns were. The public helped to rank the cities priorities and were made a cornerstone
of the GCAP. This ensured that key figures in the local government could throw their support
behind the GCAP and provide the necessary political impetus for implementation of the plan.
In another sense, the public must also be made to ‘do their part’ within the plan. For
example, encouraging car-pooling or cycling must be rewarded by tax cuts or be made part
of company policy such as the UK’s ‘cycle to work scheme’. Another example is government policy in Copenhagen which encourages companies to allow ‘tele-working’ to reduce commuting and therefore, emissions.
6.4 Ecology Management – Singapore; ‘Palau Semakau’ Landfill
Allowing an ecosystem to thrive within or near to an
urban space encourages a healthier population and
increases the livability within a city. As ever, there
are innovative ways to create a thriving ecosystem
near to or even within a densely populated urban
area.
Palau Semakau landfill is Singapore’s only landfill. It lays 7 km south of Singapore on a converted island
which has an area of 3.5 square kilometers and has
a capacity of 63 million m³. While the island is
actively used as a landfill site, the government
ensures that great care is taken with respect to the
island’s environment.
As a result, the landfill still supports a thriving ecosystem with a range of birds, animals and
expansive coral network. In 2005 the island was opened up to the public which is regularly
visited as part of a bid to encourage scenic and sports tourism.
6.5 Energy Management – Kunming, China; ESCO Contract
Efficient energy management for cities can often be difficult to achieve, especially in
countries such as Indonesia where the power company works on a provincial rather than
municipal scale. While trading solar panels and wind farms is one way to go about energy
management, these require huge investment costs which are often difficult to find.

Appendix D 10
ESCO contracts are one way to
go achieve efficient energy
management. In this type of
contract which was implemented
in Kunming, an ESCO offered to
switch out the entire city’s traditional inefficient street
lighting with LEDs which
consume very little energy. As a
result, the company successfully
decreased the city’s energy consumption by 35%
This was done without the city
paying anything extra. Rather, as
in any ESCO contract, the city
continues to pay X amount over
Y years for their electricity bill. The ESCO pockets the city’s money to pay back their investment and make a profit. Finally, after several years of operation, the ESCO leaves
resulting in a much lower bill for the city.
Essentially, ESCOs allow cities to upgrade their infrastructure and save money without any
extra investment cost.
6.6 Food Management – Portland, USA; Reducing the consumption of carbon
intensive foods
Getting food from the producer to the consumer is usually extremely inefficient both
economically and environmentally. Tackling food management is about ensuring that the
food chain supply from the producer to consumer is as efficient as possible. This ensures
that local producers directly benefit and grow the local economy while keeping food prices
low for the general population. In other words, good food management is about reducing
transport costs.
In order to implement this, the city of
Portland drafted legislation to encourage
the consumption of locally produced
foods. This meant giving space to local
producers to showcase their products
through ‘farmers markets’ and other grassroots initiatives. The actions
implemented in Portland also included a
new labelling system of foods to raise
consumer awareness of how ‘carbon intensive’ their foods were. These efforts
combined have directly reduced GHGs but more importantly, they have greatly aided the
local agricultural economy and increased the city’s revenue.
6.7 Green Economy Management – Copenhagen, Denmark; Export of wind
turbines
Part of becoming a ‘green’ city is about underlining the business value of projects which are good for the environment. After decades of green planning, Copenhagen has become and

Appendix D 11
pioneer and the world’s largest exporter of the technology behind wind turbines around the
world. The ‘green’ sector is also the fastest growing sector of its economy.
Consequently, the city has directly increased its revenues as a result of an increase of
company profits in the green sector over the last several years. The same occurrence is
being recorded in China. However, in both cases it should be remembered that this has to be
a government-led initiative where the local government needs to facilitate and incentivize
businesses to invest in the green economy through tax cuts or other similar benefits.
6.8 Green Fiscal Planning – Thanh Hoa Province, Vietnam; Charging concrete
producers to pay for mangrove plantations
Green fiscal planning is about not being wasteful with a city’s resources and finding
innovative ways to finance green projects. While there are several ways to finance projects,
often times, this can be as simple as allocating a larger city budget towards green projects. In
other cases where resources are more strained, capacity building and other measures can
be taken in order to improve efficiency of the city’s operations.
In Thanh Hoa Province, concrete producers are a vital part of the province’s revenue. Their operations have helped to fuel growth and as such, Thanh Hoa is now one of the fastest
developing provinces in Vietnam. The concrete industry is extremely polluting and the
government sought ways to alleviate the environmental damages it was causing. Being
situated along the coast, Thanh Hoa province is facing rising sea levels as a consequence of
climate change. In order to alleviate this threat, the government decided to charge concrete
producers a carbon tax and used the funds to plant mangroves along the coast which act as
a natural barrier to rising sea levels. In summary, the local government is helping to mitigate
climate change without paying extra costs or investments.
6.9 Green/Blue Spaces Management, Singapore; Skyscraper gardens
While this is often recognized by several developing cities
as a mainstay of ‘green’ development, green and blue
spaces become difficult to create and manage when land
is limited and housing, offices and other buildings obstruct
their development.
In reality, keeping a green space present in a sprawling
urban space such as Central Park in New York or Hyde
Park in London requires decades of forward thinking which
is always threatened by the push for economic
development and prime real estate.
Singapore, faced with extremely limited space and having
given into the need to construct in order to guarantee
economic growth, instead implemented a policy which
states that every citizen should have access to a green
space within 15 minutes of walking. The solution was to
build gardens within or on rooftops of the skyscrapers
which are closely packed across the city-state. In doing so,
the city simultaneously incentivized developers to provide green spaces as part of their
buildings which citizens could enjoy and which consequently reduced GHG emissions.
6.10 Solid Waste Management – Cebu, Philippines; Solid Waste Management Board

Appendix D 12
Cities can increase the efficiency of their solid waste
management systems through a range of measures –
many will focus on large investment projects, such as
the waste to energy landfills in Vancouver. However,
it is important to remember that relatively inexpensive
fixes can result in a huge cost savings for a city
through capacity building and education on waste
reduction and recycling (3 R’s – reduce, reuse
recycle).
In Cebu, the city set up a Solid Waste Management
Board (SWMB) which provided education, logistical
and policy support to citizens to help them put what
they learnt into practice throughout their respective
communities. The project’s success demonstrates how much can be achieved if citizens are taught
environmentally sustainable principles.
6.11 Transport Management – London, UK; Congestion Charge
When cities think about transport
management, most will envision expensive
infrastructure projects which can be very
difficult to set up and manage due to the
system’s economic, environmental and most
importantly, political costs. However, thinking
about transport management in innovative
ways can generate a city millions in revenue if
properly implemented.
London was the world’s first major city to employ a congestion charge to reduce the flow of
traffic into and around the city centre. Employing a congestion zone charge favours the use
of public transport, allows the government to create a revenue stream and reduces GHGs in
densely populated areas. It also reduces travel time by decongesting the zone, costing less
for business. London’s congestion charge has generated over $1.5 billion in 10 years.
6.12 Urban Building Management – Italy; Preservation of heritage sites
Urban building management
ensures that buildings
become more energy
efficient. This can easily be
done through changes in
regulations which force
developers to create
carbon-neutral structures –
as was done in Vancouver.
However, urban building management can also be about ensuring the preservation of
heritage sites which can generate revenue for the city. These structures are often expensive
to upkeep and governments must find innovative ways to deal with this.
In Italy, one mechanism for funding for both private and government conservation projects is
through a special scheme with banking institutions. A bank may choose to finance a

Appendix D 13
conservation project to a listed building, monument or artwork due to the publicity it receives,
tax breaks or reduced tax exposure, or statutory requirements. For example the Monte dei
Paschi di Siena (Bank) is required to donate a certain percentage of its profits to
philanthropic initiatives which include such conservation projects.
6.13 Water Management – Phnom Penh, Cambodia; Increase of coverage and
reliability of water supply
Good water management is vital to ensuring a city’s green future. Again, large investment projects are often required, but the key is to find an innovative way to finance the required
investments. This largely comes down to efficiency. In the same way that a city may carry out
a study to increase the efficiency of its solid waste management systems, the same can be
done for water management.
In Phnom Penh, the Phnom Penh Water Authority realized that over 70% of their water
disappeared without ever being paid for – government and water utility employees were
refusing to pay for their water usage. By forcing everyone to pay and threatening
disconnection, the water authority was able to expand coverage from 40% in 1993 to over
90% of the population in 2009 with clean, affordable water.
6.14 A note on cross-sectoral initiatives – Manila, Philippines; Pasig River
Rehabilitation Commission
A GCAP will sometimes have to implement projects which intervene
across a range of areas. In this case, it often makes sense to create
scheme which can cut across the various sectors and manage all the
aims with one initiative.
For example, the government of the Manila decided in 1999 to
rehabilitate the Pasig River which begun to suffer from extensive
environmental and economic damage. To do this, the government set
up the Pasig River Rehabilitation Commission (PRRC). PRRC
undertakes range of projects under single coordination mechanism:
Environmental Management, Housing and Resettlement, Riverbank
Transportation and Flood management, Public Information, Advocacy
and Tourism. The logic behind the commission is that it saves time
and money by creating positive conditions for project success from start to finish.
Its efforts have been expanded in recent years – the commission continues to deliver
integrated projects under a unified body with a central leadership team.
7 Methods for Developing GCAPs
As demonstrated in the previous section, the key to GCAPs is finding local solutions to local
problems through innovation – the more a city adapts to its natural environment, the ‘greener’ it will be. For example, Singapore’s geography as an island city-state led it to heavily invest
in recycling water while Vancouver’s underground landfills allowed it to both produce electricity and significantly reduce a source of GHGs.
The success of any GCAP is also heavily dependent on local ownership of the plan. The
belief is that by having significant local input in developing a GCAP, the local government,
other stakeholders, and the community must become the key stakeholders, and will have a
stronger interest in ensuring that the program is adhered to. Their local knowledge will also
facilitate the development of an action plan which works. It is important therefore that any

Appendix D 14
GCAPs in Indonesia are produced in Bahasa in a simple format which can be disseminated
to stakeholders.
GCAPs need to be flexible working documents which are to be regularly revised using best
practices from other examples in both developed and developing countries. This also
contributes to the transfer of knowledge solutions across the world.
In order to effectively bring about ‘green’ change, there is a strong need for both physical and non-physical initiatives. For example, as much as waste water treatment plants may need
expanding, non-physical actions such as capacity building in water conservation for both the
local community and officials remains essential, as well as the institutional set up to
implement the project. These should be specific actions in themselves.
The table below presents a broad overview of the different methodologies and approaches
currently being used to help develop green cities across the world.4 While the table not
exhaustive, the quantity of existing programs indicates a lack of consensus about how to
best develop green cities. However, it is also encouraging that there is at least an agreement
that the development of green cities is essential if urban centers are to sustainably thrive in
the future.
Institution Program Name Description
Asian Development Bank (ADB)
GrEEEn Cities Centred on improving the Environment, Equity and Economic Competitiveness of an urban area.
Inter-American Development Bank (IDB)
Emerging Sustainable Cities Initiative (ESCI)
City led step by step methodology focused around 6 phases creating specific plans to implement sustainable development options.
ICLEI GreenClimateCities Program
A comprehensive climate change mitigation program for Local Governments that offers a process tailor-made to Local Government requirements and a clear and flexible methodology covering 3 phases: Analyse, Act and Accelerate.
EU Reference Framework for Sustainable Cities (RFSC)
An on-line toolkit which offers a multi-purpose decision-making and communication tool for promoting sustainable urban development. It is not place-specific and can be adapted to suit local priorities and different circumstances. The tool demonstrates step-by-step what actions are possible or necessary to organise the process in a city or municipality.
World Bank Planning, Connecting and Financing Cities
Policy focus of the WB to make sustainable cities by using an integrated approach focused on the three pillars of planning, connecting and financing. Detailed review covering lessons learnt available.
Mayors Adapt- the Covenant of Mayors Initiative on Climate Change Adaptation
Toolbox of Methodologies on Climate and Energy
The toolbox provides practical guidance and knowledge support to its signatories as well as to any other interested cities, towns or stakeholders in Europe and beyond and supports urban adaptation decision-makers, practitioners and interested stakeholders with a quick-start step-by-step guidance through the adaptation planning and implementation cycles.
4 The focus of this table is on methodologies for green city development. However, other features including rankings and
dialogues ha e also ee i luded e ause the o tri ute to the tool o a d therefore aid the ethodologi al pro ess.

Appendix D 15
EU GRaBS: Climate Change Adaptation Action Plan Guidance
The GRaBS project is a network of leading pan-European organisations involved in integrating climate change adaptation into regional planning and development.
Asia Green Camp Kitakyushu Model Initiative
The Kitakyushu Model was developed to systematically organize the city’s urban environmental administrative know-how. By utilizing the Kitakyushu Model, master plans can be proposed to create sustainable cities that meet the needs of emerging countries, and the concept of “green cities” (eco-friendly cities) can be exported overseas.
8 Focus on Methodologies
8.1 ADB – grEEEn Cities
ADB’s grEEEn city concept is still in development but the framework below illustrates their
vision of Green Cities centered on improving the Environment, Equity and Economic
Competitiveness.
Source: ADB
ADB’s framework is currently being applied to Vinh Yen, Vietnam and Mandalay, Myanmar. The approach is useful as it provides a conceptual framework which can be applied to
produce a more liveable city, but it is lacking a clear and consistent methodology or approach
for developing and implementing GCAPs. In reality, the concept’s broadness, although potentially interpreted as a strength, may allow too much room for interpretation, resulting in
sporadic and uncoordinated initiatives which although individually good, do little to improve
the overall socio-economic conditions of urban residents. This is particularly the case in
developing countries where governments have little experience creating or implementing
GCAPs.
GCAPs produced by ADB supported TAs to date have been driven by consultants, and
actions are focused on projects rather than the actions (institutional, capacity, finance)
necessary for implementing said projects.

Appendix D 16
There is no standard ADB methodology for facilitating locally developed GCAPs so this TA
will have to develop and trial the methodology throughout.
8.2 IDB – Emerging Sustainable Cities Initiative (ESCI)
The Inter-American Development Bank (IDB) has developed a framework for developing
action plans under the Emerging Sustainable Cities Initiative that is being applied across
Latin America. Importantly, this includes a methodological guide which facilitates action plan
preparation through a logically phased and consistent process.
Source: IDB ESCI Methodological Guide
IDB’s framework is also particularly helpful as it allows the GCAP to easily adapt to local circumstances. ‘Conceptually the approach uses three dimensions of sustainability:
environment and climate change; urban, including integrated urban development,
mobility/transport, economic and social development, competitiveness and security; and
fiscal and governance.’5 Essentially, the IDB framework offers a more consistent approach
to establishing city level action plans and could be adapted to develop GCAPs in Asia.
8.3 ICLEI – GreenClimateCities (GCC) Program
Built on over 20 years of experience in developing
sustainable solutions for local governments, ICLEI
created the GCC program by combining their
extensive collection of planning and monitoring
tools. The aim of this methodology is to provide a
comprehensive climate mitigation framework for
local governments focused around three stages:
Analyse, Act and Accelerate. The program is
broad and can be tailored to each city.
The GCC Program derives its strength from the
numerous tools ICLEI has developed over the
past 20 years. The program has also created a
toolbox of methodologies which gives local
governments access to numerous tools such as
trainings, information documents and processes.
None the less, the choice of tools available to governments could prove confusing to
emerging cities that have little experience implementing complex programs. It is very unlikely
that cities which lack management/technical capacity will be able to guide themselves
through ICLEI’s complex processes.
5 IDB, Methodological Guide, IDB, 2012, p. 2
Appendix D 17
8.4 EU – Reference Framework for Sustainable Cities (RFSC)
RFSC is aimed at European municipalities who want to become more sustainable but lack
the capacity to develop a complex and innovative program. ‘The Reference Framework for European Sustainable Cities (RFSC) is an online toolkit designed to help cities promote and
enhance their work on integrated sustainable urban development. It is available free of
charge to all European local authorities and offers practical support in integrating
sustainability principles into local policies and actions.’
It is difficult to tell whether the RFSC has proven to be a success. At the time of writing, it
appears that the RFSC website has fallen into neglect, having not been updated since 2014.
Although the tools provided the RFSC are certainly useful and should be applicable to a
range of cities, it appears that the methodology suffered from a lack of buy-in from European
Local Governments.
However, it should be noted that the RFSC exists within a broader framework for ‘greening’ cities in Europe. It is embedded within European legislation and is part of a ‘toolkit’ which encourages city to apply to become to European Green Capital – an annual award which
recognizes a city’s achievements in policy.
8.5 World Bank – Planning, Connecting and Financing Cities
The World Bank developed this resource in 2013 as part of its own efforts to encourage
sustainable urban planning in local municipalities by concentrating on three pillars of the
‘greening’ process: planning, connecting and financing. While the document does not provide a step by step methodology (and therefore suffers from the same defects as ADB’s grEEEn concept), it does provide a useful database of ‘lessons learnt’ which are drawn from examples across the world.
The main argument found in this study is that cities need to plan accordingly across the three
pillars, as indicated in the diagram below. It appears that the study’s lessons have been integrated into policy planning –‘for example, In India, the Urbanization Review provided considerable inputs to the teams that shaped the contours of the 12th Five-Year Plan; in
Colombia, the Urbanization Review helped in the design of a Mission for Cities—the product
of a high level committee for urban management.’

Appendix D 18
8.6 European Commission – Mayors Adapt Initiative & the Urban Adaptation
Support Tool
Mayors Adapt was an
initiative of the European
Commission whose main
aim was to create an
initiative to help cities
reduce their greenhouse
gas emissions. Mayors
Adapt provides a
framework for local
authorities to take action.
Cities who sign up to this
scheme must either develop a comprehensive adaptation strategy or integrate adaptation to
climate change into their relevant existing plans.
In turn, Mayor’s Adapt contributes a knowledge sharing base along with relevant expertise to help cities achieve these aims. While it doesn’t provide a methodology to develop green
cities, it assesses city’s needs on a case by case basis and helps encourage other cities to take part in the initiative.
The main strength of the program is the reliance for cities to ‘buy-in’ into their greening efforts
i.e. the effort to become a green city is the result of a city’s own initiative rather than imposed by external actors. This resolves the problem of political will which usually contributes to the
downfall of greening plans.
This initiative is extremely active and regularly holds conferences and other relevant
workshops to dissipate knowledge and best practices to cities throughout Europe. It currently
includes 149 local authorities as part of the initiative.

Appendix D 19
The Urban Adaptation Support Tool complements the Mayor’s Adapt initiative. Its aim is to
assist cities in developing climate change adaptation strategies and plans by providing
guidance, links to relevant sources and dedicated tools. It also provides an interactive step-
by-step ‘checklist’ for decision-makers, practitioners and interested stakeholders which guide
them through the adaptation planning and implementation cycles.
8.7 EU – GRaBS: Climate Change Adaptation Action Plan
The GRaBS project is a network of leading
pan-European organisations involved in
integrating climate change adaptation into
regional planning and development. It
proposes a 6 step cyclical process to help
local governments come up with a plan to
tackle climate change. Its main focus is to
encourage a cyclical process which is
reviewed every 2-3 years.
The plan suggests that cyclical climate
adaptation planning also, ‘enables local and regional governments to respond to
changing conditions, such as political
change, new technology, the evolution of
climate science or changes in society, by periodically updating the adaptation targets and
AAPs.’
8.8 Asia Green Camp – Kitakyushu Model Initiative
The Kitakyushu model is unique in the sense that it tailors itself specifically to Asian
societies, instead believing that values promoted in western cities or the methods they
employ are unsuitable for the development of green cities in Asia.
The model finds its roots in practical experience from the Japanese city of Kitakyushu.
Historically, the city grew to be heavily industrialised and consequently, suffered from
extensive pollution as a direct result of poor planning and unchecked urban development.
The city became so unlivable; the local government took initiatives to clean up the city
environmentally. Today, it boasts one of the highest scores of ‘livability’ in Asia.
As a result of the clean-up, the city developed a methodology based on its experiences
which it now seeks to spread to emerging cities in Asia. The figures below demonstrate the
concept behind the methodology.

Appendix D 20
9 A brief note on financing green city development
Robust financing mechanisms suited to local contexts are essential to ensure the success of
GCPAs. It must be remembered that underlying every Green City vision is the opportunity for
governments to increase revenue while making (generally) unquantifiable future savings on
healthcare, environmental degradation and energy resources. The importance is in finding
innovative solutions to enable short term financing of green actions given the financial
deficits experienced by a range of developing cities before environmental-related problems
appear.

Appendix D 21
10 A concluding note on implementation and monitoring
From the range of GCAPs analysed during this study, it is clear that the overwhelming
majority of GCAPs are in developed countries. However, this does not imply that GCAPs are
only appropriate for developed countries. On the contrary, by developing GCAPs now,
emerging cities can realize necessary changes to mitigate the negative effects of rapid
urbanization which create severe economic costs on their strained financial budgets.
Developing cities do acknowledge the need for green initiatives, but in order to sufficiently
impact the overall urban landscape a coordinated effort must be made – GCAPs offer an
appropriate tool to accomplish their Green City vision.
However, they must be simple, and at least initially, very much integrated with the prevailing
planning and project development processes. This dictates that for now, in such cities, they
may have to be sectoral and project focused rather than too innovative and integrated. For
GCAPs to succeed they need full engagement from the City, and this will require that they
are developed internally.
As previously stated, monitoring efforts of GCAPs have struggled. This can be partly placed
on the relative infancy of most GCPAs. However, in several cases monitoring has been
carried out by cities themselves leading to skewed results demonstrating success. Politicians
are usually mandated for short terms in office of three to five years resulting in their need to
demonstrate a project’s success during their time in office. This is equally prevalent in
countries such as Vietnam and China where politicians are nominated by the party. Skewed
monitoring results can be even more blatant in developing cities where a strong incentive
from the central government to demonstrate success exists. Developing a robust,
transparent and independent monitoring framework must therefore be considered essential
post-GCAPs. Without a comprehensive understanding of the success or failure of the
objectives being aimed for, the full potential of GCAPs is hindered. Good monitoring will rely
on indicators to be selected which are readily available and that can be readily and
transparently collected/compiled within the city’s (or responsible agency’s) technical capacity. Ideally a national body should be mandated to compile, validate and present this data
transparently.
There is an overwhelming case for the preparation of GCAPs in both developed and
developing cities across the world. As the vision of Green Cities picks up steam, increasing
numbers of cities will begin to implement GCAPs creating a knowledge base of best
practices for other cities to draw from. This vision, however, is conditional on choosing the
right actions. As Barker reminds us, “Vision without action is just a dream. Action without
vision just passes the time. Vision with action can change the world.” If Vancouver, Copenhagen and Portland are any examples to go by, it seems that GCAPs are at least a
step in the right direction to accomplishing a Green City vision.
Actions must be realistic (and logical and sequential), specific, and focused on delivering
projects or initiatives that bring about green results.

Appendix D 22
11 Selected Bibliography
Adelaide City Council, ‘Environmental Sustainability Strategy 2009-2012’, Adelaide, 2009.
Bangkok Metropolitan Administration, ‘The Bangkok Comprehensive Plan’, Bangkok, 2013.
R. Benner et. al., City of Portland and Multnomah County Climate Action Plan 2009, City of
Portland, 2009.
City of Cape Town, ‘Green Goal Action Plan, Cape Town, 2010.
City of Vancouver, Greenest City Action Plan: 2020 Action Plan, City of Vancouver, 2012.
L. Davis et. al., Delivering London’s Energy Future: Executive Summary, Greater London
Authority, 2011.
IDB, Methodological Guide, IDB, 2012.
Inter-Ministerial Committee on Sustainable Development, A Lively and Liveable Singapore:
Strategies for Sustainable Growth, Ministry of the Environment and Water Resources and
Ministry of National Development, 2009.
J. Lee, ‘How Green is Vancouver Now?’, The Vancouver Sun, 21 February 2014, available
at http://www.vancouversun.com/technology/green+Vancouver/9537550/story.html,
accessed 10 October 2014
J. Friederich et. al., Asian Green Cities Index, Munich, Siemens, 2011.
M. Jamieson, ‘How do cities become green? 10 Best practices of green cities’ [web blog], 22
May 2013, available at http://blog.schneider-electric.com/energy-management-energy-
efficiency/2013/05/22/how-do-cities-become-green-10-best-practices-of-green-cities/,
accessed 10 October 2014.
B.N. Lohani, ‘Innovative Solutions to Help Asian Cities Grow’, Climate Action Programme,
ADB, 22 January 2014, available at http://www.adb.org/news/op-ed/innovative-solutions-
help-asian-cities-grow-green, accessed 10 October 2014.
O. Lonngren, Stockholm action plan for climate and energy 2012–2015 with an outlook to
2030, City of Stockholm, 2012.
Mairie de Paris, ‘Plan Climat Energie de Paris’, Paris, 2012.
Rotterdam City, Rotterdam Climate City Mitigation Action Programme 2010, Rotterdam City,
2010.
A. Rubin et. al., Environmental Programme for the City of Malmo 2009-2020, Malmo City
Council, 2009.
D.M. Smith ‘Breaking: Portland sustainability chief admits ‘Portlandia’ isn’t really a parody’, Grist, 2 November 2012, available at http://grist.org/cities/breaking-portland-sustainability-
chief-admits-portlandia-isnt-really-a-parody/, accessed 10 October 2014.
P. Torres, et. al., Methodological Guide: Emerging Sustainable Cities Initiative, Inter-
American Development Bank, 2012.
A. Vogl, ‘Smart Concepts for Greener Cities’, in M. Lindfield and F. Steinberg (ed.), Green
Cities, Mandaluyong City, Asian Development Bank, 2012, pp. 373-405.

CLEANER COMPETITIVE RESILIENT
Increase efforts to reduce impacts to important local
ecosystems and on the wider environment
Provide opportunities and improved conditions for all
residents, communities and enterprises
Focus on maintaining improved conditions for
generations to come
Activities E1a. Conserve/reuse/reclaim water L1a. Improve solid waste collection services R1a. Prepare for sea level rise and coastal floodings
Example actions/projects e.g., promote water conservation, rainwater harvesting, reuse wastewater e.g., increase number of collection sites, increase frequency, recycling e.g., map potential inundation, coastal protection, natural defences
E1b. Upstream water management L1b. Increase coverage and reliability of water supply R1b. Prevent river and urban drainage floodings
e.g., protecting wetlands, catchment areas, reforestration e.g., expand coverage, reduce NRW, water master planning e.g., create water retention areas, improve dikes, canals, storm drains
E1c. Promote and facilitate reuse/recycling of waste materials L1c. Increase coverage of sanitation services R1c. Prepare for drought
e.g., recyclables collection, support local recycling businesses e.g., expand sewer system, decentralized sanitation systems e.g., climate scenarios, draught planning, water retention, conservation
E1d. Reduce energy consumption/ expand use of renewables L1d. Increase coverage and reliability of power supply
e.g., energy effiencies of utilities, green buildings, solar, wind power e.g., expand into unserved areas, reduce number of power outages
E1e. Promote local food production L1e. Provide affordable housing for urban poor R2a. Improved preparedness for tsunamis
e.g., fruit trees in parks, urban farms e.g., access to mortgages, publicly funded housing schemes e.g., tsunami evacuation routes, early warning system, awareness
L1f. Increase coverage and reliability of communication networks R2b. Improved preparedness for earthquakes
e.g., Internet cables, mobile networks, landlines e.g., resilient buildings, communications procedures for emergencies
E2a. Improve solid waste management R2c. Improved preparedness for landslides
e.g., reduce solid waste going to landfill, landfill methane capture e.g. mapping areas at risk, community preparedness
E2b. Reduce emmissions from transport L2a. Reduce congestion R2d. Improved preparedness for volcanic eruptions
e.g., promote low emmission vehicles, road pricing mechanisms e.g., discourage private car ownership, pedestrian only zones e.g., vulnarablity assessment, emergency plan
E2c. Reduce emissions from industrial activities L2b. Expand and improve public transport services
e.g., improving effiencies, regulations, incentives for greener production e.g., metro/tram rail system, bus repaid transit,more bus stops
E2d. Improve treatment of wastewater effluents L2c. Shorten journey times and distances R3a. Support local enterpreneurship
e.g., improve septic tanks, increase desludging, WWTPs e.g., expanding public transport networks, compact neighborhoods e.g.,access to finance, regulations, allocate public space
E2e. Discourage urban sprawl R3b. Encourage Public Private Partnerships
e.g., compact neighborhoods, spatial planning and regulation e.g., achieve creditworthiness, project development
L3a. Build and upgrade parks and other green spaces R3c. Support local workforce development
e.g., community parks, green roofs, sports fields, greening streets e.g., education, local skills development
L3b. Create attractive urban water bodies and waterfronts R3d. Increase local government's fiscal self-suffiency
e.g., improve water quality, beautify waterfront, wetland parks e.g., tariff reforms, efficiency improvements
L3c. Make walking and cycling safe, convenient and attractive R3e. Promote green businesses and create green jobs
e.g., dedicated bicycle lanes, footpaths, streetlights,shading e.g., pedicabs, recycling, solar panels, retrofiting, green technologies
L3d. Preserve heritage and other cultural/religious assets
e.g., adaptive reuse of historic buildings, improve access to religious sites
L4a. Promote Industry/Commercial Clusters
e.g, business/science/eco-parks, heavy industry cluster,
L4b. Allocate space for Small and Medium Enterprises
e.g, incubators, upgrading tourism areas, farmer markets
L4b. Upgrade town center / central business district
e.g, building renovations, cleaning/greening, events
L . Fa ilitate lo al e o o i gro th…
GREEN VISION
E . Redu e the i pa t o the e iro e t …
R . Redu e ul era ilities to e o o i tre ds…
Creating opportunities to make our city more liveable, with a cleaner environment for all of us and generations to come
Mission
L . I pro e ur a o e ti ity a d a essi ility for all…
L . Pro ide attra ti e pu li spa e for all…
R . Redu e ul era ilities to li ate related threats…Objectives
R . Redu e ul era ilities to geo-hazards…
E1. Optimize the use of natural resources.. L1. Provide reliable public services for all...