Embed Size (px)
Citation preview

© 2016 International Monetary Fund
IMF Country Report No. 16/352
LIBERIA TECHNICAL ASSISTANCE REPORT––PUBLIC INVESTMENT MANAGEMENT ASSESSMENT
This Technical Assistance Report on Liberia was prepared by a staff team of the
International Monetary Fund. It is based on the information available at the time it was
completed on July 2016.
Copies of this report are available to the public from
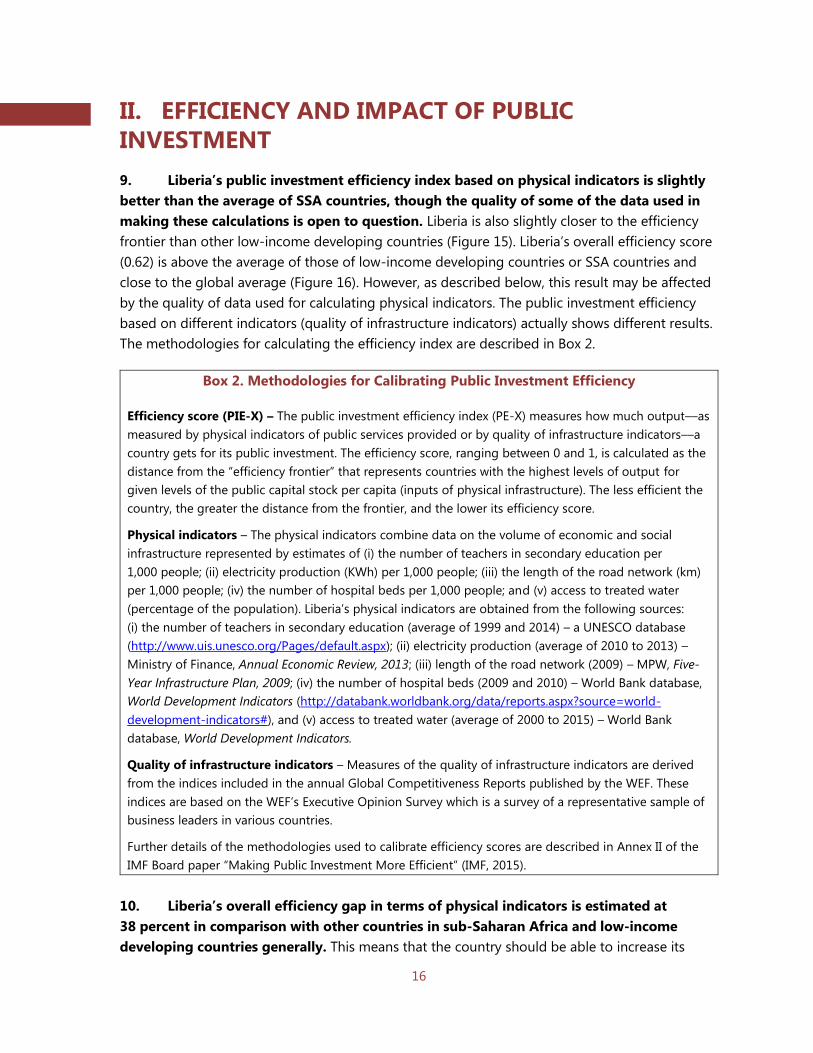
International Monetary Fund Publication Services
PO Box 92780 Washington, D.C. 20090
Telephone: (202) 623-7430 Fax: (202) 623-7201
E-mail: [email protected] Web: http://www.imf.org
Price: $18.00 per printed copy
International Monetary Fund
Washington, D.C.
November 2016

I N T E R N A T I O N A L M O N E T A R Y F U N D
F I S C A L A F F A I R S D E P A R T M E N T
LiberiaPublic Investment ManagementAssessment
Lesley Fisher, Richard Allen, Daniel Boakye, Willie du Preez,Yugo Koshima, and Andrew Lawson
Technical Assistance Report | November 2016

F I S C A L A F F A I R S D E P A R T M E N T
Liberia
Public Investment Management Assessment
Lesley Fisher, Richard Allen, Daniel Boakye, Willie du Preez, Yugo Koshima,
and Andrew Lawson
Technical Assistance Report
November 2016

1
CONTENTS
GLOSSARY _______________________________________________________________________________________ 3
PREFACE _________________________________________________________________________________________ 4
EXECUTIVE SUMMARY __________________________________________________________________________ 5
I. TRENDS IN PUBLIC INVESTMENT ____________________________________________________________ 9
A. Trends in Total Public Investment and Capital Stock ___________________________________________ 9
B. Composition of Public Investment ____________________________________________________________ 12
II. EFFICIENCY AND IMPACT OF PUBLIC INVESTMENT ______________________________________ 16
III. PUBLIC INVESTMENT MANAGEMENT INSTITUTIONS ___________________________________ 20
A. Overall Assessment ___________________________________________________________________________ 20
B. Investment Planning __________________________________________________________________________ 21
C. Investment Allocation _________________________________________________________________________ 26
D. Investment Implementation ___________________________________________________________________ 30
IV. REFORM PRIORITIES AND RECOMMENDATIONS ________________________________________ 36
A. Investment Planning Institutions ______________________________________________________________ 36
B. Investment Allocation Institutions _____________________________________________________________ 37
C. Investment Implementation Institutions _______________________________________________________ 37
D. Improving Capacity for Managing Public Investment Management ___________________________ 38
BOXES
1. Methodologies for Calibrating Public Investment and the Capital Stock in Liberia ____________ 10
2. Methodologies for Calibrating Public Investment Efficiency ___________________________________ 16
3. Project Adjustment Guidelines Utilized in Kenya ______________________________________________ 35
FIGURES
1. Public Investment ______________________________________________________________________________ 9
2. Public Capital Stock ____________________________________________________________________________ 9
3. Public Capital Stock per Capita, 2013 __________________________________________________________ 10
4. Public Debt and Budget Deficit ________________________________________________________________ 11
5. Recurrent and Capital Expenditure ____________________________________________________________ 11
6. Recurrent and Capital Expenditure, 2015 ______________________________________________________ 11
7. Capital Budget Execution Rate ________________________________________________________________ 12
8. Investment Volatility, 2011–16_________________________________________________________________ 12
9. Externally Financed Capital Expenditure _______________________________________________________ 13
10. Funding of Capital Expenditure ______________________________________________________________ 13

2
11. Public Investment by Function _______________________________________________________________ 14
12. Non-Capital Externally Financed Expenditure by Function ___________________________________ 14
13. Transfer from County Development Fund and Social Development Fund ____________________ 15
14. Capital Expenditure of State-Owned Enterprises _____________________________________________ 15
15. Efficiency Frontier (Physical Infrastructure Indicators) ________________________________________ 17
16. Efficiency Gap (Physical Infrastructure Indicators) ____________________________________________ 17
17. Measures of Infrastructure Access (Latest Years) _____________________________________________ 18
18. Quality of Infrastructure Scores ______________________________________________________________ 19
19. Efficiency Frontier (Quality of Infrastructure Indicator) _______________________________________ 19
20. Efficiency Gap (Quality of Infrastructure Indicator) ___________________________________________ 20
21. Strength of Public Investment Management Institutions _____________________________________ 21
22. Number of Public Sector Investment Projects in FY16 ________________________________________ 31
23. Capital Expenditure Performance, Relative to Budget ________________________________________ 31
24. Comparison between Budget Appropriations and Allotments _______________________________ 32
TABLES
1. Liberia Summary Assessment ___________________________________________________________________ 8
APPENDICES
I. Proposed Project Appraisal Guidelines for Liberia ______________________________________________ 39
II. Organizational Chart of Ministry of Finance and Development Planning ______________________ 41

3
GLOSSARY
AfT Agenda for Transformation
AMU Aid Management Unit
BFP Budget Framework Paper
BSE Bureau of State Enterprises
CAG Comptroller and Accountant-General
CDF County Development Fund
DBDP Department of Budget and Development Planning
DMC Debt Management Committee
DMU Debt Management Unit
DSA Debt Sustainability Analysis
ECOWAS Economic Community of West African States
EU European Union
FAD Fiscal Affairs Department
GoL Government of Liberia
GSA General Services Agency
IFI International Financial Institutions
LEC Liberia Electricity Corporation
LIBTELCO Liberia Telecommunications Corporation
LTA Liberia Telecommunications Authority
M&As Ministries and Agencies
MFDP Ministry of Finance and Development Planning
MLME Ministry of Land, Mines, and Energy
MPW Ministry of Public Works
MTEF Medium-Term Expenditure Framework
NIC National Investment Commission
PFMA Public Finance Management Act
PFMR Public Finance Management Regulations
PIU Public Investment Unit
PIM Public Investment Management
PIMA Public Investment Management Assessment
PPCA Public Procurement and Concessions Act
PPCC Public Procurement and Concessions Commission
PPP Public-Private Partnership
PSIP Public Sector Investment Program
SDF Social Development Fund
Sida Swedish International Development Cooperation Agency
SOE State-Owned Enterprise
SSA Sub-Saharan Africa
SWG Sector Working Group
TSA Treasury Single Account
WEO World Economic Outlook

4
PREFACE
At the request of the Minister of Finance, a mission from the IMF’s Fiscal Affairs Department
(FAD) visited Liberia during the period July 11–25, 2016 to conduct a Public Investment
Management Assessment (PIMA) and advise the government on improving management
practices for public investment. The mission was led by Lesley Fisher and included Richard Allen
and Yugo Koshima (all FAD), Willie du Preez, Andrew Lawson (both FAD experts), and Daniel
Boakye from the World Bank’s country office. The mission acknowledges the preliminary data
collection by the Regional Advisor for AFRITAC WEST II, Mr. Ashni Singh, which informed the
evaluation. The document was produced with the financial assistance of Swedish International
Development Cooperation Agency (Sida) and the European Union (EU).
During its stay, the mission met with the Hon. Boima Kamara, Minister of Finance and
Development Planning; the Hon. T. G. Brunson, Deputy Minister of Budgeting and Development
Planning; Dr. A. Kollie, Deputy Minister of Fiscal Affairs; the Hon. Sekou Sanoe, Comptroller and
Accountant-General; Mr. Edward Eesiah, Deputy Minister of Administration; and senior staff
members of the Budget and Development Planning Department including the Public Investment
Unit (PIU), the Aid Management Coordination Unit, the Debt Management Unit (DMU), the State-
Owned Enterprise (SOE) unit, IFMIS staff, and the Macroeconomics and Financial Policy Unit. It
further benefited from discussion with Senator E. Dagoseh, Chairman of the Ways, Means,
Finance, and Budget Committee of the Senate.
The Auditor General, Mrs. Y. S. Gaye, and her staff provided valuable insights with respect to the
oversight of public investment. In addition, the mission met with Ms. A. C. Bush, Minister of
Transport; Mr. R. F. Giddings, Deputy Minister of Public Works; Mr. Varney Sirleaf, Deputy
Minister of Internal Affairs; and Mr. C. K. Moniba, the President’s Delivery Unit. Meetings were
also held with senior managers from the Ministries of Agriculture; Education; Health; Land, Mines,
and Energy; and Transport; the Liberia Electricity Corporation; and the National Investment
Commission.
During the mission, a workshop was conducted with the PIU from the Ministry of Finance and
Development Planning (MFDP) as well as officials from the Ministry of Public Works (MPW) to
analyze the appraisal writing ability and project management functions of the PIU, as well as
possible requirements for templates to monitor projects and proposed guidelines for the
planning of capital projects.
The mission briefed representatives of donors on the mission findings, including the EU, USAid,
the World Bank, the IFC, and Sida.
The mission would like to thank the Liberian Authorities for their cooperation during the course
of its work. It is especially grateful to Mr. Emmanuel Togba and Mr. Lawrence Taylor from the
MFDP for coordinating the meeting schedule, as well as Mr. Daniel Boakye from the World Bank
for his guidance and close cooperation throughout the mission. The mission expresses its
gratitude to the IMF Resident Representative in Liberia, Mr. Charles Amo-Yartey and his staff for
their guidance and assistance with logistics.

5
EXECUTIVE SUMMARY
The overall performance of public investment management (PIM) in Liberia is in line with
that of comparable low-income countries, and reflects the country’s post-conflict status,
which severely damaged its infrastructure, and heavy dependence on external loans and
grants. Principal weaknesses in PIM include the absence of an integrated pipeline of projects for
domestic or external funding that have passed tests of economic and social viability; poor
information flows on the execution of projects between ministries and agencies (M&As) and the
MFDP; the absence of an integrated database of planned and ongoing public investment
projects; and a recently established but still largely ineffective oversight role for the MFDP.
About 80 percent of Liberia’s public investment is financed through external sources.
grants and concessional loans, and executed outside the budget. These sources of funding
are not within government’s control and have contributed to the volatility of public investment in
recent years. In addition, co-funding of donor-financed projects does not always materialize, and
contributes to delays in the implementation of projects.
Liberia’s investment spending is less efficient and its capital stock lower than its
competitors. The Public Sector Investment Program (PSIP) comprises development projects
which do not distinguish between capital and recurrent spending—thus making it difficult to
accurately identifrighty the capital stock. The mission estimates that, despite Liberia spending
more on public investment as a share of GDP than Economic Community of West African States
(ECOWAS) and Sub-Saharan African (SSA) countries, its overall capital stock is lower than these
comparators. The estimates show an average efficiency gap of 38 percent in Liberia, indicating
that the country has substantial room to further improve the efficiency of investment spending.
Part of this efficiency gap is attributable to replacing the public capital that was destroyed during
the 15 years of civil war. The gap also reflects weaknesses in some of the 15 public investment
management institutions that were assessed during the mission.
Liberia scores relatively well on the institutions for planning domestically-financed public
investment, but externally-financed projects are planned through separate processes. For
domestically financed projects, the Agenda for Transformation (AfT) provides for costed sectoral
projects which are discussed by sector working groups (SWGs), but sector priorities are not
necessarily reflected in budget appropriations or spending commitments by donors. Moreover,
when sector projects are prioritized, inadequate funding is made available to resource these
costed projects. Externally-financed projects should at the minimum be recognized in the AfT to
ensure integrated prioritization.
There are no formal public-private partnerships (PPPs) in Liberia and a disagreement exists
within the government about whether the Public Procurement and Concessions Act (PPCA)
should cover PPPs, or whether separate legislation is required. Private investment know-how
and funding is currently accessed through concession contracts, which are defined in law but

6
loosely regulated. The role of the MFDP in overseeing PPPs and concessions is not adequately
defined. Similarly, a draft SOE Act has not been implemented—which weakens the governance of
SOEs and could potentially expose the Government of Liberia (GoL) to unquantified fiscal risks.
The GoL has not announced in the recently introduced Medium-Term Expenditure
Framework (MTEF) or elsewhere any policy guideline or target for investment spending—a
critical element for sustainable development and future economic growth. The budget only
covers domestically-financed capital spending (through the PSIP) and has a disproportionate
focus on recurrent spending. Investment spending is allocated largely as a residual, after other
spending commitments have been met.
The lack of integration between externally-funded and PSIP project spending limits
budget comprehensiveness. The budget documents presented to the legislature do not
provide a comprehensive or consistent presentation of PSIP and donor-funded capital spending,
and a comparison of these data with budget execution reports is challenging. In addition, donor
agreements do not provide sufficient information on the functional (sector or M&A) breakdown
of investment projects, or their economic classification. The GoL’s definition of “development
projects” in the AfT also includes a mixture of capital investment and recurrent spending (e.g., on
training programs) which makes it difficult to accurately determine capital stock or investment
spending.
A fully appraised pipeline of projects, both externally- and domestically-financed, should
be developed to better inform funding decisions. In fact, concessional loans and grant
funding are often driven by the priorities of donors rather than the GoL. In extreme cases,
concessional loan agreements have been concluded without the project details being finalized,
appraised, or adequately costed. Introduction of an integrated project pipeline, based upon
standardized project cycle management procedures for domestically- and externally-financed
projects, would address these deficiencies.
The PIU in the MFDP should be adequately resourced and trained to perform all
investment funding decisions. Although some line ministries and all donors have adequate
project evaluation and appraisal capacity, the PIU does not have sufficient capacity to assess
these appraisals and make independent recommendations on domestic or counterpart funding.
Their role is focused on appraising compliance with recurrent budget guidelines and sometimes
on evaluating capacity building requests. This unit should become pivotal in advising on whether
projects have been adequately costed, whether risks have been taken into account, and if
government funding is justified.
Implementation of donor-funded projects uses the donors’ own systems and procedures,
and is generally more effective than the execution of domestically-funded projects.
Because of the perceived weaknesses in country systems for procurement, commitment control,
cash releases, or monitoring the execution of capital projects, these systems are not generally

7
used by donors. Since the bulk of investment spending is executed by donors, however, the GoL
scores quite well on these institutions. For domestically-financed projects, there is no guarantee
of full funding over the projected lifespan of the investment project, cash releases are often
inadequate, and there is limited evaluation or audit of projects once executed, which presents
potential financial risk.
The procurement framework for domestic projects is adequate, but could be further
improved by timely approval of procurement plans and ex-post monitoring of the
implementation of projects. The requirement to approve annual procurement plans
necessitates the use of sole sourcing by M&As to complete multi-year projects with the same
service providers. The legal framework does not allow for continuation of an existing provider
contract if a project extends over more than one year.
The institutional framework for PIM could be further strengthened along with
streamlining the responsibilities, reporting framework, and flows of information in the
MFDP. The ministry’s roles and responsibilities are fragmented across many divisions and units,
and could be centrally coordinated. Improvements in the MFDP’s organizational structure, and
the sharing and dissemination of relevant documents and data, would increase the ministry’s
ability to take informed decisions on the planning, allocation, and execution of public investment
based upon the use of an integrated PSIP pipeline of projects.
Public Investment Assessment Methodology
Institutional strength assesses the design of the processes, laws, systems, and managerial tools
implemented from a design point of view. It is based on the questionnaire presented in the
IMF Board Paper “Making Public Investment More Efficient.” This questionnaire comprises
15 institutions each with three indicators. For each indicator, three possible scores are set (low,
medium, and good). The scoring of the three indicators per institution is aggregated using
simple averaging. The following color code was used and scores for the institution were assigned
according to the following four categories:
Good Improving Medium Low
Strength of institution Highest score on
average
Two highest scores
and one low or
two medium and
one highest score
Medium score on
average
Lowest score on
average
Effectiveness assesses how well an institution is implemented in practice and whether it achieved
the envisaged results. The assessment drew on a wide range of information (e.g., numerical data,
reports by the GoL, audit reports, and reviews and assessments of donors and international
organizations). For the efficiency ratings, the mission evaluated domestically and externally
financed public investment and provided an average score for the two practices. The following
color code was used: High Medium Low
Effectiveness

8
Table 1. Liberia Summary Assessment
Phase / Institution Institutional Strength Effectiveness Rec.
A. P
lan
nin
g
1 Fiscal rules
Medium: The GoL has announced policy
objectives on debt and borrowing, but there are
no permanent fiscal rules.
Medium: Overall fiscal discipline is effective,
but with limited protection (targets) for
development spending.
2 National and
sectoral planning
Good: The system of national and sectoral
planning is well developed. Development projects
are costed and plans include measurable targets
for outputs/outcomes.
Improving: Planning processes for externally
financed projects and domestically financed
project (PSIP) exist but are not well integrated.
3 Central-local
coordination
Medium: Counties are not allowed to borrow, but
receive Country Development Fund (CDF) and
Social Development Fund (SDF) transfers for
development spending.
Low: There is no monitoring of capital
spending, and poor execution of projects
which account for under one percent of GDP.
4 Public-private
partnerships
Low: There is no legal basis or approved policy
guidelines for PPPs, which are currenly managed
as government concessions.
Low: No PPPs have so far been implemented,
but some are under consideration, creating
potential fiscal risks.
2
5
Regulation of
infrastructure
companies
Low: The legal basis for SOEs is weak, and the
MFDP has limited powers of financial oversight.
Medium: The markets in telecoms is
liberalized, and an electricity regulator is being
established. SOEs investment represents only
1.4 percent of GDP
2
B. A
llo
cati
on
6 Multi-year
budgeting
Low: The MTEF includes three-year projections
but these represent neither ceilings nor floors on
investment and do not include all projects or full
life cycle costs.
Low: MTEF projections are not accurate and
have limited coverage; some 60 percent of
externally financed projects is excluded.
7 Budget
comprehensiveness
Medium: Most projects are externally financed
and off-budget; some documentation is provided
in the budget and the legislature approves all
loans.
Low: Externally financed projects shown in the
budget are not broken down by M&As, and
the data are difficult to compare with spending
on PSIP projects.
8 Budget unity
Medium: Recurrent and domestic development
budgets are prepared and presented together,
but the classification of spending is not in line
with international standards.
Medium: Many PSIP projects have little or no
capital component (e.g., training projects), and
about half of the PSIP is described as
contingent.
3
9 Project appraisal
Medium: Externally financed projects are subject
to systematic appraisal by the donors; some
M&As have also developed good procedures to
appraise PSIP projects.
Medium: Donor projects are well appraised.
PSIP projects are generally small (less than
$500,000 USD), and may not require a full
appraisal.
10 Project selection
Medium: Most projects are externally financed
and in the absence of a pipeline and central
review process, the selection of projects is largely
donor-led.
Low: Some donor-funded projects proceed
which are not GoL priorities; decisions on
National Priority Projects are often taken in a
non-transparent way.
1
C. Im
ple
men
tati
on
11
Protection of
investment
Medium: Outlays are appropriated on an annual
basis; the MFDP can reallocate funds among
projects; and carryover for 90 days is allowed to
pay outstanding commitments. Externally funded
projects are governed by their project
agreements.
Medium: Sufficient appropriations are given
to domestic projects, but are under-executed
by around 70 percent due to shortage of
funds. Multi-year appropriations are not
permitted.
12 Availability of
funding
Low: Funds for PSIP projects are often released
late because of delays in budget approval, and
application of cash rationing through the
allotment system.
Low: Allotments for PSIP projects have been
on average one-third lower than
appropriations with knock-on effects on
execution rates.
4
13 Transparency of
execution
Medium: For domestically-financed projects,
there has been significant progress in ensuring
compliance with the procurement regulatory
framework.
Low: There is limited monitoring of projects,
and few ex posts audits by the GAC. PDU
monitors National Priority Projects.
14 Project management
Improving: Some M&As apply high standards of
project management and oversight, using
professionally qualified staff. Externally financed
projects are well managed by donors.
Medium: Management practices in some
M&As focus largely on financial compliance.
External audit reports reveal poor compliance
with procurement regulations.
5
15 Accounting for
public assets
Medium: The GoL prepares an inventory of
selected capital assets (e.g., government vehicles),
but there is no comprehensive register of
government-owned assets.
Low: There is no comprehensive inventory of
government-owned financial assets
9
I. TRENDS IN PUBLIC INVESTMENT
A. Trends in Total Public Investment and Capital Stock
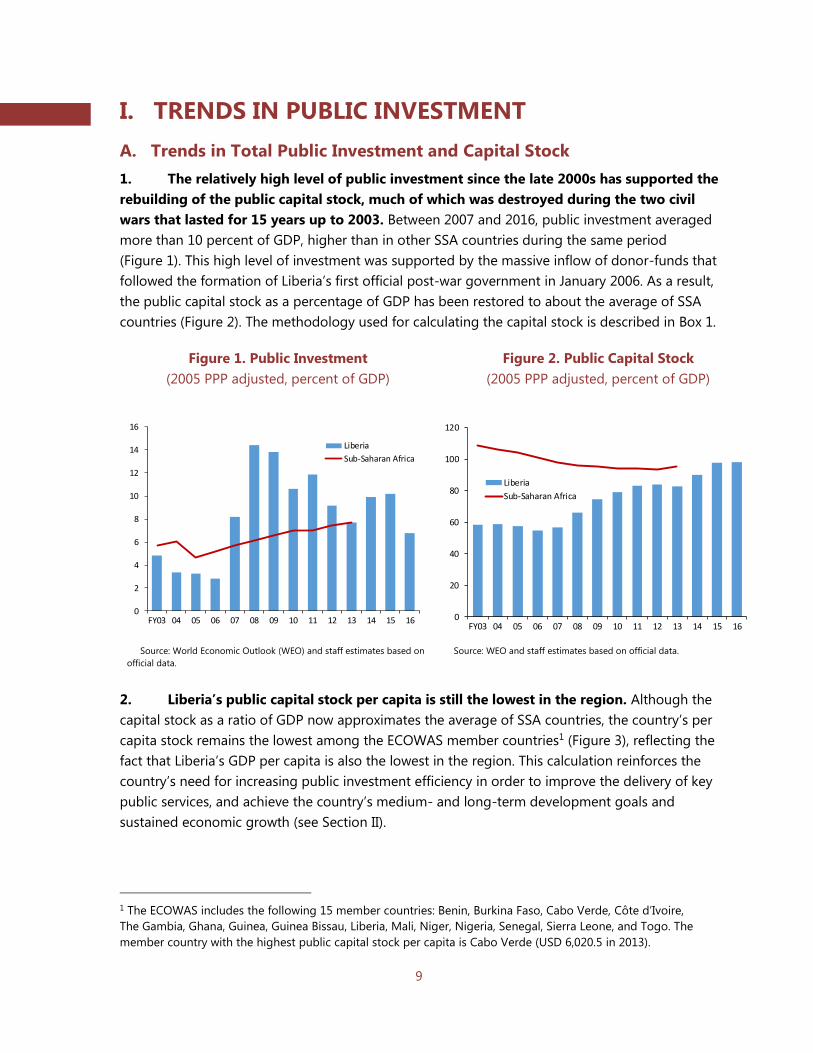
1. The relatively high level of public investment since the late 2000s has supported the
rebuilding of the public capital stock, much of which was destroyed during the two civil
wars that lasted for 15 years up to 2003. Between 2007 and 2016, public investment averaged
more than 10 percent of GDP, higher than in other SSA countries during the same period
(Figure 1). This high level of investment was supported by the massive inflow of donor-funds that
followed the formation of Liberia’s first official post-war government in January 2006. As a result,
the public capital stock as a percentage of GDP has been restored to about the average of SSA
countries (Figure 2). The methodology used for calculating the capital stock is described in Box 1.
Figure 1. Public Investment
(2005 PPP adjusted, percent of GDP)
Figure 2. Public Capital Stock
(2005 PPP adjusted, percent of GDP)
Source: World Economic Outlook (WEO) and staff estimates based on
official data.
Source: WEO and staff estimates based on official data.
2. Liberia’s public capital stock per capita is still the lowest in the region. Although the
capital stock as a ratio of GDP now approximates the average of SSA countries, the country’s per
capita stock remains the lowest among the ECOWAS member countries1 (Figure 3), reflecting the
fact that Liberia’s GDP per capita is also the lowest in the region. This calculation reinforces the
country’s need for increasing public investment efficiency in order to improve the delivery of key
public services, and achieve the country’s medium- and long-term development goals and
sustained economic growth (see Section II).
1 The ECOWAS includes the following 15 member countries: Benin, Burkina Faso, Cabo Verde, Côte d’Ivoire,
The Gambia, Ghana, Guinea, Guinea Bissau, Liberia, Mali, Niger, Nigeria, Senegal, Sierra Leone, and Togo. The
member country with the highest public capital stock per capita is Cabo Verde (USD 6,020.5 in 2013).
0
2
4
6
8
10
12
14
16
FY03 04 05 06 07 08 09 10 11 12 13 14 15 16
Liberia
Sub-Saharan Africa
0
20
40
60
80
100
120
FY03 04 05 06 07 08 09 10 11 12 13 14 15 16
Liberia
Sub-Saharan Africa

10
Box 1. Methodologies for Calibrating Public Investment and the Capital Stock in Liberia
Public investment – In the absence of reliable data on public gross fixed capital formation, public
investment was calculated as capital expenditure by the central government (excluding the costs of
acquisition of land, inventories, and valuables). Between 1990-96, on-budget capital expenditure is
assumed as zero due to the lack of budget execution data during this period. A breakdown of extra-
budget spending by economic classification does not exist. Therefore, extra-budget capital expenditure
from FY2014 to FY2016 was estimated by using actual disbursements for each2 project and the ratio of
capital spending to total project cost. These estimates were derived from a review of all project loan and
grant documents active during this period with actual annual disbursements exceeding USD 1 million
(covering 83% of total donor disbursements). Before FY2013, 40 percent of donor grant and loan
disbursements (excluding budget support) is assumed to be capital expenditure, based on the average
ratio of capital expenditure to total externally-financed expenditure between FY2014 to FY2016.
Public capital stock – The public capital stock was estimated using the methodology described in Annex I
of “Making Public Investment More Efficient” (IMF, 2015). From FY1990 to FY1996 and from FY2000 to
FY2003, a much increased depreciation rate (25 percent) compared to the standard depreciation rate
(2.5%) is applied in order to reflect damages to the public capital stock caused by the civil war. The
increased depreciation rate takes into account an IMF study which calculated a depreciation rate of
30 percent at the peak of the Burundian civil war: Since damage to the capital stock in Liberia was severe,
the 30 percent rate could be an underestimate. See: “How Can Burundi Raise its Growth Rate?” (Olivier
Basdevant, 2009, IMF Working Paper WP/09/11).
2 53 projects were used in the analysis.
Figure 3. Public Capital Stock per Capita, 2013
(2005 PPP adjusted US$ per person)
Source: WEO and staff estimates based on official data.
507.6
511.1
624.1
663.3
737.7
918.6
931.0
973.4
1047.7
1106.3
1161.7
1278.3
1711.8
1739.7
0 200 400 600 800 1,000 1,200 1,400 1,600 1,800 2,000
Liberia
Niger
Mali
Sierra Leone
Guinea
Guinea-Bissau
Burkina Faso
Togo
Nigeria
Senegal
Côte d'Ivoire
Benin
Ghana
Gambia, The

11
3. The limited fiscal space for capital spending is a constraint on efforts to increase
the stock of infrastructure and other productive investment. When Liberia reached the
completion point under the Heavily Indebted Poor Countries (HIPC) Initiative in June 2010, the
gross debt of the general government had been reduced to 30 percent of GDP, but the widened
fiscal deficit during the Ebola outbreak increased public debt to 36 percent of GDP in FY2015
(Figure 4). Furthermore, there is a large stock of proposals for external loans on which
negotiations between the GoL and the donors have not yet been completed. If approved and
fully disbursed, these loans could potentially create additional public debt up to 40 percent of
GDP.3 High levels of recurrent spending in the budget limits the amount of fiscal space that is
available for public investment. The ratio of recurrent spending to total central government
expenditure is estimated at 82 percent in FY2016 (Figure 5), higher than peer countries (for
example, around 75 percent in Ghana and 65 percent in Sierra Leone), and among the highest in
SSA (Figure 6).
Figure 4. Liberia: Public Debt and Budget
Deficit
(Percent of GDP)
Figure 5. Liberia: Recurrent and Capital
Expenditure
(Percent of total expenditure)
Source: Staff estimates based on official data.
Source: Staff estimates based on official data.
Figure 6. Recurrent and Capital Expenditure, 2015
(Sub-Sahara Africa, percent of GDP)
Source: WEO and staff estimates based on official data.
3 MFDP, Public Debt Management Report: Fourth Quarter, Fiscal Year 2014/15, 2015.
-5
-4
-3
-2
-1
0
1
0
5
10
15
20
25
30
35
40
FY2011 FY2012 FY2013 FY2014 FY2015Domestic debt External debt Budget deficit (RHS) 0
10
20
30
40
50
60
70
80
90
FY07 FY08 FY09 FY10 FY11 FY12 FY13 FY14 FY15 FY16
Recurrent
Capital
Liberia
0
5
10
15
20
25
30
35
0 10 20 30 40 50 60Recurrent Expenditure
Cap
ital
Exp
end
itu
re

12
4. Public investment through the budget is also highly volatile. Over the last three
years, the execution rates for GoL funded capital expenditure has varied widely, ranging from
41 percent to 102 percent of the original budget (Figure 7), partly because appropriations for
PSIP capital projects are often revised significantly during the fiscal year (see Institution 11). As a
result, Liberia’s public investment financed through the budget has been more volatile than in
peer countries in recent years (Figure 8), and budget allocations for public investment have been
unpredictable and uncertain. In addition, the actual disbursements to externally-financed public
investment projects are only around 40 percent of the projected level. This large deviation further
contributes to the uncertainty of resources available for capital spending.
Figure 7. Liberia: Capital Budget
Execution Rate
(Percent of original budget or projection)
Figure 8. Investment Volatility, 2011–16
(Standard deviations1)
Source: Staff estimates based on official data.
Source: Staff estimates based on official data.
1Volatility is calculated as the standard deviation of year-on-year
growth in the public investment to GDP ratio. Volatility of externally
financed public investment is based on actual disbursements.
B. Composition of Public Investment
Sources of funding
5. About 80 percent of public investment is financed through external sources that
are not appropriated in the budget. This pattern has not changed since the formation of the
current government (Figure 9). Over the last three years, public investment financed by external
loans represents about 22 percent of total investment (Figure 10). All outstanding external loans
are concessional and provided by multilateral and bilateral donors. The share of externally-
financed public investment is higher than in peer countries (for example, around 50 percent in
Ghana and 60 percent in Sierra Leone in recent years).
0
20
40
60
80
100
120
FY11 FY12 FY13 FY14 FY15
On-budget
Off-budget*
*No data for off-budget execution rate before FY13 0.0
0.2
0.4
0.6
0.8
1.0
1.2
1.4
Ghana Liberiaexternal
SierraLeone
Côted'Ivoire
Guinea Liberiadomestic

13
Figure 9. Liberia: Externally Financed
Capital Expenditure
(Percent of total capital expenditure)
Figure 10. Liberia: Funding of Capital
Expenditure
(Million USD)
Source: Staff estimates based on official data.
Source: Staff estimates based on official data.
Sectoral decomposition
6. The functional allocation4 of public investment in Liberia has focused on economic
infrastructure in recent years, as planned in the AfT. Between FY2014 and FY2016, the share
of capital investment in such infrastructure was substantially higher than in other SSA countries
(Figure 11). Investment in economic infrastructure mainly comprises energy and road projects
implemented by the Ministry of Lands, Mines, and Energy (MLME), the MPW, and the Liberia
Electricity Corporation (LEC), in order to address the significant infrastructure gap in these sectors
(see Section II.A). In contrast, capital investment in social projects, in particular the health and
education sectors, was considerably lower than in other SSA countries5. At the same time, a
majority of non-capital externally-financed projects were allocated to the health and education
sectors (Figure 12). This implies that Liberia has relatively good access to health and education
services (see Section II.A) which are operating, however, without the support of adequate capital
infrastructure, as discussed in Section II of this report.
4 In the absence of a modern functional classification in Liberia, the estimates included in this report are based on
the sector classification used in the budget. In particular: (i) the “economic infrastructure” function includes
energy, environment, agriculture, infrastructure and basic services, and the industry and commerce sectors;
(ii) the “social” function includes health, social development and education services; and (iii) the “other” function
includes public administration, transparency and accountability, the security and rule of law sectors, the Ministry
of Interior, the Monrovia City Corporation, and the Liberia Water and Sewer Corporation.
5 Between FY2014-16, Liberia’s capital investment in water and sanitation was lower than in other SSA countries.
This may be because most large capital projects in these sectors were implemented before FY2013 under the
WASH (water, sanitation, and hygiene) initiative.
0
20
40
60
80
100
FY07 FY08 FY09 FY10 FY11 FY12 FY13 FY14 FY15 FY16On budget domestic financing Off budget external financing 0
50
100
150
200
250
FY14 FY15 FY16
Off-budget grant
Off-budget loan
Domestic

14
Figure 11. Public Investment by Function
(Percent of total domestically and externally financed public investment. Excluding defense)
Liberia, FY2014–16
(Average)
Sub-Saharan Africa, 2009–13
(Average)
Source: WEO and staff estimates based on official data.
For definitions of economic infrastructure, social, and other sectors, see footnote 7.
Figure 12. Non-Capital Externally Financed Expenditure by Function
(Percent of total non-capital externally financed expenditure. Excluding defense)
Liberia, FY2014–16
(Average)
Source: WEO and staff estimates based on official data.
1,2,3/For definitions of economic infrastructure, social, and other sectors, see
footnote 7.
7. The share of public investment of counties and SOEs has been small in recent
years.6 The funding sources of public investment carried out by counties are mostly limited to
6 In the case of SOEs, investment projects are frequently managed by the entities, but ownership of the assets
rests with the government. Thus the projects count as investment by the government not the SOE.
89.8%
4.0%
6.2%
Economic infrastructure1 Social2 Other3
30.7%
38.1%
31.3%
Economic infrastructure1 Social2 Other3
26.8%
47.5%
25.7%
Economic infrastructure1 Social2 Other3

15
transfers from the CDF and the SDF (see Institution 3). These transfers, however, are small: less
than one percent of GDP in FY2013 and FY2015, and zero in FY2016 because mining companies
deferred payments of their contributions to the SDF
(Figure 13). Capital expenditure by infrastructure SOEs7 was 1.4 percent of GDP on average
between FY2013 and FY2015 (Figure 14). Although infrastructure SOEs are often responsible for
the implementation of public investment projects, the government typically finances the
investment and retains ownership of the capital assets.
8. Some capital investment has been made under concession arrangements since 2010
(see Institution 5).8 Under an agreement between the National Port Authority and APM
Terminals Liberia, Ltd. (a subsidiary of a Dutch company) concluded in September 2010, for
example, the concessionaire has invested around USD 80 million (4 percent of GDP) in the
facilities of the Freeport of Monrovia. These facilities are owned by the concessionaire, while the
NPA maintains the ownership of the concession area.
Figure 13. Liberia: Transfer from County
Development Fund and Social Development
Fund
(Million USD, percent of GDP (RHS))
Figure 14. Liberia: Capital Expenditure of
State-Owned Enterprises
(Million USD, percent of GDP (RHS))
Source: Staff estimates based on official data.
Source: Staff estimates based on official data.
7 Infrastructure SOEs include the Liberia Electricity Corporation, the Liberia Maritime Authority, the Liberia
Petroleum Refining Corporation, the Liberia Water and Sewer Corporation, the National Social Security
Corporation, the National Oil Company of Liberia, and the National Port Authority.
8 A concession agreement is a negotiated contract between a company and the government that gives the
company the right to operate a specific business within the government’s jurisdiction, subject to certain
conditions.
0.0
0.1
0.2
0.3
0.4
0.5
0.6
0.7
0.8
0
2
4
6
8
10
12
14
16
FY2013 FY2014 FY2015 FY2016
SDFCDF% of GDP (RHS)
0.0
0.5
1.0
1.5
2.0
2.5
0
10
20
30
40
50
FY2013 FY2014 FY2015
Total amount
% of GDP (RHS)
16
II. EFFICIENCY AND IMPACT OF PUBLIC
INVESTMENT
9. Liberia’s public investment efficiency index based on physical indicators is slightly
better than the average of SSA countries, though the quality of some of the data used in
making these calculations is open to question. Liberia is also slightly closer to the efficiency
frontier than other low-income developing countries (Figure 15). Liberia’s overall efficiency score
(0.62) is above the average of those of low-income developing countries or SSA countries and
close to the global average (Figure 16). However, as described below, this result may be affected
by the quality of data used for calculating physical indicators. The public investment efficiency
based on different indicators (quality of infrastructure indicators) actually shows different results.
The methodologies for calculating the efficiency index are described in Box 2.
Box 2. Methodologies for Calibrating Public Investment Efficiency
Efficiency score (PIE-X) – The public investment efficiency index (PE-X) measures how much output––as
measured by physical indicators of public services provided or by quality of infrastructure indicators––a
country gets for its public investment. The efficiency score, ranging between 0 and 1, is calculated as the
distance from the “efficiency frontier” that represents countries with the highest levels of output for
given levels of the public capital stock per capita (inputs of physical infrastructure). The less efficient the
country, the greater the distance from the frontier, and the lower its efficiency score.
Physical indicators – The physical indicators combine data on the volume of economic and social
infrastructure represented by estimates of (i) the number of teachers in secondary education per
1,000 people; (ii) electricity production (KWh) per 1,000 people; (iii) the length of the road network (km)
per 1,000 people; (iv) the number of hospital beds per 1,000 people; and (v) access to treated water
(percentage of the population). Liberia’s physical indicators are obtained from the following sources:
(i) the number of teachers in secondary education (average of 1999 and 2014) – a UNESCO database
(http://www.uis.unesco.org/Pages/default.aspx); (ii) electricity production (average of 2010 to 2013) –
Ministry of Finance, Annual Economic Review, 2013; (iii) length of the road network (2009) – MPW, Five-
Year Infrastructure Plan, 2009; (iv) the number of hospital beds (2009 and 2010) – World Bank database,
World Development Indicators (http://databank.worldbank.org/data/reports.aspx?source=world-
development-indicators#), and (v) access to treated water (average of 2000 to 2015) – World Bank
database, World Development Indicators.
Quality of infrastructure indicators – Measures of the quality of infrastructure indicators are derived
from the indices included in the annual Global Competitiveness Reports published by the WEF. These
indices are based on the WEF’s Executive Opinion Survey which is a survey of a representative sample of
business leaders in various countries.
Further details of the methodologies used to calibrate efficiency scores are described in Annex II of the
IMF Board paper “Making Public Investment More Efficient” (IMF, 2015).
10. Liberia’s overall efficiency gap in terms of physical indicators is estimated at
38 percent in comparison with other countries in sub-Saharan Africa and low-income
developing countries generally. This means that the country should be able to increase its

17
infrastructure outputs by 38 percent (see Figure 16) through improvements in public investment
efficiency without any increase in the current level of Liberia’s public sector capital stock. This
result underlines the importance of strengthening the institutions discussed in Section III of this
report.
Figure 15. Efficiency Frontier (Physical Infrastructure Indicators)
Source: Staff estimates.
Figure 16. Efficiency Gap (Physical Infrastructure Indicators)
Source: Staff estimates.
Liberia
0
20
40
60
80
100
120
140
160
0 10,000 20,000 30,000 40,000
Ph
ysic
al in
dic
ato
r (O
utp
ut)
Public Capital Stock per Capita (Input)
Low-Income Developing CountriesAll Other CountriesFrontier
0.0
0.2
0.4
0.6
0.8
1.0
LIDC{n=40}
SSA{n=34}
All Countries{n=122}
Effi
cie
ncy
sco
re
Mean
Liberia
Average Efficiency
Gap of 41%
Average Efficiency Gap
of 57%
Average Efficiency
Gap of 53%
25th percentile
75th percentile

18
11. There are significant gaps in access to infrastructure of all sectors (Figure 17). In
particular, electricity production (0.01 KWh per 1,000 people in 2013) and the length of the road
network is lower than in peer countries.9 However, questions can be raised about the reliability of
these data. For example, the number of teachers in secondary education may be overstated by
failing to eliminate ghost workers. Similarly, the indicator of access to treated water could be
biased towards urban areas, such as Monrovia, and may not fully reflect the limited availability of
treated water in rural areas.
Figure 17. Measures of Infrastructure Access (Latest Years)
Source: World Bank and staff estimates based on official data.
12. The quality of infrastructures in Liberia is perceived as worse than in peer countries.
According to a survey carried out by the World Economic Forum (see Box 2 above), Liberia’s
scores on the perceived quality of capital infrastructure, including social infrastructure, is below
the average of ECOWAS member countries (Figure 18). The survey results imply that the quality
of infrastructure in the health and education sectors, in which there has been little recent
investment, is low. The quality of road infrastructure in Liberia is also perceived as much worse
than the average of ECOWAS member countries, and is ranked as one of the lowest in the world
(Figure 18).
9 Because most public investment––both in the PSIP and externally-financed––has been allocated to energy and
road infrastructure in the last three years (see Chapter I, Section B), there is a possibility that the efficiency index
would show a better result than the calculations in Figures 17 and 18, which are based on older data.
0
20
40
60
80
0
1
2
3
4
Secondary teachersper 1000 people
Electricity productionKWh per 1000 people
Roads Km per 1000people
Hospital beds per1000 people
Access to treatedwater (%, RHS)
Liberia Average of Ghana, Sierra Leone, Guinea Sub-Saharan Africa Low-Income Developing Countries
Liberia 0.01

19
Figure 18. Quality of Infrastructure Scores
(Worst – 1, Best – 7, 2015)
(Global ranking, 2015, out of 140 countries)
Overall Roads Port Air
Liberia 119 127 90 117
Ghana 120 101 94 88
Sierra Leone 137 122 116 139
Guinea 140 140 113 136
Source: Staff estimates based on Global Competitiveness Report 2015–16, WEF.
13. The efficiency score based on the quality of infrastructure indicators places Liberia
below it comparator countries. When the efficiency score is calculated using the WEF’s quality
of infrastructure index described above, the estimated level of Liberia’s public investment
efficiency (efficiency score 0.72, efficiency gap 28 percent) is actually below the average of low-
income developing countries and SSA countries (Figures 19 and 20).
Figure 19. Efficiency Frontier (Quality of Infrastructure Indicator)
Source: Staff estimates.
0.0
0.5
1.0
1.5
2.0
2.5
3.0
3.5
4.0
4.5
5.0
Quality of overallinfrastructure
Quality of roads Quality of portinfrastructure
Quality of airtransport
infrastructure
Liberia ECOWAS average Global average
Liberia
0
20
40
60
80
100
120
140
0 10,000 20,000 30,000 40,000
Surv
ey-b
ase
d in
dic
ato
r (O
utp
ut)
Public Capital Stock per Capita (Input)
Low-Income Developing Countries
All Other Countries
Frontier

20
Figure 20. Efficiency Gap (Quality of Infrastructure Indicator)
Source: Staff estimates.
III. PUBLIC INVESTMENT MANAGEMENT
INSTITUTIONS
A. Overall Assessment
14. Liberia’s institutions for managing public investment compare favorably to other
LIDCs but require further development. Planning institutions are broadly effective but there is
no comprehensive legal framework for managing PPPs and SOEs. The allocation of resources is
less effective due to (i) the absence of multi-year project costs; (ii) exclusion of externally-
financed extra-budgetary capital spending in budget documents; (iii) inadequate or limited
information from development partners on their spending; and (iv) inadequate distinction
between capital and recurrent spending in the chart of accounts. These weaknesses and
limitations are elaborated below. With respect to implementation, project management and
procurement institutions generally score well, but more effort is required in providing predictable
cash releases for capital spending, carrying over funds for existing commitments, and developing
a comprehensive register of infrastructure and other capital assets (see Figure 21).
0.0
0.2
0.4
0.6
0.8
1.0
LIDC{n=37}
SSA{n=32}
All Countries{n=127}
Effi
cie
ncy
sco
re
Mean
Liberia
Average Efficiency Gap
of 19%
Average Efficiency Gap
of 21%
Average Efficiency Gap of
23%

21
Figure 21. Strength of Public Investment Management Institutions
B. Investment Planning
I.1. Fiscal rules (Strength – Medium; Effectiveness – Medium)
15. The GoL has announced some fiscal policy objectives, but these do not constitute
formal fiscal rules that are bound by law.10 In particular:
Over the period to FY2017/18, all new borrowing must be undertaken for the purposes of
investment, consistent with the government’s PSIP.11
Prior to any new borrowing being undertaken, a Debt Sustainability Analysis (DSA) must be
carried out and presented to the Debt Management Committee (DMC) to ensure debt rules
are not breached.
16. In practice, the GoL sets its fiscal policy objectives in consultation with the IMF in
the context of the ECF Program. Recent fiscal trends have been favorable. The overall fiscal
deficit is projected at 7.0 percent of GDP in 2016, compared to 3.8 percent of GDP in 2012, as
new tax revenue measures take effect. Total external debt is projected to rise from 28.2 percent
of GDP in 2016 to 38.5 percent in 2021,12 still well below the GoL’s stated ceiling of 60 percent.
The government’s AFT gives priority to infrastructure investment (see Institution 2). The GoL is
10 Ministry of Finance and Development Planning, Budget Framework Paper, FY2016/17, April 2016. Very similar
objectives are laid down in the MFDP’s Medium-term Debt Management Strategy, 2014–2016, December 2013
(pages 7–8).
11 This approximates to a “golden rule” of investment financing.
12 IMF, Liberia – Staff Report for the 2016 Article IV Consultation (to be published).

22
also committed to continue to prioritize external grants and focus on priority projects financed
by highly concessional loans. In addition, implementation of the PSIP will be limited to ongoing
projects, while domestic and external off-budget debt financing will be sought for priority
infrastructure projects.13
17. The IMF has argued that fiscal policy would benefit from a longer-term approach
and the formalization of a fiscal anchor in the form of an explicit debt target or spending
rule.14 Such a rule would make fiscal policy more predictable and support fiscal discipline. It
could be combined with measures to allow for the funding of multi-year development projects
through the budget, which is not provided for under existing legislation, and creates an incentive
for the government to seek off-budget financing sources (see Institution 6).
I.2. National and sectoral planning (Strength – Good; Effectiveness – Improving)
18. The system of national and sectoral planning in Liberia is well developed. The GoL
publishes several documents that describe development goals and challenges including a
statement of long-term development objectives and priorities, Vision 2030, a medium-term
development plan, the AfT,15 covering the period from 2012 to 2017, in which the various
programs and activities have been costed.16 In addition, several sectors have published their
development plans. The plan for the health sector,17 for example, focuses specifically on
investment in health infrastructure. In response to the Ebola crisis, the GoL prepared and
published in April 2015 its Economic Stabilization and Recovery Plan. In general, cost estimates
are based on assumptions and methods developed by the individual sectors18 rather than at
central level, e.g., by the MFDP. Most plans include quantitative targets for outputs and
outcomes, both at the aggregate level and for individual projects. On the downside, plans are
not regularly updated and the data in the plans are not reconciled with the projections of capital
spending included in the budget and the MTEF.
19. Arrangements for taking decisions on the scope and content of the development
plans, and for setting priorities (see also Institution 10) vary from sector to sector and are
generally effective. Usually, however, the process centers around sector working groups (SWGs)
which include representatives of the parent ministry, other M&As (including the MFDP), bilateral
and multilateral donors, and representatives of NGOs and civil society organizations. In sectors
such as mines, energy, and health, high level coordinating committees meet monthly or quarterly
13 IMF, Liberia – Staff Report for the 2016 Article IV Consultation, paragraph 14.
14 IMF, Liberia – Staff Report for the 2016 Article IV Consultation, paragraph 17.
15 Republic of Liberia, 2012, Agenda for Transformation: Steps toward Liberia Rising 2030.
16 Government of Liberia, Costing of the Agenda for Transformation, December 2012.
17 Ministry of Health, Investment Plan for Building a Resilient Health Sector in Liberia, 2015 to 2021. April 2015.
18 For example, both the Ministry of Education and the Ministry of Health uses standardized designs and norms
for estimating the cost of schools and health centers.
23
to take strategic decisions on investment priorities and resource allocation. The planning process
could be simplified by focusing on the overall use of resources derived from external aid,
counterpart funding, private sector finance (e.g., concessions and PPPs), and the national budget
(PSIP). Too much attention is currently focused on the PSIP which, counterpart funding aside,
constitutes around 20 percent of development spending (see Institution 10).
I.3. Central-local coordination (Strength – Medium; Effectiveness – Low)
20. The National Policy on Decentralization and Local Governance 2012 provides a
framework for the financial management of Liberia’s 15 counties. Although a fully
decentralized system is envisaged, the Local Government Bill, which is intended to give effect to
the policy, has not been enacted and local government services remain deconcentrated19 rather
than decentralized.
21. Counties lack own revenue, are dependent on central transfers, and under the PFM
Act 2009 are not allowed to borrow. Each county receives an annual transfer of $200,000 from
the CDF for expenditure on investment projects, and a few counties also receive payments from a
SDF from concession companies to fund projects.20 Multi-year projections of CDF and SDF are
not provided and the SDF payment schedule depends on when transfers are received from
concession companies. Counties have absolute discretion in the selection of capital projects
financed from these funds, which currently accounts for about 1 percent of GDP (Figure 13).
22. Reports issued by the General Audit Commission (GAC) have identified the lack of
project monitoring and execution in counties as a key challenge.21 The Ministry of Internal
Affairs—which is responsible for overseeing county spending—lacks capacity to monitor
counties’ performance in executing their projects. As a result, some projects have been
constructed to poor standards, construction has been abandoned, and procurement rules have
been violated. The reporting obligations of counties also require strengthening—a key
requirement for further decentralization of revenue and spending authority to counties.
I.4. Public-private partnerships (Strength – Low; Effectiveness – Low)
23. The policy framework for PPPs in Liberia remains undeveloped. A draft policy paper
prepared in 201422 by the National Investment Commission (NIC) sets out a coherent framework,
but the government has not yet adopted and published the framework, nor have any steps been
19 Carried out by branches of the agriculture, education, health and other ministries located in the counties.
20 Concessions range from $2,000 USD to $1.5 million per year and are paid by Arcelor Mittal Steel Company,
Western Cluster, Putu Mining, China Union, and BHP Billiton. (Source: MFDP, 2016/17 Budget Estimates).
21 GAC audit reports for Montserrado, River Cress, and Margibi Counties.
22 Republic of Liberia, Public-Private Partnerships Policy (2nd draft), October 2014.

24
taken by the GoL to put the framework into law, unlike several other countries in the region.23
The government is currently engaged in a legal dispute about the development of policy on
PPPs. The Public Procurement and Concessions Commission (PPCC) has argued that the PPCA
provides adequate legal cover for PPP contracts, a viewpoint disputed by the NIC. The NIC has
also argued that both of the alleged PPP contracts approved so far are in fact concession
agreements.24 This legal dispute is currently being adjudicated by the Ministry of Justice.
24. Despite the current legal vacuum, some line ministries are moving ahead with new
proposals to create PPPs. The Ministry of Health, for example, has also prepared a draft policy
paper on PPPs, and is working on the development of two potential PPP projects for clinical and
reference laboratories. PPP projects in the education sector are also under consideration.
Concession agreements are subject to elaborate procedures laid down in the PPCA, and overseen
by an inter-ministerial committee. Project proposals are also screened by the MFDP’s Fiscal
Affairs Department. In principle, these procedures should lead to decisions that enable projects
to achieve value for money. A recent report of the natural resources sector by Moore Stephens,
however, suggests that few of the 68 contracts awarded by the GoL since 2009 are fully
compliant with the law.25
25. Little information is currently available on the assets and liabilities that underpin
existing concession agreements and PPPs. Such data are not systematically collected by the
MFDP, nor is the physical, operational, or financial performance of the agreements monitored
against assigned targets.
I.5. Regulation of infrastructure companies (Strength – Low; Effectiveness – Medium)
26. State-owned enterprises (SOEs) are poorly regulated in Liberia, even though they
account for about 1.4 percent of GDP (see Figure 1N). Currently, 30 SOEs are listed by
Liberia’s oversight body, the Bureau of State Enterprises (BSE),26 of which only 14 are operational.
All of the entities are 100 percent owned by the GoL. It is questionable whether some of the
SOEs are genuine enterprises, and the GoL could consider bringing the classification into line
with international standards.27 There is no legal framework covering the governance and
23 Examples are Kenya, Tanzania, and Uganda, as well as South Africa.
24 The existing projects comprise a port concession awarded in 2010 under which the concessionaire has the sole
right to handle all forms of cargo and containers at the Freeport of Monrovia. The contract is for the period of
25 years and requires the concessionaire to make an investment of $120 million, together with other
assignments. The second PPP is a management contract with Manitoba Hydro International (MHI) also awarded
in 2010 to improve electricity services in Monrovia over a five-year period.
25 Liberia Extractive Industries Transparency Initiative (LEITI), Sixth Annual report, December 2015.
26 A GoL decision to close the BSE was announced during the mission.
27 As defined in the IMF’s Government Finance Statistics Manual 2014. One of the entities is the Liberia
Telecommunications Authority which is the regulator of another SOE, the Liberia Telecommunications
Corporation. In most countries, the National Social Security and Welfare Corporation would be classified as a
(continued)
25
oversight of SOEs with except for a few important provisions in the PFM Act (Section 43–46) and
corresponding financial regulations. A draft SOE Act has been prepared but not enacted, and its
provisions should be reviewed by the MFDP. A small SOE Financial Reporting Unit28 has been
established in the MFDP to monitor the financial performance of the 12 SOEs that are large or
impose significant fiscal risks. The unit prepares a report on SOEs that is published as an annex to
the budget, together with quarterly and annual performance-monitoring reports29 that include
information on the entities’ budgets and capital investment.
27. According to the IMF, the MFDP’s SOE Unit has helped build capacity in the SOEs,
improved their performance, and contributed to the reduction of subventions to these
enterprises of more than 50 percent.30 Nevertheless, overall financial performance in the sector
remains weak. Total subsidies to the 12 SOEs monitored by MFDP comprise some 20 percent of
operating revenues, and five corporations recorded operating losses in 2014/2015. None of the
dormant entities have yet been closed down. Compliance with the requirements of the PFM Act
is also unsatisfactory. Several companies, for example, have failed to provide the MFDP’s SOE
Unit with information on their budgets and financial plans.
28. The regulatory framework for SOEs currently provides only limited support for
competition in contestable markets. The Liberia Telecommunications Corporation (LIBTELCO)
is the national telecommunications operator, and licenses have been granted to private sector
operators, resulting in greatly improved access of households to cellphones (more than
50 percent), and prices that are reasonable by international standards.31 At the same time, the
Liberia Telecommunications Authority (LTA) was given an independent mandate to regulate both
the quality and price of services provided. The Electricity Law of 2015 will create an independent
Liberia Electricity Regulatory Commission with powers to issue licenses to the LEC or private
sector companies for the generation, transmission and distributions of electricity, and to
establish the methodology for setting tariffs. In other sectors (e.g., water and transportation)
similar reforms have not yet been introduced.
government agency, receiving income from social welfare contributions or other government revenues, and
making payments of pensions or other welfare benefits.
28 Comprising only two professional staff members.
29 MFDP, Consolidated State Owned Enterprises Annex to FY2016/2017 National Budget; FY2014/2015 Annual SOE
Financial Performance Report; FY2015/2016 SOEs Q2 Consolidated Financial Performance Report.
30 IMF, Liberia – Fourth Review under the Extended Credit Facility Arrangement, Country Report No. 16/8, January
2106, paragraph 17.
31 Republic of Liberia, Agenda for Transformation, page 75.

26
C. Investment Allocation
I.6. Multi-year budgeting (Strength – Low; Effectiveness – Low)
29. A MTEF has been published since FY 2011/12 and submitted to the legislature as an
accompanying document to the annual budget. The format of the MTEF has varied over the
years but, for FY 2016/17, it includes three-year forecasts of development spending, divided
among the 11 sectors defined in the AfT.32 These projections do not constitute binding or
indicative ceilings (or floors) for the two outer-years of the MTEF. Moreover, the coverage of
development spending is limited to the PSIP, which includes only GoL-funded projects and
counterpart funds for externally-financed projects, and is thus significantly incomplete.
30. The Budget Framework Paper (BFP) presents projections for aggregate
development spending, including on externally financed projects, but the linkages with
planning documents are unclear. The BFP does not break down the forecasts of total
development spending among either M&As or the sectors defined in the AfT. It is thus not
possible to compare the BFP forecasts of development spending with the numbers published in
the annual budget appropriations, the PSIP, or project documents for externally-funded projects.
31. Most major capital projects are externally funded and the costs of these projects
over their life cycle are not published in the budget or the associated documentation.
Major government-funded capital projects are included in the PSIP but until FY2016 funding (on
a project by project basis) has been shown for one year only. Thus, there is no document that
presents forecasts of the life-cycle costs of projects, including the recurrent costs of operations
and maintenance.
32. The Aid Management Unit (AMU) of the MFDP collects relatively comprehensive
information on externally-funded projects but this is not consolidated into a multi-year
database of anticipated project outlays. In addition, the database is compiled directly from
information included in loan or grant agreements. Thus, when several financing sources or loans
are required to finance a single project (such as the Mt. Coffee Hydro plant), these are presented
as separate items in the database.
33. The existing institutions for multi-year budgeting are, therefore, not effective in
generating comprehensive medium-term projections of capital spending on a full cost
basis. The most significant shortcoming is the absence of an integrated public sector investment
strategy, comprising a multi-year presentation of all development projects, regardless of their
source of funding. Ideally, the MTEF would incorporate the first three years of this integrated
32 These AfT sectors group the 109 spending entities (ministries, agencies and commissions) with responsibility
for budgetary spending. 10 of the sectors are consistent with the 10 high-level functions defined in COFOG, with
“Municipal Government” as an additional classifier. By contrast with a true functional classification, these do not
subdivide spending within institutional units but assign institutional spending in full to the AfT sector to which
they contribute.

27
strategy thus providing the legislature with a comprehensive overview of planned recurrent and
development spending. If, in addition, these documents embodied a standardized approach to
costing development projects, based upon an economic classification, clearly distinguishing
recurrent and capital spending, it would be possible to analyze and monitor capital investment
and, amongst other things, to use this information as a basis for projecting future maintenance
requirements.
I.7. Budget comprehensiveness (Strength – Medium; Effectiveness – Low)
34. As noted earlier, external-financing comprises about 80 percent of all development
spending. All such projects are executed off-budget, in most cases by externally-financed
project implementation units (PIUs) working within government M&As and, in some cases,
through externally-contracted private companies or NGOs. On average over the last three years,
less than 10 percent of government-funded development spending comprises counterpart
funding for externally-financed projects. This counterpart funding is included in the PSIP and is
appropriated in the annual budget, along with the remaining appropriations in the PSIP which
are for development projects wholly financed by the GoL. The composition of development
spending by funding source is shown in Figure 1.J above.
35. All external loans for development projects require the approval of the legislature.
It is reported that such approvals are rarely withheld by the legislature, although delays in
approval are common. External grants for development projects do not require legislative
approval but must be approved either by the Minister of Foreign Affairs or the Minister of
Finance and Development Planning, depending on the specific protocols that govern the signing
of financing agreements for the various donor agencies.
36. Documentation on externally-financed projects for the budget year is annexed to
the budget but is not presented on a project-by-project basis. For FY 2015/16, this
information was presented in an aggregated form, divided among the 11 sectors defined in the
AfT. In FY 2013/14, when it was first included as an annex to the budget, the presentation
followed a project-by-project format but this practice has not been continued, which has
significantly reduced the usefulness of the annex. The current format is not easily comparable
either with the PSIP (showing GoL-funded development projects) or with recurrent budget
allocations by M&As.
37. No information on PPP transactions or similar arrangements (such as investment
projects financed through concessions) is included in the budget or in annual debt
management reports. A significant number of public investments, however, have been privately
financed, in return for access to fee-based revenues deriving from those investments. For
example, the National Port Authority has a substantial arrangement of this kind for investments
amounting to some USD $ 120 million. Smaller scale investments have also been undertaken to
support the development of the vehicle licensing process, and are planned for the introduction
of weigh bridges to monitor axle loads on major roads.

28
I.8. Budget unity (Strength – Medium; Effectiveness – Medium)
38. M&As submit budgets for recurrent and for GoL-financed development spending
(PSIP) at the same time and this information is consolidated in one set of budget
documents by the MFDP. Externally-financed projects (the majority of development spending)
are prepared by MFDP and presented separately (See Institution 7).
39. Within recurrent cost appropriations, allocations are made for spending on
operations and maintenance but these allocations are not explicitly attributed to ongoing
or planned projects. The allocations are projected over the three-year framework of the MTEF.
Estimates of recurrent costs beyond the three-year framework of the MTEF are not systematically
included in the budget documents, or in the fiscal projections made by the macro-fiscal unit of
MFDP.
40. With the exception of health and education facilities, maintenance allocations for
buildings and government facilities are managed centrally by the General Services Agency
(GSA). The agency informed the mission that allocations in the budget for the maintenance of
roads and other forms of infrastructure investment are inadequate but did not provide any
evidence to substantiate this claim. The MPW reported that the majority of current road
maintenance costs are covered by externally-financed development projects.33 Different options
for providing funding for road maintenance requirements are under discussion, including
potentially the establishment of a Road Fund. However, no integrated fiscal framework
examining options for maintenance funding has yet been prepared.
41. The budget classification/chart of accounts currently applied is not fully consistent
with international standards34 and does not distinguish adequately between capital and
recurrent expenditure. In particular, the current CoA for the budget includes an “economic
classification” entitled “development projects.” Within the budget, all allocations for PSIP projects
are assigned to this single classification, even though in practice they include a mixture of capital
and recurrent spending. The execution reports distinguish between capital and recurrent
expenditure. Moreover, there is no standard GFSM-compliant economic classification that is
applied to externally-financed projects. 30 externally-financed projects now present financial
reports through the IFMIS showing capital expenditure correctly, but the coverage is partial and
is presented only at the budget execution stage.
42. As a consequence of the classification systems currently in place, it is not possible
to distinguish the capital investment component of development expenditure for domestic
or externally financed projects. The proportion of development spending dedicated to
recurrent costs is not currently known. The introduction of an international economic
classification system for all development projects at formulation and execution stage would
33 Confirmed by the donor agency representatives with whom the mission met.
34 IMF, Government Finance Statistics Manual (GFSM), 2014.

29
permit the government to analyze this question, and assist the process of taking decisions on the
allocation of resources that is appropriate to meet Liberia’s medium- and long-term
development needs.
I.9. Project appraisal (Institutional strength – Medium; Effectiveness – Medium)
43. Most capital projects are currently executed through donor funding, requiring
detailed project appraisals to be conducted by specialized external consultants according
to the rules, templates and procedures determined by the respective donors. A dedicated
PIU has been established in the MFDP but is currently not resourced to provide central guidance
to MDAs on the central appraisal, selection and monitoring of projects that are domestically
financed through the PSIP, and to provide quality assurance of MDAs’ work. Most of these
projects are relatively small and would not require an expensive and detailed project appraisal
process. Some M&As employ professionals in their establishment and undertake project
appraisal, proto-type drawings, detailed Bills of Quantity, and comprehensive budgeting of
projects. The current appraisal guideline should be strengthened to be used as a national
appraisal template, utilized by all M&As and in future appraisals could be published.
44. Project evaluations—including appraisals—are done by the PIU in accordance with
guidelines prepared by the MFDP, and circulated to all M&As. While this is a positive
development, the evaluation template lacks a number of critical elements, such as (i) the name of
the executing agency, (ii) the split in the estimated cost of the project among GoL funding and
loan or grant funding, (iii) the ranking assigned to the project, (iv) attachment of a formal
appraisal document if required, and (v) the name of the agency assigned for monitoring and
managing the project. The planning guidelines could be further enhanced to cover inception,
project planning, as well as project execution. It is vital that comprehensive support
documentation be prepared at the project appraisal stage to enable the evaluation team to fully
understand the project. Appendix I provides further guidance on the evaluation and appraisal
process. The PIU at the MFDP currently lack the ability to professionally scrutinize and appraise
work carried out by the M&As as there is no national guideline available on how to carry out
appraisals. There is also a lack of national guidelines for planning capital projects, an essential
requirement.
I.10. Project selection (Strength – Medium; Effectiveness – Low)
45. Virtually all major development projects are externally financed and these are not
subject to a standardized central review. The absence of a central review leads to a lack of
predictability and uniformity in resource planning. In most cases, these projects are appraised at
the line ministry level in conjunction with the funding agent but there is no systematic process
for comparing these projects at a central level to ensure that they are consistent with
government priorities, that they provide an adequate level of social and economic returns, and
that their recurrent costs can be financed by future GoL revenues. In the case of grant-financed
projects, a central-level review is undertaken by the AMU of MFDP but the procedures for such a
review are not standardized and it is not clear that all grant-financed projects are subject to

30
central review. In the case of loan-financed projects, a central review is carried out by the Debt
Management Committee, comprising the Ministers of Finance, Justice, and the State House, as
well as the Governor of the Central Bank. This review is subject to more precise, standardized
criteria but it comes at a late stage in the project cycle, when projects have already been
designed and appraised and are thus difficult to reject or modify.
46. There are project selection criteria specified in the "National Project System" for
the GoL-funded projects included in the PSIP. Although the PSIP represents only a small
proportion of projects, it could provide the basis for a more wide-ranging screening process. At
present, externally funded projects must in principle follow criteria of national priorities specified
in the AfT and in broad terms they appear to do so, but there is no formal, centralized process to
ensure these criteria are systematically applied.
47. There is no formal pipeline of approved investment projects, nor is the notion of a
pipeline effectively captured within existing project selection and management
procedures. A set of procedures has been established for the submission of projects for the
(GoL-financed) PSIP through SWGs, and for the screening of these projects by the PIU, using
criteria defined in the National Project System. However, these procedures do not incorporate a
clearly defined project cycle, beginning from the identification of a project, passing through
initial screening and approval, and proceeding through design and appraisal before then being
incorporated in future years’ budgets.
48. Largely as a consequence of the lack of a centrally-approved pipeline, the selection
of projects is a highly fragmented process, which is heavily donor-led. A formal project
pipeline would allow the GoL to ensure, at identification stage, that all projects conform to
national priorities and represent feasible, worthwhile investments before they might
subsequently be adopted by donors for design, appraisal and financing. It would also allow the
timing of project start dates to be planned in the light of the available financing and the
requirements for ongoing projects, thus ensuring timely completion of projects and systematic
consideration of recurrent cost implications.
D. Investment Implementation
I.11. Protection of investment (Strength – Medium; Effectiveness – Medium)
49. Capital investments are appropriated on an annual basis but multi-year projections
of project costs are presented in the national budget (see also Institution 6). Article 27 of
the Public Finance Management Act (PFMA) requires the annuality of the budget, subject to
limited carryover of unspent allocations (see below), and does not permit multiannual
appropriations.

31
50. During the execution of the budget, transfers from capital to current spending
(“virement”) require the approval of the MFDP.35 The Public Financial Management
Regulations (PFMRs) have no restriction on virement from capital to current spending.
51. Committed but unspent appropriations for capital spending can be carried over for
90 days after the end of the fiscal year (Article 27 of the PFMA). The financial regulations
require the minister’s authorization of such carryover based on a statement of undischarged
commitments submitted by spending agencies within 15 days of the end of a fiscal year.
52. The lack of a credible allocation to each project in the original budget weakens the
protection of public investment during budget execution. Within a fiscal year, appropriations
for PSIP projects are revised significantly through transfers (Figure 22), and budget execution
rates of GOL funded capital expenditure vary considerably across fiscal years (Figure 23, see also
Section I, Part A). The absence of a credible allocation to each project in the budget creates
uncertainty about the availability of funding.
I.12. Availability of funding (Strength – Low; Effectiveness – Low)
53. It is not possible for M&As to commit development expenditures until the receipt
of corresponding cash allotments, which are often released late. According to the PFM
Regulations, M&As are required to submit spending forecasts for the budget year and to update
these on a monthly basis. The 2016 Public Expenditure and Financial Accountability Assessment
(PEFA)36 reports that annual spending forecasts are generally submitted on a timely basis,
35 Public Financial Management Regulation E.8.
36 World Bank and AECOM, Liberia - Public Expenditure and Financial Accountability Assessment, March 2016.
Figure 22. Liberia: Scope of Revisions to
Public Sector Investment Projects in FY16
(Variation % from original to revised budgets)
Source: Staff estimates based on official data.
Figure 23. Liberia: Capital Expenditure
Performance, Relative to Budget
(Percent of original budgets)
Source: Staff estimates based on Fiscal Outturn reports
and National Budgets.
89 9
21
12
1
0
5
10
15
20
25
-100% <-50% <0% 0% <+50% <+100% >+100%
40
50
60
70
80
90
100
110
FY11 FY12 FY13 FY14 FY15
Revised budgetAllotmentOutturn
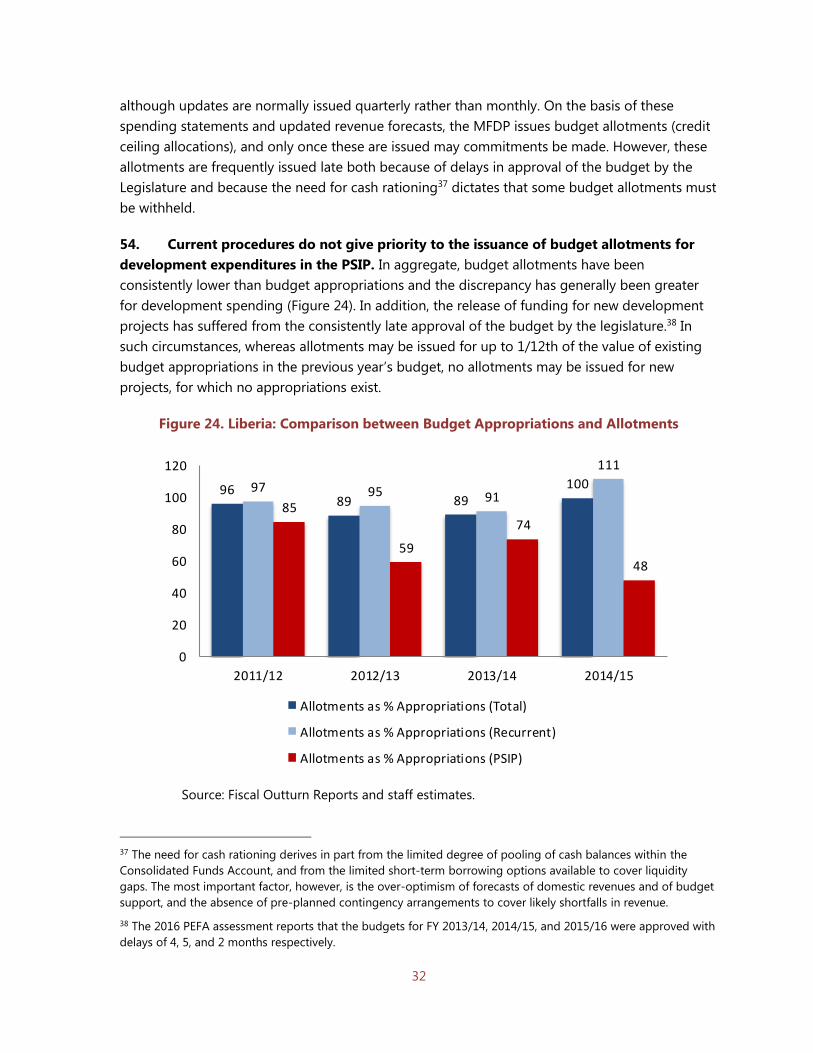
32
although updates are normally issued quarterly rather than monthly. On the basis of these
spending statements and updated revenue forecasts, the MFDP issues budget allotments (credit
ceiling allocations), and only once these are issued may commitments be made. However, these
allotments are frequently issued late both because of delays in approval of the budget by the
Legislature and because the need for cash rationing37 dictates that some budget allotments must
be withheld.
54. Current procedures do not give priority to the issuance of budget allotments for
development expenditures in the PSIP. In aggregate, budget allotments have been
consistently lower than budget appropriations and the discrepancy has generally been greater
for development spending (Figure 24). In addition, the release of funding for new development
projects has suffered from the consistently late approval of the budget by the legislature.38 In
such circumstances, whereas allotments may be issued for up to 1/12th of the value of existing
budget appropriations in the previous year’s budget, no allotments may be issued for new
projects, for which no appropriations exist.
Figure 24. Liberia: Comparison between Budget Appropriations and Allotments
Source: Fiscal Outturn Reports and staff estimates.
37 The need for cash rationing derives in part from the limited degree of pooling of cash balances within the
Consolidated Funds Account, and from the limited short-term borrowing options available to cover liquidity
gaps. The most important factor, however, is the over-optimism of forecasts of domestic revenues and of budget
support, and the absence of pre-planned contingency arrangements to cover likely shortfalls in revenue.
38 The 2016 PEFA assessment reports that the budgets for FY 2013/14, 2014/15, and 2015/16 were approved with
delays of 4, 5, and 2 months respectively.
9689 89
10097 95 91
111
85
59
74
48
0
20
40
60
80
100
120
2011/12 2012/13 2013/14 2014/15
Allotments as % Appropriations (Total)
Allotments as % Appropriations (Recurrent)
Allotments as % Appropriations (PSIP)

33
55. Similarly, donor agencies reported that delays in the release of counterpart funds
for development projects that are included in the budget were commonplace. In cases
where counterpart funds were pooled with donor funds in project accounts that finance the
same projects, donors were often willing to continue funding projects directly, in recognition of
the constraints facing the government’s budget. However, in cases where counterpart funds were
dedicated to specific project components, it was reported that their late release would frequently
impact negatively on the efficient execution of such projects, due to the interdependencies
between these components.
56. External financing for projects is largely held in commercial bank accounts, outside
of the government’s Consolidated Funds Account (CFA).39 Even project accounts, which are
held in Special Accounts of the CBL (as is the case for the African Development Bank and the
World Bank) do not have their balances “pooled” with the CFA, nor are they counted by the
central bank as part of the government’s net treasury position. This serves to restrict the level of
short-term budget (and therefore project) financing that might otherwise be available through
ways and means advances from the Central Bank.
I.13. Transparency of execution (Strength – Medium; Effectiveness – Low)
57. The PPCA provides a competitive legal framework for procurement but there is
limited public access to information. The act requires open, competitive bidding for all
procurement transactions above specified thresholds40 that are approved by the PPCC. The
majority of capital spending (94 percent) is implemented through competitive bidding including
national competitive bidding, international competitive bidding, or restrictive bidding (RB) where
there are fewer suppliers. Only about six percent of total spending is implemented by sole source
contracts.41 All sole source contracts require prior approval from the PPCC and can be justified
on several criteria––national emergencies, the extension of an existing contract (within a cost
variation of 20 percent of the original cost), and for national security reasons. The turnaround
time for approvals is one week. While most requests are cleared within the time frame, there are
notable examples of request from M&As that last more than two weeks, which is the mandatory
time period beyond which requests for clearance by M&As are considered automatically
approved.
58. The PPCC’s approved procurement plans capture all public expenditures including
PSIPs, except those funded by bilateral and multilateral donors. Most donor projects follow
their own procurement rules and are not captured by the PPCC database. The PPCC intend to
improve the efficiency of procurement systems so as to encourage donors to use country
39 GoL does not yet have a treasury single account (TSA).
40 These thresholds are $100,000 for service contracts; $200,000 for goods contracts; and $400,000 for works
contracts.
41 Based on discussions with PPCC.

34
systems. However, the Project Delivery Unit (PDU) at the presidency, monitors all priority
projects, including some donor funded projects, during implementation. Procurement plans of all
M&As, covering FY2015 have been published online, but no procurement monitoring reports
have been published since 2006, and information on contract awards is also not published.42
59. There is no established ex-post procurement audit system or legislative scrutiny of
completed capital projects, although special project audits are sometimes conducted by
the General Audit Commission (GAC). More systematic audits would help to ascertain the
value for money obtained from capital spending, and also check the accuracy of the justification
for sole sourcing. The PPCC is yet to build the capacity to conduct detailed verification checks of
the cost of projects, and their compliance with the specifications in the contract. In July 2015, the
GAC published a special audit report on procurement undertaken by the MPW.43 The report
identified several weaknesses in project management, commitment control, procurement
processes, project implementation and monitoring, amounting to a total of $92 million
(4.6 percent of GDP). The main procurement modality used was sole sourcing. The violations of
commitment controls resulted in a massive accumulation of arrears, representing 8.9 percent of
total expenditures in FY2014.44
I.14. Management of project implementation (Institutional strength – Improving;
Effectiveness – Medium)
60. Some M&As employ in-house technical staff for monitoring and managing
projects. Projects financed externally are managed by the donors, using their own rules and
procedures. Domestically-financed projects are mostly monitored by technical personnel from
the MPW as well as the PIU at the MFDP. Important indicators such as the quality and time-
management of PSIP projects, however, are not systematically monitored by the PIU. The MPW
applies internationally accepted project management principles. However, the failure to protect
capital spending (see Institution 11) as well as the fact that payments are based on milestones,
rather than certified monthly disbursements—limits the effectiveness of the monitoring
procedures.
61. There is a lack of guidelines on project adjustments that are consistently applied
across government. Adjustments are used for sole source procurement to extend the
appointment of suppliers/contractors to complete multi-year projects where spending runs
beyond the period authorized in the annual budget appropriations. A variation order is a tool
42 PPCC has finalized a framework for monitoring key performance indicators of capital projects starting from
FY2017.
43 The IMF report ((IMF Country Report No. 16/81 January 2016) is posted on www.imf.org. The issue arose from a
special audit carried out by GAC, published in July 2015 (“Audit Report on Special Procurement of the Ministry of
Public Works for Construction of Roads and Bridges throughout Liberia”, publicly available at
http://www.gac.gov.lr/auditDoc/MPW).
44 Draft Liberia PEFA 2016, (PI-4), page 49.

35
that could be employed to summarize the reasons for any changes in the contract, and to enable
the PPCC to determine if the variations fall within the terms of the agreement. The use of
variation orders reduces the need for sole source procurement in the case of multi-year projects.
Box 1 sets out information on project adjustment guidelines used in Kenya.
62. Payments on projects are currently disbursed on the basis of milestone payments
instead of the internationally preferred method of monthly payments based on a
certificate of completed works. The milestone method creates risks for the GoL, since
payments may be made for work not yet completed according to the specification set out in the
contract with the supplier, e.g., payments made for a roads contract where all elements required
are not completed. Evidence of these risks is clearly stated in the GAC reports noted above,
e.g., asphalt patching of potholes on several road projects. The payment certificates method is
preferred since it is based on measured quantities verified against the specifications and
tendered rates set out in the contract.
63. Construction supervision consultants are being appointed on contracts of up to
10 years by the MPW’s Infrastructure Implementation Unit. International good practice is for
such contracts to be issued for no longer than the duration of a project, or alternatively three
years, in order to mitigate any risk that the consultants might become involved in collusion.
Box 3. Project Adjustment Guidelines Utilized in Kenya
Kenya Highways Authority is utilizing effective project adjustment guidelines that are applicable for the
following changes in the terms of a contract:
Price adjustments as a result of changes in the scope of a project;
Extension of the time period of a project that results in an increase in its cost;
Additional services supplied by consultants for the supervision of a construction project as a result of the
extension of the contract period; and
Additional services provided by a materials laboratory as a result of the extension of the contract period.
The adjustments summarized above do not trigger another procurement process, but only a financial approval
process in order to confirm that the changes comply with the government’s procurement regulations, as well
as the relevant clauses of the contract.
Once the additional cost is approved by the National Treasury and the process verified by the Procurement
Authority, the addendum to the contract can be approved and implemented.
I.15. Accounting for public assets (Strength – Medium; Effectiveness – Low)
64. The management and maintenance of most of the government’s non-financial
assets is under the responsibility of the GSA, which undertakes systematic surveys some
non-financial assets. These surveys include valuation exercises and may also lead to recovery
actions (such as the premature termination of leases, where assets are seen to be mismanaged or
under-utilized), the organization of new leases, and other operations (such as asset sales).

36
However, the surveys do not cover the substantial non-financial assets of the health sector, as
well as the education sector.
65. The government’s financial statements do not provide any list of the government’s
physical assets, nor any estimates of the depreciation of such assets. Accounting rules on the
recording of assets and depreciation have not yet been developed. The existence of a centralized
inventory of fixed assets within the GSA, however, would provide a significant “head-start” for
any future efforts by the MFDP to begin to record assets, develop a government balance sheet,
and make provision for the depreciation of assets.
IV. REFORM PRIORITIES AND RECOMMENDATIONS
66. Based on the assessment provided in Section III, the following recommendations
should be given high priority by the MFDP during the period to December 31, 2017. The
recommendations are grouped under the three phases of the PIMA framework: namely, the
planning, allocation, and implementation of public investment projects, together with a fourth
category for improving the MFDP’s capacity to manage public investment.
A. Investment Planning Institutions
Issue 1: There is no framework for PIM or a central pipeline of projects to inform
budget priorities.
67. Recommendation 1: Prepare a framework paper on the PIM cycle, which takes a global
view of the planning and preparation of all development projects, using domestic, grant, and
loan finance, and gives priority to the development of a pipeline of approved sector projects.
a. Obtain Cabinet approval for further developing and implementing this approach.
b. Publish the pipeline of projects in the annual BFP for consultation with the legislature
(July 2017 – Department of Budget and Development Planning (DBDP)).
Issue 2: The legal framework for planning does not adequately address PPPs and SOEs.
68. Recommendation 2: Strengthen the legal framework for PIM:
a. Enact and implement the draft SOE Law as soon as practicable.
b. Issue the draft policy guidelines on PPPs as soon as practicable, and prepare and enact a
legal framework for PPPs based on these guidelines.
c. Make any additional amendments to the PFM Act 2009 that may be required to strengthen
PIM (July 2017 – SOE unit).

37
B. Investment Allocation Institutions
Issue 3: The PSIP presentation does not include externally financed projects and does
not present a clear classification of planned expenditures.
69. Recommendation 3: Improve the presentation of development projects in the annual
budget documents, to includes all projects, showing the allocation by M&As, types of project,
sources of funding, and the breakdown between capital and recurrent spending on a multi-year
basis, for both existing and new projects.
a. Amend the chart of accounts to define capital and recurrent spending in line with
international standards (GFSM2014) in order to improve resource allocation through the
budget, and assist in quantifying the capital stock (July 2017 – CAG).
b. Include estimates of planned spending on externally financed projects within the annual
budget and the three-year PSIP (July 2018 – DMDP).
Issue 4: Existing PSIP projects are not prioritized in budget allotments which leads to
inefficient spending on projects which are already underway.
70. Recommendation 4: In issuing allotments for budget execution, establish and enforce
rules for prioritizing PSIP projects, and the payment of counterpart funds, to facilitate smoother
and more predictable execution of externally-financed projects (July 2017 – CAG).
C. Investment Implementation Institutions
Issue 5: There is no integrated database of PSIP and off-budget public investment to
determine overall capital investment.
71. Recommendation 5: In consultation with the International Financial Institutions (IFI) and
donors, establish one comprehensive database of both externally- and domestically-financed
projects that will support the GoL in analyzing and monitoring these projects (December 2016 –
IFMIS and AMU).
a. Consider using data on government assets that are already collected by the GSA to develop a
comprehensive register of the government’s fixed assets, and estimates of their depreciation.
b. Develop and implement a plan for improving the exchange of information on the
implementation of both domestically- and externally-financed projects between M&As and
the MFDP.

38
D. Improving Capacity for Managing Public Investment Management
Issue 6: The roles and responsibilities for PIM in MFDP are not well coordinated and
defined and project monitoring is inadequate.
72. Recommendation 6: Review the organizational structure of the MFDP to ensure that it
has an appropriate allocation of roles and functions, adequate communications, and sufficient
resources to provide effective management of public investment.
a. Assign to the Assistant Minister for Development Planning the task of coordinating all
activities and exchanges of information within the MFDP––including the Budget and Planning
Divisions, CAG, AMU, DMU, PIU, and the M&E Unit––on issues relating to PIM (July 2017).
b. Increase the resources available to the PIU (including vehicles for staff to make site visits, and
access to MS Project software) to establish guidelines, templates, and reporting procedures
for the appraisal and evaluation of projects by MDAs (December 2016).
c. Improve monitoring of ongoing projects and publish regular report on project execution
(January 2017 – PIU).
d. Increase the resources available to the MFDP’s SOE Unit to provide effective financial
oversight of SOEs (July 2017).
e. Establish a Unit in the MFDP to provide effective financial oversight of PPPs (July 2018).
Issue 7: Information sharing on PIM within MFDP is sub-optimal and needs to be
coordinated
73. Recommendation 7: Prepare an inventory of all documents and reports relating to the
preparation, appraisal, evaluation, and execution of public investment projects (including grant
and loan proposals, contracts, and concession agreements) that are submitted to the MFDP or
internally generated by its divisions and units.
a. Undertake an analysis of the users of these documents and how efficiently the information is
currently exchanged between the Minister’s Office and the divisions and units of the MFDP
(January 2017).
b. Prepare recommendations for improving the exchange of information to ensure that all
divisions and units with a “need to know” have access to all relevant information, and that
the work of these divisions and units is well coordinated (June 2017).
c. Develop guidelines for publishing reports and other documents on PIM on the MFDP’s
external website (January 2017).
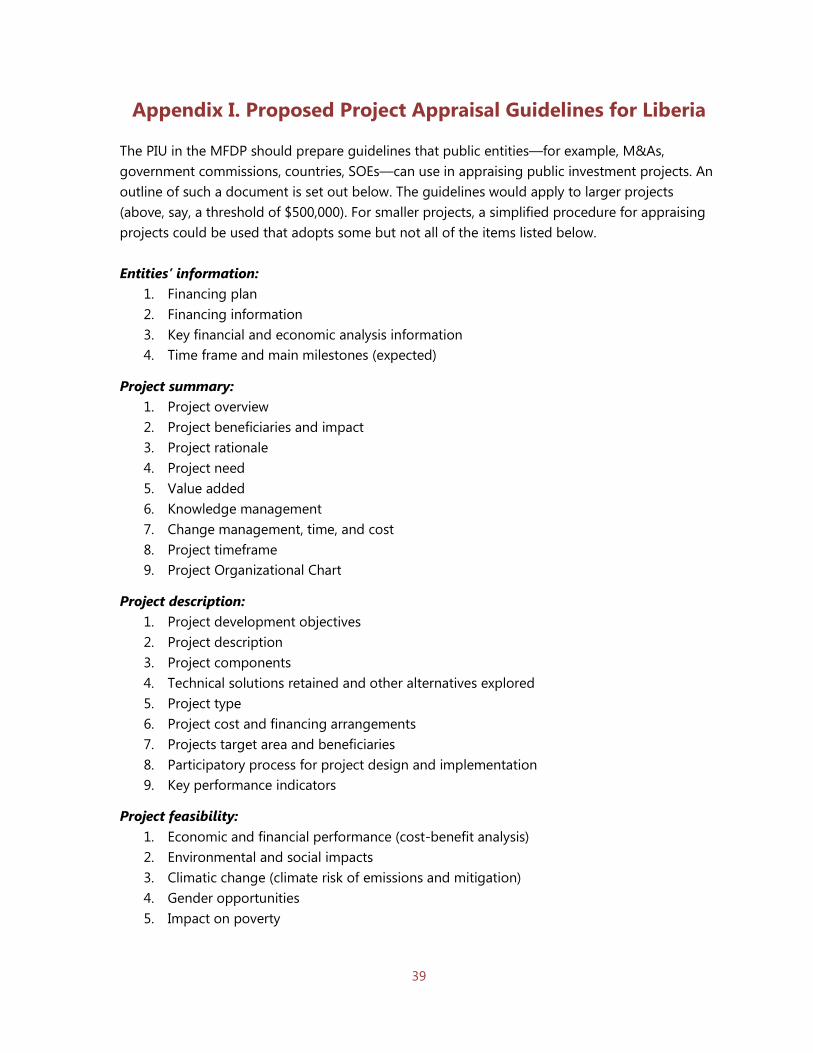
39
Appendix I. Proposed Project Appraisal Guidelines for Liberia
The PIU in the MFDP should prepare guidelines that public entities––for example, M&As,
government commissions, countries, SOEs––can use in appraising public investment projects. An
outline of such a document is set out below. The guidelines would apply to larger projects
(above, say, a threshold of $500,000). For smaller projects, a simplified procedure for appraising
projects could be used that adopts some but not all of the items listed below.
Entities’ information:
1. Financing plan
2. Financing information
3. Key financial and economic analysis information
4. Time frame and main milestones (expected)
Project summary:
1. Project overview
2. Project beneficiaries and impact
3. Project rationale
4. Project need
5. Value added
6. Knowledge management
7. Change management, time, and cost
8. Project timeframe
9. Project Organizational Chart
Project description:
1. Project development objectives
2. Project description
3. Project components
4. Technical solutions retained and other alternatives explored
5. Project type
6. Project cost and financing arrangements
7. Projects target area and beneficiaries
8. Participatory process for project design and implementation
9. Key performance indicators
Project feasibility:
1. Economic and financial performance (cost-benefit analysis)
2. Environmental and social impacts
3. Climatic change (climate risk of emissions and mitigation)
4. Gender opportunities
5. Impact on poverty

40
6. Response to communicable diseases (HIV/AIDS testing and awareness campaigns during
construction)
7. Road safety and safe road use
8. Post trauma and injury care
9. Foot bridges, walkways, and access roads
10. Upgrading of feeder roads
11. Involuntary settlement
Implementation:
1. Executing agency
2. Procurement strategy
3. Financial management and disbursement arrangements
4. Monitoring
5. Governance (tender committees and anti-corruption policies, procurement law,
transparent procurement processes)
6. Sustainability
7. Risk management
8. Knowledge building
Legal instruments and authority:
1. Legal instruments (Loan agreements, guarantees, grant agreements, etc.)
2. Undertakings
3. Compliance with lender policies
Recommendations

Minister
Deputy Minister Dept. of Fiscal Affairs
James Kollie
Comptroller & Accountant General (CAG)
Sekou Sannoh
Assistant MinisterExpenditure Division
Alieu Nyei
DirectorFinancial Approvals
DirectorGovt. Accounting
DirectorRemuneration &
Expenditure Monitoring
Assistant MinisterRev. & Tax Policy Division
Juah Feika
DirectorDirect Taxes
DirectorNon-Direct Taxes
DirectorNon-Tax Revenue
DirectorRevenue Coordination
Deputy Minister Dept. of Economic Management
Mounir Siaplay
Assistant MinisterEconomic Policy, Macro & Fin.
Sector Division
Gweh Tarwo (ACT.)
DirectorEconomic Policy
DirectorMacroeconomic & Fin. Sector
Assistant MinisterExternal Resources & Debt
Management Division
Alvin Attah
DirectorBilateral Aid Coordination
DirectorMultilateral Aid
DirectorDebt Management
Deputy Minister Dept. of Budget & Development Planning
Tanneh Brunson
Assistant MinisterBudget Division
Augustine Blamah
DirectorSoc. & Economic Service
Sectors
DirectorPublic Admin. Service Sectors
DirectorBudget Receipts
DirectorBudget Coordination
Assistant MinisterPlan Coordination, Reg. &
Sect. Planning Division
ACTING HEAD
DirectorPlan Coordination
DirectorRegional & Sectorial Planning
DirectorPublic Investment
Management
DirectorMonitoring & Evaluation
Deputy Minister Dept. of Administration
Edward Eesiah
Assistant MinisterAdministration Division
Romel Watson
DirectorFinance
DirectorAdministration
DirectorCommunication &
External Affairs
Internal Audit
IFMIS
PFMLiberia Macroeconomic Policy Analysis Capacity Building Project (LIMPAC)
41
Ap
pen
dix
II. Org
an
izatio
nal C
hart o
f Min
istry o
f Fin
an
ce a
nd
Develo
pm
en
t Pla
nn
ing
HEADS
Departments – Deputy Ministers
Divisions – Assistant Ministers
Units – Directors
Sections – Supervisors
Note: Role players in public investment management are indicated
in green.

Fiscal Affairs Department
International Monetary Fund700 19th Street NWWashington, DC 20431USAhttp://www.imf.org/capacitydevelopment