Embed Size (px)
Citation preview
Technical Data Report
MARINE SHIPPING QUANTITATIVE RISK ANALYSIS
ENBRIDGE NORTHERN GATEWAY PROJECT
Det Norske Veritas Oslo, Norway
Audun Brandsæter, Principal Consultant Peter Hoffmann, Senior Consultant
2010

MARINE SHIPPING QUANTITATIVE RISK ANALYSIS Technical Data Report Table of Contents
2010 DRAFT Page i
Table of Contents
Table of Contents ............................................................................................................ i List of Tables ................................................................................................................ iv List of Figures .............................................................................................................. vii Executive Summary .................................................................................................... 1-1 1 Introduction ...................................................................................................... 1-4
1.1 Objective ............................................................................................................. 1-4 1.2 Abbreviations ...................................................................................................... 1-6
2 Methodology ..................................................................................................... 2-7 2.1 Northern Gateway Pipelines Marine QRA Methodology ..................................... 2-7 2.2 Application of Methodology ................................................................................ 2-8
3 System Definition ........................................................................................... 3-10 3.1 Route Description ............................................................................................. 3-10
3.1.1 Description of Segments Common to all Routes (Segments 1 and 2) ........ 3-14 3.1.2 North Route Segments (Segment 3 to Segment 5) ..................................... 3-18 3.1.3 South Route Segments (Segments 6 to 9) .................................................. 3-23 3.1.4 Area Seaward of Queen Charlotte Islands and Vancouver Island .............. 3-26 3.1.5 Alternative Routes ....................................................................................... 3-27
3.2 Tanker Specifications ....................................................................................... 3-30 3.2.1 Hull and Cargo Tank Components .............................................................. 3-30 3.2.2 Navigational Equipment ............................................................................... 3-31 3.2.3 Fire Prevention and Fire Fighting ................................................................ 3-31
3.3 Kitimat Terminal ................................................................................................ 3-32 3.3.1 Marine Terminal Berthing Procedures ......................................................... 3-33 3.3.2 Terminal Cargo Transfer Equipment ........................................................... 3-34 3.3.3 Marine Terminal Safety and Monitoring Equipment .................................... 3-35
3.4 Weather Description ......................................................................................... 3-36 3.4.1 Waves, Wind and Current............................................................................ 3-36 3.4.2 Currents ....................................................................................................... 3-38
4 Hazard Identification ....................................................................................... 4-40 4.1 HAZID Workshop .............................................................................................. 4-40
4.1.1 Methodology ................................................................................................ 4-40 4.2 Hazard Evaluation of Routes by Navigational Expert ....................................... 4-44
4.2.1 Collision Hazard .......................................................................................... 4-45 4.2.2 Grounding Hazard ....................................................................................... 4-45
4.3 Local Meetings and Interviews ......................................................................... 4-46 4.4 Conclusion ........................................................................................................ 4-47
5 Frequency Assessment .................................................................................. 5-49 5.1 Incidents during Transit to and from the Kitimat Terminal ................................ 5-49
5.1.1 Vessel Incident Frequency Data .................................................................. 5-49 5.1.2 Assumptions on Sailing Time Relevant to Incidents ................................... 5-50 5.1.3 Scaling Factors ............................................................................................ 5-51
MARINE SHIPPING QUANTITATIVE RISK ANALYSIS Technical Data Report Table of Contents
Page ii DRAFT 2010
5.1.4 Grounding .................................................................................................... 5-54 5.1.5 Collision ....................................................................................................... 5-61 5.1.6 Foundering ................................................................................................... 5-66 5.1.7 Scaled Fire and / or Explosion Frequency per Segment ............................. 5-69 5.1.8 Scaled Incident Frequencies for Each Route Segment ............................... 5-69
5.2 Incidents during Berthing and Cargo Transfer Operations ............................... 5-71 5.2.1 Impact by Harbour Tug ................................................................................ 5-71 5.2.2 Tanker Striking Pier during Berthing ............................................................ 5-72 5.2.3 Impact by Passing Vessels .......................................................................... 5-72 5.2.4 Cargo Transfer Operations .......................................................................... 5-74
6 Consequence Assessment ............................................................................ 6-76 6.1 Conditional Spill Probabilities ........................................................................... 6-76 6.2 Tanker Capacities ............................................................................................ 6-76 6.3 Conditional Probability of a Spill from Incidents Occurring during Transit to
and from the Marine Terminal .......................................................................... 6-77 6.3.1 Grounding .................................................................................................... 6-78 6.3.2 Collisions ..................................................................................................... 6-82 6.3.3 Foundering ................................................................................................... 6-87 6.3.4 Fire and Explosions ..................................................................................... 6-87 6.3.5 Unmitigated Spill Frequencies per Segment ............................................... 6-88
6.4 Conditional Probability of a Spill from Incidents Occurring during Berthing and Cargo Transfer Operations ........................................................................ 6-90 6.4.1 Tanker Striking Pier during Berthing ............................................................ 6-90 6.4.2 Impact by a Passing Vessel ......................................................................... 6-91 6.4.3 Cargo Transfer Operations .......................................................................... 6-91
7 Unmitigated Risk Evaluation .......................................................................... 7-93 7.1 Definition of Incident and Spill Return Periods ................................................. 7-93 7.2 Relative Comparison of Unmitigated Incident and Spill Return Periods for
Tanker Transits to and from the Kitimat Terminal ............................................ 7-94 7.3 Relative Comparison of the Effect of the use of Alternative Routes on
Unmitigated Spill Return Periods ..................................................................... 7-97 7.3.1 Whale Channel ............................................................................................ 7-97 7.3.2 Cridge Passage ........................................................................................... 7-98 7.3.3 Estevan Sound ............................................................................................ 7-98 7.3.4 Conclusions on the Use of Alternate Routes ............................................... 7-98
7.4 Sensitivity Analyses .......................................................................................... 7-99 7.4.1 Increased Scaling Factors for Grounding .................................................... 7-99 7.4.2 Increased Traffic ........................................................................................ 7-100 7.4.3 Increase or Decrease in the Number of Tankers Calling at the Kitimat
Terminal ..................................................................................................... 7-101 7.4.4 Extending Routes Seaward of the Queen Charlotte Islands and
Vancouver Island ....................................................................................... 7-102 7.4.5 Conclusion from the Sensitivity Analysis ................................................... 7-104
7.5 Unmitigated Incident and Spill Return Periods for Tanker Transits to and From the Kitimat Terminal .............................................................................. 7-104

MARINE SHIPPING QUANTITATIVE RISK ANALYSIS Technical Data Report Table of Contents
2010 DRAFT Page iii
7.6 Unmitigated Spill Return Periods for Berthing and Cargo Transfer Operations ...................................................................................................... 7-111 7.6.1 Tanker Striking Pier during Berthing .......................................................... 7-111 7.6.2 Impact by Passing Vessel ......................................................................... 7-112 7.6.3 Release during Loading / Discharge ......................................................... 7-112
7.7 Increased Risk Areas (IRA’s) .......................................................................... 7-113 7.7.1 Step 1 – Selection of Increased Risk Segments ........................................ 7-114 7.7.2 Step 2 to 4 – Assessment of IRAs .............................................................. 7-114
7.8 Conclusion ...................................................................................................... 7-116 8 Mitigated Risk Evaluation ............................................................................. 8-118
8.1 Standard Tug Escort Manoeuvres .................................................................. 8-118 8.2 The Northern Gateway Tug Escort Plan ......................................................... 8-119
8.2.1 Operational Requirements ......................................................................... 8-120 8.3 The Lower Risk of Oil Spill using Tug Escort .................................................. 8-121 8.4 Other Risk Mitigation Measures ........................................................................ 129
8.4.1 Improvements to Navigational Aids ............................................................... 129 8.4.2 Electronic Chart Display and Information System (ECDIS) ........................... 130 8.4.3 Improvements to Vessel Traffic Service (VTS) .............................................. 130 8.4.4 Traffic Separation .......................................................................................... 131 8.4.5 Closed Loading (with Vapour Return System) .............................................. 131 8.4.6 Other Measures ............................................................................................. 133
8.5 Recent and Future Changes to Tanker Regulations ......................................... 133 8.6 Conclusion ......................................................................................................... 135
9 References ...................................................................................................... 138
MARINE SHIPPING QUANTITATIVE RISK ANALYSIS Technical Data Report Table of Contents
Page iv DRAFT 2010
List of Tables
Table 3-1 Route distances and approximate sailing times .................................... 3-12 Table 3-2 Frequency of vessels passing Wright Sound (Source TERMPOL
3.2) ........................................................................................................ 3-17 Table 3-3 Number of vessels passing through Douglas Channel (Source:
TERMPOL 3.2) ...................................................................................... 3-17 Table 3-4 Average number of vessels in Outside Passage (Source:
TERMPOL 3.2) ...................................................................................... 3-22 Table 3-5 Traffic reported passing Duckers Island (Source TERMPOL 3.2) ......... 3-25 Table 3-6 Description of Average wave, wind, gust and surface conditions
(Source: Northern Gateway 2009) ......................................................... 3-37 Table 3-7 Visibility North Route (Source: ASL 2010) ............................................. 3-39 Table 4-1 Scale used for frequency assessment ................................................... 4-42 Table 4-2 Scale used for consequence assessment ............................................. 4-42 Table 5-1 Base tanker incident frequencies per ship year (LRFP 2007) ............... 5-50 Table 5-2 Base worldwide tanker incident frequencies per nautical mile .............. 5-51 Table 5-3 Scaling factors for incidents considered along the marine tanker
routes .................................................................................................... 5-53 Table 5-4 Assessment of scaling factor: Knavigational route .......................................... 5-55 Table 5-5 Assessment of scaling factor: Kmeasures, for powered grounding ............ 5-55 Table 5-6 Assessment of scaling factor: Knavigational difficulty ...................................... 5-56 Table 5-7 Unmitigated, scaled powered grounding incident frequency per nm
for each route segment ......................................................................... 5-57 Table 5-8 Assessment of scaling factor: Kdistance to shore .......................................... 5-58 Table 5-9 Assessment of scaling factor: Kem-anchoring .............................................. 5-59 Table 5-10 Unmitigated, scaled drift grounding incident frequency per nm for
each route segment ............................................................................... 5-60 Table 5-11 Assessment of scaling factor: Ktraffic density .............................................. 5-62 Table 5-12 Assessment of scaling factor: Kmeasures, for collision .............................. 5-63 Table 5-13 Assessment of scaling factor: Knavigational difficulty ...................................... 5-64 Table 5-14 Unmitigated, scaled collision incident frequency per nm for each
route segment ....................................................................................... 5-65 Table 5-15 Assessment of scaling factor: K weather conditions ........................................ 5-66 Table 5-16 Scaled foundering incident frequency per nm for each route
segment ................................................................................................ 5-68 Table 5-17 Total unmitigated and scaled incident frequency per Nautical mile
for each incident type for each route segment ....................................... 5-70 Table 5-18 Striking probabilities (Source: DNV study, 2006) .................................. 5-73 Table 5-19 Probability of cargo release per loading/discharge operation
(Source: DNV 2000) .............................................................................. 5-75
MARINE SHIPPING QUANTITATIVE RISK ANALYSIS Technical Data Report Table of Contents
2010 DRAFT Page v
Table 6-1 Cargo and bunker fuel capacity (Source: RFP 2009) ........................... 6-77 Table 6-2 LRFP damage frequency distribution and DNV estimate of the
conditional probability of a release of cargo or bunker fuel from grounding incidents .............................................................................. 6-79
Table 6-3 Estimated outflow volumes from grounding incidents. .......................... 6-80 Table 6-4 Estimated probability of zero outflow in case of grounding ................... 6-80 Table 6-5 LRFP damage frequency distribution and DNV estimates of the
conditional probability of a release of cargo or bunker fuel from collision incidents ................................................................................. 6-83
Table 6-6 Probability of zero outflow in case of collisions and outflow volumes ... 6-84 Table 6-7 Probability of zero outflow in case of collisions and outflow volumes ... 6-84 Table 6-8 LRFP damage frequency distribution and DNV estimates of the
conditional probability of a release of cargo or bunker fuel from foundering incidents ............................................................................. 6-87
Table 6-9 LRFP damage frequency distribution and DNV estimates of the conditional probability of a release of cargo or bunker fuel from fire and / or explosion ................................................................................. 6-88
Table 6-10 Unmitigated probability per nautical mile transited by laden tankers of an incident resulting in a release of cargo (including oil, condensate or bunker) .......................................................................... 6-89
Table 6-11 Unmitigated probability per nautical mile transited by tankers in ballast of an incident resulting in a release of cargo (including oil, condensate or bunker) .......................................................................... 6-89
Table 6-12 DNV estimates of damage frequency and conditional probability of a release of cargo or bunker fuel from a tanker striking the pier during berthing ..................................................................................... 6-90
Table 6-13 DNV estimates of damage frequency and conditional probability of a release of cargo or bunker fuel from an impact by a passing vessel ................................................................................................... 6-91
Table 6-14 Distribution of spills from loading/discharge incidents (Source: DNV 2000) .................................................................................................... 6-92
Table 6-15 Typical release volumes for spills caused by major loading failure (Source: DNV 2006) ............................................................................. 6-92
Table 7-1 Relative comparison of the unmitigated return periods for the three standard routes and the alternative route choices ................................ 7-99
Table 7-2 Effect on relative unmitigated spill return periods per route by increasing the total drift and powered grounding (K) scaling factors for grounding by 20% .......................................................................... 7-100
Table 7-3 Increase in factors affecting traffic density .......................................... 7-100 Table 7-4 Effect of increased traffic density on the relative comparison of
unmitigated return periods for oil spills ............................................... 7-101
MARINE SHIPPING QUANTITATIVE RISK ANALYSIS Technical Data Report Table of Contents
Page vi DRAFT 2010
Table 7-5 Relative comparison of the spill return periods for a 200nm segment at the ends of Segments 5 and 8, or seaward of the Queen Charlotte Islands & Vancouver Island ................................................. 7-103
Table 7-6 Forecast annual ship traffic to the Kitimat Terminal (Source: RFP 2009) ................................................................................................... 7-104
Table 7-7 Assumed distribution of ship traffic to and from the Kitimat Terminal .. 7-105 Table 7-8 Unmitigated annual probability per route segment of an incident
resulting in a spill (based on average forecast traffic) ......................... 7-106 Table 7-9 Estimated spill volume and unmitigated distribution ............................ 7-110 Table 7-10 Frequency of tanker striking the pier during berthing and spill return
periods ................................................................................................ 7-112 Table 7-11 Probability and return periods for spills from loading/discharge
incidents .............................................................................................. 7-113 Table 8-1 Risk reducing effect of using escort tugs/tethered tugs ....................... 8-120 Table 8-2 Mitigated probability per route segment of an incident resulting in a
release of cargo (including oil, condensate or bunker) based on average forecast traffic ........................................................................ 8-122
Table 8-3 Oil spill return periods for forecasted route choices with different use of tugs .............................................................................................. 125
Table 8-4 Probability and return periods for spills from loading/discharge with risk mitigation measures applicable to closed loading systems .............. 132
Table 8-5 Recent and imminent International regulations ...................................... 134 Table 8-6 Risk reducing effect of other risk reduction measures ............................ 135 Table 8-7 Summary of Mitigated and Unmitigated Return Periods for Spills at
the Marine Terminal ............................................................................... 136 Table 8-8 Summary of Mitigated and Unmitigated Return Periods for Spills
occurring during tanker operation along the preferred marine routes ..... 137
MARINE SHIPPING QUANTITATIVE RISK ANALYSIS Technical Data Report Table of Contents
2010 DRAFT Page vii
List of Figures
Figure 2-1 Steps performed in the QRA ................................................................... 2-8 Figure 3-1 Three marine transportation routes and ten segments referred to in
QRA ...................................................................................................... 3-11 Figure 3-2 Confined Channel Assessment Area (CCAA) ....................................... 3-13 Figure 3-3 Segment 1 from Kitimat Terminal to Wright Sound via Douglas
Channel ................................................................................................ 3-14 Figure 3-4 Common Segment 2, and South Route (via Caamano Sound)
Segment 6 ............................................................................................ 3-16 Figure 3-5 North Route Segments 5, 4b, 4a and 3 and South Route Segment
9. .......................................................................................................... 3-18 Figure 3-6 North Route and South Route (via Browning Entrance) Segment 3
from Squally Channel to Browning Entrance via Principe Channel and Otter Passage. ............................................................................... 3-19
Figure 3-7 Segments 4a and 4b ............................................................................ 3-20 Figure 3-8 Segment 5 Dixon Entrance ................................................................... 3-21 Figure 3-9 South Route (via Caamano Sound) Segments 6, 7 and 8 and South
Route (via Browning Entrance) Segment 9. .......................................... 3-23 Figure 3-10 South Route via Caamano Sound Segment 6 (Squally Channel to
Caamano Sound) and Segment 7 (through Caamano Sound) ............. 3-24 Figure 3-11 Shipping routes seaward of the Queen Charlotte Islands
(TERMPOL 3.2) .................................................................................... 3-26 Figure 3-12 Tanker Exclusion Zone (Canadian Coast Guard 2010, Internet site) .... 3-27 Figure 3-13 Alternative route from Campania Sound to Wright Sound via Whale
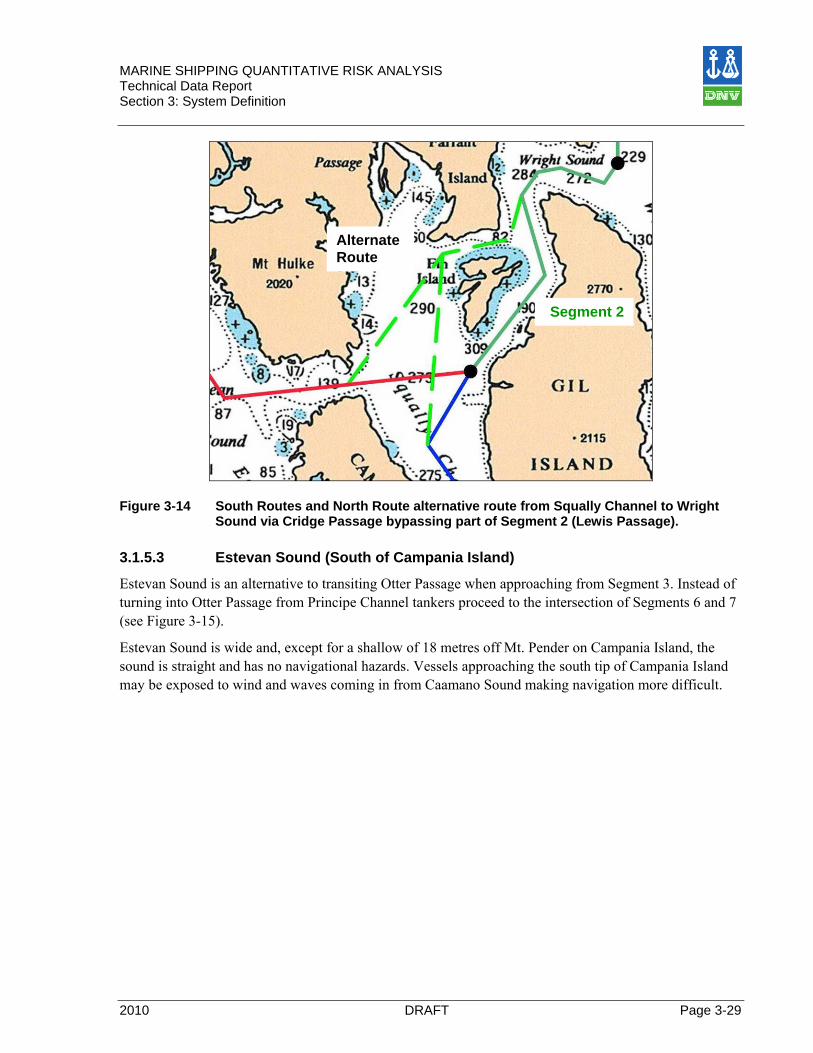
Channel, bypassing part of Segment 6 and Segment 2 ........................ 3-28 Figure 3-14 South Routes and North Route alternative route from Squally
Channel to Wright Sound via Cridge Passage bypassing part of Segment 2 (Lewis Passage). ................................................................ 3-29
Figure 3-15 Alternative route from Caamano Sound to Otter Channel via Estevan Sound bypassing Segment 6. ................................................. 3-30
Figure 3-16 Proposed location of the Kitimat Terminal (RFP 2009) ......................... 3-32 Figure 3-17 Proposed layout of one of the two berths at the Kitimat Terminal
(TERMPOL 3.10)) ................................................................................. 3-33 Figure 3-18 Proposed Turning Basins, Navigational Clearances and Vessel
Manoeuvres (TERMPOL 3.10) ............................................................. 3-34 Figure 3-19 Marine loading arms in operation (TERMPOL 3.11) ............................. 3-35 Figure 4-1 Causes for collision as identified in HAZID ........................................... 4-41 Figure 4-2 Causes for powered grounding identified in HAZID .............................. 4-42 Figure 4-3 Causes for drift grounding as identified in HAZID ................................. 4-42
MARINE SHIPPING QUANTITATIVE RISK ANALYSIS Technical Data Report Table of Contents
Page viii DRAFT 2010
Figure 4-4 Risk ranking per segment based on HAZID findings (number of causes categorized as low, medium or high risk respectively) .............. 4-43
Figure 4-5 Route sailed 27th April 2009 .................................................................. 4-45 Figure 5-1 Number of transits over global shipping routes in one year mapped
with GPS ............................................................................................... 5-62 Figure 5-2 Vessel struck at jetty ............................................................................. 5-73 Figure 6-1 Conditional probability of spill exceeding a certain volume given a
grounding incident ................................................................................. 6-81 Figure 6-2 Relative comparison of the frequency of spills from grounding
exceeding a certain volume assuming all vessel classes transport the same volume of cargo. .................................................................... 6-82
Figure 6-3 Conditional probability of spill exceeding a certain volume given a collision incident .................................................................................... 6-85
Figure 6-4 Relative comparison of the frequency of spills from collisions exceeding a certain volume assuming all vessel classes transport the same volume of cargo. .................................................................... 6-86
Figure 7-1 Relative comparison of the unmitigated incident return period for each route ............................................................................................. 7-95
Figure 7-2 Relative comparison of the unmitigated spill return period for each route segment ....................................................................................... 7-96
Figure 7-3 Relative comparison of the unmitigated spill return period for each route ...................................................................................................... 7-97
Figure 7-4 Relative comparison of the effect of increasing or decreasing the number of tankers forecast to call at the Kitimat Terminal on the unmitigated spill return period for each route ...................................... 7-102
Figure 7-5 Overall incident return period per route using forecast traffic .............. 7-107 Figure 7-6 Unmitigated total (oil and condensate) spill return periods per route
segment using forecast traffic per route .............................................. 7-108 Figure 7-7 Unmitigated spill return period for each route ...................................... 7-109 Figure 7-8 Annual probability of a spill exceeding a given volume ....................... 7-110 Figure 7-9 Unmitigated return periods for total loss incidents per route
segment (based on forecast traffic per segment) ................................ 7-111 Figure 7-10 Increased risk area 4b ......................................................................... 7-115 Figure 7-11 Increased risk areas T, 1, 2, 6, 7, and 3 .............................................. 7-116 Figure 8-1 Effect of the use of escort tug on oil spill risk for applicable
segments ................................................................................................ 124 Figure 8-2 Unmitigated and mitigated spill return periods for each route................. 126 Figure 8-3 Accumulated frequency of spills exceeding a certain size;
Unmitigated / Mitigated .......................................................................... 127 Figure 8-4 Mitigated spill return frequencies per segment for tankers
transporting Crude Oil and Condensate respectively ............................. 128
MARINE SHIPPING QUANTITATIVE RISK ANALYSIS Technical Data Report Table of Contents
2010 DRAFT Page ix
Figure 8-5 Unmitigated and mitigated return periods for total loss incidents per route segment (based on forecast traffic per segment) .......................... 129
Figure 8-6 Comparison of unmitigated and mitigated spill return periods for releases during cargo transfer at the marine terminal ............................. 132

MARINE SHIPPING QUANTITATIVE RISK ANALYSIS Technical Data Report Section 0: Executive Summary
2010 DRAFT Page 1-1
Executive Summary This report describes the marine Quantitative Risk Analysis (QRA) completed as part of the TERMPOL review process for the Enbridge Northern Gateway Pipelines Project (the Project). The QRA fulfils a number of the requirements described in Section 3.15 of TERMPOL 2001 (TP743E).
The QRA estimates risks associated with the marine transportation of oil and condensate in tankers travelling via established marine routes to and from open ocean and the Kitimat Terminal. The QRA also calculates the risk of incidents occurring during loading and discharge operations at the marine terminal. Important outcomes of the QRA are that:
1. Portions of the routes in the Confined Channel Assessment Area, or CCAA, have the highest risk of an incident occurring during marine transportation compared to portions of the routes in the open waters of Queen Charlotte Sound, Dixon Entrance and Hecate Straight.
2. The greatest unmitigated hazard to marine traffic transiting to and from Kitimat Terminal is drift
or powered grounding. This hazard is relatively greater for this Project due to the longer transit distances along narrow channels.
3. While grounding is the greatest hazard to marine tanker transport, it is also the hazard most effectively mitigated by the use of escort tugs. It is predicted that the use of an appropriately placed and sized escort tug fleet can more than triple the return period of an oil spill along the tanker routes.
4. The greatest unmitigated hazard to terminal loading operations is tank overfilling. This hazard
can be virtually eliminated with the use of a closed loading system in conjunction with a vapour recovery unit that can capture and redirect any oil overflow from the cargo tanks.
5. Overall risk levels are in line with that of other comparable terminals located on the west coast of
Norway. Relative to terminals in Norway, the distance sailed in confined waters to reach the marine terminal is longer (by a factor of 4 to 6), but forecast traffic to Kitimat Terminal is lower (by a factor of 5 to 10).
6. Without mitigation measures in place the Project is expected have close to world average incident and spill frequencies. The incident frequency is predicted to be 0.94 the world average and the spill frequency is predicted to be 1.06 the world average.
7. With mitigation measures in place the frequency of incidents and spills is expected to be about one third the world average.
8. The mitigated return period of a small spill at the marine terminal is 77 year and the mitigated return period of a medium spill is 290 years.
9. The mitigated return period of a spill (oil, condensate and / or bunker fuel) resulting from an incident during marine tanker transport is 250 years. The mitigated return period of an oil spill is 350 years and the mitigated return period for a condensate spill is 890 years.
MARINE SHIPPING QUANTITATIVE RISK ANALYSIS Technical Data Report Section 0: Executive Summary
Page 1-2 DRAFT 2010
10. The mitigated return period of spills resulting from an incident during marine tanker transport
exceeding 5,000 m3, 20,000 m3, and 40,000 m3 is approximately 550, 2,800 and 15,000 years respectively.
11. Only vessels with longitudinal cargo tank bulkheads will be accepted at the Kitimat Terminal. Longitudinal bulkheads reduce the cargo volume per tank and the potential volume of cargo that may be spilled if a cargo tank is penetrated.
Hazards identified in the QRA comprise known causes of worldwide marine tanker and terminal incidents as well as local factors, unique to the British Columbia and the Kitimat. Local knowledge of potential hazards was incorporated through a HAZID workshop with British Columbia Coast Pilots, local interviews, and 2 tours of sections of the proposed marine routes and the marine terminal site. TERMPOL 3.8 concluded that statistically valid incident frequencies could not be established based on the low frequency of locally occurring incidents and that world frequencies from a more appropriate data set needed to be used in the QRA. Worldwide frequencies are scaled to the British Columbia coast environment and traffic volumes using factors developed during the gathering of local knowledge and a peer review by DNV. This is an important area of qualitative input into the QRA. Frequencies for marine transportation incidents are derived from worldwide statistics from 1990 to 2006 catalogued in the Lloyds Register Fairplay database, one of the foremost ship casualty databases. Frequencies for incidents that may occur at the marine terminal are based on DNV research of terminal operations in northern Europe that are comparable to the terminal planned at Kitimat. The consequences that could result from an incident as well as the conditional probability of a spill are assessed in the QRA. Not all incidents will necessary lead to a release of oil, condensate and/or bunker fuel. Consequences, for the purpose of this QRA, are defined as physical damage to the tanker or the marine terminal and the amount of cargo or bunker fuel that may be released. The environmental, social and economic impacts resulting from an incident are discussed in documentation provided to the National Energy Board (NEB). The risks of events occurring during marine transport and at the marine terminal are estimated as return periods. The relative analysis of the risks indicates the most significant hazards and areas of greatest risk along the marine routes. This information provides the basis for the examination of risk mitigation strategies. Examples of risk mitigation measures that were quantitatively analysed include the use of tug escorts and closed loading systems at the marine terminal.
The tug plan currently proposed for Northern Gateway Pipelines Project is as follows:
• All laden tankers will have a close escort tug between the pilot boarding stations at Triple Islands, or proposed stations at Browning Entrance and Caamano Sound and the Kitimat Terminal. In addition all laden tankers will have a tethered escort tug throughout the CCAA (between Browning Entrance and Caamano Sound and the Kitimat Terminal).
• All tankers in ballast will have a close escort tug between the pilot boarding stations at Triple Islands, or proposed stations at Browning Entrance and Caamano Sound and the Kitimat Terminal.
MARINE SHIPPING QUANTITATIVE RISK ANALYSIS Technical Data Report Section 0: Executive Summary
2010 DRAFT Page 1-3
Some risk mitigation measures were analysed qualitatively due to the lack of statistical information on their efficacy. Using DNV’s experience in international maritime shipping operations the following items were assessed and are recommended for consideration and/or implementation:
• the installation of enhanced navigational aids and radar monitoring system • the mandatory use of Electronic Chart Display and Information System (ECDIS) by both ship and
independent pilot systems
• speed reduction in Wright Sound when higher density traffic is present
• improvements to the communication systems at certain areas along the marine transportation routes
• enhancing Vessel Traffic Services with the installation of radar at strategic locations in the CCAA
• consideration of a traffic separation system in the CCAA
The conclusion of the QRA is that, with suitable mitigation measures, the predicted frequencies of incidents and spills along the marine transportation routes are predicted to be one third of current world averages. The risk of an oil spill occurring during marine transit or at the terminal can be mitigated to levels comparable with other modern international tanker and terminals which conform to best operating practices.
MARINE SHIPPING QUANTITATIVE RISK ANALYSIS Technical Data Report Section 1: Introduction
Page 1-4 DRAFT 2010
1 Introduction
1.1 Objective This report describes the marine Quantitative Risk Analysis (QRA) completed as part of the TERMPOL review process for the Enbridge Northern Gateway Pipelines Project (the Project). The QRA fulfils a number of the requirements described in Section 3.15 of TERMPOL 2001 (TP743E). TERMPOL 2001 (TP743E) suggests examining the probability of certain events occurring en route to the marine terminal or during marine terminal transhipment and the likelihood of an event causing an uncontrolled release of oil, condensate, or bunker. Incident scenarios considered in the QRA include:
• a two ship collision;
• a ship grounding (powered and drift);
• a ship striking a fixed object (e.g. marine structures during berthing);
• an incident resulting from improper cargo transfer, or
• a fire or explosion on board the vessel.
In addition this QRA also examines the risk of a tanker at the berth being struck by a passing vessel and the risk of a tug boat striking and damaging a tanker.
As requested in TERMPOL 2001 the QRA examines:
• the probabilities of credible incidents that could breach a ship’s cargo containment system;
• the risks associated with navigation to and from the Kitimat Terminal;
• the probabilities of cargo transfer incidents at one of the two berths at the marine terminal;
• the consequences of an incident occurring;
• the probability that an incident becomes "uncontrollable". Chapter 4 of the QRA identifies hazards to tankers travelling in Canadian waters and during cargo transfer at the Kitimat Terminal. Local knowledge of potential hazards was incorporated through a HAZID workshop, local interviews and two tours of sections of the proposed marine routes and marine terminal site. Incident frequencies are estimated in Chapter 5. The frequencies of incidents that may occur during transit to and from open ocean and the Kitimat Terminal are defined in terms of incidents per nautical mile and are derived from worldwide casualty data recorded by Lloyds Register Fairplay (LRFP). Frequencies of incidents that may occur during berthing and cargo transfer at the marine terminal are defined in terms of incidents per berthing (or per loading/discharge operation) and are based on LRFP data and DNV research of terminals in northern Europe that are comparable to the marine terminal planned for Kitimat.

MARINE SHIPPING QUANTITATIVE RISK ANALYSIS Technical Data Report Section 1: Introduction
2010 DRAFT Page 1-5
The probable consequences of incidents are examined in Chapter 6. Consequences are defined as the potential damage to tankers and / or the terminal, as well as the volume of cargo or bunker fuel that may be released. The consequences developed in this report are used in the environmental and, socio-economic assessment provided to the National Energy Board (NEB) and in the contingency planning discussed in TERMPOL 3.18. The risks of incidents occurring and incidents causing a release of cargo or bunker fuel is calculated in Chapters 5 through 7 and summarized as incident and spill return periods in Chapter 7. Chapter 7 also includes a sensitivity analysis of input parameters. The risks from Chapter 7 are re-evaluated in Chapter 8 with risk mitigation measures in place.
MARINE SHIPPING QUANTITATIVE RISK ANALYSIS Technical Data Report Section 1: Introduction
Page 1-6 DRAFT 2010
1.2 Abbreviations
CCAA Confined Channel Assessment Area
DM Direct Mode
DNV Det Norske Veritas
ECDIS Electronic Chart Display and Information System
EEZ Exclusive Economic Zone
FSA Formal Safety Assessment
H Hour
HAZID Hazard Identification
IM Indirect Mode
IMO International Maritime Organisation
IRA Increased Risk Areas
km Distance in kilometres
kn Vessel speed in knots
LRFP Lloyd’s Register Fairplay incident database
m Distance / depth in metres
m3 Cubic metre
MCTS Marine Communications and Traffic Services
ME Mechanical
MEPC Marine Environment Protection Committee
MT Metric ton
nm Nautical mile
OWA Open Water Area
QRA Quantitative Risk Analysis
SOLAS International Convention for Safety of Life at Sea
TEZ Tanker Exclusion Zone
VLCC Very Large Crude Carriers
VTS Vessel Traffic Service
VTMS Vessel Traffic Management System
MARINE SHIPPING QUANTITATIVE RISK ANALYSIS Technical Data Report Section 2: Methodology
2010 DRAFT Page 2-7
2 Methodology Two different methodologies were evaluated for completing this marine Quantitative Risk Analysis: “The Per Voyage Methodology” and “The Per Volume of Oil Transported Methodology”.
The Per Voyage Methodology calculates the risk for each voyage, taking into consideration:
• the route length;
• local factors, such as wind and bathymetry;
• size of the vessels, and;
• number of voyages for each vessel class
The Per Voyage Methodology was used to complete the QRA for the TERMPOL Review Process for the LNG terminal at Rabaska in Eastern Canada (Rabaska 2004).
The Per Volume of Oil Transported Methodology assumes that there is a direct correlation between spill frequency and the volume of oil transported. Frequencies are based on incident data compared to the volume of oil shipped in the same period. A project that ships twice the volume of oil compared to another operation is forecast to have twice the number of incidents.
2.1 Northern Gateway Pipelines Marine QRA Methodology The Per Voyage Methodology was selected for completing the marine QRA for the Enbridge Northern Gateway Pipelines Project, because it can more accurately assess the range of tanker sizes, the relatively long distances travelled in confined channels and the risk mitigation measures planned to be implemented.
The Per Voyage methodology takes into consideration that fewer transits by tankers are required to ship the same volume of cargo if Very Large Crude Carriers (VLCCs) are used rather than Suezmax and / or Aframax vessels. This could not be taken into account using the Per Volume Methodology. The Per Voyage Methodology is also more adequate for examining the benefit of using tug escorts along portions of the marine tanker routes.
MARINE SHIPPING QUANTITATIVE RISK ANALYSIS Technical Data Report Section 2: Methodology
Page 2-8 DRAFT 2010
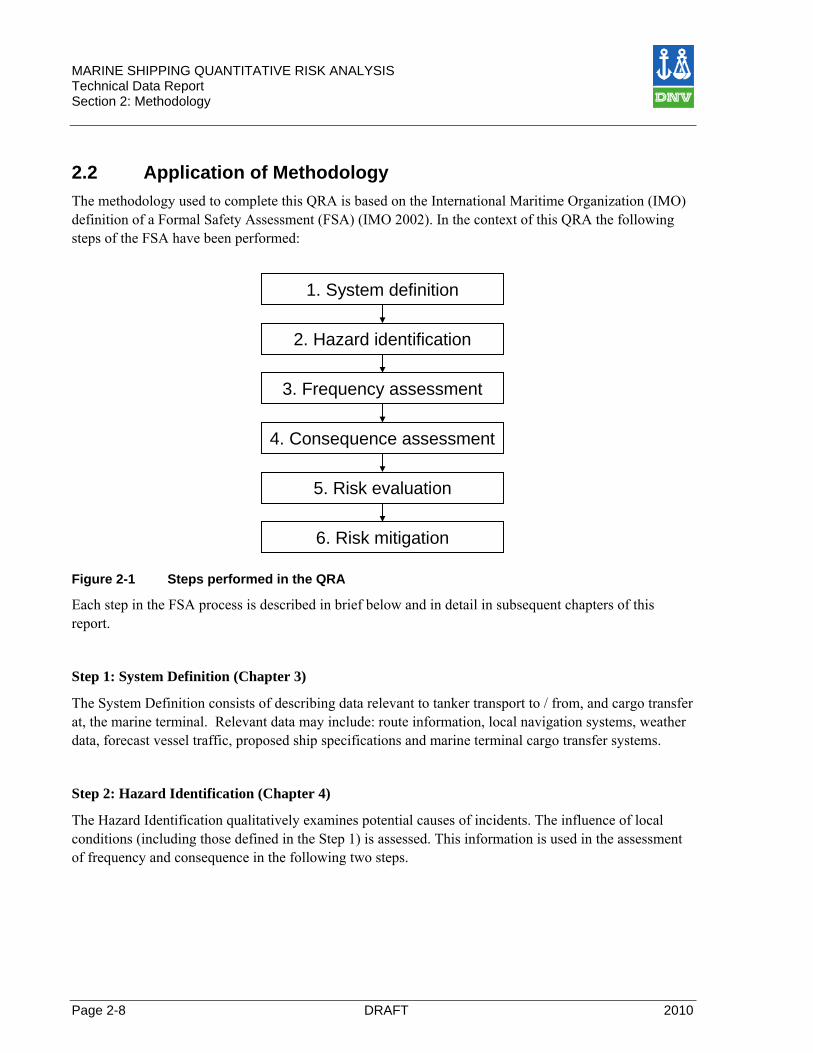
2.2 Application of Methodology The methodology used to complete this QRA is based on the International Maritime Organization (IMO) definition of a Formal Safety Assessment (FSA) (IMO 2002). In the context of this QRA the following steps of the FSA have been performed:
1. System definition
2. Hazard identification
3. Frequency assessment
4. Consequence assessment
5. Risk evaluation
6. Risk mitigation
Figure 2-1 Steps performed in the QRA
Each step in the FSA process is described in brief below and in detail in subsequent chapters of this report.
Step 1: System Definition (Chapter 3)
The System Definition consists of describing data relevant to tanker transport to / from, and cargo transfer at, the marine terminal. Relevant data may include: route information, local navigation systems, weather data, forecast vessel traffic, proposed ship specifications and marine terminal cargo transfer systems.
Step 2: Hazard Identification (Chapter 4)
The Hazard Identification qualitatively examines potential causes of incidents. The influence of local conditions (including those defined in the Step 1) is assessed. This information is used in the assessment of frequency and consequence in the following two steps.
MARINE SHIPPING QUANTITATIVE RISK ANALYSIS Technical Data Report Section 2: Methodology
2010 DRAFT Page 2-9
Step 3: Frequency Assessment (Chapter 5)
The frequency assessment calculates likelihood of incidents occurring given the hazards identified in Step 2 and the system described in Step 1. The assessment is based on incident frequencies from LRFP and DNV research of terminals located in northern Europe.
As described in TERMPOL 3.8, statistically valid local tanker incident frequencies could not be established for the British Columbia coast due to the few incidents that have occurred involving vessels of relevant size. As an alternative, international incident frequencies are used and scaling factors, to reflect local conditions, are applied. Scaled frequencies are presented in terms of incidents per nautical mile (nm).
Step 4: Consequence Assessment (Chapter 6)
The consequence assessment estimates (assuming that an incident has occurred) the likely damage to the tanker and / or terminal and the probability that cargo and / or bunker fuel will be released. For incidents predicted to result in a release, the corresponding volume of cargo and / or bunker fuel expected to be released is estimated.
The range of likely consequences takes into account the incident type, the size of ship, the cargo tank configuration, terminal pump rates, as well as local meteorological and oceanographic conditions.
Consequences are defined in terms of the degree of damage and the conditional probability of a spill for each incident type.
Step 5: Risk Evaluation (Chapter 7)
Based on the frequency and consequence assessment and the forecast annual number of tanker calls at the Kitimat Terminal, the risk of an incident or spill occurring is estimated.
The frequencies calculated in Step 3 and the conditional probabilities from Step 4 are used to calculate the annual probabilities of incidents occurring and incidents leading to a release of cargo and / or bunker fuel for the marine terminal and marine transportation components of the Project. Results are expressed as return periods, or the estimated recurrence interval between events.
Chapter 7 also includes a sensitivity analysis that examines the relative effect of changes to input parameters (e.g. the number of annual tanker calls at the Kitimat Terminal).
Step 6: Risk Mitigation and Evaluation (Chapter 8)
In Step 6 the effects of risk mitigation measures on the risks calculated in Step 5 are quantified. Risk mitigation measures are categorized by their effect on either frequency reduction or consequence mitigation. The focus of this report is on frequency reduction, or measures that eliminate incidents from occurring altogether.

MARINE SHIPPING QUANTITATIVE RISK ANALYSIS Technical Data Report Section 3: System Definition
Page 3-10 DRAFT 2010
3 System Definition The following Chapter describes the system that is analysed in this QRA, including:
The proposed shipping routes and alternative routes;
The forecast tanker traffic and vessel specifications;
The proposed marine terminal, and;
The local weather conditions
3.1 Route Description This section describes geographical and bathymetric areas of the proposed routes. The information presented is taken from the following documents:
• TERMPOL 3.5 and 3.12 (Enbridge Northern Gateway Pipelines Project TERMPOL Surveys and Studies 2010)
• TERMPOL 3.2 (Enbridge Northern Gateway Pipelines Project TERMPOL Surveys and Studies 2010)
• Wind Observations in Douglas Channel, Squally Channel and Caamaño Sound Technical Data Report (Hay and Company Consultants [Hayco] 2010)
• Weather and Oceanographic Conditions at sites in the CCAA and in Queen Charlotte Sound, Hecate Strait and Dixon Entrance Technical Data Report (ASL Environmental Sciences [ASL] 2010)
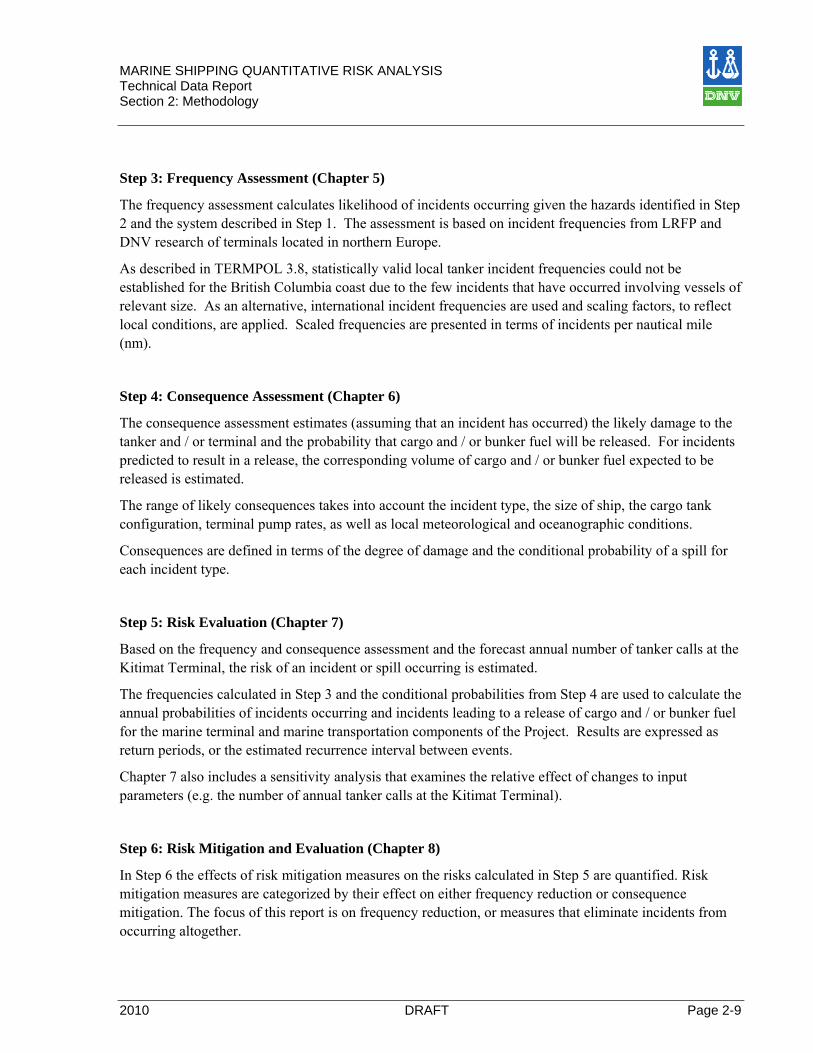
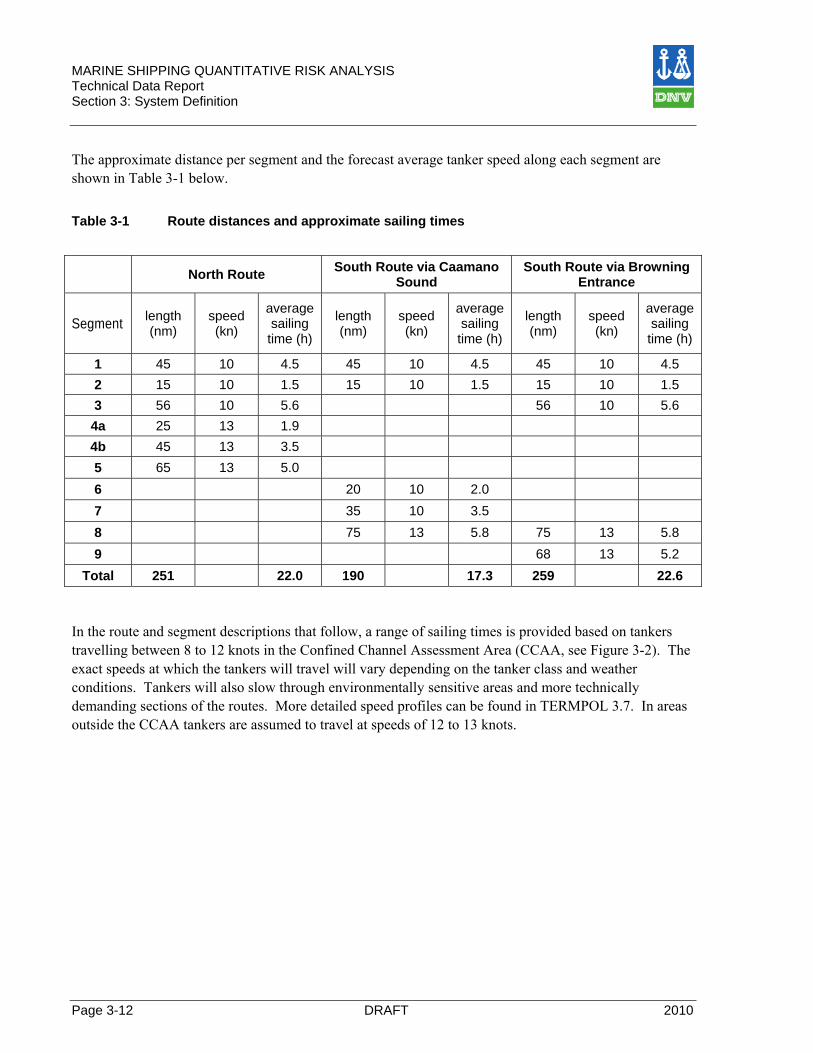
There are three main routes to and from open ocean and the Kitimat Terminal. There are two South Routes that pass south of Queen Charlotte Islands one North Route that passes north of the Queen Charlotte Islands, see Figure 3-1. DNV notes that the name of the Queen Charlotte Islands was changed to Haida Gwaii during the preparation of this report. However, to remain consistent with published marine charts and the information gathered by DNV during 2009, the term Queen Charlotte Islands is used.
To analyse different areas, each route has been divided into segments with similar bathymetry, traffic and metocean conditions. All routes contain common Segments 1 and 2.
The North Route also contains:
Segments 3, 4a, 4b and 5
The South Route via Caamano Sound also contains:
• Segments 6, 7, and 8
The South Route via Browning Entrance also contains:
Segments 3, 8 and 9
The three routes proposed by Northern Gateway are all active shipping routes. Vessels have the option to choose between routes when approaching or departing the Kitimat Terminal and select a route based on forecast weather and their final destination.
MARINE SHIPPING QUANTITATIVE RISK ANALYSIS Technical Data Report Section 3: System Definition
2010 DRAFT Page 3-11
Figure 3-1 Three marine transportation routes and ten segments referred to in QRA
MARINE SHIPPING QUANTITATIVE RISK ANALYSIS Technical Data Report Section 3: System Definition
Page 3-12 DRAFT 2010
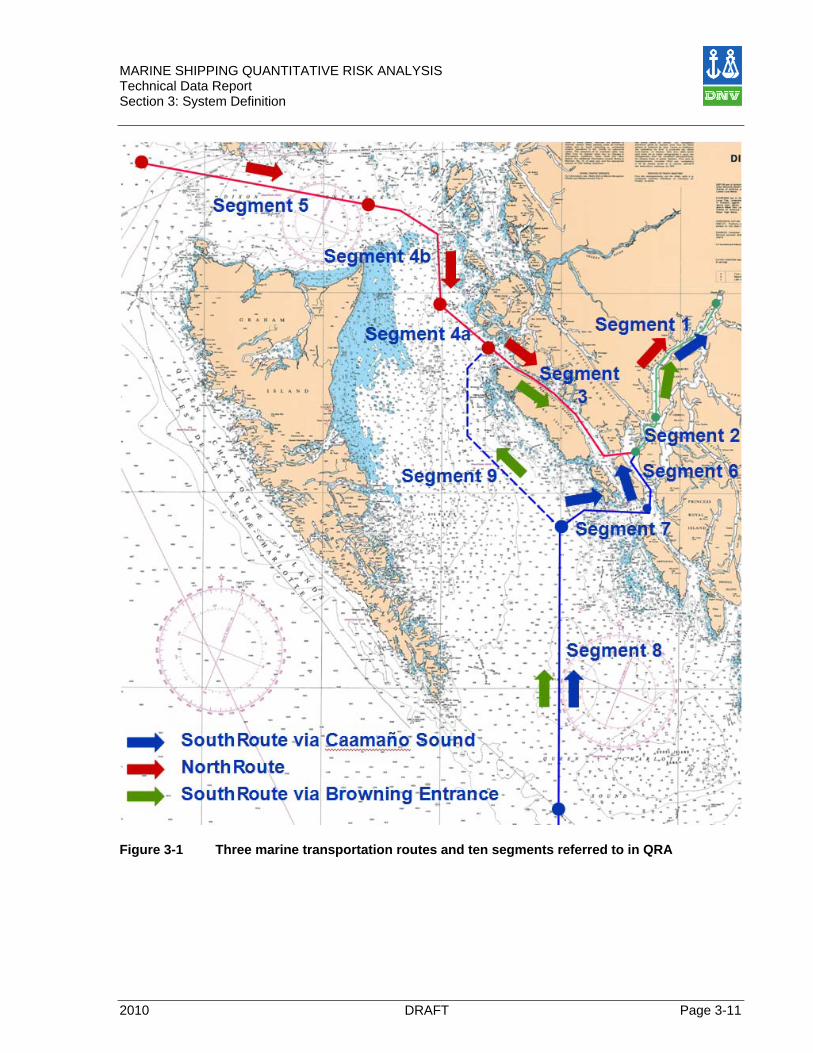
The approximate distance per segment and the forecast average tanker speed along each segment are shown in Table 3-1 below.
Table 3-1 Route distances and approximate sailing times
North Route South Route via Caamano Sound
South Route via Browning Entrance
Segment length (nm)
speed (kn)
average sailing time (h)
length (nm)
speed (kn)
average sailing time (h)
length (nm)
speed (kn)
average sailing time (h)
1 45 10 4.5 45 10 4.5 45 10 4.5 2 15 10 1.5 15 10 1.5 15 10 1.5 3 56 10 5.6 56 10 5.6 4a 25 13 1.9 4b 45 13 3.5 5 65 13 5.0 6 20 10 2.0 7 35 10 3.5 8 75 13 5.8 75 13 5.8 9 68 13 5.2
Total 251 22.0 190 17.3 259 22.6
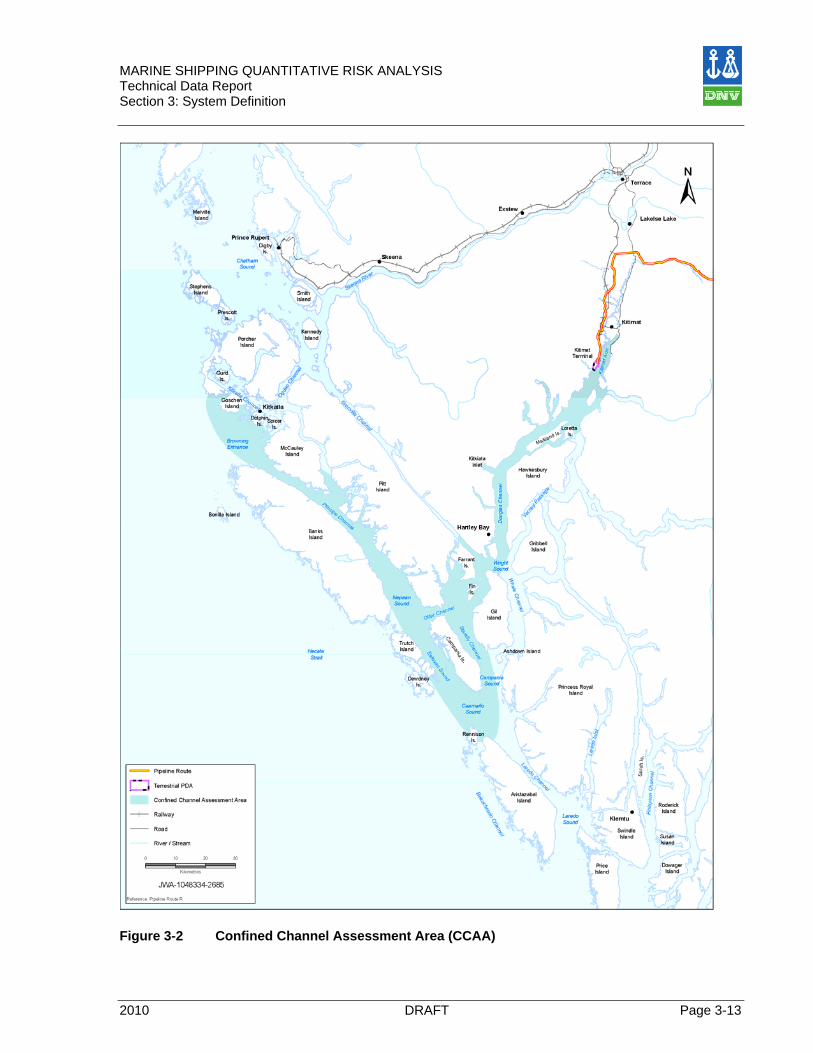
In the route and segment descriptions that follow, a range of sailing times is provided based on tankers travelling between 8 to 12 knots in the Confined Channel Assessment Area (CCAA, see Figure 3-2). The exact speeds at which the tankers will travel will vary depending on the tanker class and weather conditions. Tankers will also slow through environmentally sensitive areas and more technically demanding sections of the routes. More detailed speed profiles can be found in TERMPOL 3.7. In areas outside the CCAA tankers are assumed to travel at speeds of 12 to 13 knots.
MARINE SHIPPING QUANTITATIVE RISK ANALYSIS Technical Data Report Section 3: System Definition
2010 DRAFT Page 3-13
Figure 3-2 Confined Channel Assessment Area (CCAA)

MARINE SHIPPING QUANTITATIVE RISK ANALYSIS Technical Data Report Section 3: System Definition
Page 3-14 DRAFT 2010
3.1.1 Description of Segments Common to all Routes (Segments 1 and 2) Segments 1 and 2 (see Figure 3-3, below) form a navigable route from the south end of Lewis Passage to the Kitimat Terminal. Segment 2 joins either Segment 3 or 6 between “Blackrock Point” to the south and “Keld Point” to the north in Squally Channel.
3.1.1.1 Segment 1 - Kitimat Terminal to Wright Sound
Segment 1, from Wright Sound to the Kitimat Terminal, is approximately 45 nm in length (sailing time of 3.8-5.6 hours).
Douglas Channel is 1.9 nm wide at its entrance near the south west corner of Gribbell Island. Proceeding northwards from Money Point, Douglas Channel is 1.6 to 2.2 nm wide. Douglas Channel is deep, (with charted depths in excess of 180 metres) and straight for about 14 nm, passing Hartley Bay and Kiskosh Inlet and Kitkiata Inlet where the channel turns north-east.
Figure 3-3 Segment 1 from Kitimat Terminal to Wright Sound via Douglas Channel
Segment 2
Segment 1
MARINE SHIPPING QUANTITATIVE RISK ANALYSIS Technical Data Report Section 3: System Definition
2010 DRAFT Page 3-15
From Kitkiata Inlet, Douglas Channel continues approximately 17 nm in a north-easterly direction towards the narrows between Emilia Island and Maitland Island. Between Kitkiata Inlet and Maitland Island, the navigable channel is straight and approximately 1.5 nm wide, with charted water depths in excess of 90 metres.
At Grant Point on Maitland Island, the navigable channel doglegs to the north, before resuming its north-easterly course and reducing in width to approximately 1.2 nm, 5.0 nm northeast of Grant Point.
South of Emilia Island, Douglas Channel narrows to a width of 0.8 nm to 3 nm, with charted depths in excess of 90 metres to 365 metres. As inbound vessels clear the Emilia Island section, the channel widens and vessels enter Kitimat Arm and Kitimat Harbour.
Inbound tankers will clear Nanakwa Shoal and Coste Rocks. Nanakwa Shoal lies to the northwest of the 1.5 nm wide navigable channel and has a charted depth of 18 metres. Coste Rocks lies southeast of the navigable channel situated 1.0 nm southwest of Louis Point on Coste Island. Between Markland Point and Coste Island, the navigable channel is 1.5 nm wide, narrowing to 1.0 nm wide off Clio Point.
Inbound vessels will continue from Clio Point to the Kitimat Terminal. Off Kitimat Terminal, charted depths quickly reach depths in excess of 180 metres.
3.1.1.2 Segment 2 - Wright Sound to Squally Channel
Segment 2, from the south end of Lewis Passage and Squally Channel to Wright Sound, is approximately 15 nm in length (sailing time of 1.3-1.9 hours).
The entrance to Lewis Passage lies between Fin Island and Gil Island and is 1.24 nm wide with charted depths exceeding 36 metres. Inside Lewis Passage, the channel widens slightly as inbound vessels pass Crane Bay and Williams Islet.
MARINE SHIPPING QUANTITATIVE RISK ANALYSIS Technical Data Report Section 3: System Definition
Page 3-16 DRAFT 2010
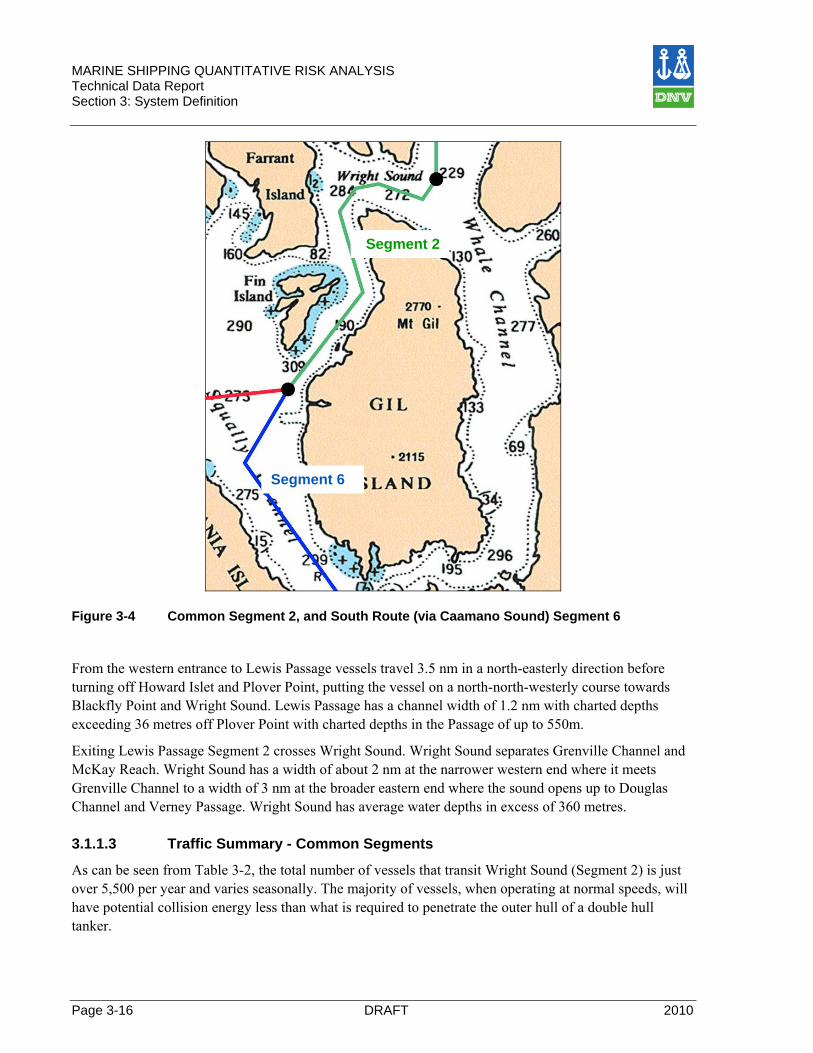
Figure 3-4 Common Segment 2, and South Route (via Caamano Sound) Segment 6
From the western entrance to Lewis Passage vessels travel 3.5 nm in a north-easterly direction before turning off Howard Islet and Plover Point, putting the vessel on a north-north-westerly course towards Blackfly Point and Wright Sound. Lewis Passage has a channel width of 1.2 nm with charted depths exceeding 36 metres off Plover Point with charted depths in the Passage of up to 550m.
Exiting Lewis Passage Segment 2 crosses Wright Sound. Wright Sound separates Grenville Channel and McKay Reach. Wright Sound has a width of about 2 nm at the narrower western end where it meets Grenville Channel to a width of 3 nm at the broader eastern end where the sound opens up to Douglas Channel and Verney Passage. Wright Sound has average water depths in excess of 360 metres.
3.1.1.3 Traffic Summary - Common Segments
As can be seen from Table 3-2, the total number of vessels that transit Wright Sound (Segment 2) is just over 5,500 per year and varies seasonally. The majority of vessels, when operating at normal speeds, will have potential collision energy less than what is required to penetrate the outer hull of a double hull tanker.
Segment 2
Segment 6
MARINE SHIPPING QUANTITATIVE RISK ANALYSIS Technical Data Report Section 3: System Definition
2010 DRAFT Page 3-17
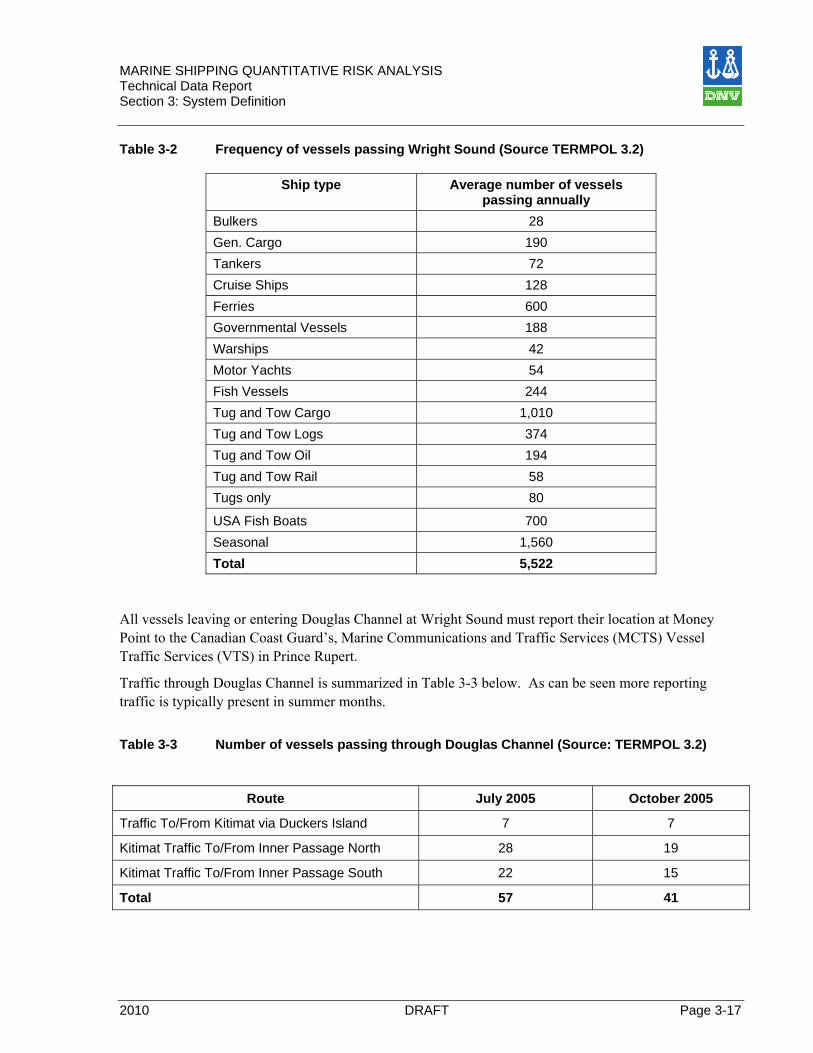
Table 3-2 Frequency of vessels passing Wright Sound (Source TERMPOL 3.2)
Ship type Average number of vessels passing annually
Bulkers 28 Gen. Cargo 190 Tankers 72 Cruise Ships 128 Ferries 600 Governmental Vessels 188 Warships 42 Motor Yachts 54 Fish Vessels 244 Tug and Tow Cargo 1,010 Tug and Tow Logs 374 Tug and Tow Oil 194 Tug and Tow Rail 58 Tugs only 80
USA Fish Boats 700 Seasonal 1,560 Total 5,522
All vessels leaving or entering Douglas Channel at Wright Sound must report their location at Money Point to the Canadian Coast Guard’s, Marine Communications and Traffic Services (MCTS) Vessel Traffic Services (VTS) in Prince Rupert.
Traffic through Douglas Channel is summarized in Table 3-3 below. As can be seen more reporting traffic is typically present in summer months.
Table 3-3 Number of vessels passing through Douglas Channel (Source: TERMPOL 3.2)
Route July 2005 October 2005
Traffic To/From Kitimat via Duckers Island 7 7
Kitimat Traffic To/From Inner Passage North 28 19
Kitimat Traffic To/From Inner Passage South 22 15
Total 57 41
MARINE SHIPPING QUANTITATIVE RISK ANALYSIS Technical Data Report Section 3: System Definition
Page 3-18 DRAFT 2010
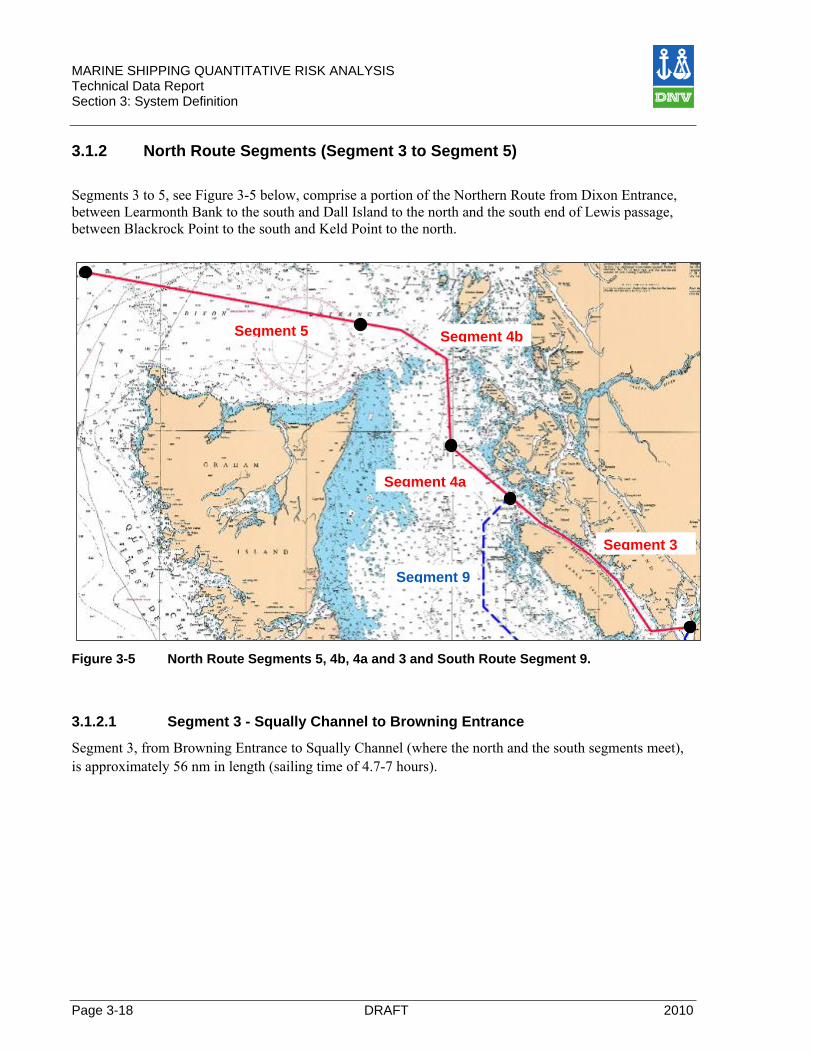
3.1.2 North Route Segments (Segment 3 to Segment 5) Segments 3 to 5, see Figure 3-5 below, comprise a portion of the Northern Route from Dixon Entrance, between Learmonth Bank to the south and Dall Island to the north and the south end of Lewis passage, between Blackrock Point to the south and Keld Point to the north.
Figure 3-5 North Route Segments 5, 4b, 4a and 3 and South Route Segment 9.
3.1.2.1 Segment 3 - Squally Channel to Browning Entrance
Segment 3, from Browning Entrance to Squally Channel (where the north and the south segments meet), is approximately 56 nm in length (sailing time of 4.7-7 hours).
Segment 5
Segment 3
Segment 4b
Segment 4a
Segment 9
MARINE SHIPPING QUANTITATIVE RISK ANALYSIS Technical Data Report Section 3: System Definition
2010 DRAFT Page 3-19
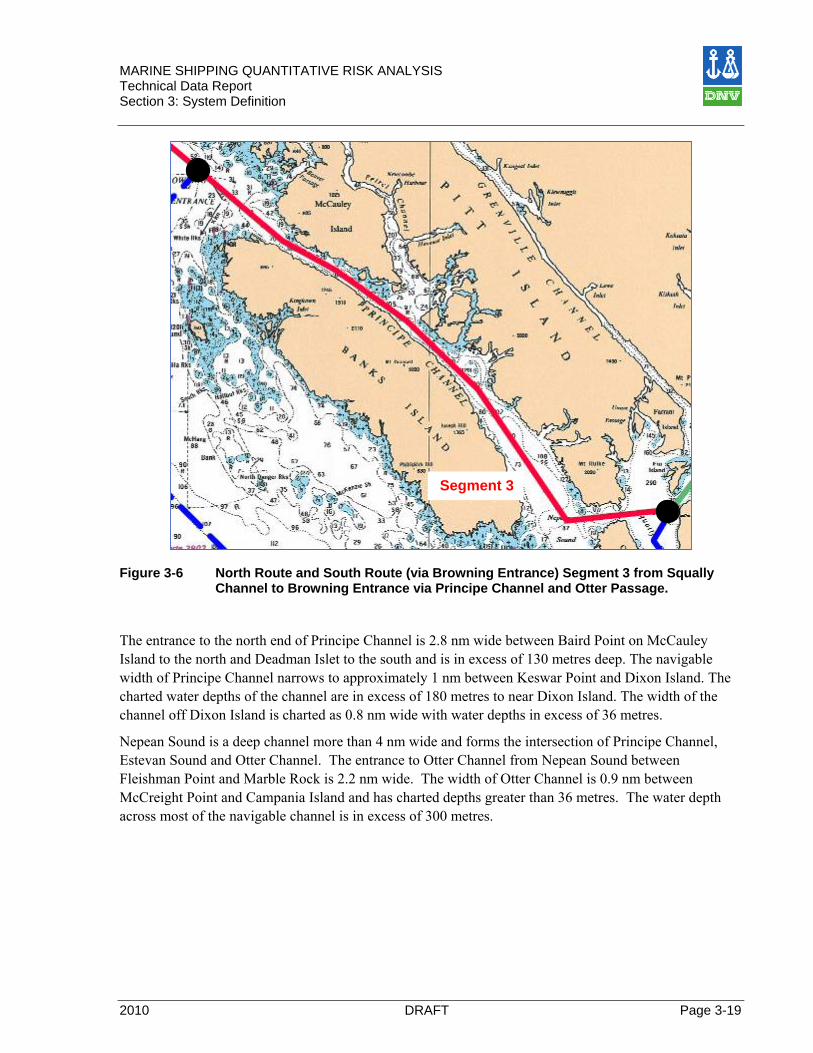
Figure 3-6 North Route and South Route (via Browning Entrance) Segment 3 from Squally
Channel to Browning Entrance via Principe Channel and Otter Passage.
The entrance to the north end of Principe Channel is 2.8 nm wide between Baird Point on McCauley Island to the north and Deadman Islet to the south and is in excess of 130 metres deep. The navigable width of Principe Channel narrows to approximately 1 nm between Keswar Point and Dixon Island. The charted water depths of the channel are in excess of 180 metres to near Dixon Island. The width of the channel off Dixon Island is charted as 0.8 nm wide with water depths in excess of 36 metres.
Nepean Sound is a deep channel more than 4 nm wide and forms the intersection of Principe Channel, Estevan Sound and Otter Channel. The entrance to Otter Channel from Nepean Sound between Fleishman Point and Marble Rock is 2.2 nm wide. The width of Otter Channel is 0.9 nm between McCreight Point and Campania Island and has charted depths greater than 36 metres. The water depth across most of the navigable channel is in excess of 300 metres.
Segment 3
MARINE SHIPPING QUANTITATIVE RISK ANALYSIS Technical Data Report Section 3: System Definition
Page 3-20 DRAFT 2010
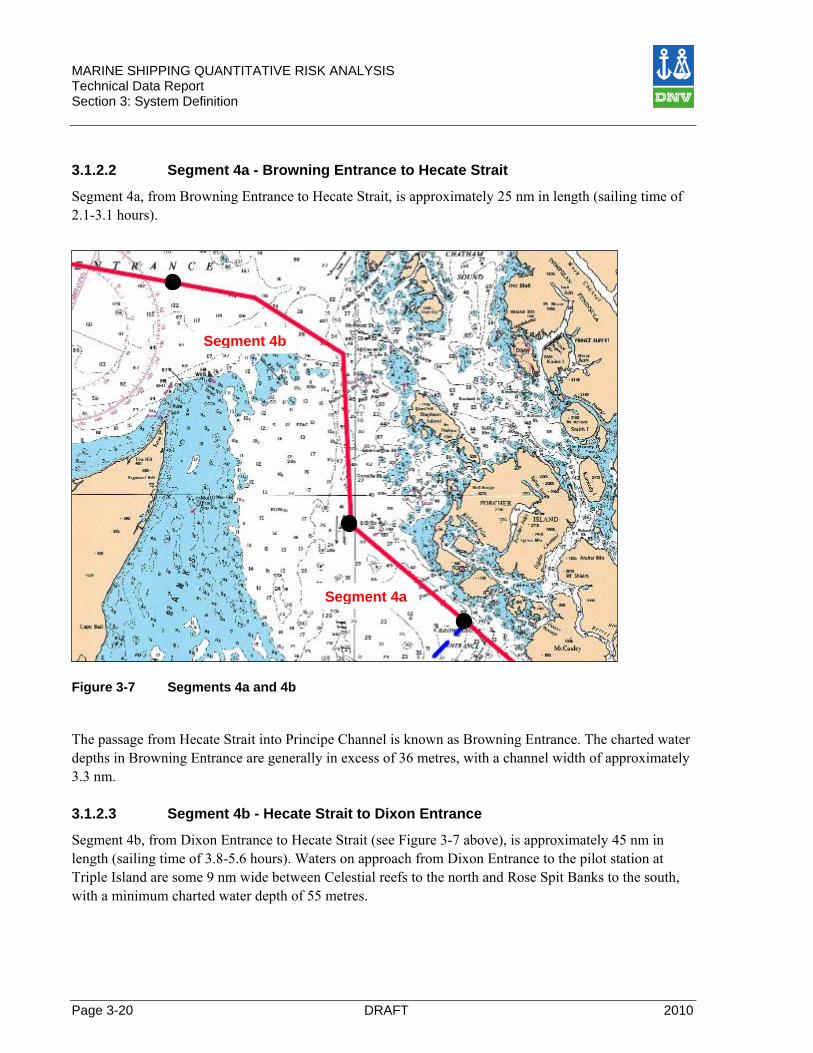
3.1.2.2 Segment 4a - Browning Entrance to Hecate Strait
Segment 4a, from Browning Entrance to Hecate Strait, is approximately 25 nm in length (sailing time of 2.1-3.1 hours).
Figure 3-7 Segments 4a and 4b
The passage from Hecate Strait into Principe Channel is known as Browning Entrance. The charted water depths in Browning Entrance are generally in excess of 36 metres, with a channel width of approximately 3.3 nm.
3.1.2.3 Segment 4b - Hecate Strait to Dixon Entrance
Segment 4b, from Dixon Entrance to Hecate Strait (see Figure 3-7 above), is approximately 45 nm in length (sailing time of 3.8-5.6 hours). Waters on approach from Dixon Entrance to the pilot station at Triple Island are some 9 nm wide between Celestial reefs to the north and Rose Spit Banks to the south, with a minimum charted water depth of 55 metres.
Segment 4a
Segment 4b

MARINE SHIPPING QUANTITATIVE RISK ANALYSIS Technical Data Report Section 3: System Definition
2010 DRAFT Page 3-21
3.1.2.4 Segment 5 - Dixon Entrance
Segment 5 through Dixon Entrance is approximately 65 nm in length (sailing time of 5.4-8.1 hours). The mouth of Dixon Entrance is nearly 27 nm wide between Langara Island to the south and Dall Island to the north. Learmonth Bank, with a minimum charted depth of 36 metres, is located at the head of Dixon Entrance.
Figure 3-8 Segment 5 Dixon Entrance
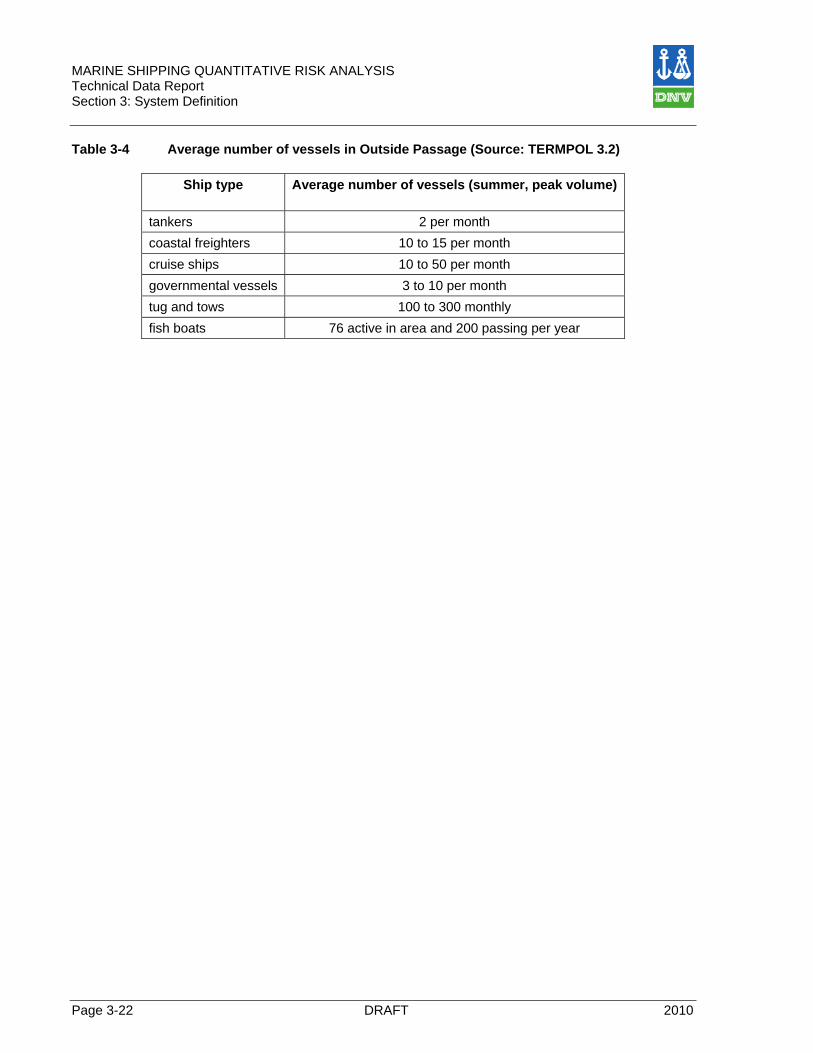
3.1.2.5 Traffic Summary –North Route Segments
The North Route and portions of the South Route via Browning Entrance traverse Principe Channel and Estevan Sound. Together with Laredo Channel and Laredo Sound, these water bodies form part of what is referred to as the Outside Passage. As can be seen in Table 3-4, below, there is a low concentration of large vessel traffic. Table 3-4 summarizes peak summer traffic; winter traffic will be less.
Segment 5
MARINE SHIPPING QUANTITATIVE RISK ANALYSIS Technical Data Report Section 3: System Definition
Page 3-22 DRAFT 2010
Table 3-4 Average number of vessels in Outside Passage (Source: TERMPOL 3.2)
Ship type Average number of vessels (summer, peak volume)
tankers 2 per month coastal freighters 10 to 15 per month cruise ships 10 to 50 per month governmental vessels 3 to 10 per month tug and tows 100 to 300 monthly fish boats 76 active in area and 200 passing per year
MARINE SHIPPING QUANTITATIVE RISK ANALYSIS Technical Data Report Section 3: System Definition
2010 DRAFT Page 3-23
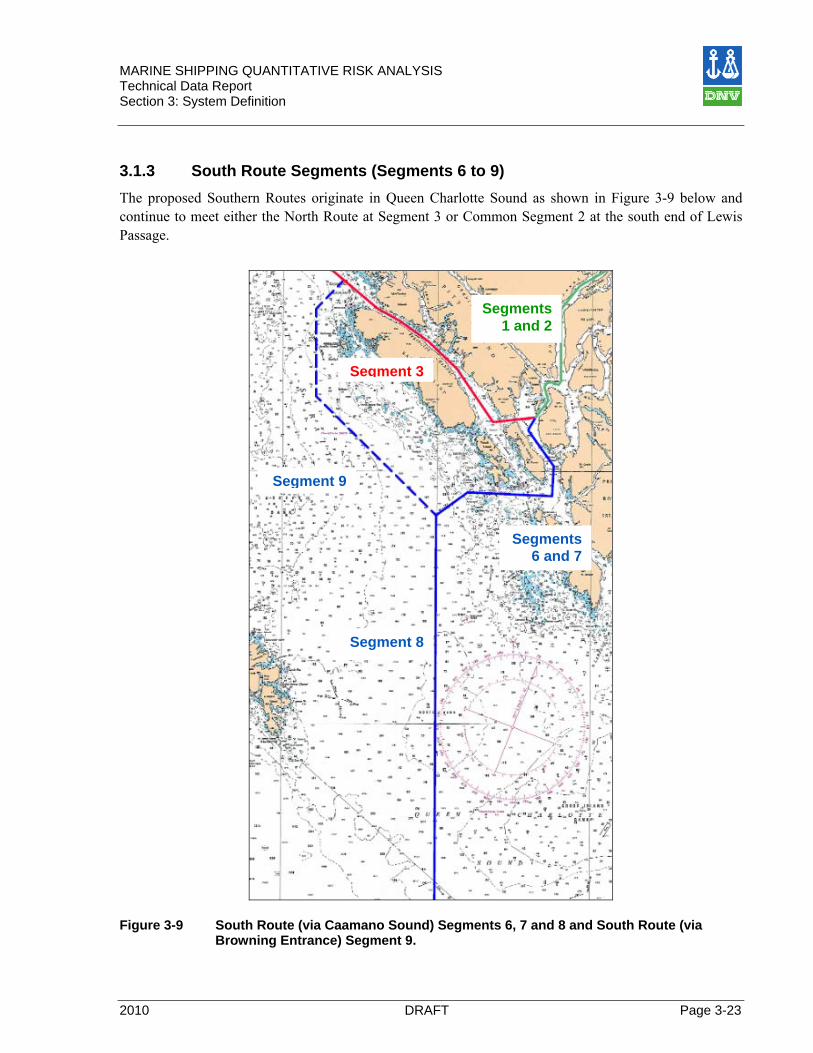
3.1.3 South Route Segments (Segments 6 to 9) The proposed Southern Routes originate in Queen Charlotte Sound as shown in Figure 3-9 below and continue to meet either the North Route at Segment 3 or Common Segment 2 at the south end of Lewis Passage.
Figure 3-9 South Route (via Caamano Sound) Segments 6, 7 and 8 and South Route (via Browning Entrance) Segment 9.
Segment 9
Segment 8
Segments 6 and 7
Segments 1 and 2
Segment 3

MARINE SHIPPING QUANTITATIVE RISK ANALYSIS Technical Data Report Section 3: System Definition
Page 3-24 DRAFT 2010
3.1.3.1 Segment 6 - Caamano Sound to Squally Channel
Segment 6, from Caamano Sound to Squally Channel (where the North and South Routes meet), is approximately 20 nm in length (sailing time of 1.7-2.5 hours).
Segment 6 exits Caamano Sound through Campania Sound and Squally Channel. The width of Squally Channel varies from approximately 4.9 nm in width down to 3.2 nm at the narrowest section off Fawcett Point on Gil Island. Charted water depths are, in general, greater than 500 metres. From Fawcett Point, the channel widens out and becomes Campania Sound with a width of 2.4 nm and charted water depths in excess of 180 metres.
Figure 3-10 South Route via Caamano Sound Segment 6 (Squally Channel to Caamano Sound) and Segment 7 (through Caamano Sound)
3.1.3.2 Segment 7 - Caamano Sound
Segment 7 through Caamano Sound is approximately 30 nm in length (sailing time of 2.9-4.4 hours). Caamano Sound provides direct access to Queen Charlotte Sound and open ocean. The indicated navigable channel has a minimum width of 2.5 nm.
Segment 6
Segment 7
MARINE SHIPPING QUANTITATIVE RISK ANALYSIS Technical Data Report Section 3: System Definition
2010 DRAFT Page 3-25
3.1.3.3 Segment 8 – Caamano Sound to Queen Charlotte Sound
Segment 8 starts in Queen Charlotte Sound and is approximately 75 nm in length (sailing time of 6.3-9.4 hours) with depths in excess of 100 metres.
3.1.3.4 Segment 9 – Caamano Sound to Hecate Strait
Segment 9 is an alternative to the Southern Route via Caamano Sound and Segments 6 and 7. Segment 9 transits Hecate Strait and joins Segment 8 to the North Route at Segment 3 and Browning Entrance. Segment 9 is approximately 68 nm in length (sailing time 5.7-8.5 hours).
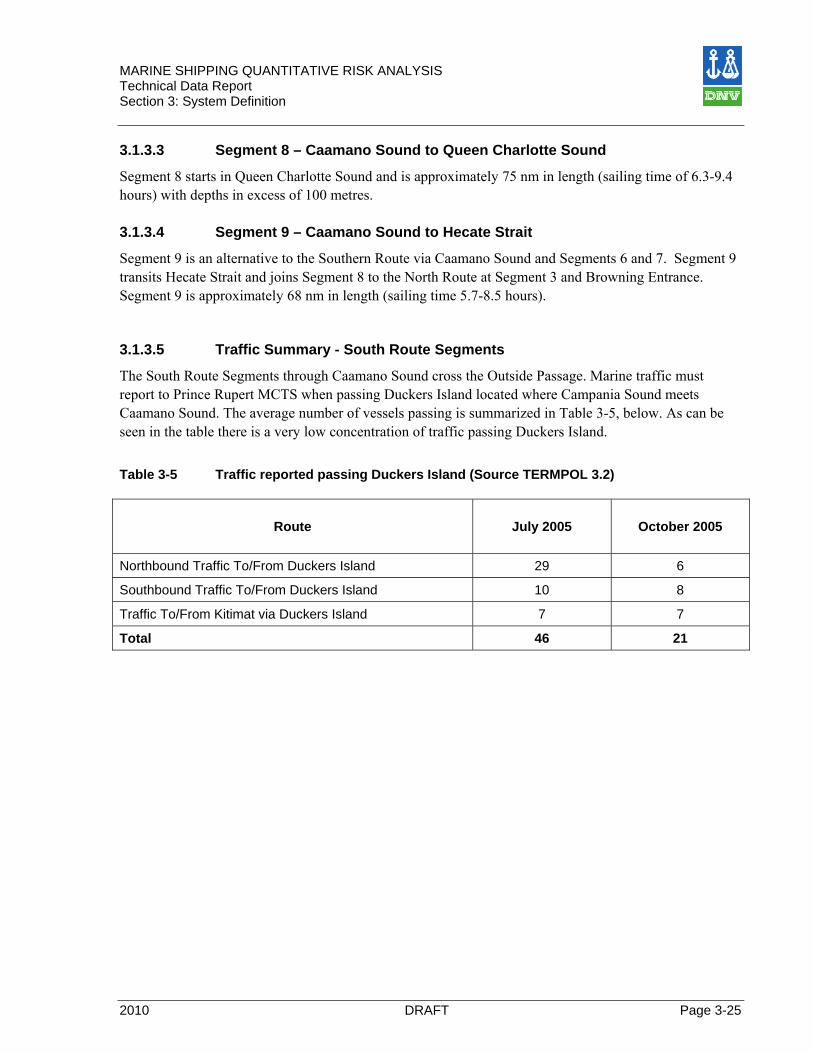
3.1.3.5 Traffic Summary - South Route Segments
The South Route Segments through Caamano Sound cross the Outside Passage. Marine traffic must report to Prince Rupert MCTS when passing Duckers Island located where Campania Sound meets Caamano Sound. The average number of vessels passing is summarized in Table 3-5, below. As can be seen in the table there is a very low concentration of traffic passing Duckers Island.
Table 3-5 Traffic reported passing Duckers Island (Source TERMPOL 3.2)
Route July 2005 October 2005
Northbound Traffic To/From Duckers Island 29 6
Southbound Traffic To/From Duckers Island 10 8
Traffic To/From Kitimat via Duckers Island 7 7
Total 46 21
MARINE SHIPPING QUANTITATIVE RISK ANALYSIS Technical Data Report Section 3: System Definition
Page 3-26 DRAFT 2010
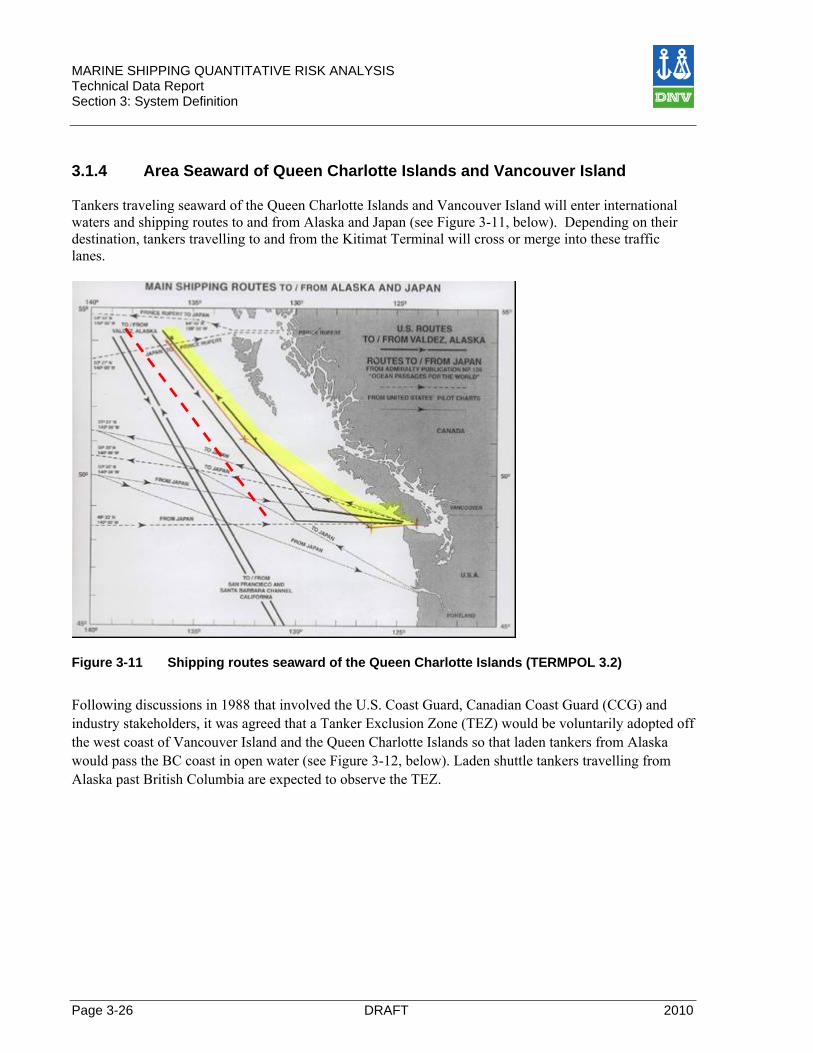
3.1.4 Area Seaward of Queen Charlotte Islands and Vancouver Island Tankers traveling seaward of the Queen Charlotte Islands and Vancouver Island will enter international waters and shipping routes to and from Alaska and Japan (see Figure 3-11, below). Depending on their destination, tankers travelling to and from the Kitimat Terminal will cross or merge into these traffic lanes.
Figure 3-11 Shipping routes seaward of the Queen Charlotte Islands (TERMPOL 3.2)
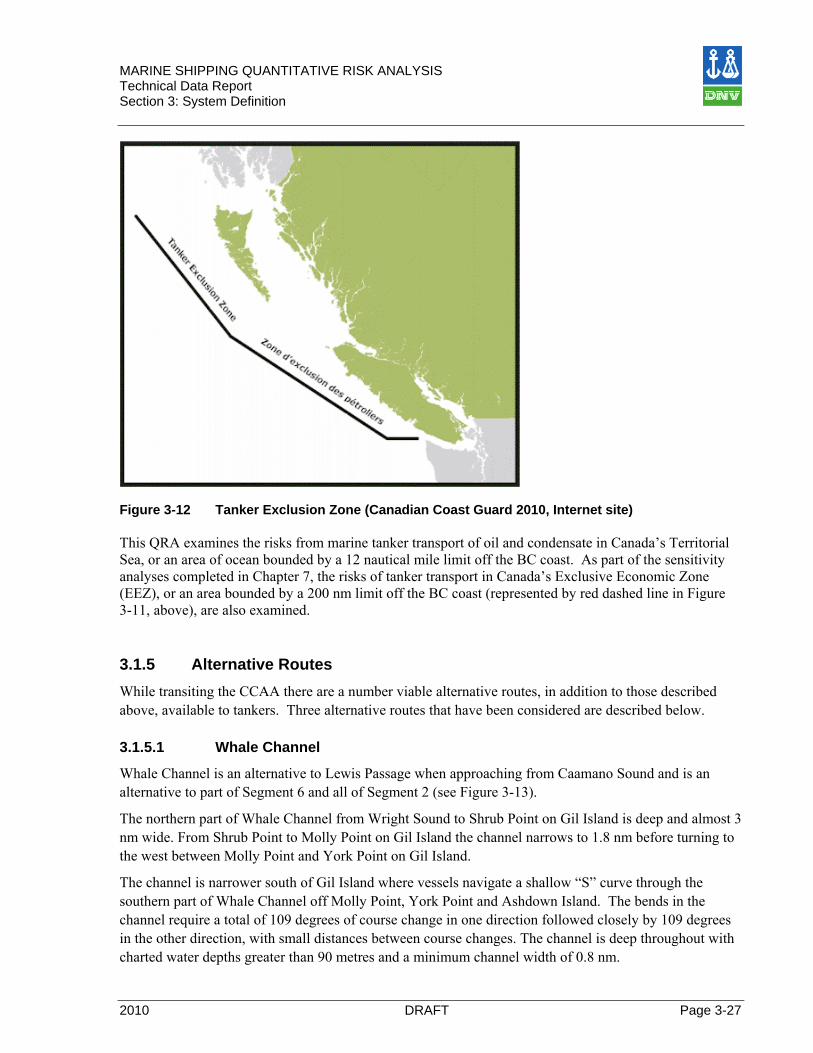
Following discussions in 1988 that involved the U.S. Coast Guard, Canadian Coast Guard (CCG) and industry stakeholders, it was agreed that a Tanker Exclusion Zone (TEZ) would be voluntarily adopted off the west coast of Vancouver Island and the Queen Charlotte Islands so that laden tankers from Alaska would pass the BC coast in open water (see Figure 3-12, below). Laden shuttle tankers travelling from Alaska past British Columbia are expected to observe the TEZ.
MARINE SHIPPING QUANTITATIVE RISK ANALYSIS Technical Data Report Section 3: System Definition
2010 DRAFT Page 3-27
Figure 3-12 Tanker Exclusion Zone (Canadian Coast Guard 2010, Internet site) This QRA examines the risks from marine tanker transport of oil and condensate in Canada’s Territorial Sea, or an area of ocean bounded by a 12 nautical mile limit off the BC coast. As part of the sensitivity analyses completed in Chapter 7, the risks of tanker transport in Canada’s Exclusive Economic Zone (EEZ), or an area bounded by a 200 nm limit off the BC coast (represented by red dashed line in Figure 3-11, above), are also examined.
3.1.5 Alternative Routes While transiting the CCAA there are a number viable alternative routes, in addition to those described above, available to tankers. Three alternative routes that have been considered are described below.
3.1.5.1 Whale Channel
Whale Channel is an alternative to Lewis Passage when approaching from Caamano Sound and is an alternative to part of Segment 6 and all of Segment 2 (see Figure 3-13).
The northern part of Whale Channel from Wright Sound to Shrub Point on Gil Island is deep and almost 3 nm wide. From Shrub Point to Molly Point on Gil Island the channel narrows to 1.8 nm before turning to the west between Molly Point and York Point on Gil Island.
The channel is narrower south of Gil Island where vessels navigate a shallow “S” curve through the southern part of Whale Channel off Molly Point, York Point and Ashdown Island. The bends in the channel require a total of 109 degrees of course change in one direction followed closely by 109 degrees in the other direction, with small distances between course changes. The channel is deep throughout with charted water depths greater than 90 metres and a minimum channel width of 0.8 nm.

MARINE SHIPPING QUANTITATIVE RISK ANALYSIS Technical Data Report Section 3: System Definition
Page 3-28 DRAFT 2010
Figure 3-13 Alternative route from Campania Sound to Wright Sound via Whale Channel,
bypassing part of Segment 6 and Segment 2
3.1.5.2 Cridge Passage An alternative to Lewis Passage is Cridge Passage on the north side of Fin Island (see Figure 3-14). This alternative is most likely to be used for tankers coming from Wright Sound via Otter Passage or vice versa. Cridge Passage at the narrowest point is about 0.8 nm wide compared to 1.2 nm for Lewis Passage. The minimum width of Cridge Passage is approximately the same as Otter Passage. There is adequate channel width for the tankers to complete necessary turns to the east or west of Cridge Passage.
Segment 2
Alternate Route
Segment 6
MARINE SHIPPING QUANTITATIVE RISK ANALYSIS Technical Data Report Section 3: System Definition
2010 DRAFT Page 3-29
Figure 3-14 South Routes and North Route alternative route from Squally Channel to Wright Sound via Cridge Passage bypassing part of Segment 2 (Lewis Passage).
3.1.5.3 Estevan Sound (South of Campania Island)
Estevan Sound is an alternative to transiting Otter Passage when approaching from Segment 3. Instead of turning into Otter Passage from Principe Channel tankers proceed to the intersection of Segments 6 and 7 (see Figure 3-15).
Estevan Sound is wide and, except for a shallow of 18 metres off Mt. Pender on Campania Island, the sound is straight and has no navigational hazards. Vessels approaching the south tip of Campania Island may be exposed to wind and waves coming in from Caamano Sound making navigation more difficult.
Segment 2
Alternate Route

MARINE SHIPPING QUANTITATIVE RISK ANALYSIS Technical Data Report Section 3: System Definition
Page 3-30 DRAFT 2010
Figure 3-15 Alternative route from Caamano Sound to Otter Channel via Estevan Sound
bypassing Segment 6.
3.2 Tanker Specifications TERMPOL 3.9 describes design specifications for tankers that will be accepted at the Kitimat Terminal. In the following section these designs are assessed by DNV with respect to key safety features. The features which have been assessed are:
• Hull and cargo tank components
• Navigational equipment
• Fire prevention and fire fighting
3.2.1 Hull and Cargo Tank Components The tankers specified in TERMPOL 3.9 will be of double hull construction. As per international guidelines, to which Canada is a party, single hull tankers will be phased out of service worldwide by the time the Project is operational. The most common outcome of a collision or grounding involving a double hull tanker is a breach of the outer hull and no breach of the inner hull that contains the liquid cargo.
TERMPOL 3.9 includes the three most common cargo tank arrangements found onboard tankers today. The arrangements vary in the number of tanks and in some arrangements the tanks extend the full width of the tanker (minus the ballast tanks).
Alternate Route
Segment 6
Segment 6
MARINE SHIPPING QUANTITATIVE RISK ANALYSIS Technical Data Report Section 3: System Definition
2010 DRAFT Page 3-31
DNV recommends that cargo tank arrangements extending the width of the tanker (minus the ballast tanks) should not be accepted. Tankers calling at the Kitimat Terminal should be equipped with tanks with at least one longitudinal bulkhead. A bulkhead increases the number of tanks and reduces the volume of cargo per tank and potential spill volume should the inner hull of a cargo tank be penetrated. Northern Gateway has indicated to DNV that it accepts this recommendation and will decline the nomination of tankers with cargo tank arrangements extending the width of the tanker. Tankers with longitudinal bulkheads are assumed in the consequence analysis that follows in Chapter 6.
3.2.2 Navigational Equipment A vessel registered in a country that has ratified the International Maritime Organisation’s (IMO) International Convention for Safety of Life at Sea (SOLAS) is fitted with the navigation equipment and systems required in SOLAS, Chapter V, Regulation 19, and will also satisfy the navigation bridge visibility requirements in Regulation 22. The SOLAS convention's general purpose is to ensure that a ship is fit for the service for which it is intended. TERMPOL 3.9 states that all tankers calling at the marine terminal must satisfy SOLAS requirements.
3.2.3 Fire Prevention and Fire Fighting As described in TERMPOL 3.9 tankers will be equipped with fire prevention and firefighting systems per international rules and regulations. All tankers operating around world must meet the same standard.
MARINE SHIPPING QUANTITATIVE RISK ANALYSIS Technical Data Report Section 3: System Definition
Page 3-32 DRAFT 2010
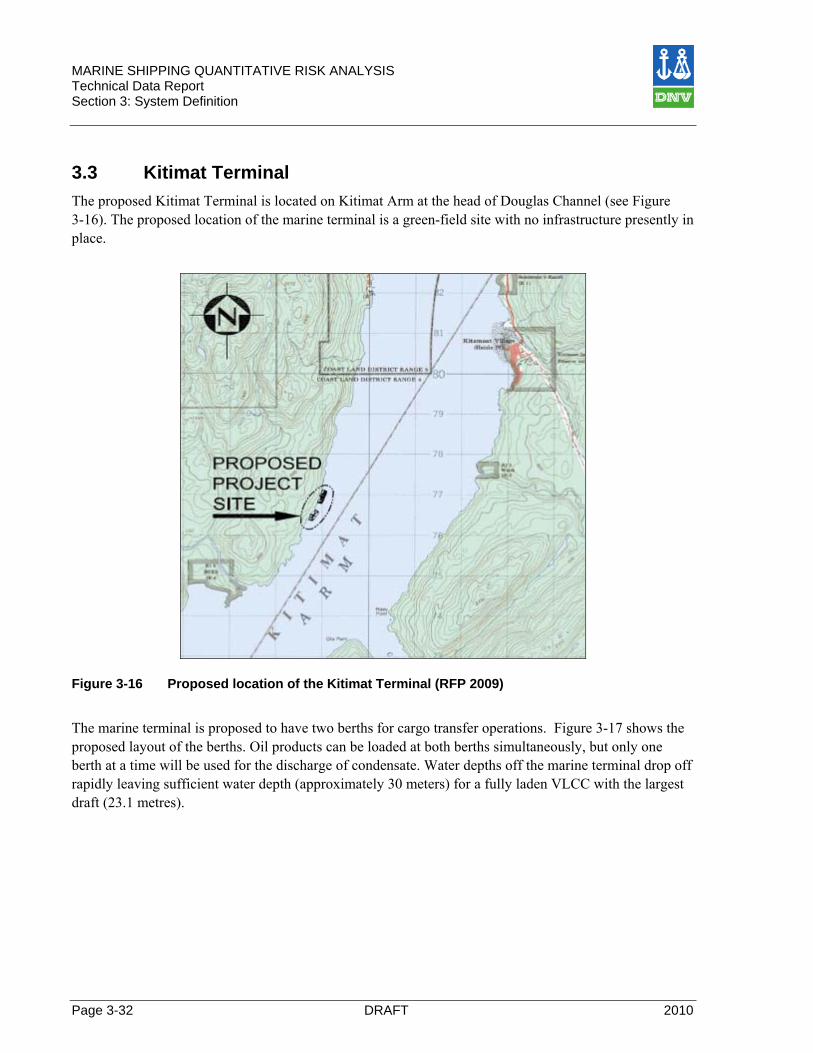
3.3 Kitimat Terminal The proposed Kitimat Terminal is located on Kitimat Arm at the head of Douglas Channel (see Figure 3-16). The proposed location of the marine terminal is a green-field site with no infrastructure presently in place.
Figure 3-16 Proposed location of the Kitimat Terminal (RFP 2009)
The marine terminal is proposed to have two berths for cargo transfer operations. Figure 3-17 shows the proposed layout of the berths. Oil products can be loaded at both berths simultaneously, but only one berth at a time will be used for the discharge of condensate. Water depths off the marine terminal drop off rapidly leaving sufficient water depth (approximately 30 meters) for a fully laden VLCC with the largest draft (23.1 metres).
MARINE SHIPPING QUANTITATIVE RISK ANALYSIS Technical Data Report Section 3: System Definition
2010 DRAFT Page 3-33
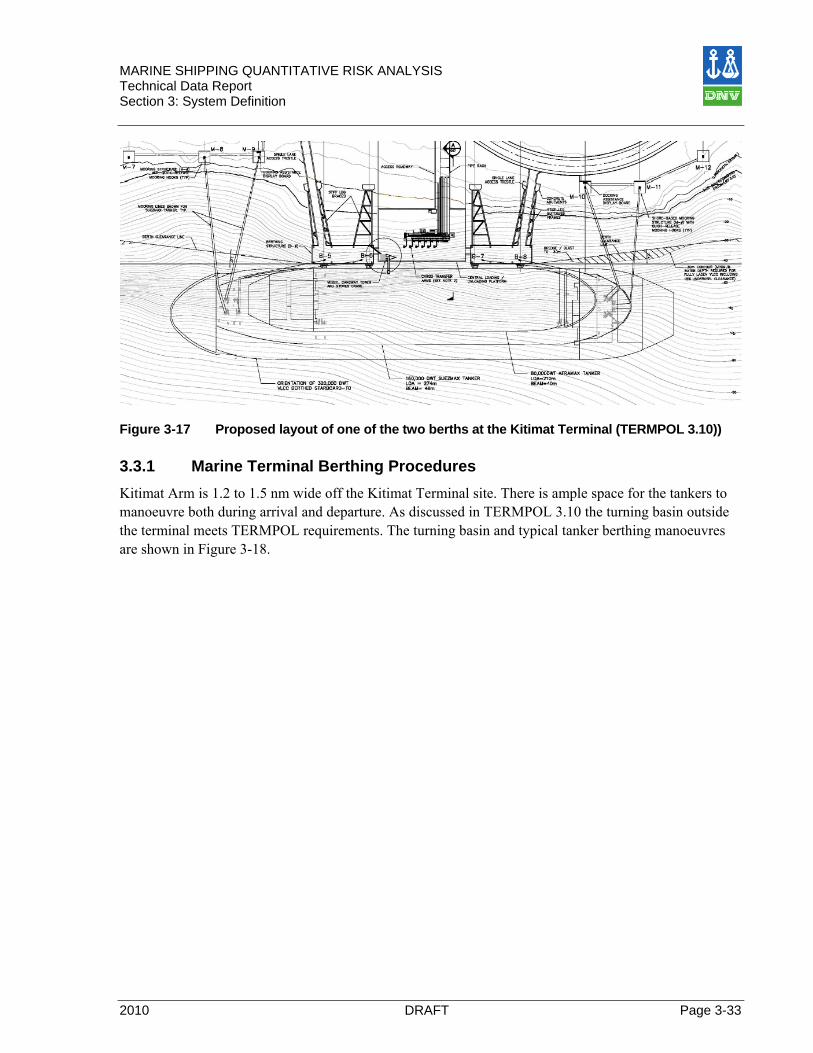
Figure 3-17 Proposed layout of one of the two berths at the Kitimat Terminal (TERMPOL 3.10))
3.3.1 Marine Terminal Berthing Procedures Kitimat Arm is 1.2 to 1.5 nm wide off the Kitimat Terminal site. There is ample space for the tankers to manoeuvre both during arrival and departure. As discussed in TERMPOL 3.10 the turning basin outside the terminal meets TERMPOL requirements. The turning basin and typical tanker berthing manoeuvres are shown in Figure 3-18.

MARINE SHIPPING QUANTITATIVE RISK ANALYSIS Technical Data Report Section 3: System Definition
Page 3-34 DRAFT 2010
Figure 3-18 Proposed Turning Basins, Navigational Clearances and Vessel Manoeuvres
(TERMPOL 3.10)
At very low speed, tankers of the proposed sizes have limited manoeuvrability and therefore need to be assisted during berthing and deberthing by tugs pushing directly on the tanker hull or pulling on lines fixed to the tanker deck. All tankers berthing and deberthing at the marine terminal will be assisted by 2 to 4 tugs to and from the berth.
As tankers berth alongside the loading / discharge platforms, mooring lines will be fixed from the tanker to moorings located on shore. Only after the vessel is moored to the satisfaction of the ships master will the tugs return to their standby moorage at the utility berth, north of the two tanker berths.
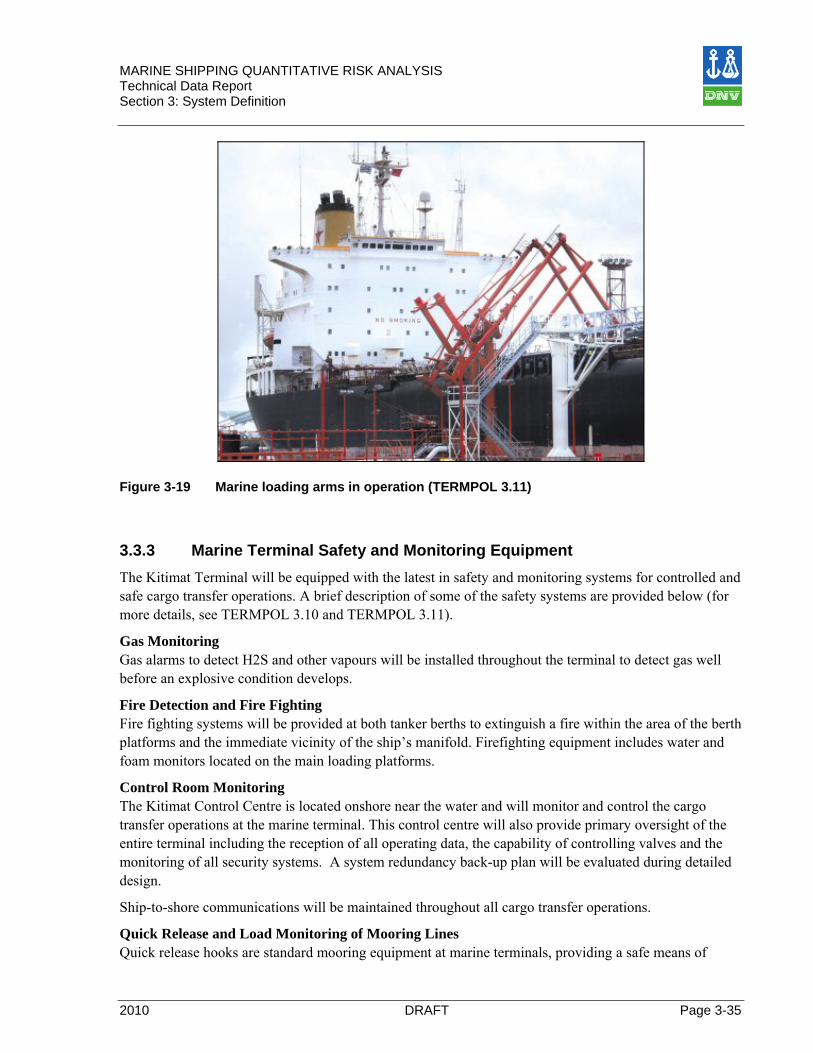
3.3.2 Terminal Cargo Transfer Equipment After tankers are securely moored and pre-cargo transfer meetings, tests and documentation are complete, cargo transfer operations will commence. Oil or condensate will be loaded or discharged respectively, using marine loading arms. Loading arms are special components of the cargo transfer system, designed to be connected to a manifold on the tanker deck. The arms are assembled from articulated pipe assemblies that can accommodate the movement of a moored ship. Loading arms have replaced hoses and are standard equipment at most marine liquid terminals around the world. A typical loading arm assembly is shown in Figure 3-19 below (TERMPOL 3.11).
MARINE SHIPPING QUANTITATIVE RISK ANALYSIS Technical Data Report Section 3: System Definition
2010 DRAFT Page 3-35
Figure 3-19 Marine loading arms in operation (TERMPOL 3.11)
3.3.3 Marine Terminal Safety and Monitoring Equipment The Kitimat Terminal will be equipped with the latest in safety and monitoring systems for controlled and safe cargo transfer operations. A brief description of some of the safety systems are provided below (for more details, see TERMPOL 3.10 and TERMPOL 3.11).
Gas Monitoring Gas alarms to detect H2S and other vapours will be installed throughout the terminal to detect gas well before an explosive condition develops.
Fire Detection and Fire Fighting Fire fighting systems will be provided at both tanker berths to extinguish a fire within the area of the berth platforms and the immediate vicinity of the ship’s manifold. Firefighting equipment includes water and foam monitors located on the main loading platforms.
Control Room Monitoring The Kitimat Control Centre is located onshore near the water and will monitor and control the cargo transfer operations at the marine terminal. This control centre will also provide primary oversight of the entire terminal including the reception of all operating data, the capability of controlling valves and the monitoring of all security systems. A system redundancy back-up plan will be evaluated during detailed design.
Ship-to-shore communications will be maintained throughout all cargo transfer operations.
Quick Release and Load Monitoring of Mooring Lines Quick release hooks are standard mooring equipment at marine terminals, providing a safe means of

MARINE SHIPPING QUANTITATIVE RISK ANALYSIS Technical Data Report Section 3: System Definition
Page 3-36 DRAFT 2010
securing a vessel alongside a berth, yet in an emergency situation can quickly release the mooring lines even if they are under load.
Mooring line load monitoring equipment will be installed at the marine terminal to measure the load on the mooring lines in real time and warn terminal operators if mooring loads are increasing to unsafe levels and tug boats can be readied for support.
Metocean Monitoring System Meteorological and oceanographic monitoring equipment will be installed at the Kitimat Terminal and at select points along all three routes. These sensors will provide real time data on wind speed, wind direction, barometric pressure, temperature, visibility, tidal changes, wave height, wave direction, current speed, and current direction.
The information gathered by the sensors will be used to guide decisions by tanker and terminal operations. Tankers will not transit to and from the marine terminal or may choose alternative routes during adverse weather or if adverse weather is forecast.
Docking Monitoring System The Kitimat Terminal will be equipped with a docking monitoring system to assist in docking and undocking tankers. This system provides feedback information to the pilot and ship’s crew in order to facilitate the safe berthing of the vessel.
The docking system assists pilots and terminal operators during the final 200 to 300 metres of the approach to the berth. Laser sensors measure the vessel’s approach speed, distance and angle with respect to the berth structures. The vessel’s distance and speed data are typically displayed on a large outdoor display board located on one of the berth structures. The data can also be transmitted and displayed to the pilots and ship personnel in real time via carry-on laptops or hand-held monitors.
The system improves the safety of the berthing operation by helping the pilot and ship’s crew manage the vessel’s speed and approach vectors and verify that the approach procedure is within the specified terminal limits.
The system can be designed to perform three major functions including:
• Monitoring the vessel as it approaches and is manoeuvred towards the berth;
• Monitoring the vessel’s approach immediately prior to docking as it makes contact with the fender(s); and,
• Monitoring the drift movements and position of the vessel while it is moored at the berth.
All sensor information is sent to the control centre for display and logging.
3.4 Weather Description The following section describes the weather in the area of the three proposed routes to and from the Kitimat Terminal, with a focus on the environmental aspects relevant to the QRA.
3.4.1 Waves, Wind and Current Table 3-6 below summarizes maximum and average wave height, wind speed, and surface current speed recorded at stations along the proposed routes and near the site for the Kitimat Terminal.
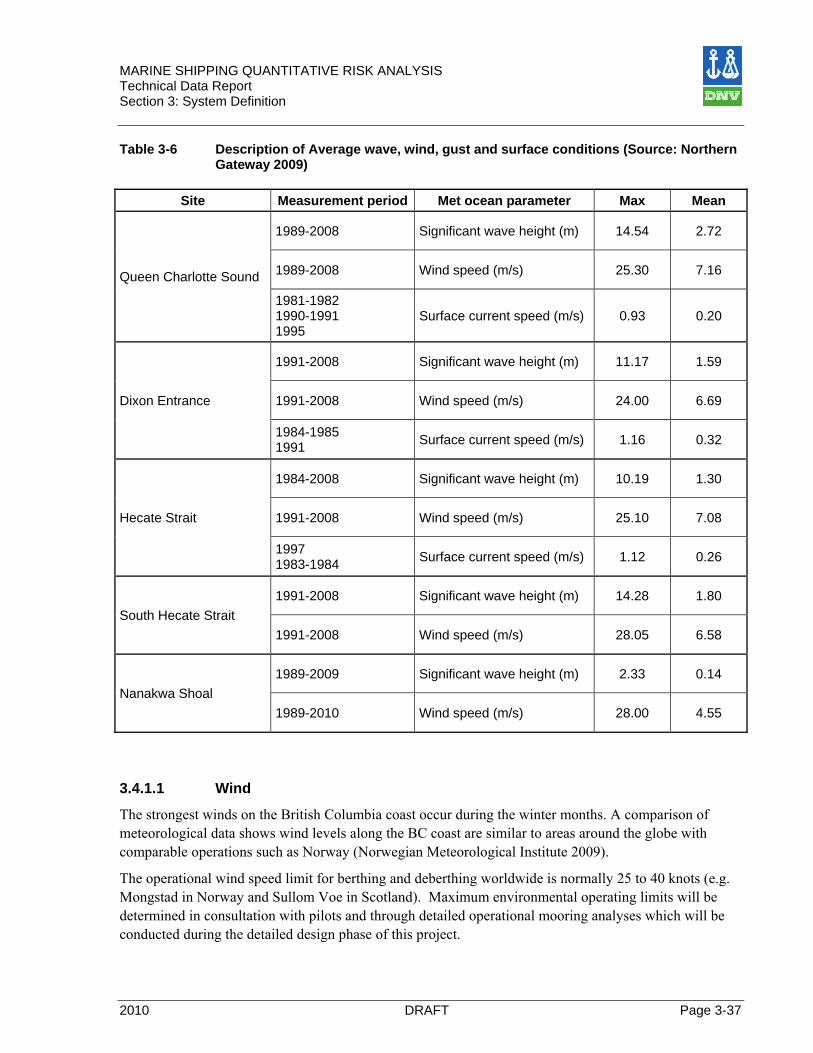
MARINE SHIPPING QUANTITATIVE RISK ANALYSIS Technical Data Report Section 3: System Definition
2010 DRAFT Page 3-37
Table 3-6 Description of Average wave, wind, gust and surface conditions (Source: Northern Gateway 2009)
Site Measurement period Met ocean parameter Max Mean
Queen Charlotte Sound
1989-2008 Significant wave height (m) 14.54 2.72
1989-2008 Wind speed (m/s) 25.30 7.16
1981-1982 1990-1991 1995
Surface current speed (m/s) 0.93 0.20
Dixon Entrance
1991-2008 Significant wave height (m) 11.17 1.59
1991-2008 Wind speed (m/s) 24.00 6.69
1984-1985 1991 Surface current speed (m/s) 1.16 0.32
Hecate Strait
1984-2008 Significant wave height (m) 10.19 1.30
1991-2008 Wind speed (m/s) 25.10 7.08
1997 1983-1984 Surface current speed (m/s) 1.12 0.26
South Hecate Strait 1991-2008 Significant wave height (m) 14.28 1.80
1991-2008 Wind speed (m/s) 28.05 6.58
Nanakwa Shoal 1989-2009 Significant wave height (m) 2.33 0.14
1989-2010 Wind speed (m/s) 28.00 4.55
3.4.1.1 Wind
The strongest winds on the British Columbia coast occur during the winter months. A comparison of meteorological data shows wind levels along the BC coast are similar to areas around the globe with comparable operations such as Norway (Norwegian Meteorological Institute 2009).
The operational wind speed limit for berthing and deberthing worldwide is normally 25 to 40 knots (e.g. Mongstad in Norway and Sullom Voe in Scotland). Maximum environmental operating limits will be determined in consultation with pilots and through detailed operational mooring analyses which will be conducted during the detailed design phase of this project.
MARINE SHIPPING QUANTITATIVE RISK ANALYSIS Technical Data Report Section 3: System Definition
Page 3-38 DRAFT 2010
Wind can delay navigation and disrupt cargo operations and increase the navigational risk of drifting due to wind. However, provided that operating limits are observed and tug boats are used, wind should not constitute an uncontrollable risk to tankers or operations at the Kitimat Terminal.
3.4.1.2 Waves
Table 3-6 shows significant wave heights for the waters along the proposed marine transportation routes. These wave heights are not seen to pose an uncontrollable risk to tanker operations. The classes of tankers proposed to call at the Kitimat Terminal, are constructed for world trade and regularly sail in areas with similar wave conditions. In addition weather stations and weather forecasts will provide early warning of weather conditions that may exceed maximum environmental operating conditions and enable scheduling of ship movements to avoid excessive conditions.
3.4.2 Currents Maximum surface currents of up to 1 m/s, or 2 knots are found throughout the routes to and from the Kitimat Terminal. In the CCAA the surface currents will predominately run in the longitudinal direction of the channels and do not pose a challenge to navigation.
As described in Chapter 5, wind and currents can make controlling an emergency situation more challenging. Currents have greater influence on laden tankers, compared to tankers in ballast, due to the larger draft, or portion of hull underwater, exposed to the current forces. The opposite is true for wind.
Surface currents are not assessed to constitute an increased risk to tanker operations compared to other areas in the world, such as terminals in western Norway. British Columbia Coast Pilots have intimate knowledge of the local currents and can safely guide tankers to and from the Kitimat Terminal.
3.4.2.1 Visibility
It is more difficult to judge the correctness of sound, distance, and movement with reduced visibility, which makes navigation more challenging. However, modern navigation technology including AIS, DGPS, ECDIS and radar alleviates these challenges. Generally visibilities lower than 1 nm (~1.85 km) are regarded as problematic for navigation and are reflected in the safety limitations for tanker and terminal operations. The visibility at locations near the proposed tanker routes is shown below in Table 3-7.

MARINE SHIPPING QUANTITATIVE RISK ANALYSIS Technical Data Report Section 3: System Definition
2010 DRAFT Page 3-39
Table 3-7 Visibility North Route (Source: ASL 2010)
Location Measurement period Percentage of time below
2 km visibility
Queen Charlotte Sound (Cape St James )
Jan – Mar 9.2% Apr – Jun 8.6% Jul – Sep 14.4% Oct – Dec 10.4
Queen Charlotte Sound (Cape Scott)
Jan – Mar 4.8% Apr – Jun 5.5% Jul – Sep 14.4% Oct – Dec 6.0
Dixon Entrance
Jan – Mar 2.6% Apr – Jun 1.7% Jul – Sep 6.7% Oct – Dec 2.4%
Hecate Strait 1 (Sandspit)
Jan – Mar 2.7% Apr – Jun 1.0% Jul – Sep 1.3% Oct – Dec 2.0%
Hecate Strait 2 (Bonilla Island)
Jan – Mar 3.4% Apr – Jun 2.5% Jul – Sep 8.2% Oct – Dec 5.3%
Hecate Strait 3 (Triple Islands)
Jan – Mar 1.8% Apr – Jun 1.5% Jul – Sep 5.8% Oct – Dec 1.3%
The operational limit for tanker manoeuvres will be in the range of 1 to 2 nm and will be defined during detailed design and the development of safe operating criteria with the involvement of pilots. May to August is the period with the poorest visibility. On average the visibility is less than the 1 nm for few hours at a time.
MARINE SHIPPING QUANTITATIVE RISK ANALYSIS Technical Data Report Section 4: Hazard Identification
Page 4-40 DRAFT 2010
4 Hazard Identification The following chapter describes the methodology and findings from the Hazard Identification (HAZID) process completed as part of the QRA. The HAZID involved the following steps:
• HAZID workshop
• Hazard evaluation of proposed route
• Meetings and discussion with local stakeholders
• Assessment of ship safety features
4.1 HAZID Workshop A HAZID workshop was held in Vancouver, British Columbia with local maritime experts to discuss local hazards and their influence on the risk to marine transportation to and from the Kitimat Terminal.
HAZID workshops are used to incorporate local knowledge into an assessment such as the one summarized in this report. The goals of the workshop include identification of credible hazards that may cause relevant marine incidents and a qualitative assessment of the frequency and consequences of relevant marine incidents. Results from the HAZID are used in Chapter 5 to estimate local scaling factors to be applied to worldwide incident frequencies.
4.1.1 Methodology A HAZID is a systematic, multidisciplinary, team-oriented exercise. It requires a group of experts to evaluate hazards, the likelihood of incidents occurring, and the probable consequences should an incident occur.
The HAZID first asked participants to identify credible causes of marine incidents based on local knowledge of weather, bathymetry, navigation routes, local aids to navigation and other infrastructure. The next step was to qualitatively assess the likelihood and probable consequence for each incident that could occur as the result of the hazards identified. The team was also asked to evaluate the adequacy of safeguards to prevent incidents from occurring or mitigate the consequences should an incident occur.
4.1.1.1 The HAZID Participants
The HAZID workshop took place in Vancouver, on April 27th 2009. A group of local experts, knowledgeable of all three proposed marine routes, was assembled. Members of the team had experience piloting and conning vessels to and from terminals in Kitimat and working on marine projects along the BC coast. DNV believes that the team assembled for the exercise comprised a significant body of knowledge of local risks and hazards. The team included:
• Brian Young Director Marine Operations, Pacific Pilotage Authority
• Al Ranger Pilot, British Columbia Coast Pilots (BCCP)
• Bob Lynch Pilot, BCCP
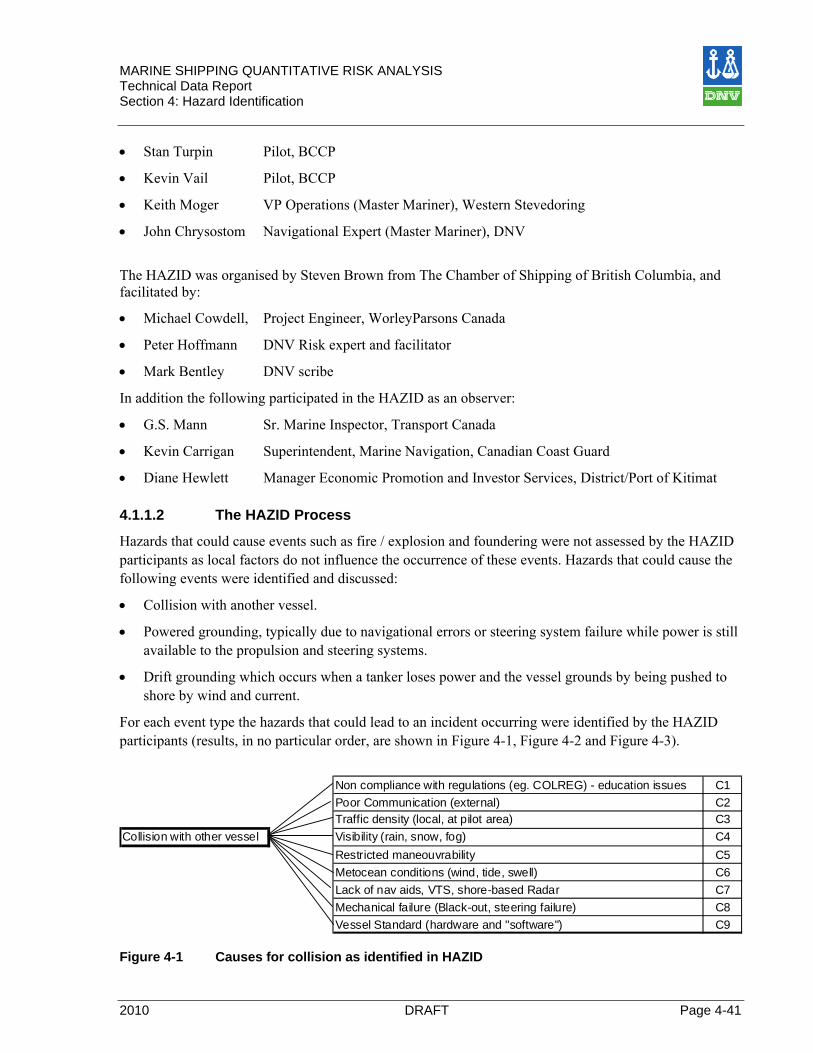
MARINE SHIPPING QUANTITATIVE RISK ANALYSIS Technical Data Report Section 4: Hazard Identification
2010 DRAFT Page 4-41
• Stan Turpin Pilot, BCCP
• Kevin Vail Pilot, BCCP
• Keith Moger VP Operations (Master Mariner), Western Stevedoring
• John Chrysostom Navigational Expert (Master Mariner), DNV
The HAZID was organised by Steven Brown from The Chamber of Shipping of British Columbia, and facilitated by:
• Michael Cowdell, Project Engineer, WorleyParsons Canada
• Peter Hoffmann DNV Risk expert and facilitator
• Mark Bentley DNV scribe
In addition the following participated in the HAZID as an observer:
• G.S. Mann Sr. Marine Inspector, Transport Canada
• Kevin Carrigan Superintendent, Marine Navigation, Canadian Coast Guard
• Diane Hewlett Manager Economic Promotion and Investor Services, District/Port of Kitimat
4.1.1.2 The HAZID Process
Hazards that could cause events such as fire / explosion and foundering were not assessed by the HAZID participants as local factors do not influence the occurrence of these events. Hazards that could cause the following events were identified and discussed:
• Collision with another vessel.
• Powered grounding, typically due to navigational errors or steering system failure while power is still available to the propulsion and steering systems.
• Drift grounding which occurs when a tanker loses power and the vessel grounds by being pushed to shore by wind and current.
For each event type the hazards that could lead to an incident occurring were identified by the HAZID participants (results, in no particular order, are shown in Figure 4-1, Figure 4-2 and Figure 4-3).
C1C2C3
Collision with other vessel C4C5C6
Lack of nav aids, VTS, shore-based Radar C7C8C9
Mechanical failure (Black-out, steering failure)
Metocean conditions (wind, tide, swell)
Traffic density (local, at pilot area)Visibility (rain, snow, fog)Restricted maneouvrability
Poor Communication (external)Non compliance with regulations (eg. COLREG) - education issues
Vessel Standard (hardware and "software") Figure 4-1 Causes for collision as identified in HAZID

MARINE SHIPPING QUANTITATIVE RISK ANALYSIS Technical Data Report Section 4: Hazard Identification
Page 4-42 DRAFT 2010
P1P2P3
Powered grounding P4P5P6
Visibility (rain, snow, fog)
Navigational error (human, GPS, ECDIS)
Lack of nav aids, VTS, shore-based Radar
Mechanical failure (steering)
Metocean conditions (wind, tide, swell)Poor Communication (internal)
Figure 4-2 Causes for powered grounding identified in HAZID
D1D2
Drifting grounding D3D4
Confined watersMetocean conditions (wind, tide, swell)Full Black-outME engine failure
Figure 4-3 Causes for drift grounding as identified in HAZID
The next step was to qualitatively assess the frequency and consequence of each hazard based on the scales in Table 4-1 and Table 4-2. This is a relative comparison of local factors, independent of global norms.
Table 4-1 Scale used for frequency assessment
Scale Frequency 1 Highly unlikely (less than once in 1000 operating years) 2 Unlikely (less than once in 100 operating years 3 Possible (once every 10 to 100 operating years) 4 Somewhat likely (once a year to once every 10 op. years) 5 Likely (Once or more in an average operating year)
Table 4-2 Scale used for consequence assessment
Scale Consequence 1 Minor (no to small damage / spill) 2 Slight (minor damage / small to medium spill) 3 Moderate (minor to major damage / medium spill) 4 Major (major damage / medium to large spill) 5 Catastrophic (total loss / large spill)
In order to perform the assessment the routes were divided into segments (See Figure 3-1). The routes were divided so that bathymetry, traffic and weather were relatively consistent along each segment. DNV has used this approach on similar projects. The approach enables discussion of the relative change in
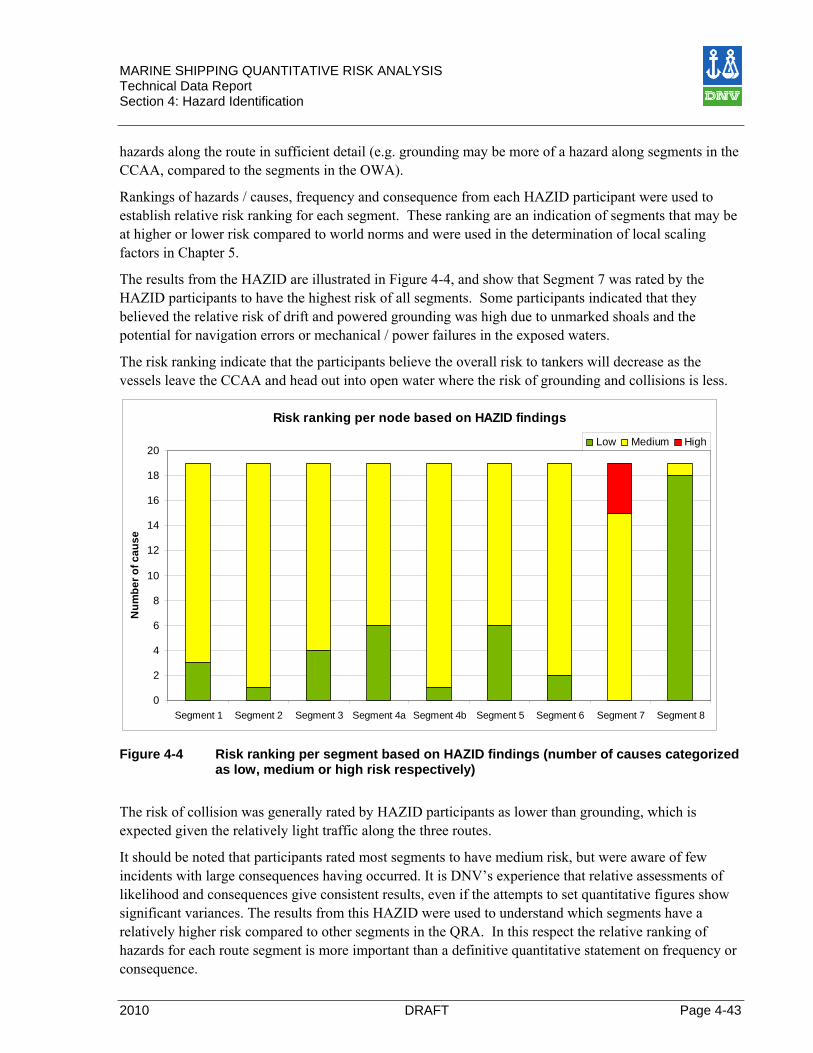
MARINE SHIPPING QUANTITATIVE RISK ANALYSIS Technical Data Report Section 4: Hazard Identification
2010 DRAFT Page 4-43
hazards along the route in sufficient detail (e.g. grounding may be more of a hazard along segments in the CCAA, compared to the segments in the OWA).
Rankings of hazards / causes, frequency and consequence from each HAZID participant were used to establish relative risk ranking for each segment. These ranking are an indication of segments that may be at higher or lower risk compared to world norms and were used in the determination of local scaling factors in Chapter 5.
The results from the HAZID are illustrated in Figure 4-4, and show that Segment 7 was rated by the HAZID participants to have the highest risk of all segments. Some participants indicated that they believed the relative risk of drift and powered grounding was high due to unmarked shoals and the potential for navigation errors or mechanical / power failures in the exposed waters.
The risk ranking indicate that the participants believe the overall risk to tankers will decrease as the vessels leave the CCAA and head out into open water where the risk of grounding and collisions is less.
Risk ranking per node based on HAZID findings
0
2
4
6
8
10
12
14
16
18
20
Segment 1 Segment 2 Segment 3 Segment 4a Segment 4b Segment 5 Segment 6 Segment 7 Segment 8
Num
ber o
f cau
se
Low Medium High
Figure 4-4 Risk ranking per segment based on HAZID findings (number of causes categorized
as low, medium or high risk respectively)
The risk of collision was generally rated by HAZID participants as lower than grounding, which is expected given the relatively light traffic along the three routes.
It should be noted that participants rated most segments to have medium risk, but were aware of few incidents with large consequences having occurred. It is DNV’s experience that relative assessments of likelihood and consequences give consistent results, even if the attempts to set quantitative figures show significant variances. The results from this HAZID were used to understand which segments have a relatively higher risk compared to other segments in the QRA. In this respect the relative ranking of hazards for each route segment is more important than a definitive quantitative statement on frequency or consequence.

MARINE SHIPPING QUANTITATIVE RISK ANALYSIS Technical Data Report Section 4: Hazard Identification
Page 4-44 DRAFT 2010
4.2 Hazard Evaluation of Routes by Navigational Expert The following persons boarded the high speed craft, Rain Coast Explorer, on April 29 2009, at Prince Rupert to view portions of the North and South Routes to Kitimat.
1. Michael Cowdell, (Project Engineer, WorleyParsons Canada) 2. Peter Hoffmann (Senior Consultant, DNV Norway) 3. Mark Bentley (Station Manager, DNV Vancouver) 4. Capt. John Chrysostom (Navigation Expert, DNV Miami)
The purpose of this trip was to provide DNV with an opportunity to view, firsthand, sections of the North and South Routes. DNV was able to view portions of the routes with less width and more complex navigation in the CCAA. DNV was also able view areas such as Wright Sound where relatively more traffic may lead to a higher risk of collision.
The trip started in Prince Rupert and followed the east side of Porcher Island, Beaver Passage, Principe Channel, Estevan Sound, Caamano Sound, Campania Sound, Squally Channel, Lewis Passage, Wright Sound, Douglas Channel and Kitimat Arm arriving at a marina south of Kitimat (see Figure 4-5). Weather on the day of the trip was sunny and clear with light seas over most of the route with some outflow winds and waves experienced crossing Nepean Sound past Otter Channel.
Key personnel from DNV also participated on a second boat trip from Prince Rupert to Kitimat on June 17, 2009.
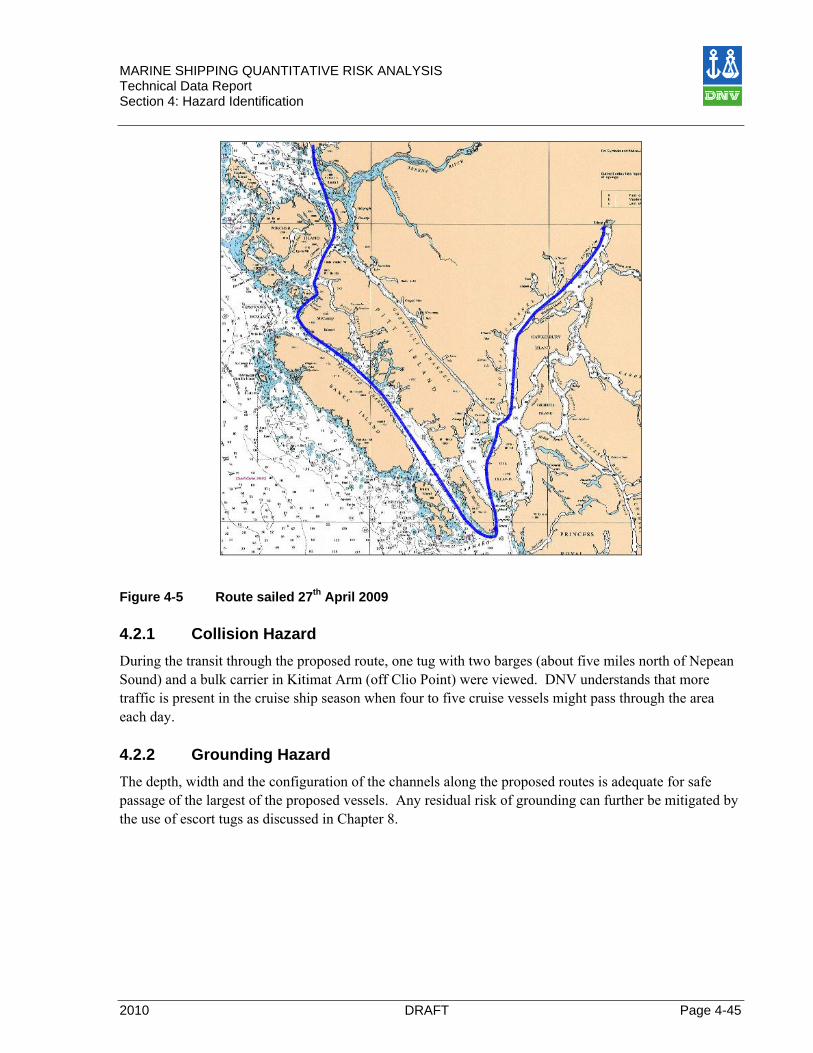
MARINE SHIPPING QUANTITATIVE RISK ANALYSIS Technical Data Report Section 4: Hazard Identification
2010 DRAFT Page 4-45
Figure 4-5 Route sailed 27th April 2009
4.2.1 Collision Hazard During the transit through the proposed route, one tug with two barges (about five miles north of Nepean Sound) and a bulk carrier in Kitimat Arm (off Clio Point) were viewed. DNV understands that more traffic is present in the cruise ship season when four to five cruise vessels might pass through the area each day.
4.2.2 Grounding Hazard The depth, width and the configuration of the channels along the proposed routes is adequate for safe passage of the largest of the proposed vessels. Any residual risk of grounding can further be mitigated by the use of escort tugs as discussed in Chapter 8.

MARINE SHIPPING QUANTITATIVE RISK ANALYSIS Technical Data Report Section 4: Hazard Identification
Page 4-46 DRAFT 2010
4.3 Local Meetings and Interviews In addition to the tour of the shipping route on April 29, 2009 and the HAZID held April 27, a number of interviews with local stakeholders were held in Prince Rupert (April 28, 2009), Kitimat (April 30, 2009) and Vancouver (May 1, 2009). Local stakeholders included:
• tour boat operators (Prince Rupert & Kitimat)
• logging contractors running barges to / from logging sites (Kitimat)
• sports fishermen (Kitimat)
• environmental groups (Kitimat)
• terminal operators (Kitimat)
• tug and barge operator (Vancouver)
The discussions related to the proposed shipping routes and whether there were any local hazards or conditions that should be incorporated into the QRA. Participants were mostly familiar with the inner CCAA, not the open waters of Hecate Strait, Queen Charlotte Sound and Dixon Entrance. The main topics of discussion related to:
• Exceptional weather conditions (e.g. wind, fog & currents) along the route
• Areas of increased traffic
• Areas of difficult navigation
The consensus from meeting participants was that there are no conditions along the proposed shipping routes that pose an unmanageable risk to safe marine navigation or berthing.
• Concern was expressed over the possibility of collisions between tankers and local fishing or recreational vessels. It was widely acknowledged that while a concern to the safety of smaller vessel and the environment, the risk to the tankers in such an event was minimal.
• Little concern was expressed over increases in traffic, with most meeting participants citing the excellent safety record of the BC Coast Pilots in guiding ships to and from Kitimat.
• Weather was generally not seen as a problem. Some concern was expressed with respect to heavy snow in winter that can hamper radar visibility. This level of snowfall was generally short in duration and forecast in advance.
• In Douglas Channel and some side channels strong in and out-flow winds occur. Because winds run parallel to the channels and the ship’s bow or stern, the winds seldom pose a risk to navigation, but may modify a vessels progress.
• With respect to grounding risk, no “hidden” rocks or shoals were identified as a concern. The channels are steep and the water depth quickly becomes deep enough for a tanker to pass over with adequate under keel clearance.
MARINE SHIPPING QUANTITATIVE RISK ANALYSIS Technical Data Report Section 4: Hazard Identification
2010 DRAFT Page 4-47
• Some participants noted that the current communications infrastructure in some areas, including Douglas Channel, could be improved and that radio communication and GPS sometime do not work near the steep mountains that rise from the channels.
4.4 Conclusion The overall conclusion from the hazard identification process was that the hazards presented appear manageable, particularly when the risk mitigation systems discussed in Chapter 8 are taken into account. No hazards were discovered that would indicate that the area of the British Columbia examined is more challenging than other areas of the world with similar marine terminal and tanker operations.
In general, the CCAA was regarded as having a medium risk by HAZID participants, notably Segment 7 through Caamano Sound. The approach channels will have a relatively higher risk of grounding compared to the segments in open water.
Through the hazard identification a few risk reducing measures were identified for consideration by Northern Gateway:
• use of escort tugs
• installation of enhanced navigational aids and VTS along the routes
• requirement for ECDIS on all tankers
• only accepting tankers with a longitudinal cargo tank bulkhead
The findings from this review are incorporated into the scaling of the event frequencies in Chapter 5 and risk mitigation measures that are discussed in Chapter 8.

MARINE SHIPPING QUANTITATIVE RISK ANALYSIS Technical Data Report Section 5: Frequency Assessment
2010 DRAFT Page 5-49
5 Frequency Assessment In the following chapter the frequencies of incidents occurring both globally and locally are discussed. The frequency assessment has been divided into two parts:
• Frequencies of incidents occurring during passage to and from the marine terminal
• Frequencies of incidents occurring at the marine terminal
5.1 Incidents during Transit to and from the Kitimat Terminal Based on the findings from Chapter 4, the following four incident types have been identified as potential hazards to tankers transiting between the open ocean and the Kitimat Terminal in Canadian waters:
• Grounding (powered grounding and drift grounding)
• Collision
• Foundering
• Fire and/or explosion
Chapter 5 estimates the unmitigated frequency at which each incident type may occur along the route segments shown in Figure 3-1. Frequencies calculated in this chapter are based on global incident frequencies that are scaled to local conditions. Risk mitigation measures that reduce the frequencies of events occurring are analysed in Chapter 8.
5.1.1 Vessel Incident Frequency Data Frequencies for incidents that may occur during transit to and from the terminal are based on data from the Lloyds Register Fairplay (LRFP) marine casualty database. LRFP is generally considered to be the most comprehensive casualty databases in the world, recording incidents since 1978.
LRFP data from the period 1990 to 2006 are used in this QRA to establish incident frequencies, since the type of vessels in operation and the incidents that have occurred after 1990 are considered to be more representative of modern tanker operations, such as the one planned by Northern Gateway. Incidents involving tankers exceeding 10,000 dwt are included.
As discussed, few incidents involving cargo vessels over 10,000 dwt have occurred off the BC coast and statistically valid tanker incident frequencies could not be developed based on local records. Therefore, international statistics from LRFP are qualitatively scaled to estimate incident frequencies on the BC coast. The process of developing the appropriate scaling factors is discussed in Chapters 5.1.3 to 5.1.6, below.
The incident frequencies derived from the LRFP data are considered to be valid for all three tanker classes forecast to call at the Kitimat Terminal. Tanker incident frequencies are influenced more by the specific shipping route, than the type of tanker. The materials and equipment as well as hull and tank configurations do not vary significantly between classes.
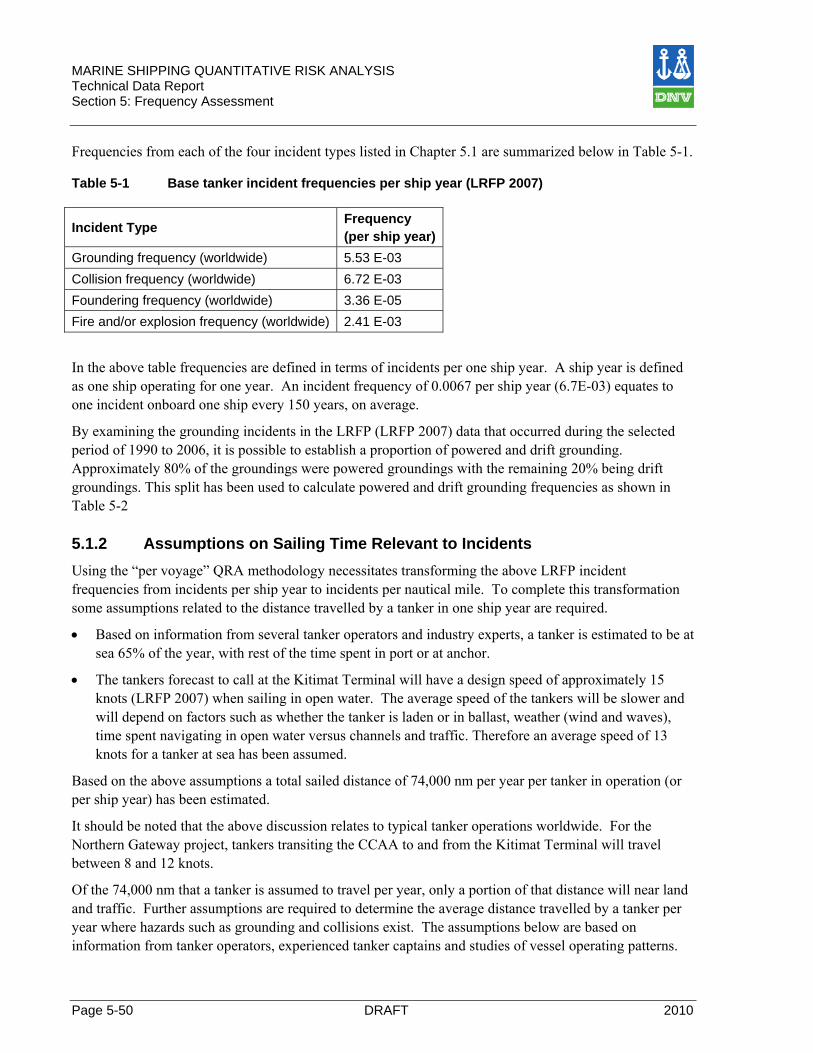
MARINE SHIPPING QUANTITATIVE RISK ANALYSIS Technical Data Report Section 5: Frequency Assessment
Page 5-50 DRAFT 2010
Frequencies from each of the four incident types listed in Chapter 5.1 are summarized below in Table 5-1. Table 5-1 Base tanker incident frequencies per ship year (LRFP 2007)
Incident Type Frequency (per ship year)
Grounding frequency (worldwide) 5.53 E-03 Collision frequency (worldwide) 6.72 E-03 Foundering frequency (worldwide) 3.36 E-05 Fire and/or explosion frequency (worldwide) 2.41 E-03
In the above table frequencies are defined in terms of incidents per one ship year. A ship year is defined as one ship operating for one year. An incident frequency of 0.0067 per ship year (6.7E-03) equates to one incident onboard one ship every 150 years, on average.
By examining the grounding incidents in the LRFP (LRFP 2007) data that occurred during the selected period of 1990 to 2006, it is possible to establish a proportion of powered and drift grounding. Approximately 80% of the groundings were powered groundings with the remaining 20% being drift groundings. This split has been used to calculate powered and drift grounding frequencies as shown in Table 5-2
5.1.2 Assumptions on Sailing Time Relevant to Incidents Using the “per voyage” QRA methodology necessitates transforming the above LRFP incident frequencies from incidents per ship year to incidents per nautical mile. To complete this transformation some assumptions related to the distance travelled by a tanker in one ship year are required.
• Based on information from several tanker operators and industry experts, a tanker is estimated to be at sea 65% of the year, with rest of the time spent in port or at anchor.
• The tankers forecast to call at the Kitimat Terminal will have a design speed of approximately 15 knots (LRFP 2007) when sailing in open water. The average speed of the tankers will be slower and will depend on factors such as whether the tanker is laden or in ballast, weather (wind and waves), time spent navigating in open water versus channels and traffic. Therefore an average speed of 13 knots for a tanker at sea has been assumed.
Based on the above assumptions a total sailed distance of 74,000 nm per year per tanker in operation (or per ship year) has been estimated.
It should be noted that the above discussion relates to typical tanker operations worldwide. For the Northern Gateway project, tankers transiting the CCAA to and from the Kitimat Terminal will travel between 8 and 12 knots.
Of the 74,000 nm that a tanker is assumed to travel per year, only a portion of that distance will near land and traffic. Further assumptions are required to determine the average distance travelled by a tanker per year where hazards such as grounding and collisions exist. The assumptions below are based on information from tanker operators, experienced tanker captains and studies of vessel operating patterns.
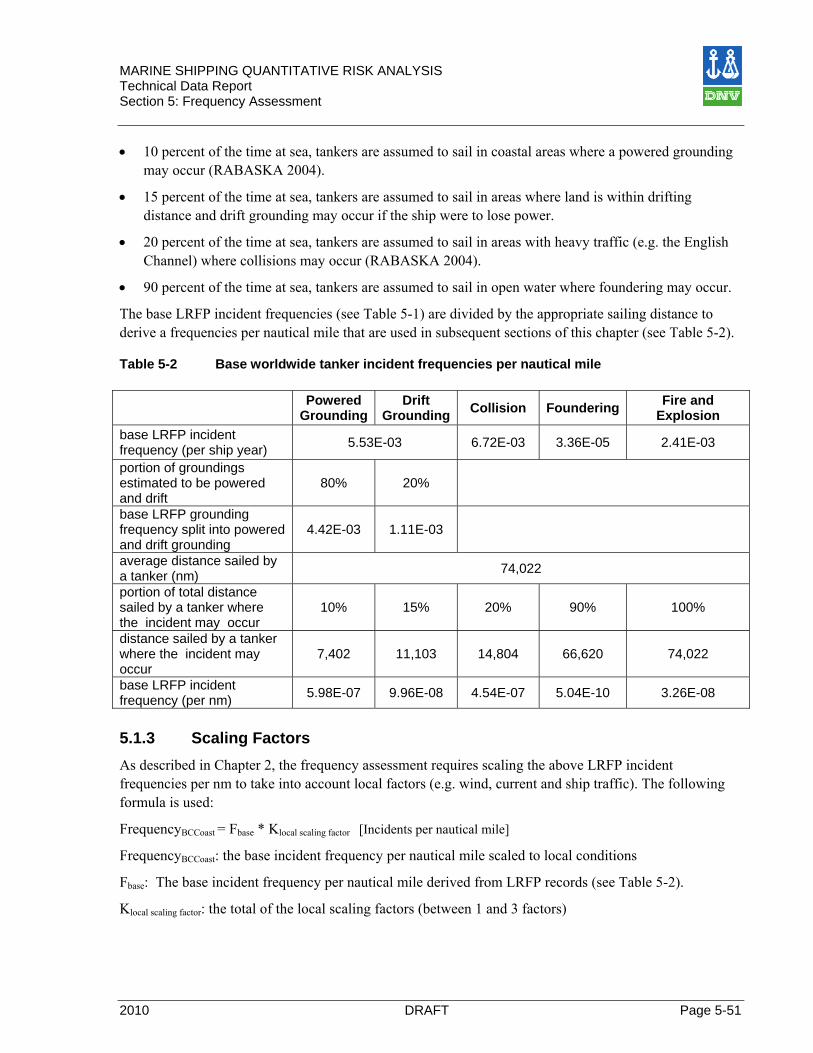
MARINE SHIPPING QUANTITATIVE RISK ANALYSIS Technical Data Report Section 5: Frequency Assessment
2010 DRAFT Page 5-51
• 10 percent of the time at sea, tankers are assumed to sail in coastal areas where a powered grounding may occur (RABASKA 2004).
• 15 percent of the time at sea, tankers are assumed to sail in areas where land is within drifting distance and drift grounding may occur if the ship were to lose power.
• 20 percent of the time at sea, tankers are assumed to sail in areas with heavy traffic (e.g. the English Channel) where collisions may occur (RABASKA 2004).
• 90 percent of the time at sea, tankers are assumed to sail in open water where foundering may occur.
The base LRFP incident frequencies (see Table 5-1) are divided by the appropriate sailing distance to derive a frequencies per nautical mile that are used in subsequent sections of this chapter (see Table 5-2). Table 5-2 Base worldwide tanker incident frequencies per nautical mile
Powered
GroundingDrift
Grounding Collision Foundering Fire and Explosion
base LRFP incident frequency (per ship year) 5.53E-03 6.72E-03 3.36E-05 2.41E-03
portion of groundings estimated to be powered and drift
80% 20%
base LRFP grounding frequency split into powered and drift grounding
4.42E-03 1.11E-03
average distance sailed by a tanker (nm) 74,022
portion of total distance sailed by a tanker where the incident may occur
10% 15% 20% 90% 100%
distance sailed by a tanker where the incident may occur
7,402 11,103 14,804 66,620 74,022
base LRFP incident frequency (per nm) 5.98E-07 9.96E-08 4.54E-07 5.04E-10 3.26E-08
5.1.3 Scaling Factors As described in Chapter 2, the frequency assessment requires scaling the above LRFP incident frequencies per nm to take into account local factors (e.g. wind, current and ship traffic). The following formula is used:
FrequencyBCCoast = Fbase * Klocal scaling factor [Incidents per nautical mile]
FrequencyBCCoast: the base incident frequency per nautical mile scaled to local conditions
Fbase: The base incident frequency per nautical mile derived from LRFP records (see Table 5-2).
Klocal scaling factor: the total of the local scaling factors (between 1 and 3 factors)
MARINE SHIPPING QUANTITATIVE RISK ANALYSIS Technical Data Report Section 5: Frequency Assessment
Page 5-52 DRAFT 2010
A total scaling factor equal to 1.0 suggests that the frequency of local events is predicted to be equal to the world average.
As little data from shipping incidents involving vessels of relevant size was available for the BC coast, some qualitative assessments were required to determine the appropriate scaling factors. After the initial scaling factors were established based on the steps described in Chapter 4, a peer review was conducted to validate the findings. The workshop took place at Høvik, Norway on 19th May 2009 and included the following experts with extensive experience in marine risk assessments, tanker operations, and global navigation:
• Dr. Torkel Soma Human factors and risk expert
• Audun Brandsæter Risk expert
• Ole Vidar Nilsen Navigational and risk expert
• Viktor Friberg Scribe
• Peter Hoffmann Facilitator
All scaling factors are summarized in Table 5-3, below, and are discussed in detail throughout this chapter. It should be noted that there are two sets of Kmeasures and Knavigational difficulty. The first set (Table 5-5 and Table 5-6) pertain to powered groundings. The second set pertains to collisions. The two sets are not intended to match each other.
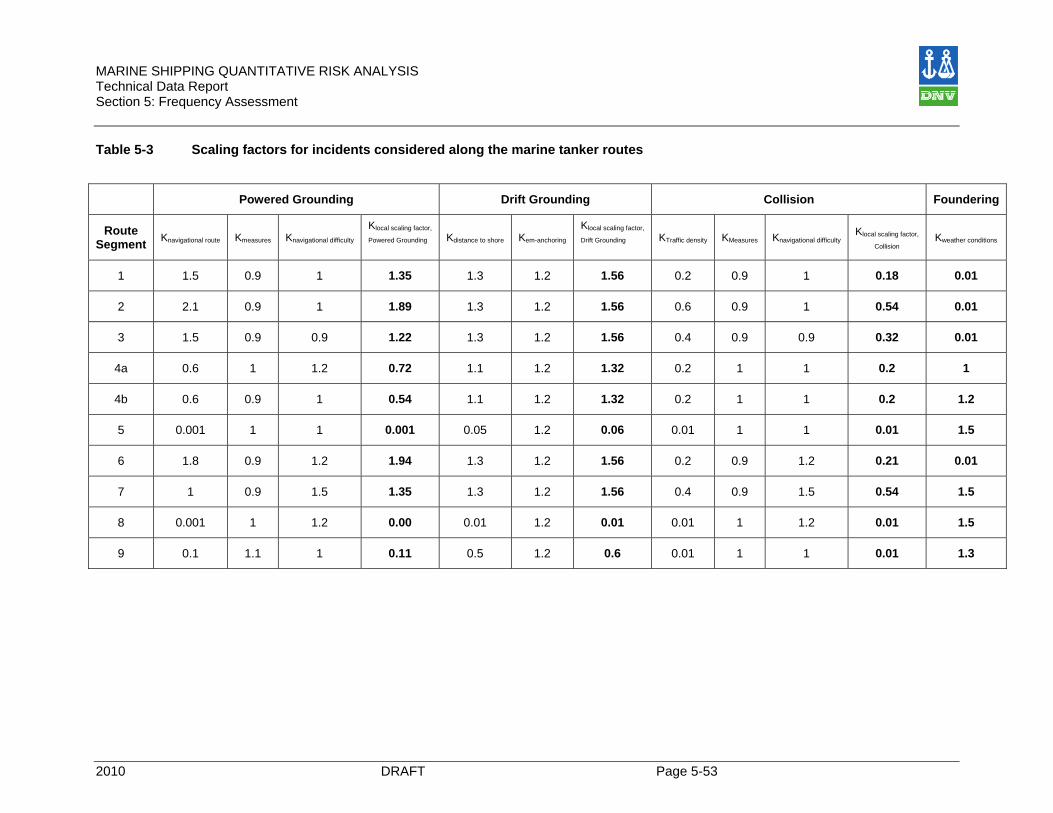
MARINE SHIPPING QUANTITATIVE RISK ANALYSIS Technical Data Report Section 5: Frequency Assessment
2010 DRAFT Page 5-53
Table 5-3 Scaling factors for incidents considered along the marine tanker routes
Powered Grounding Drift Grounding Collision Foundering
Route Segment Knavigational route Kmeasures Knavigational difficulty
Klocal scaling factor,
Powered Grounding
Kdistance to shore Kem-anchoring Klocal scaling factor,
Drift Grounding
KTraffic density KMeasures Knavigational difficulty Klocal scaling factor,
Collision Kweather conditions
1 1.5 0.9 1 1.35 1.3 1.2 1.56 0.2 0.9 1 0.18 0.01
2 2.1 0.9 1 1.89 1.3 1.2 1.56 0.6 0.9 1 0.54 0.01
3 1.5 0.9 0.9 1.22 1.3 1.2 1.56 0.4 0.9 0.9 0.32 0.01
4a 0.6 1 1.2 0.72 1.1 1.2 1.32 0.2 1 1 0.2 1
4b 0.6 0.9 1 0.54 1.1 1.2 1.32 0.2 1 1 0.2 1.2
5 0.001 1 1 0.001 0.05 1.2 0.06 0.01 1 1 0.01 1.5
6 1.8 0.9 1.2 1.94 1.3 1.2 1.56 0.2 0.9 1.2 0.21 0.01
7 1 0.9 1.5 1.35 1.3 1.2 1.56 0.4 0.9 1.5 0.54 1.5
8 0.001 1 1.2 0.00 0.01 1.2 0.01 0.01 1 1.2 0.01 1.5
9 0.1 1.1 1 0.11 0.5 1.2 0.6 0.01 1 1 0.01 1.3

MARINE SHIPPING QUANTITATIVE RISK ANALYSIS Technical Data Report Section 5: Frequency Assessment
Page 5-54 DRAFT 2010
“Overall scaling factors” have been estimated to be 1.31 for powered grounding, 1.48 for drift grounding and 0.31 for collisions. Therefore, without mitigation measures in place, the frequencies per nm of powered and drift groundings are estimated to be higher than the world average and the frequency per nm of collisions less than the world average.
With mitigation measures in place, as described in Chapter 8, the “overall scaling factors” for powered grounding, drift grounding and collisions are each estimated to be approximately 0.3. Therefore the mitigated frequencies of powered grounding, drift grounding and collisions are estimated to be about one third of the world average.
5.1.4 Grounding The probability for grounding varies across the west coast of British Columbia. The HAZID identified some areas of concern or “increased risk areas” with respect to grounding probability (see Chapter 4). The following sections assess scaling factors for powered and drift grounding for each of the ten segments shown in Figure 3-1. The total drift and powered grounding frequencies from Table 5-2 are multiplied by the total scaling factors from Table 5-7 to derive a local, unmitigated, incident frequency.
5.1.4.1 Powered Grounding
Powered grounding refers to when a ship with functioning mechanical and navigation equipment runs aground. This type of grounding is usually due to a navigator’s inability to follow the correct course or correct a steering malfunction. The reasons may include misjudgement, lack of attention (situational awareness) or the navigator’s condition (illness, intoxication, etc.).
The powered grounding frequency is adjusted with respect to the navigational route (number of course changes, distance to shore), operational measures (pilot) and navigational difficulty (visibility, markings, currents, traffic disturbance). The calculation is as shown in the formula below.
Fgrounding-segment x = Fbase * Knavigational route * Kmeasures * Knavigational difficulty Knavigational route:
Knavigational route equals the world average of 1.0 in coastal areas where the distance to shore or shallow water is approximately 4 nm, and with very few critical course changes.
Knavigational route represents the influence that the number of course changes has on powered grounding. Many course changes over a small distance with little time to detect that a change has failed before the vessel may reach shallow water or shore will increase the grounding frequency.
Table 5-4 shows that the risk of powered grounding is higher in narrow areas with more course changes. Therefore values above 1.0 have been chosen for the segments in the CCAA, while values below 1.0 have been assigned to the areas in open water.
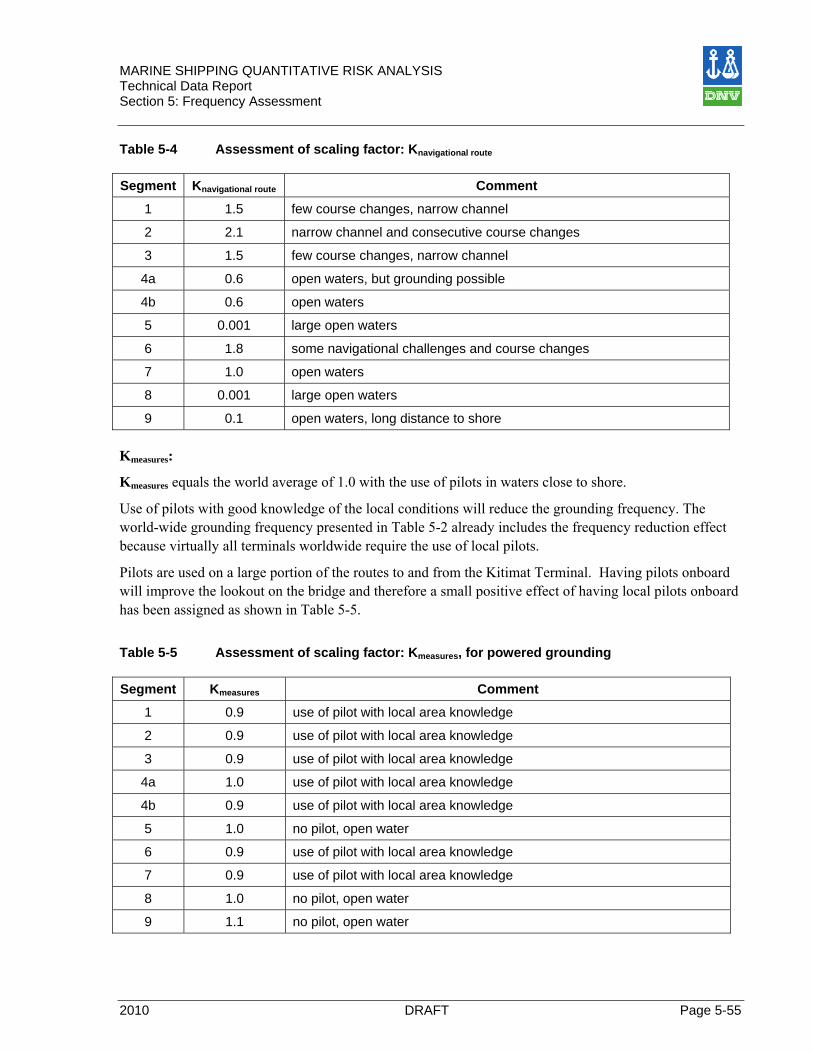
MARINE SHIPPING QUANTITATIVE RISK ANALYSIS Technical Data Report Section 5: Frequency Assessment
2010 DRAFT Page 5-55
Table 5-4 Assessment of scaling factor: Knavigational route Segment Knavigational route Comment
1 1.5 few course changes, narrow channel
2 2.1 narrow channel and consecutive course changes
3 1.5 few course changes, narrow channel
4a 0.6 open waters, but grounding possible
4b 0.6 open waters
5 0.001 large open waters
6 1.8 some navigational challenges and course changes
7 1.0 open waters
8 0.001 large open waters
9 0.1 open waters, long distance to shore Kmeasures:
Kmeasures equals the world average of 1.0 with the use of pilots in waters close to shore.
Use of pilots with good knowledge of the local conditions will reduce the grounding frequency. The world-wide grounding frequency presented in Table 5-2 already includes the frequency reduction effect because virtually all terminals worldwide require the use of local pilots.
Pilots are used on a large portion of the routes to and from the Kitimat Terminal. Having pilots onboard will improve the lookout on the bridge and therefore a small positive effect of having local pilots onboard has been assigned as shown in Table 5-5.
Table 5-5 Assessment of scaling factor: Kmeasures, for powered grounding Segment Kmeasures Comment
1 0.9 use of pilot with local area knowledge
2 0.9 use of pilot with local area knowledge
3 0.9 use of pilot with local area knowledge
4a 1.0 use of pilot with local area knowledge
4b 0.9 use of pilot with local area knowledge
5 1.0 no pilot, open water
6 0.9 use of pilot with local area knowledge
7 0.9 use of pilot with local area knowledge
8 1.0 no pilot, open water
9 1.1 no pilot, open water
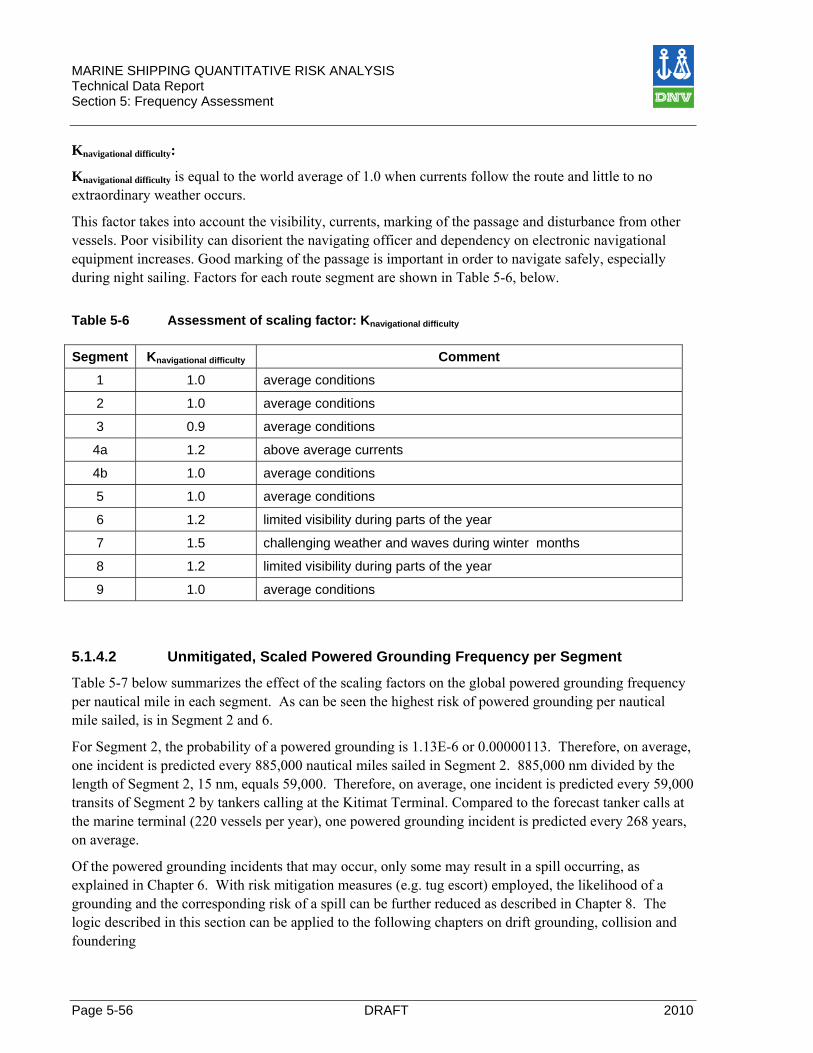
MARINE SHIPPING QUANTITATIVE RISK ANALYSIS Technical Data Report Section 5: Frequency Assessment
Page 5-56 DRAFT 2010
Knavigational difficulty:
Knavigational difficulty is equal to the world average of 1.0 when currents follow the route and little to no extraordinary weather occurs.
This factor takes into account the visibility, currents, marking of the passage and disturbance from other vessels. Poor visibility can disorient the navigating officer and dependency on electronic navigational equipment increases. Good marking of the passage is important in order to navigate safely, especially during night sailing. Factors for each route segment are shown in Table 5-6, below.
Table 5-6 Assessment of scaling factor: Knavigational difficulty Segment Knavigational difficulty Comment
1 1.0 average conditions
2 1.0 average conditions
3 0.9 average conditions
4a 1.2 above average currents
4b 1.0 average conditions
5 1.0 average conditions
6 1.2 limited visibility during parts of the year
7 1.5 challenging weather and waves during winter months
8 1.2 limited visibility during parts of the year
9 1.0 average conditions
5.1.4.2 Unmitigated, Scaled Powered Grounding Frequency per Segment
Table 5-7 below summarizes the effect of the scaling factors on the global powered grounding frequency per nautical mile in each segment. As can be seen the highest risk of powered grounding per nautical mile sailed, is in Segment 2 and 6.
For Segment 2, the probability of a powered grounding is 1.13E-6 or 0.00000113. Therefore, on average, one incident is predicted every 885,000 nautical miles sailed in Segment 2. 885,000 nm divided by the length of Segment 2, 15 nm, equals 59,000. Therefore, on average, one incident is predicted every 59,000 transits of Segment 2 by tankers calling at the Kitimat Terminal. Compared to the forecast tanker calls at the marine terminal (220 vessels per year), one powered grounding incident is predicted every 268 years, on average.
Of the powered grounding incidents that may occur, only some may result in a spill occurring, as explained in Chapter 6. With risk mitigation measures (e.g. tug escort) employed, the likelihood of a grounding and the corresponding risk of a spill can be further reduced as described in Chapter 8. The logic described in this section can be applied to the following chapters on drift grounding, collision and foundering
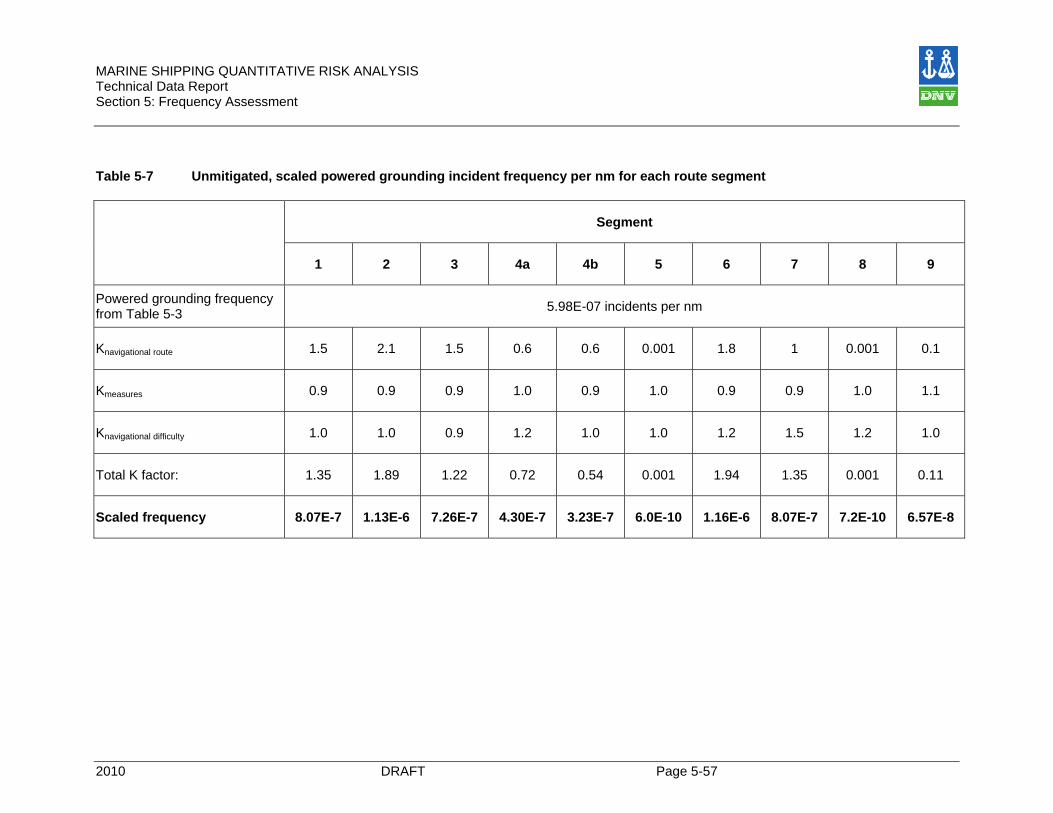
MARINE SHIPPING QUANTITATIVE RISK ANALYSIS Technical Data Report Section 5: Frequency Assessment
2010 DRAFT Page 5-57
Table 5-7 Unmitigated, scaled powered grounding incident frequency per nm for each route segment
Segment
1 2 3 4a 4b 5 6 7 8 9
Powered grounding frequency from Table 5-3 5.98E-07 incidents per nm
Knavigational route 1.5 2.1 1.5 0.6 0.6 0.001 1.8 1 0.001 0.1
Kmeasures 0.9 0.9 0.9 1.0 0.9 1.0 0.9 0.9 1.0 1.1
Knavigational difficulty 1.0 1.0 0.9 1.2 1.0 1.0 1.2 1.5 1.2 1.0
Total K factor: 1.35 1.89 1.22 0.72 0.54 0.001 1.94 1.35 0.001 0.11
Scaled frequency 8.07E-7 1.13E-6 7.26E-7 4.30E-7 3.23E-7 6.0E-10 1.16E-6 8.07E-7 7.2E-10 6.57E-8
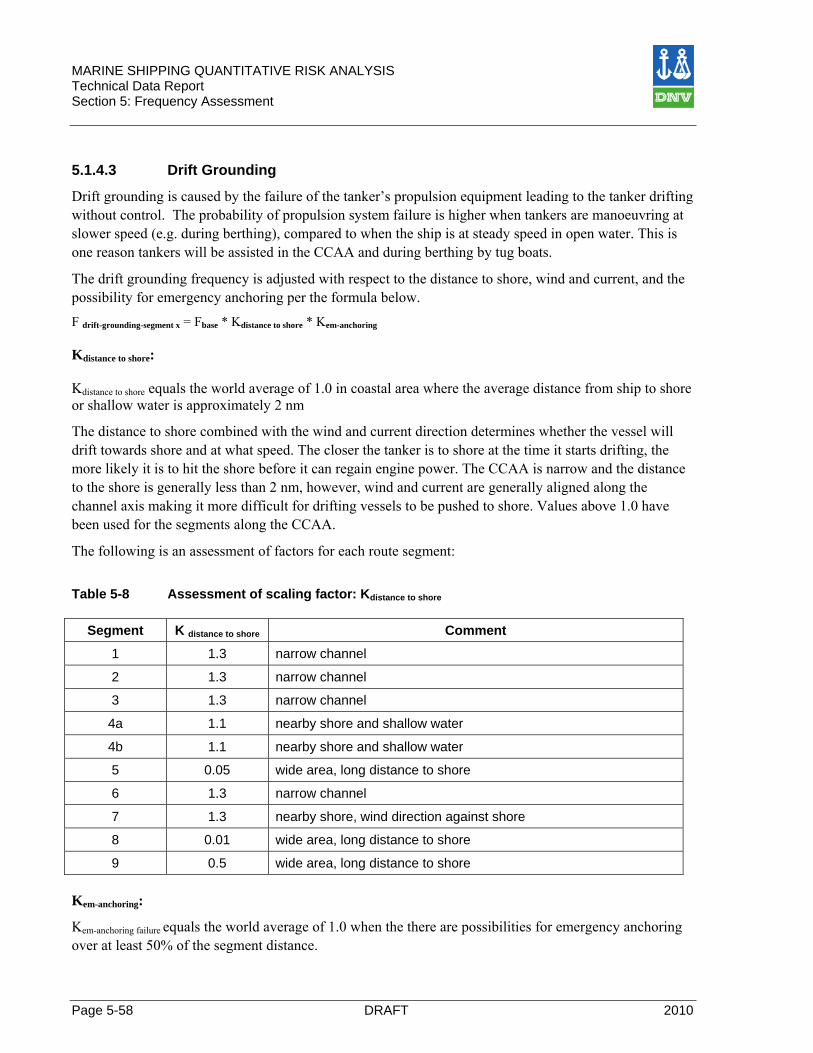
MARINE SHIPPING QUANTITATIVE RISK ANALYSIS Technical Data Report Section 5: Frequency Assessment
Page 5-58 DRAFT 2010
5.1.4.3 Drift Grounding
Drift grounding is caused by the failure of the tanker’s propulsion equipment leading to the tanker drifting without control. The probability of propulsion system failure is higher when tankers are manoeuvring at slower speed (e.g. during berthing), compared to when the ship is at steady speed in open water. This is one reason tankers will be assisted in the CCAA and during berthing by tug boats.
The drift grounding frequency is adjusted with respect to the distance to shore, wind and current, and the possibility for emergency anchoring per the formula below. F drift-grounding-segment x = Fbase * Kdistance to shore * Kem-anchoring Kdistance to shore: Kdistance to shore equals the world average of 1.0 in coastal area where the average distance from ship to shore or shallow water is approximately 2 nm
The distance to shore combined with the wind and current direction determines whether the vessel will drift towards shore and at what speed. The closer the tanker is to shore at the time it starts drifting, the more likely it is to hit the shore before it can regain engine power. The CCAA is narrow and the distance to the shore is generally less than 2 nm, however, wind and current are generally aligned along the channel axis making it more difficult for drifting vessels to be pushed to shore. Values above 1.0 have been used for the segments along the CCAA.
The following is an assessment of factors for each route segment:
Table 5-8 Assessment of scaling factor: Kdistance to shore
Segment K distance to shore Comment
1 1.3 narrow channel
2 1.3 narrow channel
3 1.3 narrow channel
4a 1.1 nearby shore and shallow water
4b 1.1 nearby shore and shallow water
5 0.05 wide area, long distance to shore
6 1.3 narrow channel
7 1.3 nearby shore, wind direction against shore
8 0.01 wide area, long distance to shore
9 0.5 wide area, long distance to shore Kem-anchoring:
Kem-anchoring failure equals the world average of 1.0 when the there are possibilities for emergency anchoring over at least 50% of the segment distance.
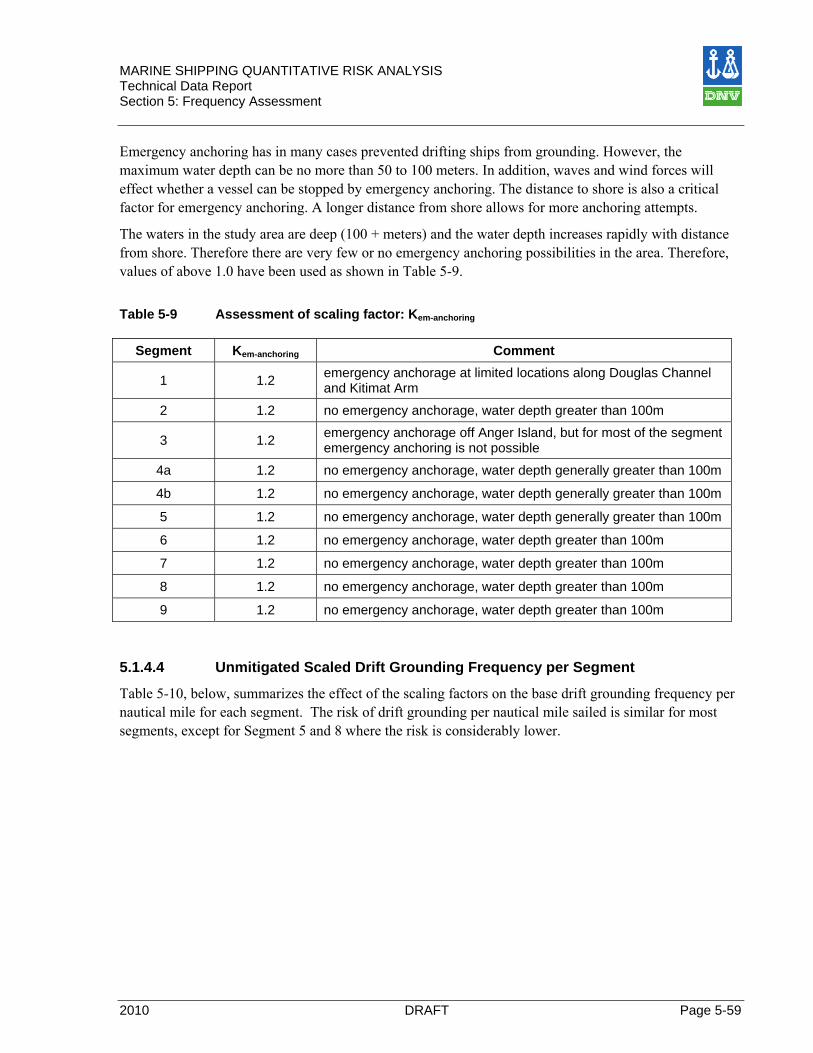
MARINE SHIPPING QUANTITATIVE RISK ANALYSIS Technical Data Report Section 5: Frequency Assessment
2010 DRAFT Page 5-59
Emergency anchoring has in many cases prevented drifting ships from grounding. However, the maximum water depth can be no more than 50 to 100 meters. In addition, waves and wind forces will effect whether a vessel can be stopped by emergency anchoring. The distance to shore is also a critical factor for emergency anchoring. A longer distance from shore allows for more anchoring attempts.
The waters in the study area are deep (100 + meters) and the water depth increases rapidly with distance from shore. Therefore there are very few or no emergency anchoring possibilities in the area. Therefore, values of above 1.0 have been used as shown in Table 5-9.
Table 5-9 Assessment of scaling factor: Kem-anchoring
Segment Kem-anchoring Comment
1 1.2 emergency anchorage at limited locations along Douglas Channel and Kitimat Arm
2 1.2 no emergency anchorage, water depth greater than 100m
3 1.2 emergency anchorage off Anger Island, but for most of the segment emergency anchoring is not possible
4a 1.2 no emergency anchorage, water depth generally greater than 100m
4b 1.2 no emergency anchorage, water depth generally greater than 100m
5 1.2 no emergency anchorage, water depth generally greater than 100m
6 1.2 no emergency anchorage, water depth greater than 100m
7 1.2 no emergency anchorage, water depth greater than 100m
8 1.2 no emergency anchorage, water depth greater than 100m
9 1.2 no emergency anchorage, water depth greater than 100m
5.1.4.4 Unmitigated Scaled Drift Grounding Frequency per Segment
Table 5-10, below, summarizes the effect of the scaling factors on the base drift grounding frequency per nautical mile for each segment. The risk of drift grounding per nautical mile sailed is similar for most segments, except for Segment 5 and 8 where the risk is considerably lower.
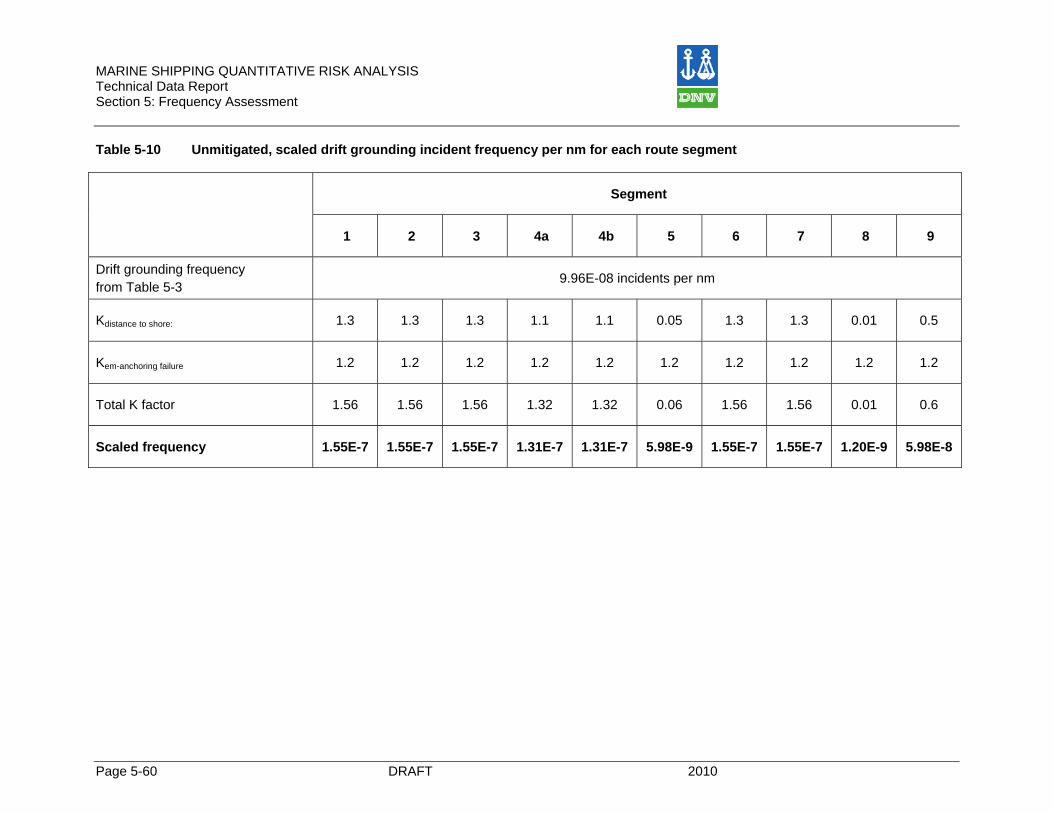
MARINE SHIPPING QUANTITATIVE RISK ANALYSIS Technical Data Report Section 5: Frequency Assessment
Page 5-60 DRAFT 2010
Table 5-10 Unmitigated, scaled drift grounding incident frequency per nm for each route segment
Segment
1 2 3 4a 4b 5 6 7 8 9
Drift grounding frequency from Table 5-3
9.96E-08 incidents per nm
Kdistance to shore: 1.3 1.3 1.3 1.1 1.1 0.05 1.3 1.3 0.01 0.5
Kem-anchoring failure 1.2 1.2 1.2 1.2 1.2 1.2 1.2 1.2 1.2 1.2
Total K factor 1.56 1.56 1.56 1.32 1.32 0.06 1.56 1.56 0.01 0.6
Scaled frequency 1.55E-7 1.55E-7 1.55E-7 1.31E-7 1.31E-7 5.98E-9 1.55E-7 1.55E-7 1.20E-9 5.98E-8
MARINE SHIPPING QUANTITATIVE RISK ANALYSIS Technical Data Report Section 5: Frequency Assessment
2010 DRAFT Page 5-61
5.1.5 Collision Collision is caused by a navigational failure of one or both vessels involved in the collision. The main factor that influences collision frequency is the density of vessel traffic. The probability of collision increases with the vessel density squared (if the density doubles, the probability of a collision quadruples). Other factors that influence the collision frequency are the quality of the crew, traffic separation, environmental conditions (visibility), advice from Vessel Traffic Service (VTS), and the use of pilots. Collisions discussed in this section occur when two vessels collide. A slightly different collision scenario where a vessel strikes a tanker moored at the Kitimat Terminal is assessed in Chapter 5.2.3. The base collision frequency from Table 5-2 does not separate whether the vessel struck another vessel or if it was struck. This is a conservative assumption and is an important factor in the assessment of consequences discussed in Chapter 6.
The collision frequency is adjusted with respect to traffic density, mitigating measures (pilot, VTS and traffic separation) and navigational difficulty (visibility, markings, and currents). The calculation is as shown in the formula below. Fcollision-segment x = Fbase * Ktraffic density * Kmeasures * Knavigational difficulty
Ktraffic density:
Ktraffic density equals the world average of 1.0 when at least 5 vessels may be encountered during the transit of a segment and where it is relatively easy to pass vessels at a safe distance
The traffic densities along the proposed routes to the Kitimat Terminal are relatively low. During one approach to the Kitimat Terminal a tanker can expect to meet, on average, 2 vessels sailing in the opposite direction. Compared to most other international ports this density of traffic is low, especially in the outer segments where the channels are relatively wide and fewer recreational craft will be encountered. International traffic densities are illustrated by the figure below showing a year of global shipping routes mapped by GPS.
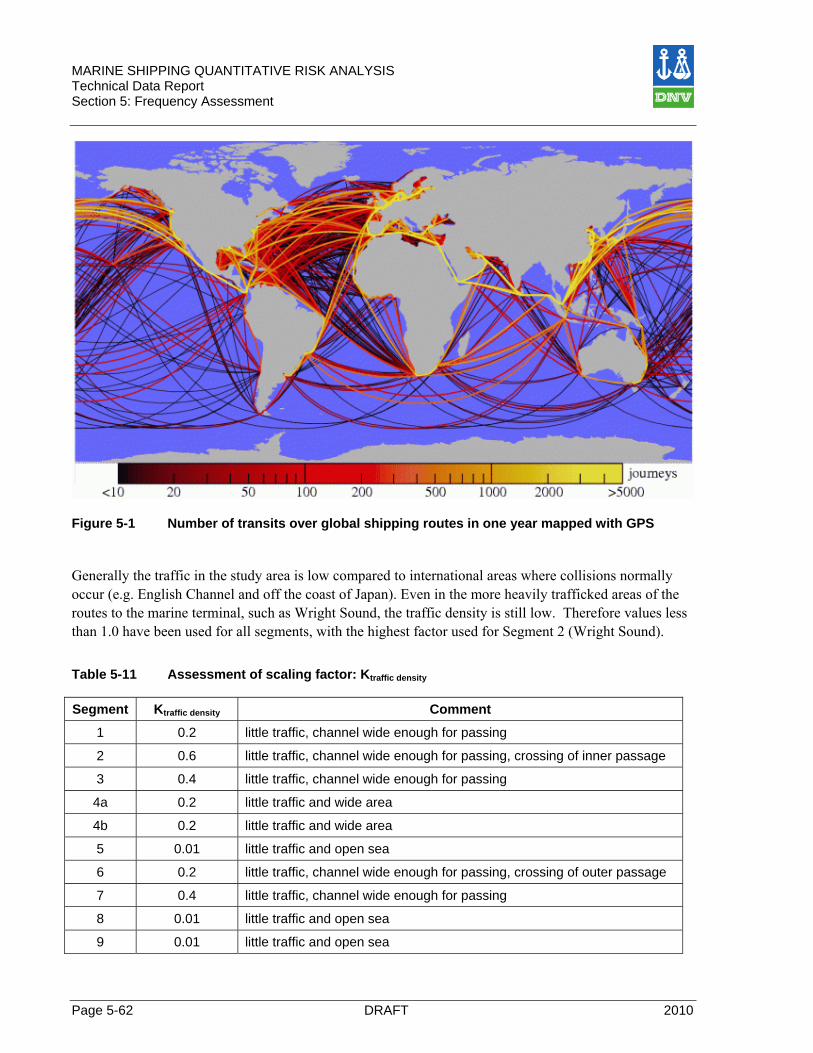
MARINE SHIPPING QUANTITATIVE RISK ANALYSIS Technical Data Report Section 5: Frequency Assessment
Page 5-62 DRAFT 2010
Figure 5-1 Number of transits over global shipping routes in one year mapped with GPS
Generally the traffic in the study area is low compared to international areas where collisions normally occur (e.g. English Channel and off the coast of Japan). Even in the more heavily trafficked areas of the routes to the marine terminal, such as Wright Sound, the traffic density is still low. Therefore values less than 1.0 have been used for all segments, with the highest factor used for Segment 2 (Wright Sound).
Table 5-11 Assessment of scaling factor: Ktraffic density Segment Ktraffic density Comment
1 0.2 little traffic, channel wide enough for passing
2 0.6 little traffic, channel wide enough for passing, crossing of inner passage
3 0.4 little traffic, channel wide enough for passing
4a 0.2 little traffic and wide area
4b 0.2 little traffic and wide area
5 0.01 little traffic and open sea
6 0.2 little traffic, channel wide enough for passing, crossing of outer passage
7 0.4 little traffic, channel wide enough for passing
8 0.01 little traffic and open sea
9 0.01 little traffic and open sea
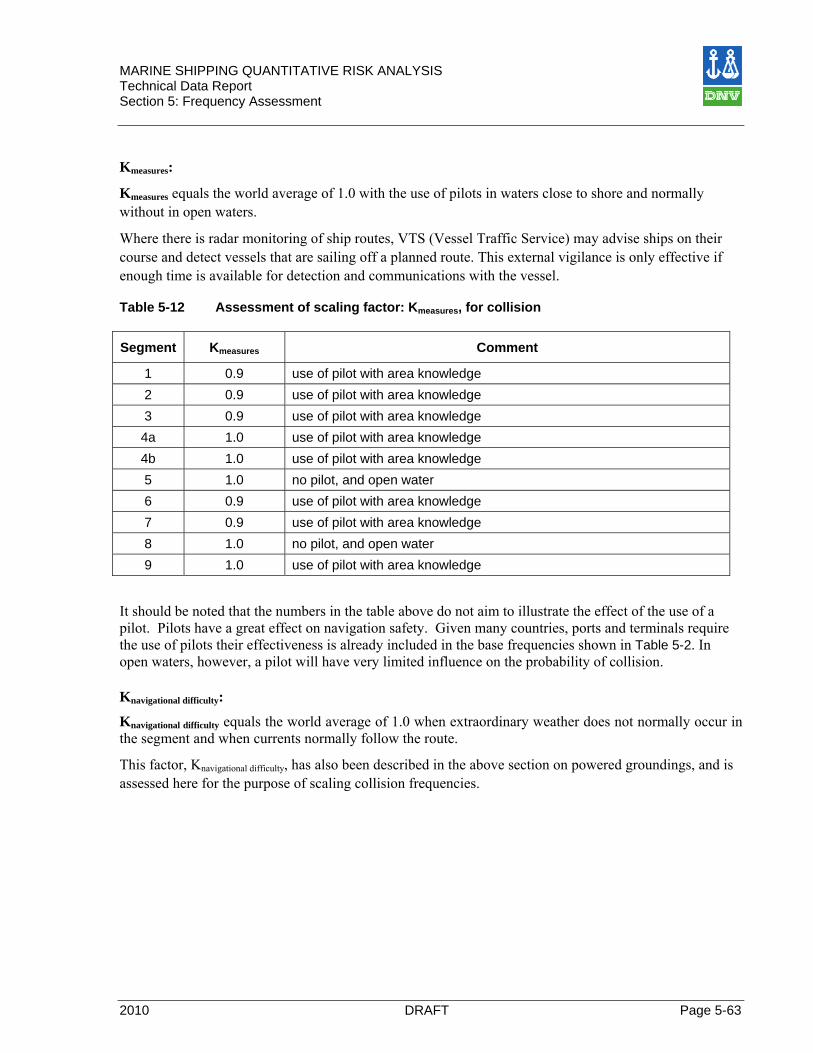
MARINE SHIPPING QUANTITATIVE RISK ANALYSIS Technical Data Report Section 5: Frequency Assessment
2010 DRAFT Page 5-63
Kmeasures:
Kmeasures equals the world average of 1.0 with the use of pilots in waters close to shore and normally without in open waters.
Where there is radar monitoring of ship routes, VTS (Vessel Traffic Service) may advise ships on their course and detect vessels that are sailing off a planned route. This external vigilance is only effective if enough time is available for detection and communications with the vessel. Table 5-12 Assessment of scaling factor: Kmeasures, for collision Segment Kmeasures Comment
1 0.9 use of pilot with area knowledge 2 0.9 use of pilot with area knowledge 3 0.9 use of pilot with area knowledge 4a 1.0 use of pilot with area knowledge 4b 1.0 use of pilot with area knowledge 5 1.0 no pilot, and open water 6 0.9 use of pilot with area knowledge 7 0.9 use of pilot with area knowledge 8 1.0 no pilot, and open water 9 1.0 use of pilot with area knowledge
It should be noted that the numbers in the table above do not aim to illustrate the effect of the use of a pilot. Pilots have a great effect on navigation safety. Given many countries, ports and terminals require the use of pilots their effectiveness is already included in the base frequencies shown in Table 5-2. In open waters, however, a pilot will have very limited influence on the probability of collision. Knavigational difficulty:
Knavigational difficulty equals the world average of 1.0 when extraordinary weather does not normally occur in the segment and when currents normally follow the route.
This factor, Knavigational difficulty, has also been described in the above section on powered groundings, and is assessed here for the purpose of scaling collision frequencies.

MARINE SHIPPING QUANTITATIVE RISK ANALYSIS Technical Data Report Section 5: Frequency Assessment
Page 5-64 DRAFT 2010
Table 5-13 Assessment of scaling factor: Knavigational difficulty Segment Knavigational difficulty Comment
1 1.0 average conditions
2 1.0 average conditions
3 0.9 average conditions
4a 1.0 average conditions
4b 1.0 average conditions
5 1.0 average conditions
6 1.2 variable visibility during parts of the year
7 1.5 variable visibility during parts of the year and sea clutter on radar during high waves and wind
8 1.2 variable visibility during parts of the year
9 1.0 average conditions
5.1.5.1 Unmitigated, Scaled Collision Frequency per Segment
Table 5-14 summarizes the effect of the factors and the collision frequency per nautical mile in each segment. The highest risk of collision per nautical mile sailed, is in segment 2, 3 and 7. For example the likelihood of a tanker colliding in Segment 7 is once every 4,000,000 nautical miles sailed by tankers through Segment 7.
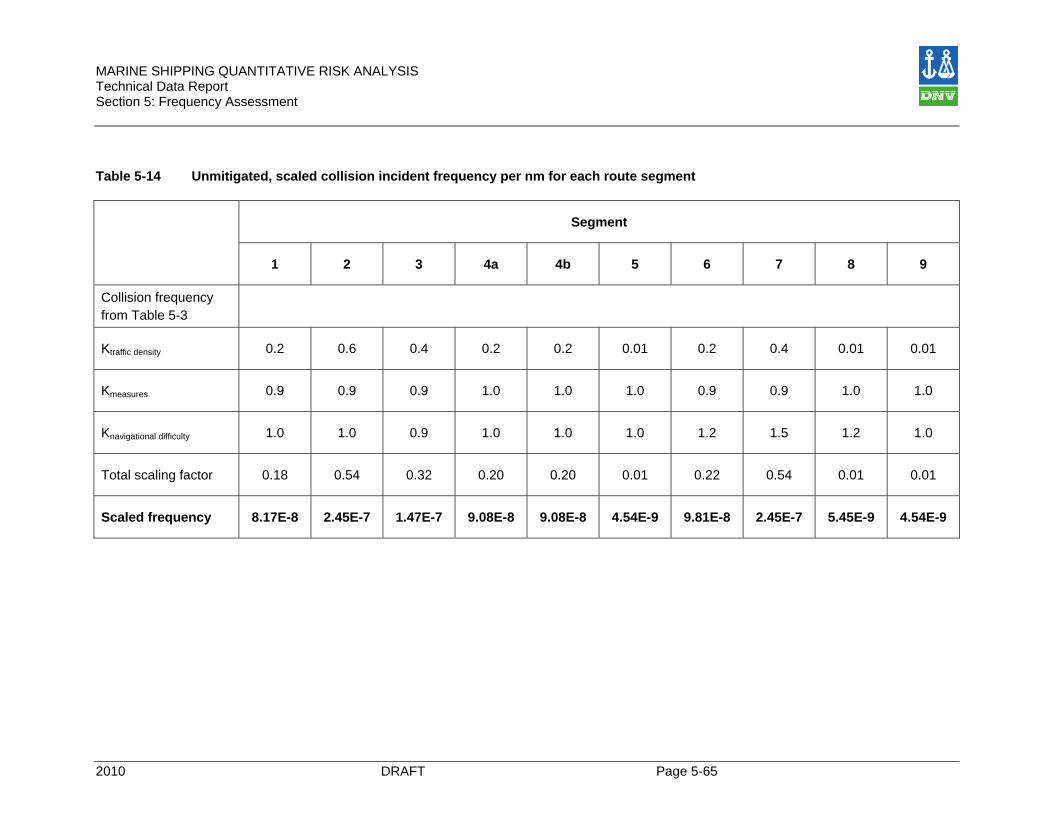
MARINE SHIPPING QUANTITATIVE RISK ANALYSIS Technical Data Report Section 5: Frequency Assessment
2010 DRAFT Page 5-65
Table 5-14 Unmitigated, scaled collision incident frequency per nm for each route segment
Segment
1 2 3 4a 4b 5 6 7 8 9
Collision frequency from Table 5-3
Ktraffic density 0.2 0.6 0.4 0.2 0.2 0.01 0.2 0.4 0.01 0.01
Kmeasures 0.9 0.9 0.9 1.0 1.0 1.0 0.9 0.9 1.0 1.0
Knavigational difficulty 1.0 1.0 0.9 1.0 1.0 1.0 1.2 1.5 1.2 1.0
Total scaling factor 0.18 0.54 0.32 0.20 0.20 0.01 0.22 0.54 0.01 0.01
Scaled frequency 8.17E-8 2.45E-7 1.47E-7 9.08E-8 9.08E-8 4.54E-9 9.81E-8 2.45E-7 5.45E-9 4.54E-9
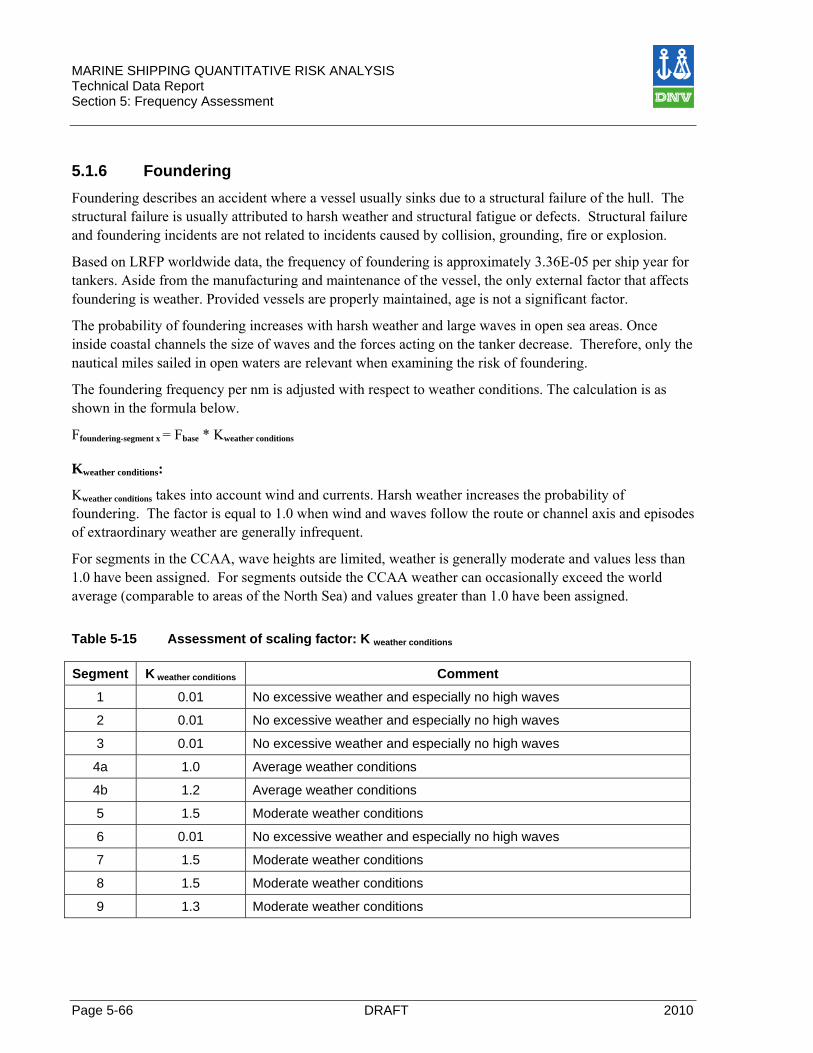
MARINE SHIPPING QUANTITATIVE RISK ANALYSIS Technical Data Report Section 5: Frequency Assessment
Page 5-66 DRAFT 2010
5.1.6 Foundering Foundering describes an accident where a vessel usually sinks due to a structural failure of the hull. The structural failure is usually attributed to harsh weather and structural fatigue or defects. Structural failure and foundering incidents are not related to incidents caused by collision, grounding, fire or explosion.
Based on LRFP worldwide data, the frequency of foundering is approximately 3.36E-05 per ship year for tankers. Aside from the manufacturing and maintenance of the vessel, the only external factor that affects foundering is weather. Provided vessels are properly maintained, age is not a significant factor.
The probability of foundering increases with harsh weather and large waves in open sea areas. Once inside coastal channels the size of waves and the forces acting on the tanker decrease. Therefore, only the nautical miles sailed in open waters are relevant when examining the risk of foundering.
The foundering frequency per nm is adjusted with respect to weather conditions. The calculation is as shown in the formula below.
Ffoundering-segment x = Fbase * Kweather conditions Kweather conditions:
Kweather conditions takes into account wind and currents. Harsh weather increases the probability of foundering. The factor is equal to 1.0 when wind and waves follow the route or channel axis and episodes of extraordinary weather are generally infrequent.
For segments in the CCAA, wave heights are limited, weather is generally moderate and values less than 1.0 have been assigned. For segments outside the CCAA weather can occasionally exceed the world average (comparable to areas of the North Sea) and values greater than 1.0 have been assigned.
Table 5-15 Assessment of scaling factor: K weather conditions Segment K weather conditions Comment
1 0.01 No excessive weather and especially no high waves
2 0.01 No excessive weather and especially no high waves
3 0.01 No excessive weather and especially no high waves
4a 1.0 Average weather conditions
4b 1.2 Average weather conditions
5 1.5 Moderate weather conditions
6 0.01 No excessive weather and especially no high waves
7 1.5 Moderate weather conditions
8 1.5 Moderate weather conditions
9 1.3 Moderate weather conditions
MARINE SHIPPING QUANTITATIVE RISK ANALYSIS Technical Data Report Section 5: Frequency Assessment
2010 DRAFT Page 5-67
5.1.6.1 Scaled Foundering Frequency per Segment
Table 5-16, below, summarizes the effect the scaling factor on the base foundering frequency per nautical mile for each route segment. As can be seen in the table the risk for foundering is relatively small in all segments.
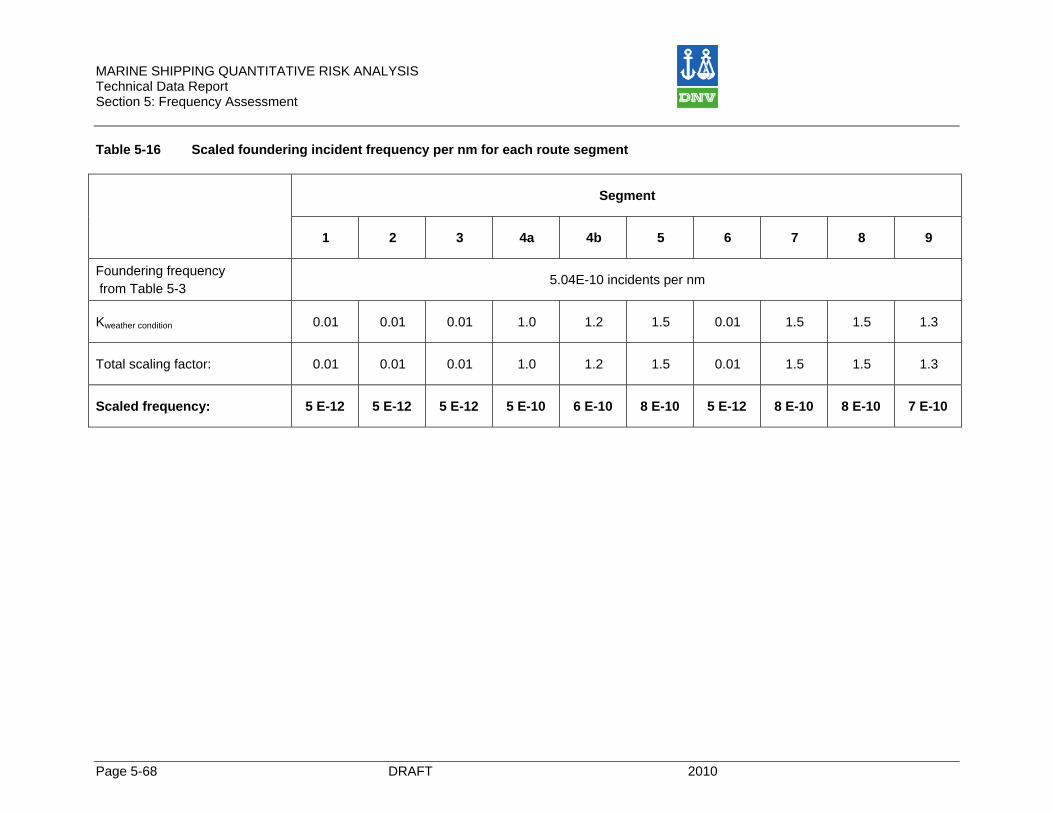
MARINE SHIPPING QUANTITATIVE RISK ANALYSIS Technical Data Report Section 5: Frequency Assessment
Page 5-68 DRAFT 2010
Table 5-16 Scaled foundering incident frequency per nm for each route segment
Segment
1 2 3 4a 4b 5 6 7 8 9
Foundering frequency from Table 5-3
5.04E-10 incidents per nm
Kweather condition 0.01 0.01 0.01 1.0 1.2 1.5 0.01 1.5 1.5 1.3
Total scaling factor: 0.01 0.01 0.01 1.0 1.2 1.5 0.01 1.5 1.5 1.3
Scaled frequency: 5 E-12 5 E-12 5 E-12 5 E-10 6 E-10 8 E-10 5 E-12 8 E-10 8 E-10 7 E-10
MARINE SHIPPING QUANTITATIVE RISK ANALYSIS Technical Data Report Section 5: Frequency Assessment
2010 DRAFT Page 5-69
5.1.7 Scaled Fire and / or Explosion Frequency per Segment Based on LRFP worldwide data, the annual frequency of fire and/or explosion is approximately 2.41E-03 per vessel. This corresponds to a frequency of 3.26E-05 per nm, ref. Table 5-2.
The frequency for fire/explosion is independent of local factors such as traffic and weather. Therefore, no scaling factors have been used to adjust the worldwide fire / explosion frequency, and hence:
FFire/explosion-segment x = FBase.
5.1.8 Scaled Incident Frequencies for Each Route Segment Table 5-17, below, shows the scaled incident frequency per nautical mile for each incident type and each route segment. This table is updated throughout this report, as described below.
Table 5-17 is updated in Table 6-10 and Table 6-11 with the application of conditional spill probabilities to calculate the unmitigated probability per nautical mile of an incident resulting in a spill for each incident type and each route segment.
Tables Table 6-10 and Table 6-11 are updated in Table 7-8 with the application of the total distances transited annually in each route by tankers laden and in ballast to calculate the unmitigated annual probability of an incident resulting in a spill for each incident type and each route segment.
The use of tug escorts reduces the frequency of powered and drift groundings as well as collisions. Therefore the frequency reduction factors in Table 8-1 are applied to Table 5-17, to recalculate the results for Table 6-10, Table 6-11 and Table 7-8. Table 8-2 summarizes the mitigated annual probability of an incident resulting in a spill for each incident type and for each route segment..
Tug escort is the only risk mitigation measure for marine tanker transportation that is quantitatively examined in this QRA. Other measures are qualitatively examined in Chapter 8. The frequencies for foundering and fire and explosions for all segments, as well as all incident frequencies for Segments 5, 8, and 9 (where tugs are not employed, but will be available to assist) do not change from those shown inTable 5-17..
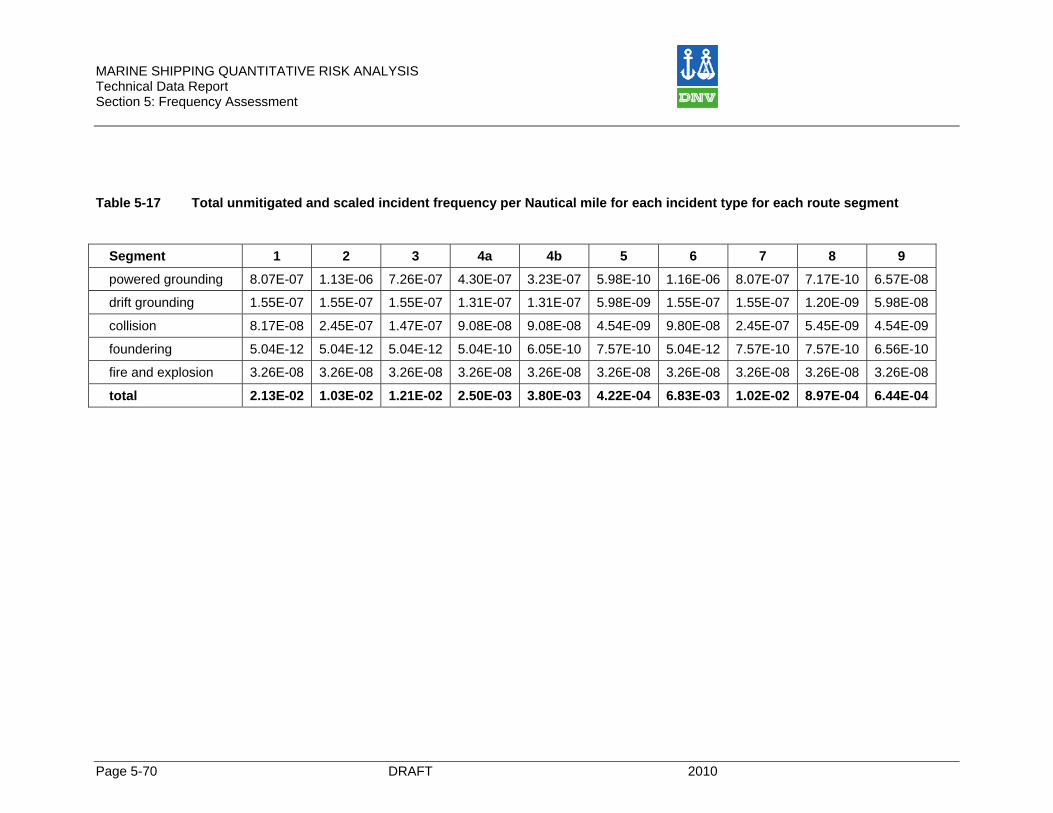
MARINE SHIPPING QUANTITATIVE RISK ANALYSIS Technical Data Report Section 5: Frequency Assessment
Page 5-70 DRAFT 2010
Table 5-17 Total unmitigated and scaled incident frequency per Nautical mile for each incident type for each route segment
Segment 1 2 3 4a 4b 5 6 7 8 9
powered grounding 8.07E-07 1.13E-06 7.26E-07 4.30E-07 3.23E-07 5.98E-10 1.16E-06 8.07E-07 7.17E-10 6.57E-08
drift grounding 1.55E-07 1.55E-07 1.55E-07 1.31E-07 1.31E-07 5.98E-09 1.55E-07 1.55E-07 1.20E-09 5.98E-08
collision 8.17E-08 2.45E-07 1.47E-07 9.08E-08 9.08E-08 4.54E-09 9.80E-08 2.45E-07 5.45E-09 4.54E-09
foundering 5.04E-12 5.04E-12 5.04E-12 5.04E-10 6.05E-10 7.57E-10 5.04E-12 7.57E-10 7.57E-10 6.56E-10
fire and explosion 3.26E-08 3.26E-08 3.26E-08 3.26E-08 3.26E-08 3.26E-08 3.26E-08 3.26E-08 3.26E-08 3.26E-08
total 2.13E-02 1.03E-02 1.21E-02 2.50E-03 3.80E-03 4.22E-04 6.83E-03 1.02E-02 8.97E-04 6.44E-04
MARINE SHIPPING QUANTITATIVE RISK ANALYSIS Technical Data Report Section 5: Frequency Assessment
2010 DRAFT Page 5-71
5.2 Incidents during Berthing and Cargo Transfer Operations The following section discusses the frequency of incidents during berthing and deberthing and cargo transfer operations at the marine terminal. Frequency data is based on LRFP data and DNV’s research of operating terminals on the west coast of Norway. Incident frequencies from terminals in Norway are most representative of the operation planned for the Kitimat Terminal and should provide an appropriate forecast of the possible incident frequency at the Kitimat Terminal.
5.2.1 Impact by Harbour Tug Tankers will be assisted by tug boats during berthing (see Chapter 3.3). Tug boats normally approach a tanker at low speed and cannot damage the tanker hull. However, if a tug boat misjudges the speed/distance to a tanker and strikes the tanker with sufficient speed, the collision energy may be sufficient to damage the tanker.
Given the relatively small mass of a tug, up to around 600 tonnes (LRFP 2007), high tug boat speeds are required to damage a tanker. In order to penetrate the hull of a tanker the collision energy must be greater than 5 MJ (DNV 2006), with some references suggesting the required energy is closer to 10 MJ. These energy estimates assume a tanker of typical construction including an average number of stiffeners and thickness of steel and have been validated by computer analysis and damage reports from real incidents.
To illustrate the speed required to achieve the required 5 MJ of energy to damage a tanker, the following well known equation for energy is used:
E = 0.5*(1+0.1)*M*V2 /1000 [MJ]
where;
M = ship displacement [tonnes]
V = ship speed [m/s]
The 0.1 in the (1+0.1) takes into account the added mass of the tug boat. As the tug boat moves and displaces water a small volume of water is carried along with the tug boat. This additional mass of water is typically modelled in marine engineering and naval architecture by adding a percent of the vessels own weight, in this case 10%.
Based on the above formula and an assumed tug boat weight / displacement of 600 tonnes, a tug boat would need to impact a tanker at a speed of over 3.9 m/s or 7.6 knots. This speed would need to be even greater if the assumption 10 MJ energy is used. Given tug boats travel at speeds much lower than 7 to 8 knots when manoeuvring near other vessels, the likelihood of a tug boat colliding with a tanker and breaching the tanker hull is assessed to be negligible and is not considered in the remainder of this QRA.
MARINE SHIPPING QUANTITATIVE RISK ANALYSIS Technical Data Report Section 5: Frequency Assessment
Page 5-72 DRAFT 2010
5.2.2 Tanker Striking Pier during Berthing The possibility of collision with the berthing structures at the marine terminal is a risk to vessels berthing. Reasons for striking the pier include:
1. The vessel does not utilize tugs and has a mechanical failure and drifts into the pier.
2. Tugs are utilized during berthing, but have a mechanical failure and the ship strikes the pier.
3. The tugs are not powerful enough for the size of vessel berthing and the environmental conditions.
4. Human error onboard the ship or the tugs leads to loss of control and the vessel striking the pier.
All tankers berthing at the Kitimat Terminal will utilize two or more specially designed tug boats. Therefore causes 1 and 3 above are considered not to be relevant to the Kitimat Terminal.
The proposed Kitimat Terminal includes four fenders per berth. The fenders are designed to absorb berthing forces from tankers. It is rare, even if a tanker berths at speed in excess of the design berthing velocity, that significant damage would occur to the tanker.
Even with the use of tugs and fenders it is still possible for a tanker to hit the corner of one of the marine structures at the marine terminal. This is a conservative assumption as the layout of the fenders is meant to prevent this scenario from occurring. If a tanker struck the marine structures a breach of the outer hull is possible, however breaching the inner cargo hull is much less likely.
By examining incident data for tankers striking the pier during berthing (LRFP 2007) a frequency of 2.8E-03 per ship year can be determined. Examining world tanker operations and the number of berthings for different sizes of vessels an average number of 44 berthings per tanker per year is estimated.
The frequency of tankers striking the pier from LRFP is divided by 44 berthings per tanker per year to derive a base frequency of 6.3E-05 collisions with marine structures per tanker berthing at the marine terminal.
5.2.3 Impact by Passing Vessels While a tanker is moored at the marine terminal there is a possibility that passing vessels transiting to and from other terminals in the Port of Kitimat may strike the tanker due to an error in navigation or mechanical failure. The probability depends on the number of passing vessels and the width of the passage. The scenario is illustrated in Figure 5-2, below.
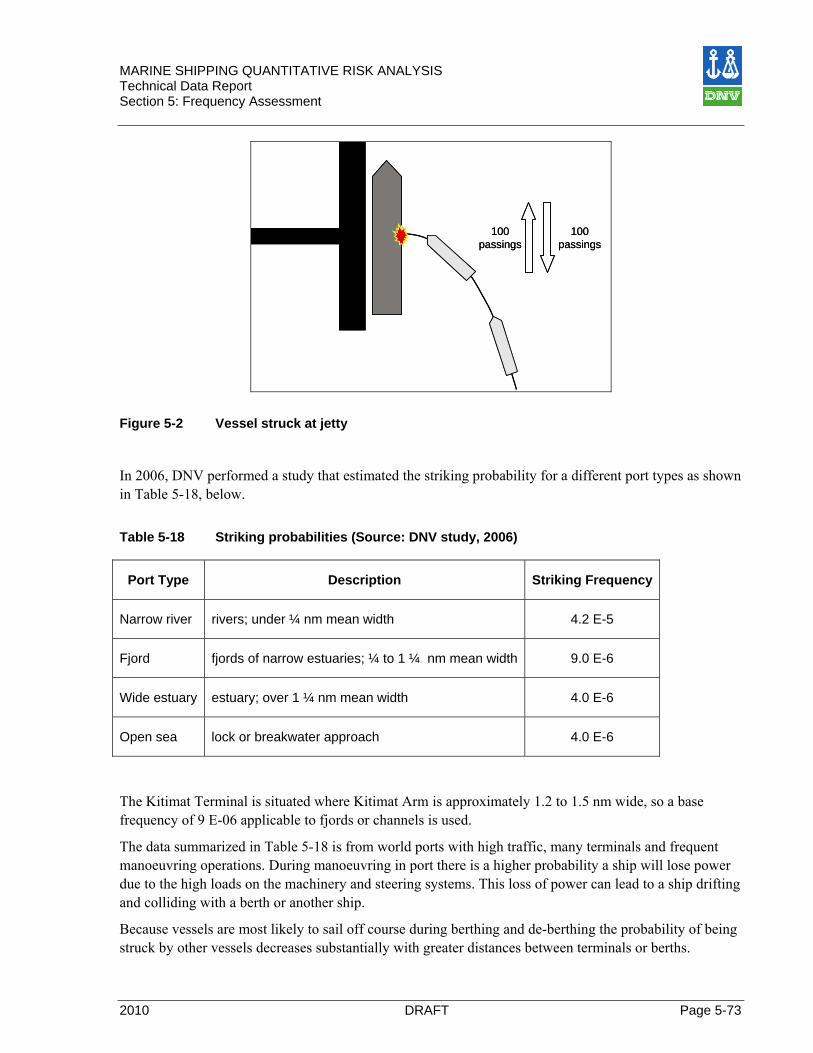
MARINE SHIPPING QUANTITATIVE RISK ANALYSIS Technical Data Report Section 5: Frequency Assessment
2010 DRAFT Page 5-73
100 passings
100 passings
100 passings
100 passings
Figure 5-2 Vessel struck at jetty
In 2006, DNV performed a study that estimated the striking probability for a different port types as shown in Table 5-18, below.
Table 5-18 Striking probabilities (Source: DNV study, 2006)
Port Type Description Striking Frequency
Narrow river rivers; under ¼ nm mean width 4.2 E-5
Fjord fjords of narrow estuaries; ¼ to 1 ¼ nm mean width 9.0 E-6
Wide estuary estuary; over 1 ¼ nm mean width 4.0 E-6
Open sea lock or breakwater approach 4.0 E-6
The Kitimat Terminal is situated where Kitimat Arm is approximately 1.2 to 1.5 nm wide, so a base frequency of 9 E-06 applicable to fjords or channels is used.
The data summarized in Table 5-18 is from world ports with high traffic, many terminals and frequent manoeuvring operations. During manoeuvring in port there is a higher probability a ship will lose power due to the high loads on the machinery and steering systems. This loss of power can lead to a ship drifting and colliding with a berth or another ship.
Because vessels are most likely to sail off course during berthing and de-berthing the probability of being struck by other vessels decreases substantially with greater distances between terminals or berths.
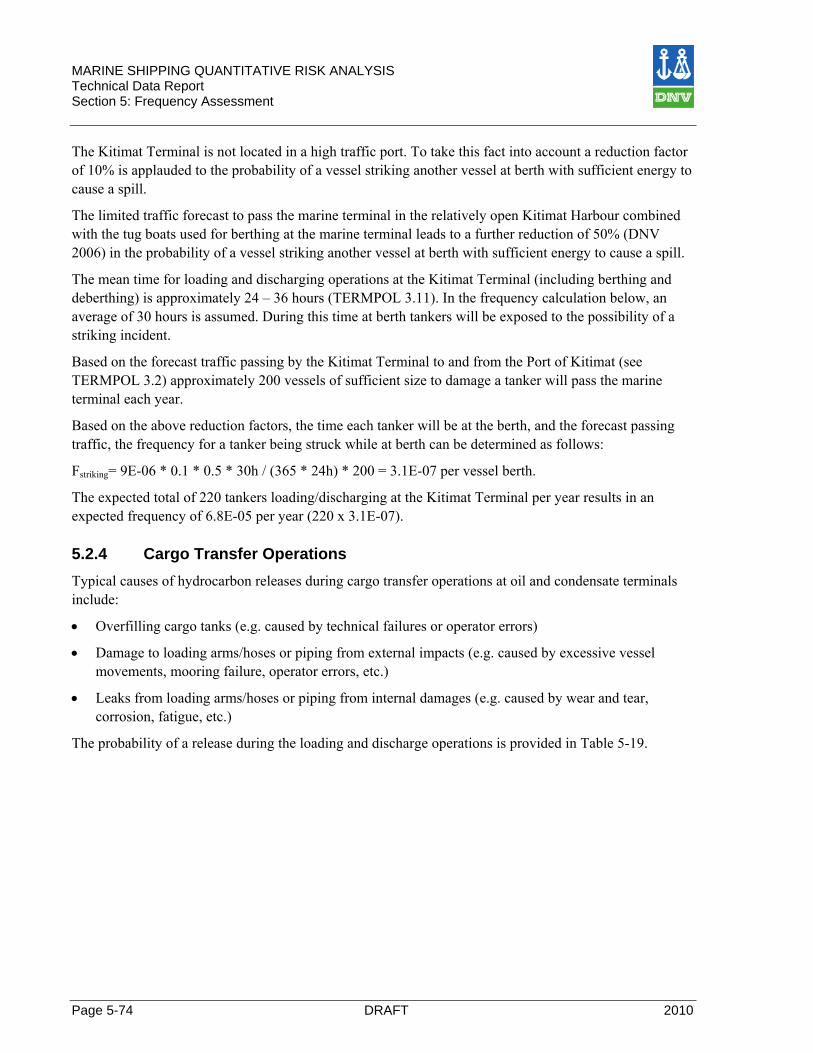
MARINE SHIPPING QUANTITATIVE RISK ANALYSIS Technical Data Report Section 5: Frequency Assessment
Page 5-74 DRAFT 2010
The Kitimat Terminal is not located in a high traffic port. To take this fact into account a reduction factor of 10% is applauded to the probability of a vessel striking another vessel at berth with sufficient energy to cause a spill.
The limited traffic forecast to pass the marine terminal in the relatively open Kitimat Harbour combined with the tug boats used for berthing at the marine terminal leads to a further reduction of 50% (DNV 2006) in the probability of a vessel striking another vessel at berth with sufficient energy to cause a spill.
The mean time for loading and discharging operations at the Kitimat Terminal (including berthing and deberthing) is approximately 24 – 36 hours (TERMPOL 3.11). In the frequency calculation below, an average of 30 hours is assumed. During this time at berth tankers will be exposed to the possibility of a striking incident.
Based on the forecast traffic passing by the Kitimat Terminal to and from the Port of Kitimat (see TERMPOL 3.2) approximately 200 vessels of sufficient size to damage a tanker will pass the marine terminal each year.
Based on the above reduction factors, the time each tanker will be at the berth, and the forecast passing traffic, the frequency for a tanker being struck while at berth can be determined as follows:
Fstriking= 9E-06 * 0.1 * 0.5 * 30h / (365 * 24h) * 200 = 3.1E-07 per vessel berth.
The expected total of 220 tankers loading/discharging at the Kitimat Terminal per year results in an expected frequency of 6.8E-05 per year (220 x 3.1E-07).
5.2.4 Cargo Transfer Operations Typical causes of hydrocarbon releases during cargo transfer operations at oil and condensate terminals include:
• Overfilling cargo tanks (e.g. caused by technical failures or operator errors)
• Damage to loading arms/hoses or piping from external impacts (e.g. caused by excessive vessel movements, mooring failure, operator errors, etc.)
• Leaks from loading arms/hoses or piping from internal damages (e.g. caused by wear and tear, corrosion, fatigue, etc.)
The probability of a release during the loading and discharge operations is provided in Table 5-19.
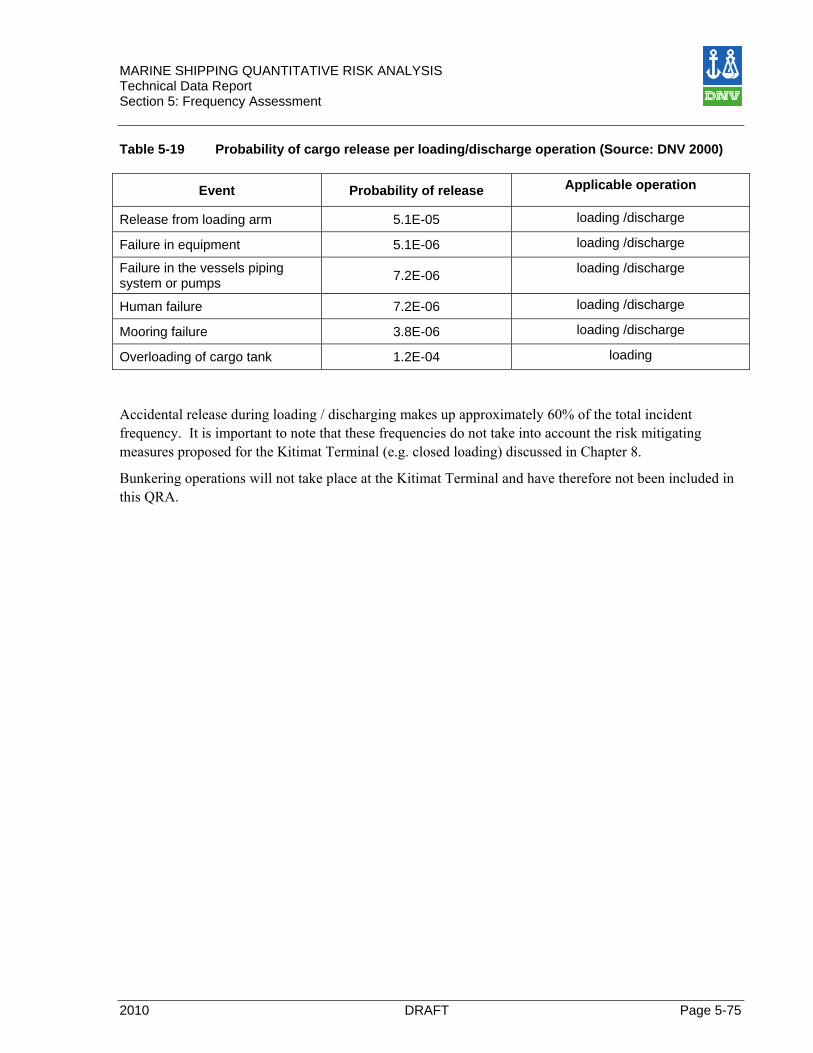
MARINE SHIPPING QUANTITATIVE RISK ANALYSIS Technical Data Report Section 5: Frequency Assessment
2010 DRAFT Page 5-75
Table 5-19 Probability of cargo release per loading/discharge operation (Source: DNV 2000)
Event Probability of release Applicable operation
Release from loading arm 5.1E-05 loading /discharge
Failure in equipment 5.1E-06 loading /discharge
Failure in the vessels piping system or pumps 7.2E-06 loading /discharge
Human failure 7.2E-06 loading /discharge
Mooring failure 3.8E-06 loading /discharge
Overloading of cargo tank 1.2E-04 loading
Accidental release during loading / discharging makes up approximately 60% of the total incident frequency. It is important to note that these frequencies do not take into account the risk mitigating measures proposed for the Kitimat Terminal (e.g. closed loading) discussed in Chapter 8.
Bunkering operations will not take place at the Kitimat Terminal and have therefore not been included in this QRA.
MARINE SHIPPING QUANTITATIVE RISK ANALYSIS Technical Data Report Section 6: Consequence Assessment
Page 6-76 DRAFT 2010
6 Consequence Assessment Chapter 6 describes the consequences that could result from each event described in Chapter 5. For the purposes of the QRA the term consequence refers to vessel damage and volume of cargo that may be released. The consequence assessment is divided into two parts:
• Consequences from an incident involving tankers travelling to and from the Kitimat Terminal.
• Consequences resulting from an incident during berthing or cargo transfer operations at the marine terminal.
6.1 Conditional Spill Probabilities The outcome of the consequence assessment is the conditional probability of a spill for each of the incidents described in Chapter 5. For example, the conditional probability of a spill resulting from a grounding is the probability of a spill given (or conditional on the fact) that a grounding has occurred.
The conditional probabilities are multiplied by the scaled incident frequencies from Chapter 5 to determine the probability of a spill resulting from an incident occurring.
Two different methods have been used to estimate the conditional spill probabilities for groundings and collisions. Method 1 is used to calculate the conditional probability of spill, while Method 2 is used to predict the spill size distribution.
Method 1
Method 1 determines conditional spill probabilities based on damage recorded in the LRFP casualty database. DNV has estimated the conditional probability of a spill for each incident type and damage category. Spill volumes are not calculated.
Method 2
Method 2 calculates the conditional spill probability and spill size distribution for bottom and side damages. The method calculates spill quantities based on vessel damage information provided in IMO’s MARPOL regulations. A software package called NAPA (Naval Architecture Package, by NAPA Ltd.) is used to estimate spill size distributions. Using a Monte Carlo simulation and picking random damages, conditional probability estimates for different spill sizes have also been calculated.
6.2 Tanker Capacities Table 6-1, below provides the assumed cargo and bunker fuel capacity for four vessels used in the spill size distribution calculations described in Method 2, above. The vessels are all double hull tankers, with centre line longitudinal bulkheads, assumed to have been built between 2000 and 2008. The capacities below represent a typical vessel in each class of tanker forecast to call that the Kitimat Terminal.
While the (VLCCmax) represents the largest vessel forecast to call at the marine terminal, it may not necessarily have the largest tank volumes. Depending on the number of bulkheads a VLCC may have smaller tank volumes than a smaller class vessel with fewer bulkheads (see Section 3.2.1). The estimated
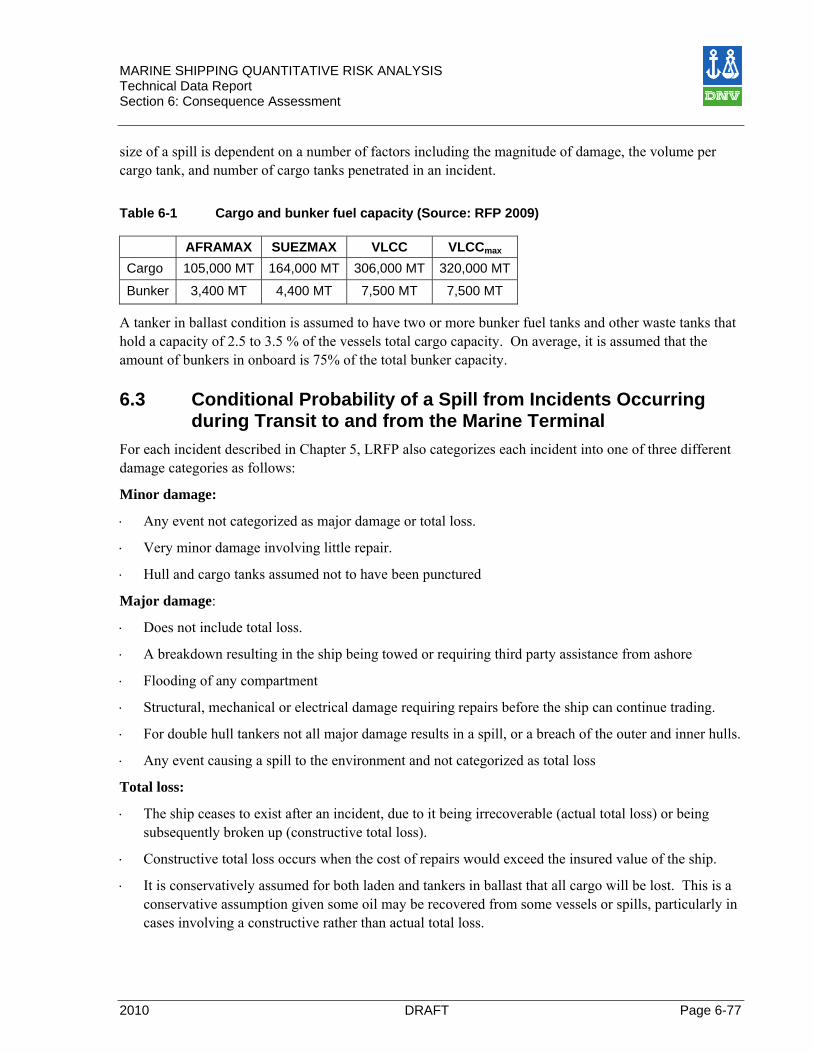
MARINE SHIPPING QUANTITATIVE RISK ANALYSIS Technical Data Report Section 6: Consequence Assessment
2010 DRAFT Page 6-77
size of a spill is dependent on a number of factors including the magnitude of damage, the volume per cargo tank, and number of cargo tanks penetrated in an incident.
Table 6-1 Cargo and bunker fuel capacity (Source: RFP 2009)
AFRAMAX SUEZMAX VLCC VLCCmax Cargo 105,000 MT 164,000 MT 306,000 MT 320,000 MT
Bunker 3,400 MT 4,400 MT 7,500 MT 7,500 MT
A tanker in ballast condition is assumed to have two or more bunker fuel tanks and other waste tanks that hold a capacity of 2.5 to 3.5 % of the vessels total cargo capacity. On average, it is assumed that the amount of bunkers in onboard is 75% of the total bunker capacity.
6.3 Conditional Probability of a Spill from Incidents Occurring during Transit to and from the Marine Terminal
For each incident described in Chapter 5, LRFP also categorizes each incident into one of three different damage categories as follows:
Minor damage:
⋅ Any event not categorized as major damage or total loss.
⋅ Very minor damage involving little repair.
⋅ Hull and cargo tanks assumed not to have been punctured
Major damage:
⋅ Does not include total loss.
⋅ A breakdown resulting in the ship being towed or requiring third party assistance from ashore
⋅ Flooding of any compartment
⋅ Structural, mechanical or electrical damage requiring repairs before the ship can continue trading.
⋅ For double hull tankers not all major damage results in a spill, or a breach of the outer and inner hulls.
⋅ Any event causing a spill to the environment and not categorized as total loss
Total loss:
⋅ The ship ceases to exist after an incident, due to it being irrecoverable (actual total loss) or being subsequently broken up (constructive total loss).
⋅ Constructive total loss occurs when the cost of repairs would exceed the insured value of the ship.
⋅ It is conservatively assumed for both laden and tankers in ballast that all cargo will be lost. This is a conservative assumption given some oil may be recovered from some vessels or spills, particularly in cases involving a constructive rather than actual total loss.
MARINE SHIPPING QUANTITATIVE RISK ANALYSIS Technical Data Report Section 6: Consequence Assessment
Page 6-78 DRAFT 2010
TERMPOL requests that the risk of an incident becoming uncontrollable be examined. For the purposes of this QRA, an uncontrollable situation is assumed to be a total loss. This risk is illustrated in Figure 7-9 (without risk mitigation measures applied) and in Figure 8-5 (with mitigation measures applied).
The definition of an uncontrollable situation may vary. As noted above a total loss may or may not result in an actual total loss or in all cargo and bunkers being released (although this is conservatively assumed in the following sections). In the case of a total loss cargo may be recovered and the vessel may be salvaged.
6.3.1 Grounding The consequence to a vessel in the event of a powered or drift grounding will depend on a number of factors, such as:
• type of hull
• type of seabed (rock or sand)
• vessel speed at time of impact
• environmental conditions including weather, wind, and tidal range
Vessel speed at time of impact is more applicable to powered grounding. For drift grounding the environmental conditions including weather, wind, and tidal range are more influential.
Cargo will be released when both the inner and outer hull of a double hull tanker are breached. Compared to a single hull design higher impact energy is required to penetrate a cargo tank.
The north coast of British Columbia consists mostly of rock seabed. This increases the probability of major damage in the event of a grounding.
All calculations in this chapter assume double hull tankers that will have at least two meters between inner and outer hull. Alternative design concepts are allowed only when approved in principle by IMO MEPC to have equivalent or better predicted performance with regard to oil outflow in case of an accident.
6.3.1.1 Conditional Probability of a Spill from Powered or Drift Groundings (Method 1)
LRFP grounding damage categories and DNV’s assumption on the conditional spill probabilities for each damage category are discussed below and summarized in Table 6-2
Minor Damage
• For both laden and vessels in ballast it is assumed that minor damage will not lead to a spill.
Major Damage:
• For laden vessels it is assumed that 3 out of 4 grounding events causing major damage will have sufficient energy to penetrate a cargo or bunker fuel tank.
• For vessels in ballast it is assumed that grounding will result in a release of bunkers from vessels in ballast 10% of the time. Bunker fuel tanks are normally near the stern of the vessel. Powered

MARINE SHIPPING QUANTITATIVE RISK ANALYSIS Technical Data Report Section 6: Consequence Assessment
2010 DRAFT Page 6-79
groundings will more often affect the bow of the vessel, while drift grounding has a higher probability of damaging the stern of the vessel and the bunker fuel tanks.
Total Loss:
• For both laden and vessels in ballast it is conservatively assumed that when tankers in laden condition have a total loss all cargo and / or bunker fuel contents will be released.
The frequency distribution between Minor Damage, Major Damage and Total Loss, as recorded in LRFP, is shown in Table 6-2, below. The conditional probability of a spill has been estimated by DNV based on the research of spill to damage data.
Table 6-2 LRFP damage frequency distribution and DNV estimate of the conditional
probability of a release of cargo or bunker fuel from grounding incidents
Damage Category Description frequency
distribution* (%)
conditional probability of spill (%)
laden ballast
total loss the vessel is damaged beyond repair from an insurance perspective 2.4 100 100
major damage damage through the outer hull. 40.4 75 10
minor damage
small indents that do not penetrate the outer hull 57.2 0 0
Total 32.7 6.4
In Table 6-2 above, the term conditional probability refers to the probability there will be a spill given a grounding has occurred. The total conditional probability in the bottom row of the last two columns are the above conditional probabilities multiplied by the frequency distributions for each damage category (i.e. 2.4% x 100% + 40.4% x 75% = 32.7%). A total conditional probability of 32.7% for laden tankers means that some release of cargo and / or bunkers is predicted 32.7% of the time there is a grounding incident involving a laden tanker.
6.3.1.2 Conditional Probability of a Spill from Powered or Drift Groundings (Method 2)
The results of the Monte-Carlo simulations (according to IMO’s MARPOL regulations as outlined in MEPC 49/22/Add.2) for grounding (bottom damage) are shown in Table 6-3 and Table 6-4. Both mean and extreme cargo outflows are shown. In accordance with the IMO regulations, mean outflow is the mean from all bottom damage incidents. Similarly, the extreme outflow is the mean of the 10% of bottom damage incidents with the highest outflow.
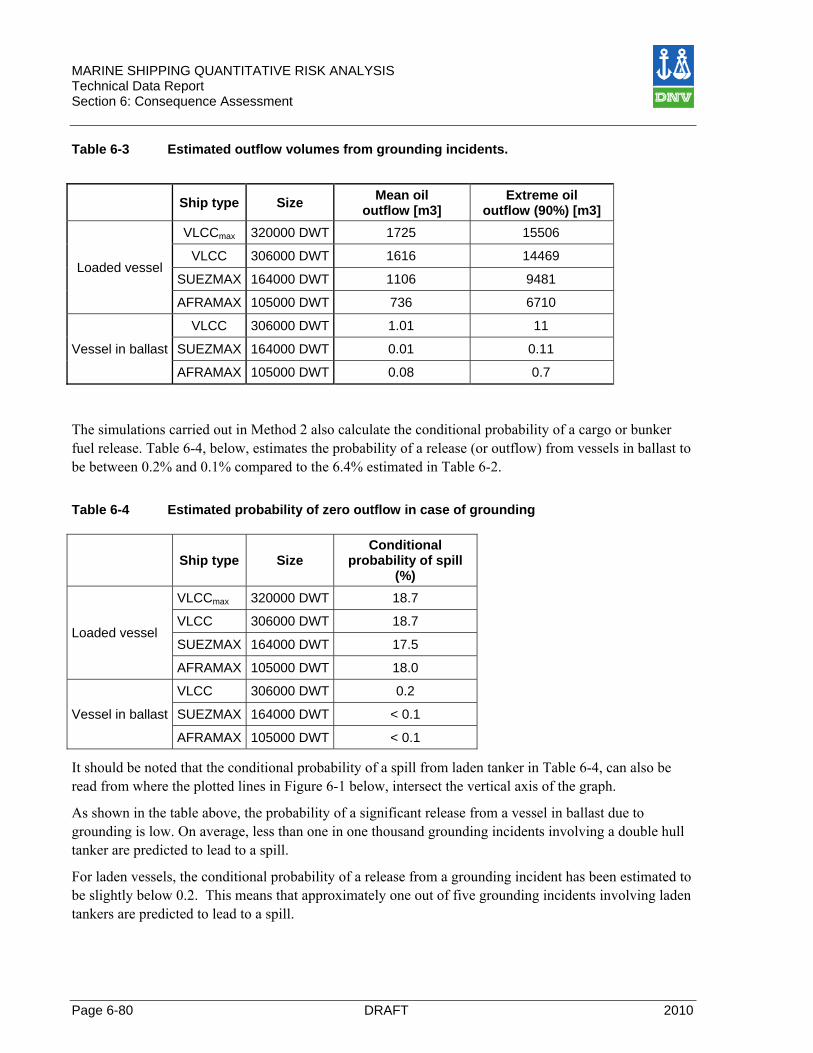
MARINE SHIPPING QUANTITATIVE RISK ANALYSIS Technical Data Report Section 6: Consequence Assessment
Page 6-80 DRAFT 2010
Table 6-3 Estimated outflow volumes from grounding incidents.
Ship type Size Mean oil outflow [m3]
Extreme oil outflow (90%) [m3]
Loaded vessel
VLCCmax 320000 DWT 1725 15506
VLCC 306000 DWT 1616 14469
SUEZMAX 164000 DWT 1106 9481
AFRAMAX 105000 DWT 736 6710
Vessel in ballast
VLCC 306000 DWT 1.01 11
SUEZMAX 164000 DWT 0.01 0.11
AFRAMAX 105000 DWT 0.08 0.7
The simulations carried out in Method 2 also calculate the conditional probability of a cargo or bunker fuel release. Table 6-4, below, estimates the probability of a release (or outflow) from vessels in ballast to be between 0.2% and 0.1% compared to the 6.4% estimated in Table 6-2.
Table 6-4 Estimated probability of zero outflow in case of grounding
Ship type Size Conditional
probability of spill (%)
Loaded vessel
VLCCmax 320000 DWT 18.7
VLCC 306000 DWT 18.7
SUEZMAX 164000 DWT 17.5
AFRAMAX 105000 DWT 18.0
Vessel in ballast
VLCC 306000 DWT 0.2
SUEZMAX 164000 DWT < 0.1
AFRAMAX 105000 DWT < 0.1
It should be noted that the conditional probability of a spill from laden tanker in Table 6-4, can also be read from where the plotted lines in Figure 6-1 below, intersect the vertical axis of the graph.
As shown in the table above, the probability of a significant release from a vessel in ballast due to grounding is low. On average, less than one in one thousand grounding incidents involving a double hull tanker are predicted to lead to a spill.
For laden vessels, the conditional probability of a release from a grounding incident has been estimated to be slightly below 0.2. This means that approximately one out of five grounding incidents involving laden tankers are predicted to lead to a spill.
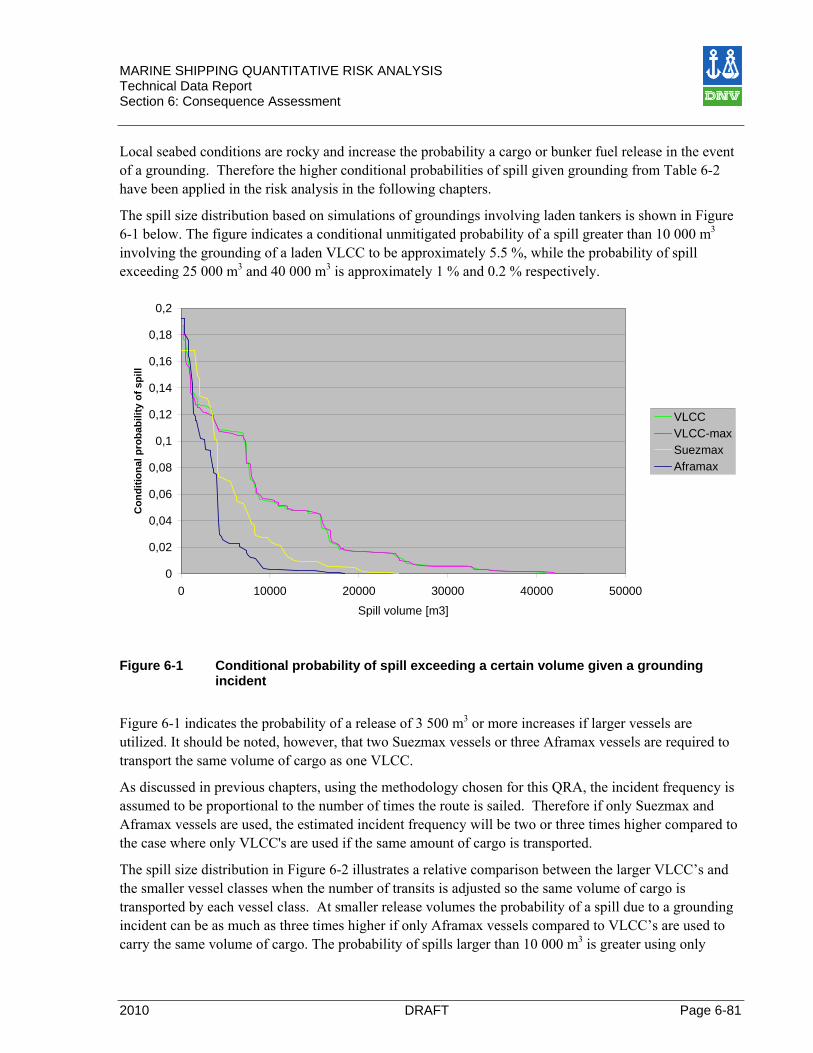
MARINE SHIPPING QUANTITATIVE RISK ANALYSIS Technical Data Report Section 6: Consequence Assessment
2010 DRAFT Page 6-81
Local seabed conditions are rocky and increase the probability a cargo or bunker fuel release in the event of a grounding. Therefore the higher conditional probabilities of spill given grounding from Table 6-2 have been applied in the risk analysis in the following chapters.
The spill size distribution based on simulations of groundings involving laden tankers is shown in Figure 6-1 below. The figure indicates a conditional unmitigated probability of a spill greater than 10 000 m3 involving the grounding of a laden VLCC to be approximately 5.5 %, while the probability of spill exceeding 25 000 m3 and 40 000 m3 is approximately 1 % and 0.2 % respectively.
0
0,02
0,04
0,06
0,08
0,1
0,12
0,14
0,16
0,18
0,2
0 10000 20000 30000 40000 50000Spill volume [m3]
Con
ditio
nal p
roba
bilit
y of
spi
ll
VLCCVLCC-maxSuezmaxAframax
Figure 6-1 Conditional probability of spill exceeding a certain volume given a grounding
incident
Figure 6-1 indicates the probability of a release of 3 500 m3 or more increases if larger vessels are utilized. It should be noted, however, that two Suezmax vessels or three Aframax vessels are required to transport the same volume of cargo as one VLCC.
As discussed in previous chapters, using the methodology chosen for this QRA, the incident frequency is assumed to be proportional to the number of times the route is sailed. Therefore if only Suezmax and Aframax vessels are used, the estimated incident frequency will be two or three times higher compared to the case where only VLCC's are used if the same amount of cargo is transported.
The spill size distribution in Figure 6-2 illustrates a relative comparison between the larger VLCC’s and the smaller vessel classes when the number of transits is adjusted so the same volume of cargo is transported by each vessel class. At smaller release volumes the probability of a spill due to a grounding incident can be as much as three times higher if only Aframax vessels compared to VLCC’s are used to carry the same volume of cargo. The probability of spills larger than 10 000 m3 is greater using only
MARINE SHIPPING QUANTITATIVE RISK ANALYSIS Technical Data Report Section 6: Consequence Assessment
Page 6-82 DRAFT 2010
VLCC’s, however the predicted amount of cargo released over a given period of time as result of groundings will still be 15% to 20 % greater using only Suezmax and Aframax class tankers due to the longer return period of more extreme events.
The conclusion of this analysis is that while a VLCC may have the potential to release more cargo in one incident, it is more likely that by using only Aframax or Suezmax tankers there will be a greater potential for more frequent smaller volume spills and a greater amount of cargo released over a period of time.
0
0,5
1
1,5
2
2,5
3
3,5
4
0 10000 20000 30000 40000 50000
Spill volume [m3]
Rel
ativ
e fr
eque
ncy
(VLC
C m
ax =
1)
VLCCVLCC-maxSuezmaxAframax
Figure 6-2 Relative comparison of the frequency of spills from grounding exceeding a certain
volume assuming all vessel classes transport the same volume of cargo.
6.3.2 Collisions When modelling a spill resulting from a collision the vessel used in the model is assumed to have been struck by another vessel. This is a conservative, worst case, scenario as the vessel struck is likely to suffer greater damage than the vessel that it was struck by.
The distribution of consequences given a collision occurs are provided in Table 6-5 below. Conservative assumptions have been made given that the exact nature of the collision will have great impact on whether a spill occurs and what size of spill occurs.
As is the case for grounding, higher collision energy is required to penetrate the outer and inner hull and cargo tank of a double hull tanker compared to the energy required to penetrate the cargo tank of a single hull tanker and cause a spill.
MARINE SHIPPING QUANTITATIVE RISK ANALYSIS Technical Data Report Section 6: Consequence Assessment
2010 DRAFT Page 6-83
6.3.2.1 Conditional Probability of a Spill from Collisions (Method 1)
LRFP collision damage categories and DNV’s assumption on the conditional spill probabilities for each damage category are discussed below and summarized in Table 6-5.
Minor Damage:
• For both laden and vessels in ballast it is assumed that minor damage will not lead to a spill of cargo.
Major Damage:
• For laden vessels it is assumed that 3 out of 4 collision events causing major damage will have sufficient energy to penetrate a cargo or bunker fuel tank.
• For vessels in ballast it is assumed that a spill will occur 10% of the time. Bunker fuel tanks are generally placed near the stern of a vessel in areas less likely to be damaged by being struck by another vessel.
Total Loss
• For both laden and vessels in ballast it is conservatively assumed that all cargo and / or bunker fuel contents will be released.
Table 6-5 LRFP damage frequency distribution and DNV estimates of the conditional
probability of a release of cargo or bunker fuel from collision incidents
Damage category Description
Frequency distribution1
(%)
Conditional probability of spill (%)
Laden Ballast
Total loss The vessel is damaged beyond repair from an insurance perspective Negligible 100 100
Major damage Damage through the outer hull. 25.5 75 10
Minor damage
Small indents that do not penetrate the outer hull 74.5 0 0
Total 19.1 2.6
6.3.2.2 Conditional Probability of Spill from Collisions (Method 2)
Monte-Carlo simulations (according to IMO’s MARPOL regulations as outlined in MEPC 49/22/Add.2) have been performed for collisions (side damage) and mean and extreme oil outflows have been calculated and are shown in table Table 6-6 below.

MARINE SHIPPING QUANTITATIVE RISK ANALYSIS Technical Data Report Section 6: Consequence Assessment
Page 6-84 DRAFT 2010
Table 6-6 Probability of zero outflow in case of collisions and outflow volumes
Ship type Size Mean oil outflow [m3]
Extreme oil outflow (90%) [m3]
Loaded vessel
VLCC 320000 DWT 1399 35839
VLCC 306000 DWT 1397 35605
SUEZMAX 164000 DWT 1280 28980
AFRAMAX 105000 DWT 638 17539
Vessel in ballast
VLCC 306000 DWT 210 2101
SUEZMAX 164000 DWT 86 860
AFRAMAX 105000 DWT 174 1414
The simulations carried out in Method 2 also calculate the conditional probability of a cargo or bunker fuel release. Table 6-7, below, estimates the probability of a release (or outflow) from vessels in ballast involved in a collision to be between 8.3% and 14.2% compared to the 2.6% estimated in Table 6-5 above.
The local traffic pattern is such that with the exception a few shipping lane intersections, the probability of tanker being hit at a perpendicular angle in the cargo or fuel tank area is lower than the world average. Therefore the lower conditional probabilities of spill given collision from Table 6-5 have been applied in the remainder of this QRA.
Table 6-7 Probability of zero outflow in case of collisions and outflow volumes
Ship type Size Conditional
probability of spill (%)
Loaded vessel
VLCC 320000 DWT 23.9 VLCC 306000 DWT 24.9
SUEZMAX 164000 DWT 27.7 AFRAMAX 105000 DWT 21.0
Vessel in ballast
VLCC 306000 DWT 8.3 SUEZMAX 164000 DWT 5.7 AFRAMAX 105000 DWT 14.2
As shown in the tables above, both the probability of release and the expected outflow volumes are higher for collisions than grounding. For laden vessels, the probability of a spill in case of collision has been estimated to be between 21 % and 28%. These values can also be read off Figure 6-3 below, where the plotted lines intersect the vertical axis.

MARINE SHIPPING QUANTITATIVE RISK ANALYSIS Technical Data Report Section 6: Consequence Assessment
2010 DRAFT Page 6-85
The probabilities of spills above a certain size, are shown in Figure 6-3 below. The average probability of a spill of cargo of 10 000 m3 or more as a result of a collision involving a laden VLCC is approximately 25 %, while the probability of spill exceeding 20 000 m3 and 50 000 m3 is approximately 10 % and 0.3 % respectively.
00,020,040,060,08
0,10,120,140,160,18
0,20,220,240,260,28
0,3
0 10000 20000 30000 40000 50000 60000 70000 80000
Spill volume [m3]
Con
ditio
nal p
roba
bilit
y of
spi
ll
VLCCVLCC-maxSuezmaxAframax
Figure 6-3 Conditional probability of spill exceeding a certain volume given a collision
incident
As per grounding, the same argument also applies to collisions that incident frequency (and therefore spill frequency) is dependent on the size of vessel used to move a certain volume of oil. This is illustrated in Figure 6-4, where a relative comparison has been made where each vessel class is assumed to transport the same volume of cargo. The probability of spills larger than 30 000 m3 is greater with VLCC’s, but the expected spill volume over a given period of time as result from collision will be 45 to 75 % higher if only Suezmax and Aframax vessels are used compared to using only VLCC’s.
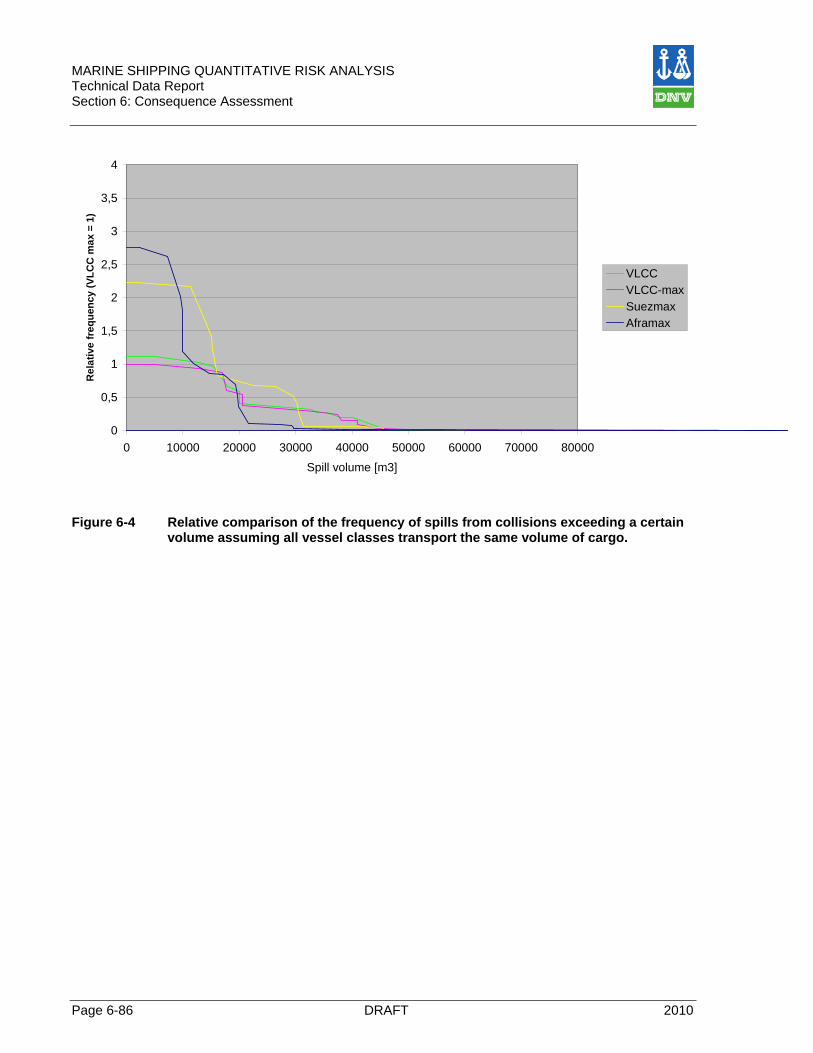
MARINE SHIPPING QUANTITATIVE RISK ANALYSIS Technical Data Report Section 6: Consequence Assessment
Page 6-86 DRAFT 2010
0
0,5
1
1,5
2
2,5
3
3,5
4
0 10000 20000 30000 40000 50000 60000 70000 80000
Spill volume [m3]
Rel
ativ
e fr
eque
ncy
(VLC
C m
ax =
1)
VLCCVLCC-maxSuezmaxAframax
Figure 6-4 Relative comparison of the frequency of spills from collisions exceeding a certain
volume assuming all vessel classes transport the same volume of cargo.
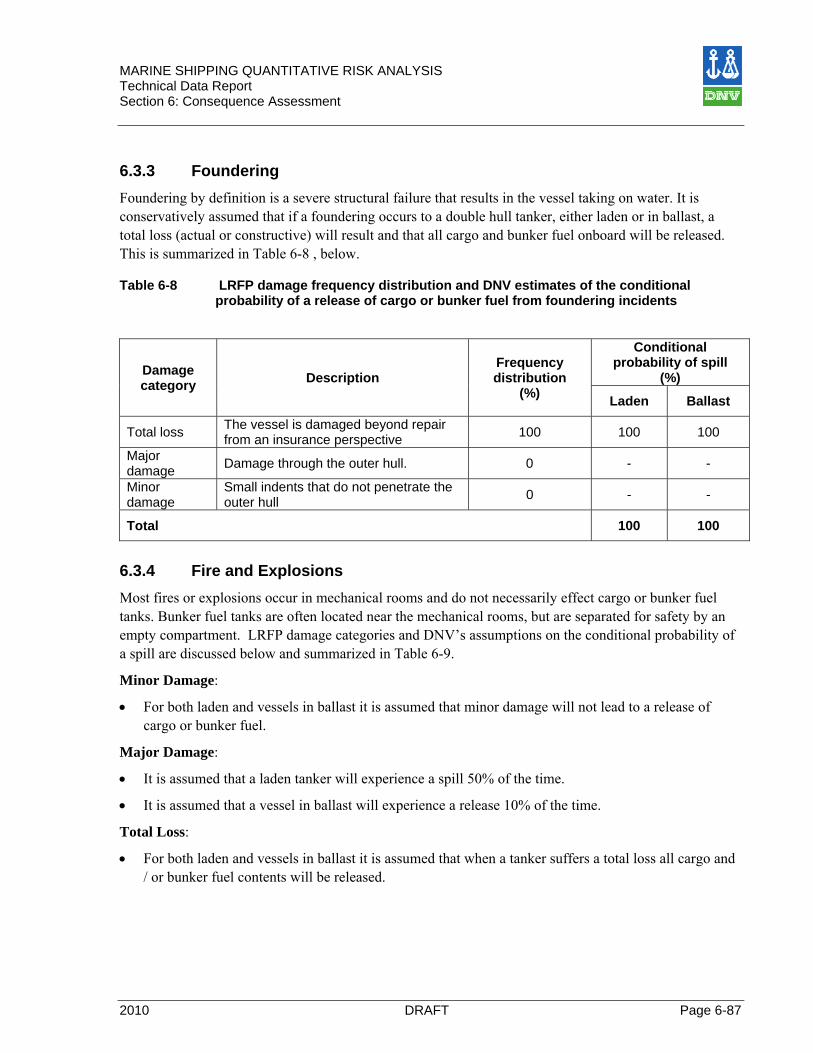
MARINE SHIPPING QUANTITATIVE RISK ANALYSIS Technical Data Report Section 6: Consequence Assessment
2010 DRAFT Page 6-87
6.3.3 Foundering Foundering by definition is a severe structural failure that results in the vessel taking on water. It is conservatively assumed that if a foundering occurs to a double hull tanker, either laden or in ballast, a total loss (actual or constructive) will result and that all cargo and bunker fuel onboard will be released. This is summarized in Table 6-8 , below. Table 6-8 LRFP damage frequency distribution and DNV estimates of the conditional
probability of a release of cargo or bunker fuel from foundering incidents
Damage category Description
Frequency distribution
(%)
Conditional probability of spill
(%)
Laden Ballast
Total loss The vessel is damaged beyond repair from an insurance perspective 100 100 100
Major damage Damage through the outer hull. 0 - -
Minor damage
Small indents that do not penetrate the outer hull 0 - -
Total 100 100
6.3.4 Fire and Explosions Most fires or explosions occur in mechanical rooms and do not necessarily effect cargo or bunker fuel tanks. Bunker fuel tanks are often located near the mechanical rooms, but are separated for safety by an empty compartment. LRFP damage categories and DNV’s assumptions on the conditional probability of a spill are discussed below and summarized in Table 6-9.
Minor Damage:
• For both laden and vessels in ballast it is assumed that minor damage will not lead to a release of cargo or bunker fuel.
Major Damage:
• It is assumed that a laden tanker will experience a spill 50% of the time.
• It is assumed that a vessel in ballast will experience a release 10% of the time.
Total Loss:
• For both laden and vessels in ballast it is assumed that when a tanker suffers a total loss all cargo and / or bunker fuel contents will be released.
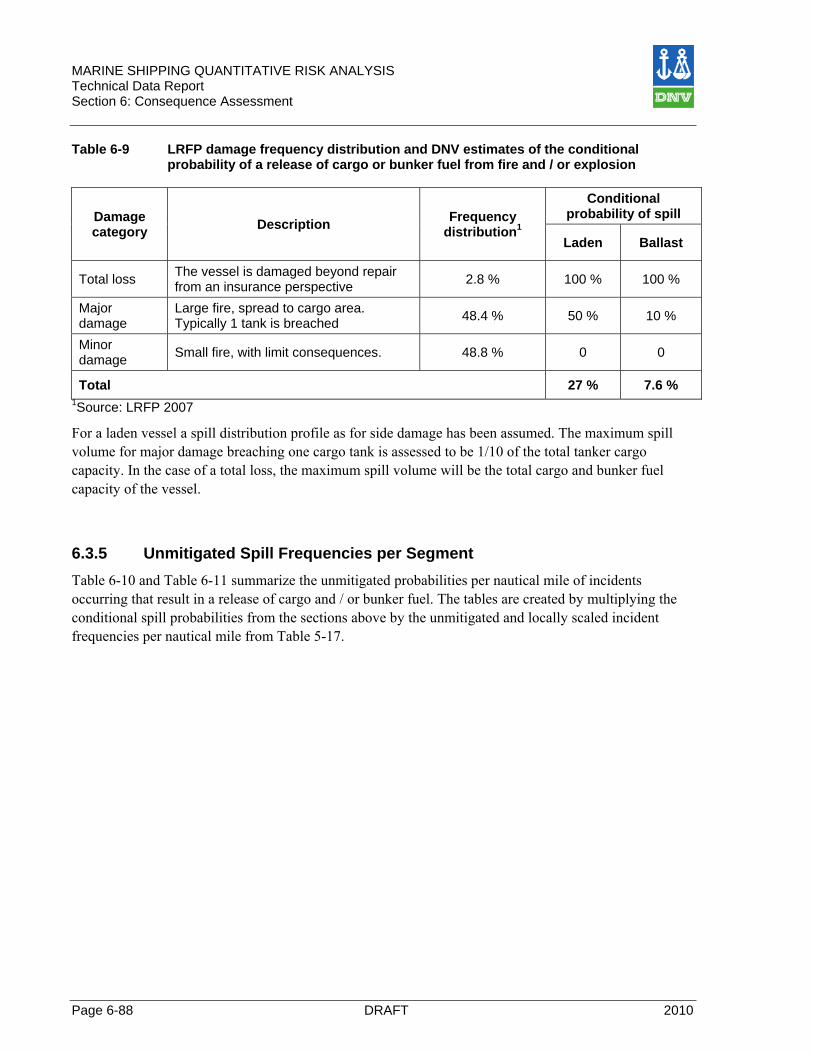
MARINE SHIPPING QUANTITATIVE RISK ANALYSIS Technical Data Report Section 6: Consequence Assessment
Page 6-88 DRAFT 2010
Table 6-9 LRFP damage frequency distribution and DNV estimates of the conditional probability of a release of cargo or bunker fuel from fire and / or explosion
Damage category Description Frequency
distribution1
Conditional probability of spill
Laden Ballast
Total loss The vessel is damaged beyond repair from an insurance perspective 2.8 % 100 % 100 %
Major damage
Large fire, spread to cargo area. Typically 1 tank is breached 48.4 % 50 % 10 %
Minor damage Small fire, with limit consequences. 48.8 % 0 0
Total 27 % 7.6 % 1Source: LRFP 2007
For a laden vessel a spill distribution profile as for side damage has been assumed. The maximum spill volume for major damage breaching one cargo tank is assessed to be 1/10 of the total tanker cargo capacity. In the case of a total loss, the maximum spill volume will be the total cargo and bunker fuel capacity of the vessel.
6.3.5 Unmitigated Spill Frequencies per Segment Table 6-10 and Table 6-11 summarize the unmitigated probabilities per nautical mile of incidents occurring that result in a release of cargo and / or bunker fuel. The tables are created by multiplying the conditional spill probabilities from the sections above by the unmitigated and locally scaled incident frequencies per nautical mile from Table 5-17.
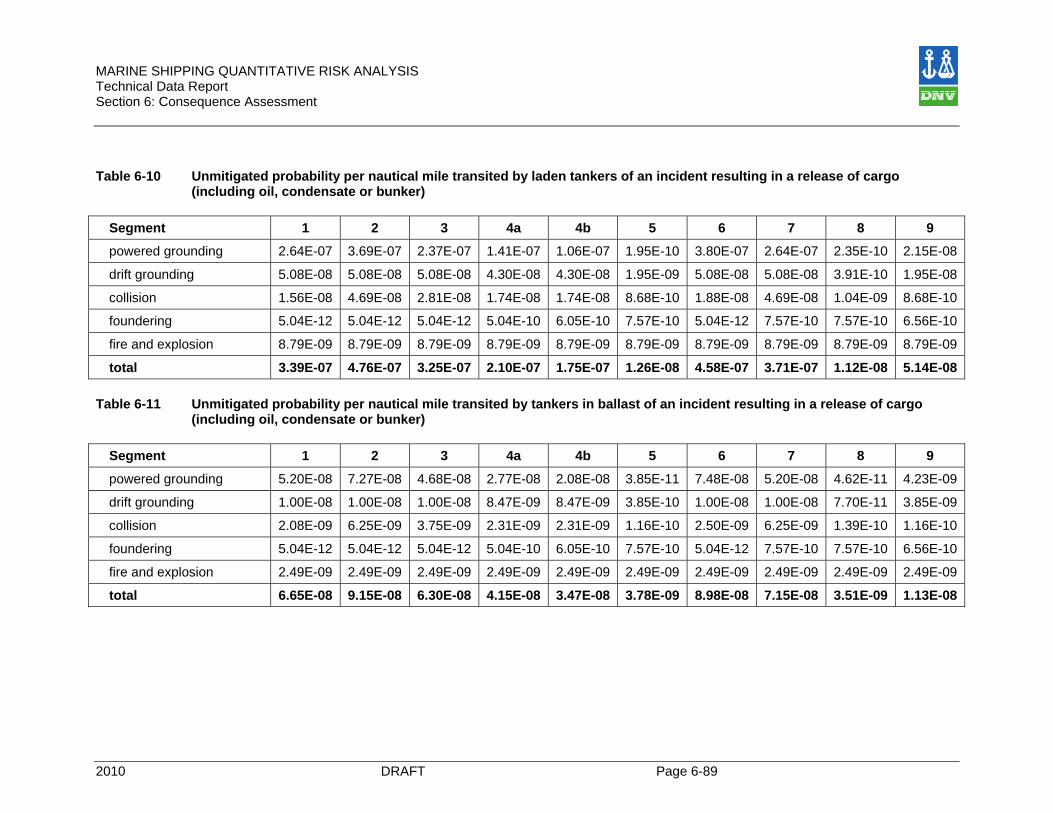
MARINE SHIPPING QUANTITATIVE RISK ANALYSIS Technical Data Report Section 6: Consequence Assessment
2010 DRAFT Page 6-89
Table 6-10 Unmitigated probability per nautical mile transited by laden tankers of an incident resulting in a release of cargo
(including oil, condensate or bunker)
Segment 1 2 3 4a 4b 5 6 7 8 9
powered grounding 2.64E-07 3.69E-07 2.37E-07 1.41E-07 1.06E-07 1.95E-10 3.80E-07 2.64E-07 2.35E-10 2.15E-08
drift grounding 5.08E-08 5.08E-08 5.08E-08 4.30E-08 4.30E-08 1.95E-09 5.08E-08 5.08E-08 3.91E-10 1.95E-08
collision 1.56E-08 4.69E-08 2.81E-08 1.74E-08 1.74E-08 8.68E-10 1.88E-08 4.69E-08 1.04E-09 8.68E-10
foundering 5.04E-12 5.04E-12 5.04E-12 5.04E-10 6.05E-10 7.57E-10 5.04E-12 7.57E-10 7.57E-10 6.56E-10
fire and explosion 8.79E-09 8.79E-09 8.79E-09 8.79E-09 8.79E-09 8.79E-09 8.79E-09 8.79E-09 8.79E-09 8.79E-09
total 3.39E-07 4.76E-07 3.25E-07 2.10E-07 1.75E-07 1.26E-08 4.58E-07 3.71E-07 1.12E-08 5.14E-08 Table 6-11 Unmitigated probability per nautical mile transited by tankers in ballast of an incident resulting in a release of cargo
(including oil, condensate or bunker)
Segment 1 2 3 4a 4b 5 6 7 8 9
powered grounding 5.20E-08 7.27E-08 4.68E-08 2.77E-08 2.08E-08 3.85E-11 7.48E-08 5.20E-08 4.62E-11 4.23E-09
drift grounding 1.00E-08 1.00E-08 1.00E-08 8.47E-09 8.47E-09 3.85E-10 1.00E-08 1.00E-08 7.70E-11 3.85E-09
collision 2.08E-09 6.25E-09 3.75E-09 2.31E-09 2.31E-09 1.16E-10 2.50E-09 6.25E-09 1.39E-10 1.16E-10
foundering 5.04E-12 5.04E-12 5.04E-12 5.04E-10 6.05E-10 7.57E-10 5.04E-12 7.57E-10 7.57E-10 6.56E-10
fire and explosion 2.49E-09 2.49E-09 2.49E-09 2.49E-09 2.49E-09 2.49E-09 2.49E-09 2.49E-09 2.49E-09 2.49E-09
total 6.65E-08 9.15E-08 6.30E-08 4.15E-08 3.47E-08 3.78E-09 8.98E-08 7.15E-08 3.51E-09 1.13E-08
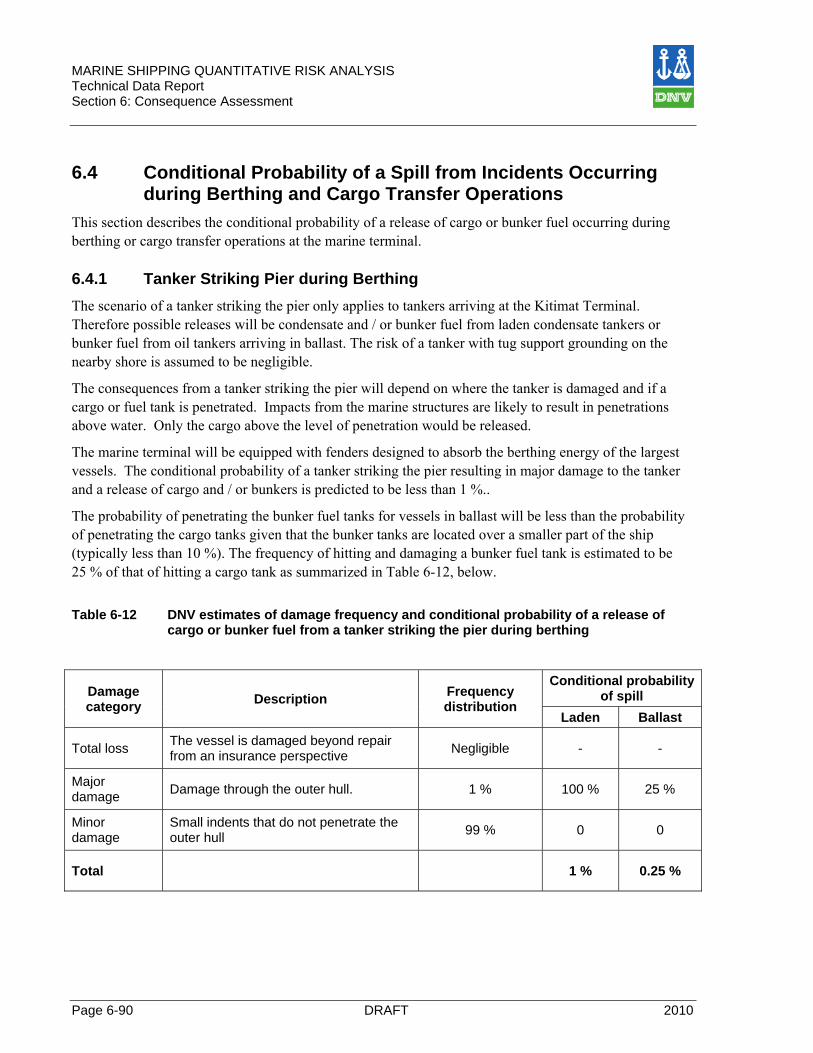
MARINE SHIPPING QUANTITATIVE RISK ANALYSIS Technical Data Report Section 6: Consequence Assessment
Page 6-90 DRAFT 2010
6.4 Conditional Probability of a Spill from Incidents Occurring during Berthing and Cargo Transfer Operations
This section describes the conditional probability of a release of cargo or bunker fuel occurring during berthing or cargo transfer operations at the marine terminal.
6.4.1 Tanker Striking Pier during Berthing The scenario of a tanker striking the pier only applies to tankers arriving at the Kitimat Terminal. Therefore possible releases will be condensate and / or bunker fuel from laden condensate tankers or bunker fuel from oil tankers arriving in ballast. The risk of a tanker with tug support grounding on the nearby shore is assumed to be negligible.
The consequences from a tanker striking the pier will depend on where the tanker is damaged and if a cargo or fuel tank is penetrated. Impacts from the marine structures are likely to result in penetrations above water. Only the cargo above the level of penetration would be released.
The marine terminal will be equipped with fenders designed to absorb the berthing energy of the largest vessels. The conditional probability of a tanker striking the pier resulting in major damage to the tanker and a release of cargo and / or bunkers is predicted to be less than 1 %..
The probability of penetrating the bunker fuel tanks for vessels in ballast will be less than the probability of penetrating the cargo tanks given that the bunker tanks are located over a smaller part of the ship (typically less than 10 %). The frequency of hitting and damaging a bunker fuel tank is estimated to be 25 % of that of hitting a cargo tank as summarized in Table 6-12, below.
Table 6-12 DNV estimates of damage frequency and conditional probability of a release of
cargo or bunker fuel from a tanker striking the pier during berthing
Damage category Description Frequency
distribution
Conditional probability of spill
Laden Ballast
Total loss The vessel is damaged beyond repair from an insurance perspective Negligible - -
Major damage Damage through the outer hull. 1 % 100 % 25 %
Minor damage
Small indents that do not penetrate the outer hull 99 % 0 0
Total 1 % 0.25 %
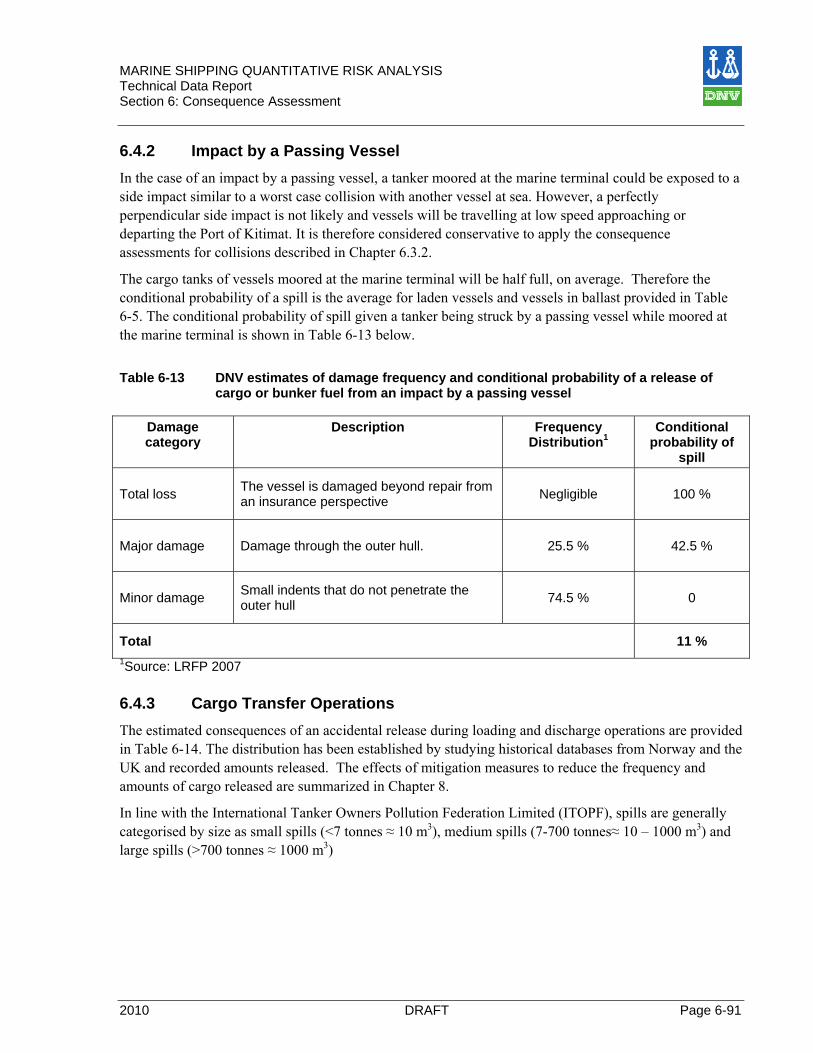
MARINE SHIPPING QUANTITATIVE RISK ANALYSIS Technical Data Report Section 6: Consequence Assessment
2010 DRAFT Page 6-91
6.4.2 Impact by a Passing Vessel In the case of an impact by a passing vessel, a tanker moored at the marine terminal could be exposed to a side impact similar to a worst case collision with another vessel at sea. However, a perfectly perpendicular side impact is not likely and vessels will be travelling at low speed approaching or departing the Port of Kitimat. It is therefore considered conservative to apply the consequence assessments for collisions described in Chapter 6.3.2.
The cargo tanks of vessels moored at the marine terminal will be half full, on average. Therefore the conditional probability of a spill is the average for laden vessels and vessels in ballast provided in Table 6-5. The conditional probability of spill given a tanker being struck by a passing vessel while moored at the marine terminal is shown in Table 6-13 below.
Table 6-13 DNV estimates of damage frequency and conditional probability of a release of
cargo or bunker fuel from an impact by a passing vessel
Damage category
Description Frequency Distribution1
Conditional probability of
spill
Total loss The vessel is damaged beyond repair from an insurance perspective Negligible 100 %
Major damage Damage through the outer hull. 25.5 % 42.5 %
Minor damage Small indents that do not penetrate the outer hull 74.5 % 0
Total 11 % 1Source: LRFP 2007
6.4.3 Cargo Transfer Operations The estimated consequences of an accidental release during loading and discharge operations are provided in Table 6-14. The distribution has been established by studying historical databases from Norway and the UK and recorded amounts released. The effects of mitigation measures to reduce the frequency and amounts of cargo released are summarized in Chapter 8.
In line with the International Tanker Owners Pollution Federation Limited (ITOPF), spills are generally categorised by size as small spills (<7 tonnes ≈ 10 m3), medium spills (7-700 tonnes≈ 10 – 1000 m3) and large spills (>700 tonnes ≈ 1000 m3)
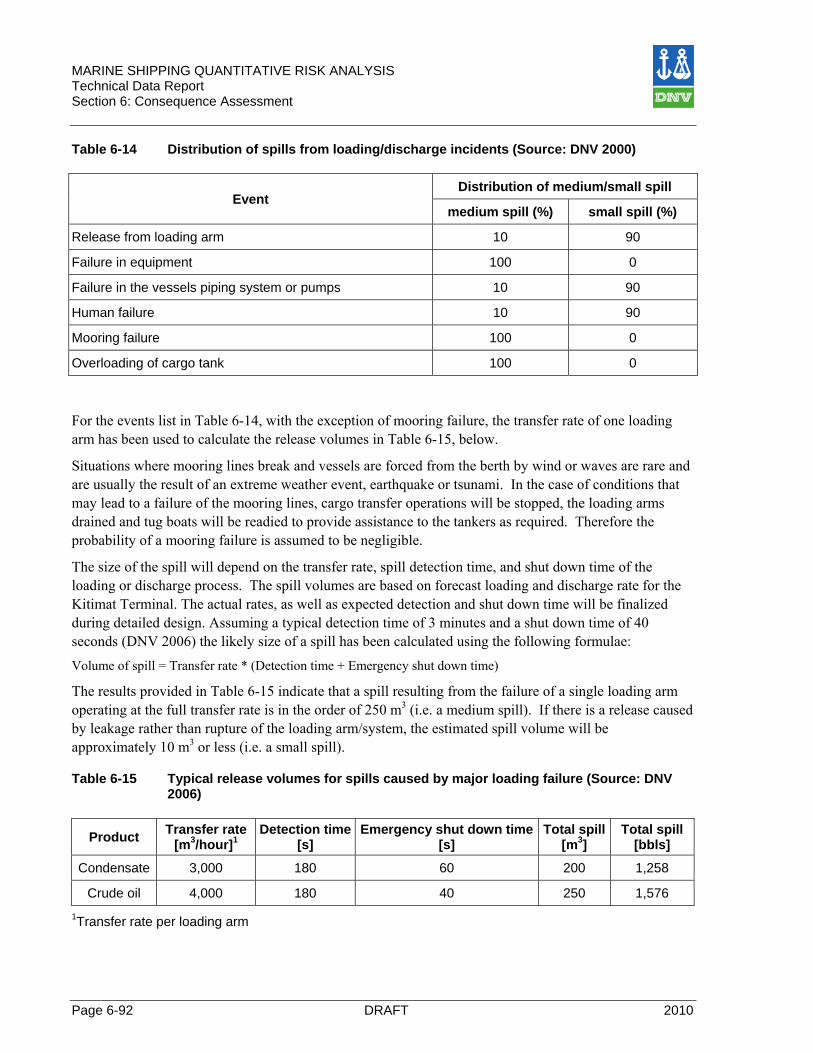
MARINE SHIPPING QUANTITATIVE RISK ANALYSIS Technical Data Report Section 6: Consequence Assessment
Page 6-92 DRAFT 2010
Table 6-14 Distribution of spills from loading/discharge incidents (Source: DNV 2000)
Event Distribution of medium/small spill
medium spill (%) small spill (%)
Release from loading arm 10 90
Failure in equipment 100 0
Failure in the vessels piping system or pumps 10 90
Human failure 10 90
Mooring failure 100 0
Overloading of cargo tank 100 0
For the events list in Table 6-14, with the exception of mooring failure, the transfer rate of one loading arm has been used to calculate the release volumes in Table 6-15, below.
Situations where mooring lines break and vessels are forced from the berth by wind or waves are rare and are usually the result of an extreme weather event, earthquake or tsunami. In the case of conditions that may lead to a failure of the mooring lines, cargo transfer operations will be stopped, the loading arms drained and tug boats will be readied to provide assistance to the tankers as required. Therefore the probability of a mooring failure is assumed to be negligible.
The size of the spill will depend on the transfer rate, spill detection time, and shut down time of the loading or discharge process. The spill volumes are based on forecast loading and discharge rate for the Kitimat Terminal. The actual rates, as well as expected detection and shut down time will be finalized during detailed design. Assuming a typical detection time of 3 minutes and a shut down time of 40 seconds (DNV 2006) the likely size of a spill has been calculated using the following formulae: Volume of spill = Transfer rate * (Detection time + Emergency shut down time)
The results provided in Table 6-15 indicate that a spill resulting from the failure of a single loading arm operating at the full transfer rate is in the order of 250 m3 (i.e. a medium spill). If there is a release caused by leakage rather than rupture of the loading arm/system, the estimated spill volume will be approximately 10 m3 or less (i.e. a small spill). Table 6-15 Typical release volumes for spills caused by major loading failure (Source: DNV
2006)
Product Transfer rate [m3/hour]1
Detection time[s]
Emergency shut down time[s]
Total spill [m3]
Total spill[bbls]
Condensate 3,000 180 60 200 1,258
Crude oil 4,000 180 40 250 1,576 1Transfer rate per loading arm
MARINE SHIPPING QUANTITATIVE RISK ANALYSIS Technical Data Report Section 7: Unmitigated Risk Evaluation
2010 DRAFT Page 7-93
7 Unmitigated Risk Evaluation This chapter discusses the unmitigated risk of incidents or spills occurring en route to, as well as during berthing and cargo transfer operations at, the Kitimat Terminal. The effects of risk mitigation measures on the unmitigated risks presented in this chapter are evaluated in Chapter 8.
The discussion of risk in this chapter has been divided into the following parts:
1. Definition of incident and spill return periods
2. Relative unmitigated incident and spill return periods for each marine tanker route
3. The effect of alternate routes on the relative unmitigated return periods for each route
4. Sensitivity analysis of input parameters including:
a. Select frequency scaling (K) factors from Chapter 5
b. Forecast tanker calls to the Kitimat Terminal
c. Future vessel traffic in the study area
5. Unmitigated incident and spill return periods for each marine tanker route based on forecast tanker calls to the Kitimat Terminal
6. Unmitigated return periods for spills during berthing and cargo transfer operations
7. Increased risk areas
8. Conclusions
7.1 Definition of Incident and Spill Return Periods The scaled incident frequencies from Table 5-17 for each segment are multiplied by the segment length and number of times the segment is transited per year to calculate the annual probability of each incident occurring along the segment. The equation below sums the annual probabilities of incidents for the segment, with the inverse being the overall incident return period.
Incident return periodsegment i = 1 / (Σ(Fi,j · Xi · n),
where Fi,j = frequency of incident type j in segment i (per nm),
Xi = number of nm sailing distance through segment i, and
ni = number of times the route through segment i is travelled per year
To calculate the return period for each route, the return periods for the applicable segments are totalled. For example, the formula for calculating the incident return period for the North Route is as follows:
1/ (1/return period segment 1 + 1/return period segment 2 + 1/return period segment 3 + 1/return period segment 4a + 1/return period segment 4b + 1/return period segment 5)
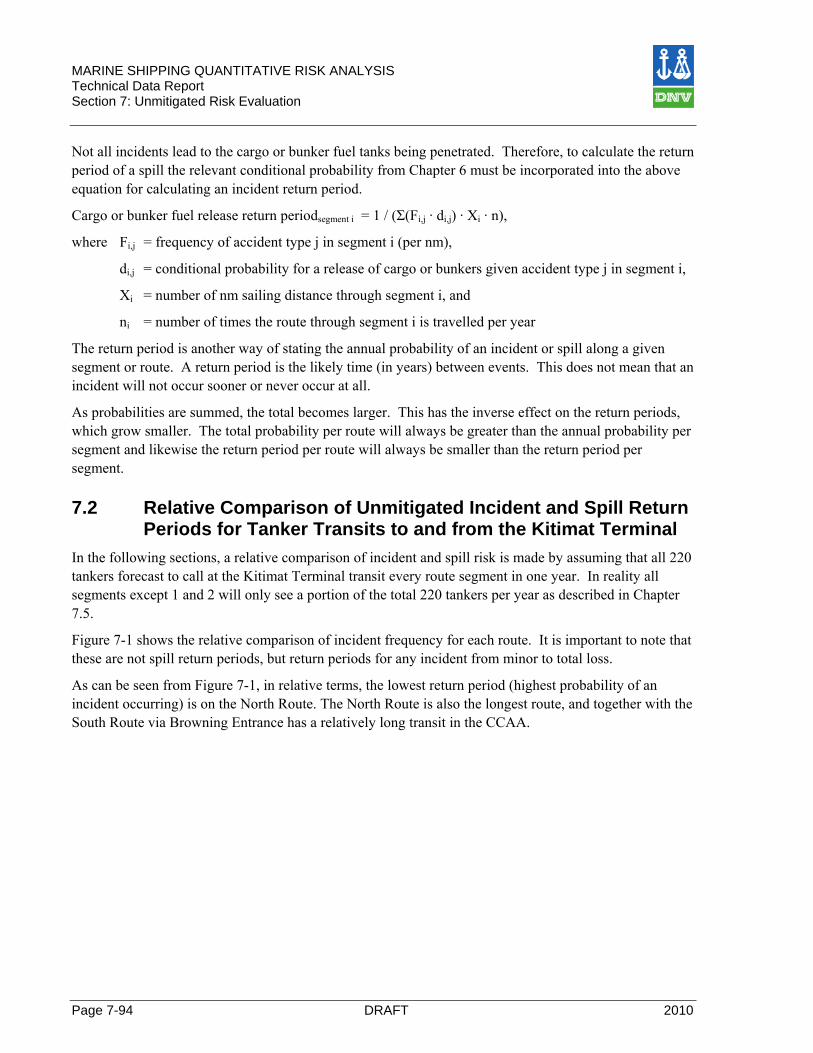
MARINE SHIPPING QUANTITATIVE RISK ANALYSIS Technical Data Report Section 7: Unmitigated Risk Evaluation
Page 7-94 DRAFT 2010
Not all incidents lead to the cargo or bunker fuel tanks being penetrated. Therefore, to calculate the return period of a spill the relevant conditional probability from Chapter 6 must be incorporated into the above equation for calculating an incident return period.
Cargo or bunker fuel release return periodsegment i = 1 / (Σ(Fi,j · di,j) · Xi · n),
where Fi,j = frequency of accident type j in segment i (per nm),
di,j = conditional probability for a release of cargo or bunkers given accident type j in segment i,
Xi = number of nm sailing distance through segment i, and
ni = number of times the route through segment i is travelled per year
The return period is another way of stating the annual probability of an incident or spill along a given segment or route. A return period is the likely time (in years) between events. This does not mean that an incident will not occur sooner or never occur at all.
As probabilities are summed, the total becomes larger. This has the inverse effect on the return periods, which grow smaller. The total probability per route will always be greater than the annual probability per segment and likewise the return period per route will always be smaller than the return period per segment.
7.2 Relative Comparison of Unmitigated Incident and Spill Return Periods for Tanker Transits to and from the Kitimat Terminal
In the following sections, a relative comparison of incident and spill risk is made by assuming that all 220 tankers forecast to call at the Kitimat Terminal transit every route segment in one year. In reality all segments except 1 and 2 will only see a portion of the total 220 tankers per year as described in Chapter 7.5.
Figure 7-1 shows the relative comparison of incident frequency for each route. It is important to note that these are not spill return periods, but return periods for any incident from minor to total loss.
As can be seen from Figure 7-1, in relative terms, the lowest return period (highest probability of an incident occurring) is on the North Route. The North Route is also the longest route, and together with the South Route via Browning Entrance has a relatively long transit in the CCAA.
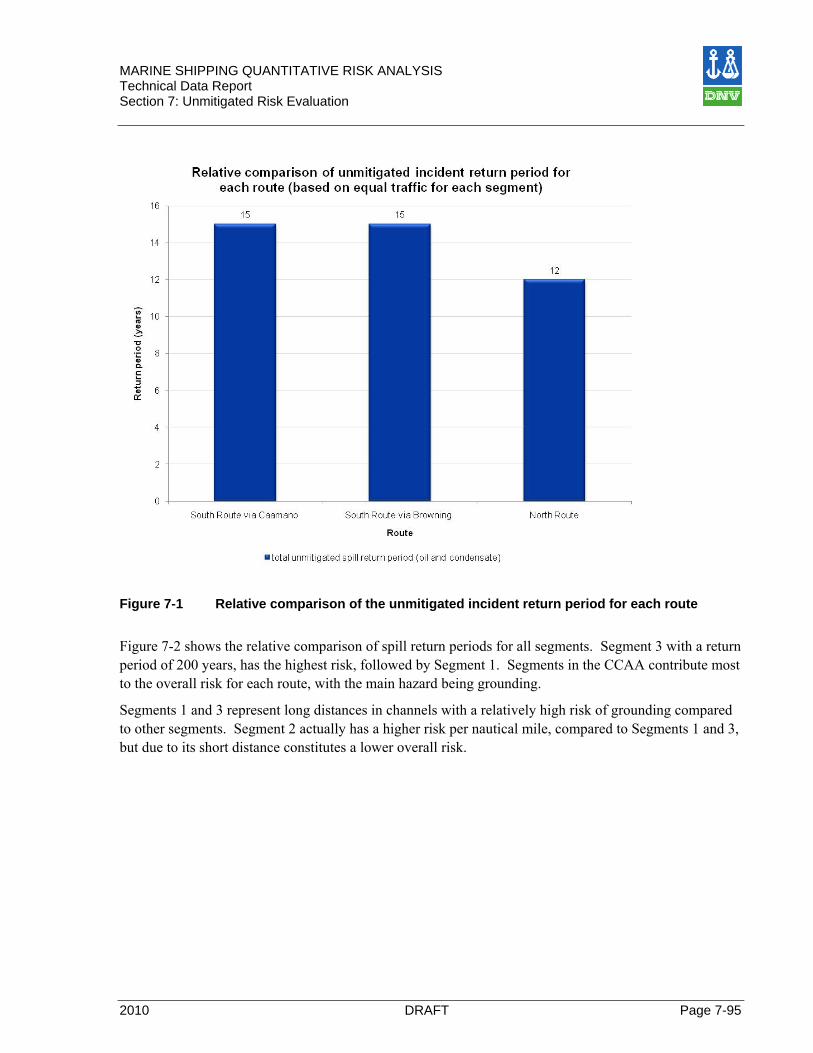
MARINE SHIPPING QUANTITATIVE RISK ANALYSIS Technical Data Report Section 7: Unmitigated Risk Evaluation
2010 DRAFT Page 7-95
Figure 7-1 Relative comparison of the unmitigated incident return period for each route
Figure 7-2 shows the relative comparison of spill return periods for all segments. Segment 3 with a return period of 200 years, has the highest risk, followed by Segment 1. Segments in the CCAA contribute most to the overall risk for each route, with the main hazard being grounding.
Segments 1 and 3 represent long distances in channels with a relatively high risk of grounding compared to other segments. Segment 2 actually has a higher risk per nautical mile, compared to Segments 1 and 3, but due to its short distance constitutes a lower overall risk.
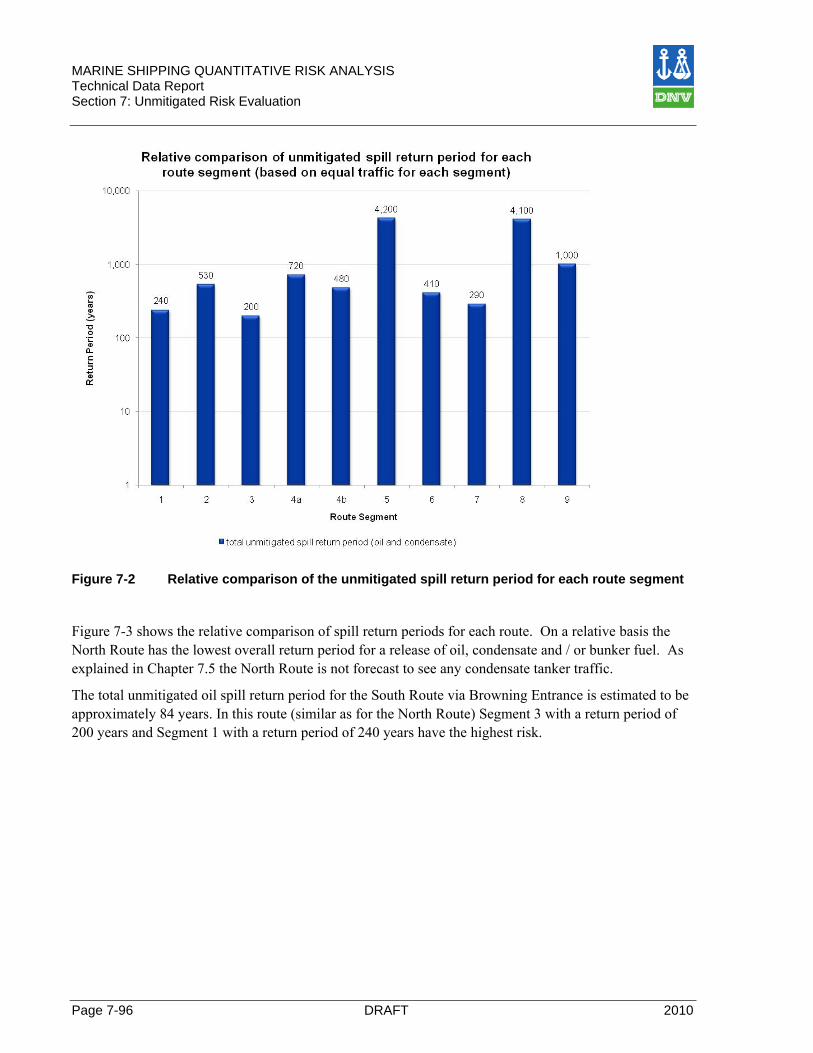
MARINE SHIPPING QUANTITATIVE RISK ANALYSIS Technical Data Report Section 7: Unmitigated Risk Evaluation
Page 7-96 DRAFT 2010
Figure 7-2 Relative comparison of the unmitigated spill return period for each route segment
Figure 7-3 shows the relative comparison of spill return periods for each route. On a relative basis the North Route has the lowest overall return period for a release of oil, condensate and / or bunker fuel. As explained in Chapter 7.5 the North Route is not forecast to see any condensate tanker traffic.
The total unmitigated oil spill return period for the South Route via Browning Entrance is estimated to be approximately 84 years. In this route (similar as for the North Route) Segment 3 with a return period of 200 years and Segment 1 with a return period of 240 years have the highest risk.
MARINE SHIPPING QUANTITATIVE RISK ANALYSIS Technical Data Report Section 7: Unmitigated Risk Evaluation
2010 DRAFT Page 7-97
Figure 7-3 Relative comparison of the unmitigated spill return period for each route
7.3 Relative Comparison of the Effect of the use of Alternative Routes on Unmitigated Spill Return Periods
As described in Chapter 3.1.5 there are three alternative routes tankers can use when transiting the CCAA. The effect on the risk per route is discussed below in relative terms (i.e. each route segment sees 440 transits per year).
7.3.1 Whale Channel Whale Channel is an alternative segment for the South Route via Caamano Sound and bypasses Segment 2 and parts of Segment 6, see Chapter 3.1.5.1 for further description.
The level of traffic in Segment 2 and 6 compared to Whale Channel is similar. Both routes end in Wright Sound with traffic from Kitimat entering either Lewis or Whale Channel. The risk of collision in Whale Channel should be similar to Lewis Passage.
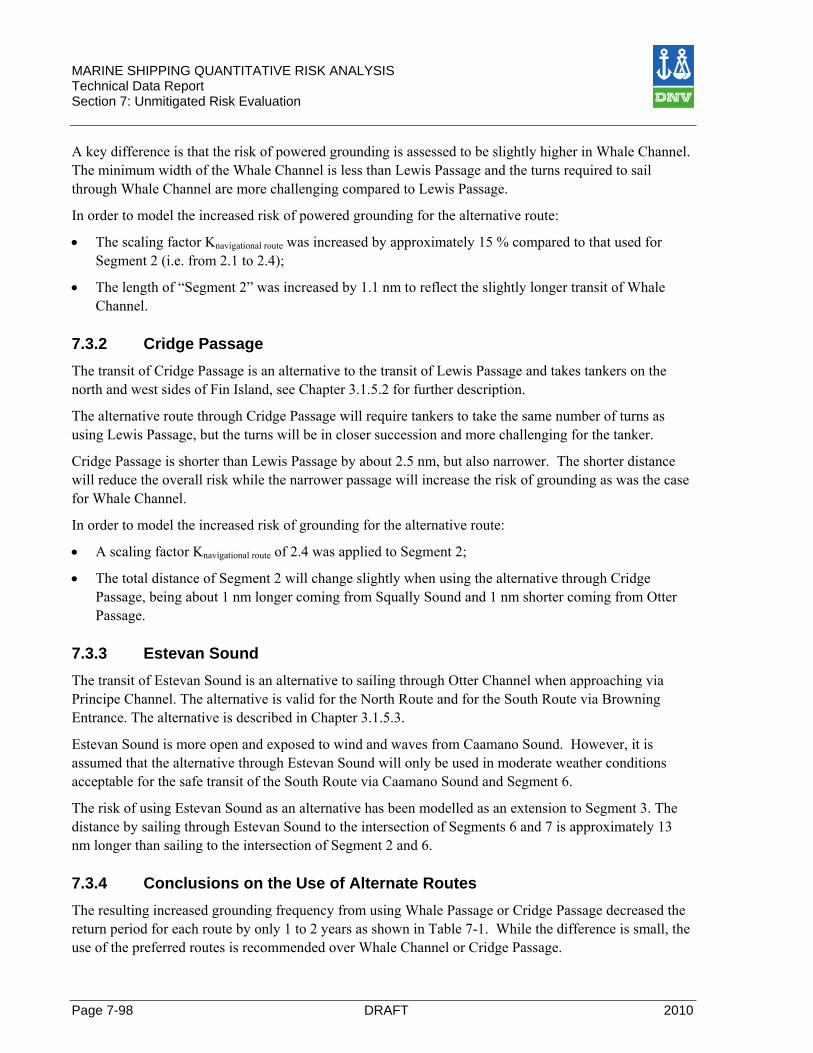
MARINE SHIPPING QUANTITATIVE RISK ANALYSIS Technical Data Report Section 7: Unmitigated Risk Evaluation
Page 7-98 DRAFT 2010
A key difference is that the risk of powered grounding is assessed to be slightly higher in Whale Channel. The minimum width of the Whale Channel is less than Lewis Passage and the turns required to sail through Whale Channel are more challenging compared to Lewis Passage.
In order to model the increased risk of powered grounding for the alternative route:
• The scaling factor Knavigational route was increased by approximately 15 % compared to that used for Segment 2 (i.e. from 2.1 to 2.4);
• The length of “Segment 2” was increased by 1.1 nm to reflect the slightly longer transit of Whale Channel.
7.3.2 Cridge Passage The transit of Cridge Passage is an alternative to the transit of Lewis Passage and takes tankers on the north and west sides of Fin Island, see Chapter 3.1.5.2 for further description.
The alternative route through Cridge Passage will require tankers to take the same number of turns as using Lewis Passage, but the turns will be in closer succession and more challenging for the tanker.
Cridge Passage is shorter than Lewis Passage by about 2.5 nm, but also narrower. The shorter distance will reduce the overall risk while the narrower passage will increase the risk of grounding as was the case for Whale Channel.
In order to model the increased risk of grounding for the alternative route:
• A scaling factor Knavigational route of 2.4 was applied to Segment 2;
• The total distance of Segment 2 will change slightly when using the alternative through Cridge Passage, being about 1 nm longer coming from Squally Sound and 1 nm shorter coming from Otter Passage.
7.3.3 Estevan Sound The transit of Estevan Sound is an alternative to sailing through Otter Channel when approaching via Principe Channel. The alternative is valid for the North Route and for the South Route via Browning Entrance. The alternative is described in Chapter 3.1.5.3.
Estevan Sound is more open and exposed to wind and waves from Caamano Sound. However, it is assumed that the alternative through Estevan Sound will only be used in moderate weather conditions acceptable for the safe transit of the South Route via Caamano Sound and Segment 6.
The risk of using Estevan Sound as an alternative has been modelled as an extension to Segment 3. The distance by sailing through Estevan Sound to the intersection of Segments 6 and 7 is approximately 13 nm longer than sailing to the intersection of Segment 2 and 6.
7.3.4 Conclusions on the Use of Alternate Routes The resulting increased grounding frequency from using Whale Passage or Cridge Passage decreased the return period for each route by only 1 to 2 years as shown in Table 7-1. While the difference is small, the use of the preferred routes is recommended over Whale Channel or Cridge Passage.
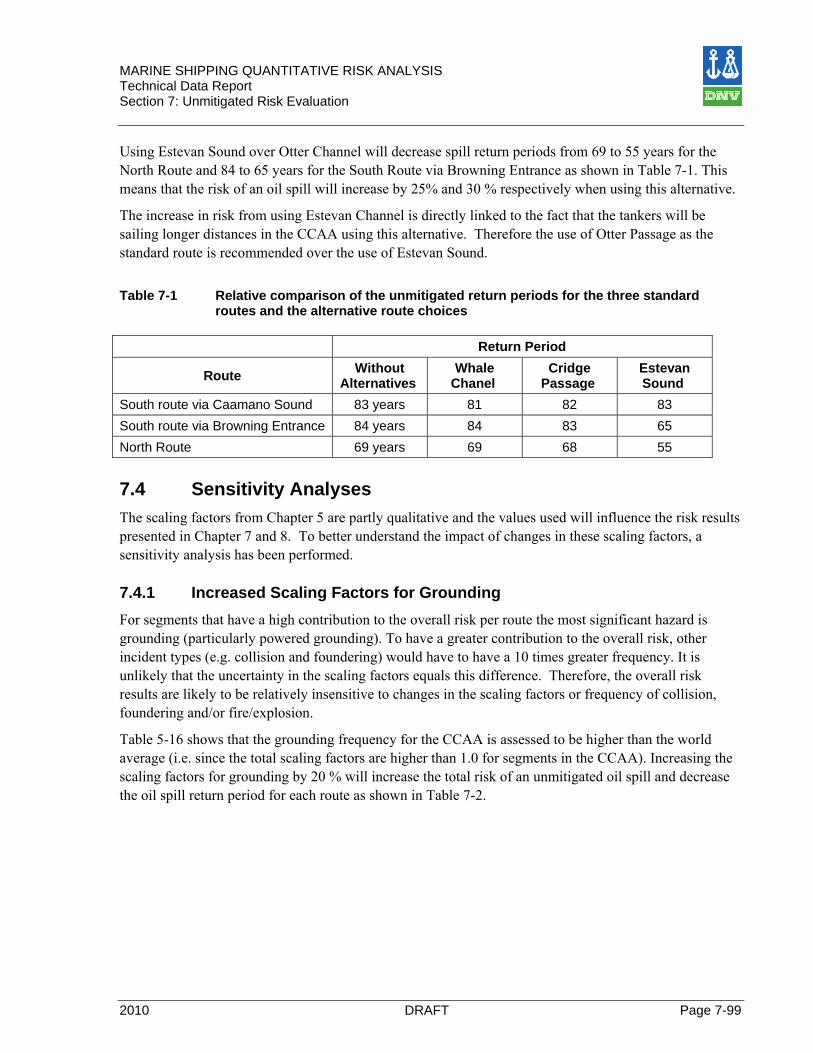
MARINE SHIPPING QUANTITATIVE RISK ANALYSIS Technical Data Report Section 7: Unmitigated Risk Evaluation
2010 DRAFT Page 7-99
Using Estevan Sound over Otter Channel will decrease spill return periods from 69 to 55 years for the North Route and 84 to 65 years for the South Route via Browning Entrance as shown in Table 7-1. This means that the risk of an oil spill will increase by 25% and 30 % respectively when using this alternative.
The increase in risk from using Estevan Channel is directly linked to the fact that the tankers will be sailing longer distances in the CCAA using this alternative. Therefore the use of Otter Passage as the standard route is recommended over the use of Estevan Sound.
Table 7-1 Relative comparison of the unmitigated return periods for the three standard
routes and the alternative route choices
Return Period
Route Without Alternatives
Whale Chanel
Cridge Passage
Estevan Sound
South route via Caamano Sound 83 years 81 82 83 South route via Browning Entrance 84 years 84 83 65 North Route 69 years 69 68 55
7.4 Sensitivity Analyses The scaling factors from Chapter 5 are partly qualitative and the values used will influence the risk results presented in Chapter 7 and 8. To better understand the impact of changes in these scaling factors, a sensitivity analysis has been performed.
7.4.1 Increased Scaling Factors for Grounding For segments that have a high contribution to the overall risk per route the most significant hazard is grounding (particularly powered grounding). To have a greater contribution to the overall risk, other incident types (e.g. collision and foundering) would have to have a 10 times greater frequency. It is unlikely that the uncertainty in the scaling factors equals this difference. Therefore, the overall risk results are likely to be relatively insensitive to changes in the scaling factors or frequency of collision, foundering and/or fire/explosion.
Table 5-16 shows that the grounding frequency for the CCAA is assessed to be higher than the world average (i.e. since the total scaling factors are higher than 1.0 for segments in the CCAA). Increasing the scaling factors for grounding by 20 % will increase the total risk of an unmitigated oil spill and decrease the oil spill return period for each route as shown in Table 7-2.
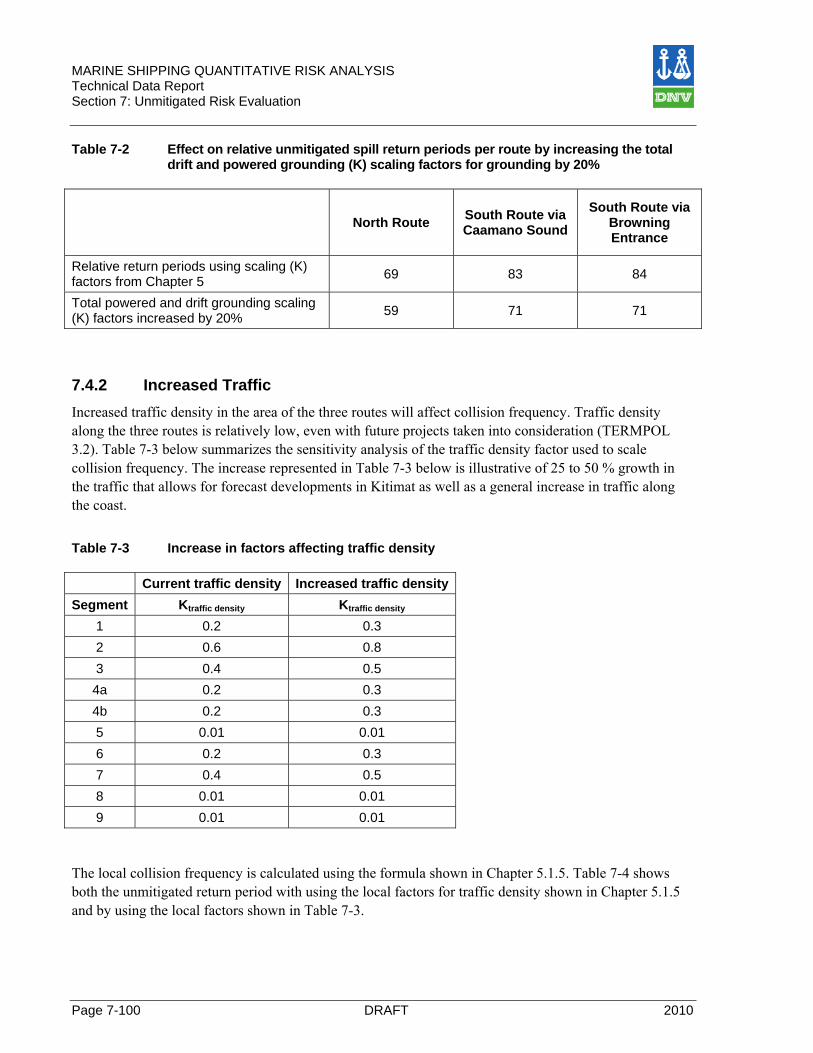
MARINE SHIPPING QUANTITATIVE RISK ANALYSIS Technical Data Report Section 7: Unmitigated Risk Evaluation
Page 7-100 DRAFT 2010
Table 7-2 Effect on relative unmitigated spill return periods per route by increasing the total drift and powered grounding (K) scaling factors for grounding by 20%
North Route South Route via Caamano Sound
South Route via Browning Entrance
Relative return periods using scaling (K) factors from Chapter 5 69 83 84
Total powered and drift grounding scaling (K) factors increased by 20% 59 71 71
7.4.2 Increased Traffic Increased traffic density in the area of the three routes will affect collision frequency. Traffic density along the three routes is relatively low, even with future projects taken into consideration (TERMPOL 3.2). Table 7-3 below summarizes the sensitivity analysis of the traffic density factor used to scale collision frequency. The increase represented in Table 7-3 below is illustrative of 25 to 50 % growth in the traffic that allows for forecast developments in Kitimat as well as a general increase in traffic along the coast.
Table 7-3 Increase in factors affecting traffic density
Current traffic density Increased traffic densitySegment Ktraffic density Ktraffic density
1 0.2 0.3 2 0.6 0.8 3 0.4 0.5 4a 0.2 0.3 4b 0.2 0.3 5 0.01 0.01 6 0.2 0.3 7 0.4 0.5 8 0.01 0.01 9 0.01 0.01
The local collision frequency is calculated using the formula shown in Chapter 5.1.5. Table 7-4 shows both the unmitigated return period with using the local factors for traffic density shown in Chapter 5.1.5 and by using the local factors shown in Table 7-3.
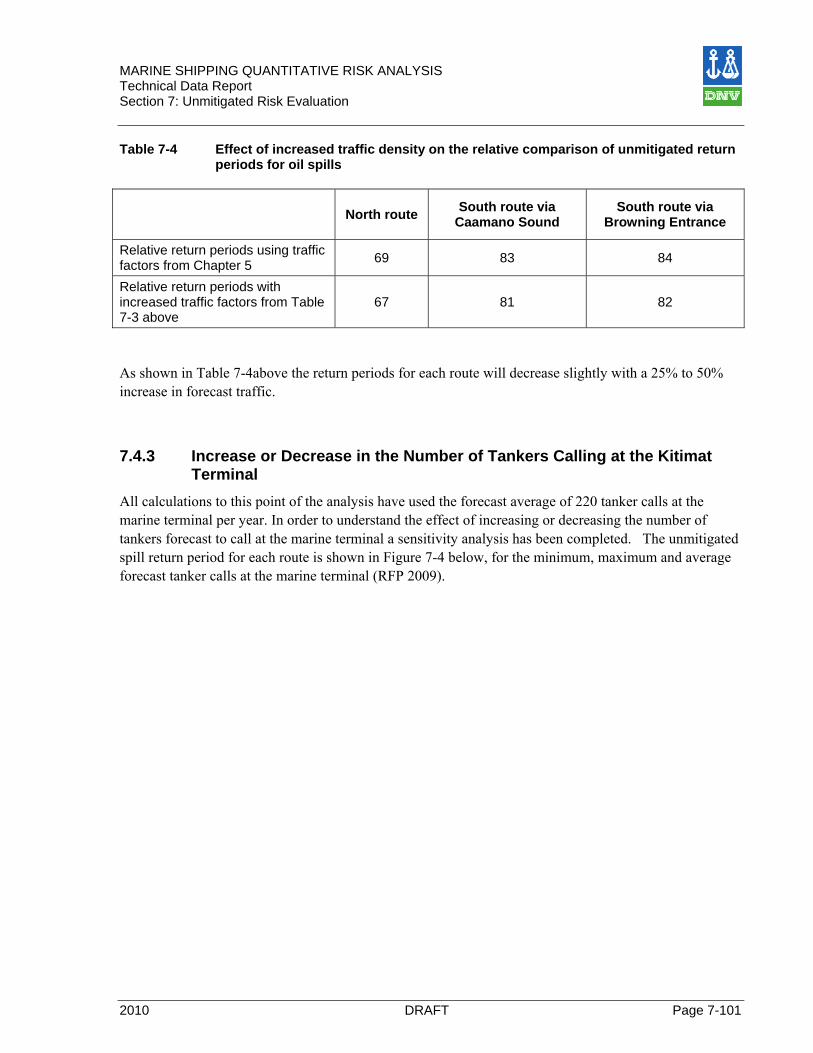
MARINE SHIPPING QUANTITATIVE RISK ANALYSIS Technical Data Report Section 7: Unmitigated Risk Evaluation
2010 DRAFT Page 7-101
Table 7-4 Effect of increased traffic density on the relative comparison of unmitigated return periods for oil spills
North route South route via Caamano Sound
South route via Browning Entrance
Relative return periods using traffic factors from Chapter 5 69 83 84
Relative return periods with increased traffic factors from Table 7-3 above
67 81 82
As shown in Table 7-4above the return periods for each route will decrease slightly with a 25% to 50% increase in forecast traffic.
7.4.3 Increase or Decrease in the Number of Tankers Calling at the Kitimat Terminal
All calculations to this point of the analysis have used the forecast average of 220 tanker calls at the marine terminal per year. In order to understand the effect of increasing or decreasing the number of tankers forecast to call at the marine terminal a sensitivity analysis has been completed. The unmitigated spill return period for each route is shown in Figure 7-4 below, for the minimum, maximum and average forecast tanker calls at the marine terminal (RFP 2009).

MARINE SHIPPING QUANTITATIVE RISK ANALYSIS Technical Data Report Section 7: Unmitigated Risk Evaluation
Page 7-102 DRAFT 2010
Figure 7-4 Relative comparison of the effect of increasing or decreasing the number of
tankers forecast to call at the Kitimat Terminal on the unmitigated spill return period for each route
As can be seen from the figure above the return period will decrease with an increase in the number of tankers that transit the routes. As discussed in Chapter 6 increasing the number of sailings has a negative effect on the overall spill risk per route and outweighs factors such as the relative number of each vessel class (Aframax, Suezmax, or VLCC) used on each route.
7.4.4 Extending Routes Seaward of the Queen Charlotte Islands and Vancouver Island
The frequency of oil spills is significantly lower in Segments 5 and 8 compared to other segments. The oil spill frequencies in Segments 5 and 8 represent approximately 2 % of the estimated oil spill probability for the North and South Routes.

MARINE SHIPPING QUANTITATIVE RISK ANALYSIS Technical Data Report Section 7: Unmitigated Risk Evaluation
2010 DRAFT Page 7-103
7.4.4.1 Frequency of Incidents during Transit 200nm Seaward of Queen Charlotte Islands and Vancouver Island
As tankers depart the BC coast they will head into open waters passing through Segment 5 or 8 entering the open Pacific Ocean. The following is a discussion of the risk for the 200nm extension to the ends of Segments 5 and 8 that capture the area seaward of Vancouver Island and the Queen Charlotte Islands. Grounding
Outside the Queen Charlotte Islands and Vancouver Island tankers will be far from any land masses where potential grounding can occur. There is, however, still the possibility for a tanker with mechanical difficulties to drift aground. Therefore to be conservative the risk of grounding is assumed to be the same as for Segments 5 and 8. Collision
Tankers will pass through or join the great circle route from the US west coast to Alaska and Asia. Traffic outside Vancouver Island and the Queen Charlotte Islands can be greater than traffic found along Segments 5 and 8, but spread over a larger geographical area.
The likelihood of two vessels colliding in the area seaward of Vancouver Island and the Queen Charlotte Islands is assessed, conservatively, to be the same as Segments 5 and 8. Foundering
The frequency of foundering based on historical incident data is extremely low. To be conservative the risk of foundering is assumed to be the same as Segment 5 and 8. Fire / Explosion As previously mentioned, the frequency of fire and explosion is independent of local factors. Therefore the same global frequency discussed in previous chapters, is also applicable to the 200nm seaward of the Queen Charlotte Islands and Vancouver Island.
7.4.4.2 Risk of Spills during Transit 200nm Seaward of Queen Charlotte Islands and Vancouver Island
The oil spill risk for an area seaward of the Queen Charlotte Islands and Vancouver Island (see Table 7-5, below) has been calculated by conservatively assuming that the incident and spill frequencies for Segments 5 and 8 are applicable over the 200 nautical miles west of Segments 5 and 8.
Table 7-5 Relative comparison of the spill return periods for a 200nm segment at the ends of
Segments 5 and 8, or seaward of the Queen Charlotte Islands & Vancouver Island
Route Oil spill risk (Return period, years)
200nm extension to Segment 5 1,400 200nm extension to Segment 8 1,500
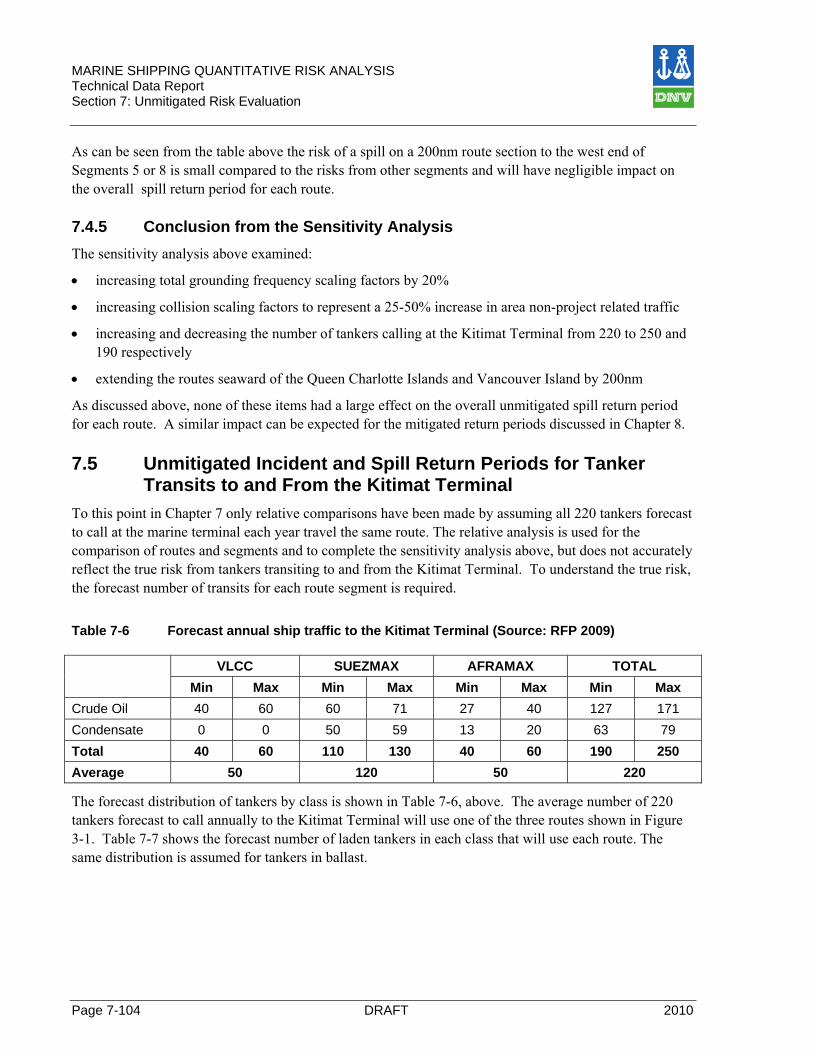
MARINE SHIPPING QUANTITATIVE RISK ANALYSIS Technical Data Report Section 7: Unmitigated Risk Evaluation
Page 7-104 DRAFT 2010
As can be seen from the table above the risk of a spill on a 200nm route section to the west end of Segments 5 or 8 is small compared to the risks from other segments and will have negligible impact on the overall spill return period for each route.
7.4.5 Conclusion from the Sensitivity Analysis The sensitivity analysis above examined:
• increasing total grounding frequency scaling factors by 20%
• increasing collision scaling factors to represent a 25-50% increase in area non-project related traffic
• increasing and decreasing the number of tankers calling at the Kitimat Terminal from 220 to 250 and 190 respectively
• extending the routes seaward of the Queen Charlotte Islands and Vancouver Island by 200nm
As discussed above, none of these items had a large effect on the overall unmitigated spill return period for each route. A similar impact can be expected for the mitigated return periods discussed in Chapter 8.
7.5 Unmitigated Incident and Spill Return Periods for Tanker Transits to and From the Kitimat Terminal
To this point in Chapter 7 only relative comparisons have been made by assuming all 220 tankers forecast to call at the marine terminal each year travel the same route. The relative analysis is used for the comparison of routes and segments and to complete the sensitivity analysis above, but does not accurately reflect the true risk from tankers transiting to and from the Kitimat Terminal. To understand the true risk, the forecast number of transits for each route segment is required.
Table 7-6 Forecast annual ship traffic to the Kitimat Terminal (Source: RFP 2009)
VLCC SUEZMAX AFRAMAX TOTAL Min Max Min Max Min Max Min Max
Crude Oil 40 60 60 71 27 40 127 171 Condensate 0 0 50 59 13 20 63 79 Total 40 60 110 130 40 60 190 250 Average 50 120 50 220
The forecast distribution of tankers by class is shown in Table 7-6, above. The average number of 220 tankers forecast to call annually to the Kitimat Terminal will use one of the three routes shown in Figure 3-1. Table 7-7 shows the forecast number of laden tankers in each class that will use each route. The same distribution is assumed for tankers in ballast.
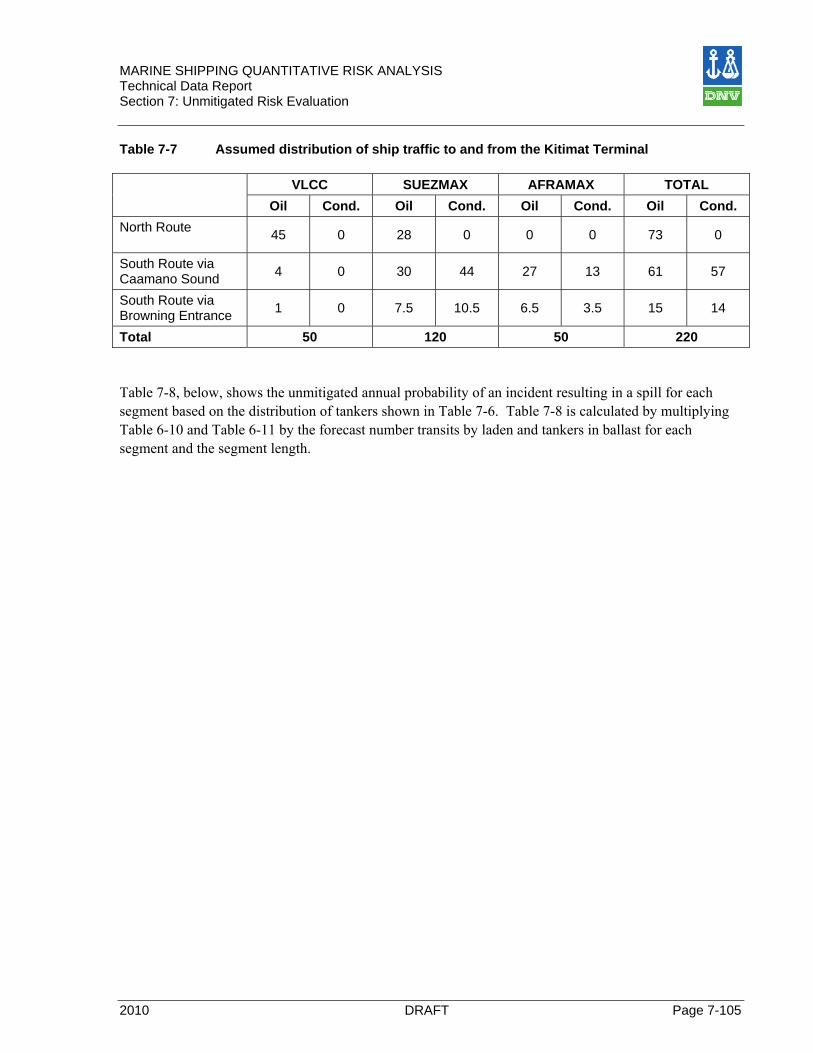
MARINE SHIPPING QUANTITATIVE RISK ANALYSIS Technical Data Report Section 7: Unmitigated Risk Evaluation
2010 DRAFT Page 7-105
Table 7-7 Assumed distribution of ship traffic to and from the Kitimat Terminal
VLCC SUEZMAX AFRAMAX TOTAL Oil Cond. Oil Cond. Oil Cond. Oil Cond.
North Route 45 0 28 0 0 0 73 0
South Route via Caamano Sound 4 0 30 44 27 13 61 57
South Route via Browning Entrance 1 0 7.5 10.5 6.5 3.5 15 14
Total 50 120 50 220
Table 7-8, below, shows the unmitigated annual probability of an incident resulting in a spill for each segment based on the distribution of tankers shown in Table 7-6. Table 7-8 is calculated by multiplying Table 6-10 and Table 6-11 by the forecast number transits by laden and tankers in ballast for each segment and the segment length.
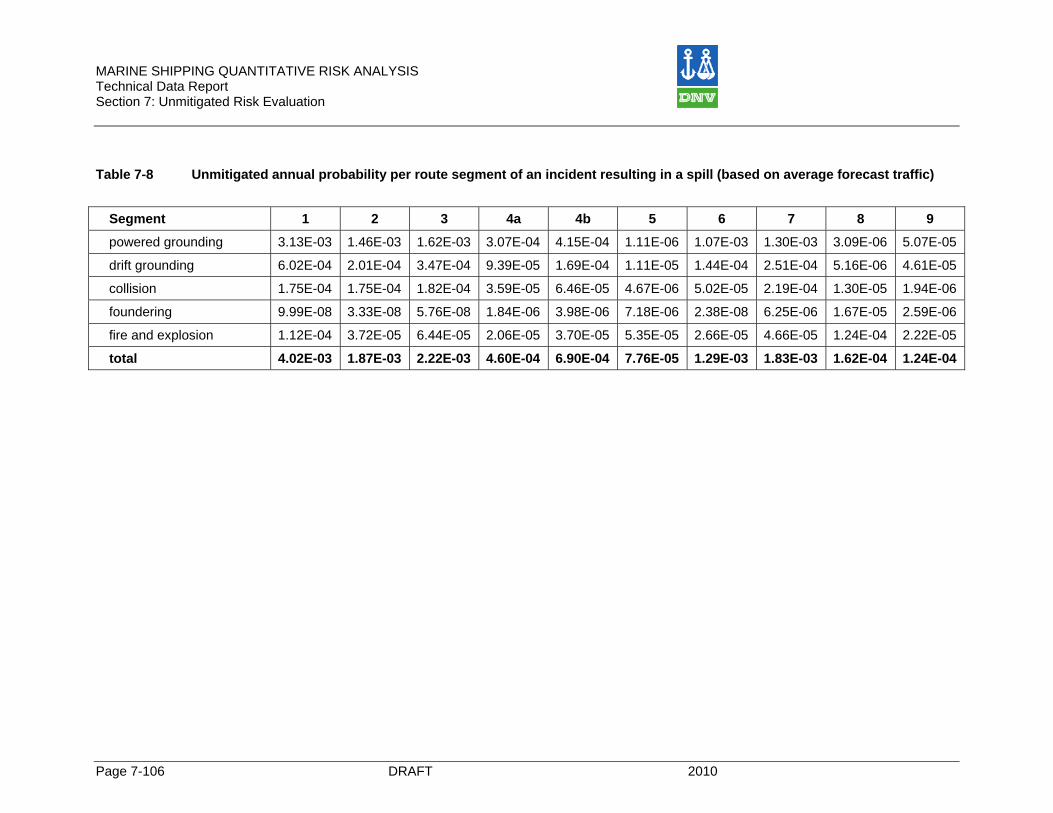
MARINE SHIPPING QUANTITATIVE RISK ANALYSIS Technical Data Report Section 7: Unmitigated Risk Evaluation
Page 7-106 DRAFT 2010
Table 7-8 Unmitigated annual probability per route segment of an incident resulting in a spill (based on average forecast traffic)
Segment 1 2 3 4a 4b 5 6 7 8 9
powered grounding 3.13E-03 1.46E-03 1.62E-03 3.07E-04 4.15E-04 1.11E-06 1.07E-03 1.30E-03 3.09E-06 5.07E-05
drift grounding 6.02E-04 2.01E-04 3.47E-04 9.39E-05 1.69E-04 1.11E-05 1.44E-04 2.51E-04 5.16E-06 4.61E-05
collision 1.75E-04 1.75E-04 1.82E-04 3.59E-05 6.46E-05 4.67E-06 5.02E-05 2.19E-04 1.30E-05 1.94E-06
foundering 9.99E-08 3.33E-08 5.76E-08 1.84E-06 3.98E-06 7.18E-06 2.38E-08 6.25E-06 1.67E-05 2.59E-06
fire and explosion 1.12E-04 3.72E-05 6.44E-05 2.06E-05 3.70E-05 5.35E-05 2.66E-05 4.66E-05 1.24E-04 2.22E-05
total 4.02E-03 1.87E-03 2.22E-03 4.60E-04 6.90E-04 7.76E-05 1.29E-03 1.83E-03 1.62E-04 1.24E-04
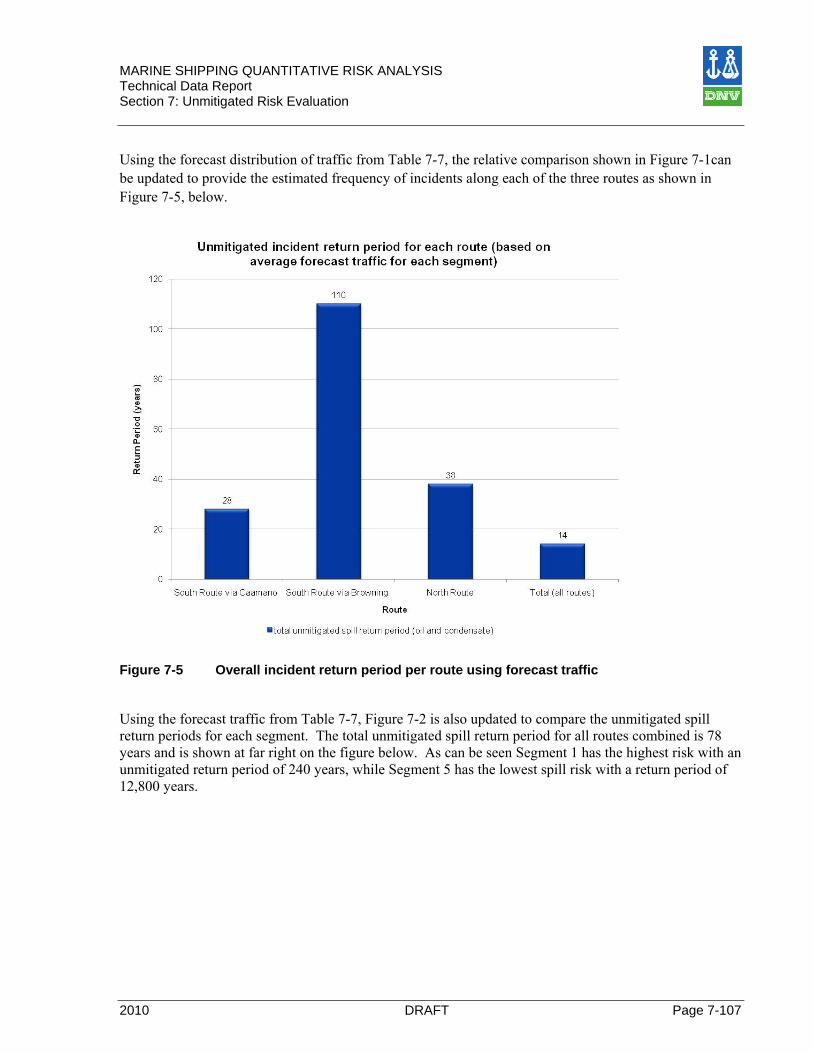
MARINE SHIPPING QUANTITATIVE RISK ANALYSIS Technical Data Report Section 7: Unmitigated Risk Evaluation
2010 DRAFT Page 7-107
Using the forecast distribution of traffic from Table 7-7, the relative comparison shown in Figure 7-1can be updated to provide the estimated frequency of incidents along each of the three routes as shown in Figure 7-5, below.
Figure 7-5 Overall incident return period per route using forecast traffic
Using the forecast traffic from Table 7-7, Figure 7-2 is also updated to compare the unmitigated spill return periods for each segment. The total unmitigated spill return period for all routes combined is 78 years and is shown at far right on the figure below. As can be seen Segment 1 has the highest risk with an unmitigated return period of 240 years, while Segment 5 has the lowest spill risk with a return period of 12,800 years.
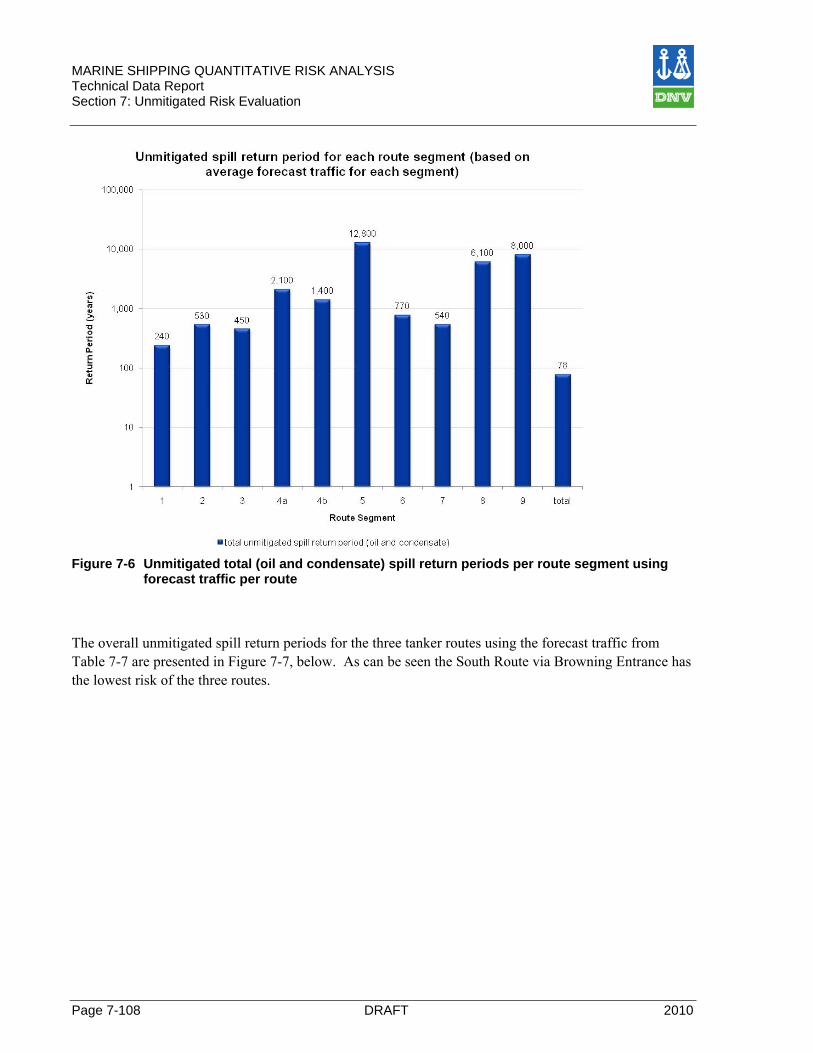
MARINE SHIPPING QUANTITATIVE RISK ANALYSIS Technical Data Report Section 7: Unmitigated Risk Evaluation
Page 7-108 DRAFT 2010
Figure 7-6 Unmitigated total (oil and condensate) spill return periods per route segment using
forecast traffic per route
The overall unmitigated spill return periods for the three tanker routes using the forecast traffic from Table 7-7 are presented in Figure 7-7, below. As can be seen the South Route via Browning Entrance has the lowest risk of the three routes.
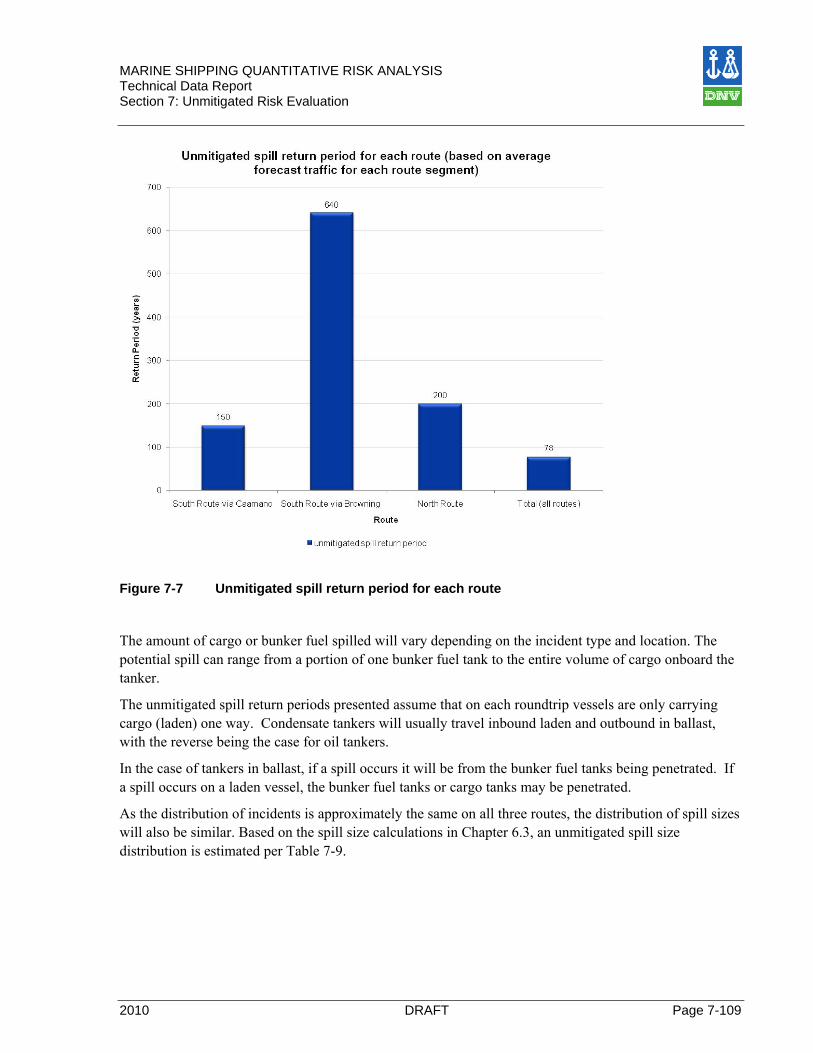
MARINE SHIPPING QUANTITATIVE RISK ANALYSIS Technical Data Report Section 7: Unmitigated Risk Evaluation
2010 DRAFT Page 7-109
Figure 7-7 Unmitigated spill return period for each route
The amount of cargo or bunker fuel spilled will vary depending on the incident type and location. The potential spill can range from a portion of one bunker fuel tank to the entire volume of cargo onboard the tanker.
The unmitigated spill return periods presented assume that on each roundtrip vessels are only carrying cargo (laden) one way. Condensate tankers will usually travel inbound laden and outbound in ballast, with the reverse being the case for oil tankers.
In the case of tankers in ballast, if a spill occurs it will be from the bunker fuel tanks being penetrated. If a spill occurs on a laden vessel, the bunker fuel tanks or cargo tanks may be penetrated.
As the distribution of incidents is approximately the same on all three routes, the distribution of spill sizes will also be similar. Based on the spill size calculations in Chapter 6.3, an unmitigated spill size distribution is estimated per Table 7-9.

MARINE SHIPPING QUANTITATIVE RISK ANALYSIS Technical Data Report Section 7: Unmitigated Risk Evaluation
Page 7-110 DRAFT 2010
Table 7-9 Estimated spill volume and unmitigated distribution
Estimated spill volume [m3] Unmitigated Distribution
< 5000 58 % 5000 – 10000 23 %
10000 – 20000 14 % 20000 – 40000 3,7 %
> 40000 0,8 %
On this basis, the unmitigated return period of spills greater than 5,000 m3 has been estimated to be of the order of 200 years, while the return period for spills of 20,000 m3 will be some 1,750 years. The unmitigated return periods for extremely large oil spills, exceeding 40 000 m3, has been estimated to approximately 12,000 years.
The expected annual frequency of spills exceeding a certain size is illustrated in Figure 7-8. The term “accumulated” indicates that probabilities plotted are for spills greater than the spill volume read off the horizontal axis.
Accumulated unmitigated frequency of spills exceeding a certain size
0
0,002
0,004
0,006
0,008
0,01
0,012
0,014
0 5000 10000 15000 20000 25000 30000 35000 40000 45000 50000
Spill volume [m3]
Ann
ual f
requ
ency
[per
yea
r]
North RouteSouth Route via Caamaño SoundSouth Route via Browning EntranceForecast route choice
Figure 7-8 Annual probability of a spill exceeding a given volume
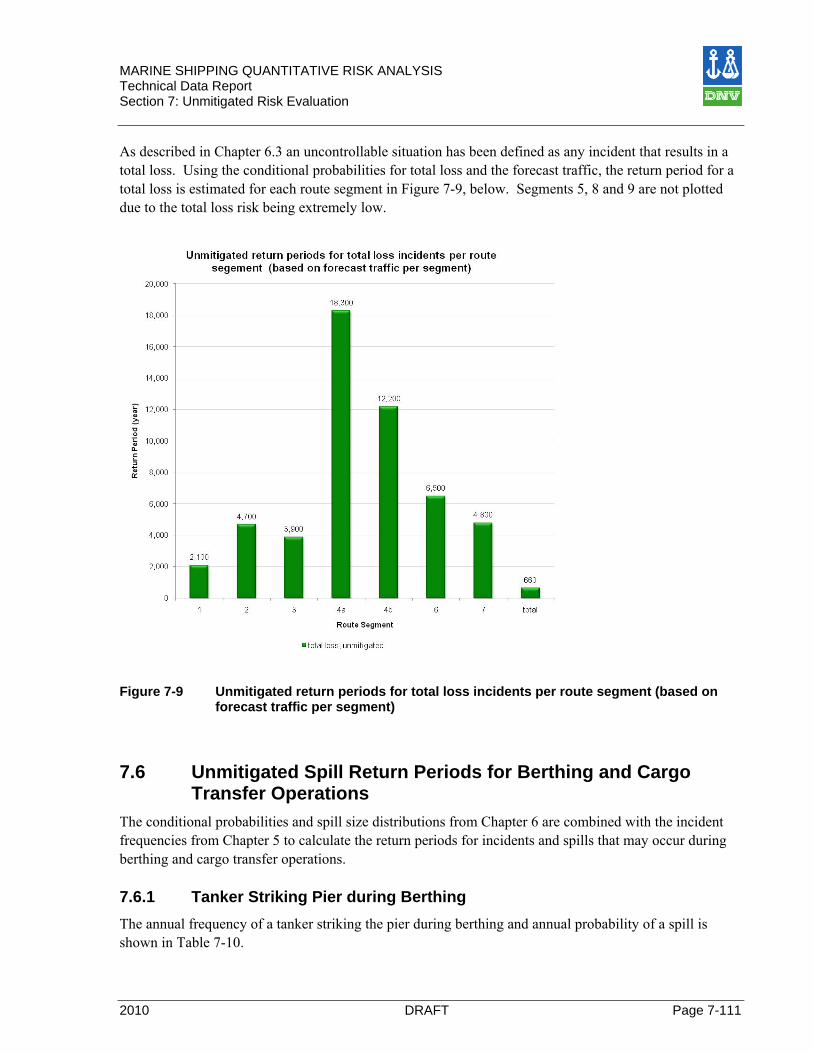
MARINE SHIPPING QUANTITATIVE RISK ANALYSIS Technical Data Report Section 7: Unmitigated Risk Evaluation
2010 DRAFT Page 7-111
As described in Chapter 6.3 an uncontrollable situation has been defined as any incident that results in a total loss. Using the conditional probabilities for total loss and the forecast traffic, the return period for a total loss is estimated for each route segment in Figure 7-9, below. Segments 5, 8 and 9 are not plotted due to the total loss risk being extremely low.
Figure 7-9 Unmitigated return periods for total loss incidents per route segment (based on
forecast traffic per segment)
7.6 Unmitigated Spill Return Periods for Berthing and Cargo Transfer Operations
The conditional probabilities and spill size distributions from Chapter 6 are combined with the incident frequencies from Chapter 5 to calculate the return periods for incidents and spills that may occur during berthing and cargo transfer operations.
7.6.1 Tanker Striking Pier during Berthing The annual frequency of a tanker striking the pier during berthing and annual probability of a spill is shown in Table 7-10.
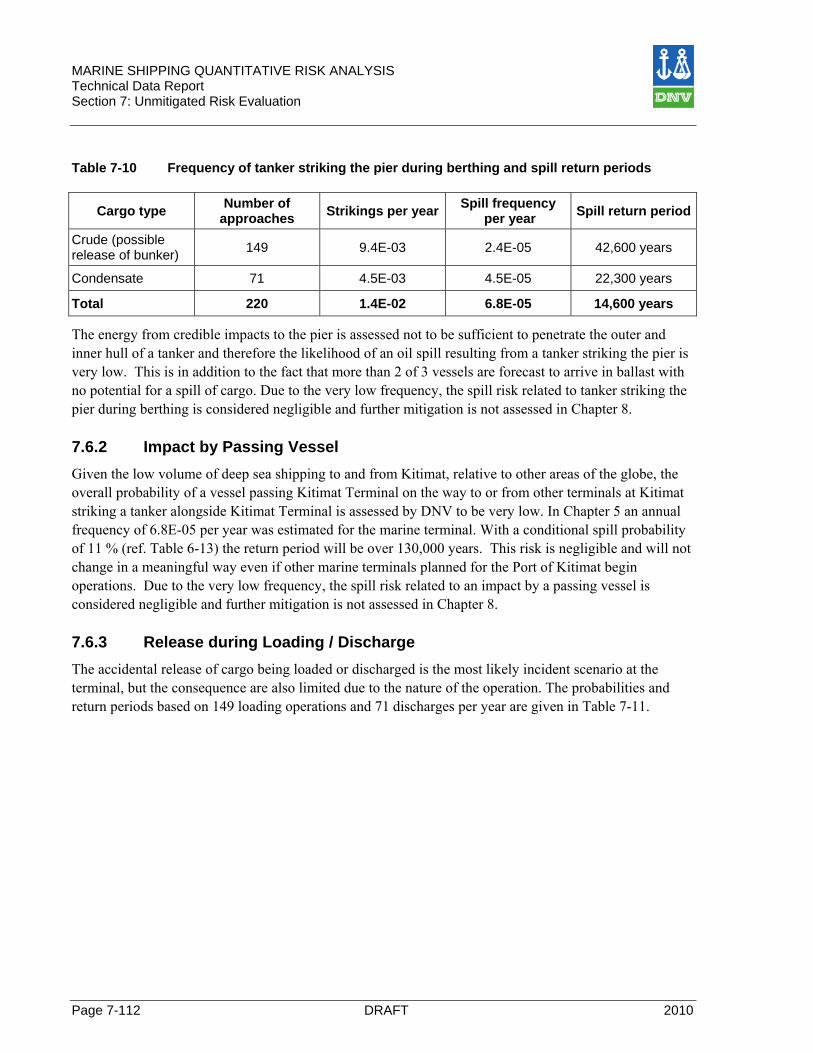
MARINE SHIPPING QUANTITATIVE RISK ANALYSIS Technical Data Report Section 7: Unmitigated Risk Evaluation
Page 7-112 DRAFT 2010
Table 7-10 Frequency of tanker striking the pier during berthing and spill return periods
Cargo type Number of approaches Strikings per year Spill frequency
per year Spill return period
Crude (possible release of bunker) 149 9.4E-03 2.4E-05 42,600 years
Condensate 71 4.5E-03 4.5E-05 22,300 years
Total 220 1.4E-02 6.8E-05 14,600 years
The energy from credible impacts to the pier is assessed not to be sufficient to penetrate the outer and inner hull of a tanker and therefore the likelihood of an oil spill resulting from a tanker striking the pier is very low. This is in addition to the fact that more than 2 of 3 vessels are forecast to arrive in ballast with no potential for a spill of cargo. Due to the very low frequency, the spill risk related to tanker striking the pier during berthing is considered negligible and further mitigation is not assessed in Chapter 8.
7.6.2 Impact by Passing Vessel Given the low volume of deep sea shipping to and from Kitimat, relative to other areas of the globe, the overall probability of a vessel passing Kitimat Terminal on the way to or from other terminals at Kitimat striking a tanker alongside Kitimat Terminal is assessed by DNV to be very low. In Chapter 5 an annual frequency of 6.8E-05 per year was estimated for the marine terminal. With a conditional spill probability of 11 % (ref. Table 6-13) the return period will be over 130,000 years. This risk is negligible and will not change in a meaningful way even if other marine terminals planned for the Port of Kitimat begin operations. Due to the very low frequency, the spill risk related to an impact by a passing vessel is considered negligible and further mitigation is not assessed in Chapter 8.
7.6.3 Release during Loading / Discharge The accidental release of cargo being loaded or discharged is the most likely incident scenario at the terminal, but the consequence are also limited due to the nature of the operation. The probabilities and return periods based on 149 loading operations and 71 discharges per year are given in Table 7-11.

MARINE SHIPPING QUANTITATIVE RISK ANALYSIS Technical Data Report Section 7: Unmitigated Risk Evaluation
2010 DRAFT Page 7-113
Table 7-11 Probability and return periods for spills from loading/discharge incidents
Event
Overall probability per year
Return period (years)
Medium spill Small Spill Overall
Release from loading arm 1.1E-02 890 99 89
Failure in equipment 1.1E-03 890 - 890
Failure in the vessels piping system or pumps 1.6E-03 6300 700 630
Human failure 1.6E-03 6300 700 630
Mooring failure 8.4E-04 1100 - 1100
Overloading of cargo tank 1.8E-02 56 - 56
Total 3.4E-02 46 77 29
The overall return period is the inverse of the total probability per year. Spill frequencies were provided in Table 5-19 and the conditional probability of a medium or small spill was provided in Table 6-14.
The greatest contributor to risk in the above table is overloading of a cargo tank which is mitigated in Chapter 8 by the application of a closed loading system with features that virtually eliminate the risk of tank overloading leading to a spill.
7.7 Increased Risk Areas (IRA’s) An IRA is a location representative of where a spill may occur taking into account the most likely incident(s) along the segment as well as the segment’s bathymetry, weather, available navigation aids, etc.
The IRAs have been developed using the following three steps:
1. Which segments have the highest risk for an oil spill?
2. Which incident type contributes most to the risk of each selected segment?
3. Where along the selected segments is the incident most likely to occur?
The purpose of establishing IRA’s is to provide possible locations and scenarios for use in contingency planning and to form the basis for specific risk mitigation measures discussed in Chapter 8.
It should be noted that there are many locations where an incident could occur on any given route and the IRA’s are only a guide to the more credible scenarios.

MARINE SHIPPING QUANTITATIVE RISK ANALYSIS Technical Data Report Section 7: Unmitigated Risk Evaluation
Page 7-114 DRAFT 2010
7.7.1 Step 1 – Selection of Increased Risk Segments The following areas of the have been included in the assessment of IRA’s:
• CCAA Segments 1, 2, 3, 6 & 7
• Segment 4b
• Cargo transfer operations at the marine terminal
7.7.2 Step 2 to 4 – Assessment of IRAs The locations of the IRAs are shown in Figure 7-10 and Figure 7-11 below. Terminal (IRA T)
Without mitigation measures, the lowest incident return period is related to an oil spill at the Kitimat Terminal with the most likely incident being an “accidental release during loading/discharge”. An IRA (IRA T) has therefore been located at the Kitimat Terminal. Segment 1 (IRA 1)
Based on the calculations for Segment 1 the most likely incident is grounding. Examining the navigational charts for Segment 1, the most probable location for grounding is between Kitkiata Inlet and Nanakwa Shoal. It is assessed that the risk for grounding is highest in the narrowest section near Emilia Island.
Segment 2 (IRA 2)
The highest risk of collision for all routes will be in the location with the highest density of marine traffic which is Wright Sound. Therefore, the most credible spill scenario for Segment 2 has been assessed to be a collision between a tanker and a vessel crossing Wright Sound transiting the Inner Passage. Segment 3 (IRA 3)
The most credible incident scenario for Segment 3 is grounding. Based on the navigational charts for Segment 3, the most probable location for grounding appears to be in the area between Keswar Point and Dixon Island.
Segment 4b (IRA 4b)
The most credible incident scenario for Segment 4b is grounding. Based on the navigational charts the most probable location for grounding appears to be in the area of Butterworth Rocks and Triple Island where the tankers will slow to board or disembark the pilots.
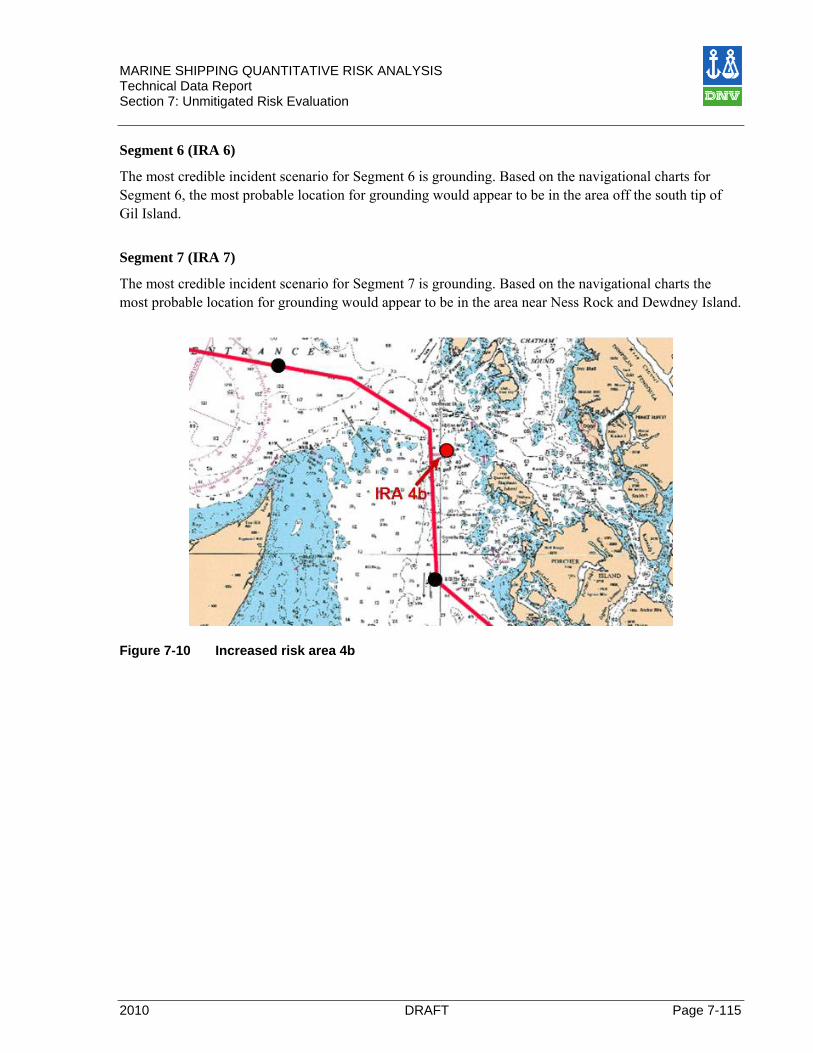
MARINE SHIPPING QUANTITATIVE RISK ANALYSIS Technical Data Report Section 7: Unmitigated Risk Evaluation
2010 DRAFT Page 7-115
Segment 6 (IRA 6)
The most credible incident scenario for Segment 6 is grounding. Based on the navigational charts for Segment 6, the most probable location for grounding would appear to be in the area off the south tip of Gil Island.
Segment 7 (IRA 7)
The most credible incident scenario for Segment 7 is grounding. Based on the navigational charts the most probable location for grounding would appear to be in the area near Ness Rock and Dewdney Island.
Figure 7-10 Increased risk area 4b
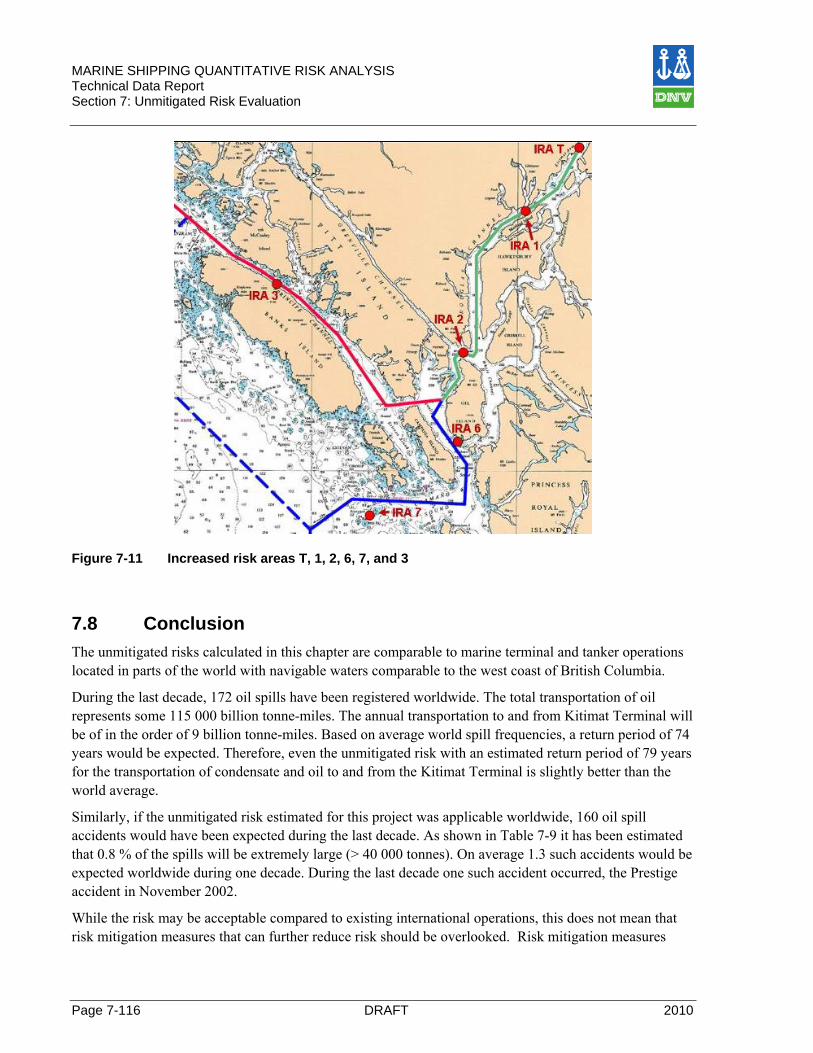
MARINE SHIPPING QUANTITATIVE RISK ANALYSIS Technical Data Report Section 7: Unmitigated Risk Evaluation
Page 7-116 DRAFT 2010
Figure 7-11 Increased risk areas T, 1, 2, 6, 7, and 3
7.8 Conclusion The unmitigated risks calculated in this chapter are comparable to marine terminal and tanker operations located in parts of the world with navigable waters comparable to the west coast of British Columbia.
During the last decade, 172 oil spills have been registered worldwide. The total transportation of oil represents some 115 000 billion tonne-miles. The annual transportation to and from Kitimat Terminal will be of in the order of 9 billion tonne-miles. Based on average world spill frequencies, a return period of 74 years would be expected. Therefore, even the unmitigated risk with an estimated return period of 79 years for the transportation of condensate and oil to and from the Kitimat Terminal is slightly better than the world average.
Similarly, if the unmitigated risk estimated for this project was applicable worldwide, 160 oil spill accidents would have been expected during the last decade. As shown in Table 7-9 it has been estimated that 0.8 % of the spills will be extremely large (> 40 000 tonnes). On average 1.3 such accidents would be expected worldwide during one decade. During the last decade one such accident occurred, the Prestige accident in November 2002.
While the risk may be acceptable compared to existing international operations, this does not mean that risk mitigation measures that can further reduce risk should be overlooked. Risk mitigation measures

MARINE SHIPPING QUANTITATIVE RISK ANALYSIS Technical Data Report Section 7: Unmitigated Risk Evaluation
2010 DRAFT Page 7-117
have been implemented in many operations in Norway, the United Kingdom and the United States and should be considered for the Northern Gateway Pipelines Project as well. Risk mitigation measures are assessed in Chapter 8.
MARINE SHIPPING QUANTITATIVE RISK ANALYSIS Technical Data Report Section 8: Mitigated Risk Evaluation
Page 8-118 DRAFT 2010
8 Mitigated Risk Evaluation Risk assessment has two main purposes. The first is to enable a discussion of risk acceptability. The second is to provide an informed and organized platform for selecting risk mitigation measures, in order to reduce risk in key areas. In this regard, the exact quantification of the probability of events and their consequences is not as important as ensuring that the relative discussion of risk along the routes and at the marine terminal is correct so that effective measures are taken to reduce risk.
The risk mitigation measures listed below are based in large part on the local knowledge gathered during the HAZID process discussed in Chapter 4. Chapter 8 discusses the effectiveness of the measures on reducing risk either during marine transport, berthing or cargo transfer operations at the marine terminal:
1. Tug escort
2. Enhanced navigational aids
3. Expanded vessel traffic management system
4. Establishing environmental limits for safe operation
5. Establishing places of refuge along each route
As previously noted the majority of risk mitigation measures proposed in the QRA reduce the frequency of events occurring. Many of the consequence mitigation measures are already built into tankers (e.g. double hulls) or will be addressed in the contingency planning covered in TERMPOL 3.18.
8.1 Standard Tug Escort Manoeuvres The action taken by an escort tug boat will depend on instructions from the captain and pilot onboard the tanker and will vary with the position of the tanker and the nature of the unfolding incident. The four basic operations are briefly described below.
8.1.1.1 Brake – Arrest
This manoeuvre is carried out when the tanker wishes to slow as fast as possible and there is sufficient space in front of the tanker such that emergency steering is not required. A Direct Mode (DM) tug could slow down the tanker with its thrusters, or make an “indirect arrest” (the tug positions itself transversely at the stern with the thruster force 90 degrees to the advancing direction). This “indirect arrest” is not modelled in the analysis. An Indirect Mode (IM) tug reduces the speed of the tanker by use of a zigzag manoeuvre generating a drag force with the tankers hull, or by positioning itself in IM position at one side of the stern, generating drag with the tug hull only. The latter manoeuvre will also turn the tanker.
8.1.1.2 Steer-Brake
This manoeuvre is carried out in narrow waters. The intention is to steer the vessel on a safe course, and at the same time apply braking forces, keeping a safe distance from land, until it can be slowed down. The manoeuvre is only applicable for IM tugs.
MARINE SHIPPING QUANTITATIVE RISK ANALYSIS Technical Data Report Section 8: Mitigated Risk Evaluation
2010 DRAFT Page 8-119
8.1.1.3 Steer
This manoeuvre is carried out when there is a loss of steering or human failure on the tanker. The escort tug acts like the rudder of the ship and steers the tanker on a safe course. The manoeuvre is only applicable for indirect mode tugs.
8.1.1.4 U-turn – Brake
The manoeuvre is carried out when there is a rudder and / or machinery failure. The escort tug will turn the tanker 180º or more to avoid grounding.
8.2 The Northern Gateway Tug Escort Plan The predicted frequency reduction effect of using tug escorts is provided in Table 8-1. The effectiveness of escort tugs is based on previous DNV studies (DNV 2002). In the studies typical causes of grounding and collision incidents were studied by DNV to ascertain how an escort tug might help a tanker avoid an incident, or minimize damage to the tanker if the incident was to occur.
The tug plan currently proposed for Northern Gateway Pipelines Project is as follows (See Figure 3-1 for map illustrating the segments):
• All laden tankers will have a close escort tug between the pilot boarding stations at Triple Islands, or proposed stations at Browning Entrance and Caamano Sound and the Kitimat Terminal (Segments 1, 2, 3, 4a, half of 4b, 6 and 7). In addition all laden tankers will have a tethered escort tug throughout the CCAA (between Browning Entrance and Caamano Sound and the Kitimat Terminal or Segments 1, 2, 3, 6 and 7).
• All tankers in ballast will have a close escort tug between the pilot boarding stations at Triple Islands, or proposed stations at Browning Entrance and Caamano Sound and the Kitimat Terminal (Segments 1, 2, 3, 4a, half of 4b, 6 and 7).
In general, a risk reducing effect of 80 % has been applied for groundings, while the effect on collisions will be much less, and 5 % reduction has been applied. A tethered tug will have a somewhat higher risk reducing effect, especially for a drifting vessel. Therefore the risk reducing effect has been increased to 90 % for drift grounding when a tethered tug is connected in addition to the close escort tug. In total this gives a reduction of the total incident frequency by some 65 %.
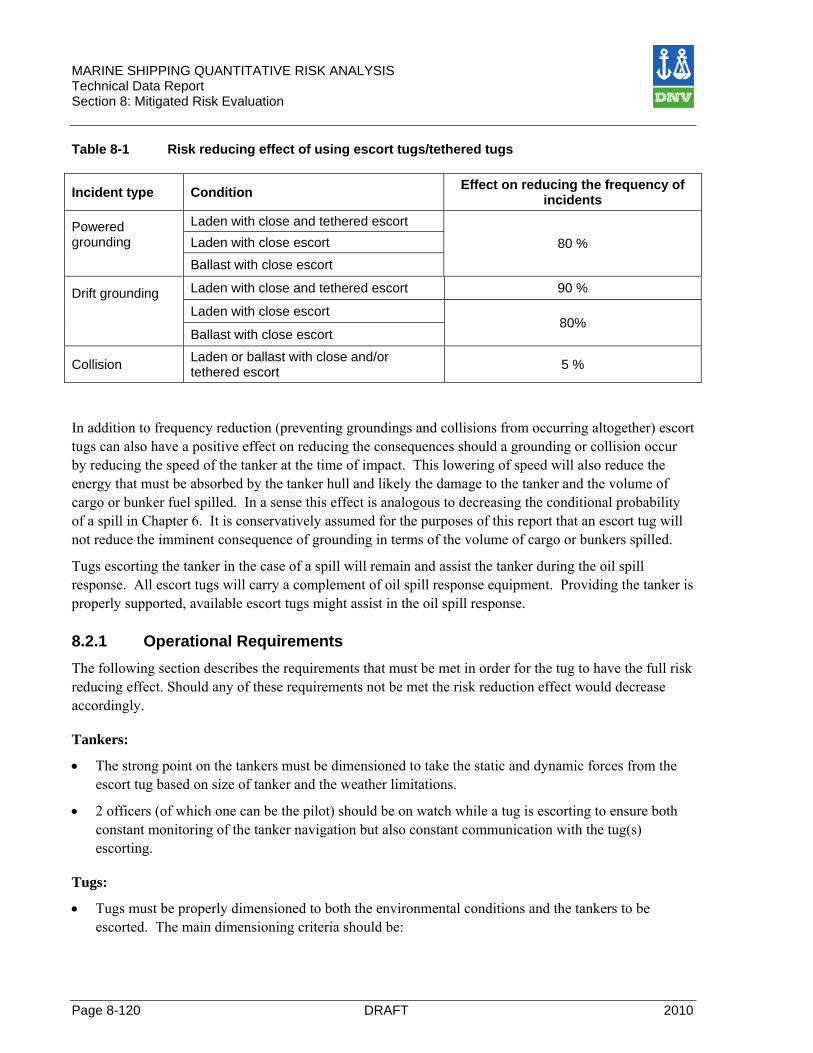
MARINE SHIPPING QUANTITATIVE RISK ANALYSIS Technical Data Report Section 8: Mitigated Risk Evaluation
Page 8-120 DRAFT 2010
Table 8-1 Risk reducing effect of using escort tugs/tethered tugs
Incident type Condition Effect on reducing the frequency of incidents
Powered grounding
Laden with close and tethered escort
80 % Laden with close escort
Ballast with close escort
Drift grounding
Laden with close and tethered escort 90 %
Laden with close escort 80%
Ballast with close escort
Collision Laden or ballast with close and/or tethered escort 5 %
In addition to frequency reduction (preventing groundings and collisions from occurring altogether) escort tugs can also have a positive effect on reducing the consequences should a grounding or collision occur by reducing the speed of the tanker at the time of impact. This lowering of speed will also reduce the energy that must be absorbed by the tanker hull and likely the damage to the tanker and the volume of cargo or bunker fuel spilled. In a sense this effect is analogous to decreasing the conditional probability of a spill in Chapter 6. It is conservatively assumed for the purposes of this report that an escort tug will not reduce the imminent consequence of grounding in terms of the volume of cargo or bunkers spilled.
Tugs escorting the tanker in the case of a spill will remain and assist the tanker during the oil spill response. All escort tugs will carry a complement of oil spill response equipment. Providing the tanker is properly supported, available escort tugs might assist in the oil spill response.
8.2.1 Operational Requirements The following section describes the requirements that must be met in order for the tug to have the full risk reducing effect. Should any of these requirements not be met the risk reduction effect would decrease accordingly. Tankers:
• The strong point on the tankers must be dimensioned to take the static and dynamic forces from the escort tug based on size of tanker and the weather limitations.
• 2 officers (of which one can be the pilot) should be on watch while a tug is escorting to ensure both constant monitoring of the tanker navigation but also constant communication with the tug(s) escorting.
Tugs:
• Tugs must be properly dimensioned to both the environmental conditions and the tankers to be escorted. The main dimensioning criteria should be:

MARINE SHIPPING QUANTITATIVE RISK ANALYSIS Technical Data Report Section 8: Mitigated Risk Evaluation
2010 DRAFT Page 8-121
o Wave height at point of tug connection
o Tug able to operate in weather on entire route o Ensure tugs have sufficient pulling force to retard and / or steer the proposed tankers
Tug Escort:
• Weather limitations based on tug capability should be defined and followed.
• The role and responsibility of the tug captain, tanker captain and pilot need to be clearly defined and communicated to all parties to prevent misunderstandings during operation.
• The tanker captain should be made fully aware of the escort tug’s capabilities
• Definition of relevant emergency situations which should be included and described in the tug escort operational procedures.
Training:
• Simulator training for pilots and escort tug crew to provide training for actual operation through the study area.
• Annual full scale drills in the Kitimat area involving a full size tanker and tug to give pilots and tug crews hands on experience in an emergency situation under controlled conditions.
8.3 The Lower Risk of Oil Spill using Tug Escort The greatest hazard to tankers over the three preferred routes is grounding and this is also the hazard escort tugs are the most effective in preventing. The effect of tug escort on the unmitigated spill probabilities from Table 7-8 is shown in Table 8-2, based on the frequency reducing effect summarized in Table 8-1. The use of tug escorts has the greatest effect is on powered grounding, followed by drift grounding and collision. Segments 1 and 6 see the largest decrease in risk. It should be noted that results in Table 8-2 assume an escort tug is provided to tankers laden and in ballast.
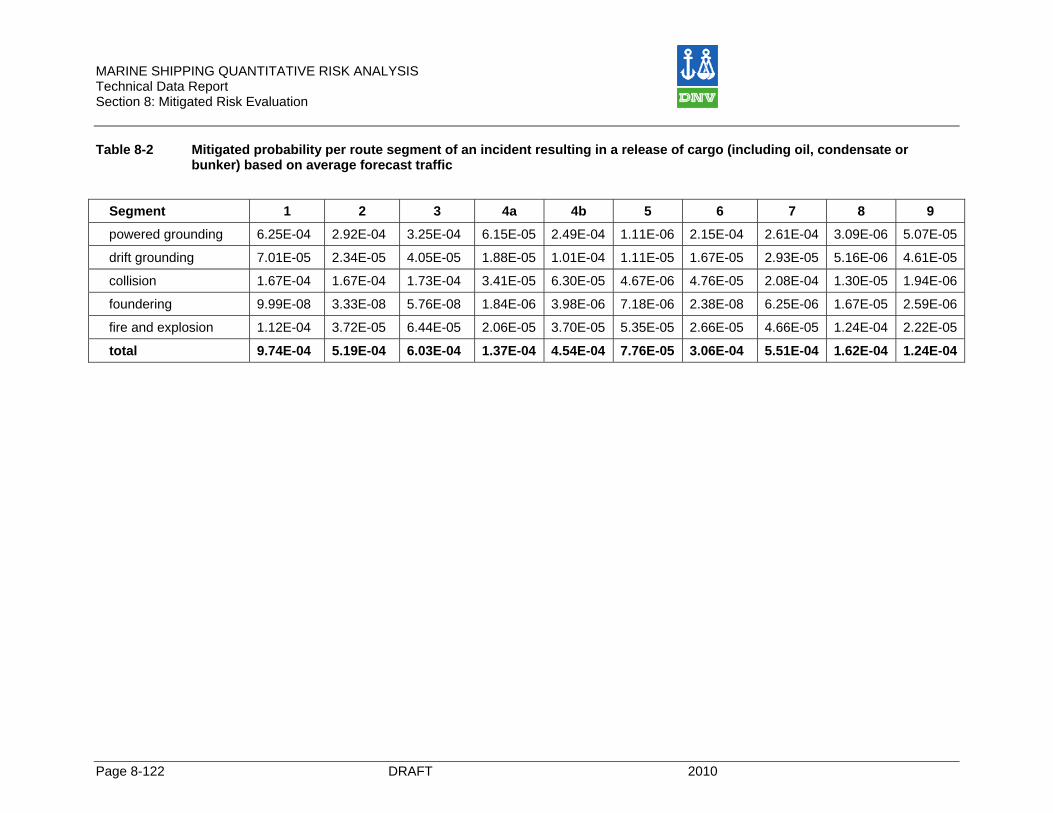
MARINE SHIPPING QUANTITATIVE RISK ANALYSIS Technical Data Report Section 8: Mitigated Risk Evaluation
Page 8-122 DRAFT 2010
Table 8-2 Mitigated probability per route segment of an incident resulting in a release of cargo (including oil, condensate or bunker) based on average forecast traffic
Segment 1 2 3 4a 4b 5 6 7 8 9
powered grounding 6.25E-04 2.92E-04 3.25E-04 6.15E-05 2.49E-04 1.11E-06 2.15E-04 2.61E-04 3.09E-06 5.07E-05
drift grounding 7.01E-05 2.34E-05 4.05E-05 1.88E-05 1.01E-04 1.11E-05 1.67E-05 2.93E-05 5.16E-06 4.61E-05
collision 1.67E-04 1.67E-04 1.73E-04 3.41E-05 6.30E-05 4.67E-06 4.76E-05 2.08E-04 1.30E-05 1.94E-06
foundering 9.99E-08 3.33E-08 5.76E-08 1.84E-06 3.98E-06 7.18E-06 2.38E-08 6.25E-06 1.67E-05 2.59E-06
fire and explosion 1.12E-04 3.72E-05 6.44E-05 2.06E-05 3.70E-05 5.35E-05 2.66E-05 4.66E-05 1.24E-04 2.22E-05
total 9.74E-04 5.19E-04 6.03E-04 1.37E-04 4.54E-04 7.76E-05 3.06E-04 5.51E-04 1.62E-04 1.24E-04


MARINE SHIPPING QUANTITATIVE RISK ANALYSIS Technical Data Report Section 8: Mitigated Risk Evaluation
Page 124 DRAFT 2010
The effect of using escort tugs has been calculated by multiplying the scaled incident frequency for each relevant segment (i.e. 1, 2, 3, 4a, 4b, 6 & 7) from Chapter 5 with the effect of tug escort from Table 8-1. The effect on oil spill return periods for the applicable segments is shown in Figure 8-1, based on the forecast transits per year through each segment as discussed in Chapter 7.
Figure 8-1 Effect of the use of escort tug on oil spill risk for applicable segments
Both Figure 8-1 and Figure 8-2 show the effect of tug escort on laden tankers and tankers in ballast. In some operations around the world only laden tankers are escorted given they often pose a greater consequence in the event of an incident that results in a spill. As can be seen in the figures above and below, and in Table 8-3 using tug escort on tankers in ballast can further limit the frequency of spills, some of which could still be significant depending on the volume of bunker fuel onboard. As described previously in this chapter, the Northern Gateway Pipelines Project plans to use tug escorts for tankers laden as well as those in ballast throughout the CCAA and to the pilot boarding stations.
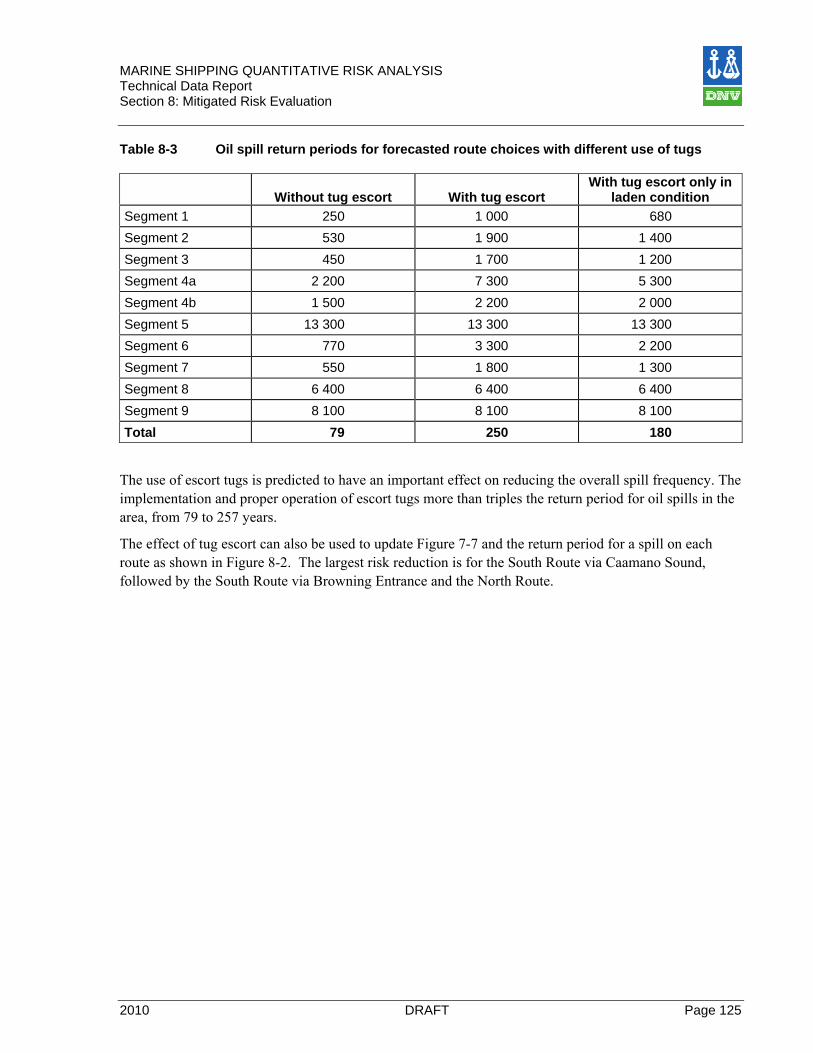
MARINE SHIPPING QUANTITATIVE RISK ANALYSIS Technical Data Report Section 8: Mitigated Risk Evaluation
2010 DRAFT Page 125
Table 8-3 Oil spill return periods for forecasted route choices with different use of tugs
Without tug escort With tug escort With tug escort only in
laden condition Segment 1 250 1 000 680 Segment 2 530 1 900 1 400 Segment 3 450 1 700 1 200 Segment 4a 2 200 7 300 5 300 Segment 4b 1 500 2 200 2 000 Segment 5 13 300 13 300 13 300 Segment 6 770 3 300 2 200 Segment 7 550 1 800 1 300 Segment 8 6 400 6 400 6 400 Segment 9 8 100 8 100 8 100 Total 79 250 180
The use of escort tugs is predicted to have an important effect on reducing the overall spill frequency. The implementation and proper operation of escort tugs more than triples the return period for oil spills in the area, from 79 to 257 years.
The effect of tug escort can also be used to update Figure 7-7 and the return period for a spill on each route as shown in Figure 8-2. The largest risk reduction is for the South Route via Caamano Sound, followed by the South Route via Browning Entrance and the North Route.

MARINE SHIPPING QUANTITATIVE RISK ANALYSIS Technical Data Report Section 8: Mitigated Risk Evaluation
Page 126 DRAFT 2010
Figure 8-2 Unmitigated and mitigated spill return periods for each route
The expected annual frequency of spills exceeding a certain size is illustrated in Figure 8-3 below. The mitigated return period of spills greater than 5,000 m3 has been estimated to be of the order of 550 years, while the return period for spills of 20,000 m3 will be some 2,800 years. The return periods for extremely large spills, exceeding 40 000 m3, have been estimated to more than 15,000 years.
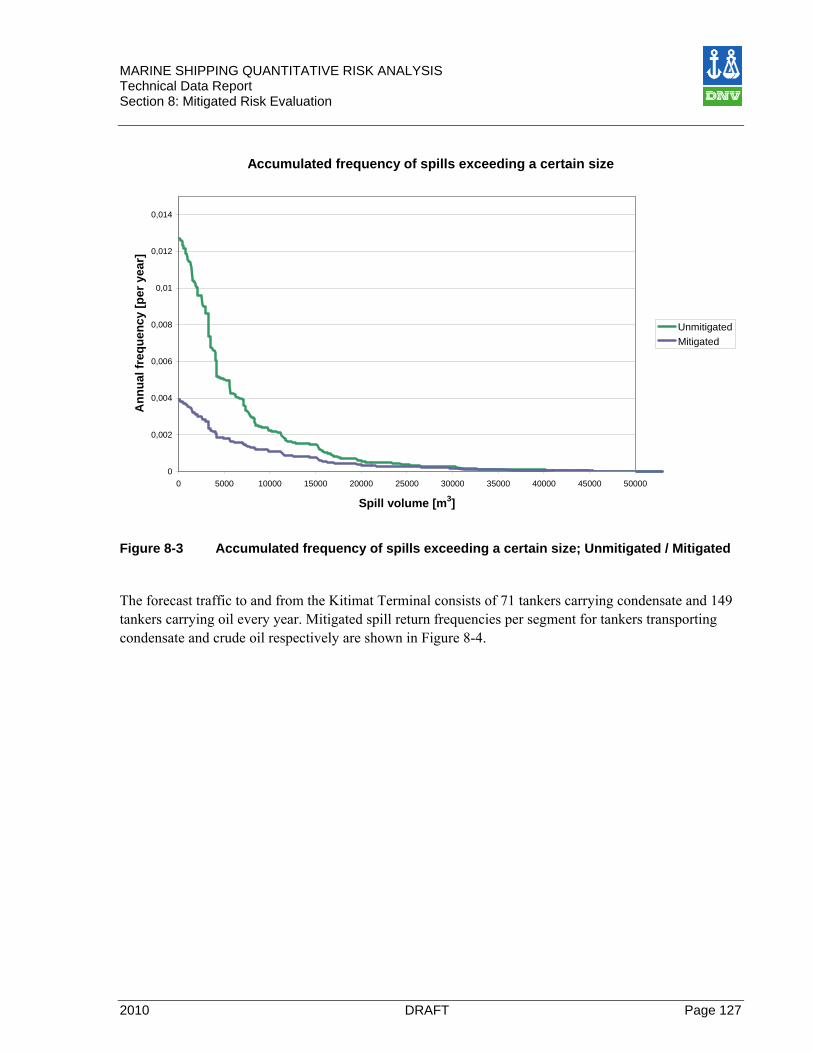
MARINE SHIPPING QUANTITATIVE RISK ANALYSIS Technical Data Report Section 8: Mitigated Risk Evaluation
2010 DRAFT Page 127
Accumulated frequency of spills exceeding a certain size
0
0,002
0,004
0,006
0,008
0,01
0,012
0,014
0 5000 10000 15000 20000 25000 30000 35000 40000 45000 50000
Spill volume [m3]
Ann
ual f
requ
ency
[per
yea
r]
UnmitigatedMitigated
Figure 8-3 Accumulated frequency of spills exceeding a certain size; Unmitigated / Mitigated
The forecast traffic to and from the Kitimat Terminal consists of 71 tankers carrying condensate and 149 tankers carrying oil every year. Mitigated spill return frequencies per segment for tankers transporting condensate and crude oil respectively are shown in Figure 8-4.

MARINE SHIPPING QUANTITATIVE RISK ANALYSIS Technical Data Report Section 8: Mitigated Risk Evaluation
Page 128 DRAFT 2010
Figure 8-4 Mitigated spill return frequencies per segment for tankers transporting Crude Oil
and Condensate respectively
As first described in Chapter 6.3 an uncontrollable situation has been defined as any incident that results in a total loss. The unmitigated return period for a total loss is estimated for each route in Figure 7-9, and is updated in Figure 8-4, below, with mitigation measures in place. The frequency of a total loss is moderate in the CCAA, however, the return periods for a total loss on the remaining segments are large enough for the risk to be considered negligible. Segments 5, 8 and 9 are not displayed and have mitigated return periods of 57,000, 26,000 and 55,000, respectively.
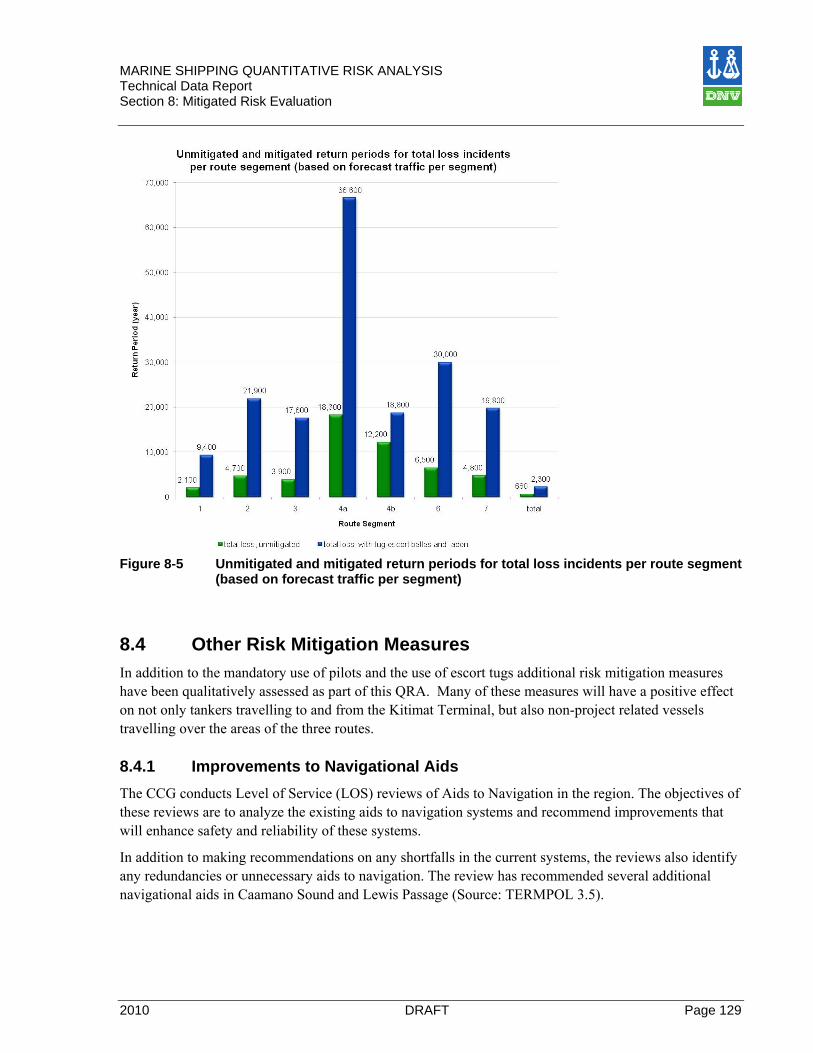
MARINE SHIPPING QUANTITATIVE RISK ANALYSIS Technical Data Report Section 8: Mitigated Risk Evaluation
2010 DRAFT Page 129
Figure 8-5 Unmitigated and mitigated return periods for total loss incidents per route segment
(based on forecast traffic per segment)
8.4 Other Risk Mitigation Measures In addition to the mandatory use of pilots and the use of escort tugs additional risk mitigation measures have been qualitatively assessed as part of this QRA. Many of these measures will have a positive effect on not only tankers travelling to and from the Kitimat Terminal, but also non-project related vessels travelling over the areas of the three routes.
8.4.1 Improvements to Navigational Aids The CCG conducts Level of Service (LOS) reviews of Aids to Navigation in the region. The objectives of these reviews are to analyze the existing aids to navigation systems and recommend improvements that will enhance safety and reliability of these systems.
In addition to making recommendations on any shortfalls in the current systems, the reviews also identify any redundancies or unnecessary aids to navigation. The review has recommended several additional navigational aids in Caamano Sound and Lewis Passage (Source: TERMPOL 3.5).

MARINE SHIPPING QUANTITATIVE RISK ANALYSIS Technical Data Report Section 8: Mitigated Risk Evaluation
Page 130 DRAFT 2010
The additional navigational aids are assessed to have a low risk reducing effect in the CCAA and are only relevant for powered grounding. Navigational aids, however, are considered to have a medium risk reducing effect in the area of Lewis Passage and Caamano Sound.
It should be noted that increased aids to navigation was cited as an important potential risk reducing measure in interviews with local stakeholders. The aids should have a positive effect on reducing the risk of both project and non-project related marine incidents in the area of the three routes.
8.4.2 Electronic Chart Display and Information System (ECDIS) IMO is working on guidelines making the installation of ECDIS (Electronic Chart Display and Information System), with back-up mandatory on all tankers. This will enable vessel crews to plan and monitor their route and positioning in a timely manner with up to date data.
One study indicates that the installation of ECDIS, with approved charts, may reduce the risk of powered grounding by up to 36% (source: MSC 81), while another indicates a reduction of the frequency of powered groundings by 11 % to 38 % (source: NAV 52). Both these studies compare situations with and without ECDIS.
Some vessels are already equipped with ECDIS and it is likely that the accident statistics used in this QRA already partly include the effect of ECDIS. Therefore the net additional effect of a general requirement for ECDIS for all tankers calling at the Kitimat Terminal is difficult to estimate.
For a tanker not equipped with ECDIS, the installation of ECDIS is expected to reduce the probability of powered grounding by some 30 %, and the total probability of an oil spill by some 15 to 20 %.
Although it is not required in SOLAS to have ECDIS installed on existing tankers until 1 July 2015, many ships have already installed the system. SOLAS requires ECDIS to be fitted on new tankers constructed on or after 1 July 2012. DNV recommends that ECDIS is installed on the tankers calling at the Kitimat Terminal.
8.4.3 Improvements to Vessel Traffic Service (VTS) The existing Vessel Traffic Service (VTS) system on Canada’s west coast involves reporting requirements for vessels over a certain size at designated call-in points.
The existing VTS system on the north coast focuses heavily on marine traffic within the Inner Passage route, due to its historic and continued use as a marine transportation corridor.
Today, however, larger vessels travelling the coast and to and from Kitimat are more often using Hecate Strait and the wider Outside Passage. Based on discussions in TERMPOL 3.5 & 3.12, additional calling-in points provided within the Outside Passage would enhance the effectiveness of the current VTS system and increase navigational safety in the area.
MARINE SHIPPING QUANTITATIVE RISK ANALYSIS Technical Data Report Section 8: Mitigated Risk Evaluation
2010 DRAFT Page 131
Similarly marine radar coverage relayed to Prince Rupert MCTS at certain points such as Wright Sound could greatly enhance both the overall VTS capability and the navigational safety of all vessels transiting the CCAA.
The risk reducing effect of the enhanced VTS system is assessed to be relatively small. The main risk reducing effect of the VTS will be on collisions which already assessed to be low risk given the relatively low traffic density along the three routes.
It is recommended that an enhanced VTS be assessed based on the total current and predicted traffic pattern in the area. Improvements such as the installation of radar coverage to augment VTS systems will reduce the risk of both project and non-project related marine incidents in the area of the three routes.
8.4.4 Traffic Separation In many coastal areas traffic separation schemes have been implemented in order to reduce the risk of collisions. The traffic separation schemes are similar to roads on land where inbound traffic would sail on one side and outbound traffic on the other. This measure can reduce the risk for head on collisions.
The collision risk along the three routes is assessed to be low. Therefore, the effect of implementing the traffic scheme and the potential effect on oil spill risk is limited. However, a traffic separation scheme may make it easier for small recreational crafts in the area to know which side the tankers would transit. As discussed in Chapter 4 this was concern raised in meetings with local stakeholders.
It is recommended that traffic separation schemes be assessed for routes in the CCAA.
8.4.5 Closed Loading (with Vapour Return System) The Kitimat Terminal will be equipped with a closed loading system and vapour recovery unit to collect the vapours that are displaced from the cargo tanks during loading. If the cargo tanks were to be accidentally overfilled the closed loading system can also redirect excess oil into alternate (empty) ship tanks thereby eliminating the risk of an oil spill.
This is in addition to the many cargo monitoring systems on board modern tankers, and the many spill prevention measures now built into tankers including deck containment systems. Any oil spilled by overloading the cargo tanks, and for some reason not collected by the vapour return system would be captured by the deck containment system and directed to the vessels slop tanks. Given the high frequency of historical cargo tank overfilling it is recommended that a vapour return system should be used during all loadings. This will virtually eliminate tank overfilling, increasing the overall oil spill return period to 62 years as shown in Table 8-4.
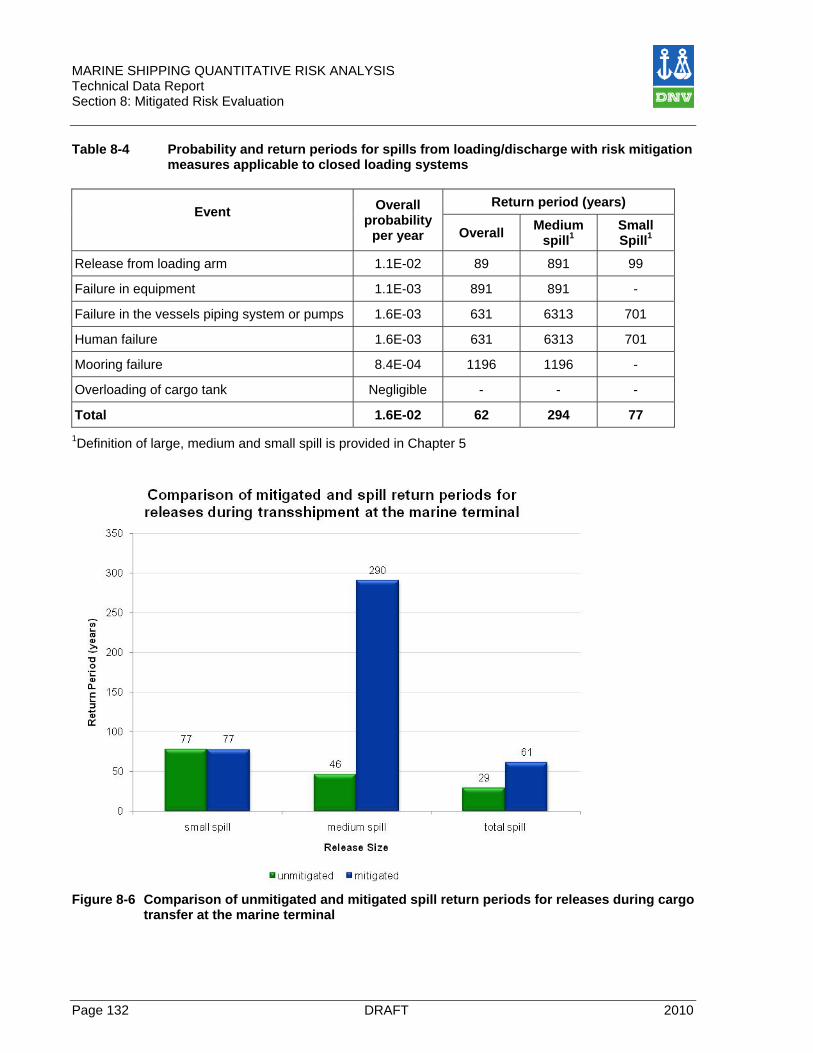
MARINE SHIPPING QUANTITATIVE RISK ANALYSIS Technical Data Report Section 8: Mitigated Risk Evaluation
Page 132 DRAFT 2010
Table 8-4 Probability and return periods for spills from loading/discharge with risk mitigation measures applicable to closed loading systems
Event
Overall probability
per year
Return period (years)
Overall Medium spill1
Small Spill1
Release from loading arm 1.1E-02 89 891 99
Failure in equipment 1.1E-03 891 891 -
Failure in the vessels piping system or pumps 1.6E-03 631 6313 701
Human failure 1.6E-03 631 6313 701
Mooring failure 8.4E-04 1196 1196 -
Overloading of cargo tank Negligible - - -
Total 1.6E-02 62 294 77 1Definition of large, medium and small spill is provided in Chapter 5
Figure 8-6 Comparison of unmitigated and mitigated spill return periods for releases during cargo
transfer at the marine terminal
MARINE SHIPPING QUANTITATIVE RISK ANALYSIS Technical Data Report Section 8: Mitigated Risk Evaluation
2010 DRAFT Page 133
8.4.6 Other Measures Other risk mitigation measures (some of which were mentioned throughout this QRA) should be examined for use on the Northern Gateway Pipelines Project.
• Based on the discussion in Chapter 3.2 Northern Gateway will decline the nomination of tankers with cargo tank arrangement extending the width of the tanker (minus the ballast tanks). Only tankers with longitudinal bulkheads will be used for transporting condensate and oil to and from the Kitimat Terminal. Increasing the number of tanks and reducing the volume of cargo per tank will limit the amount spilled if a tank is penetrated.
• Tanker speeds should be adjusted in Wright Sound when higher density traffic is present to avoid collision. As briefly discussed in this QRA, tankers will modify their speed in certain areas that are known to be more challenging to navigation or for environmental reasons such as the presence of marine mammals.
• Along with the enhancements to VTS and navigation aids, the basic radio and GPS communication systems along the routes should be evaluated per comments made during the HAZID.
• Per comments made during the HAZID local mariners may need to be educated on large tanker manoeuvring and international navigation protocols. While in the past small shuttle tankers may have manoeuvred around recreational or fishing activities, this is less likely to be the case with large tankers. Northern Gateway has also indicated they may modify operations during concentrated periods of commercial fishing.
• Closed loading eliminates the historically frequent event of tank overfilling at marine terminals and mooring line monitoring guards against a vessel drifting from the berth. Other incidents that can occur at the marine berth that could lead to spills can be mitigated through the adherence to well developed operating procedures and maintenance plans. Loading arm technology, procedures, maintenance, monitoring, and inspection, should all be carefully considered during detailed design, commissioning and operation.
• Weather monitoring and forecasting, including scheduling operations to avoid periods where conditions will exceed the environmental limits for safe operation should be further defined in detailed design.
8.5 Recent and Future Changes to Tanker Regulations International maritime rules and requirements are under constant improvement and new standards for all ship types, especially tankers, are ratified at regular intervals by the international maritime industry.
New requirements are most often implemented over a number of years after they are first introduced. This provides the ship owners and designers time to adjust to the new requirements, both in terms of equipment and design of the ship.
Below is a list of new requirements that have been approved and that have either recently come into force, or will come into effect in the near future. Most of these requirements will be in place by the time the Northern Gateway Project is operational.
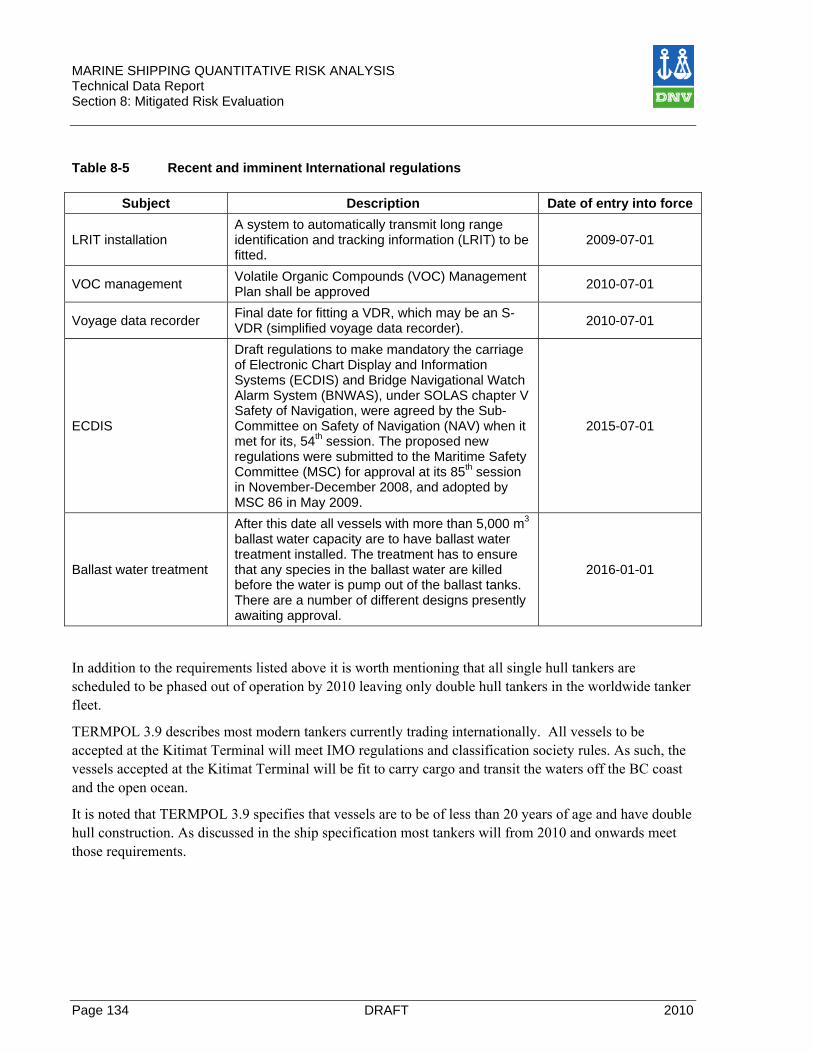
MARINE SHIPPING QUANTITATIVE RISK ANALYSIS Technical Data Report Section 8: Mitigated Risk Evaluation
Page 134 DRAFT 2010
Table 8-5 Recent and imminent International regulations
Subject Description Date of entry into force
LRIT installation A system to automatically transmit long range identification and tracking information (LRIT) to be fitted.
2009-07-01
VOC management Volatile Organic Compounds (VOC) Management Plan shall be approved 2010-07-01
Voyage data recorder Final date for fitting a VDR, which may be an S-VDR (simplified voyage data recorder). 2010-07-01
ECDIS
Draft regulations to make mandatory the carriage of Electronic Chart Display and Information Systems (ECDIS) and Bridge Navigational Watch Alarm System (BNWAS), under SOLAS chapter V Safety of Navigation, were agreed by the Sub-Committee on Safety of Navigation (NAV) when it met for its, 54th session. The proposed new regulations were submitted to the Maritime Safety Committee (MSC) for approval at its 85th session in November-December 2008, and adopted by MSC 86 in May 2009.
2015-07-01
Ballast water treatment
After this date all vessels with more than 5,000 m3 ballast water capacity are to have ballast water treatment installed. The treatment has to ensure that any species in the ballast water are killed before the water is pump out of the ballast tanks. There are a number of different designs presently awaiting approval.
2016-01-01
In addition to the requirements listed above it is worth mentioning that all single hull tankers are scheduled to be phased out of operation by 2010 leaving only double hull tankers in the worldwide tanker fleet.
TERMPOL 3.9 describes most modern tankers currently trading internationally. All vessels to be accepted at the Kitimat Terminal will meet IMO regulations and classification society rules. As such, the vessels accepted at the Kitimat Terminal will be fit to carry cargo and transit the waters off the BC coast and the open ocean.
It is noted that TERMPOL 3.9 specifies that vessels are to be of less than 20 years of age and have double hull construction. As discussed in the ship specification most tankers will from 2010 and onwards meet those requirements.
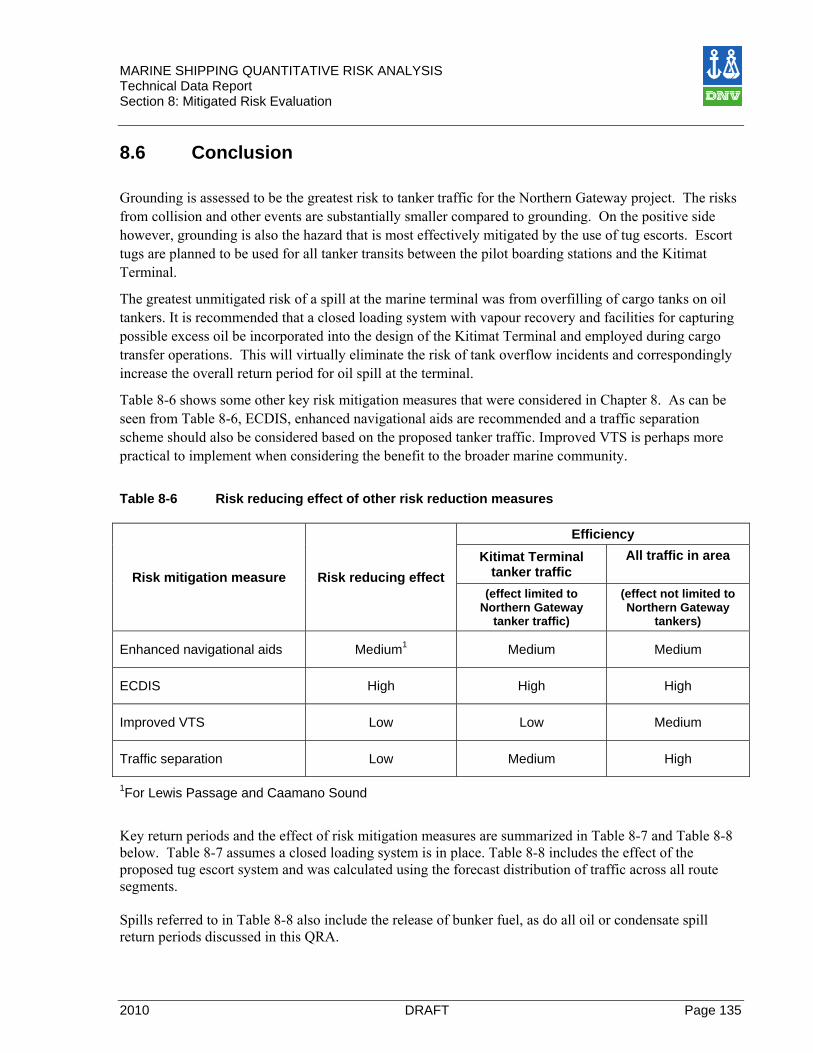
MARINE SHIPPING QUANTITATIVE RISK ANALYSIS Technical Data Report Section 8: Mitigated Risk Evaluation
2010 DRAFT Page 135
8.6 Conclusion
Grounding is assessed to be the greatest risk to tanker traffic for the Northern Gateway project. The risks from collision and other events are substantially smaller compared to grounding. On the positive side however, grounding is also the hazard that is most effectively mitigated by the use of tug escorts. Escort tugs are planned to be used for all tanker transits between the pilot boarding stations and the Kitimat Terminal.
The greatest unmitigated risk of a spill at the marine terminal was from overfilling of cargo tanks on oil tankers. It is recommended that a closed loading system with vapour recovery and facilities for capturing possible excess oil be incorporated into the design of the Kitimat Terminal and employed during cargo transfer operations. This will virtually eliminate the risk of tank overflow incidents and correspondingly increase the overall return period for oil spill at the terminal.
Table 8-6 shows some other key risk mitigation measures that were considered in Chapter 8. As can be seen from Table 8-6, ECDIS, enhanced navigational aids are recommended and a traffic separation scheme should also be considered based on the proposed tanker traffic. Improved VTS is perhaps more practical to implement when considering the benefit to the broader marine community.
Table 8-6 Risk reducing effect of other risk reduction measures
Risk mitigation measure Risk reducing effect
Efficiency Kitimat Terminal
tanker traffic All traffic in area
(effect limited to
Northern Gateway tanker traffic)
(effect not limited to Northern Gateway
tankers)
Enhanced navigational aids Medium1 Medium Medium
ECDIS High High High
Improved VTS Low Low Medium
Traffic separation Low Medium High
1For Lewis Passage and Caamano Sound
Key return periods and the effect of risk mitigation measures are summarized in Table 8-7 and Table 8-8 below. Table 8-7 assumes a closed loading system is in place. Table 8-8 includes the effect of the proposed tug escort system and was calculated using the forecast distribution of traffic across all route segments. Spills referred to in Table 8-8 also include the release of bunker fuel, as do all oil or condensate spill return periods discussed in this QRA.
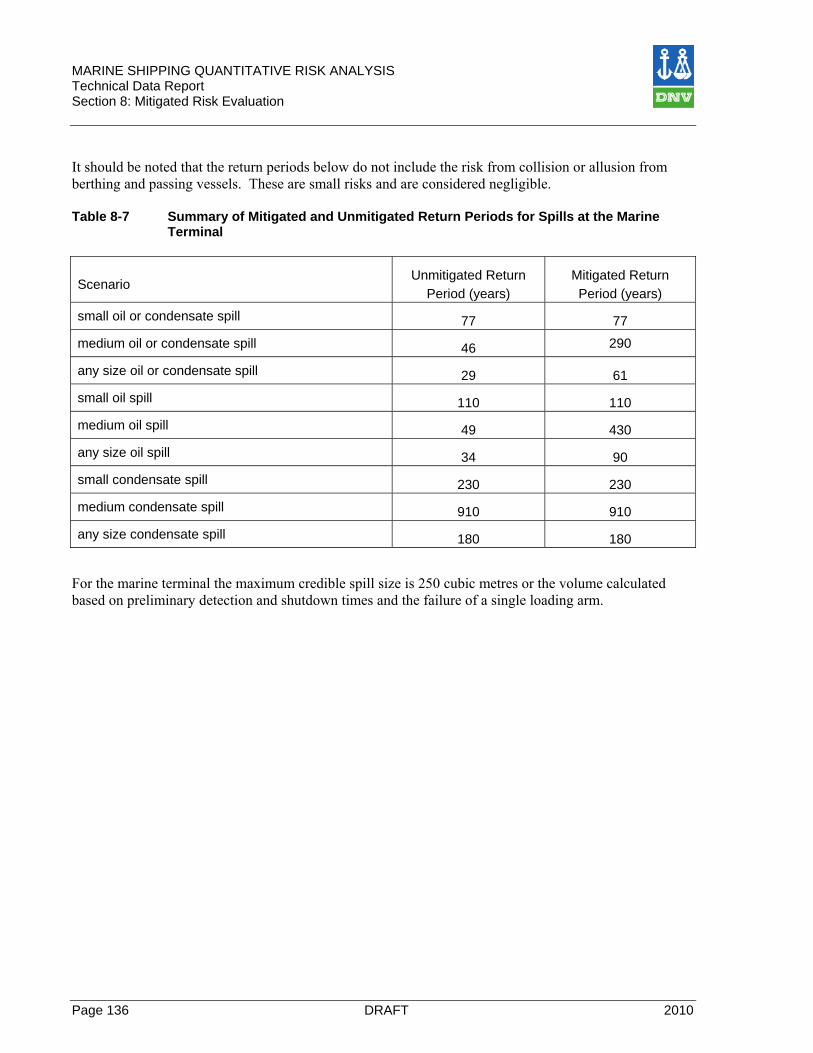
MARINE SHIPPING QUANTITATIVE RISK ANALYSIS Technical Data Report Section 8: Mitigated Risk Evaluation
Page 136 DRAFT 2010
It should be noted that the return periods below do not include the risk from collision or allusion from berthing and passing vessels. These are small risks and are considered negligible. Table 8-7 Summary of Mitigated and Unmitigated Return Periods for Spills at the Marine
Terminal
Scenario Unmitigated Return
Period (years) Mitigated Return Period (years)
small oil or condensate spill 77 77
medium oil or condensate spill 46 290
any size oil or condensate spill 29 61
small oil spill 110 110
medium oil spill 49 430
any size oil spill 34 90
small condensate spill 230 230
medium condensate spill 910 910
any size condensate spill 180 180
For the marine terminal the maximum credible spill size is 250 cubic metres or the volume calculated based on preliminary detection and shutdown times and the failure of a single loading arm.
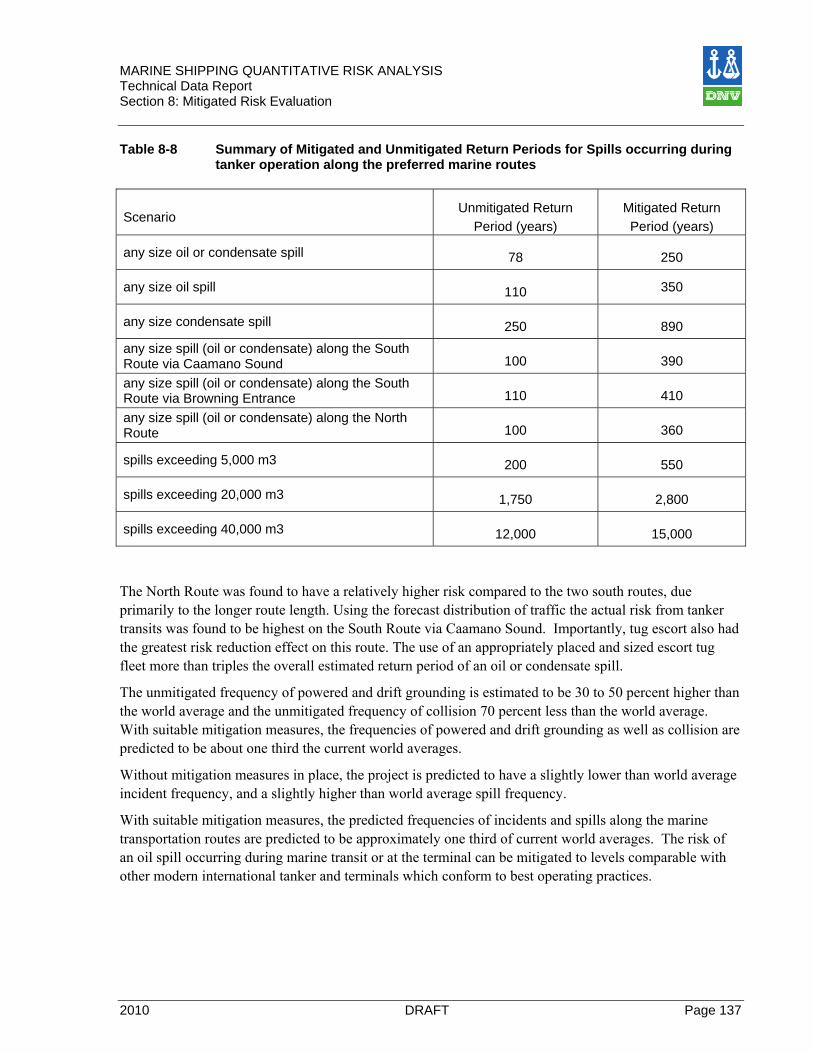
MARINE SHIPPING QUANTITATIVE RISK ANALYSIS Technical Data Report Section 8: Mitigated Risk Evaluation
2010 DRAFT Page 137
Table 8-8 Summary of Mitigated and Unmitigated Return Periods for Spills occurring during tanker operation along the preferred marine routes
Scenario Unmitigated Return
Period (years) Mitigated Return Period (years)
any size oil or condensate spill 78 250
any size oil spill 110 350
any size condensate spill 250 890 any size spill (oil or condensate) along the South Route via Caamano Sound 100 390 any size spill (oil or condensate) along the South Route via Browning Entrance 110 410 any size spill (oil or condensate) along the North Route 100 360
spills exceeding 5,000 m3 200 550
spills exceeding 20,000 m3 1,750 2,800
spills exceeding 40,000 m3 12,000 15,000
The North Route was found to have a relatively higher risk compared to the two south routes, due primarily to the longer route length. Using the forecast distribution of traffic the actual risk from tanker transits was found to be highest on the South Route via Caamano Sound. Importantly, tug escort also had the greatest risk reduction effect on this route. The use of an appropriately placed and sized escort tug fleet more than triples the overall estimated return period of an oil or condensate spill.
The unmitigated frequency of powered and drift grounding is estimated to be 30 to 50 percent higher than the world average and the unmitigated frequency of collision 70 percent less than the world average. With suitable mitigation measures, the frequencies of powered and drift grounding as well as collision are predicted to be about one third the current world averages.
Without mitigation measures in place, the project is predicted to have a slightly lower than world average incident frequency, and a slightly higher than world average spill frequency.
With suitable mitigation measures, the predicted frequencies of incidents and spills along the marine transportation routes are predicted to be approximately one third of current world averages. The risk of an oil spill occurring during marine transit or at the terminal can be mitigated to levels comparable with other modern international tanker and terminals which conform to best operating practices.
MARINE SHIPPING QUANTITATIVE RISK ANALYSIS Technical Data Report Section 9: References
Page 138 DRAFT 2010
9 References DNV 2000 “Activity Responsible Function (ARF) Procedures”. Safety Analysis
Handbook. H Ship Traffic Safety H2 Types of Incidental Events. rev. 24.01.2000
DNV 2002 Optimized Escort Tug Operations At Fawley Terminal, DNV report no. 2002 – 0529 CONFIDENTIAL
Rabaska 2004 RABASKA, Projet de terminal méthanier, Processus d’examen TERMPOL Étude 3.15, Analyse des risques et méthodes visant à réduire les risques
DNV 2006 Totalrisikoanalyse, Statoil – Kårstø, DNV Report 2006 – 0340 CONFIDENTIAL
Enbridge 2009 E – mail dated 26th May 2009 from Chris Anderson. Marine Advisor Enbridge Northern Gateway
GEM 2009 Gateway Environmental Management Team, Wind Observations in Douglas Channel. Squally Channel and Camano Sound, April 2009
ITOPF
The International Tanker Owners Pollution Federation Limited, www.itopf.com
LRFP 2007
Lloyd’s Register Fairplay Incident database and World Fleet Statistics
MET 2009
Norwegian Meteorological Institute, www.met.no, May 2009
MSC 81 FSA Study on ECDIS/ENCs: Details on Risk Assessment and Cost Benefit Assessments, Submitted by Denmark and Norway, MSC 81/INF.9.
NAV 52 Evaluation of the use of ECDIS and ENC Development: Evaluation of cost-effectiveness of ECDIS in routes of cargo ships considering ENC coverage, Submitted by Japan, MSC Sub-Committee on Safety of Navigation, NAV 52/6/2
NGP 2009 Northern Gateway Pipelines Technical Data Report, A Compilation of Statistics on Weather and Oceanographic Conditions in Queen Charlotte Sound. Hecate Strait. Dixon Entrance. and Nanakwa Shoal, 25 March 2009
RFP 2009 Request for Proposal for: Northern Gateway Marine. Quantitative Risk Assessment
TERMPOL 3.10 Site Plans and Technical Data, Enbridge Northern Gateway Pipelines Project. May 28 2009
MARINE SHIPPING QUANTITATIVE RISK ANALYSIS Technical Data Report Section 9: References
2010 DRAFT Page 139
TERMPOL 3.11 Cargo Transfer and Transhipment Systems, Enbridge Northern Gateway Pipelines Project. May 28 2009
TERMPOL 3.13 Berth Procedures and Provisions, Enbridge Northern Gateway Pipelines Project. June 30 2009
TERMPOL 3.2 Origin, Destination & Marine Traffic Volume Survey, Northern Gateway Pipelines Project. 30 March 2009
TERMPOL 3.5 Route Analysis. Approach Characteristics And Navigability Survey. Enbridge Northern Gateway Pipelines Project. January 30 2009
TERMPOL 3.5 & 3.12
Route Analysis & Anchorage Elements. Enbridge Northern Gateway Pipelines Project. January 30 2009
TERMPOL 3.8 Casualty Data Survey, Enbridge Northern Gateway Pipelines Project, June 2009
TERMPOL 3.9 Ship Specification. Enbridge Northern Gateway Pipelines Project. February 9 2009