Embed Size (px)
Citation preview
Technical Efficiency in Agriculture and Dependency on Forest
Resources: An Economic Analysis of Rural Households and the
Conservation of Natural Forests in Sri Lanka
Prabodh Illukpitiya
October, 2005

Comments should be sent to: Prabodh Illukpitiya, University of Hawaii at Manoa, 1910, East West Road, Honolulu, Hawaii, 96826, USA.
Email: [email protected]
EEPSEA was established in May 1993 to support research and training in environmental and resource economics. Its objective is to enhance local capacity to undertake the economic analysis of environmental problems and policies. It uses a networking approach, involving courses, meetings, technical support, access to literature and opportunities for a competitive research. Member countries are Thailand, Malaysia, Indonesia, the Philippines, Vietnam, Cambodia, Lao PDR, China, Papua New Guinea and Sri Lanka. EEPSEA is supported by the International Development Research Center (IDRC); the Swedish International Development Cooperation Agency (Sida); and the Canadian International Development Agency (CIDA). EEPSEA publications are also available online at http://www.eepsea.org.
2

ACKNOWLEDGEMENTS
The author gratefully acknowledges the doctoral field research grant provided by EEPSEA and the helpful comments made by Dr. David Glover and Dr. Herminia Francisco (EEPSEA) during proposal stage. He wishes to extend his sincere thanks to Dr. Nancy Olewiler (Simon Fraser University, Vancouver, Canada), and Dr. John. F. Yanagida (University of Hawaii at Manoa, USA) for constructive comments and suggestions made throughout the study. Author also wishes to thank numerous persons who assisted during field research and especially the rural households who took the time to provide with invaluable information. Thanks to Ms. Catherine Ndiaye (Program Assistant, EEPSEA) for her continuous assistance throughout the study period. Any errors contained in the report are the responsibility of the author.

TABLE OF CONTENTS
Executive Summary 1 1.0 Introduction 2
1.1 The Case in Sri Lanka 3 1.2 Problem Statement 3 1.3 Aims and Objectives 5
2.0 Review of Household Models and Theory of of Technical Efficiency 6 3.0 Empirical Model and Methodology 9
3.1 The Stochastic Frontier Model 9 3.2 Forest Dependency 11 3.2.1 Hypothetical Scenario Associated with the Forest Dependency Model 11 3.3 Data Sources and Methodology 14 3.3.1 Study Area 14 3.3.2 Sample 14 3.3.3 Survey Design 15 3.3.4 Data Sources 15
4.0 Results and Discussion 17
4.1 Translog Frontier Model 17 4.2 Forest Dependency Model 19 4.2.1 Estimation of Forest Dependency Model (for All Forest Products) 19 4.2.2 Estimation of Forest Dependency Model (NTFP) 21 4.2.3 Estimation of Forest Dependency Model (Fuelwood) 21 4.2.4 Estimation of Forest Dependency Model (Probit Analysis) 24 4.3 Economic Value of NTFP and Fuelwood to Rural Communities 24 4.4 Potential Benefits from Increasing Agricultural Efficiency to Rural
Households 26 4.5 Conclusion 288
5.0 Policy Implications 28
5.1 Recent Trends in Forest Policies in Sri Lanka 29 5.2 Policy Options 32
References 34 Appendix A 41 Appendix B 46Appendix C 46
4

LIST OF TABLES
Table 2.1. Results of Comparative Statics: Theoretical Relationships Between Exogenous and Endogenous Variables 7
Table 4.1. Technical Efficiency Ranges in Agricultural Farms in Forest Peripheries 18 Table 4.2. Mean Efficiency Scores in DEA Model 19 Table 4.3 Estimation on Forest Dependency for All Forest Product Category 20 Table 4.4 Estimation on Forest Dependency for the NTFP 22 Table 4.5. Estimation on Forest Dependency for the fuelwood 23 Table 4.6. Probit Estimation on Determinants of Forest Dependency 25 Table 4.7. Annual Economic Value of NTFPs and Fuelwood to Rural Communities in
Forest Peripheries 26 Table 4.8. Projected Benefit of Increasing Efficiency and the Threshold Efficiency
Levels Needed to Arrest Forest Dependency 27 Table 4.9. Annual Reduction of Opportunity Cost of Biodiversity Conservation due to
Increasing Farming Efficiency 27 Table A.1. Summary Statistics of Selected Variables 41 Table A.2. Comparison of Regression Coefficients Between Forest Reserves (Chow
Test) 42 Table A.3. Heteroskedasticity Tests Results for Original Model 42 Table A.4. Heteroskedasticity Tests Results for Corrected Model 42 Table A.5. Maximum Likelihood Estimates for the Dunhinda and Kithulanahela forest
reserves 43 Table A6. Maximum Likelihood Estimates for the Galagodabedda and Bibilehela-
Welanvita forest reserves 44 Table A.7. Probit Estimation on Marginal Effects on Determinants of Forest
Dependency 45
LIST OF FIGURES
Figure 2.1. Stochastic Frontier Production Function 8Figure C.1 Information flow in policy decisions 48

Technical Efficiency in Agriculture and Dependency on Forest Resources:
An Economic Analysis of Rural Households and the Conservation of Natural
Forests in Sri Lanka
Prabodh Illukpitiya
EXECUTIVE SUMMARY Households living in peripheral villages of the natural forests are primarily dependent on agriculture and secondarily dependent on forest gatherings. High rates of forest dependency occur, in part, from the efforts of inefficient farmers securing subsistence. Due to excessive use, the productivity of the remaining forests is at a critical stage. Technical efficiency in agriculture in forest peripheries is one aspect in which agricultural capacity and rural incomes can be enhanced. The study’s main objective was to assess the efficiency of farming in forest margins and to determine its effect on dependency on forest resources by rural households. The findings of the study showed that the mean technical efficiency in agricultural farming in forest peripheries ranges between 67 – 73 percent. Factors such as age, education, experience, extension, and the nutrition status of the household head are mainly responsible for determining the level of inefficiency. Further, study findings showed factors such as technical efficiency in agriculture, off-farm income, wealth and the diversification index had negative and significant effects on dependency of rural households on forest resource extraction. It is estimated that on average, an increase in mean technical efficiency in agriculture by 10 percent would increase agricultural revenue by 2,142 – 3,987 rupees/farm. Based on the threshold efficiency levels needed to arrest forest dependency, it is estimated that increasing agricultural income through increasing technical efficiency can be partly compensated for forest resource extraction. Compared to the measured efficiency levels, the efficiency gaps needs to be addressed by policy measures range from 2-14 percent for NTFP categories and 10-26 percent for the fuelwood category. Technical efficiency in agriculture can be minimized via policies to enhance farmer education, extension and nutrition status of households. Income diversification and off-farm employment, may be other viable options to minimize forest dependency. Based on the economic value of forest products extracted from each forest reserve, it is estimated that increasing technical efficiency in agriculture by 10 percent would reduce the opportunity cost of biodiversity conservation by 27, 46, 34 and 75 percents respectively in the forest under investigation. The study findings showed that intersectoral activities such as agriculture produce positive externalities in forest conservation. Additional revenue generated by improving technical efficiency of agriculture can be partly compensated for the income gained by extracting forest goods. Hence, improving technical efficiency in farming in forest peripheries should be an integral part of forest conservation policy in Sri Lanka.
1

1.0 INTRODUCTION Over the past few decades, environmental and developmental concerns have converged, with increasing interest in both tropical forests as an important ecosystem, and in the well-being of people who live near them. At the same time, tropical forests are subject to high rates of degradation and deforestation, with current estimates indicating a loss of some 17 million ha, or more than 1% of the total forest area, per year for all tropical forests (Byron and Arnold, 1999). Without a doubt, protection is one of the methods of assuring the continuation of tropical forests (see Hyde, 1980 for alternative ways of conserving natural forests). A primary factor acknowledged as a constraint to the successful establishment of protected areas in tropical countries is the lack of clear linkages between the well-being of local residents and conservation efforts undertaken in protected areas. Local residents are dependent on protected areas for a variety of reasons. Very often conservation efforts conflict with local subsistence demands, which erodes any protective measures undertaken (Shyamsundar and Kramer, 1996). The concept of forest dependency is focused on the degree of concentration of a particular forest based livelihood in a particular area. Given this, analysts often proceed to the determination of dependent communities by identifying communities that exceed a given, arbitrarily imposed, dependency threshold. For example, in a recent study of rural areas in the United States, farming-dependent counties were defined as counties that had 20 percent or more of labor and proprietor income derived from farming (Cook and Mizer 1994). In another study, recreational dependency was defined as having at least 10 percent of total employment in eating and drinking establishments, hotels and other lodging, and amusement parks (Ross and Green 1985). Many scholars assume that the extraction of plants and animals from the forest by rural populations helps conservation because foraging does not disturb the forest as much as logging. Leaving aside the injudicious extraction of forest plants and animals by recent harvesters, there is evidence that even indigenous people far from markets can deplete forest goods (Godoy and Bawa, 1993). As the evidence of Paleo-Indian hunters in North America shows (Martin, 1984), population growth or technological change can lead people to deplete natural resources. Extraction may be a sustainable activity only in areas with low population densities (Homma, 1992). A fundamental problem for conservation and development programs lie in the lack of knowledge about factors that influence choices between traditional activities made by forest households. To make matters worse, recent work shows that the resource use behavior of these households is, in fact, quite diverse both within and across communities (Browder, 1992; Coomes, 1996; Coomes and Barham, 1997). This diversity or heterogeneity means that whereas non-timber forest product (NTFP) represent major sources of income for some households, others in the same community may rely primarily on agriculture for their livelihood. Thus, what factors influence household participation in NTFP extraction activities becomes a relevant question.
2

1.1 The Case in Sri Lanka In Sri Lanka, there is a long tradition of forest product use by communities living in close proximity to forests, either as an economic mainstay or as a supplementary source of household income. Forests are important as an economic buffer and safety net for poor households. Exploitation of wild species, the enrichment of natural forests with economically important species and the adoption of complex agro forestry systems are all examples of a close relationship between people and forests in Sri Lanka (Wickramasinghe, et al., 1996).
1.2 Problem Statement Non-timber forest products (NTFPs) are used by rural communities as energy sources, food items, medicinal products, materials for household equipment, construction materials, as well as equipment and materials for agricultural activities. Several studies have documented the extent and product use in few forest reserves in Sri Lanka (see for instance Gunatilake et al., 1993; McDermott et al., 1990; Wickramasinghe et al., 1996, Bogahawatta, 1998). According to the Department of Census and Statistics, the rural population in Sri Lanka is growing rapidly. Due to the higher prices of gas and kerosene, the demand for fuel wood is growing rapidly. Inflation, caused by economic depression due to war and political instability, has been a tremendous impact on rural life. The occurrences will lead rural households to intensify NTFP extraction as a survival strategy as the current income gained from agricultural activities is insufficient to meet their basic needs. Due to excessive use, the productivity of the natural forests is at a critical stage1. In order to arrest the continuing problem of excessive extraction of NTFPs that leads to forest degradation, the government of Sri Lanka launched a number of conservation projects such as the Knuckles conservation program, Sinharaja conservation program, etc. These new policies were introduced specially for the conservation of forests by limiting the consumption of NTFPs, banning logging activities in forests and reducing the conversion of forestlands to agriculture (see section 5.1 for further discussion of Sri Lanka forest policies). This intervention is clearly a justification of the severity of the problem of forest dependency in Sri Lanka. The problems that arise from conflicts between conservation and development require a four-pronged solution. First, make additional resources available to encourage human economic activities that do not pose a threat to the survival of essential forests. Second, encourage agricultural activities that are economically productive and at the same time, environmentally and ecologically sound. Third, careful planning is needed to conserve forests in order to achieve environmental and ecological objectives while utilizing forest products within viable limits. Last, reforest land to extend forest cover. Among those proposed solutions this research will focus on improving agricultural activities done by
1 Forest extraction is sustainable and culturally meaningful only if NTFPs are freely available and population pressure is low. However if the harvesting of NTFPs are grater than its regeneration, continuous extraction would further leads degradation of forest resources.
3

rural households thereby minimizing their dependency on forest resources, which will strengthen conservation of the natural forests in Sri Lanka. Households living in peripheral villages of the protected forests are primarily dependent on agriculture and secondarily dependent on forest gatherings. High rates of forest dependency are driven, in part, by the effort of inefficient farmers to secure subsistence. Technical efficiency in agriculture in forest peripheries is one aspect in which agricultural capacity and rural incomes can be enhanced. But from an environmental perspective, attempts to raise rural incomes through agricultural improvement can result in an ambiguous effect (Shively, 2001). Technologies that increase the returns to agriculture can reduce the need for subsistence-driven land clearing. However, raising incomes and returns to agricultural activities may also provide incentives to convert forestland to farmland or other uses (see Faris, 1999; Mattos and Uhl 1994; Nickerson, 1999; Theil and Wiebelt, 1994; Barbier and Burgess, 1996). According to these studies, deforestation is assumed to be an increasing function of agricultural yield. However this assumption may not be applicable to countries where forest cover has already declined to a critical level (Repetto and Gillis, 1998) and where protected forests have been well demarcated with buffer zones and laws restricting conversion of forest lands to agriculture. Given that many Sri Lankan natural forests are legally protected from encroachment and conversion to agriculture, it is unlikely that improvement of agriculture cause clearing of natural forests. However, efficiency improvement has to be accompanied by strict monitoring and enforcement of laws regarding ban on forest lands to agriculture. In view of the growing competition in the agricultural sector and high production costs, technical efficiency will become an important determinant in the future of rural farming. Developing and adopting new production technology can improve technical efficiency. In addition, farming can maintain its economic viability by improving the efficiency of existing operations with a given technology. In other words, total farm output can be increased without increasing total cost by making better use of available inputs and technology. Hence, technical efficiency in agriculture decreases cost and ceteris paribus increases profit. This would enable poor farmers to overcome poverty and improve their standard of living. Increasing technical efficiency in agriculture has decreasing effect on forest dependency in two ways namely: income effect and labor supply effect (see Tachibana et al., 1998 and Shively, 2001 for similar discussion on increase in efficiency in lowland agriculture and its effect on upland farming). Increase in profitability of agriculture may arrest forest dependency due to large income effect. The higher profit in farming due to increasing efficiency will make an incentive for rural households to be engaging more on farming activities. Technical efficiency in agriculture may make rural household wealthier due to increase profit in farming. As shown by Godoy and Bawa (1993), wealthier households are less interested in extraction of forest resources hence their dependency will decline. From the rural labor market point of view, increased farm activities mean attraction for household labor to farming hence decreasing the labor allocated to forest extraction. When farming become a profitable business, then the opportunity cost of extraction activities become high.
4

Due to above facts it is reasonable to hypothesize that technical efficiency in agriculture productivity in peripheral villages of natural forests has a negative impact on the dependency on forest resources by local people. The reduction in the dependency on forest (when technical efficiency in agriculture increases) will reduce the depletion of the forest’s resources. If economic analysis determines that forest dependency is a decreasing function of technical efficiency in agriculture, and the efficiency improvement in agriculture could at least compensated for the current income gained by forest resource extraction, then on economic grounds, there is a basis for policy intervention to reduce forest dependency. Hence, finding ways to increase technical efficiency in agriculture and rural income without jeopardizing the remaining forest resources will be an important policy goal to protect forests while enhancing living conditions of the communities.
1.3 Aims and Objectives The major objective of this research is to determine how efficiency of agricultural activities in forest peripheries alters forest related activities. The more specific objectives are to:
1. determine technical efficiency of the farming activities in forest peripheries, 2. identify factors affecting the productivity and efficiency of agricultural farming in
forest peripheries, 3. estimate economic value of forest products extracted and the contribution of NTFPs
to the rural economy, 4. identify various socio-economic factors including technical efficiency of
agriculture influencing forest dependency, and 5. determine level of efficiency improvement to be archived in order to compensate
the current income generated by NTFPs
5
2.0 REVIEW OF HOUSEHOLD MODELS AND THEORY OF TECHNICAL EFFICIENCY
There have been growing interests in developing household economic models for agriculture and tropical forestry. Although few models are of interest those dealing with agriculture productivity and tropical deforestation warrant careful examination and are summarized next. Shively (2001) has developed a model of lowland technical progress and upland activities at a tropical forest margin. A model of lowland agricultural production is combined with a model of labor allocation on a representative upland farm to show how labor productivity, agricultural wages, and the returns from upland activities determine the rate of forest clearing. The empirical analysis based on farm level data from the Philippines demonstrates how agricultural intensification in the form of lowland irrigation development led to an increase in labor demand, an increase in employment of upland inhabitant, and small but significant reductions in rates of forest clearing. As Shively (2001) pointed out, the impact of technical progress depends on both direct impacts arising in the labor market and the indirect impacts arising in commodity markets. Growth in lowland production tends to pull labor out of upland production. Also, production increased income throughout the lowland economy, causing increased demand for upland products which resulted in upland households concentrating on commodity production and reducing forest degrading activities. A labor allocation model of the Bolivian Andes developed by the Bluffstone et al., (2001), examined the hypothesis that better management and regulation translates into time saving for households engaged in forest related activities. Such time saving can then be used in other productive activities such as off-farm employment. Time allocation toward more productive activities and an increase in resource rents translate into increased household income. The household model developed by Kohlin (1998), explains choice of collection/ consumption of biomass among households in Orissa, India, from natural forests (NF), village woodlots (VWL) and the markets. Based on the Kuhn-Tucker conditions, different household collection decisions were explained. According to the model, the marginal products from collection in VWL and NF are equal for certain household groups engaged in both activities. When the shadow price of collection is greater than the price of fuelwood times the marginal utility of cash income, households tends to purchase fuel. The higher opportunity cost of labor leads to no collection at all. Tachibana et al., (2001) presented a dynamic model of agricultural intensification and tested its implications using commune level data in the northern hill region of Vietnam. The results suggested that the choice between intensification and extensification is relevant in hilly areas with limited flat land and sloped upland and that strengthened land rights particularly that on upland, tend to deter deforestation. The results of the comparative statistics are given in the table 2.1.
6

Table 2.1. Results of Comparative Statics: Theoretical Relationships Between Exogenous and Endogenous Variables Increase in a
lL bS cuT * dD*
lE : Production efficiency in lowland farming + - - -
lT : Lowland farm area per capita + - - - P : Market price of upland products - + + + a : Cost parameter of forest clearance + - (i) - c : Insecurity index of upland property rights - + - (i) L : Labor endowment + + + + Notes:
alL :Labor input for upland farming bS : Upland cropping intensity
cuT * : Rotational shifting cultivation area at steady state
dD* : Forest area to be cleared at steady state (i): Ambiguous The finding of the above study showed that the improvement of lowland production efficiency, , leads to a smaller upland cultivation area, and a lower deforestation rate at the steady state.
lE
The theory of technical efficiency can be used to understand its effect on dependency on forest resources. Technical efficiency can be determined by estimating the best practice production frontier, where the discrepancy between the frontier and actual production points yields measures of inefficiency. Inefficiency increases costs and reduces profit. A producer may be inefficient for several reasons: (i) failing to achieve maximum output from a given level of inputs (technical inefficiency), (ii) using inputs in wrong proportions given their prices (allocative inefficiency), and (iii) failing to achieve the optimum scale of operation (scale inefficiency). Economic efficiency is the product of technical and allocative efficiencies.
Technical efficiency can be illustrated by alternative production frontier models such as deterministic frontiers, stochastic frontiers, and panel data models (Battese, 1992). The basic structure of the stochastic frontier model (Appendix B.1) is depicted in Figure 2.1 in which the productive activities of two firms, represented by and i j , are considered. Firm uses inputs with values given by (the vector) and produces output, , but the frontier output, , exceeds the value on the deterministic production function,
i ix iY*
iY ( )iixf β, , because its productive activity is associated with favorable conditions for which the random error, is positive. However, firm iV j uses inputs with values given by (the
vector) and produces output, which has corresponding frontier output, which is jx jY *jY
7
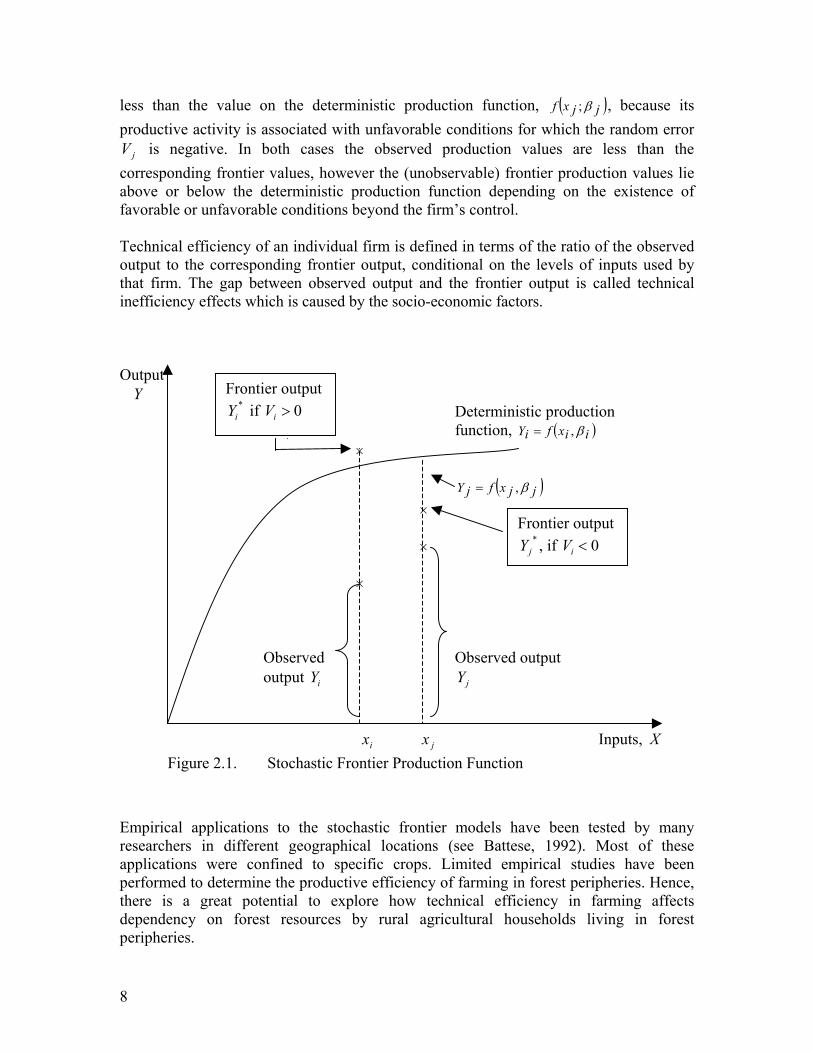
less than the value on the deterministic production function, ( )jjxf β; , because its productive activity is associated with unfavorable conditions for which the random error
is negative. In both cases the observed production values are less than the corresponding frontier values, however the (unobservable) frontier production values lie above or below the deterministic production function depending on the existence of favorable or unfavorable conditions beyond the firm’s control.
jV
Technical efficiency of an individual firm is defined in terms of the ratio of the observed output to the corresponding frontier output, conditional on the levels of inputs used by that firm. The gap between observed output and the frontier output is called technical inefficiency effects which is caused by the socio-economic factors. Output Y Deterministic production function, ( )iixfiY β,= × ( )jjxfjY β,= × × × Observed Observed output output iY jY
Frontier output *Y 0>i if V i
Inputs, ix jx X Figure 2.1. Stochastic Frontier Production Function
Empirical applications to the stochastic frontier models have been tested by many researchers in different geographical locations (see Battese, 1992). Most of these applications were confined to specific crops. Limited empirical studies have been performed to determine the productive efficiency of farming in forest peripheries. Hence, there is a great potential to explore how technical efficiency in farming affects dependency on forest resources by rural agricultural households living in forest peripheries.
Frontier output *
jY , if 0<iV
8

3.0 EMPIRICAL MODEL AND METHODOLOGY
This section statistically evaluates the predictions of the model on agriculture and forest extraction. The main interest lies in quantifying the effect of technical efficiency in agriculture on forest extraction. Hence, a series of statistical estimations was performed in order to examine how technical efficiency in farming activities affects the dependency on forest resources. The first series of equations analyzed deals with the estimation and assessment of technical efficiency from farming activities in forest peripheries. The first stage of the estimation was done by using the translog production function followed by the finding of factors associated with technical inefficiency. Then, estimation of forest dependency was performed by incorporating the technical efficiency results generated by stage one of the empirical model along with other socio-economic variables.
3.1 The Stochastic Frontier Model Since the basic stochastic frontier model was first proposed by Aigner et al., (1977) and Mueeusen and Van den Broeck (1977), various other models have been suggested and applied in the analysis of cross sectional and panel data. Reviews of some of these models and their applications are given by Battese (1992); Bravo-Ureta and Pinherio (1993) and Coelli (1995). Some models have been proposed in which the technical inefficiency effects in the stochastic frontier model are also modeled in terms of other observable explanatory variables (see Kumbhakar et al., 1991; Huang and Liu. 1994, and Battese and Coelli. 1995). In the first phase of the analysis, technical efficiency effects for a cross section of rural agricultural households in the periphery of the natural forest were modeled in terms of input variables in the production process. Various statistical hypotheses were tested for the smallholder farmers and their technical efficiencies of production are predicted. The stochastic production function proposed by Battese and Coelli (1995) was based on the empirical model of agricultural efficiency. Rural agricultural households generally cultivate different crops in their farmlands, this practice renders the single crop production model to be infeasible. In the case of multiple outputs, the dependent variable in the production model is measured in terms of the total value of agricultural outputs or production. Inputs can be categorized into three groups: land, labor and other variable inputs. It is assumed that the capital use in agriculture is homogenous across the households. The stochastic frontier model to be estimated is defined by:
ii1j 1kj
kiijjkijj0i UVlnXlnXβlnXββlnY −+∑ ∑ ∑++== =<
6 6 6 3.1
Where represent the natural logarithm lnthe subscript, i , indicates the th farmer in the sample i ( )ni ...,..........,.........2,1= .
9
iY represents the value of farm output
1lnX represents the logarithm of the total area of land (in ha) under cultivation (Area)
2lnX represents the logarithm of family labor in man-days (Flabor)
3lnX represents the logarithm of hired labor (Hlabor)
4lnX is the logarithm of the quantity of inorganic fertilizer applied (Ifer)
5lnX is the logarithm of the quantity of organic fertilizer applied (Ofer)
6lnX is the logarithm of the quantity of pesticides applied (Pest)
jβ ’S are unknown parameters to be estimated
iV 's are assumed to be independent and identically distributed normal random errors having zero mean and unknown variance, σv
2; ’s are non-negative random variables, called technical inefficiency effects, which are assumed to be independently distributed such that is defined by the truncation (at zero) of the normal distribution with mean, μ
iU
iU i and variance σ2.
iiiiiii ZZZZZZU 6655443322110 δδδδδδδ ++++++= 3.2 Where:
iZ1 is the age and represents the number of years of formal education (Edu) of the household head
iZ2
iZ3 is the number of years of experience in farming (Exp) of the household head
iZ4 represents the number of hours of extension assistance (Exten) received by the household head
iZ5 is the nutritional level (Nutri) of the household head measured by average daily intake of calories
iZ6 is gender (Gen) 1 if the household head is male or otherwise zero δ ’s are known as scalar parameters The model for the technical inefficiency effects, defined by equation (3.2) specifies that the technical inefficiency effects of the stochastic frontier (B.1) are a function of the age, gender, education, nutritional status, experience of the household head and the hours of extension advice they receive. It is hypothesized that increased formal education, ceteris paribus, is expected to reduce technical inefficiency. Older farmers are expected to increase technical inefficiency (see Battese and Coelli, 1992; Burki and Terrell, 1998; Ekanayake and Jayasuriya, 1987; Kalirajan and Flinn, 1983) partly because older farmers tend to be less adaptable to new technical developments. It is also hypothesized that increased experience in farming results in lower values of technical inefficiency (Carter and Cubbage, 1995).
10

More advice from extension workers, ceteris paribus, is expected to reduce technical inefficiency effects, which can be categorized as institutional characteristics. The impact of nutrition on labor productivity has been analyzed by number of authors (Strauss, 1996, and Deolalikar, 1988). It is hypothesized that households with access to more nutritional diets result in lower values of technical inefficiency. According to the gender division among rural households in Sri Lanka, farming is mainly done by males. Male household heads possess inherent skills for farming activities. Therefore, if the household head is male, then lower technical inefficiency value is expected.
3.2 Forest Dependency The econometric estimation strategy requires a dependent variable that measures forest dependency. Literature indicates, forest collection labor as one way to measure forest dependency (see Bluffstone et al., 2001; Pattanayak and Sills, 2001). However, there are difficulties in measuring time allocation for extraction. Therefore, in the empirical model, household income generated from forest extraction was taken as an indicator of forest dependency. The households decision making in forest resource extraction is govern by border set of variables, namely physical, personal and economic factors (See Bluffstone et al., 2001; Cavendish, 2000, Gunatilake, 1998; Godoy and Bawa, 1993; Godoy et al., 2000; Pattanayak & Sills, 2001; Ruiz Pérez & Byron, 1999 and Vedeld et al., 2004 for more details). Forest dependency is also associated with historical reasons (Cooms, 1995) and cultural aspects (Balèe, 1989). Hence individual hypotheses can be formed based on the forest resource extraction by rural households in the periphery of natural forests. These are identified in the discussion that follows.
3.2.1 Hypothetical Scenario Associated with the Forest Dependency Model The extraction of forest resources by rural households is assumed to be governed by a number of factors, hence individual hypotheses can be formed based on the forest resource extraction by rural households in the periphery of natural forests. 1. Because rural households depend primarily on agriculture, technical efficiency of farming is a key factor affecting forest extraction. Efficient farmers will depend less on forest extraction while inefficient farmers may have to depend more on forest resources. Hence, it is hypothesized that there is an inverse relationship between efficiency of farming and dependency of forest resources among rural households. 2. Education is an important tool governing the dependency of forest resource extraction. Education is assumed to be associated with access to new information and opens up better employment opportunities diverting people from subsistence agricultural and forest extraction activities (Gunatilake, 1998, Vedeld et al., 2004). On the other hand, education along with experience are major determinants of wage. Hence, it is hypothesized that
11

there is an inverse relationship between education and forest resource extraction by households. 3. Microeconomic theory suggests that the effect of economic development on the sustainability of foraging depends on wealth and will produce complex results. As described by Godoy and Bawa (1993), wealthier households and villages tend to: a). extract fewer plants and animals, b). spend less time foraging and more time in non-forestry occupations, c). consume fewer wild plants and game, and d). use more domesticated animals and industrial substitutes. However, richer households may use greater quantities of environmental resources (Cavendish, 2000). On the other hand, wealthy villagers are more likely to deplete resources than poor villagers because wealth allows villagers easier access to modern technologies. Considering the local situation, where, modern technology (such as fire arms for hunting) is banned in conservation forests, it is hypothesized that increased wealth has a negative impact on forest resource extraction. 4. When off-farm employment opportunities are high, households will pay less interest on foraging activities. Hence, it is assumed that an inverse relationship exists between off-farm income and forest extraction activities. 5. Family labor is a key component in forest gathering. Given the subsistence nature of forest gathering, it is not economical to employ hired labor. Therefore, availability of family labor when other things equal (i.e., when family members are not all involved in other activities such as agriculture) contribute to increased forest dependency. 6. Due to diversity and complexity of tropical forests, accumulated forest knowledge affects the household’s ability to collect. Households with better understanding of forestry and forest products have a comparative advantage over less knowledgeable households. Therefore, a positive relationship is assumed between accumulated forest knowledge and forest dependency. 7. Forest gathering is done by both males and females (Wickramasinghe et al, 1996, Ruiz Pérez et al., 2002). In the study areas, fuelwood gathering is mainly done by females, while other NTFPs are mainly collect by male households though there are exceptions. The effect of male: female ration on forest dependency depends according to the types of forest goods gathered. For example if the fuelwood is the major forest gathering, then an inverse relationship is assumed between higher male:female ratio and forest dependency. If the major income is gain from forest products which male households are specialized in collecting (i.e hunting, trapping of trees) then higher male:female ratio would lead increase forest dependency. However due to the complex nature of gender allocation in forest good collection, overall effect may be ambiguous. 8. Income diversification is a strategy that rural households practice for difference reasons (see Reardon et al., 2000; Huggblade et al., 1989; Valdivia, et al., 1996; Vedeld et al., 2004). Given that household’s perception on allocation of time and labor for productive income sources, an inverse relationship between the diversification index and
12

forest gathering is hypothesized (However, this assumption does not hold in a situation where there is no diversification of household income and the family is completely involved in agriculture or a single income source). 9. If the distance to the forest is too far from the village, households may show less interest in foraging (Heltberg et al., 2000). Greater distances to forests imply higher opportunity cost of time for extraction activities. Hence, a negative relationship is hypothesized between distance to the forest and extraction. 10. Tropical forests have contributed to the well being of local people by providing a form of natural insurance. Pattanayak and Sills (2001) conceptualized a microeconomic model relating agricultural risk to NTFPs in the Brazilian Amazon and found that households rely on forests to mitigate agricultural risk. Hence, a positive relationship between agricultural risk and forest dependency is conjectured. 11. The availability of credit for farming activities may have an effect on household dependency on forest resources. If the likelihood of obtaining credit increases, farmers would be more interested in investing in farming activities. In developing countries, access to credit is one of the major limiting factors in farm activities. For different parts of the world, researchers (Gardner, 1969; Hussain and Young, 1986; Sahota, 1968) have found similar results. Therefore it is hypothesized that greater access to credit has an inverse effect on the extraction of forest resources. Although, all of the above relationships are important to fully understand the dependency of forest resources, it is not easy to measure some of the variables in a cross sectional survey. Agricultural risk can be measured as a coefficient of variation in prices or yields of major crops. However, time series data are needed to estimate price and yield risk. Therefore, variables representing agricultural risk was not be included in the empirical model. Also due to the limited availability of credit to rural households, variable credit was also excluded in the final model (3.3). The model can be mathematically represented as:
( ) ( ) ( ) ( ) ( ) ( ) (( ) ( ) iii
iiiiiii0f
DisβDiverβ
WealthβMFratioβKnowβFlaborβOincβEduβEffiββY
ε+++
)+++++++=
98
7654321 3.3
Where:
iY = income generate from extraction of forest resources
iEffi = technical efficiency in farming
iEdu = formal education measured by number of years
iOinc = off-farm income
iFlabor = family labor measured in number of productive members in the family
iKnow = accumulated forest knowledge (experience)
iMFratio = male to female ratio
13

iWealth = household wealth measured by the value of the selected goods (i.e livestock, tractors, bicycles, radios, equipments used with animals)
iDiver = diversification index
iDis = distance to forest from home
iβ ’s are unknown parameters to be estimated
iε is the error term The variable associated with diversification can be constructed by the inverse Simpson index of diversity (Hill, 1973).
Index of diversity = ∑=
=N
iiP
1
21 3.4
Where: N = number of different income sources
iP = household income generated by activity i
3.3 Data Sources and Methodology
3.3.1 Study Area The study was conducted in the natural forest areas (i.e., Dunhinda, Kithulanahela, Galagodabedda, Bibilehela and Welanwita) of the Badulla district in Sri Lanka. The Badulla district is comprised of a wide range of natural forests with 19.6 % of the total land area in the district being devoted to natural forests. The average monthly household income of communities in the district is approximately 50 US $. The incidence of poverty in the study area is estimated to be over 30 percent (ADB, 1997). With this level of poverty and over 15 percent unemployment, pressure on natural forest is high. From each of these forests, several villages were selected based on their location.
3.3.2 Sample Determining the appropriate sample size is a most crucial step in any research study. To obtain a statistically sound result, the approach described by Hamburg (1987) and Yamane (1967) was utilized. The calculation of appropriate sample size is as follows:
( ) 22/⎥⎦⎤
⎢⎣⎡=
EZn σα 3.5
Where: n= sample size
14

Z = the two tail z value with the appropriate confidence level σ = population standard deviation E = precision level In agricultural research, 95% confidence interval is normally used. Based on estimation of forest dependency from the pilot survey conducted in April - May, 2003, the estimated population standard deviation was calculated. The parameters required to estimate sample size are as follows: E = 314.65 (1/10 of standard deviation) α = 0.05 Z = 1.96 σ = 3146.5 Utilizing this information and equation 3.5, a desired sample size of 382 was obtained.
3.3.3 Survey Design Prior to implementation of the survey, pre-testing was conducted among randomly selected households in two forest peripheries during April-May, 2003. Field surveys were conducted during the period of September, 2003- January, 2004. This was followed by another field visit during May-June, 2004 to re-check the data gathered during field surveys and especially to verify the valuation of forest products. Standardized interviewing techniques (Fowler and Mangione, 1990) were used in order to minimize interviewing related error. Basic information such as location of forest and villages was also obtained from the District Forest Office (DFO) and the Range Forest Office (RFO) in Badulla. Demographic information related to villages in forest peripheries were collected from the statistical handbooks of the divisional secretariats in Soranathota, Passara, Meegahakivula and Haldummulla in the Badulla district. Demographic data were disaggregated to the village level within each individual forest reserve. The data was collected in several villages in the forest peripheries of Dunhinda, Galagodabedda, Kithulanahela, Bibilehela and Welanwita forest areas. Households were randomly selected for the survey.
3.3.4 Data Sources Information on farm returns from random samples of farmers on subsistence production activities such as paddy and other field crops were collected. Information was collected on the total value of agricultural outputs, because farmers generally practice mixed cropping, in which more than one crop is grown on a piece of land at the same time. Inputs such as land area under cultivation, human labor and other inputs such as inorganic fertilizer, organic
15

fertilizer and pesticides were also recorded. Socio-economic variables, such as age, farming experience and the level of education of the farmers were also recorded. Agricultural extension assistance received by the farmer, nutrition and gender status of the head of the household were also be recorded. Energy intake of a household is the sum of energy values that could be obtained from each and every food item consumed in the household. The household heads meal in each day of the reference week is recorded in the survey schedule and this information was used to calculate the per-capita energy intake per day of the households as stipulated by the household income and expenditure survey (DOCS, 2002). Per capita energy intake of the household head was calculated using food composition tables for Sri Lanka (see Perera et al., 1979). Identification of NTFPs (fruits, vegetables, mushrooms, yams, spices, bee honey, wild meat, medicinal products, poles, and various other products), and fuelwood used by peripheral villagers, quantities extracted and time spent by households for collection, rate of extraction was performed. In quantifying NTFPs, most of the information was obtained by direct questioning of respondents. The economic value of the NTFPs was assessed using forest gate prices, opportunity cost of time and the prices of closest substitutes (see Godoy et al., 1993). Forest gate prices were used to assess the value of products such as fruits, vegetables, mushroom, wild meat, bee honey, rattan, kithul (Caryota urens) products and certain spices. Opportunity cost of time was used to value products such as thatching materials, poles, cut grass and medicinal plants. Value of fuelwood was determined using price of closest substitute (i.e., price of marketable fuelwood). Based on the above information, the aggregate economic value of NTFPs for each household was calculated. Non-market valuation techniques were not used as total forest biodiversity is not measured in the study. However, due to short time horizon, relatively homogenous population and low variation of price in local markets, measurements of NTFPs as above would not leads major mis-specification hence it is unlikely that it would fundamentally change the results. Farmer's wealth was measured by the value of nine assets (i.e., cows, buffaloes, goats, poultry, tractors, bicycles, radio, television, and farm equipment used with animals). To value physical assets, village price at the time of survey was used. Off-farm income was calculated as income received by non-farm and non-extraction activities. Household members have to walk to the forest for extraction activities. Distance from their home to the forest location most often visited was measured in kilometers. Average time spent by each household on a single trip was recorded. The number of trips that households take to the forest for gathering activities was also recorded. The number of years of experience in forest gathering was recorded as it is a proxy for accumulated forest knowledge. Secondary data were mainly gathered from government publications. Various publications from local and international organizations, sectoral studies, previous research studies and other relevant materials were utilized for data collection. Other secondary data sources (e.g., Department of Survey, Divisional Secretariats in Badulla district) were used to obtain information such as geographical locations of selected villages and forests, demographic characteristics, etc. Forestry maps were obtained from the Department of forest conservation.
16
4.0 RESULTS AND DISCUSSION
The data set consists of 442 households, comprise of five different forest reserves in the Badulla district. Bibilehela and Welanvita forest reserves are contiguous, hence considered as one reserve. Summary statistics with regard to the key variables are given in table A.1. The Chow test was performed to determine whether pooling the data by different forest sites was appropriate. The results are summarized in table A.2. Pooling data between different forest sites in the translog frontier model was rejected except for the forest reserves of Kithulanahela vs Galagodabedda and Kithulanahela vs Bibilehela–Welanvita. Also the hypothesis of pooling data in forest dependency model was rejected except for the forest reserves of Galagodabedda vs Bibilehela–Welanvita. As the forest dependency model depends on the translog frontier model, pooling data was not possible in the analysis. Each forest and its peripheral villages has its own natural and socio-economics environment. This may explain the results differing by location. Hence, separate analysis was followed for each forest site.
4.1 Translog Frontier Model Estimation of the translog production function was performed using Frontier version 4.1 (Coelli, 1996). The single step procedure was performed where factors believed to have an effect on technical inefficiency were simultaneously regressed with factors included in frontier model. The analytical results of the maximum likelihood (ML) estimates of the translog production frontier are shown in tables A.5–A.6. The ML estimate of the variance parameter,γ , is close to 1 for all sites and significantly different from zero, hence assuring the stochastic nature of the production function. These results indicate that the vast majority of residual variation is due to the inefficiency effect, ui, while the random error vi, is approximately zero. There were no reported evidences of unusual events (droughts, insect/disease epidemics etc.) and the agricultural policies remained the same during the period of study. It is observed that the one-sided generalized likelihood ratio test of γ = 0 for Dunhinda, Kithulanahela, Galagodabedda and Bibilehela–Welanvita forest reserves were 104.09, 78.82, 6.12, and 39.65 respectively, which exceeds the 5% critical value. Therefore, the traditional average response function is not an adequate representation of the data, which further assures its stochastic nature. For the ML estimation analysis of the Dunhinda forest reserve, factors such as the extent of farming, Flabor, Hlabor and Ifer exhibited positive and statistically significant relationships with farm income. However, application of organic fertilizer and pesticides did not have a significant effect on farm income in this analysis. Generally, frequency and extent of use of organic fertilizers and pesticides in farming for the Dunhinda area are low. For the Kithulanahela forest reserve, factors such as the extent of farming, Flabor, Ofer, and Pest exhibited positive and statistically significant relationships with farm income. However, Hlabor exhibited unexpected negative and significant effect. One possible reason may be
17

that a few tobacco farmers with high returns while employing less hired labor overshadowed the hired labor in the rest of the sample. Perhaps this result for labor use could also be attributed to data measurement problems encountered from the survey. Normally in rural areas in Sri Lanka, farming is done by communal labor groups, where farmers help each other especially during field preparation, planting and harvesting. Therefore, the reported data may not capture the actual labor hours used for farming. Application of inorganic fertilizers showed an unexpected negative sign, however, it did not have a significant effect on farm income in this analysis. For the Galagodabedda forest reserve, all factors had positive signs, however only extent, Flabor and Ofer showed significant effects. For the Bibilehela–Welanvita forest reserve, factors excluding Flabor and Hlabor had the expected positive sign, but only Extent and Ifer showed statistical significance. Although factors such as Flabor and Hlabor showed negative effects, these were not significant. The overall mean technical efficiency for farming in the Dunhinda, Kithulanahela, Galagodabedda and Bibilehela–Welanvita forest reserves are 0.67, 0.71. 0.73 and 0.69 respectively. Table 4.1 shows that farms were distributed throughout the technical efficiency range.
Table 4.1. Technical Efficiency Ranges in Agricultural Farms in Forest Peripheries Dunhinda Kithulanahela Galagodabedda Bibilehela-
Welanvita Technical Efficiency range Number
of farms % of farms
Number of farms
% of farms
Number of farms
% of farms
Number of farms
% of farms
0.1-0.19 06 3.68 04 4.21 01 1.09 0 0 0.2-0.29 10 6.13 02 2.10 03 3.26 05 5.43 0.3-0.39 06 3.68 06 6.32 04 4.35 08 8.69 0.4-0.49 14 8.59 09 9.47 06 6.52 04 4.35 0.5-0.59 18 11.04 07 7.37 06 6.52 19 20.65 0.6-0.69 33 20.25 08 8.42 11 11.96 09 9.78 0.7-0.79 21 12.88 16 16.84 20 21.74 11 11.96 0.8-0.89 14 8.59 18 18.95 16 17.39 14 15.22 >0.9 41 25.15 25 26.31 25 27.17 22 23.91 In the inefficiency model, farmer’s age had the expected positive sign except for the Bibilehela–Welanvita forest reserve. However, it was significant only for the Kithulanahela and Galagodabedda forest reserves. Results indicate that personal characteristics such as Edu and Exp in farming had negative signs in all forest reserves. Edu is significant in all cases however Exp is significant only for the Dunhinda and Kithulanahela forest reserves. Education enables household heads to access and utilize information on crop production and management. Utilizing this information in production decreases technical inefficiency. Farmers with more experience are generally technically less inefficient users of resources. The coefficient for extension contacts was negative and significant except for Galagodabedda forest reserve supporting the hypothesis that farmers who receive extension assistance tend to be less inefficient. Nutritional status of the household head was negative
18
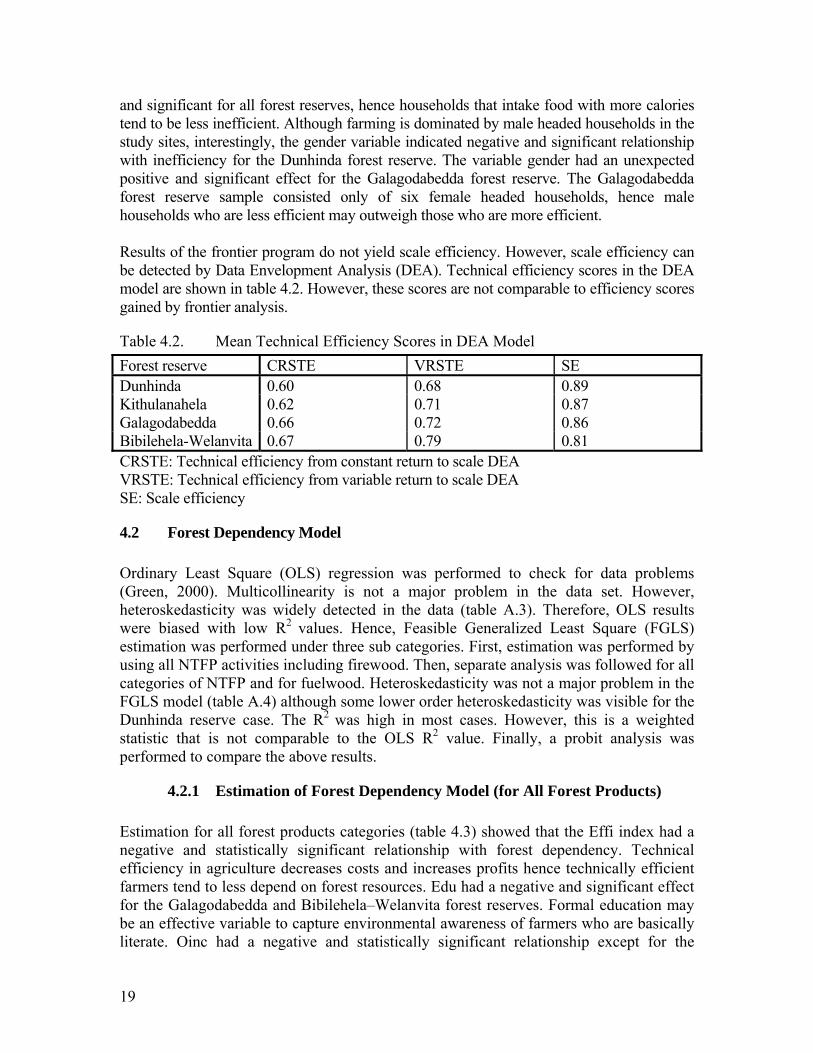
and significant for all forest reserves, hence households that intake food with more calories tend to be less inefficient. Although farming is dominated by male headed households in the study sites, interestingly, the gender variable indicated negative and significant relationship with inefficiency for the Dunhinda forest reserve. The variable gender had an unexpected positive and significant effect for the Galagodabedda forest reserve. The Galagodabedda forest reserve sample consisted only of six female headed households, hence male households who are less efficient may outweigh those who are more efficient. Results of the frontier program do not yield scale efficiency. However, scale efficiency can be detected by Data Envelopment Analysis (DEA). Technical efficiency scores in the DEA model are shown in table 4.2. However, these scores are not comparable to efficiency scores gained by frontier analysis.
Table 4.2. Mean Technical Efficiency Scores in DEA Model Forest reserve CRSTE VRSTE SE Dunhinda 0.60 0.68 0.89 Kithulanahela 0.62 0.71 0.87 Galagodabedda 0.66 0.72 0.86 Bibilehela-Welanvita 0.67 0.79 0.81 CRSTE: Technical efficiency from constant return to scale DEA VRSTE: Technical efficiency from variable return to scale DEA SE: Scale efficiency
4.2 Forest Dependency Model Ordinary Least Square (OLS) regression was performed to check for data problems (Green, 2000). Multicollinearity is not a major problem in the data set. However, heteroskedasticity was widely detected in the data (table A.3). Therefore, OLS results were biased with low R2 values. Hence, Feasible Generalized Least Square (FGLS) estimation was performed under three sub categories. First, estimation was performed by using all NTFP activities including firewood. Then, separate analysis was followed for all categories of NTFP and for fuelwood. Heteroskedasticity was not a major problem in the FGLS model (table A.4) although some lower order heteroskedasticity was visible for the Dunhinda reserve case. The R2 was high in most cases. However, this is a weighted statistic that is not comparable to the OLS R2 value. Finally, a probit analysis was performed to compare the above results.
4.2.1 Estimation of Forest Dependency Model (for All Forest Products) Estimation for all forest products categories (table 4.3) showed that the Effi index had a negative and statistically significant relationship with forest dependency. Technical efficiency in agriculture decreases costs and increases profits hence technically efficient farmers tend to less depend on forest resources. Edu had a negative and significant effect for the Galagodabedda and Bibilehela–Welanvita forest reserves. Formal education may be an effective variable to capture environmental awareness of farmers who are basically literate. Oinc had a negative and statistically significant relationship except for the
19

Galagodabedda forest reserve. The availability of off-farm income sources increases the opportunity cost for allocating labor to forest extraction. Flabor and Expe were not statistically significant in all four cases. The MF ratio was positive in all sites however significant only for the Kithulanahela and Galagodabedda reserves. Household wealth had a negative and significant relationship with forest dependency except for the Bibilehela–Welanvita reserve. The variable Dis was negative and insignificant in all sites. The index Diver had a negative and significant effect on forest dependency except for the Galagodabedda site. This indicates that households with more diverse income sources are less dependent on forest resource extraction.
20

Table 4.3. Estimation on Forest Dependency for All Forest Product Category
Dunhinda (n=118) Kithulanahela (n=76) Galagodabedda (n=69) Bibilehela-Welanvita (n=64) Variable Estimated coefficient
Std. error
t-ratio Estimated coefficient
Std. error
t-ratio Estimated coefficient
Std. error
t-ratio Estimated coefficient
Std. error
t-ratio
Effi -3954.6 1920 -2.06* -8473 1211 -6.99* -8107.4 3385 -2.39* -5932.5 2321 -2.56* Edu 261.81 388.8 0.67 251.36 174.9 1.44 -1203.2 437.7 -2.75* -916.31 375.6 -2.44* Oinc -0.15 0.02 -7.65* -0.06 0.01 -4.76* -0.55(-02) 0.03 -0.17 -0.10 -0.02 -4.32* Flabor -126.23 113.5 -1.11 87.24 178.7 0.49 115.85 412.5 0.28 -451.74 373.8 -1.21 Exp -30.97 22.32 -1.39 22.88 11.77 1.94 3.85 27.98 0.14 -49.83 28.15 -1.77 MF ratio 14.51 261.9 0.06 297.74 126.6 2.35* 1770.8 720.2 2.46* 557.11 458.4 1.22 Wealth -0.07 0.03 -2.39* -0.05 0.02 -3.04* -0.08 0.04 -2.10* 0.27(-02) 0.05 0.06 Dis -920.61 744.0 -1.24 -1462 1137 -1.29 -188.54 1588 -0.12 -180.38 253.7 -0.71 Diver -1677.0 594.5 -2.82* -1082.5 273.6 -3.96* 1228.8 890 1.38 -857.49 427.4 -2.01* Wt 20493 1771 11.57 14436 1888 7.65 9758.7 5159 1.89 16028 3391 4.73* R2 Adjusted
0.92 (0.64)
0.93 (0.66)
0.83 (0.24)
0.99 (0.33)
n = sample size * significant at 0.05 level OLS R2 adjusted values are in parentheses

4.2.2 Estimation of Forest Dependency Model (NTFP) Estimation results of NTFP category showed (table 4.4) that Effi had a negative and significant effect on dependency for NTFP except for the Bibilehela–Welanvita forest reserve. Education was significant only for the Galagodabedda forest reserve. For Oinc, the results were negative and significant for the Dunhinda and Kithulanahela reserves. The variable Flabor had a positive and significant effect on NTFP dependency only for the Kithulanahela forest reserve. The MF ratio was positive and significant for the Dunhinda and Galagodabedda forest reserves while it was insignificant in other reserves. A positive and significant MF ratio indicates that extraction is male dominant activity. This is due to the inherent skill men possess in collecting NTFPs. Wealth had a negative and significant effect on NTFP dependency for all forest reserves except for the Bibilehela–Welanvita. Variables Dis and index Diver were not significant in any of the reserves.
4.2.3 Estimation of Forest Dependency Model (Fuelwood) In the fuelwood dependency model (table 4.5), efficiency had a negative and significant effect only for the Dunhinda and Kithulanahela reserves. The variable Edu had an unexpected positive and significant result for the Dunhinda reserve however it was not significant effect on fuelwood dependency for the other forest reserves. High levels of unemployment among rural households may have yielded the unexpected results in variable related to Edu. The variable Oinc had a negative and significant result for the Dunhinda and Kithulanahela reserves which indicate that households receive income through off-farm employment sources extract less fuelwood. Flabor was insignificant in all forest reserves. Variable Exp showed an unexpected negative and significant effect on fuelwood dependency for the Bibilehela–Welanvita reserve. A possible reason for this result may be due to the correlation between variable Exp and Age. More experiences households tend to be the older households and these households may collect less fuelwood due to old age. The MF ratio had a negative and significant effect for the Kithulanahela forest while it had positive and significant effect for the Bibilehela–Welanvita reserve. For the Kithulanahela reserve, fuelwood extraction is a female dominant activity while for the Bibilehela-Welanvita, it is a male dominant activity. Wealth had a negative and significant effect on fuelwood dependency except for the Galagodabedda forest reserve. The variable distance exhibited an unexpected positive and significant effect on fuelwood dependency for the Galagodabedda reserve. One possible explanation may be that for greater distances, households collect more fuelwood on order to minimize the number of trips for collection hence, perhaps households over estimate fuelwood collection. Also, the distance is not easy to measure hence its accuracy may be questionable in a field survey. The variable Diver was negative and significant except for the Galagodabedda reserve. Households with more diversified income sources tend to depend less on fuelwood collection.

Table 4.4. Estimation on Forest Dependency for the NTFP
Dunhinda (n=117) Kithulanahela (n=87) Galagodabedda (n=68) Bibilehela-Welanvita (n=33) Variable Estimated coefficient
Std. error
t-ratio Estimated coefficient
Std. error
t-ratio Estimated coefficient
Std. error t-ratio Estimated coefficient
Std. error
t-ratio
Effi -4488.7 10321 -4.35* -20665 2929 -7.05* -16819 6899 -2.44* 1133.8 1300 -0.87 Edu -136.5 209.7 -0.65 -56.53 287.9 -0.19 -2002.9 967.7 -2.07* 179.25 431.6 0.42 Oinc -0.27 0.01 -2.67* -0.07 0.03 -2.76* -0.31(-02) 0.06 -0.05 -0.05 0.03 -1.89 Flabor 180.28 92.63 1.95 1240.8 233.1 5.32* 527.04 866.7 0.61 193.23 213.5 0.91 Exp 35.13 10.29 3.42* 21.16 20.34 1.04 35.69 59.48 0.60 28.81 29.09 0.99 MF ratio 376.77 174.3 2.16* 26.11 216.8 0.12 3503.9 1470 2.38* -95.47 357 0.27 Wealth 0.2(-02) 0.02 0.12* -0.18 0.03 -7.09* -0.17 0.08 -2.17* 0.06 0.04 1.42 Dis -261.91 389.3 -0.67 813.5 1783 0.46 -1461.1 3375 -0.43 -349.26 1067 -0.33 Diver -446.12 240.8 1.85 -194.46 534.9 -0.36 2227.9 1797 1.24 902.07 680.5 1.33 Wt 2610.3 912.1 2.86* 21892 3884 5.64* 19000 0.10(+05) 1.83 -1354.2 3219 -0.42 R2 Adjusted
0.68 (0.34)
0.69 (0.67)
0.95 (0.23)
0.98 (0.37)
n = sample size * significant at 0.05 level OLS R2 adjusted values are in parentheses
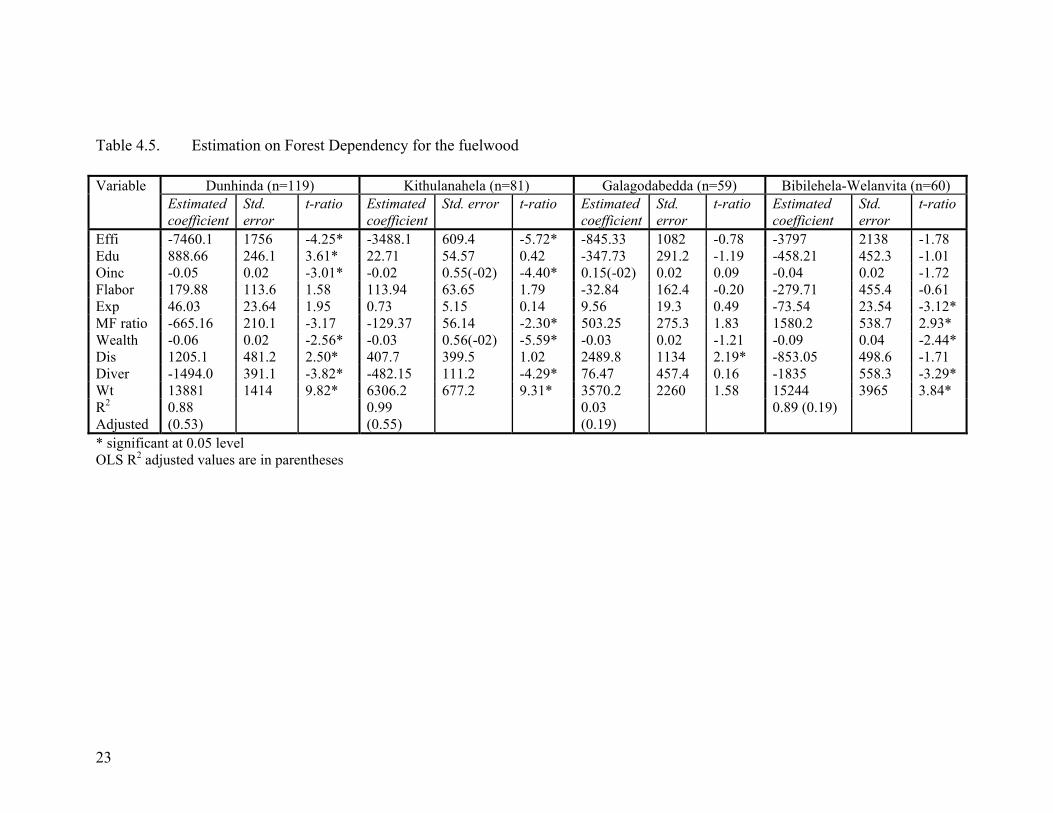
Table 4.5. Estimation on Forest Dependency for the fuelwood
Dunhinda (n=119) Kithulanahela (n=81) Galagodabedda (n=59) Bibilehela-Welanvita (n=60) Variable Estimated coefficient
Std. error
t-ratio Estimated coefficient
Std. error t-ratio Estimated coefficient
Std. error
t-ratio Estimated coefficient
Std. error
t-ratio
Effi -7460.1 1756 -4.25* -3488.1 609.4 -5.72* -845.33 1082 -0.78 -3797 2138 -1.78 Edu 888.66 246.1 3.61* 22.71 54.57 0.42 -347.73 291.2 -1.19 -458.21 452.3 -1.01 Oinc -0.05 0.02 -3.01* -0.02 0.55(-02) -4.40* 0.15(-02) 0.02 0.09 -0.04 0.02 -1.72 Flabor 179.88 113.6 1.58 113.94 63.65 1.79 -32.84 162.4 -0.20 -279.71 455.4 -0.61 Exp 46.03 23.64 1.95 0.73 5.15 0.14 9.56 19.3 0.49 -73.54 23.54 -3.12* MF ratio -665.16 210.1 -3.17 -129.37 56.14 -2.30* 503.25 275.3 1.83 1580.2 538.7 2.93* Wealth -0.06 0.02 -2.56* -0.03 0.56(-02) -5.59* -0.03 0.02 -1.21 -0.09 0.04 -2.44* Dis 1205.1 481.2 2.50* 407.7 399.5 1.02 2489.8 1134 2.19* -853.05 498.6 -1.71 Diver -1494.0 391.1 -3.82* -482.15 111.2 -4.29* 76.47 457.4 0.16 -1835 558.3 -3.29* Wt 13881 1414 9.82* 6306.2 677.2 9.31* 3570.2 2260 1.58 15244 3965 3.84* R2 Adjusted
0.88 (0.53)
0.99 (0.55)
0.03 (0.19)
0.89 (0.19)
* significant at 0.05 level OLS R2 adjusted values are in parentheses
23

4.2.4 Estimation of Forest Dependency Model (Probit Analysis) The estimated Probit model produced mixed results. The coefficients indicate the effect of change in the dependent variable on the utility index (table 4.6). Variable Effi had a negative and significant effect for all forest reserves. Edu, was negative and insignificant for all reserves. Family labor had a positive and significant effect only for the Kithulanahela reserve while it showed unexpected negative and significant effect for the Dunhinda. As shown in summary statistics, allocation of family labor for farming is higher in Dunhinda. The unexpected negative sign may be due to the diversion of family labor for farming in larger families. Exp had a positive and significant effect for all reserves except for the Dunhinda. The MF ratio was insignificant in all forest reserves except for the Galagodabedda. Wealth showed an insignificant effect for all reserves. Distance was negative and significant for the Dunhinda while it showed an unexpected positive and significant effect for the Bibilehela-Welanvita reserve. The unexpected positive sign may be due to measurement error of the distance between home to the forest. Index Diver indicated a negative and significant effect in all reserves except Galagodabedda. The impact of a unit increase in an explanatory variable on the choice probability was obtained by estimating the marginal effects. Results are shown in table A.7.
4.3 Economic Value of NTFP and Fuelwood to Rural Communities Table 4.7 shows the economic value of NTFPs and fuelwood to rural households in the study sites. Due to the complexity in getting information related to labor allocation for processing etc., calculation of net economic value was not done. Hence the values describe in the proceeding reflect the gross economic value of forest products. Average economic values of NTFPs for Dunhinda, Kithulanahela, Galagodabedda and Bibilehela–Welanvita reserves were 2,324, 3,292, 3,074 and 764 rupees/year respectively. Average economic values of fuelwood for the above forest reserves were 5,631, 2,528, 3,258 and 4,528 rupees/year respectively. For the Dunhinda and Bibilehela–Welanvita reserves, NTFPs account for 29% and 14% of total forest products respectively. NTFPs values for Kithulanahela and Galagodabedda account for approximately 50% from total forest products. Wild meat, poles and kithul products make significant contribution in the non fuelwood category. The estimated total economic value of NTFPs for Dunhinda, Kithulanahela, Galagodabedda and Bibilehela–Welanvita reserves were 378,811, 312,681, 292,012, and 70,330 rupees/year respectively. Estimated total economic value of fuelwood to the households for these reserves were 917,900, 240,160, 292,817, and 416,585 rupees/year respectively. Accordingly, the total economic values of all products in the above sites were 1,294,711; 528,644; 596,655; and 486,915 rupees/year respectively. The extent and pattern of dependency on the forest varies by community, depending on the nature, magnitude, and accessibility of forest resources (ADB, 2000).

Table 4.6. Probit Estimation on Determinants of Forest Dependency
Dunhinda (n=163) Kithulanahela (n=95) Galagodabedda (n=92) Bibilehela-Welanvita (n=92) Variable
coefficient Std. error
t-ratio coefficient Std. error
t-ratio coefficient Std. error
t-ratio coefficient Std. error
t-ratio
Effi -3.64 1.11 -3.28* -3.81 1.52 -2.51* -3.44 1.28 -2.69* -5.35 1.66 -3.23* Edu -0.22 0.17 -1.29 -0.13 0.28 -0.47 -0.34 0.24 -1.43 -0.34 0.38 -0.90 Oinc 0.19(-04) 0.14(-04) 1.47 0.14(-04) 0.15(-04) 0.89 0.34(-06) 0.11(-04) 0.03 -0.24(-04) 0.13 -1.79 Flabor -0.24 0.98(-01) -2.43* 0.38 0.15 2.45* 0.27 0.16 1.67 0.18 0.15 1.17 Exp -0.24(-01) 0.14(-01) -1.69 0.45(-01) 0.13(-01) 3.46* 0.32(-01) 0.14(-01) 2.39* 0.89(-01) 0.33(-01) 2.68* MF ratio -0.24 0.15 -1.55 -0.93(-01) 0.16 -0.58 -0.38 0.17 -2.18* -0.18 0.24 -0.76 Wealth 0.13(-04) 0.13(-04) 1.05 -0.34(-04) 0.29(-04) -1.15 -0.24(-04) 0.15(-04) -1.57 0.36(-04) 0.22(-04) 1.68 Dis -0.97 0.38 -2.54* -1.99 1.23 -1.62 0.74(-01) 0.81 0.09 5.74 1.82 3.15* Diver -0.75 0.24 -3.15* -0.86 0.33 -2.64* 0.34 0.35 0.98 -1.47 0.41 -3.55* Constant 8.09 1.20 6.74* 4.93 1.50 3.28* 2.15 1.11 1.94 5.34 1.47 3.63* n = sample size * significant at 0.05 level

These estimated values were higher than those of the case studies done in wet zone forests (see Bogahawatta, 1998) and lower than the economic values of NTFPs extracted in several high productive forest reserves in Sri Lanka (see Gunatilake et al., 1993, Abeygunawardena, 1993, Abeygunawardena and Wickramasinghe, 1991 and Bandaratilake, 1998).
Table 4.7. Annual Economic Value of NTFPs and Fuelwood to Rural Communities in Forest Peripheries
Annual economic value of various forest products (rupees) Forest Products
Dunhinda Kithulanahela Galagodabedda Bibilehela–Welanvita
Fruits 47.9 105.2 162.1 71.1 Vegetables 86.4 124.4 130.9 - Yam 461.2 138.7 1.7 - Mushroom 50.5 338.5 13.0 19 Spices - - 302.3 96.6 Meat 778.8 994.7 934.8 369.6 Bee honey - 65.8 3.3 99.55 Rattan - 292.9 65.2 - Medicine 101.5 14.7 113.9 16.9 Grass - 268.1 - - Thatching materials
- 19.7 102.4 14.9
Poles 557.2 106.3 67.4 76.8 Other products 240.8 822.4 1,177.2 - Sub total 2,323.9 3291.4 3,074.2 764.6 Firewood 5,631.3 2,53 3,257.6 4,528.1 Total average 7,955.3 5,819.4 6,331.9 5,292.5
4.4 Potential Benefits from Increasing Technical Efficiency in Agriculture to Rural Households Table 4.8 shows additional income generated from increasing mean technical efficiency levels and the threshold efficiency levels needed to lessen forest dependency in different product categories. It is estimated that on average, a 10% increase in technical efficiency in agriculture would increase agricultural income by 2,142–3,987 rupees/farm. Additionally, mean agricultural income would increase by 7,069–12,359 rupees/farm if farms were fully technically efficient. However, for the Dunhinda and Galagodabedda reserves, total forest income cannot be fully compensated even by achieving full efficiency. According to the analysis, mean threshold efficiency levels needed to reduce forest dependency for the Kithulanahela, and Bibilehela–Welanvita reserves were 0.93 and 0.82. In technical terms, the mean threshold technical efficiency level in agriculture needed to lessen NTFP dependency in Dunhinda, Kithulanahela, Galagodbedda and Bibilehela-Welanvita forest reserves were 0.78, 0.83, 0.87 and 0.71 respectively. In the case of

fuelwood, income is fully compensated by achieving threshold technical efficiency levels of 0.93, 0.81, 0.88 and 0.80 respectively in these forest reserves. Compared to the measured technical efficiency levels (0.67, 0.71, 0.73 and 0.69 respectively), the efficiency gap needs to be addressed by policy measures range from 2-14% for NTFP categories and 10-26% for the fuelwood category.
Table 4.8. Projected Benefit of Increasing Technical Efficiency and the Threshold Technical Efficiency Levels Needed to Arrest Forest Dependency
Benefit of increasing Technical efficiency (rupees/farm/year)
Threshold Technical efficiency level needed to arrest forest dependency
Forest reserve Mean annual farm income (rupees)
Mean technical efficiency 10%
increase in efficiency
Full efficiency level
Total forest dependency
NTFP dependency
Fuelwood dependency
Dunhinda 14,352 0.67 2142 7,069 - 0.78 0.93 Kithulanahela 18,262 0.71 2572 7,459 0.93 0.83 0.81 Galagodabedda 15,949 0.73 2184 5,899 - 0.87 0.88 Bibilehela-Welanvita
27,509 0.69 3987 12,359 0.82 0.71 0.80
Based on the economic value of forest products extracted from each forest reserve, it is estimated that increasing technical efficiency in agriculture by 10 percent (from current mean technical efficiency level) would reduce the opportunity cost of biodiversity conservation by 27, 46, 34 and 75 percents respectively in the forest under investigation (table 4.9). Households living in periphery of Bibilehela-Welanvita reserve earn much higher income compared to other forest reserves. Farmers in this region cultivate high value field crops. They also have comparative advantage in marketing of agricultural products than other regions due to the close proximity to major market place. Due to higher farming income, even a slight decrease in technical inefficiency would leads larger income effect that would lower the opportunity cost of biodiversity conservation in a grater degree.
Table 4.9. Annual Reduction of Opportunity Cost of Biodiversity Conservation due to Increasing Technical Efficiency in Farming Forest reserve Total annual benefit of
increasing efficiency by 10% (rupees)
Opportunity cost of conservation of forest (rupees)
% reduction of opportunity cost of biodiversity conservation
Dunhinda 349,146 1,294,711 26.9 Kithulanahela 244,340 528,644 46.2 Galagodabedda 200,928 596,655 33.7 Bibilehela-Welanvita
366,804 486,915 75.3
27

4.5 Conclusion The study’s major objective was an in-depth investigation of technical efficiency in agricultural farming in forest peripheries and its effect on rural household dependency on forest resource extraction. Five natural forest reserves were included in the study. The statistical analysis confirmed the impossibility of pooling data due to site differences. The study was done in two stages. First, efficiency analysis was performed and provided an in-depth understanding of technical efficiency in farming in forest peripheries. In the next step, forest dependency was assessed. This study’s findings showed that the mean technical efficiency in agricultural farming for selected forest peripheries range between 0.67–0.73. The technical efficiency of individual farms lie between the efficiency range of 0.1–0.99. The results imply that there is potential for improving the technical efficiency of agricultural farming and thereby increasing farm revenues. Factors such as education, experience, extension, and the nutritional status of the household head are the primary determinants of inefficiency. Factors affecting forest dependency was assessed under three categories. First, total economic value of NTFPs including fuelwood was considered. This analysis was done for two subgroups of forest products namely, NTFPs and fuelwood. Further analysis included the Tobit estimation for forest dependency. Mixed results were obtained for the empirical estimation. Overall, agricultural efficiency, off farm income, wealth and the diversification index showed negative effects on dependency of forest resources. Results indicated the potential to improve technical efficiency in agriculture in forest margins. Increasing technical efficiency in agriculture may lessen forest dependency to a certain degree. However, assumptions underlying household behavior must be considered before drawing conclusions. Most forest products are considered to be inferior goods in most economies. However, the exception is fuelwood which is often an essential good to rural developing economies. Consequently, an improvement in rural income may not reduce the dependency on fuelwood at least in the short run, unless alternative energy sources are available at affordable prices. However, income diversification proved to be more effective in reducing fuelwood dependency. Improved substitutability has occurred between fuelwood collection from natural forests and from well-developed home gardens. Therefore, strategies to improve technical efficiency in agriculture and income diversification should be considered to minimize dependency of forest resources by rural households.
5.0 POLICY IMPLICATIONS
Before drawing inferences to forest protection policy, it may be useful to summarize the study’s accomplishments and limitations. The statistically significant variables in the estimation process support the decision process postulated in the theory and empirical model.
28

Adequate specification and measurement of independent variables is critical to the robustness of estimation results. For the variables included in this study, several could have been improved in terms of better measurement, e.g., family labor and hired labor in the ML estimation and off-farm income, distance to forest, and wealth in the forest dependency model. Most of the survey information was gathered from interviewee’s recall; hence the possibility of making errors is warranted especially for NTFPs and fuelwood data. Valuation of NTFPs and fuelwood was done using different valuation techniques. Not valuing all the components of value may lead to errors in quantities, different implicit willingness to pay (WTP) for NTFPs, different rents accruing to the households etc. This is an area where much time could be spent on valuation in future research. Although maximum effort was taken to minimize errors, possibility of making under or over valuation can occur. Simultaneous equation estimation, although theoretically desirable, is not practical for this study because of many specification issues involving the measurement of endogenous and exogenous variables, and identification of equation system. However, the issue of simultaneity should be addressed in future studies by endogenizing technical efficiency in agriculture.
5.1 Recent Trends in Forest Policies in Sri Lanka Sri Lanka’s forest policies have changed in order to reflect a new era after the 1980’s. Due to rapid deforestation and forest degradation, a need for a comprehensive forest development plan arose. This led to the development of the Forestry Master Plan (FMP) during the 1983-1986 period. Major deficiencies of the FMP were the failure to address environmental aspects of forestry and failing to involve key players in the planning process (UNDP, 2004). Taking into account the new challenges of the Sri Lanka forest sector, the National Forest Policy (NFP) was formulated in 1995. Major objectives of the NFP were:
1. to conserve forests for posterity with particular regard to biodiversity, soils, water and historical, religious and aesthetic values
2. to increase tree cover and productivity of the forests to meet the needs of present and future generations in terms of available forest products and services
3. to enhance the contribution of forestry to the welfare of the rural population and strengthen the national economy with special attention paid to equity in economic development.
The NFP acknowledges concerns for safeguarding the remaining natural forests for posterity so as to conserve biodiversity, soil and water resources (sections 1.1, 2.1, 2.3, and 6.5). It emphasizes the importance of retaining the present natural forest cover, and increasing the overall tree cover (sections 1.2, 2.1, 2.6, and 2.7). A major part of the forests are to be protected completely for the conservation of biodiversity, soil and water resources. Multiple use forestry is also to be promoted. The remaining natural forests outside the protected area system are to be used sustainably to provide for the growing demand for bio-energy, wood and non-wood forest products, and various services,
29

especially for the benefit of the rural population, without ignoring environmental objectives (section 2.1, 2.3, and 2.6). The NFP recognizes that the state alone cannot protect and manage the forests effectively. It emphasizes the need to develop partnerships with local people, communities etc. (sections 2.4, 3.1, 3.2, 3.3, 4.1, 5.6). It further highlights the need for an institutional framework for forest resource management (section 2.4, 4.1, 5.3, and 5.6). The Forestry Sector Master Plan (FSMP) was prepared based on the new concepts of conservation, community participation and the new economic policies of the government (FPU, 1995). The FSMP upholds the spirit of the NFP by providing a sector development framework for 1995-2020. The reorientation accomplished through the NFP led forest department to develop the 1997 Five Year Implementation Program (FYIP). The FYIP prescribes a balance between conservation and sustainable forest management supported by public and private sector smallholder participation in commercial forestry, and provided a sectoral implementation framework of the FSMP. According to the FSMP, existing forests were categorized into five classes for management. Class 1: for strict conservation of biodiversity, soils and water. Only research activities would be permitted in these forests. Class 11: Also for conservation but non-extractive uses would be permitted, i.e., nature based tourism as well as research. Class 111: Multiple use forests to be managed primarily for sustainable production of wood by the state and for non-wood products for communities. This would also include buffer zones around the protected forests. Participatory management by communities and regional government and communities are envisaged as the smaller blocks. Class IV: These are forest plantations and agroforestry systems. Degraded state lands could be used for forest plantations or agro-forestry, by members of the community. State plantations presumably, and hopefully, those that are not doing well could be released for commercial forestry. Class V: These are non-forests i.e., degraded state land which could be given for agro-forestry or even for housing plans and other public purposes. Drawn up plans for the FYIP included forest land allocation and macro level planning, multiple use management, commercial forest plantations, social forestry/agro-forestry development, wood based industry management and institutional strengthening. Mainly, due to a delay in implementation, FYIP was updated and renamed the Seven Year Implementation Plan (SYIP) in 2000 with assistance from the Asian Development Bank. The SYIP stresses the need to demarcate zone forestlands as a prerequisite to programs dealing with forest resources management, biodiversity conservation, conservation of soil and water resources, forest plantations, social and agroforestry
30

development, and wood based industries. According to ADB (2000), government and the ADB have agreed on the following actions to facilitate implementation of the NFP:
a. deregulation of permits for transport of timber grown by the private sector; b. private sector participation in harvesting, establishment, and management of state-
owned plantations; c. granting of 25 year leases or management rights to forestlands, with secure tenure
arrangements for participating stakeholders, and delegation of power to the conservator of forests to issue such leases
d. reorganization of the Department of Forest Conservation in Sri Lanka to establish and practice sustainable forest management; and
e. minimizing intersectoral incursions that undermine the long-term sustainability of national forests.
It is clear that Sri Lanka’s forest policies have considered the need for conservation of natural forests given that existing forests are already heavily depleted. There are criticisms that although Sri Lanka has a national forest policy and are implementing programs, there is a vast difference between what it has achieved and what it needed. Sri Lanka’s forest policies should address the needs of the dependent communities and their lifestyles. However, this has been overshadowed by politics, consultancies and dominating bureaucracy (Withanage, 1999). One of the major problems of management of natural forests is the lack of adequate scientific direction coupled with policy enforcement (UNDP, 2004). Forestry sector research in Sri Lanka is very limited. The forest department has a small research division which plays an insignificant role in development of the forestry sector. Also, forest extension programs are designed as individual projects funded by donor agencies, without national level strategic planning (De Zoyza, 2001). Policy enforcement could probably be improved with the involvement of rural people in forest conservation and the involvement of local communities in effective conservation of protected forests. Lack of scientific information in policy formulation process may undermine forest policies. An example is the forest policy related to the intersectoral activties on forest conservation. ADB (2000) identified promotion of small scale tea plantations causes increased pressure on national forests. It further recommends comprehensive land-use planning and inter sectoral policy coordination as a means to minimize the negative impacts of such externalities. However, empirical studies have shown (Gopalakrishnan et al., 2005) the existence of competitive labor allocation between tea plantations and forest extraction. Hence, promotion of agricultural activities such as tea plantations in forest peripheries may produce positive externality in conservation of natural forest. Sri Lanka’s forest policy does not address the ways to mitigate higher opportunity cost of conservation. As Pushparajah (1986) highlighted, the opportunity cost of conservation of 10,000 hectares of forests was around 45 million rupees/year. Finding alternative ways of meeting these higher opportunity costs of conservation is necessary for the successful implementation of forest conservation programs.
31

5.2 Policy Options The results generated from the analysis are useful in designing alternative policies on how intersectoral activities such as agriculture affect forest conservation in Sri Lanka. The empirical evidence also helps in finding ways to minimize higher opportunity costs of natural forest conservation. However, this requires careful interpretation of results especially since this study is confined to few forest reserves in Badulla district of Sri Lanka and forest reserves may have different socio-economic and natural environments. This study does show that under present efficiency levels, households will continue to extract forest resources. Empirical evidence supports the potential to improve income from agriculture through technical efficiency. Compared to the measured technical efficiency levels (67, 71, 73 and 69 percents respectively), the efficiency gap needs to be addressed by policy measures range from 2-14 percent for NTFPs categories and 10-26 percent for the fuelwood category. Increasing technical efficiency in agriculture facilitate farmers to operate closer to frontier output level without expanding the agricultural frontier in forest peripheries. Hence, understanding the causes underlying agricultural inefficiency among farmers and the appropriate measures to minimize inefficiency can lead to the formation of important policies designed to protect the natural forest (figure C.1). However, any agricultural policy must be accompanied by policies to ensure property rights of forests are intact and no encroachment of agriculture on forest land. Education is one of the keys to improving efficiency. Rural households should be made aware of the potential to improve profitability from using alternative input combinations. This will motivate farmers to achieving higher technical efficiency levels in farming activities. Agriculture extension can also play a major role in reducing technical inefficiency. However, agricultural extension is not available on a regular basis for farming communities in the study sites. Although agricultural extension has been decentralized, it has not been very successful in getting scientific information across to the farmers in the rural areas. Hence, a complete restructuring of agricultural extension is an urgent need for improving efficiency in farming. Outreach and extension efforts may need to be refocused to reach these rural farmers in order to improve their understanding of agricultural productivity and management of input use. The methods used by agricultural extension are outdated and require use of modern technology, information, and communication skills. Establishment of Cooperative Extension System with closer integration of extension services offered by different institutions will increase the availability of assistance to rural communities. As shown by the results, an increasing agricultural extension by 1hr would reduce technical inefficiency in agriculture by 46, 62, 8 and 27 percents for investigated forest margins respectively. Accordingly additional extension hours needed to be addressed by policy measures to increase technical
32

efficiency by 10 percent require 0.22, 0.16, 1.25 and 0.37 hours of extra extension assistance to each household head in the investigated forest peripheries respectively2. Technical inefficiency in agriculture was shown to be a decreasing function of the nutritional status of the household. Study finding also indicated that average calorie intake of rural households is considerably low. The recommended minimum average calories per day is 2,100, however estimated average daily energy intake in study sites is approximately 1633 k/calories3. Since farming in rural areas is labor intensive and the estimated production function results showed the significance of family labor in farm production, a balance diet is essential to maintain good health of the working force. The nutritional status of the households is important to increase labor productivity thereby increasing farm efficiency. Knowledge of the nutritional values of available foods and minimum daily requirements are important dietary information for households. According to the results, an increasing daily energy intake by 100 k/calories from current mean level would reduce technical inefficiency in agriculture by 17, 48, 21 and 19 percent for investigated forest margins respectively. Accordingly additional k/calories needed to be addressed by policy measures to increase technical efficiency by 10 percent require daily intake of 58.8, 20.8, 47.6 and 52.6 extra k/calories to each household head in the investigated forest peripheries respectively. Although rural households may be less willing to make dramatic changes to their current food consumption pattern, nonetheless, a well-balanced diet can lead to improvements in labor productivity without substantial increases in costs. Though improving agriculture efficiency diminishes forest dependency, with the current understanding of rural household behavior, setting a minimum income goal to halt forest extraction is somewhat arbitrary at best. Therefore, along with policies for improving technical efficiency in agriculture, other options have to be explored. Results showed that off-farm income has a negative impact on dependency on forest resources. Creating employment opportunities for rural labor has two effects on decreasing forest dependency. Lucrative income sources make higher opportunity costs for forest resource extraction, hence reduce labor from extraction activities. Off-farm employment will also have a negative impact on forest dependency through the wealth effect. Forest dependency among households with more diversified income sources proved to be less than for households with few diversified income sources. Introduction of diversified income sources is a vital and sustainable strategy to reduce forest dependency. The study findings indicate that those who have diversified income sources had a negative effect on fuelwood dependency from natural forests. Possible diversified income sources include agriculture, off-farm employment, home gardening and livestock production. An allocation of time toward more productive activities translates into increased household income thereby lessening forest dependency. An increasing diversified income sources may run a risk of further depleting forest resources through overgrazing due to livestock
2 This sort of policy change requires and extra investment to strengthen agricultural extension, however estimation of actual cost to implement such a program is beyond the scope of this study. 3 According to household income and expenditure survey in 2002 done by the Department of Census and Statistics in Sri Lanka, per capita energy intake by rural poor households was 1768 kilo calorie.
33

production. Therefore, there has to be sustained monitoring and enforcement of forest boundaries to prevent such actions. This will cause to an added cost of managing conservation programs. However, given the complex nature of protecting natural forests, other issues such as land rights, agricultural technology, crop varieties, capacity and effectiveness of institutions (for rural credit, subsidies, marketing etc.), development of rural infrastructure, may influence rural household capacity to achieve a higher standard of life thereby helping to minimize negative impacts on forest resources. In order to implement these policies, various institutions dealing with agriculture, forestry, wildlife and rural development have to be organized under one umbrella. Efficient coordination between these institutions is critical to achieve the objectives of protecting natural forests through the well being of surrounding communities. There is an urgent need for strong public and private partnership to protect natural forests in Sri Lanka. Hence these results should be carefully considered when designing and implementing future forest conservation policies and programs.
REFERENCES Abeygunawardena, P. 1993. Total economic value of forests: The case of Sinharaja reserve
in Sri Lanka. Unpublished research report. Faculty of Agriculture, University of Peradeniya, Sri Lanka.
Abeygunawardena, P. and W.A.R. Wickramasinghe. 1991. An economic valuation of non-
timber products of Hantana forest. Multipurpose Tree Species in Sri Lanka: Research and Development, Gunasena, H. P. M. (ed). pp. 183-190.
ADB, 2000. Report and recommendation for the forest resources management sector
project. Asian Development Bank. Manila, Philippines. ________ 1997. Report and recommendation for upper watershed development project in
Sri Lanka. Asian Development Bank. Manila, Philippines. Aigner, D.; C.A.K. Lovell; and P. Schmidt. 1977. Formulation of stochastic frontier
production function models. Journal of Econometrics 6. pp. 21-37. Balèe, W. 1989. The culture of Amazonian forests. Advance Economic Botany 7. pp 1-
21. Bandaratillake, H.M. 1998. Opportunities for utilization and development of non wood
forest products in the priority protected areas. Unpublished report, Biodiversity conservation project, Sri Lanka.
34

Barbier, E. B. and J.C. Burgess. 1996. Economic analysis of deforestation in Mexico. Environment and Development Economics 1 (2). pp. 203-40.
Battese, G.E. and T.J. Coelli. 1995. A model for technical inefficiency effects in a
stochastic frontier production function for panel data. Empirical Economics 20. pp. 325-332.
Battese, G.E. 1992. Frontier production functions and technical efficiency. A survey of
empirical applications in agricultural economics. Agricultural Economics 7. pp. 185-208.
Battese, G.E. and T.J. Coelli. 1992. Frontier production functions, technical efficiency and
panel data: With applications to Paddy farmers in India. Journal of Productivity Analysis 3. pp. 153-169.
Battese, G.E. and G.S. Corra. 1977. Estimation of a production function model: with
application to the pastoral zone of eastern Australia. Australian Journal of Agricultural Economics 21. pp.169-179.
Bluffstone, R.; M. Boscolo; and R. Molina. 2001. How does community forestry affect
rural households? A labor allocation model of the Bolivian Andes. Working paper, University of Redlands, USA.
Bogahawatta, C. 1998. Non-timber forest products extraction in wet zone forests in Sri
Lanka. Technical report, Environmental Economics Program for South East Asia (EEPSEA), Singapore.
Bravo-Ureta, B. and A.E. Pinheiro. 1993. Efficiency analysis of developing country
agriculture. A review of the frontier function literature. Agricultural and Resource Economics Review 22. pp. 88-101.
Browder, J.O. 1992. The limits of extrctivism. Bioscience 42 (3). pp. 174-82. Burki, A.A. and D. Terrell. 1998. Measuring production efficiency of small farms in
Pakistan. World Development 26. pp. 155-169. Byron, N. and M. Arnold. 1999. What futures for the people in tropical forests? World
Development 27 (5). pp. 789-805. Carter, D.R. and F.W. Cubbage. 1995. Stochastic frontier estimation and sources of
technical efficiency in southern timber harvesting. Forest Science 41 (2). pp. 576-593.
Cavendish, W. 2000. Empirical regularities in the poverty environment relationship of
rural households: Evidence from Zimbabwe. World Development 28 (11): 1979-2003.
35

Coelli, T. 1995. Recent developments in frontier modeling and efficiency measurement. Australian Journal of Agricultural Economics 39. pp. 219-245.
Coelli, T. 1996. A guide to FRONTIER Version 4.1: A computer program for stochastic
frontier production and cost function estimation. CEPA working paper 96/07, University of New England, Armidale, NSW, 2351, Australia.
Cook, P.J. and Mizer, K.L. 1994. The revised ERS county typology. Rural Dev. Res.
Rep. 89. Washington, DC: U.S. Department of Agriculture, Economic Research Service.
Coomes, O.T. 1995. A century of rain forest use in western Amazonia. Lessens for
extraction based conservation of tropical forest resources. forest Conservation History 39 (3). pp 108-120
Coomes, O.T. 1996. Income formation among Amazonian peasant households in
northeastern Peru: empirical observations and implications for market oriented conservation. Yearbook, conference of Latin Americanist Geographers 22. pp. 51-64.
Coomes, O.T. and B.L. Barham. 1997. Rain forest extraction and conservation in
Amazonia. The Geographical Journal 163 (2). pp. 180-88. Deolalikar, A.B. 1988. Nutrition and labor productivity in agriculture. Estimates for rural
South India. Review of Economics and Statistics 70 (3). pp.406-413. DOCS (2002). Household income and expenditure survey. Department of Census and
Statistics, Colombo, Sri Lanka. De Zoysa, M. 2001. A review of forest policy trends in Sri Lanka. Policy trend report
2001, IGES forest conservation project, Japan, 57-68. Ekanayake, S.A.B. and S. K. Jayasuriya. 1987. Measurement of farm-specific technical
efficiency: a comparison of methods. Journal of Agricultural Economics 38. pp. 115-122.
Faris, R. 1999. Deforestation and land use on evolving frontier: An empirical assessment.
HIID development discussion paper No. 678. Cambridge: Harvard Institute for International Development.
FPU, 1995. Sri Lanka forestry sector master plan: National forest policy and executive
summary. Forestry planning unit, Ministry of Agriculture, Lands and Forestry, Sri Lanka.
Fowler, F.J. and T.W. Mangione. 1990. Standardized survey interviewing: Minimizing
interviewer related error, Sage publication, Newbury Park, California.
36

Gardner, B.C. 1969. Determinants of farm family income inequality. American Journal of Agricultural Economics 5. pp. 753-63.
Godoy, R., Wilkie, D., Overman, H., Cubas, A., Cubas, G., Demmer, J., McSweeny, K,
and Brokaw, N. 2000. Valuation of consumption and sale of forest goods from a Central American rain forest. Nature 406. pp 62-63.
Godoy, R.A.; R. Lubowski; and A. Markandya. 1993. A method for the economic
valuation of non-timber forest products. Economic Botany 47 (3). pp. 220-233. Godoy, R.A. and K.S. Bawa. 1993. The economic value of sustainable harvest of plants
and animals from the tropical forest: Assumptions, hypotheses and methods. Economic Botany 47 (3). pp. 215-219.
Gopalakrishnan, C.; W.A.R. Wickramasinghe; H.M. Gunatilake; and P. Illukpitiya 2005.
Estimation of demand for non-timber forest products among rural communities: A case study in Sinharaja rain forest region, Sri Lanka. Agroforestry Systems 65. pp 13-22.
Greene, W.H. 2000. Econometric analysis. 4th edition, New York, Macmillan Publishers,
1004 pp. Gunatilake, H.M. 1998. The role of rural development in protecting tropical rainforests:
evidence from Sri Lanka. Journal of Environmental Management 53. pp. 273-292. Gunatilake, H.M.; A.H. Senaratne; and P. Abeygunawardena. 1993. Role of non-timber
forest products in the economy of the peripheral communities of Knuckles national wilderness area of Sri Lanka: A farming systems approach. Economic Botany 47 (3). pp. 275-281.
Hamburg, M. 1987. Statistical analysis for decision-making. 4th edition, Florida,
Harcourt Brace Jovanovich, Inc, 701 pp. Hartwick, J.M. and N.D. Olewiler. 1988. The economics of natural resource use (2nd
edition). Addison Wesley. Hill, M. 1973. Diversity and evenness: A unifying notation and its consequences.
Ecology 54. pp. 427-432. Homma, A.K.O. 1992. The dynamics of extraction in Amazonia: a historical perspective.
Advances in Economic Botany 9: pp. 23-31. Huang, C.J. and J.T. Liu. 1994. Estimation of a non-neutral stochastic frontier production
function. Journal of Productivity Analysis 5. pp. 171-180.
37

Haggblade, S., Hazell, P., Brown, J. 1989. Farm-nonfarm linkages in rural sub-Saharan Africa. World Development 17(8). pp 1173-1201.
Hussain, R.Z. and R.A. Young. 1985. Estimates of the economic value productivity of
irrigation water in Pakistan from farm surveys. Water Resource Bulletin, 21. pp. 1021-1027.
Hyde, W. 1980. Timber supply, land allocation and economic efficiency. Baltimore: John
Hopkins University press for resource for the future. Kalirajan, K.P. and J.C. Flinn. 1983. The measurement of farm specific technical efficiency.
Pakistan Journal of Applied Economics 2. pp. 167-180. Kohlin G. 1998. The Value of Social Forestry in Orissa, India. Unpublished Ph. D
dissertation, Goteborg University, Sweden. Kumbhakar, S. C.; J. Ghosh; and J.T. McGuckin. 1991. A generalized frontier approach for
estimating determinants of inefficiency in U.S. dairy farms. Journal of Business and Economic Statistics 9. pp. 279-286.
Martin, P.S.1984. Prehistoric overkill: the global model. Pages 354-403 in P.S Martin and
R.G. Klein, eds., Quanternary extinctions. University of Arizona press, Tucson. Mattos, M. M. and C. Uhl. 1994. Economic and ecological perspectives on ranching in
the eastern Amazon. World Development 22 (2). pp. 145-58. McDermott, M.; C.V.S. Gunatilake; and I.A.U.N. Gunatilake. 1990. The Sinharaja rain
forest: Conserving both biological diversity and a way of life. The Sri Lanka Forester 19. pp. 3-22.
Meeusen, W. and J. Van den Broeck. 1977. Efficiency estimation from Cobb-Douglas
production function with composed error. International Economic Review 18. pp. 435-444.
Nickerson, D.J. 1999. Trade-offs of mangrove area development in the Philippines.
Ecological Economics 28 (2). pp. 279-98. Pattanayak, S.K, and E.O. Sills. 2001. Do tropical forests provide natural insurance? The
microeconomics of non-timber forest product collection in the Brazilian Amazon. Land Economics 77 (4). pp. 595-612.
Perera, W.D.A.; Jayasekara, P.M; and S. Thaha. 1979. Table of food consumption for use
in Sri Lanka. Colombo: World Health Foundation of Sri Lanka.
38

Pushparajah, M. 1986. Tropical humid forests as timber resources and its implications as conservation with particular reference to Sri Lanka. The Sri Lanka Forester XVII (3 & 4). Pp. 77-81
Reardan, T., Taylor, J.E., Stamoulis, K., Lanjouw, P., Balisacan, A. 2000. Effect of non-
farm employment on rural income equality in developing countries: an investment perspective. Journal of Agricultural Economics 51 (2). 266-288.
Repetto, R. and M. Gillis. 1998. Public policies and misuse of forest resources. New
York. Cambridge University Press. Richamad, J. 1974. Estimating the efficiency of production. International Economic
Review 15. pp. 515-521. Ross, P.J. and B.L. Green. 1985. Procedures for developing a policy-oriented
classification of non-metropolitan counties. Staff Rep. AGES850308. Washington, DC: U.S. Department of Agriculture, Economic Research Service.
Ruiz Pérez, M., Byron, N. 1999. A methodology to analyze divergent case studies of non-
timber forest products and theri development potential. Forest Science 45 (1). pp 1-14.
Sahota, G.S. 1968. Efficiency of resource allocation in Indian agriculture. American
Journal of Agricultural Economics 50. pp. 548-605. Shively, G.E. 2001. Agricultural change, rural labor markets and forest clearing: An
illustrative case from the Philippines. Land Economics 77 (2). pp. 268-284. Shyamsundar, P. and R.A. Kramer. 1996. Tropical forest protection: An empirical analysis
of the costs borne by local people. Journal of Environmental Economics and Management 31. pp. 129-144.
Strauss, J. 1996. Does better nutrition raise labor productivity? Journal of Political
Economy 94 (2). pp. 297-320. Tachibana, T.; T.M. Nguyen; and K. Otsuka. 2001. Agricultural intensification versus
extensification: A case study of deforestation in the northern hill region of Vietnam. Journal of Environmental Economics and Management 41. pp. 44-69.
Theil, R. and M. Wiebelt. 1994. Policies to reduce tropical deforestation and degradation.
A computable general equilibrium analysis for Cameroon. Quarterly Journal of International Agriculture 33. pp. 162-78.
UNDP, 2004. Small Grants Programme for Operations to Promote Tropical Forests (SGP
PTF). Country guideline paper for Sri Lanka (2004-2007), Colombo, Sri Lanka.
39

Valdivia, C.; E. Dunn; and C. Jette. 1996. Diversification as a risk management strategy in an Andean agro pastoral community. American Journal of Agricultural Economics 78. pp. 1329-34.
Vedeld, P., Angelsen, A., Sjaastad, E., and Berg, G.K. 2004. Counting on the
environment: Forest incomes and the rural poor. Paper # 98, Washington, DC, The World Bank Environment Department.
Wickramasinghe, A.; M.R. Perez; and J.M. Blockhus. 1996. Non-timber forest product
gathering in Ritigala forest (Sri Lanka): Household strategies and community differentiation. Human Ecology 24 (4). pp. 493-519.
Withanage, H. 1999. Sri Lanka: Politics in forests. World Rainforest Movement,
bulleting No 29. Montevideo-Uruguay Yamane, T. 1967. Elementary sampling theory. Prentice-Hall, Englewood Cliffs, N.J.
40

Appendix A
Table A.1. Summary Statistics of Selected Variables
Dunhinda Kithulanahela Galagodabedda Bibilehela–Welanvita Variable Mean St. dev Mean St. dev Mean St. dev Mean St. dev
Agricultural Income (Rs/year)
14352 11384 18262 19325 15949 10605 27509 20877
Extent (acres) 1.126 0.78 1.16 0.79 1.13 0.59 1.78 0.93 Flabor (days/year) 69.72 30.19 49.92 36.03 40.71 21.84 69.77 41.09 Hlabor (days/year) 11.68 14.66 23.17 26.55 6.71 10.74 19.35 19.37 Ifer (kg/year) 80.81 55.05 82 76.23 69.17 58.71 70.73 71.20 Ofer (kg/year) 110.61 86.88 42.81 61.36 10.33 29.89 50.54 159.66 Pest (liters) 0.51 0.44 0.91 1.0 0.45 0.49 1.05 1.09 Age (years) 48.29 11.95 47.16 12.08 48.73 10.56 46.85 11.59 Exp (years) 28.19 10.83 27.46 11.99 29.11 9.90 27.52 12.13 Exten (hours) 0.34 0.88 0.33 0.65 2.33 1.64 1.04 1.72 Nutrition (K/kal) 1648.2 84.22 1600.49 130.85 1655.59 73.69 1630.62 121.36 NTFP value (Rs/year)
2323 3105 3291 4395 3074 6917 764 2009
Fuelwood value (Rs/year)
5631 5448 2528 3539 3257 2838 4528 6685
Off-farm income (Rs/year)
10582 11130 15754 13481 9685 17054 12911 14702
Wealth (Rs) 13793 11745 11804 8767 14102 11027 10556 8530 Experience in foraging (years)
27.2 10.26 29.07 16.22 23.36 15.63 15.92 13.32
MFratio 1.27 0.98 1.33 1.11 1.48 0.86 1.11 0.70 Diversification index
2.53 0.74 2.57 0.76 2.19 0.69 2.25 0.53
41

Table A.2. Comparison of Regression Coefficients Between Forest Reserves (Chow Test)
Translog frontier model Forest dependency model Forest reserve
F-statistics p-value F-statistics p-value
Dunhinda vs Kithulanahela 2.43 0.21(-03)* 17.17 0.12(-21)* Dunhinda vs Galagodabedda 3.28 0.61(-06)* 7.91 0.55(-10)* Dunhinda vs Bibilehela-Welanvita 3.26 0.71(-06)* 10.71 0.12(-13)* Kithulanahela vs Galagodabedda 1.22 0.22 4.99 0.21(-05)* Kithulanahela vs Bibilehela-Welanvita 1.17 0.27 5.37 0.73(-06)* Galagodabedda vs Bibilehela-Welanvita
1.61 0.04* 1.09 0.37
* significant at 0.05 level
Table A3. Heteroskedasticity Tests Results for Original Model Dunhinda Kithulanahela Galagodabedda Bibilehela-
Welanvita Test
Chi-Square
P-value Chi- Square
P-value
Chi-Square
P-value
Chi- Square
P-value
YHAT 8.13 0.004* 10.79 0.00* 8.41 0.00* 4.57 0.03* YHAT** 8.71 0.003* 14.86 0.00* 10.92 0.00* 7.72 0.01* Log(YHAT**) 4.41 0.036* 5.17 0.02* 4.04 0.04* 1.52 0.22 Arch Test 0.077 0.782 0.29 0.58 1.67 0.19 0.13 0.72 Harvey Test 8.33 0.50 8.34 0.5 19.25 0.02* 8.71 0.46 Glejser Test 13.531 0.140 21.91 0.00* 31.27 0.00* 15.72 0.07 Koenker 13.45 0.143 15.11 0.09 8.86 0.45 7.74 0.56 B-P-G 14.328 0.111 61.26 0.00* 36.25 0.00* 61.84 0.00* * Significant at 0.05 level
Table A.4. Heteroskedasticity Tests Results for Corrected Model
Dunhinda Kithulanahela Galagodabedda Bibilehela-Welanvita
Test
Chi-Square
P-value
Chi- Square
P-value
Chi-Square
P-value
Chi- Square
P-value
YHAT 2.36 0.124 0.01 0.91 0.22 0.64 0.16 0.69 YHAT** 0.139 0.709 0.19 0.66 0.12 0.73 0.15 0.69 Log(YHAT**) 9.132 0.002* 0.12 0.72 0.37 0.54 0.01 0.92 Arch Test 0.001 0.979 0.49 0.48 0.002 0.96 0.25 0.62 Harvey Test 2.867 0.969 -15.01 0.00 18.57 0.03* 9.59 0.38 Glejser Test 27.74 0.001* -2.03 0.00 4.75 0.86 -6.55 0.00* Koenker 31.19 0.000* 10.11 0.34 0.86 0.99 0.75 0.99 B-P-G 50.854 0.000* 11.21 0.26 5.73 0.77 2.51 0.98 * Significant at 0.05 level
42
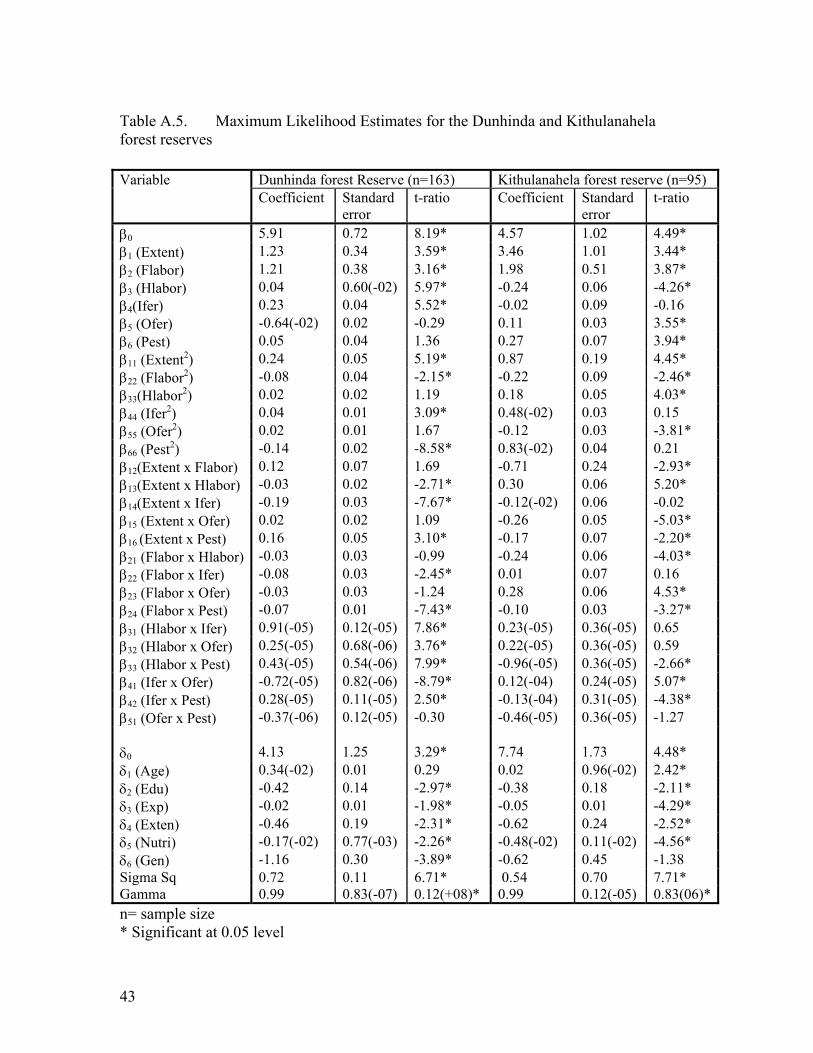
Table A.5. Maximum Likelihood Estimates for the Dunhinda and Kithulanahela forest reserves
Dunhinda forest Reserve (n=163) Kithulanahela forest reserve (n=95) Variable Coefficient Standard
error t-ratio Coefficient Standard
error t-ratio
β0 5.91 0.72 8.19* 4.57 1.02 4.49* β1 (Extent) 1.23 0.34 3.59* 3.46 1.01 3.44* β2 (Flabor) 1.21 0.38 3.16* 1.98 0.51 3.87* β3 (Hlabor) 0.04 0.60(-02) 5.97* -0.24 0.06 -4.26* β4(Ifer) 0.23 0.04 5.52* -0.02 0.09 -0.16 β5 (Ofer) -0.64(-02) 0.02 -0.29 0.11 0.03 3.55* β6 (Pest) 0.05 0.04 1.36 0.27 0.07 3.94* β11 (Extent2) 0.24 0.05 5.19* 0.87 0.19 4.45* β22 (Flabor2) -0.08 0.04 -2.15* -0.22 0.09 -2.46* β33(Hlabor2) 0.02 0.02 1.19 0.18 0.05 4.03* β44 (Ifer2) 0.04 0.01 3.09* 0.48(-02) 0.03 0.15 β55 (Ofer2) 0.02 0.01 1.67 -0.12 0.03 -3.81* β66 (Pest2) -0.14 0.02 -8.58* 0.83(-02) 0.04 0.21 β12(Extent x Flabor) 0.12 0.07 1.69 -0.71 0.24 -2.93* β13(Extent x Hlabor) -0.03 0.02 -2.71* 0.30 0.06 5.20* β14(Extent x Ifer) -0.19 0.03 -7.67* -0.12(-02) 0.06 -0.02 β15 (Extent x Ofer) 0.02 0.02 1.09 -0.26 0.05 -5.03* β16 (Extent x Pest) 0.16 0.05 3.10* -0.17 0.07 -2.20* β21 (Flabor x Hlabor) -0.03 0.03 -0.99 -0.24 0.06 -4.03* β22 (Flabor x Ifer) -0.08 0.03 -2.45* 0.01 0.07 0.16 β23 (Flabor x Ofer) -0.03 0.03 -1.24 0.28 0.06 4.53* β24 (Flabor x Pest) -0.07 0.01 -7.43* -0.10 0.03 -3.27* β31 (Hlabor x Ifer) 0.91(-05) 0.12(-05) 7.86* 0.23(-05) 0.36(-05) 0.65 β32 (Hlabor x Ofer) 0.25(-05) 0.68(-06) 3.76* 0.22(-05) 0.36(-05) 0.59 β33 (Hlabor x Pest) 0.43(-05) 0.54(-06) 7.99* -0.96(-05) 0.36(-05) -2.66* β41 (Ifer x Ofer) -0.72(-05) 0.82(-06) -8.79* 0.12(-04) 0.24(-05) 5.07* β42 (Ifer x Pest) 0.28(-05) 0.11(-05) 2.50* -0.13(-04) 0.31(-05) -4.38* β51 (Ofer x Pest) -0.37(-06) 0.12(-05) -0.30 -0.46(-05) 0.36(-05) -1.27 δ0 4.13 1.25 3.29* 7.74 1.73 4.48* δ1 (Age) 0.34(-02) 0.01 0.29 0.02 0.96(-02) 2.42* δ2 (Edu) -0.42 0.14 -2.97* -0.38 0.18 -2.11* δ3 (Exp) -0.02 0.01 -1.98* -0.05 0.01 -4.29* δ4 (Exten) -0.46 0.19 -2.31* -0.62 0.24 -2.52* δ5 (Nutri) -0.17(-02) 0.77(-03) -2.26* -0.48(-02) 0.11(-02) -4.56* δ6 (Gen) -1.16 0.30 -3.89* -0.62 0.45 -1.38 Sigma Sq 0.72 0.11 6.71* 0.54 0.70 7.71* Gamma 0.99 0.83(-07) 0.12(+08)* 0.99 0.12(-05) 0.83(06)*n= sample size * Significant at 0.05 level
43
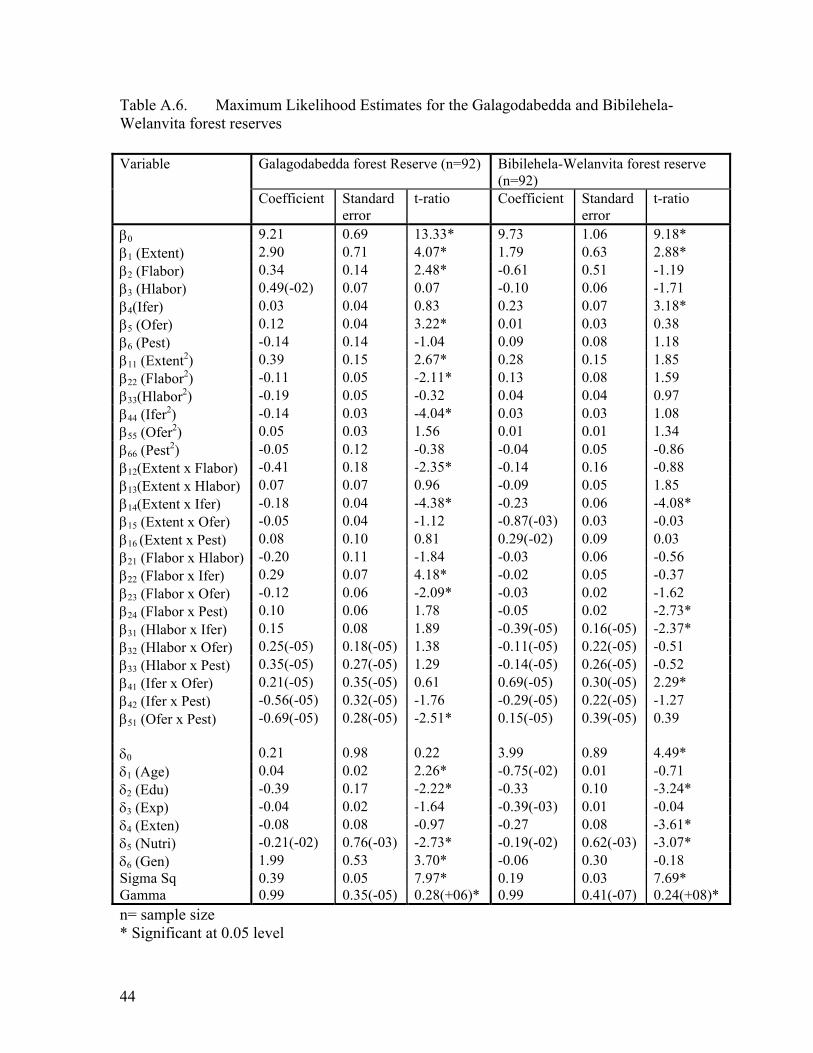
Table A.6. Maximum Likelihood Estimates for the Galagodabedda and Bibilehela-Welanvita forest reserves
Galagodabedda forest Reserve (n=92) Bibilehela-Welanvita forest reserve (n=92)
Variable
Coefficient Standard error
t-ratio Coefficient Standard error
t-ratio
β0 9.21 0.69 13.33* 9.73 1.06 9.18* β1 (Extent) 2.90 0.71 4.07* 1.79 0.63 2.88* β2 (Flabor) 0.34 0.14 2.48* -0.61 0.51 -1.19 β3 (Hlabor) 0.49(-02) 0.07 0.07 -0.10 0.06 -1.71 β4(Ifer) 0.03 0.04 0.83 0.23 0.07 3.18* β5 (Ofer) 0.12 0.04 3.22* 0.01 0.03 0.38 β6 (Pest) -0.14 0.14 -1.04 0.09 0.08 1.18 β11 (Extent2) 0.39 0.15 2.67* 0.28 0.15 1.85 β22 (Flabor2) -0.11 0.05 -2.11* 0.13 0.08 1.59 β33(Hlabor2) -0.19 0.05 -0.32 0.04 0.04 0.97 β44 (Ifer2) -0.14 0.03 -4.04* 0.03 0.03 1.08 β55 (Ofer2) 0.05 0.03 1.56 0.01 0.01 1.34 β66 (Pest2) -0.05 0.12 -0.38 -0.04 0.05 -0.86 β12(Extent x Flabor) -0.41 0.18 -2.35* -0.14 0.16 -0.88 β13(Extent x Hlabor) 0.07 0.07 0.96 -0.09 0.05 1.85 β14(Extent x Ifer) -0.18 0.04 -4.38* -0.23 0.06 -4.08* β15 (Extent x Ofer) -0.05 0.04 -1.12 -0.87(-03) 0.03 -0.03 β16 (Extent x Pest) 0.08 0.10 0.81 0.29(-02) 0.09 0.03 β21 (Flabor x Hlabor) -0.20 0.11 -1.84 -0.03 0.06 -0.56 β22 (Flabor x Ifer) 0.29 0.07 4.18* -0.02 0.05 -0.37 β23 (Flabor x Ofer) -0.12 0.06 -2.09* -0.03 0.02 -1.62 β24 (Flabor x Pest) 0.10 0.06 1.78 -0.05 0.02 -2.73* β31 (Hlabor x Ifer) 0.15 0.08 1.89 -0.39(-05) 0.16(-05) -2.37* β32 (Hlabor x Ofer) 0.25(-05) 0.18(-05) 1.38 -0.11(-05) 0.22(-05) -0.51 β33 (Hlabor x Pest) 0.35(-05) 0.27(-05) 1.29 -0.14(-05) 0.26(-05) -0.52 β41 (Ifer x Ofer) 0.21(-05) 0.35(-05) 0.61 0.69(-05) 0.30(-05) 2.29* β42 (Ifer x Pest) -0.56(-05) 0.32(-05) -1.76 -0.29(-05) 0.22(-05) -1.27 β51 (Ofer x Pest) -0.69(-05) 0.28(-05) -2.51* 0.15(-05) 0.39(-05) 0.39 δ0 0.21 0.98 0.22 3.99 0.89 4.49* δ1 (Age) 0.04 0.02 2.26* -0.75(-02) 0.01 -0.71 δ2 (Edu) -0.39 0.17 -2.22* -0.33 0.10 -3.24* δ3 (Exp) -0.04 0.02 -1.64 -0.39(-03) 0.01 -0.04 δ4 (Exten) -0.08 0.08 -0.97 -0.27 0.08 -3.61* δ5 (Nutri) -0.21(-02) 0.76(-03) -2.73* -0.19(-02) 0.62(-03) -3.07* δ6 (Gen) 1.99 0.53 3.70* -0.06 0.30 -0.18 Sigma Sq 0.39 0.05 7.97* 0.19 0.03 7.69* Gamma 0.99 0.35(-05) 0.28(+06)* 0.99 0.41(-07) 0.24(+08)* n= sample size * Significant at 0.05 level
44

Table A.7. Probit Estimation on Marginal Effects on Determinants of Forest Dependency
Dunhinda (n=163) Kithulanahela (n=95) Galagodabedda (n=92) Bibilehela-Welanvita (n=92) Variable
coefficient Std. error
t-ratio coefficient Std. error
t-ratio coefficient Std. error
t-ratio coefficient Std. error
t-ratio
Effi -0.71 0.21 -3.34* -0.23 0.13 -1.80 -0.67 0.26 -2.61* -0.26 0.26 -0.99 Edu -0.42 (-01) 0.34(-01) -1.27 -0.80(-02) 0.18(-01) -0.46 -0.67(-01) 0.48(-01) -1.39 -0.17(-01) 0.22(-01) -0.77 Oinc 0.39(-05) 0.27(-05) 1.43 0.84(-06) 0.11(-05) 0.76 0.66(-07) 0.22(-05) 0.03 -0.11(-05) 0.14(-05) -0.82 Flabor -0.46(-01) 0.18(-01) -2.56* 0.23(-01) 0.14(-01) 1.69 0.54(-01) 0.29(-01) 1.88 0.86(-02) 0.11(-01) 0.75 Exp -0.47(-02) 0.29(-02) -1.62 0.27(-02) 0.14(-02) 1.93* 0.63(-02) 0.25(-02) 2.49* 0.43(-02) 0.39(-02) 1.09 MF ratio -0.46(-01) 0.31(-01) -1.46 -0.57(-02) 0.10(-01) -0.56 -0.74(-01) 0.39(-01) -1.87 -0.87(-02) 0.14(-01) 0.61 Wealth 0.26(-05) 0.24(-05) 1.05 -0.21(-05) 0.20(-05) -1.02 -0.47(-05) 0.29(-05) -1.62 0.18(-05) 0.22(-05) 0.79 Dis -0.19 0.77(-01) -2.64* -0.12 0.84(-01) -1.45 0.14(-01) 0.16 0.09 0.29 0.26 1.07 Diver -0.15 0.48(-01) -3.04* -0.53(-01) 0.29(-01) -1.78 0.66(-01) 0.71(-01) 0.94 -0.71(-01) 0.71(-01) -1.00 Constant 1.58 0.24 6.53* 0.30 0.12 2.13* 0.42 0.24 1.73 0.26 0.25 1.01 n = sample size * significant at 0.05 level
45

Appendix B The stochastic frontier production function is defined by:
( ) ( iUiViixfiY −= exp, )β B.1 Ni ........,.........2,1=Where is a random error having zero mean, which is associated with random factors (e.g., measurement errors in production, weather, industrial action, etc.) not under the control of the firm, ’s are the independent variables and
iV
ix iβ ’s are the unknown parameters. This stochastic frontier model was independently proposed by Aigner et al., (1977) and Meeusen and Van den Broeck (1977). The model is such that the possible production, , is bounded above by the stochastic quantity,
iY( ) ( )iViixf exp, β ; hence the term stochastic
frontier. The random errors, ; iV Ni ........,.........2,1= were assumed to be independently and identically distributed as ( )2,0 σN random variables, independent of the ’s which were assumed to be non-negative truncations of the
iU( )2,0 vN σ distribution (i.e. half
normal distribution) or have exponential distribution. Meeusen and Van den Broeck (1977) considered only the case in which the ’s had exponential distribution (i.e., iU γ distribution with parameters 1=r and 1>λ ) and noted that the model was not as restrictive as the one parameter γ distribution (i.e., γ distribution with parameters nr = and 1>λ ) considered by Richmond (1974). Given the assumptions of the stochastic frontier model (B.1), inference about the parameters of the model can be based on the maximum likelihood estimators because the standard regularity conditions hold. Aigner et al., (1977) suggested that the maximum-likelihood estimates of the parameters of the model be obtained in terms of the parameterization, and 222
sv σσσ =+ vσσλ = . Rather than use the non-negative parameters, λ (i.e., the ratio of the standard deviation of the ( )2,0 σN distribution involved in specifying the distribution of the non-negative ’s to the standard deviation of the symmetric errors, ), Battese and Corra (1977) considered the parameter,
iU
iV( )222 σσσγ += v , which is bounded between zero and one.
Technical efficiency of an individual firm is defined in terms of the ratio of the observed output to the corresponding frontier output, conditional on the levels of inputs used by that firm. Thus the technical efficiency of firm in the context of the stochastic frontier production function (B.1) is the same expression as for the deterministic frontier model, namely i.e.
i
( ii UTE −= exp )*
iii YYTE = ( ) ( ) ( ) ( )iViixfiUiViixf exp,exp, ββ −= ( )iU−= exp
46

Although the technical efficiency of a firm associated with the deterministic and stochastic frontier models are the same, they have different values for the two models (Battese, 1992). As shown in figure 2.1, technical efficiency of firm j is greater under the stochastic frontier model than for the deterministic frontier, i.e.,
( )[ jjxfjYjYjY β,* >⎟⎠⎞⎜
⎝⎛ ]. That is firm j is judged technically more efficient relative to
the unfavorable conditions associated with its productive activity (i.e., ) than if its production is judged relative to the maximum associated with the value of deterministic function,
0<jV
( )jjxf β, . Further, firm i is judged technically less efficient relative to its favorable conditions than if its production is judged relative to the maximum associated with the value of the deterministic function, ( )iixf β, . However, for a given set of data, the estimated technical efficiencies obtained by fitting a deterministic frontier will be less than those obtained by fitting a stochastic frontier, because the deterministic frontier will be estimated such that no output values will exceed it (Battese, 1992).
47

Policy Decision
Household Decision Forest
Envt. Socio-
econ envt.Policy Envt.
Extension Assistance Formal education Nutrition status Options for income diversification
Minimize dependency Lack of scientific info in
policy formulation? Identification of effect of intersectoral incursions/inductions in forest conservation? Need of dependent communities? ways to mitigate opportunity cost of NTFP conservation?
Figure C.1. Information flow in policy decisions
Appendix C
48