Embed Size (px)
Citation preview
Technical Guide for Measuring Up 2006: Documenting Methodology, Indicators, and Data Sources
September 2006
THE NATIONAL CENTER FOR PUBLIC POLICY AND HIGHER EDUCATION

National Center #06-6 © 2006 by The National Center for Public Policy and Higher Education
ii
Contents Foreword...................................................................................................................................... iv Introduction ................................................................................................................................. 1 I. Scoring and Grading State Performance ................................................................................ 2 II. Graded Performance Categories............................................................................................. 6
Preparation....................................................................................................................... 7 Participation................................................................................................................... 22 Affordability .................................................................................................................. 26 Completion .................................................................................................................... 34 Benefits.......................................................................................................................... 39 Learning......................................................................................................................... 50
III. Non-Graded Measures ......................................................................................................... 59 1. Other Key Facts (In Graded Categories)
A. Performance Gaps by Race/Ethnicity and Income.................................................. 59 B. Students Enrolling in College Out of State ............................................................. 60 C. Net Revenue Loss ................................................................................................... 60
2. International Comparisons ................................................................................................... 62 3. Additional Information ........................................................................................................ 65 Appendices (Learning) ............................................................................................................... 68 About the National Center for Public Policy and Higher Education.......................................... 87
iii
Foreword
T
his Technical Guide provides complete information on the indicators presented in Measuring Up 2006: the national and the state report cards on higher education. (Both report cards are available
at www.highereducation.org.) The Technical Guide describes all of the graded and non-graded indicators in Measuring Up
2006, explains the methodology used to calculate these indicators, and lists the sources of data. Any changes made to data and methodology for this year’s report card are also explained in detail.
New additions to Measuring Up 2006 include international comparisons for all 50 states and the nation as a whole. Detailed information about the international indicators is presented in this document. Measuring Up 2006 also includes, for the first time, limited data on Learning for all 50 states. Although most states continued to receive an Incomplete grade in Learning due to the lack of reported information, this year nine states received a Plus. These nine states reported adequate data in more than one of the indicator clusters either through their participation in a pilot project, or by collecting additional state data for the state version of the National Assessment of Adult Literacy (NAAL).
We offer special thanks to Alan Wagner, professor of Educational Administration and Policy Studies/Comparative and International Education Policy Program, State University of New York at Albany for his assistance with international data and analysis. Peter Ewell, the vice president of the National Center for Higher Education Management Systems, who was responsible for the analysis of Learning data for the 50 states, also provided documentation of methodology on the learning assessment.
Mikyung Ryu, senior policy analyst at the National Center, led the Measuring Up 2006 analytical team. This Technical Guide was prepared with the assistance of Jonathan Felder and Young Kim, policy analysts, and Mikyung Ryu.
The National Center welcomes the comments of readers.
Joni Finney Vice President
The National Center for Public Policy and Higher Education
iv
Introduction
T
his Technical Guide describes the methodology and concepts used to measure and grade the performance of the 50 states in the higher education arena. Part I presents the methodology for grading states and provides information on data collection
and reporting. Part II explains the indicators that comprise each of the graded categories. Specifically, this section details the construction of each indicator—its scope, source, and computations. Part III provides data sources for non-graded information that are not taken into account in the final grade, but are important to the state assessment. Non-graded information related to the demographic, economic, or educational characteristics of states is provided to enhance understanding of the graded state performance. International comparisons are a new contextual information introduced this year.
Data for all graded and non-graded indicators in Measuring Up 2006 can be downloaded from the National Center’s web site at www.highereducation.org (see Measuring Up 2006 Database).
The term higher education is used consistently throughout the Measuring Up reports. In this context, higher education refers to the education and training beyond high school offered by accredited degree-granting colleges and universities that are eligible for Title IV federal financial aid. Private for-profit institutions run by employers to provide specific job-related training are not included. Unless otherwise noted, the indicators used in Measuring Up refer to postsecondary education and training through the bachelor’s degree.
1
I. Scoring and Grading State Performance A. GENERAL METHODS FOR SCORING AND GRADING Each of the graded categories contains a number of relevant indicators. These indicators, culled from nationally comparable data, represent variables that explain, in part, statewide variation in category performance.
States’ performance on different indicators is compared through an indexing method in which raw scores for each indicator are scaled to the median value of the top five performers. This median of best performance is the benchmark for all other states. Each state’s raw scores are indexed to (that is, divided by) the benchmark on every indicator in every category.
Once indexed, each state score is multiplied by a predetermined “weight” that accounts for the indicator’s relative importance in predicting category performance. The value of each weight was determined by existing research documenting the significance of these variables as a measure of category performance. Although some indicators are weighted more heavily than others in a category, the sum of all assigned weights equals 100%. At the introduction of each category in Part II, the specific weights assigned to each indicator are displayed.
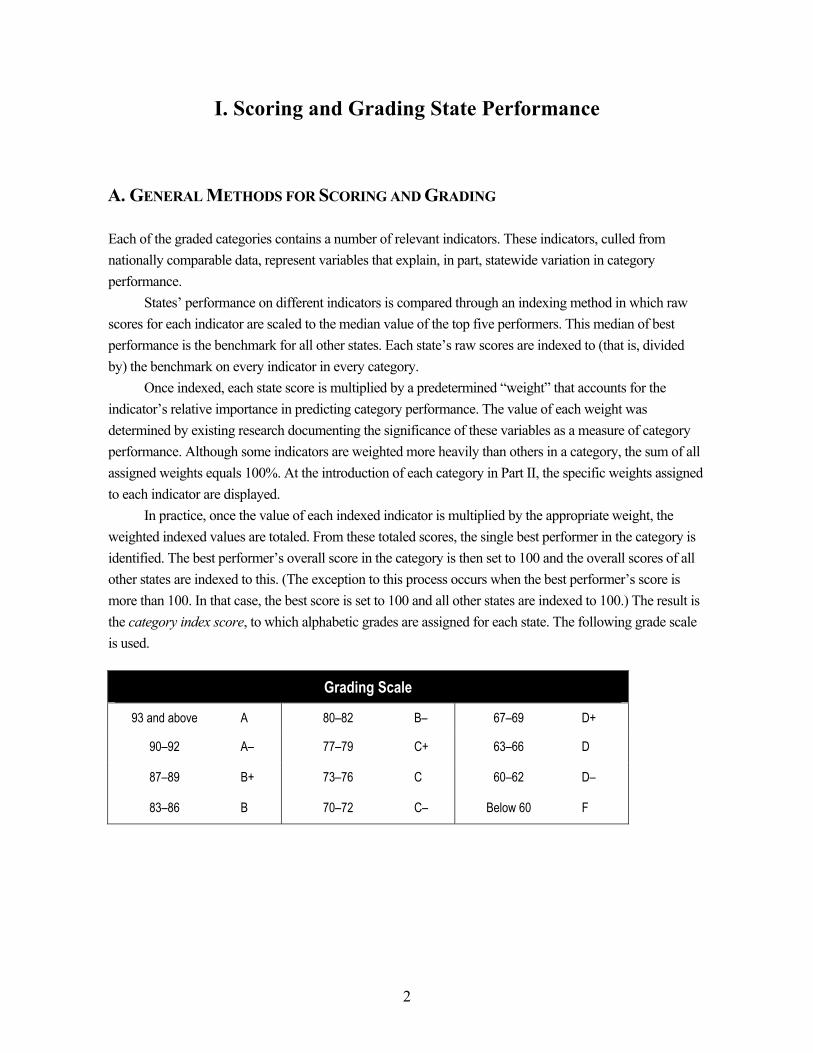
In practice, once the value of each indexed indicator is multiplied by the appropriate weight, the weighted indexed values are totaled. From these totaled scores, the single best performer in the category is identified. The best performer’s overall score in the category is then set to 100 and the overall scores of all other states are indexed to this. (The exception to this process occurs when the best performer’s score is more than 100. In that case, the best score is set to 100 and all other states are indexed to 100.) The result is the category index score, to which alphabetic grades are assigned for each state. The following grade scale is used.
Grading Scale
93 and above A 80–82 B– 67–69 D+
90–92 A– 77–79 C+ 63–66 D
87–89 B+ 73–76 C 60–62 D–
83–86 B 70–72 C– Below 60 F
2
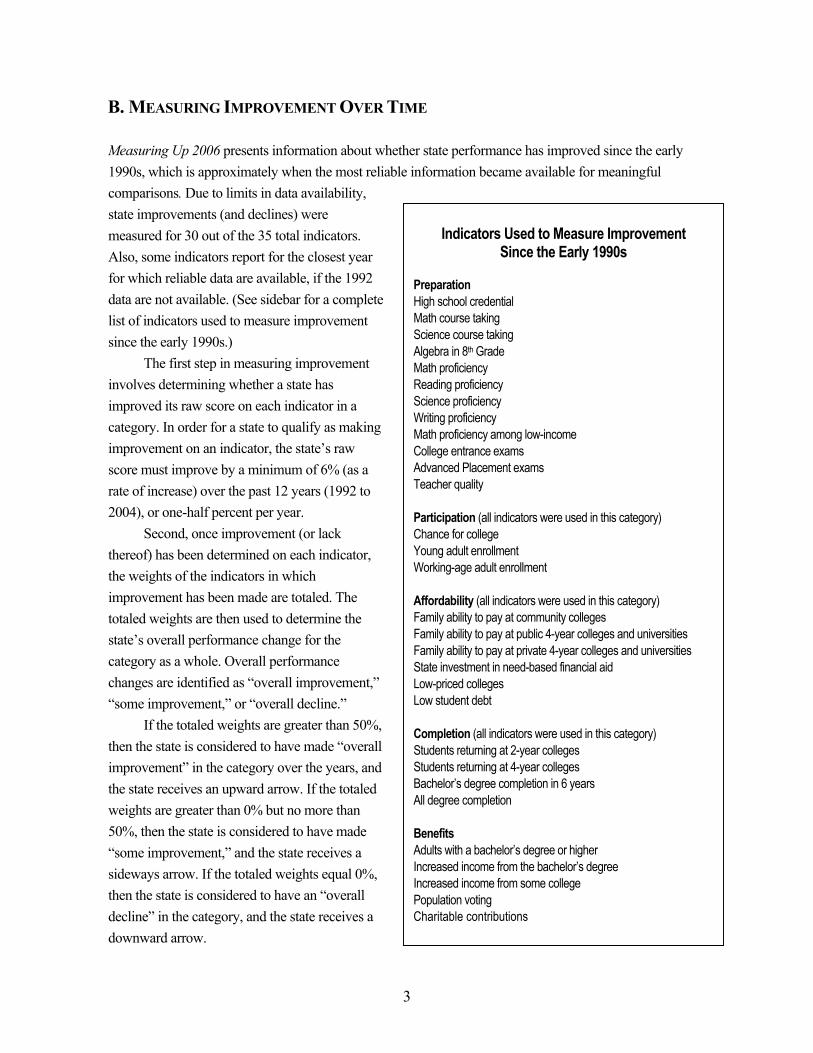
B. MEASURING IMPROVEMENT OVER TIME Measuring Up 2006 presents information about whether state performance has improved since the early 1990s, which is approximately when the most reliable information became available for meaningful comparisons. Due to limits in data availability, state improvements (and declines) were measured for 30 out of the 35 total indicators. Also, some indicators report for the closest year for which reliable data are available, if the 1992 data are not available. (See sidebar for a complete list of indicators used to measure improvement since the early 1990s.)
Indicators Used to Measure Improvement
Since the Early 1990s Preparation High school credential Math course taking Science course taking Algebra in 8th Grade Math proficiency Reading proficiency Science proficiency Writing proficiency Math proficiency among low-income College entrance exams Advanced Placement exams Teacher quality Participation (all indicators were used in this category) Chance for college Young adult enrollment Working-age adult enrollment Affordability (all indicators were used in this category) Family ability to pay at community colleges Family ability to pay at public 4-year colleges and universities Family ability to pay at private 4-year colleges and universities State investment in need-based financial aid Low-priced colleges Low student debt Completion (all indicators were used in this category) Students returning at 2-year colleges Students returning at 4-year colleges Bachelor’s degree completion in 6 years All degree completion Benefits Adults with a bachelor’s degree or higher Increased income from the bachelor’s degree Increased income from some college Population voting Charitable contributions
The first step in measuring improvement involves determining whether a state has improved its raw score on each indicator in a category. In order for a state to qualify as making improvement on an indicator, the state’s raw score must improve by a minimum of 6% (as a rate of increase) over the past 12 years (1992 to 2004), or one-half percent per year.
Second, once improvement (or lack thereof) has been determined on each indicator, the weights of the indicators in which improvement has been made are totaled. The totaled weights are then used to determine the state’s overall performance change for the category as a whole. Overall performance changes are identified as “overall improvement,” “some improvement,” or “overall decline.”
If the totaled weights are greater than 50%, then the state is considered to have made “overall improvement” in the category over the years, and the state receives an upward arrow. If the totaled weights are greater than 0% but no more than 50%, then the state is considered to have made “some improvement,” and the state receives a sideways arrow. If the totaled weights equal 0%, then the state is considered to have an “overall decline” in the category, and the state receives a downward arrow.
3
Improvement on each indicator over time is measured only when data are available for both comparison years. For a state with missing data for certain indicators, overall performance improvement for the category is determined based on all available data for the state in that category, after adjusting the indicator weights proportionately, based on the original weights. C. CURRENCY OF DATA The Measuring Up series uses the most recent data available. Unfortunately, collecting agencies often require months to analyze and disseminate reports to the public. Additionally, in some cases, data are not systematically collected each year. Finally, it is possible that future assessments or studies have not received authorization or funding for subsequent data collection. For one or more of these reasons, state results on the report card’s indicators may lag behind recent changes or incompletely capture the most recent initiatives that state policymakers have implemented. D. MISSING DATA Missing data present a number of challenges to a statewide assessment such as a report card. Measuring Up 2006 continues to measure state performance using reliable and state-by-state comparable data. Despite the scientific survey methods used to collect these survey data, information cannot always be reported reliably for each state. This can be attributed to the fact that many surveys do not intentionally oversample populations from each of the 50 states. Thus, estimates of behaviors, characteristics, or educational performance of the populations in small states are unlikely to be captured adequately by a nationally drawn random sample. In cases of nationally administered surveys such as the National Assessment of Educational Progress (NAEP) or the National Assessment of Adult Literacy (NAAL), states are given the option to participate in a state oversample and may decline to take part.
To a certain extent, missing data are problematic for some categories. Nevertheless, indicators are included to gauge state performance in the report card despite cases in which data are missing for more than one state. Such indicators were retained because they capture salient policy issues and signal the necessity to expand data collection to all 50 states. Data imputation To adjust for missing data, several strategies were considered and discarded. Choosing to assign a zero value to states that did not report data on specific indicators presumes the lowest possible performance. Alternatively, relying on the mean value of all states’ performance presumes similarity among states that are in fact quite distinct. Calculating a grade using only available data distorts the weighting method applied because indicators with data become more important than those without data in the calculation of the overall grade, regardless of their overall influence in determining category performance.
4
Consequently, where no comparable data exist to gauge states’ performance on an individual indicator, a technique known as imputation is applied. This strategy calculates the weighted mean value of state performance on indicators within a given category for which data are available for the state and applies that value where data are otherwise missing. This technique is applied to every state with missing data, using the weighted mean score of the state’s own performance. Imputing in this way presumes the state does neither better nor worse on an indicator for which it is missing data than it does on highly correlated indicators within the same category. Latest data available In cases where some states did not participate in the most recent survey, although they had previously participated, the report card applied the latest data available principle. This means that, to calculate the final grade, states’ raw scores on each indicator are derived from the most recent survey that they participated in, not necessarily the most recently administered survey. Therefore, for several states, Measuring Up 2006 used the scores from the previous report. In part II where data availability is noted for each indicator, the states using previous data are identified. Accuracy of data An estimate derived from a sample rather than the entire population can vary depending on different sample populations. Standard error is a measure of the variability among all possible samples. The accuracy of an estimate decreases with larger standard error. When state estimates are produced with a large standard error, the estimates are unlikely to be precise. Therefore, the report card applied the rule that an estimate with a standard error of 10 percentage points or greater is not reliable, and so it is considered as missing data. In such cases, the state score is based on the data used in the previous report, or an imputed value if data were never reported. E. MIGRATION Inter-state migration is a critical component of state performance in many of the categories, and its importance cannot be overstated. In the participation and benefits categories, for example, it would be appropriate to adjust performance measures for migration. However, this type of detailed analysis is simply not possible at the state level, given current practices of data collection. Although inter-state migration is generally not accounted for in this report card due to data limitations, one participation indicator (chance for college) takes into account student migration across states.
5
II. Graded Performance Categories
S
ix categories gauge state higher education performance: preparation, participation, affordability, completion, benefits, and learning.
As with the 2004 edition, most states receive an “Incomplete” in the Learning category due to the lack of reported information. This year, however, nine states receive a “Plus”: Illinois, Kentucky, Maryland, Massachusetts, Missouri, Nevada, New York, Oklahoma, and South Carolina. These nine states reported adequate data in more than one of the indicator groups either through their participation in a pilot project, or by collecting additional state data for the state version of the National Assessment of Adult Literacy (NAAL) conducted in 2003.
Like earlier editions, Measuring Up 2006 has adopted some changes in order to offer more up-to-date and more reliable information. A new survey data now replaces the data source for two persistence indicators in the Completion category.
The following pages detail each of the performance categories describing specifically all of the indicators and the indicators’ weights that are used in order to arrive at states’ grades. A comprehensive catalogue of data sources, indicating collecting agency and the reference year of data, is also presented.
6
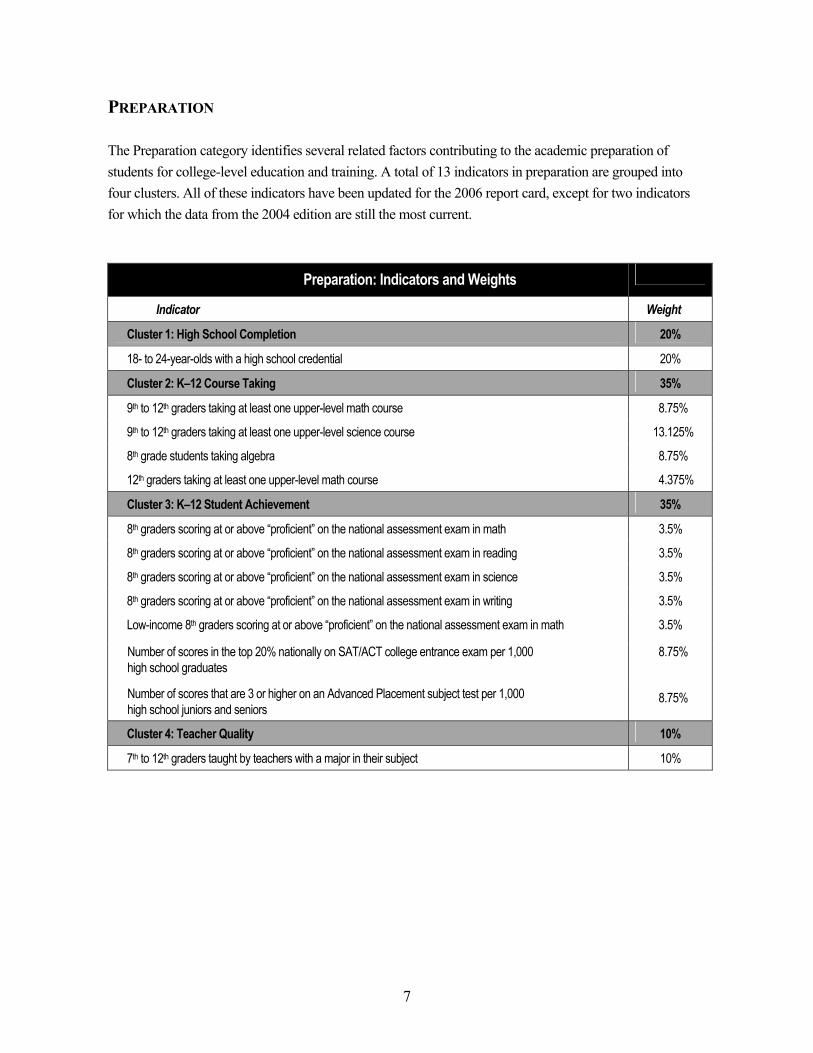
PREPARATION The Preparation category identifies several related factors contributing to the academic preparation of students for college-level education and training. A total of 13 indicators in preparation are grouped into four clusters. All of these indicators have been updated for the 2006 report card, except for two indicators for which the data from the 2004 edition are still the most current.
Preparation: Indicators and Weights
Indicator Weight
Cluster 1: High School Completion 20%
18- to 24-year-olds with a high school credential 20%
Cluster 2: K–12 Course Taking 35%
9th to 12th graders taking at least one upper-level math course 8.75%
9th to 12th graders taking at least one upper-level science course 13.125%
8th grade students taking algebra 8.75%
12th graders taking at least one upper-level math course 4.375%
Cluster 3: K–12 Student Achievement 35%
8th graders scoring at or above “proficient” on the national assessment exam in math 3.5%
8th graders scoring at or above “proficient” on the national assessment exam in reading 3.5%
8th graders scoring at or above “proficient” on the national assessment exam in science 3.5%
8th graders scoring at or above “proficient” on the national assessment exam in writing 3.5%
Low-income 8th graders scoring at or above “proficient” on the national assessment exam in math 3.5%
Number of scores in the top 20% nationally on SAT/ACT college entrance exam per 1,000 high school graduates
8.75%
Number of scores that are 3 or higher on an Advanced Placement subject test per 1,000 high school juniors and seniors
8.75%
Cluster 4: Teacher Quality 10%
7th to 12th graders taught by teachers with a major in their subject 10%
7
HIGH SCHOOL COMPLETION: 18- to 24-year-olds with a high school credential Sources U.S. Bureau of the Census. Current Population Survey. October 2002, 2003, and 2004 Supplements; October 1990, 1991, and 1992 Supplements. Washington, D.C. State-level data for 2002–2004 were provided by Research Triangle Institute, 2006; data for 1990-1992 were provided by Pinkerton Computer Consultants, 2004. Description This measure uses the following calculation:
Numerator: Number of 18- to 24-year-olds in the population holding a high school credential.* Denominator: Total population ages 18 to 24, excluding those still enrolled in high school or currently pursuing alternative certification. *High school credential includes a high school diploma or alternative certification such as a General Educational Development (GED) diploma.
Notes This indicator measures the extent to which the traditional-college-age young adult population in the state is minimally qualified to participate in postsecondary education. Other publicly available state-level figures (the Census, for instance) tend to be lower than the results on this indicator. This is because our denominator excludes those currently enrolled in high school, while others use the entire population ages 18 to 24 as denominator.
This indicator is not a calculation of cohort survival rate (such as the percent of ninth graders graduating from high school in four years). Given the drop-out and re-entry patterns of many students, a simple calculation of high school graduation rate would fail to capture their eventual completion.
First introduced in Measuring Up 2004, the report card continues to provide a breakdown that allows each state to compare between regular high school diploma holders and GED recipients in their states. Nationally, 87% of traditional-college-age youths hold a high school credential; among them about 82% are regular high school graduates and about 5% are GED recipients. Data Availability This indicator pools three years of the most current data, 2002 to 2004 (and 1990 to 1992 as the data for the early 1990s), to obtain a large enough sample size to make reliable state estimates and to account for aberrations in any single year of data. Using this method, data are available for all 50 states.
8
K–12 COURSE TAKING: 9th to 12th graders taking at least one upper-level math course Sources Rolf K. Blank and Doreen Langesen. State Indicators of Science and Mathematics Education 2005: State-by-State Trends and New Indicators from the 2003–04 School Year. Washington, D.C.: Council of Chief State School Officers, 2005.
The data for the early 1990s are from Rolf K. Blank and Doreen Gruebel. State Indicators of Science and Mathematics Education 1993: State and National Trends—New Indicators from the 1991–92 School Year. Washington, D.C.: Council of Chief School Officers, 1993, p.18. Description This indicator measures the percentage of public high school students in the state in grades 9 to 12 who took one or more math courses at levels 2 through 5 during the 2003–04 school year. These math courses include geometry, algebra 2, trigonometry, pre-calculus, or calculus. Notes Although high school humanities subject course taking is also important to students’ preparation, neither the Council of Chief State School Officers nor any other organization collects these types of data comparably from the states. Louisiana’s data from the early 1990s are for the 1989–90 school year. Data Availability Data are available for 35 states, including Alabama, Connecticut, Delaware, Kentucky, Massachusetts, New York, Oregon, and Vermont, for which the latest data available method was applied: That is, because these states had participated previously but did not participate in the most recent survey, their data from earlier Measuring Up reports were used.
Fifteen states for which data are unavailable are: Alaska, Arizona, Colorado, Georgia, Hawaii, Illinois, Kansas, Maine, Maryland, Montana, New Hampshire, New Jersey, Rhode Island, Virginia, and Washington.
9
K–12 COURSE TAKING: 9th to 12th graders taking at least one upper-level science course Sources Rolf K. Blank and Doreen Langesen. State Indicators of Science and Mathematics Education 2005: State-by-State Trends and New Indicators from the 2003–04 School Year. Washington, D.C.: Council of Chief State School Officers, 2005.
The data for the early 1990s are from Rolf K. Blank and Doreen Gruebel. State Indicators of Science and Mathematics Education 1993: State and National Trends—New Indicators from the 1991–92 School Year. Washington, D.C.: Council of Chief School Officers, 1993, p. 22. Description A separate but similar indicator to math course taking, science course taking measures the extent to which high school students in the state were enrolled in one or more of the following science courses during the 2003–04 school year: chemistry or physics, second-year biology, AP biology, second-year earth science, or other advanced science courses. Note Although high school humanities subject course taking is also important to students’ preparation, neither the CCSSO nor any other organization collects these types of data comparably from the states. Data Availability Data are available for 35 states, including Alabama, Connecticut, Delaware, Kentucky, Massachusetts, New York, Oregon, and Vermont, for which the latest data available method was applied: That is, because these states had participated previously but did not participate in the most recent survey, their results from an earlier survey (previously reported in Measuring Up) were used.
Fifteen states for which data are unavailable are: Alaska, Arizona, Colorado, Georgia, Hawaii, Illinois, Kansas, Maine, Maryland, Montana, New Hampshire, New Jersey, Rhode Island, Virginia, and Washington.
10
K–12 COURSE TAKING: 8th graders taking algebra Sources Calculations based on unpublished data provided by the Science and Math Indicator Project team at the Council of Chief State School Officers. Rolf K. Blank and Doreen Langesen. State Indicators of Science and Mathematics Education 2005: State-by-State Trends and New Indicators from the 2003–04 School Year. Washington, D.C.: Council of Chief State School Officers, 2005.
The data for the early 1990s are from Rolf K. Blank and Doreen Gruebel. State Indicators of Science and Mathematics Education 1993: State and National Trends—New Indicators from the 1991–92 School Year. Washington, D.C.: Council of Chief School Officers, 1993, p. 20. Description This indicator measures the percentage of public school eighth grade students in the state who took algebra 1 during the 2003–04 school year. Data Availability Data are available from 31 states, including Alabama, California, Connecticut, Delaware, Florida, Kentucky, Massachusetts, Oregon, and Vermont, where the latest data available method was applied: That is, because these states had participated previously but did not participate in the most recent survey, their results from an earlier survey (previously reported in Measuring Up) were used.
Nineteen states for which data are unavailable are: Alaska, Arizona, Colorado, Georgia, Hawaii, Illinois, Iowa, Kansas, Maine, Maryland, Montana, New Hampshire, New Jersey, New York, Pennsylvania, Rhode Island, Texas, Virginia, and Washington. (New York is missing the data because it offers integrated math instead of algebra.)
In measuring improvement, data for the 1989–90 school year were used for Arkansas, Indiana, Louisiana, Minnesota, Mississippi, Missouri, Nevada, New Mexico, Oklahoma, Wisconsin, and Wyoming.
11
K–12 COURSE TAKING: 12th graders taking at least one upper-level math course Sources Calculations based on unpublished data provided by the Science and Math Indicator Project team at the Council of Chief State School Officers. The data are from the same source that was used to calculate the percentage of ninth to twelfth graders taking at least one upper-level math course: Rolf K. Blank and Doreen Langesen. State Indicators of Science and Mathematics Education 2005: State-by-State Trends and New Indicators from the 2003–04 School Year. Washington, D.C.: Council of Chief State School Officers, 2005. Description This indicator measures the percentage of public high school senior students in the state who took at least one advanced math course during the 2003–04 school year. The indicator attempts to provide a current picture of how many high school students maintain academic rigor during their last year. In recent years much attention has been devoted to the problem of America’s high school seniors and the concern among policymakers that students may not be taking academically demanding courses after their graduation requirements are met, or after they are accepted to college. Thus, their preparation for postsecondary education or the workforce may be inadequate. In order to ensure that students are ready for a successful transition, it is suggested that state policies require rigorous course enrollment throughout all high school years.
The indicator uses the following calculation: Numerator: Number of public high school seniors enrolled in math courses at levels 2 through 5* during the 2003–04 school year. D enominator: Number of public high school seniors enrolled for the 2003–04 school year.
*These courses include geometry, algebra 2, trigonometry, pre-calculus, calculus, and AP calculus. Data Availability Data are reported for 23 states, including Alabama, Connecticut, Massachusetts and Vermont, for which the latest data available method was applied: That is, because these states had participated previously but did not participate in the most recent survey, their data from Measuring Up 2004 were used. Many states are missing data because they declined to participate in the survey, or they did not report the data by grade level.
Twenty-seven states for which data are unavailable are: Alaska, Arizona, Colorado, Delaware, Georgia, Hawaii, Illinois, Iowa, Kansas, Kentucky, Louisiana, Maine, Maryland, Minnesota, Montana, Nebraska, Nevada, New Hampshire, New Jersey, New York, Oklahoma, Oregon, Pennsylvania, Rhode Island, Tennessee, Virginia, and Washington. Also, historical data are unavailable; thus this indicator was not used to measure improvement over time.
12
K–12 STUDENT ACHIEVEMENT: 8th graders scoring at or above “proficient” on the national assessment exam in math Sources National Assessment of Educational Progress. The Nation’s Report Card, Mathematics 2005 and 1992. Washington, D.C.: U.S. Department of Education. http://nces.ed.gov/nationsreportcard/nde (accessed 3/15/06). Description This math proficiency rate is measured as the percentage of public school eighth graders whose performance on the National Assessment of Educational Progress (NAEP) exam in math was “proficient” or “advanced.” Note Academic proficiency levels are determined by the National Assessment Governing Board, based on judgments about what students should know and be able to do. Data Availability All 50 states are reported for 2005. In measuring improvement over time, data from the 1990 assessments were used for Illinois, Montana, and Oregon.
13

K–12 STUDENT ACHIEVEMENT: 8th graders scoring at or above “proficient” on the national assessment exam in reading Sources National Assessment of Educational Progress. The Nation’s Report Card, Reading 2005 and 1998. Washington, D.C.: U.S. Department of Education. http://nces.ed.gov/nationsreportcard/nde (accessed 3/15/06). Description These proficiency rates measure the percentage of eighth graders enrolled in public school whose performance on the National Assessment of Educational Progress (NAEP) exam in reading was “proficient” or “advanced.” Notes Academic proficiency levels are determined by the National Assessment Governing Board, based on judgments about what students should know and be able to do. The reading assessment at the state level began in 1998 and thus data from 1998 to 2005 were used to measure improvement over time. Data Availability All 50 states are reported for 2005.
14
K–12 STUDENT ACHIEVEMENT: 8th graders scoring at or above “proficient” on the national assessment exam in science Sources National Assessment of Educational Progress. The Nation’s Report Card, Science 2005 and 1996. Washington, D.C.: U.S. Department of Education. http://nces.ed.gov/nationsreportcard/nde (accessed 5/25/06). Description This indicator measures the percentage of public school eighth graders whose performance on the National Assessment of Educational Progress (NAEP) exam in science was “proficient” or “advanced.” Notes Academic proficiency levels are determined by the National Assessment Governing Board, based on judgments about what students should know and be able to do. NAEP science assessments began in 1996 and thus data from 1996 to 2005 were used to measure improvement over time. Data Availability Data are available for 46 states. Forty-four states participated in the 2005 assessment, and data for an additional two states (Nebraska and New York) were drawn from Measuring Up 2004 (that is, the 2000 assessment). States for which data are missing are: Alaska, Iowa, Kansas, and Pennsylvania.
15
K–12 STUDENT ACHIEVEMENT: 8th graders scoring at or above “proficient” on the national assessment exam in writing Sources National Assessment of Educational Progress. The Nation’s Report Card, Writing 2002 and 1998. Washington, D.C.: U.S. Department of Education. http://nces.ed.gov/nationsreportcard/nde (accessed 4/15/04). Description This measure indicates the percentage of eighth graders enrolled in public school whose performance on the National Assessment of Educational Progress (NAEP) exam in writing was “proficient” or “advanced.” Notes Academic proficiency levels are determined by the National Assessment Governing Board, based on judgments about what students should know and be able to do. The data for 2002 are still the most current data, since no assessment has been carried out since 2002. Data for 1998 and 2002 were used to measure improvement over time. Data Availability Data are reported for 43 states, including Colorado and Minnesota, where the latest data available method was applied: That is, because these states had participated previously but did not participate in the most recent survey, their results from an earlier assessment (reported in Measuring Up 2004) were used. Seven states for which data are missing are: Alaska, Illinois, Iowa, New Hampshire, New Jersey, South Dakota, and Wisconsin.
16

K–12 STUDENT ACHIEVEMENT Low-income 8th graders scoring at or above “proficient” on the national assessment exam in math Sources National Assessment of Educational Progress. The Nation’s Report Card, Mathematics 2005 and 1996. Washington, D.C.: U.S. Department of Education. http://nces.ed.gov/nationsreportcard/nde (accessed 3/15/06). Description This indicator measures the percentage of public school eighth graders who are eligible for free or reduced-price lunch and whose performance on the National Assessment of Educational Progress (NAEP) exam in math was “proficient” or “advanced.” Notes Academic proficiency levels are determined by the National Assessment Governing Board, based on judgments about what students should know and be able to do. Improvement over time was measured from 1996 to 2005. Data Availability All 50 states participated in the 2005 assessment.
17
K–12 STUDENT ACHIEVEMENT: Number of scores in the top 20% nationally on SAT/ACT college entrance exams per 1,000 high school graduates Sources Test scores The College Board. “College-Bound Senior Data Sets—SAT I Composite Scores,” 2005 and 1993, unpublished data obtained from the College Board. ACT. “Frequency and percent of students who had ACT composite scores at or above 26,” 2005 and 1993, unpublished data obtained from the ACT. Public and private high school graduates 2004–05 and 1992–93 Western Interstate Commission for Higher Education. Knocking at the College Door: Projections of High School Graduates by State, Income and Race/Ethnicity 1988–2018. Boulder, CO: 2004. Description This indicator reflects the prevalence of college entrance exam-taking throughout the state as well as the achievement level of the students who took these tests. The high achievement level on the college entrance exams demonstrated by recent high school graduates is calculated using the following formula:
Numerator: (Number of scores at or above 1200 on SAT I [verbal and math] test) + (Number of scores at or above 26 on ACT test). Denominator: Number of public and private high school graduates in a given year.
Notes Nationally, 22% of test scores were at or above 1200 on the SAT in 2005. Students attaining a score of 1200 or higher approximate the top quintile (20%) of SAT scores. Though the ACT exams are administered independently and use a different scoring methodology than that used by the College Board for the SAT, a common conversion method can be applied. A score of 26 on the ACT is equivalent to a score of 1200 on the SAT. The National Educational Longitudinal Study (NELS: 88) indicates that 15% of high school seniors take both the SAT and the ACT, although data are not collected in such a way as to provide an unduplicated count of test-takers. This indicator measures not the number of test-takers in each state, but the number of test scores for each state that are among the top 20% nationally. Constructed this way, the measure estimates the number of high school graduates demonstrating a high performance on the college preparatory exams.
The SAT scores for 1993 and 2005 are comparable. The College Board introduced a recentering system in 1995, which ensures that the levels of proficiency represented by scores are consistent among different editions of the SAT. The data used in the report card have been made comparable, after taking into account the effect of recentering. Data Availability Data are available for all 50 states.
18
K–12 STUDENT ACHIEVEMENT: Number of scores that are 3 or higher on an Advanced Placement subject test per 1,000 high school juniors and seniors Sources The College Board. 2005 State and National Annual Summary Reports. New York. www.collegeboard.com/student/testing/ap/exgrd_sum/2005.html (accessed 10/15/05); “The number of scores of 3 or above, 1993, by state,” unpublished data obtained from the College Board. Description This indicator measures the number of Advanced Placement subject tests taken by 11th and 12th grade students with scores of 3 or higher per 1,000 11th and 12th grade students enrolled in public and private schools. The measure uses the following calculation:
Numerator: Number of 11th and 12th graders’ Advanced Placement subject test scores of 3, 4, or 5. Denominator: Total 11th and 12th graders enrolled in public and private schools.*
* The number of 11th and 12th graders enrolled in public and private schools was computed by multiplying the
public enrollment by a private-enrollment adjustment factor developed by a data contractor working with the College Board. The majority of AP test-takers are enrolled in these grades.
Notes This ratio does not provide information on the number of students in each state who take an advanced placement test. Instead, the numerator measures the total number of scores at or above 3. Constructed this way, the measure accounts for individual students who perform proficiently on more than one AP subject test. Scores at or above 3 are generally recognized for college credit.
Opportunities other than AP exist for high school students to take college-level courses, including the International Baccalaureate (IB) program and college concurrent enrollment programs. The Advanced Placement program offered by the College Board is the most prevalent in U.S. high schools and the most widely recognized for credit by policymakers and colleges and universities. Data Availability Data are available for all 50 states.
19
TEACHER QUALITY: 7th to 12th graders taught by teachers with a major in their subject Sources National Center for Education Statistics. Schools and Staffing Survey, 1999–2000 and 1990–91. Washington D.C.: U.S. Department of Education. Richard Ingersoll (Associate Professor, University of Pennsylvania) assisted in designing the indicator and provided state-level analysis and data. Description This new indicator measures the percentage of secondary school students taught by teachers who have an undergraduate or graduate major in the field during the 1999–2000 or the 1990–91 school year. Adequately qualified teachers, especially at the secondary education level and especially in the core academic fields, ought to be knowledgeable about the subject that they teach. The completion of a college degree in the subject field is indicative of possessing minimum subject knowledge required to be a qualified teacher. Notes The measure looks at public school students (charter schools included) enrolled in core academic fields—that is, math, English, social studies, and science. Also, only departmentalized teachers are included; teachers who teach multiple subjects to the same class all day, as common in elementary schools, are excluded. The definition of “a major in their subject” is fairly broad: both undergraduate- and graduate-level degrees, and both academic and education degrees are counted (for instance, a degree in math or in math education), as most subject-area education degrees require substantial coursework in an academic field; a degree in related fields is also counted (see table, next page). This indicator has not been updated since the 2004 report card, because the more recent survey data are not yet available for state-by-state analysis. Data availability Data are available for all 50 states.
20
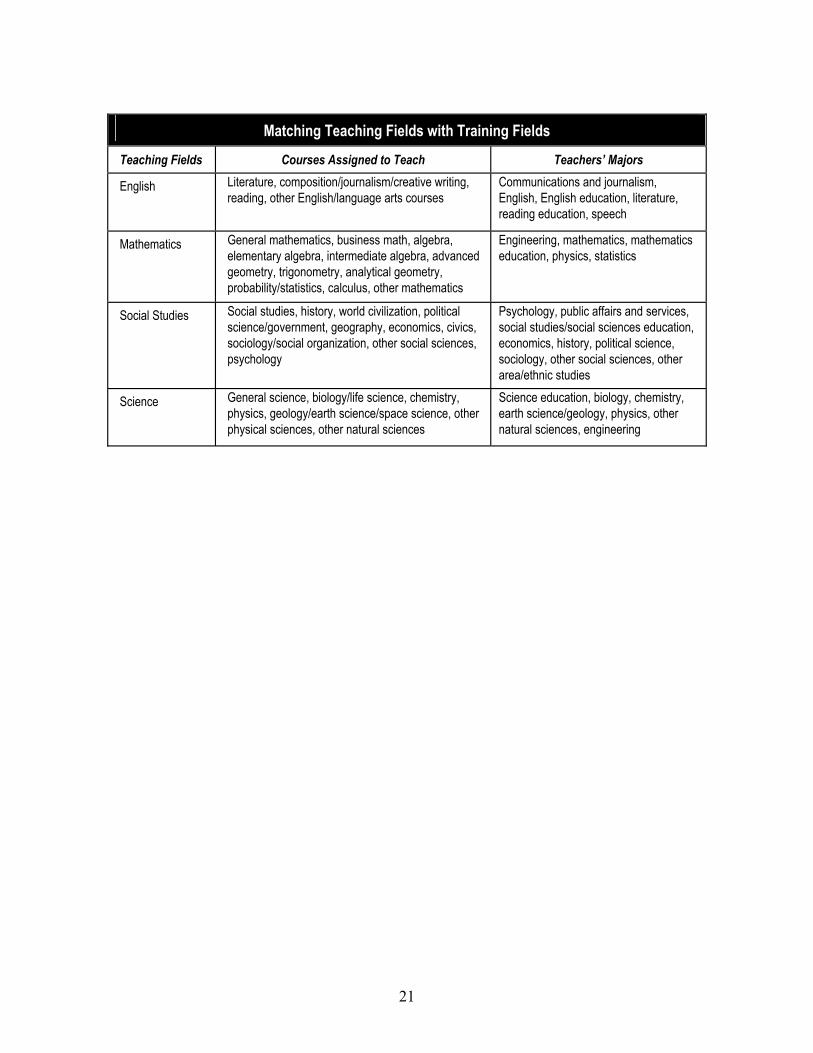
Matching Teaching Fields with Training Fields
Teaching Fields Courses Assigned to Teach Teachers’ Majors
English Literature, composition/journalism/creative writing, reading, other English/language arts courses
Communications and journalism, English, English education, literature, reading education, speech
Mathematics General mathematics, business math, algebra, elementary algebra, intermediate algebra, advanced geometry, trigonometry, analytical geometry, probability/statistics, calculus, other mathematics
Engineering, mathematics, mathematics education, physics, statistics
Social Studies Social studies, history, world civilization, political science/government, geography, economics, civics, sociology/social organization, other social sciences, psychology
Psychology, public affairs and services, social studies/social sciences education, economics, history, political science, sociology, other social sciences, other area/ethnic studies
Science General science, biology/life science, chemistry, physics, geology/earth science/space science, other physical sciences, other natural sciences
Science education, biology, chemistry, earth science/geology, physics, other natural sciences, engineering
21
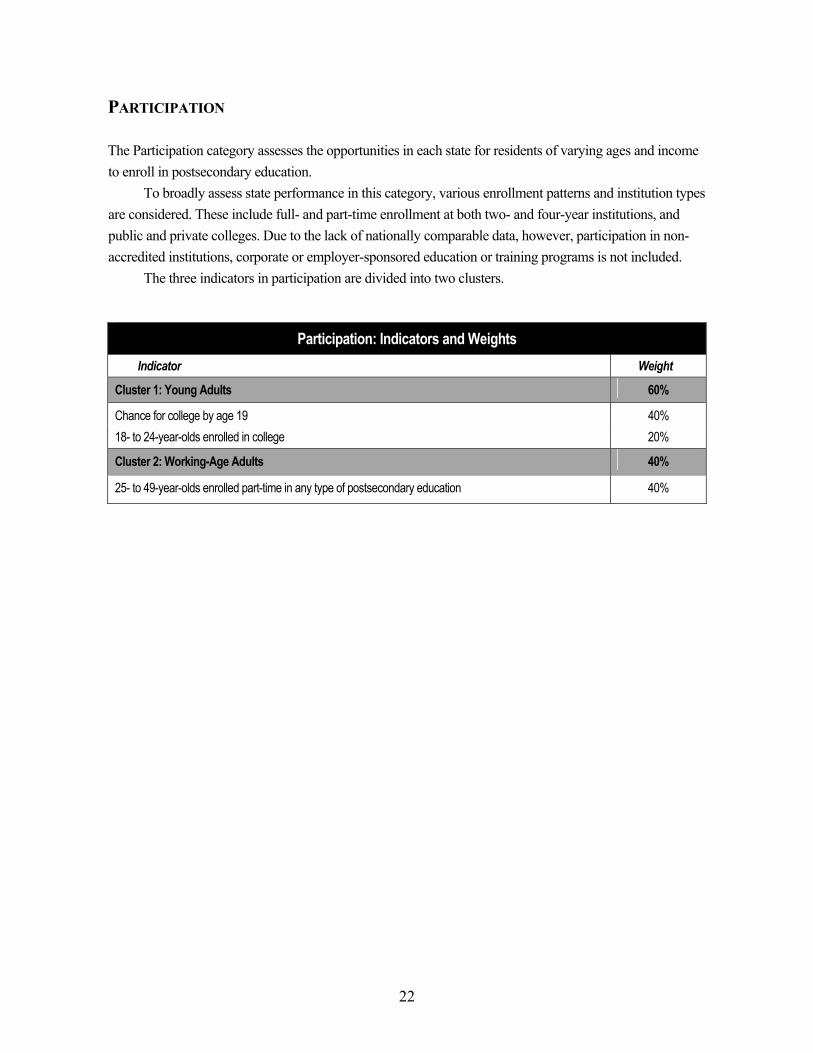
PARTICIPATION The Participation category assesses the opportunities in each state for residents of varying ages and income to enroll in postsecondary education.
To broadly assess state performance in this category, various enrollment patterns and institution types are considered. These include full- and part-time enrollment at both two- and four-year institutions, and public and private colleges. Due to the lack of nationally comparable data, however, participation in non-accredited institutions, corporate or employer-sponsored education or training programs is not included.
The three indicators in participation are divided into two clusters.
Participation: Indicators and Weights Indicator Weight
Cluster 1: Young Adults 60%
Chance for college by age 19 40% 18- to 24-year-olds enrolled in college 20%
Cluster 2: Working-Age Adults 40%
25- to 49-year-olds enrolled part-time in any type of postsecondary education 40%
22

YOUNG ADULTS: Chance for college by age 19 Sources Thomas Mortenson. “Chance for College by Age 19 by State in 2002” and “Chance for College by Age 19 by State in 1992.” Postsecondary Education Opportunity Web site accessible to subscribers, http://www.postsecondary.org/SpreadsheetsPW/ChanceCollegeAge19.xls (accessed 8/15/06). Description This indicator measures the probability that ninth grade students will finish high school within four years and go on to college immediately after high school (when most students are approximately age 19). To calculate this measure, the high school completion rate is multiplied by the college continuation rate. The following formulas describe the components of this calculation.
High School Completion Rate* Numerator: Number of public high school graduates in 2002. Denominator: Number of public school ninth graders in 1998.
College Continuation Rate*
Numerator: Number of college freshmen in 2002. Denominator: Number of public high school graduates in 2002.
* Data for all components are from National Center for Education Statistics, Washington, D.C.: U.S.
Department of Education.
This indicator adjusts for inter-state migration by using the NCES residence and migration survey, which follows high school graduates to the institutions they chose to attend. Since many students pursue their college education out-of-state, the calculation relates college freshmen (by state of residency) to the state data on high school graduates. Note This is a synthetic cohort statistic that cannot adjust for students’ out-of-state migration during the high school years. No nationally comparable longitudinal data exist that precisely measure the college-going rate of ninth grade students in each state. Additionally, due to data reporting problems in several states with regard to college continuation rates, the data for 2000 were applied for Delaware, Rhode Island, and Kansas. Data Availability Data are available for all 50 states.
23
YOUNG ADULTS: 18- to 24-year-olds enrolled in college Sources U.S. Bureau of the Census. Current Population Survey. October 2002, 2003, and 2004 Supplements; October 1990, 1991, and 1992 Supplements. Washington, D.C. State-level data for 2002–04 were provided by Research Triangle Institute, 2006. Data for 1990–92 were provided by Pinkerton Computer Consultants, 2004. Description This indicator reports the percentage of 18- to 24-year-old adults who are currently enrolled in education and training programs beyond high school. Including both full-time and part-time enrollment, the indicator is calculated using the following formula:
Numerator: Number of adults ages 18 to 24 currently enrolled in grades 13 to 17 who have not yet attained baccalaureate degrees. Denominator: Total number of adults ages 18 to 24.
Note Students already holding a baccalaureate degree and returning for additional or different credentials are not included in this figure. Data Availability This indicator pools three years of the most current data, 2002 to 2004 (and 1990 to 1992), to obtain a large enough sample size to make reliable state estimates and to account for aberrations in any single year of data. Data are available for all 50 states.
24
WORKING-AGE ADULTS: 25- to 49-year-olds enrolled part-time in any type of postsecondary education Sources Population enrolled National Center for Education Statistics. Fall Enrollment Survey, 2003 and 1993. Washington, D.C.: U.S. Department of Education. Fall 2003 state-level data provided by Research Triangle Institute, 2006. Fall 1993 state-level data provided by Pinkerton Consultants, 2004. Population U.S. Bureau of the Census. Current Population Survey. October 2002, 2003, and 2004 Supplements; October 1992, 1993, and 1994 Supplements. Washington, D.C. State-level data for 2002–04 were provided by Research Triangle Institute, 2006. Data for 1990–92 were provided by Pinkerton Computer Consultants, 2004. Description This indicator measures the percentage of 25- to 49-year-old adults with a high school credential who are currently enrolled part-time in an institution of higher education. The following calculation is used:
Numerator: Population of adults ages 25 to 49 with at least a high school credential who are currently enrolled part-time in an institution of higher education. Denominator: Population of adults ages 25 to 49 with at least a high school credential.
Notes This indicator focuses on part-time enrollment to assess the opportunities for working-age adults in each state to participate in postsecondary education. It includes both undergraduate- and graduate-level enrollments.
The 1991 enrollment survey data have a large number of age-unknown responses. Since this type of data are available every two years, the 1993 data are used instead, in order to measure improvement over time. Data Availability Data are available for all 50 states.
25
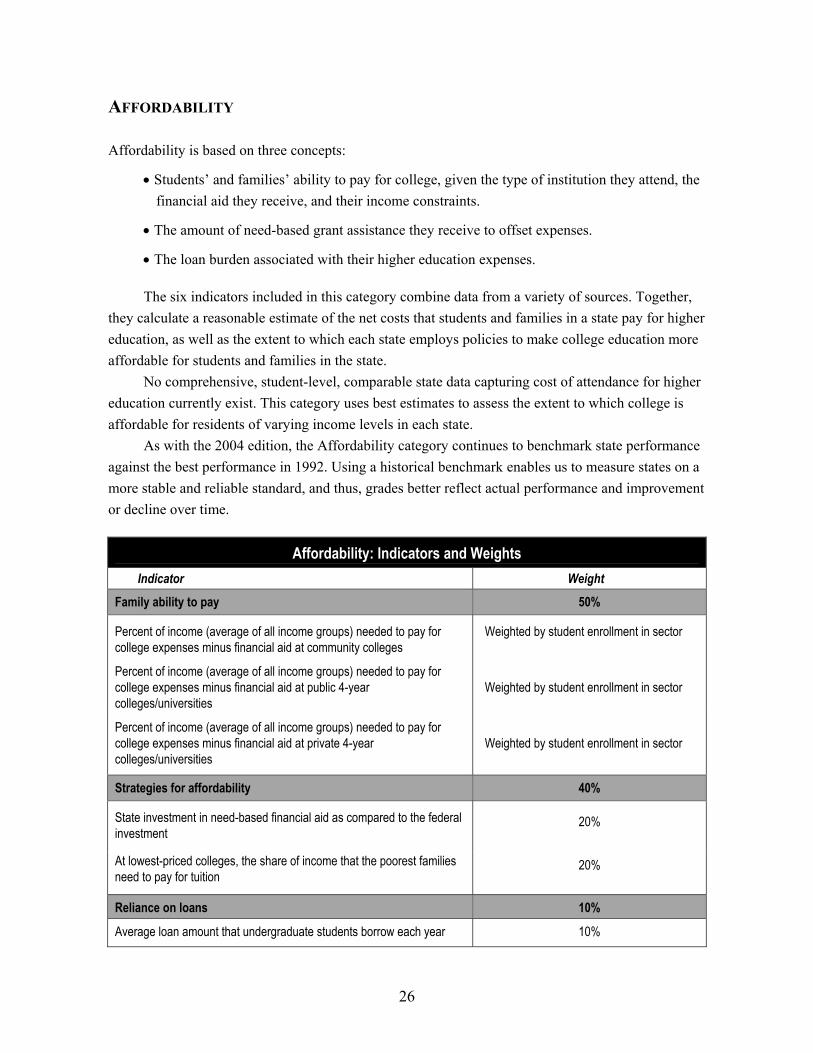
AFFORDABILITY Affordability is based on three concepts:
• Students’ and families’ ability to pay for college, given the type of institution they attend, the financial aid they receive, and their income constraints.
• The amount of need-based grant assistance they receive to offset expenses.
• The loan burden associated with their higher education expenses.
The six indicators included in this category combine data from a variety of sources. Together, they calculate a reasonable estimate of the net costs that students and families in a state pay for higher education, as well as the extent to which each state employs policies to make college education more affordable for students and families in the state. No comprehensive, student-level, comparable state data capturing cost of attendance for higher education currently exist. This category uses best estimates to assess the extent to which college is affordable for residents of varying income levels in each state. As with the 2004 edition, the Affordability category continues to benchmark state performance against the best performance in 1992. Using a historical benchmark enables us to measure states on a more stable and reliable standard, and thus, grades better reflect actual performance and improvement or decline over time.
Affordability: Indicators and Weights
Indicator Weight Family ability to pay 50%
Percent of income (average of all income groups) needed to pay for college expenses minus financial aid at community colleges
Weighted by student enrollment in sector
Percent of income (average of all income groups) needed to pay for college expenses minus financial aid at public 4-year colleges/universities
Weighted by student enrollment in sector
Percent of income (average of all income groups) needed to pay for college expenses minus financial aid at private 4-year colleges/universities
Weighted by student enrollment in sector
Strategies for affordability 40% State investment in need-based financial aid as compared to the federal investment
20%
At lowest-priced colleges, the share of income that the poorest families need to pay for tuition
20%
Reliance on loans 10%
Average loan amount that undergraduate students borrow each year 10%
26
FAMILY ABILITY TO PAY: Percent of income (average of all income groups) needed to pay for college expenses minus financial aid:
at community colleges at public 4-year colleges/universities at private 4-year colleges/universities
Sources Tuition and room and board for the academic year 2005–06 National Center for Higher Education Management Systems’ special analysis, using preliminary data from IPEDS Peer Analysis System, National Center for Education Statistics, 2006. Tuition and room and board for the academic year 1992–93: National Center for Education Statistics. Digest of Education Statistics 1994. Washington, D.C.: U.S. Department of Education, 1995. Pell grants 2004–05 and 1992–93 Office of Postsecondary Education. Title IV/Pell Grant End of the Year Report 2004–05 and 1992–93. Washington, D.C.: U.S. Department of Education, 2006, 1994. Institutional aid 2003 National Center for Higher Education Management Systems’ special analysis, based on the data from “Student Financial Aid Survey, Fall 2003,” IPEDS Peer Analysis System, National Center for Education Statistics, 2006. Institutional aid 1992–93 National Center for Education Statistics. Digest of Education Statistics 1994. “Current Fund Revenue and Expenditures of Institutions of Higher Education by Selected Categories and State, Fiscal Year 1993.” Washington, D.C.: U.S. Department of Education, 1995. Median family income by quintile 2003–05 and 1991–93 U.S. Bureau of the Census. Current Population Survey. 2003, 2004, 2005 March Supplements; 1991, 1992, and 1993 March Supplements. State-level data for 2003–05 were provided by Research Triangle Institute, 2006. Data for 1991–93 were provided by Pinkerton Computer Consultants, 2004. Average financial aid by family income 2003–2004 and 1993–94 National Center for Education Statistics. National Postsecondary Student Aid Survey 2003–04 and 1993–94. Washington, D.C.: U.S. Department of Education. Data Analysis System Variables: PELLAMT, INGRTAMT, STATNEED, STATNOND, TOTGRT By CINCOME. Filtered by institution level and control for public two-year, public four-year, and private four-year.
27
State grants (need- and non-need-based) 2005–06 National Center for Higher Education Management Systems, “Annual Survey of State Grant Aid Programs for Academic Year 2005–06,” 2006. State grants (need- and non-need-based) for the academic year 1992–93 National Association of State Student Grant and Aid Programs. Annual Survey, 1992–93 Academic Year. Albany, NY: 1994. Full-time equivalent enrollment 2004–05 National Center for Higher Education Management Systems’ special analysis, using preliminary data from IPEDS Peer Analysis System, National Center for Education Statistics, 2006. Full-time equivalent enrollment 1992–93 National Center for Education Statistics. Digest of Education Statistics 1994. Washington, D.C.: U.S. Department of Education, 1994. Description College affordability is based on institutional price, the adequacy of state effort to meet students’ financial need, and students’ personal or family income. The ability-to-pay indicator examines the interaction of these important factors given (1) the variation in the percentage of personal income that families of different means must pay to meet college costs, and (2) the variations in price across the public/private and two- and four-year sectors.
To assess state performance reliably and comparably, this indicator is based on a set of assumptions and a series of calculations that use a combination of national- and state-level data. The first set of calculations determines the approximate net cost of college attendance, taking into account federal, state, and institutional financial aid. The second set of calculations relates this net cost to families’ annual income and takes into account the share of total enrollment at each of the major sectors in higher education in the state: community colleges, public four-year colleges and universities, and private four-year colleges and universities. Components of Net College Cost Tuition and fees The average tuition and fees (for in-state residents) are calculated by state for each of the major sectors in higher education: community colleges, public four-year colleges and universities, and private four-year colleges and universities. This calculation assumes average tuition and fees for each sector charged to the full-time student. Room and board The federal government adds the cost of housing, food, and other necessary living expenses to tuition and fees when determining a student’s cost of attendance at a particular institution. This indicator
28
calculates average room and board fees by state and by type of institution. This calculation assumes that average cost of living expenses at public four-year colleges in the state are the same as those incurred by students attending the state’s public two-year community colleges. This assumption is made in part to account for living expenses that must be paid by all students, whether they live on campus or not. Federal financial aid Average federal financial aid by state is calculated as the average Pell grant per full-time equivalent enrollment (FTE), by state. Pell grants are by far the largest component of federal grant aid. State financial aid States offer need- and non-need-based financial aid for college attendance. Average state need- and non-need-based grant aid is calculated per FTE. Institutional financial aid Institutions offer scholarships, fellowships, and tuition discounts to support undergraduate college attendance. Average institutional financial aid by state is calculated by examining the reported average institutional aid received by students in each sector of higher education in each state. Sector-wide averages are calculated as an enrollment-weighted average of average aid awarded at all institutions in the sector. The new source of data we used has updated the institutional aid information substantially. However, the data are collected for first-time, full-time, degree-seeking students only (not all undergraduates). Due to the absence of current data for all undergraduates, the average freshman award is assumed to be the average institutional aid for all undergraduates. Average financial aid by family income Average financial aid awards mask the deliberateness of policies to target aid at different student populations. Without student unit records available at the state level to provide precise amounts of financial aid received, estimates must be calculated.
These estimates are based on the average financial aid received by students, nationally, in each income quintile. For each type of major financial aid (federal, state, institutional), the average aid amounts received by students in five income groups are calculated, using data from the U.S. Department of Education’s National Postsecondary Student Aid Survey. By dividing this average aid of each income group by the national average aid per FTE, the percentage of aid awarded to each income group is calculated for each type of financial aid. These percentages then are multiplied by the average aid per FTE in each state for each type of aid. These calculations assume that students receive the same percentage of available aid in every state, but the actual amount of financial aid for students in each income quintile will vary by state because the size of the average award varies by sector and by state.
29
Net college cost in each sector Average net cost of attendance in each sector of higher education is calculated by subtracting total average financial aid received (federal + state + institutional) from average expenses (tuition + fees + room + board). While students and their families incur the same expenses in a given sector regardless of income, they receive different amounts of financial aid depending on their income level. Therefore, the net college costs differ for each family income quintile in the state. The Role of Family Income The ability to pay for college is based both on the net cost and the resources available to pay the cost. By state, net cost at each of the major sectors is calculated as a percentage of median family income in each quintile. The results of these calculations are estimates of the amount of family income required by low-income, middle-income, and high-income families to attend college in each of the state’s major sectors.
To estimate affordability for all families in each sector, ability to pay is estimated for families in each income quintile. The average of these five income quintile estimates becomes the state average for each sector as shown below:
• Ability to pay for a technical or community college, all families in the state. • Ability to pay for a public four-year college or university, all families in the state. • Ability to pay for a private four-year college or university, all families in the state.
These three measures are cumulatively worth 50% of the affordability grade, but the weight assigned to each sector differs by the share of total full-time equivalent enrollment that each sector in the state comprises. This final step ensures that college affordability is determined not only by the state’s efforts to make one sector affordable for all of its residents, but also by the state’s policies to make its most-utilized institutions affordable.
In each state report card, the table entitled “A Closer Look at Family Ability to Pay” shows family income, net college costs, and net costs as a share of income for each of the five income groups. The table also presents information for the “40% of the population with the lowest income,” which is computed by averaging the figures for the two lowest income quintiles. Notes The most precise way to measure students’ ability to pay would be to analyze student-unit record data. While such records are available for national indicators of affordability, it is not possible to develop reliable and comparable indicators from these sources that attest to the level of affordability in each of the 50 states.
Comparable income data on the students enrolled in each sector are not available by state. As a result, this calculation measures the ability of all state residents to pay for college, regardless of whether or not they enroll in a postsecondary institution. Data Availability Data are available for all 50 states.
30
STRATEGIES FOR AFFORDABILITY: State investment in need-based financial aid as compared to the federal investment Sources Pell grants 2004–05 and 1992–93 Office of Postsecondary Education. Title IV/Pell Grant End of the Year Report 2004–05 and 1992–93. Washington, D.C.: U.S. Department of Education, 2006, 1994. State grants (need- and non-need-based) 2005–06 National Center for Higher Education Management Systems. “Annual Survey of State Grant Aid Programs for Academic Year 2005–06” (unpublished data). Boulder, CO: 2006. State grants (need- and non-need-based) 1992–93 State Student Grant and Aid Programs. Annual Survey, 1992–93 Academic Year. Albany, NY: National Association of State Student Grant and Aid Programs, 1994. Description This indicator measures states’ commitment to provide aid for low-income students as compared to the federal contribution. The indicator is calculated using the following formula:
Numerator: Total amount of state need-based aid awarded to undergraduate students. Denominator: Distribution of Pell grant aid by state of residence of students.
Without having data to measure precisely the expected family contribution and amount of
unmet need for students in each state, this indicator is a proxy measure for (1) how well the state targets aid to families with the greatest need, and (2) how much need-based aid is made available to all students. Notes It is assumed that the state’s methodology for awarding state need-based aid is similar enough to the federal methodology that the students awarded need-based aid in the state are the same students covered by the federal Pell grant program. This may or may not be true in all cases. Due to data limitations, whether the two types of financial aid are actually benefiting the same students cannot be determined.
Data for state grant aid now reflect the past year, while the most current data on Pell grants are still two years old. Although the state and Pell grant data do not refer to the same year, the indicator is now measured with more up-to-date data on state grants. The state grant aid data for New York reflect the TAP expenditures for 2004–05 and part-time student aid appropriations for 2005–06. Data Availability Data are available for all 50 states.
31
STRATEGIES FOR AFFORDABILITY: At lowest-priced colleges, the share of income that the poorest families need to pay for tuition Sources Tuition and fees 2005–06 National Center for Higher Education Management Systems’ special analysis, using preliminary data from IPEDS Peer Analysis System, National Center for Education Statistics, 2006. Tuition and fees 1992–93 National Center for Education Statistics. Digest of Education Statistics 1994. Washington, D.C.: U.S. Department of Education, 1995. Family income for the lowest quintile U.S. Bureau of the Census. Current Population Survey. 2003, 2004, 2005 March Supplements; 1991, 1992, and 1993 March Supplements. State-level data for 2003–05 were provided by Research Triangle Institute, 2006. Data for 1991–93 were provided by Pinkerton Computer Consultants, 2004. Description Tuition levels have been shown to affect whether low-income students choose to go to college. Decisions about overall tuition levels are an important part of the concept of affordability. Creating and preserving low-price options for college is an important state strategy to ensure access for low-income students and families who would otherwise be priced out of higher education. This indicator measures this aspect of affordability with the following formula:
Numerator: The listed tuition and fees for full-time residents at the lowest-priced public institutions in the state. Denominator: The median family income in the lowest income quintile in the state.
Notes The lowest-priced colleges normally are the community colleges. This indicator averages three years of family income data from the most current data available (2003–05) to obtain a large enough sample size to make reliable state estimates and to account for aberrations in any single year of data. Data Availability Data are available for all 50 states.
32
RELIANCE ON LOANS: Average loan amount that undergraduate students borrow each year Sources FFELP loans Office of Postsecondary Education, FFELP Report, AY 2004–05 and AY 1994–95: Total Loan Guarantees for Undergraduates Only. Washington, D.C.: U.S. Department of Education, 2006. Direct loans Office of Postsecondary Education, Direct Loans to Undergraduates, AY 2004–05 and AY 1994–95: Total Loan Guarantees for Undergraduates Only. Washington, D.C.: U.S. Department of Education, 2006. Description Federal loans comprise more than 90% of the funds students borrow to attend college. Thus, this indicator serves as a proxy for annual student loan burden. The following formula is used to calculate the average loan amount that undergraduate students receive from the federal government:
Numerator: Total dollars in FFELP Stafford subsidized, unsubsidized, and PLUS loans made to parents in FY 2005 + Total dollars in William D. Ford Stafford subsidized, unsubsidized, and PLUS loans made to students in FY 2005. Denominator: Total number of loans from both programs.
Note An unduplicated count of the borrowers is not available by state. For this reason, the denominator used may report individual students who take out more than one loan, understating the total average loan amount. Data Availability Data are available for all 50 states.
33
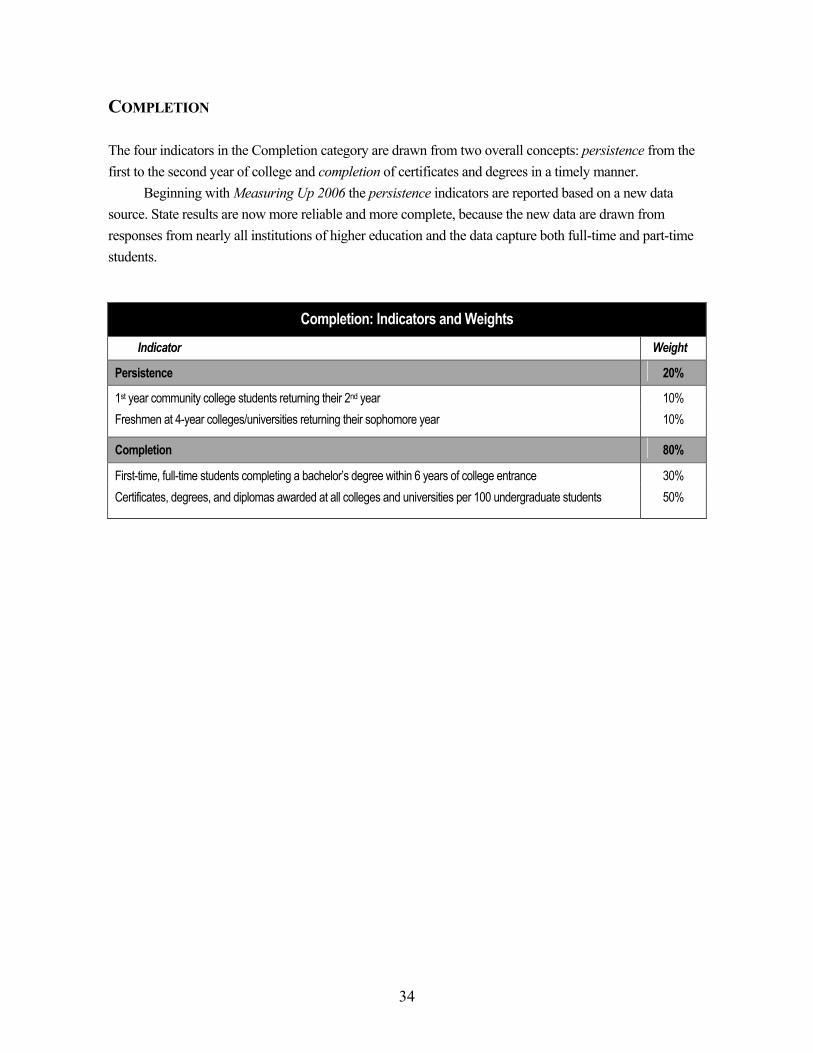
COMPLETION The four indicators in the Completion category are drawn from two overall concepts: persistence from the first to the second year of college and completion of certificates and degrees in a timely manner.
Beginning with Measuring Up 2006 the persistence indicators are reported based on a new data source. State results are now more reliable and more complete, because the new data are drawn from responses from nearly all institutions of higher education and the data capture both full-time and part-time students.
Completion: Indicators and Weights Indicator Weight
Persistence 20%
1st year community college students returning their 2nd year 10% Freshmen at 4-year colleges/universities returning their sophomore year 10%
Completion 80%
First-time, full-time students completing a bachelor’s degree within 6 years of college entrance 30% Certificates, degrees, and diplomas awarded at all colleges and universities per 100 undergraduate students 50%
34
PERSISTENCE: 1st year community college students returning their 2nd year Sources National Center for Higher Education Management Systems’ special analysis based on Enrollment Survey Fall 2003, Enrollment Retention Rate 2004, Institutional Characteristics 2004, IPEDS Peer Analysis System, National Center for Education Statistics, 2006; ACT, “Institutional Data Questionnaires 1990,” unpublished state-level data tabulation provided by the ACT, 2004. Description This indicator measures the first-to-second-year persistence rate for first-time students on two-year campuses. Prior to Measuring Up 2006, the indicator only reported for first-time full-time students due to the data limitation. A better source of data has recently become available, enabling us to capture all first-time students including part-time students. Reported by 1,635 degree-granting two-year institutions (97% response rate), the persistence rate for 2003 represents the 2003 fall cohort (all first-time degree/certificate seeking students) who returned in fall 2004 as either full- or part-time students. The persistence rate is calculated for full-time and part-time students separately and then weighted together by their respective first-time full-time/part-time cohorts to obtain an overall persistence rate. All institutions included in the analysis are Title IV degree granting two-year institutions. Those that did not report the data on retention rate and/or fall 2003 first-time undergraduate enrollments were not included in the analysis; those reported ‘zero’ were considered non-reporting and were not included in the analysis. Notes The indicator results between the previous report cards and the 2006 report card may not be entirely comparable. However, the National Center staff found that the replacement of the data source has no impact on a state’s overall direction of change when improvement over time is assessed for the Completion category. The persistence indicators are included in the analysis of improvement over time. Data Availability Data are available for all 50 states.
35
PERSISTENCE: Freshmen at 4-year colleges and universities returning their sophomore year Sources National Center for Higher Education Management Systems’ special analysis based on Enrollment Survey Fall 2003, Enrollment Retention Rate 2004, Institutional Characteristics 2004, IPEDS Peer Analysis System, National Center for Education Statistics, 2006; ACT, “Institutional Data Questionnaires 1990,” unpublished state-level data tabulation provided by the ACT, 2004. Description Similar to the persistence rate at two-year institutions, this indicator measures the first-to-second-year persistence rate for first-time students on four-year campuses. Prior to Measuring Up 2006, the indicator only reported for first-time full-time students due to the data limitation. A better source of data has recently become available, enabling us to capture all first-time students, including part-time students. Reported by 2,072 degree-granting four-year institutions (82% response rate), the persistence rate for 2003 represents the 2003 fall cohort (all first-time degree seeking students) who returned in fall 2004 as either full- or part-time students. The persistence rate is calculated for full-time and part-time students separately and then weighted together by their respective first-time full-time/part-time cohorts to obtain an overall persistence rate. All institutions included in the analysis are Title IV degree granting four-year institutions. Those that did not report the data on retention rate and/or fall 2003 first-time undergraduate enrollments were not included in the analysis; those reported ‘zero’ were considered non-reporting and were not included in the analysis. Notes Though the data are not entirely comparable between the previous report cards and the 2006 report card, state results for four-year college students are very similar between the old and new sources. Also, the National Center staff found that the replacement of the data source has no impact on a state’s overall direction of change when improvement over time is assessed for the Completion category. The persistence indicators are included in the analysis of improvement over time. Data Availability Data are available for all 50 states.
36
COMPLETION: First-time, full-time students completing a bachelor’s degree within 6 years of enrolling Sources National Center for Educational Statistics. Graduation Rate Survey, 2003–04 and 1996–97. Washington, D.C.: U.S. Department of Education. State-level data obtained from www.higheredinfo.org (accessed 3/8/06). Description Older and full-time working adults constitute a larger proportion of the college student body today, and more students now take longer to complete the baccalaureate degree. By looking at a prolonged time period within which students progress toward the bachelor’s degree, this measure is designed to capture the educational progress of a broader student population. Using preliminary data from the NCES Graduation Rate Survey (GRS), it measures the percent of first-time, full-time students enrolled in a public or private four-year institution who obtain the bachelor’s degree at the institution they entered within six years of enrolling. Notes Part-time students, returning students, and students who transfer to another campus are not captured in this measure. The completion rate may be underestimated for the states where such students are a large part of the student body. The 1996–97 and 2003–04 data are used for the analysis of improvement over time. Data Availability Data are available for all 50 states.
37
COMPLETION: Certificates, degrees, and diplomas awarded at all colleges and universities per 100 undergraduate students enrolled Sources Total awards National Center for Education Statistics. Completion Survey, 2003–04 and 1991–92. Washington, D.C.: U.S. Department of Education. State-level data for 2003–04 were provided by Research Triangle Institute, 2006. Data for 1991–92 were provided by Pinkerton Computer Consultants, 2004. Undergraduate enrollments National Center for Education Statistics. Enrollment Survey Fall 2003 and Fall 1991. Washington, D.C.: U.S. Department of Education. State-level data for 2003 were provided by Research Triangle Institute, 2006. Data for 1991 were provided by Pinkerton Computer Consultants, 2004. Description This indicator uses the following calculation:
Numerator: Total number of certificates, diplomas, associate’s degrees, and baccalaureate degrees awarded throughout the 2003–04 academic year (or 1991–92). Denominator: Full- and part-time undergraduate enrollment in fall 2003 (or 1991).
Note This measure is not a cohort statistic. However, since both the associate’s and the bachelor’s degrees are totaled, this indicator does capture the degree completion of students who transferred from one institution to another. Data Availability Data are available for all 50 states.
38
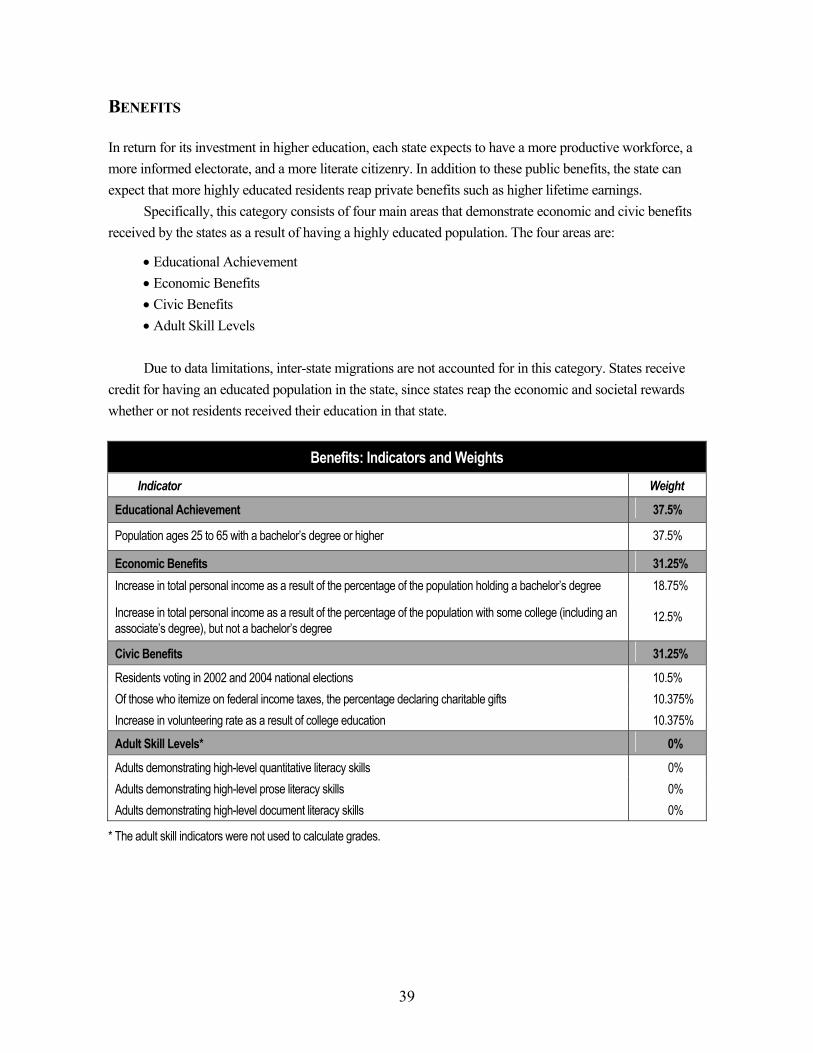
BENEFITS In return for its investment in higher education, each state expects to have a more productive workforce, a more informed electorate, and a more literate citizenry. In addition to these public benefits, the state can expect that more highly educated residents reap private benefits such as higher lifetime earnings.
Specifically, this category consists of four main areas that demonstrate economic and civic benefits received by the states as a result of having a highly educated population. The four areas are:
• Educational Achievement • Economic Benefits • Civic Benefits • Adult Skill Levels Due to data limitations, inter-state migrations are not accounted for in this category. States receive
credit for having an educated population in the state, since states reap the economic and societal rewards whether or not residents received their education in that state.
Benefits: Indicators and Weights
Indicator Weight
Educational Achievement 37.5%
Population ages 25 to 65 with a bachelor’s degree or higher 37.5%
Economic Benefits 31.25% Increase in total personal income as a result of the percentage of the population holding a bachelor’s degree 18.75%
Increase in total personal income as a result of the percentage of the population with some college (including an associate’s degree), but not a bachelor’s degree
12.5%
Civic Benefits 31.25%
Residents voting in 2002 and 2004 national elections 10.5% Of those who itemize on federal income taxes, the percentage declaring charitable gifts 10.375% Increase in volunteering rate as a result of college education 10.375%
Adult Skill Levels* 0%
Adults demonstrating high-level quantitative literacy skills 0% Adults demonstrating high-level prose literacy skills 0% Adults demonstrating high-level document literacy skills 0%
* The adult skill indicators were not used to calculate grades.
39
EDUCATIONAL ACHIEVEMENT: Population ages 25 to 65 with a bachelor’s degree or higher Sources U.S. Bureau of the Census. Current Population Survey. October 2002, 2003, and 2004 Supplements; October 1990, 1991, and 1992 Supplements. Washington, D.C. State-level data for 2002–04 were provided by Research Triangle Institute, 2006. Data for 1990–92 were provided by Pinkerton Computer Consultants, 2004. Description This measure assesses the educational attainment of the working-age population in the state, using the following calculation:
Numerator: Number of adults ages 25 to 65 with at least a baccalaureate degree. Denominator: Number of adults ages 25 to 65 in the state.
Notes This indicator averages three years of the most current data, 2002 to 2004, to account for aberrations in any single year of data. This indicator does not control for inter-state migration. State scores may be higher due to the number of bachelor’s degree holders who have migrated from other states. Data Availability Data are available for all 50 states.
40
ECONOMIC BENEFITS: Increase in total personal income as a result of the percentage of the population holding a bachelor’s degree Sources Median earnings U.S. Bureau of the Census. Current Population Survey. March 2003, 2004, and 2005 Supplements; March 1990, 1991, and 1992 Supplements. Washington, D.C. State-level data for 2003–05 were provided by Research Triangle Institute, 2006. Data for 1990–92 were provided by Pinkterton Computer Consultants, 2004. Adult population with bachelor’s degree or higher U.S. Bureau of the Census. Current Population Survey. October 2002, 2003, and 2004 Supplements; October 1990, 1991, and 1992 Supplements. Washington, D.C. State-level data for 2002–04 were provided by Research Triangle Institute, 2006. Data for 1990–92 were provided by Pinkerton Computer Consultants, 2004. Total personal income Bureau of Economic Analysis. State Personal Income, Annual and Quarterly, for All States and Regions, 2004, and 1992. Washington, D.C.: U.S. Department of Commerce. www.bea.doc.gov/bea/regional/spi/drill.cfm (accessed 3/31/06). Description Statewide economic benefit reflects the average net contribution of baccalaureate degree holders relative to total personal income. This indicator is measured with a three-step mathematical formula. First, this measure calculates the difference in the median earnings between adults whose highest level of education is a high school credential and adults with at least a baccalaureate degree. This earnings differential is then multiplied by the number of adults in the state with a baccalaureate degree. The third step divides this result by total personal income in the state. The following formula is used:
Numerator: Median earnings of population ages 25 to 65 with at least a baccalaureate degree, less median earnings of population ages 25 to 65 whose highest education is a high school credential, multiplied by the number of adults ages 25 to 65 with at least a baccalaureate degree. Denominator: Total personal income in the state.
Notes Personal income is the sum of net earnings adjusted by place of residence, rental income of persons, personal dividend income, personal interest income, and transfer payments. It is measured before the deduction of personal income taxes and other personal taxes and is reported in current dollars (no adjustment is made for price changes). Total personal income is the personal income received by all
41
residents of a state from participation in production, government, and business transfer payments, and accumulated government interest. Earnings of adults who are unemployed or not in the labor force but who have minimal annual earnings are included in the calculation of this measure. Data Availability For earnings and population this indicator averages three years of the most current data, 2003 to 2005 and 2002 to 2004, respectively, to obtain a large enough sample size to make reliable state estimates and to account for aberrations in any single year of data. A state’s total personal income information used in the calculation represents a single year of data. Data are available for each of the 50 states.
42
ECONOMIC BENEFITS: Increase in total personal income as a result of the percentage of the population with some college (including an associate’s degree), but not a bachelor’s degree Sources Median earnings U.S. Bureau of the Census. Current Population Survey. March 2003, 2004, and 2005 Supplements; March 1990, 1991, and 1992 Supplements. Washington, D.C. State-level data for 2003–05 were provided by Research Triangle Institute, 2006. Data for 1990–92 were provided by Pinkterton Computer Consultants, 2004. Adult population with some college or associate’s degree U.S. Bureau of the Census. Current Population Survey. October 2002, 2003, and 2004 Supplements; October 1990, 1991, and 1992 Supplements. Washington, D.C. State-level data for 2002–04 were provided by Research Triangle Institute, 2006. Data for 1990–92 were provided by Pinkerton Computer Consultants, 2004. Total personal income Bureau of Economic Analysis. State Personal Income, Annual and Quarterly, for All States and Regions, 2004, and 1992. Washington, D.C.: U.S. Department of Commerce. www.bea.doc.gov/bea/regional/spi/drill.cfm (accessed 3/31/06). Description This indicator approximates the statewide income benefits associated with those whose education attainment extends beyond a high school credential, but is less than a bachelor’s degree (that is, those holding an associate’s degree or those who attended some type of postsecondary institution but did not obtain the baccalaureate degree). First, the difference in the median earnings between adults whose highest level of education is a high school credential and adults with some college or an associate’s degree is calculated. This earnings differential is then multiplied by the number of adults in the state with some college, or adults holding an associate’s degree. The third step divides this result by total personal income in the state. The following formula is used:
Numerator: Median earnings of population ages 25 to 65 with some college or an associate’s degree, less median earnings of population ages 25 to 65 whose highest education is a high school credential, multiplied by the number of adults ages 25 to 65 with some college or an associate’s degree. Denominator: Total personal income in the state.
Notes Personal income is the sum of net earnings adjusted by place of residence, rental income of persons, personal dividend income, personal interest income, and transfer payments. It is measured before the
43
deduction of personal income taxes and other personal taxes and is reported in current dollars (no adjustment is made for price changes). Total personal income is the personal income received by all residents of a state from participation in production, government, and business transfer payments, and accumulated government interest. Earnings of adults who are unemployed or not in the labor force but who have minimal annual earnings are included in the calculation of this measure. Data Availability For earnings and population this indicator averages three years of the most current data, 2003 to 2005 and 2002 to 2004, respectively, to obtain a large enough sample size to make reliable state estimates and to account for aberrations in any single year of data. A state’s total personal income information used in the calculation represents a single year of data. Data are available for each of the 50 states.
44
CIVIC BENEFITS: Residents voting in 2002 and 2004 national elections Sources U.S. Bureau of the Census. Current Population Survey. November Voting and Registration, 2002 and 2004. Washington, D.C. State-level data tabulated by the National Center staff, using the Census website data tool, http://dataferrett.census.gov (accessed 2/1/06). Description This indicator uses the following calculation:
Numerator: (Number of voters in November 2002 election) + (Number of voters in 2004 election). Denominator: (Voting population* in 2002) + (Voting population in 2004) *Voting population indicates state residents age 18 or above.
Notes Votes cast in local, state, and federal races are included. Due to data limitations, this indicator does not disaggregate the voting rates of residents by level of educational attainment. National studies have shown that voting rates increase with higher levels of educational attainment. This measure is included as a proxy for the civic returns a state enjoys as a result of its more highly educated population. Data Availability Data are available for all 50 states.
45
CIVIC BENEFITS: Of those who itemize on federal income taxes, the percentage declaring charitable gifts Sources Internal Revenue Service. Statistics of Income for Tax Year 2003 and 1992. Annual State Tax Reports. Washington, D.C.: U.S. Department of the Treasury. The 2003 data were obtained from www.irs.gov (accessed 5/1/04). The 1992 data were provided by IRS staff, 2004. Description The charitable giving rate is the number of charitable contributions made by all those tax filers who itemized their tax returns during the 2003 (or 1992) tax year. This indicator uses the following calculation:
Numerator: Number of tax filers itemizing charitable contributions on their 2003 federal tax return. Denominator: Number of state residents filing an itemized federal tax return in 2003.
Notes By monitoring the number of donors, rather than the dollar amount donated, this indicator captures the prevalence of philanthropy among income earners and tax filers in the state. The number of donors in the state serves as a proxy for the residents’ local and regional dollar commitments to public welfare. Due to data limitations, this indicator does not disaggregate the charitable giving rates of residents by level of educational attainment. Annual analyses by the Washington, D.C.-based Independent Sector correlate income to volunteering and describe a direct relationship between educational attainment and charitable giving. The indicator may favor states with wealthier populations, because only those donations large enough to meet tax-deductible criteria are reported. Data Availability Data are available for all 50 states.
46
CIVIC BENEFITS: Increase in volunteering rate as a result of college education Sources U.S. Bureau of the Census. Current Population Survey. September 2003, 2004 and 2005 Supplements. Washington, D.C. State-level data tabulated by the National Center staff, using the Census website data tool, http://dataferrett.census.gov (accessed 4/30/06). Description This indicator addresses the state’s civic benefits resulting from a highly educated population as measured in the area of volunteering. Nationally, the volunteering rate increases with the level of education, according to the Census: 21% of high school graduates volunteer nationally, while 39% of bachelor’s degree holders do so. Similarly, those with some college volunteer at a higher rate than high school graduates. Given differences in volunteering rates by education, this indicator looks at the value added of college education in volunteering rates. Volunteering rates vary among states even at the same educational level, and the extent to which the volunteering rates increase with educational attainment also varies from state to state. The larger the increases by education, the higher the state scores on this indicator. The indicator is measured as the difference in volunteering rates between high school graduates and those with some college. Volunteering rates of each education group are calculated using the following formula:
Volunteering rate for high school graduates Numerator: Number of people, age 18 and above, whose highest education attained is high school and who participated in volunteering activities. Denominator: Total state population, age 18 and above, whose highest education attained is high school.
Volunteering rate for all college educated
Numerator: Number of people, age 18 and above, whose highest education attained is higher than high school and who participated in volunteering activities. Denominator: Total state population, age 18 and above, whose highest education attained is higher than high school.
Notes Due to data limitations, the extent of volunteering is not accounted for in this measure (for example, the number of hours devoted to volunteering throughout the year). Regardless of frequency or regularity of volunteering, only the total numbers of volunteers are counted. This indicator averages three years of the most current data, 2003 to 2005, to account for aberrations in any single year of data. Data Availability Data are available for all 50 states.
47
ADULT SKILL LEVELS (3 Indicators): Adults demonstrating high-level quantitative literacy skills Adults demonstrating high-level prose literacy skills Adults demonstrating high-level document literacy skills About forecasting state performance on the literacy indicators The national survey on adult literacy, administered by the U.S. Department of Education, is updated once every 10 years. The most recent survey, the 2003 National Assessment of Adult Literacy (NAAL), has reported the findings for the nation and five of the six oversample states. However, the detailed data that are necessary for state-level estimates are not yet available. Measuring Up 2006, therefore, shows the state estimates as previously reported in 2004 but does not grade states based on these estimates. These state estimates come from a commissioned study by Stephen Reder (Portland State University).
Stephen Reder’s synthetic estimates are based on the assumption that the statistical relationship between economic and demographic characteristics of state adult population (Census variables) and the level of literacy demonstrated by state adult population (National Adult Literacy Survey: NALS) remain unchanged since the last national survey results from 1992. By updating the states’ economic and demographic variables using the 2000 Census, state estimates were calculated on the percentage of adult population showing high levels of literacy in each of the three areas measured. Direct comparisons can be made from 1990 to 2000 to track state progress in these measures. However, these estimates are not comparable with the state results in the previous report cards.
Among the 1990 and 2000 Census variables, the following variables were considered as predictive of literacy levels and comparable across the 1990 Census, the 1992 NALS, and the 2000 Census and were therefore employed in the modeling:
• Educational attainment (highest grade completed/degree received) • Race (African American) • Hispanic • Speaks English (native language/very well/well/not well/not at all) • Immigration status (immigrated within past five years) • Region of U.S. (four major Census regions) The study found that a considerably larger proportion of the adult population shows high levels
of literacy than they did 10 years ago. However, as cautionary notes, uncertainty exists about predicting the 2000 data, and when newer survey data become available, these estimates will be validated against actual survey results. Also, the predicted 2000 results may be overestimated because demographic changes over the past decade are not well captured by the models. In particular, the effect of aging in the population may have a depressive effect on literacy levels but is not represented in the models.
48
About the literacy indicators Descriptions The adult skill levels indicators measure the percent of the states’ populations whose literacy skills are most similar to the skills of college graduates (level 4 or 5 on a scale of 1 to 5 on the National Adult Literacy Survey, NALS). Three types of literacy skills are measured: quantitative, prose, and document literacy.
Quantitative literacy measures the knowledge and skills required to apply arithmetic operations, either alone or sequentially, using numbers embedded in printed materials. Adults with the highest measured level of quantitative literacy, level 5, can perform multiple arithmetic operations sequentially, and can make inferences about the appropriate operation to perform without prompting from the text.
Prose literacy measures the knowledge and skills needed to understand and use information from texts that include editorials, news stories, poems, and fiction. Adults with the highest measured level of prose literacy, level 5, can find information in dense text with considerable distracting information that might seem plausible but is incorrect.
Document literacy measures the knowledge and skills required to locate and use information contained in materials that include job applications, payroll forms, transportation schedules, maps, tables, and graphs. Adults with the highest measured level of document literacy, level 5, can use complex documents containing distracting information and make high-level inferences. Note Due to data limitations, these indicators do not disaggregate the literacy rates of residents by level of educational attainment. Nevertheless, national studies have shown that literacy is attained through, and associated with, higher levels of educational attainment. Data Availability State estimates are available for 50 states.
49
LEARNING Creating Learning Index Scores for Measuring Up 2006 This section provides technical notes on how NCHEMS staff created the index scores on learning that were included in Measuring Up 2006 (see page 12 of the state report cards). This section has four subsections. The first provides background on the National Forum on College-Level Learning—the project under whose auspices these data were originally aggregated and collected. The second provides an overview of the measures used to create each score. The third reviews in greater detail how the testing data used were collected in each participating state in 2003. The final subsection describes how all these data were converted into the index scores displayed in Measuring Up 2006 and presents these data in a table. Overview and background In Measuring Up 2000, all 50 states were assigned a grade of “Incomplete” in learning because no data existed upon which to compare student learning across states. Strong reaction to the “Incomplete” in learning by policymakers, business leaders, and the media led The Pew Charitable Trusts to create the National Forum on College-Level Learning, which was charged with the task of determining the desirability and feasibility of creating such measures. Initial information-gathering on the topic—including a high-level policy meeting in the fall of 2001—suggested broad consensus on the benefits of moving forward and indicated that initial steps should be taken quickly with existing measures. Accordingly, a template for creating a graded category in learning was created and included in Measuring Up 2002, partially illustrated with data for the state of Kentucky. At the same time, the Forum launched a demonstration project to collect comparable college-level testing data in five selected states—Illinois, Kentucky, Nevada, Oklahoma, and South Carolina. These data were collected in the fall of 2003 and are the basis for the results reported in Measuring Up 2004. With the availability of updated literacy data for a number of states through the National Assessment of Adult Literacy (NAAL) and licensure and graduate admissions test data from all 50 states, partial learning measures using the same methodology could be reported in Measuring Up 2006. Measures used The Learning category was created in a similar manner to the five regular graded categories included in Measuring Up. Like its counterparts, the category consists of several weighted subcategories—each of which is designed to reflect a particular dimension of performance—that can ultimately be combined to yield an overall grade. The Learning category contains three distinct subcategories (subcategory weights are included in parentheses):
1) Abilities of the college-educated population (25%): This subcategory reflects a state’s overall stock of educational capital by examining the proportion of college-educated residents
50
who achieve high levels of literacy. It thus directly addresses the question, “What are the abilities of the college-educated population?” originally posed in Measuring Up 2000. For Measuring Up 2006, the data used were drawn from five states that participated in a state-level over-sample of the National Assessment of Adult Literacy (NAAL) in 2003—Kentucky, Maryland, Massachusetts, Missouri, and New York—for college-educated residents ages 25 to 64. The NAAL assessment poses real-world tasks or problems that require respondents to read and interpret texts (“prose literacy”), to obtain or act on information contained in tabular or graphic displays (“document literacy”), and to understand numbers or graphs and perform calculations (“quantitative literacy”).
2) College and university contributions to educational capital (25%): This subcategory is
intended to reflect the contributions to a given state’s stock of educational capital by examining the proportion of the state’s college graduates (two- and four-year) ready for advanced practice in the form of professional licensure or graduate study. It thus addresses Measuring Up 2000’s original policy question: “To what extent do the state’s public and private colleges and universities educate students to be capable of contributing to the state’s workforce and democratic processes?” For Measuring Up 2006, the measures used were based on available data from 14 existing licensure and graduate admissions examinations for students within each state.
Indices in this subcategory were computed by first defining a particular level of performance on each test that could be used as a benchmark, above which a particular test-taker could be deemed “ready for advanced practice.” In the case of licensure examinations with established national standards, this level was defined as passing the examination and being licensed. In the case of graduate admissions examinations, a criterion score was set at a level generally accepted as “competitive” with respect to gaining admission to a graduate program. The number of individuals achieving this level or higher was then counted. The resulting total number of “graduates ready for advanced practice” from all available licensure and graduate admissions examinations was then divided by the total number of applicable degrees (bachelor’s or associate’s) associated with the credential, and separately reported for nine licensure examinations and five graduate admissions tests. Fields included in the licensures list were nursing, clinical pathology, physical therapy, respiratory therapy, radiology, and physician’s assistant. Admissions examinations included Graduate Record Examination (GRE), the Graduate Management Admissions Test (GMAT), the Medical College Admissions Test (MCAT), the Law School Admissions Test (LSAT), and the Pharmacy College Admissions Test (PCAT). All test scores were obtained directly from national sources.
Highly varied data on teacher licensure are available for most states through published Title II reports. But comparing performances across states is problematic for teacher education because of differing standards in each state, as well as the use of different test batteries. In addition, each state has its own standards for what constitutes a “passing”
51
performance, even if they use the same or similar tests. These difficulties led to the decision to display teacher preparation data separately, instead of aggregating teacher licensure test results together with results for other professional licensing examinations. The “educational capital” measure for teacher education included in Measuring Up 2006 is simply the number of individuals passing licensure examinations in the state, obtained from Title II reports, divided by the number of applicable degrees obtained from the Integrated Postsecondary Educational Data System (IPEDS).
3) Performance of college graduates (50%): This category is intended to reflect how well the
graduates of the state’s two- and four-year institutions can perform complex tasks related to both academic and real-world problem-solving situations. It thus addresses the all-important question of the quality of the state’s higher-education product. Results reported in Measuring Up 2006 are the same as those reported in Measuring Up 2004, based on the five-state demonstration project conducted by the National Forum on College Level Learning. The measures used in this project consisted of two sets of assessments, the Collegiate Learning Assessment (CLA) for four-year students, and the ACT WorkKeys assessment for two-year students.
The CLA is an innovative assessment offered by the Council on Aid to Education (CAE). It goes beyond typical multiple-choice testing by posing multi-faceted tasks—anchored in an academic discipline—that a student is asked to understand and solve. For example, one set of students might be asked to draw a conclusion from a body of presented evidence in biology, while another set might be asked to examine a set of historical conclusions based on original documents, quantitative data, and academic commentary. Still other students are asked to write two extended essays—one to make a persuasive argument on an assigned topic, and another to analyze and refute an argument that they are provided, by attacking its logic and the evidence to support it. The CLA battery used in the five-state demonstration project consisted of two types of assessments—a set of four authentic tasks and a set of two writing prompts drawn from the Graduate Record Examination (GRE). Because they are different kinds of assessments examining essentially different skills, performance was reported separately—“Problem-Solving” for the Tasks and “Writing” for the GRE Prompts. (More information on the CLA assessment is available at http://www.cae.org/content/pro_collegiate.htm).
The ACT WorkKeys principally examines what students can do with what they know. Items on reading comprehension and locating information, for instance, are focused on how well test-takers can extract information from complex documents and instructions, while items on applied mathematics test students’ ability to use mathematical concepts like probability or estimation in real-world settings. The WorkKeys writing assessment also requires students to complete an extended essay. The WorkKeys battery used in Measuring Up 2004 included four tests—applied mathematics, reading for information, locating
52
information, and business writing—and the results of each test are reported separately. (More information on the WorkKeys examinations is available at www.act.org/WorkKeys/).
How testing data were collected Administering the CLA and WorkKeys examinations to students in the five participating states constituted the greatest challenge to developing a learning entry for Measuring Up. Subsections below describe the sampling procedures used to select potential students to participate, how the tests were administered, and the results obtained. Sampling Given the level of funding available, only a limited number of test-takers could be recruited in each state. The original data-collection design for the demonstration project envisioned some 1,200 test-takers for each of the two test batteries in each state. This necessitated using a cluster sampling approach in which a sample of institutions is first drawn, then a sample of students to participate from each institution selected. The sampling approach chosen was a compromise, based on the conflict between the need to attain some degree of statewide representativeness and the desire to include enough test-takers at participating institutions to make it possible for the resulting data to be used for local purposes. The basic sampling plan that emerged in each state thus envisioned about 75 to 100 test-takers at 12 to 15 four-year institutions, and an equivalent number of two-year institutions. In Nevada, where there are only two four-year institutions and four two-year institutions, all were chosen, and the numbers of students targeted for testing at each was higher. And in Kentucky and Oklahoma, all public institutions were invited to participate, and the institutional sampling frame was only used to select private institutions.
In each case where a selection of institutions was made, the universe of applicable institutions (public four-year, private four-year, and two-year) was divided into groups of roughly comparable institutions. Variables used to construct these groups included institutional size, type, disciplinary mix, selectivity, urban/rural location, full-time/part-time ratio, and race/ethnic mix. The resulting sampling groups were then checked by running statistics for various combinations of potential selections within them to ensure that they produced samples that closely resembled statewide distributions on such variables as full-time/part-time breakdown, gender, race/ethnicity, and disciplinary emphasis. The typical result for each state was five to seven distinct groups of institutions within each category of institutions (public four-year, private four-year, and two-year). The first group in each cluster consisted of institutions that were invited to participate. Given the need for flexibility in recruiting institutions, each state was then given the discretion to select a given number of institutions within each sampling group. Sampling groups for each state are included as Appendix 1. The final list of participating institutions from which testing data were obtained is included as Appendix 2.
Once participating institutions were identified, the next step was to randomly select a group of students to be invited to participate in the testing. Accordingly, a set of sample-selection guidelines
53
was developed for use by participating institutions. The target population for sampling included all students officially enrolled in the fall of 2003 expected to complete a two-year or a four-year degree the following spring (identified by numbers of credits or courses completed). Institutions were directed to randomly select an initial sample of students meeting these criteria, together with two backup samples to be used to replace on a matched basis members of the initial group who declined to participate. Institutions were provided with several methods for conducting the random selection procedure and for employing the backup sample. (See Appendix 3 for a copy of the sample-selection guidelines for the WorkKeys examination. The guidelines used for the CLA were similar.) Test administration The CLA and the WorkKeys batteries were administered using protocols supplied by the vendors, customized for use in the demonstration project. The CLA assessments were completed in a Web-based format. Each CLA test-taker completed either one Task or two GRE Prompts. Each CLA test-taker also completed the National Survey of Student Engagement (NSSE), although results of this survey were not included in Measuring Up. The total testing time for the CLA battery was just over two hours. Each WorkKeys test-taker completed a) the Applied Mathematics and the Reading for Information examination or, b) the Locating Information and the Business Writing examination. The tests were completed in a paper-and-pencil format. Each WorkKeys test-taker also completed the Community College Survey of Student Engagement (CCSSE), although results of this survey were not included in Measuring Up. The total testing time for the WorkKeys battery was about one and a half hours. Sampling results The institutional sampling procedure yielded a total of 51 two-year and 60 four-year institutions invited to participate. Of these, 48 two-year and 49 four-year institutions elected to participate. With the exception of Illinois, where the four-year participation rate was only 50%, this level of cooperation yielded a group of institutions that remained broadly representative for each state. Obtaining high levels of student cooperation, however, was a challenge—largely because of lack of incentives to participate. A total of 2,638 students completed the WorkKeys battery across the five states, representing 47.1% of the target sample quota. A total of 2,085 students completed the CLA, representing 34.8% of the target sample quota. (See Appendix 4 for obtained sampling results by state.)
Despite these challenges, both CLA and WorkKeys testing data remained reasonably representative of underlying student populations in each state, from a demographic standpoint, with the exception of gender (see Appendix 5). Women completed both test batteries more frequently than men. There were also isolated instances of race/ethnic imbalance in the test-taking population. In addition, because of test administration difficulties beyond the state’s control that resulted in a badly skewed distribution of tests between the state’s two four-year campuses (as well as unacceptably small numbers of test-takers), CLA results for Nevada could not be used in Measuring Up.
54
The extent to which the test-taking population is representative of each state’s student population on factors such as ability or motivation is, of course, unknown. But this was investigated in several ways. First, an analysis was undertaken to determine if test-taker numbers and cooperation rates at each institution were related to overall performance on the six examinations. Test-taker numbers varied (from a low of eight students to a high of 128) across institutions, and there was no indication that institutions that tested fewer students performed better on any of these tests. Indeed, on the WorkKeys Business Writing test, there was a very slight positive relationship between test-taker numbers and overall performance. While far from definitive, these results suggest that underlying student ability and motivation levels varied little across testing sites. Creating index scores Like the five graded areas in Measuring Up, measures included in the Learning category were converted into index scores in order to allow quite different measures to be aggregated and compared. The basic procedure was very similar to that used in the five graded areas and essentially involved three steps. First, the measures themselves were aggregated or otherwise adjusted (for example, weights applied to test scores to correct known sample biases, or multiple measures aggregated across existing testing data, as described below). Second, all measures were converted to a common index around a benchmark level set at 100. The national average (or in some cases the five-state average) was used to set the benchmark instead of the best-performing state. Finally, differences between each measure and the established benchmark (positive or negative) were calculated and displayed for each state.
Each type of measure, however, required a distinct set of calculations to be performed in order to accomplish the first step in this process: Literacy measures Over-sample results from the National Assessment of Adult Literacy (NAAL), administered in 2003, were available for five states—Kentucky, Maryland, Massachusetts, Missouri, and New York. Reports from each of these states and the nation prepared by NCES provided the percentage of those taking the assessment who scored in the top performance category (“Proficient”) broken down by level of education. These proportions were combined for three categories reported—earning an associate’s degree, a bachelor’s degree, and a graduate degree. The resulting proportions were then divided by the total number of residents of equivalent age and degree attainment in each state and the nation as reported by the Current Population Survey (CPS). Licensure and admissions examinations As noted earlier, data on professional licensure test-score performance were available for Measuring Up 2004 in six fields plus teacher education, and for five commonly used graduate admissions examinations. All these scores were available from national sources for all 50 states and the nation.
55
Before using these data to construct index scores, a number of initial calculations were required to make them comparable:
• Subscore aggregation: For tests with multiple subscores, but no total score, subscores were aggregated to create a single indicator of performance weighting each subscore equally. The same procedure was used to average the number of individuals passing or scoring at or above a particular level where multiple subscores were present.
• Standardizing scores: To adjust for differences in test-score scaling, summary test score
performance data were indexed to a standardized 0–1 value range depending upon the top score possible on a given test (e.g. a GRE score of 450 with a maximum of 800 yields a standardized score of 0.5625).
• Time period aggregation: Up to three years of the most recent data were used in these
calculations to create an “average year.” This approach allowed more data to be used in cases where the number of test-takers in a given state was small. In cases where three years of data were available, data from all three were aggregated and divided by three. In cases where two years were available, these two were combined and divided by two. Where only one year was available, only this most recent year was used.
After these initial adjustments, the resulting data consisted of comparable summary
performance statistics for each test, including number of test-takers, mean and median scores, standard deviation, and number passing or achieving at or above a designated score. From these data, the “graduates ready for advanced practice” indicator was calculated. The following steps were used to create this indicator:
1) Determine the number of individuals ready for advanced practice. For licensure tests, this is the number of individuals passing the examination. For admissions examinations, it is the number of individuals achieving at or above a given “nationally competitive” score (GRE=600, GMAT=600, LSAT=155, MCAT=10, PCAT=215).
2) Determine the appropriate number of graduates associated with each potential test-taking population using IPEDS data. In most cases, these are baccalaureate degrees, but in some cases they are associate’s degrees—and in some cases, both. For teacher examinations, the denominator was the total number of baccalaureate degrees in education plus all other fields of study listed as providing a “qualified” teacher in the teacher quality measure used in the Preparation category. If multiple testing years were present, degree data were aggregated by year to create an “average year.”
3) Create a ratio between these two numbers. This is the “fraction of educational capital” contribution represented by this particular test.
56
4) Sum the resulting fractional contributions to educational capital for each of the five states and the nation.
CLA and WorkKeys data Indicators were created for each of the six tests administered as part of the National Forum on College Level Learning’s five-state demonstration project by calculating the proportion of test-takers scoring at or above a given level on each test. For CLA, this level is based on standardized scores of 25 or above, reported separately for task-based problem-solving and the GRE writing prompts. For WorkKeys, the levels differ because the scales for each of the four tests also differ—high scores are 6 and above for Reading for Information and for Applied Mathematics, 5 and above for Locating Information, and 4 and above for Business Writing. These cut scores were based on conventions roughly established by the NALS, which uses a similar scoring scheme.
Because of the overrepresentation of women in all testing samples, and a few deviations in representativeness with respect to race/ethnicity, all test score data were weighted for each state before calculating index scores. While gender does not affect performance on the CLA, it has a strong effect on WorkKeys Applied Mathematics, and a moderate effect on WorkKeys Locating Information. Race/ethnicity also strongly conditions performance on both the CLA and all four WorkKeys examinations. As a result, a weighting scheme was applied to each state’s aggregate results on both batteries to adjust scores in proportion to the state’s student population on both variables. All of the test data were also weighted by institutional enrollments. Test-takers from a larger institution count more in computing the state’s aggregate score than those from smaller institutions in proportion to how much of the state’s total undergraduate FTE enrollment each represents.
Finally, because the CLA is a new instrument, it has no national norms. And although WorkKeys is nationally administered, the national norms available through ACT are for all test-takers, not just those enrolled in college. Because the demonstration project administered WorkKeys to a college-enrolled sample, the overall performance of these students in all states (and at almost all institutions) was well above ACT’s national norms. Because of these difficulties, race/ethnicity- and gender-weighted results for the CLA and WorkKeys for all of the examinations used in the five-state demonstration project were used as national benchmarks in computing index scores.
57
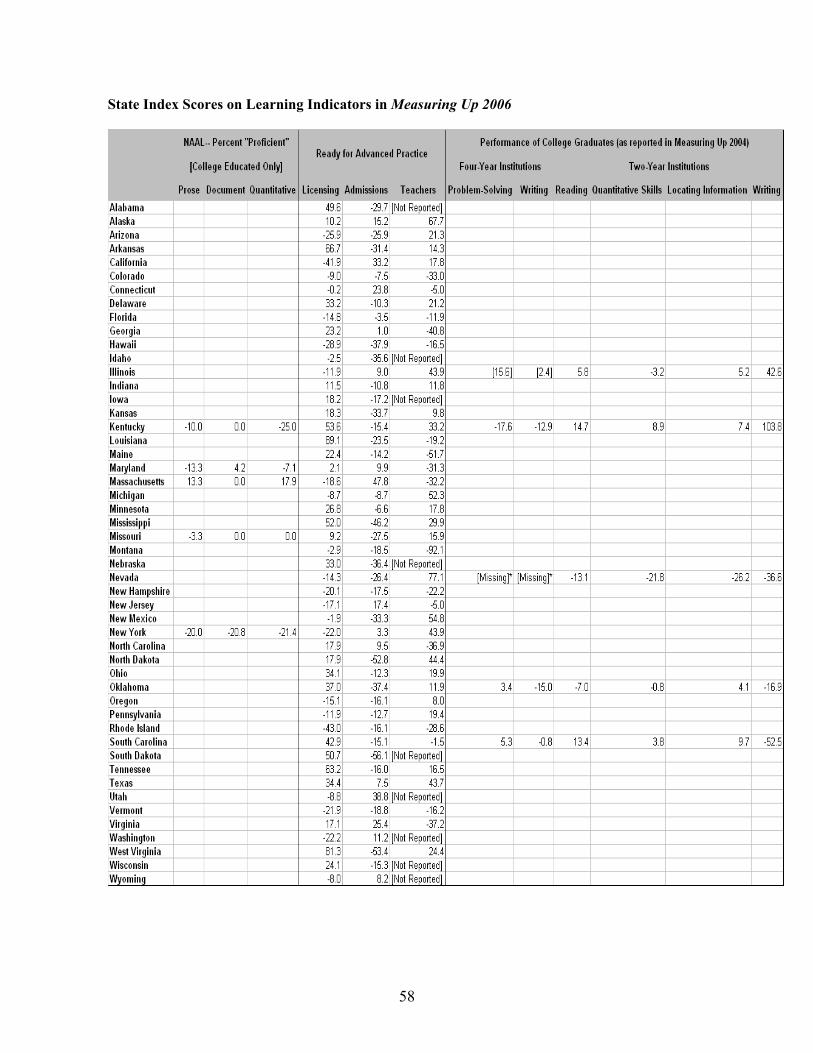
State Index Scores on Learning Indicators in Measuring Up 2006
58
III. Non-Graded Measures
1. OTHER KEY FACTS (IN GRADED CATEGORIES) A. PERFORMANCE GAPS BY RACE/ETHNICITY AND INCOME These measures reveal performance gaps within each state for the indicators presented in Measuring Up 2006. The following list details the indicators and the sources of data for which performance gaps data are available. Data from the early 1990s derive from the same sources. P
reparation: 18- to 24-year-olds with a high school credential
By race/ethnicity B y family income
U.S. Bureau of the Census. Current Population Survey. October 2002, 2003, and 2004 Supplements; October 1990, 1991, and 1992 Supplements. Washington, D.C. October 2002, 2003, and 2004 state-level data provided by Research Triangle Institute, 2006. October 1990, 1991, and 1992 state-level data provided by Pinkerton Computer Consultants, 2004.
reparation: 9th to 12th graders taking at least one upper-level math course P B
y race/ethnicity
Rolf K. Blank and Doreen Langesen. State Indicators of Science and Mathematics Education, 2005: State-by-State Trends and New Indicators from the 2003–04 School Year. Washington, D.C.: Council of Chief State School Officers, 2003, p. 23.
reparation: 9th to 12th graders taking at least one upper-level science course P B y race/ethnicity
Rolf K. Blank and Doreen Langesen. State Indicators of Science and Mathematics Education, 2005: State-by-State Trends and New Indicators from the 2003–04 School Year. Washington, D.C.: Council of Chief State School Officers, 2003, p. 23. P
articipation: 18- to 24-year-olds enrolled in college
By race/ethnicity B
y family income
U.S. Bureau of the Census. Current Population Survey. October 2002, 2003, and 2004 Supplements; October 1990, 1991, and 1992 Supplements. Washington, D.C. October 2002, 2003, and 2004 state-level
59
data provided by Research Triangle Institute, 2006. October 1990, 1991, and 1992 state-level data provided by Pinkerton Computer Consultants, 2004. Completion: Certificates, degrees, and diplomas awarded at all colleges and universities per 100
ndergraduate students u B y race/ethnicity
Total awards National Center for Education Statistics. Completion Survey, 2003–04 and 1991–92. Washington, D.C.: U.S. Department of Education. Completion Survey 2003–04 state-level data provided by Research Triangle Institute, 2006. Completion Survey 1991–92 state-level data provided by Pinkerton Computer Consultants, 2004. Undergraduate enrollment National Center for Education Statistics. Fall Enrollment Survey, 2003 and 1991. Washington, D.C.: U.S. Department of Education. Fall Enrollment Survey 2003 state-level data provided by Research Triangle Institute, 2006. Fall Enrollment Survey 1991 state-level data provided by Pinkerton Computer Consultants, 2004. B enefits: Population ages 25 to 65 with a bachelor’s degree or higher
B y race/ethnicity
U.S. Bureau of the Census. Current Population Survey. October 2002, 2003, and 2004 Supplements; (for data a decade ago) October 1990, 1991, and 1992 Supplements. Washington, D.C. October 2002, 2003 and 2004 state-level data provided by Research Triangle Institute, 2006. October 1990, 1991, and 1992 state-level data provided by Pinkerton Computer Consultants, 2004. B. STUDENTS ENROLLING IN COLLEGE OUT OF STATE (2004)
National Center for Education Statistics. Digest of Education Statistics 2005, “Residence and migration of all freshmen students in degree-granting institutions, by state,” Table 202, Washington, D.C.: The U.S. Department of Education, 2006. C. NET REVENUE LOSS (2005) This measures the loss in annual earnings due to the earnings gaps between whites and ethnic minorities with equal levels of educational attainment. Taking into account the educational attainment gaps as well as earnings gaps between non-Hispanic Whites and all others, David Wright estimates the additional earnings that would be generated if these gaps did not exist. All earnings values
60
presented in the data are in constant 2005 dollars. The estimated additional earnings are measured as a share of state total personal income in order to highlight the loss to the state as a whole. Population, earnings, and educational attainment by race/ethnicity U.S. Bureau of the Census. Current Population Survey, March Annual Demographic Files/Annual Social and Economic Supplements 2003, 2004, and 2005, Washington, D.C. State-level data are provided by David W. Wright (Wichita State University). Total personal income Bureau of Economic Analysis. Per Capita Personal Income 2005, Department of Commerce. http://bea.gov/bea/newsrelarchive/2006/spi0306.xls (accessed 4/6/06).
61
2. INTERNATIONAL COMPARISONS Measuring Up 2006 for the first time introduces international comparisons for all 50 states and for the nation as a whole. This information provides a perspective about how well the nation and the states are developing the knowledge and skills essential for the global economy. As with other data in Measuring Up, the international measures are based on the most current data available. In general, the data for countries are from 2002 or 2003, and the data for the U.S. and 50 states are from 2004. Comparisons are made with the member countries of the Organisation for Co-operation and Economic Development (OECD). Although the Organisation currently has 30 member countries, the data available to compare performance on international indicators vary from one nation to another. International comparisons at the state level are provided for three indicators, which are closely aligned with the Measuring Up indicators. The following list details the international indicators and the data sources. (1) Participation: Percent of 18- to 24-year olds currently enrolled in college Sources For the U.S. and 50 states Enrollment—National Center for Education Statistics, Enrollment Survey, fall 2003. Data tabulated by RTI (Research Triangle Institute). Population—U.S. Bureau of the Census, Current Population Survey. March 2003, 2004, 2005 Supplements. Data tabulated by RTI. For other countries Data are provided by Alan Wagner (State University of New York at Albany), based on the Organisation for Economic Co-operation and Development (OECD) database available at www.oecd.org. Data are for 2003. Description This indicator is closely aligned with the similar indicator in the graded Participation category in Measuring Up. However, this international indicator includes the graduate-level enrollment. It measures the proportion of traditional college-age youth, ages 18 to 24, who are currently enrolled in undergraduate or graduate-level education and training programs, including both full-time and part-time enrollment. The formula used is:
Numerator: Number of adults, ages 18 to 24, enrolled in undergraduate or graduate programs. Denominator: Total number of population, ages 18 to 24.
62
Data Availability For the U.S. and 50 states, the population estimates average three years of the most current data, 2003 to 2005, to obtain a large enough sample size to make reliable state estimates and to account for aberrations in any single year of data. The U.S. data reported to the OECD for its annual statistical report, Education at a Glance, are drawn from the same data source but older data. (The latest data reported for the U.S. by OECD are derived from Current Population Survey, March 2003 Supplement.) Data are available for the 50 U.S. states and 25 countries including the U.S. (2) Completion: Total number of degrees and certificates awarded at all colleges and
universities per 100 undergraduate students enrolled Sources For the U.S. and 50 states Total Awards—National Center for Education Statistics, Completion Survey, academic year 2003–2004. Data tabulated by RTI (Research Triangle Institute). Enrollment—National Center for Education Statistics, Enrollment Survey, fall 2003. Data tabulated by RTI. For other countries Data are provided by Alan Wagner (State University of New York at Albany), based on the Organisation for Economic Co-operation and Development (OECD) database available at www.oecd.org. Data are for 2003. Description Calcuated in the same way as the indicator in the graded Completion category, this measure assesses the total number of undergraduate-level degrees and certificates completed relative to the total number of undergraduates enrolled. It uses the following calculation:
Numerator: Total number of certificates and associate’s and bachelor’s degrees awarded throughout the 2003–04 academic year. Denominator: Total headcount undergraduate enrollment (both full-time and part-time students) in fall 2003.
Note The country data account for the type of awards that are roughly equivalent of the undergraduate-level degrees and certificates in the U.S system. In the OECD classification, these awards are classified as tertiary type A (‘first degrees’ only) and type B programs. And, the enrollment figures do not account for the programs of less than two years duration. For the U.S. and states, data represent all Title IV participating higher education institutions.
63
Data Availability Data are available for all 50 states and 27 countries including the U.S. (3) Benefits: Percent of adult population holding an associate’s degree or higher (younger
adults, ages 25 to 34, in comparisons with older adults, ages 35 to 64) Sources For the U.S. and 50 states U.S. Bureau of the Census, Current Population Survey. March 2003, 2004, 2005 Supplements. Data tabulated by RTI (Research Triangle Institute). For other countries Data are provided by Alan Wagner (State University of New York at Albany), based on the Organisation for Economic Co-operation and Development (OECD) database available at www.oecd.org. Data are for 2003. Description This measure looks at the educational attainment level of working-age population. A similar indicator is included in the graded Benefits category in Measuring Up; however, the graded indicator focuses on the attainment of the bachelor’s degree or higher, whereas the international indicator measures the attainment of associate’s degrees or higher. Also, the international measure highlights the education progress over time by tracing the attainment gaps between two age groups, using the following calculation:
Younger Adults Numerator: Number of adults, ages 25 to 34, holding an associate’s degree or higher Denominator: Number of adults, ages 25 to 34.
Older Adults Numerator: Number of adults, ages 35 to 64, holding an associate’s degree or higher Denominator: Number of adults, ages 35 to 64.
Notes The OECD country data report all tertiary degrees, which are the equivalent of associate’s degrees, bachelor’s degrees, and postgraduate degrees in the U.S. system. Data Availability Data are available for all 50 states and 30 countries including the U.S.
64
3. ADDITIONAL INFORMATION A. STATE CONTEXT State population (2005) U.S. Bureau of the Census, Geographic Comparison Table. factfinder.census.gov (accessed 4/4/06). Gross state product (2004) Bureau of Economic Analysis. Gross State Product in Current Dollars, 2004. http://www.bea.doc.gov/bea/newsrel/gspnewsrelease.htm (accessed 4/4/06). B. LEADING INDICATORS Projected % change in population (2005–2020) U.S. Bureau of the Census, www.census.gov/population/projections/presstab6.xls (accessed 5/30/06). www.census.gov/popest/states/tables/nst-est2005-01.xls (accessed 5/30/06). Projected % change in number of all high school graduates (2002–03 to 2017–18) Western Interstate Commission for Higher Education. Knocking at the College Door: Projections of High School Graduates by State, Income, and Race/Ethnicity, 1988–2018. Boulder, CO: 2004. Projected budget surplus/shortfall, 2005 to 2013 Dennis Jones, “State Shortfalls Projected to Continue Despite Economic Gains,” Policy Alert, February 2006, San Jose, CA: The National Center for Public Policy and Higher Education. Average income of poorest 20% of population (2003–05) U.S. Bureau of the Census. Current Population Survey. March 2003, 2004, and 2005 Supplements. Three-year averages. Washington, D.C. State-level data provided by Research Triangle Institute, 2006. Children in poverty (2004) Annie Casey Foundation. 2006 Kids Count. Baltimore, MD: Annie Casey Foundation, 2006. Percent of population with less than a high school diploma or equivalent (2004) U.S. Bureau of the Census. “Educational Attainment of the Population 25 Years and Over, By State.” Washington, D.C. www.census.gov/population/socdemo/education/cps2004/table13.xls (accessed 6/13/06).
65
New economy index (2002) Progressive Policy Institute. The 2002 State New Economy Index: Benchmarking Economic Transformation in the States. Washington, D.C.: 2002. http://www.neweconomyindex.org/states/2002/overall_rank.html (accessed 6/14/04). C. FACTS AND FIGURES Institutions of postsecondary education (2004–05) Students enrolled by institution type (2004) (undergraduate students only) Students enrolled by level (2004) Enrollment status of students (2004) N
et migration of students (2004)
National Center for Education Statistics. Digest of Education Statistics, 2005. Washington, D.C.: The U.S. Department of Education, 2006. http://nces.ed.gov/programs/digest. A
verage tuition (2005–06)
National Center for Higher Education Management Systems’ special analysis, using preliminary data from IPEDS Peer Analysis System, National Center for Education Statistics, 2006. S
tate and local appropriations for higher education (FY 2006)
Center for Higher Education & Finance. Grapevine: A National Database of Tax Support for Higher Education. Normal, IL: Illinois State University, 2006. Per $1,000 personal income and per capita (FY 2006) data are from www.coe.ilstu.edu/grapevine/table5.html (accessed 3/28/06). Data for percentage change in state appropriations (FY 1996–2006) are from www.coe.ilstu.edu/grapevine/table3.html (accessed 6/16/06).
66
D. WORKING-AGE POPULATION BY RACE/ETHNICITY CHART (1980-2020) U.S. Census Bureau, 5% Public Use Microdata Samples (based on 1980, 1990, and 2000 Census) and U.S. Population Projections (based on 2000 Census). This information is taken from Patrick Kelly, 2005, As America Becomes More Diverse: The Impact of State Higher Education Inequality, The National Center for Higher Education Management Systems, www.higheredinfo.org/raceethnicity/. E. RACIAL GAPS IN EDUCATIONAL LEVELS OF WORKING-AGE POPULATION CHART (2000) U.S. Census Bureau, 5% Public Use Microdata Samples (based on 2000 Census). This information is taken from Patrick Kelly, 2005, As America Becomes More Diverse: The Impact of State Higher Education Inequality, The National Center for Higher Education Management Systems, www.higheredinfo.org/raceethnicity/.
67
Appendix 1
Learning: Institutional Sampling Groups by State
ILLINOIS Public four-year institutions
Group 1: [select all institutions] University of Illinois–Chicago University of Illinois–Urbana/Champaign Group 2: [select two institutions] Illinois State University Northern Illinois University Southern Illinois University–Carbondale Group 3: [select one institution] Eastern Illinois University Western Illinois University Group 4: [select two institutions] Chicago State University Governors State University Northeastern Illinois University Southern Illinois University–Edwardsville University of Illinois–Springfield
Private four-year institutions
Group 1: [select one institution] Northwestern University University of Chicago Group 2: [select one institution] Bradley University DePaul University Illinois Institute of Technology Loyola University
68
McKendree College North Central College Group 3: [select one institution] Augustana College Illinois Wesleyan University Knox College Lake Forest College Monmouth College Wheaton College Group 4: [select one institution] Blackburn College Concordia College East-West University Eureka College Greenville College Illinois College McMurray College Millikin University Olivet Nazarene College Principia College Quincy University Robert Morris College Shimer College Trinity Christian College Group 5: [select one institution] Aurora University Benedictine University Dominican University Elmhurst College Judson College Lewis University North Park University Rockford College University of St. Francis Group 6: [select one institution] Barat College
69
Columbia College DeVry University National Louis University Roosevelt University St. Xavier University
Two-year colleges
Group 1: [select four institutions] College of DuPage College of Lake County Elgin Community College Illinois Central College Joliet Junior College Moraine Valley Community College Oakton Community College Parkland Community College Southwestern Illinois College Triton College William Rainey Harper College Group 2: [select three institutions] Harold Washington College Harry S. Truman College Kennedy-King College Malcolm X College Olive Harvey College Prairie State College Richard J. Daley College South Suburban College Wilbur Wright College Group 3: [select two institutions] Kankakee Community College Lewis and Clark Community College McHenry County College Morton College Richland Community College Rock Valley College Waubonsee Community College
70

Group 4: [select two institutions] Heartland Community College Illinois Valley Community College John A. Logan College Kishwaukee College Lincoln Land Community College Rend Lake College Group 5: [select one institution] Black Hawk College Carl Sandburg College Danville Area Community College Highland Community College Illinois Eastern Community Colleges [all campuses] John Wood Community College Kaskaskia College Lake Land College Sauk Valley Community College Shawnee Community College Southeastern Illinois Community College Spoon River College
KENTUCKY Public four-year institutions
[Include all institutions] Eastern Kentucky University Kentucky State University Morehead State University Murray State University Northern Kentucky University University of Kentucky University of Louisville Western Kentucky University
71
Private four-year institutions
Group 1: [select one if N=100, or select two if N=65] Berea College Centre College Georgetown College Transylvania University Group 2: [select one if N=100, or select two if N=65] Bellarmine University Spalding University Sullivan University Thomas More College Group 3: [select one if N=100, or select two if N=65] Brescia University Campbellsville University Midway College Group 4: [select one if N=100, or select two if N=65] Alice Lloyd College Asbury College Cumberland College Kentucky Christian College Kentucky Wesleyan College Lindsay Wilson College Pikeville College
Public two-year institutions Core group: [Include all institutions] Elizabethtown Community College Jefferson Community College Lexington Community College Paducah Community College Group 2: [select one institution] Ashland Community College Hopkinsville Community College
72
Group 3: [select two institutions] Hazard Community College Prestonburg Community College Somerset Community College Southeast Community College Group 4: [select one institution] Henderson Community College Madisonville Community College Maysville Community College
NEVADA: [All Nevada institutions were included in the project sample] OKLAHOMA Public four-year institutions
Core group: [Include all institutions] Oklahoma State University–Main Campus University of Central Oklahoma University of Oklahoma–Norman University of Science and Arts of Oklahoma Group 2: [select two institutions] East Central University Northeastern State University Northwestern Oklahoma State University Southeastern Oklahoma State University Southwestern Oklahoma State University Group 3: [select two institutions] Cameron University Langston University Oklahoma Panhandle State University
73
Private four-year institutions Core group: [include all institutions] University of Tulsa Group 2: [select one institution] Oklahoma Christian University Oral Roberts University Group 3: [select one institution] Oklahoma Baptist University Oklahoma City University Group 4: [select one institution] Oklahoma Wesleyan University Southern Nazarene University
Public two-year institutions [include all institutions] Carl Albert State College Connors State College Eastern Oklahoma State College Murray State College Northeastern Oklahoma Agricultural and Mechanical College Northern Oklahoma College Oklahoma City Community College Oklahoma State University–Oklahoma City Oklahoma State University–Okmulgee Redlands Community College Rose State College Seminole State College Tulsa Community College Western Oklahoma State College
74

SOUTH CAROLINA Public four-year institutions
Core group: [select all institutions] Clemson University College of Charleston South Carolina State University University of South Carolina, Columbia Group 2: [select three institutions] Coastal Carolina University Francis Marion University University of South Carolina, Aiken University of South Carolina, Spartanburg Winthrop University Group 3: [select one institution] The Citadel Lander University Medical University of South Carolina University of South Carolina, Beaufort
Private four-year institutions
Core group: [select all institutions] Furman University Group 2: [select two institutions] Converse College Erskine College Newberry College Presbyterian College Wofford College Group 3: [select two institutions] Anderson College Charleston Southern University Coker College Columbia College
75
Limestone College Southern Wesleyan University Group 4: [select one institution] Allen University Benedict College Claflin University Morris College Voorhees College
Public two-year institutions
Core group: [select all institutions] Greenville Technical College Midlands Technical College Piedmont Technical College Trident Technical College Group 2: [select five institutions] Aiken Technical College Central Carolina Technical College Horry-Georgetown Technical College Spartanburg Technical College Technical College of the Low Country Tri-County Technical College York Technical College Group 3: [select two institutions] Denmark Technical College Florence Darlington Technical College Northeastern Technical College Orangeburg Calhoun Technical College Williamsburg Technical College
76
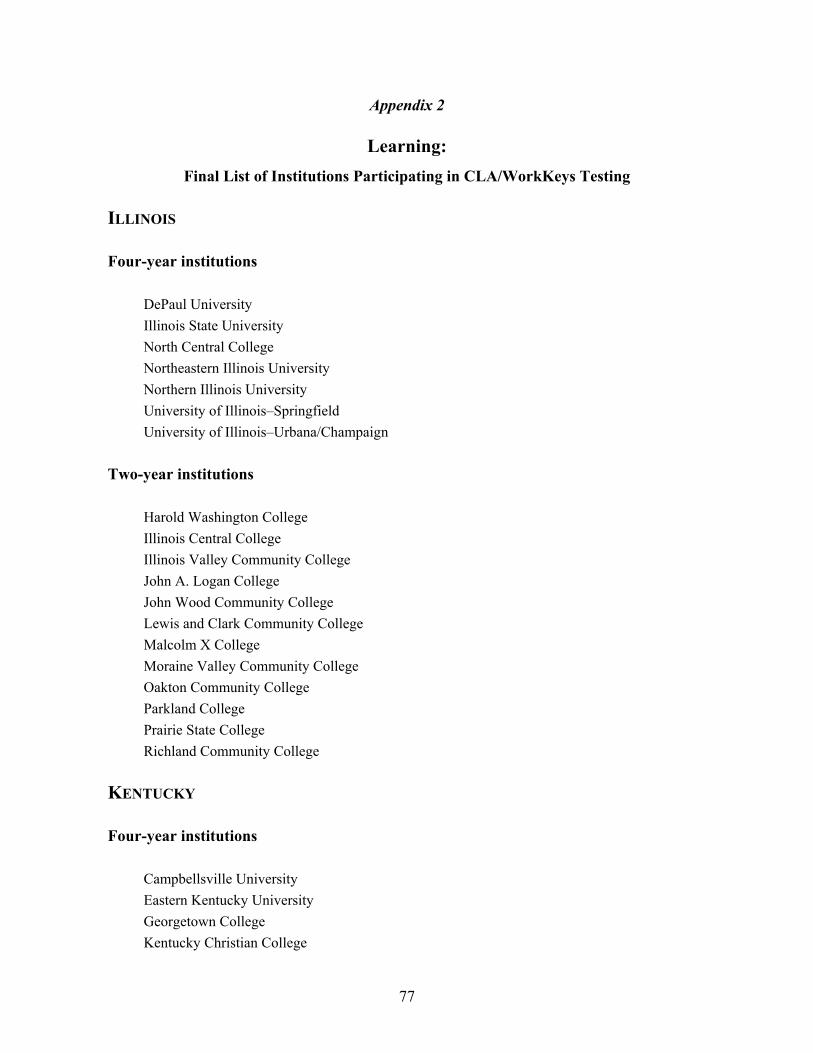
Appendix 2
Learning: Final List of Institutions Participating in CLA/WorkKeys Testing
ILLINOIS Four-year institutions
DePaul University Illinois State University North Central College Northeastern Illinois University Northern Illinois University University of Illinois–Springfield University of Illinois–Urbana/Champaign
Two-year institutions
Harold Washington College Illinois Central College Illinois Valley Community College John A. Logan College John Wood Community College Lewis and Clark Community College Malcolm X College Moraine Valley Community College Oakton Community College Parkland College Prairie State College Richland Community College
KENTUCKY Four-year institutions
Campbellsville University Eastern Kentucky University Georgetown College Kentucky Christian College
77
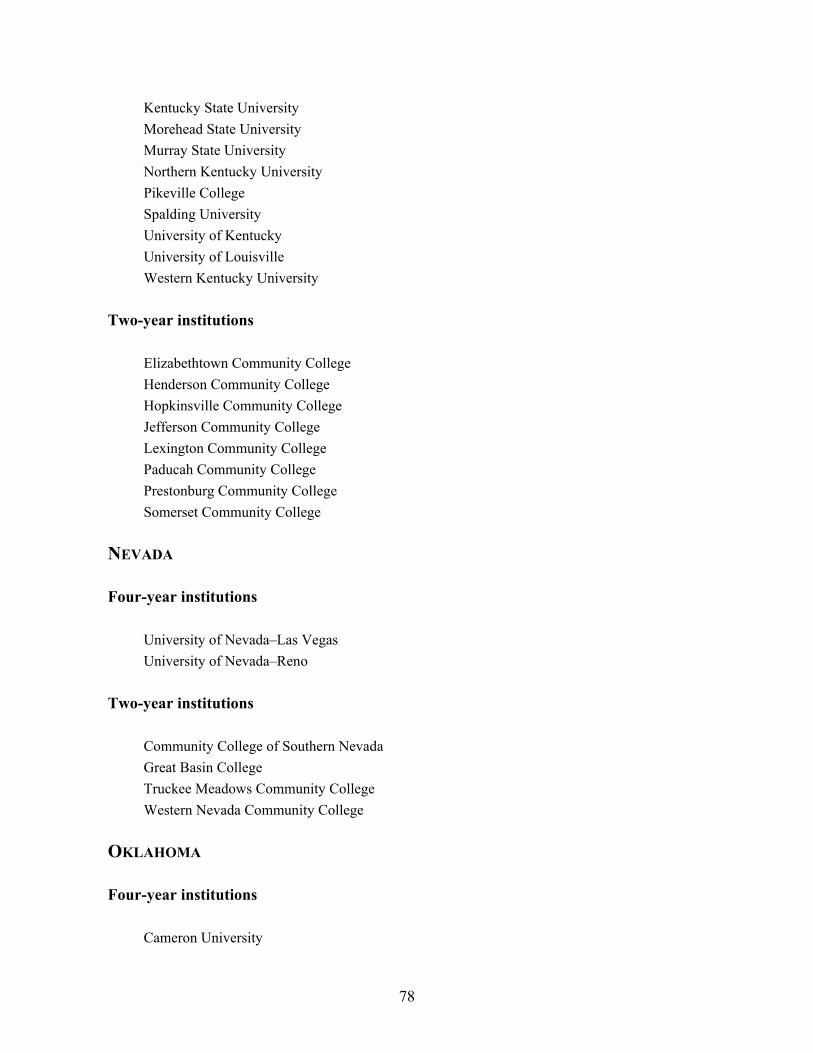
Kentucky State University Morehead State University Murray State University Northern Kentucky University Pikeville College Spalding University University of Kentucky University of Louisville Western Kentucky University
Two-year institutions
Elizabethtown Community College Henderson Community College Hopkinsville Community College Jefferson Community College Lexington Community College Paducah Community College Prestonburg Community College Somerset Community College
NEVADA Four-year institutions
University of Nevada–Las Vegas University of Nevada–Reno
Two-year institutions
Community College of Southern Nevada Great Basin College Truckee Meadows Community College Western Nevada Community College
OKLAHOMA Four-year institutions
Cameron University
78
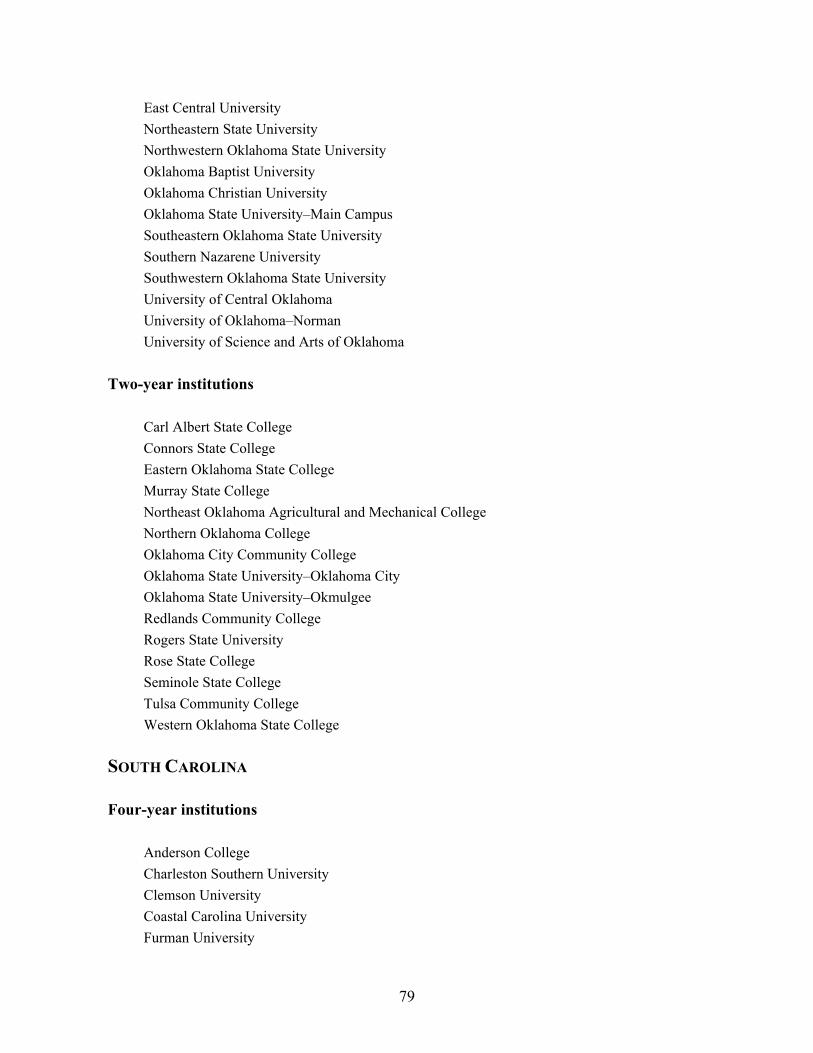
East Central University Northeastern State University Northwestern Oklahoma State University Oklahoma Baptist University Oklahoma Christian University Oklahoma State University–Main Campus Southeastern Oklahoma State University Southern Nazarene University Southwestern Oklahoma State University University of Central Oklahoma University of Oklahoma–Norman University of Science and Arts of Oklahoma
Two-year institutions
Carl Albert State College Connors State College Eastern Oklahoma State College Murray State College Northeast Oklahoma Agricultural and Mechanical College Northern Oklahoma College Oklahoma City Community College Oklahoma State University–Oklahoma City Oklahoma State University–Okmulgee Redlands Community College Rogers State University Rose State College Seminole State College Tulsa Community College Western Oklahoma State College
SOUTH CAROLINA Four-year institutions
Anderson College Charleston Southern University Clemson University Coastal Carolina University Furman University
79
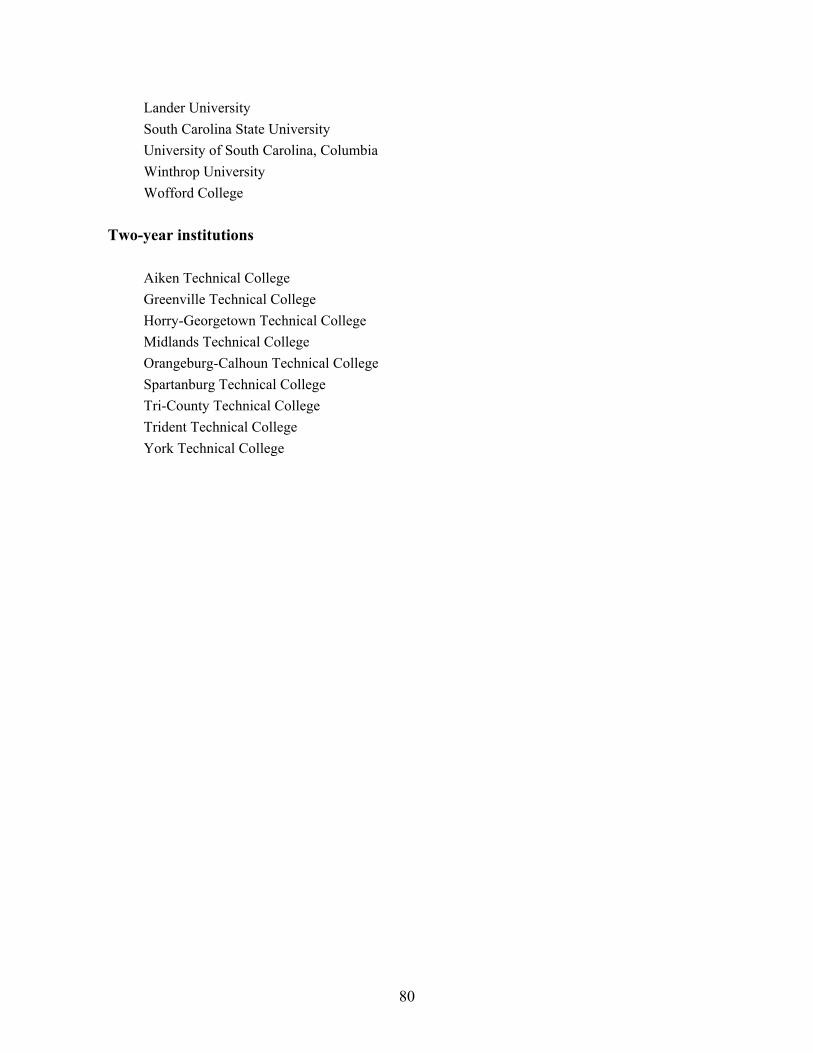
Lander University South Carolina State University University of South Carolina, Columbia Winthrop University Wofford College
Two-year institutions
Aiken Technical College Greenville Technical College Horry-Georgetown Technical College Midlands Technical College Orangeburg-Calhoun Technical College Spartanburg Technical College Tri-County Technical College Trident Technical College York Technical College
80
Appendix 3
Learning: Sample-Selection Guidelines for the ACT WorkKeys Assessment
and the Community College Survey of Student Engagement (CCSSE) Background The WorkKeys battery is a set of examinations designed to measure skills that are required in the modern workplace and that are also related to later collegiate success. It is administered by ACT. Four tests in the WorkKeys battery are being administered to samples of sophomores at two-year colleges in five states, as part of a project being undertaken by the Pew Forum on College-Level Learning. Each participating student will complete two of these tests. Students will also be asked to respond to the Community College Survey of Student Engagement (CCSSE), an instrument designed to examine institutional and student behaviors associated with learning and retention. Your institution has been selected to participate in this study. The purpose of this document is to provide guidance on selecting a group of about 100 students who will participate in the assessment. Parallel documents describe the procedures to be used in actually administering the assessments on site. Identifying the student population to be sampled The target population of students consists of undergraduate degree-seeking students at your institution (part- or full-time) who meet the following two conditions: a) are officially enrolled in fall 2003 for IPEDS reporting purposes and, b) counting the number of semester-based credits enrolled for in the fall of 2003, are within nine to 18 credit hours (or, alternatively, within three to six courses) of completing an associate’s degree in the spring or summer of 2004. Definitions will undoubtedly differ from one institution to another, but you should try to approximate these specifications as fully as possible. Please bear in mind that the project’s intent is to assess students in the fall who will likely complete their associate’s degree in the spring. If fewer than 100 students at your institution meet these selection criteria, relax the constraint on the number of hours completed until you identify at least 100 qualifying students from whom to sample. Selecting the sample The objective of the sampling procedure is to identify an initial group of students who will be invited to participate in the study, plus two backup samples that will be used to replace members of the initial group who decline participation. The total number of students to be invited to participate at your institution is shown in the accompanying Master Chart of participating institutions. Note that the number of students targeted for this initial group of invited students is larger than the number of
81
testing slots allocated to your institution (“testing quota”). This is because some students will probably not show up for testing, even though they have committed to do so. If there are more students than assigned testing slots at the time of testing, you will have been previously supplied with additional testing materials to accommodate them.
Several methods can be used to select the three samples (initial and two backups), once the population of eligible students has been identified:
1) The most straightforward method is to generate the initial sample of invited students automatically using a spreadsheet or statistical software package, most of which can generate a simple random sample. To do this, a list of Student ID numbers for all students who meet the eligibility criteria should first be compiled. The software package should then be instructed to select a random sample of Student ID numbers from this population that meets the sampling quota for invited students assigned to your institution. This will be the initial sample.
To generate the first backup sample, members of the initial sample must be removed from the original pool of eligible candidates and the sampling procedure repeated. The same procedure should be used to generate the second backup sample after removing members of the first backup sample from the pool.
2) The initial sample of invited students can also be generated manually using Student ID
numbers. This method assumes that the last three digits of any Student ID number are randomly distributed across the population—a fairly robust assumption. The first step is again to compile a list of ID numbers for all students who meet the eligibility criteria. This list should then be sorted in order of the last three digits of the ID number, beginning with 000 and ending with 999. Not all three-digit combinations will probably be represented in your institution’s eligible population, so there are likely to be gaps in the sequence and/or duplicates of some combinations in the resulting list. The third step is to pick a random start point—either by using a table of random numbers or by asking three colleagues to each supply you with a single digit. The result will be a particular three-digit number—for example 321. To select the sample, locate the first appearance of this last-three-digit combination in the sorted list of ID numbers and pick it, and the consecutive ID numbers immediately following it, until your sample quota of invited students is reached. If the number you selected as a start point (e.g., 321) is not on the list, choose the next larger number that actually occurs on the list (e.g., if 323 is the next actual number available, this would be the start point). If you reach the bottom of the sorted list before selecting the number of cases assigned, start again at the top until the goal is reached.
To generate the first backup sample, members of the initial sample must be removed from the original pool of eligible candidates and the sampling procedure repeated. The same procedure should be used to generate the second backup sample after removing members of the first backup sample from the pool.
82
3) Finally, the sample can be selected systematically by choosing every Nth case. To
accomplish this, begin with a list of Student ID numbers for all students who meet the eligibility criteria (as above). Divide the number of individuals in this list by the sample quota of invited students assigned to your institution and round up to the nearest integer in order to obtain an interval for selecting cases. For example, if the list of eligible graduates contains 1,127 names, and your sample quota is 125, the resulting interval is nine. Determine a random start point at the top of the list from one to eight, and pick every ninth case in sequence from the start point, beginning again at the top of the list when you reach the bottom. For institutions with very large populations of eligible students, this method may result in fairly large sampling intervals. Where this is the case, care should be taken to ensure that important populations (for example, small majors or demographic groups) are not systematically excluded because they fall within the sampling interval. This can usually be avoided by pre-sorting the list according to some random characteristic—for example the last three digits of the Student ID numbers, as above.
If the systematic sampling method is employed, an alternative way to generate the two backup samples is available. Members of the first backup will simply consist of those records located immediately above the previously identified members of the initial sample on the master list. Members of the second backup will consist of those Student ID numbers located immediately below. (If the last entry on the list is a member of the initial sample, the entry two records above should be chosen as the last member of the second backup sample.)
Whichever method is employed, the final list of selected Student ID numbers for each sample can then be used to obtain additional contact or demographic information from the student record system. For institutions with fewer than 300 total qualifying students, cases should be selected for the three samples sequentially until no more students remain.
Employing the samples When notified by your state project coordinator to begin recruitment, members of the initial sample should be contacted and invited to participate using the recruitment materials supplied. Members of this group who have not replied, or who provided an initial negative reply, should be re-contacted in a week to discuss the project and attempt further recruitment. At this time a firm “yes” or “no” decision to participate should be requested. Replacements for those refusing participation should be selected from the available backup samples in the following manner:
1) Identify those members of the initial sample refusing participation in the study by program and by full-time/part-time attendance status.
2) Locate a member of the first backup sample who matches each member of the initial
sample’s refusing population as fully as possible with respect to program. If an exact match
83
on major is not available, choose a student enrolled in a program that comes as close to the refuser’s program as you can with respect to what you know about the curriculum. For example, if a student in medical technology is a member of the initial refusal group—and no students enrolled in medical technology are present in the first backup sample—a nursing student, a dental hygiene student, and a science transfer student might be considered in that order. However this selection is made, the replacement should always be drawn from the same general disciplinary area as the case it is replacing—for example college transfer, applied arts, health professions, business, or a technology. Ideally, the replacement should also match the case it is replacing with respect to full-time/part-time status. But if this is not possible, the student’s program should be decisive in making the selection. Where two or more potential replacement cases are available on both variables, the replacement chosen should be the first in order of occurrence on the backup sample list.
3) Repeat the recruitment procedures employed for members of the initial sample for the
replacements drawn from the first backup sample. 4) Identify those who refuse participation and locate replacements drawn from the second
backup sample in the same manner as step 2 above. 5) Repeat the recruitment procedures for the second group of replacements.
These procedures can be administered flexibly depending upon local circumstances, bearing in
mind the need to balance obtaining a statistically representative set of invited participants with student cooperation. For example, you may want to increase the number of students invited to participate beyond your assigned sample of invited students if you think that fewer students will show up for testing than needed. Remember that the ultimate objective is to ensure that the allocated test-taker “quota” for your institution is actually achieved. As noted, limited numbers of additional testing materials will be made available in case more students than anticipated actually show up.
When in doubt about recruitment or sampling procedures, contact your state project coordinator. Reporting After the testing is concluded, you will send completed tests and surveys to ACT for processing, following the instructions provided in the parallel document on test administration procedures. ACT and CCSSE will then process the results, and each organization will supply you with an institutional report that allows you to compare your results with a comparison group drawn from the entire project. In addition, individual score reports for WorkKeys will be supplied to you for distribution to each participating student.
84
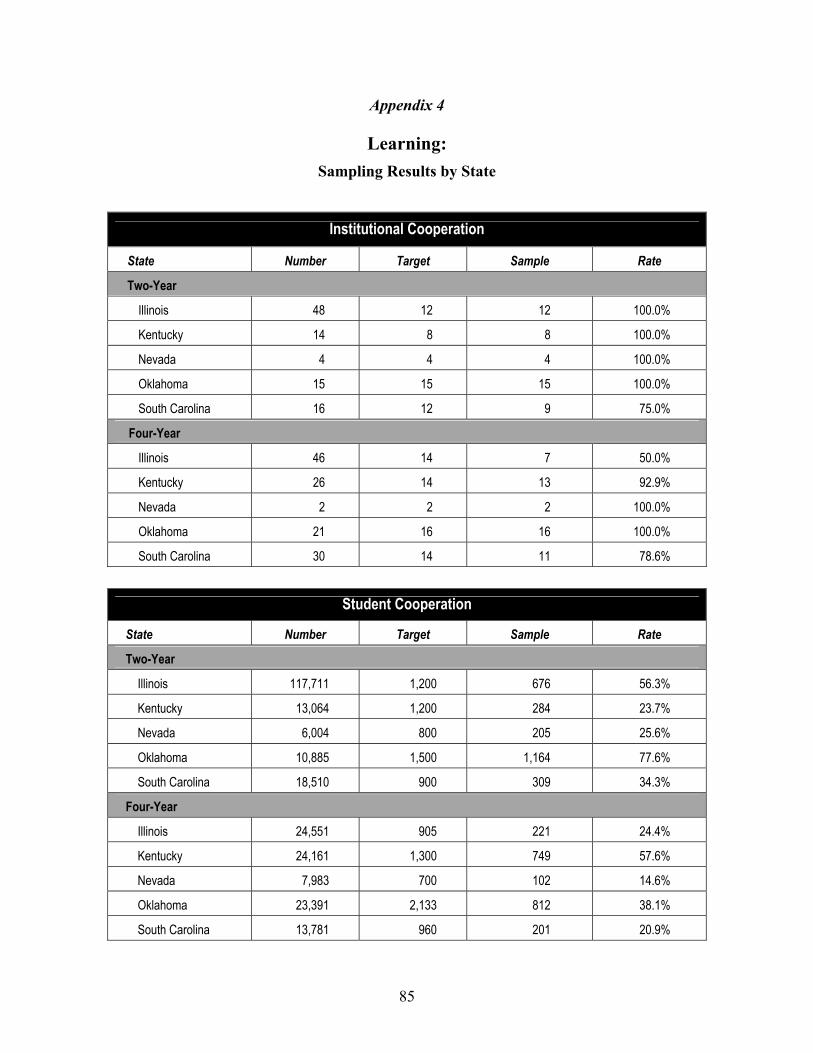
Appendix 4
Learning: Sampling Results by State
Institutional Cooperation
State Number Target Sample Rate
Two-Year
Illinois 48 12 12 100.0%
Kentucky 14 8 8 100.0%
Nevada 4 4 4 100.0%
Oklahoma 15 15 15 100.0%
South Carolina 16 12 9 75.0%
Four-Year
Illinois 46 14 7 50.0%
Kentucky 26 14 13 92.9%
Nevada 2 2 2 100.0%
Oklahoma 21 16 16 100.0%
South Carolina 30 14 11 78.6%
Student Cooperation
State Number Target Sample Rate
Two-Year
Illinois 117,711 1,200 676 56.3%
Kentucky 13,064 1,200 284 23.7%
Nevada 6,004 800 205 25.6%
Oklahoma 10,885 1,500 1,164 77.6%
South Carolina 18,510 900 309 34.3%
Four-Year
Illinois 24,551 905 221 24.4%
Kentucky 24,161 1,300 749 57.6%
Nevada 7,983 700 102 14.6%
Oklahoma 23,391 2,133 812 38.1%
South Carolina 13,781 960 201 20.9%
85
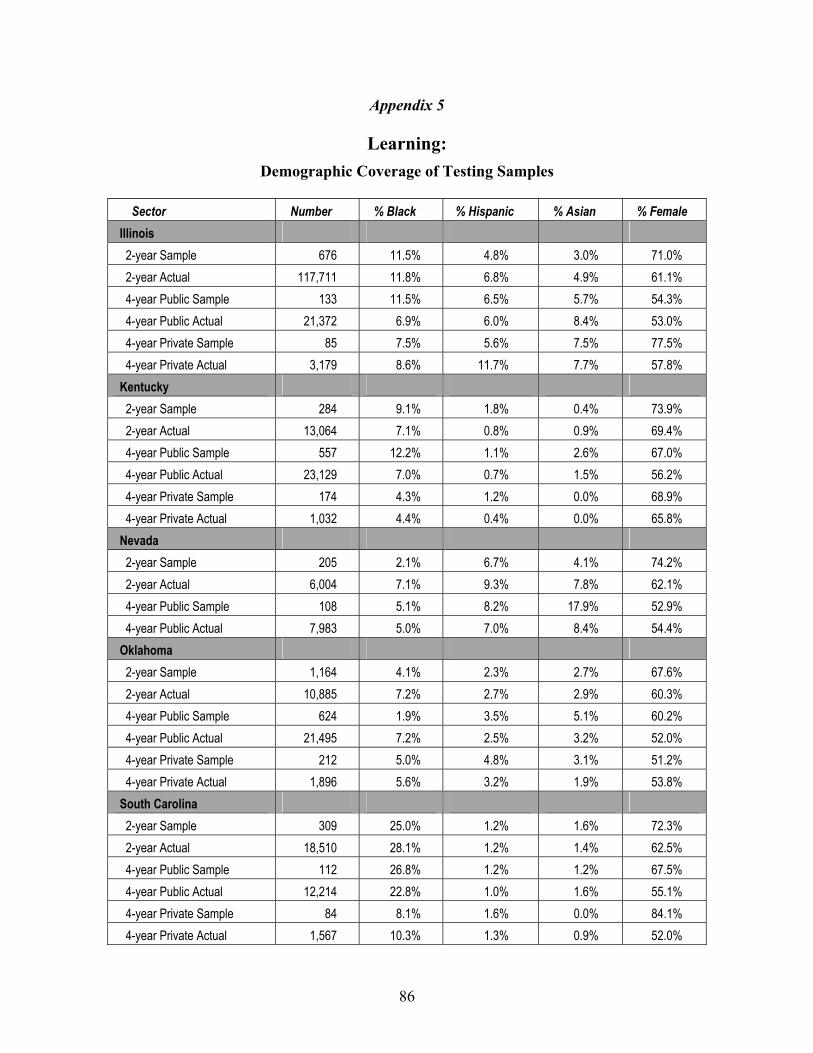
Appendix 5
Learning: Demographic Coverage of Testing Samples
Sector Number % Black % Hispanic % Asian % Female
Illinois 2-year Sample 676 11.5% 4.8% 3.0% 71.0% 2-year Actual 117,711 11.8% 6.8% 4.9% 61.1% 4-year Public Sample 133 11.5% 6.5% 5.7% 54.3% 4-year Public Actual 21,372 6.9% 6.0% 8.4% 53.0% 4-year Private Sample 85 7.5% 5.6% 7.5% 77.5% 4-year Private Actual 3,179 8.6% 11.7% 7.7% 57.8%
Kentucky 2-year Sample 284 9.1% 1.8% 0.4% 73.9% 2-year Actual 13,064 7.1% 0.8% 0.9% 69.4% 4-year Public Sample 557 12.2% 1.1% 2.6% 67.0% 4-year Public Actual 23,129 7.0% 0.7% 1.5% 56.2% 4-year Private Sample 174 4.3% 1.2% 0.0% 68.9% 4-year Private Actual 1,032 4.4% 0.4% 0.0% 65.8%
Nevada 2-year Sample 205 2.1% 6.7% 4.1% 74.2% 2-year Actual 6,004 7.1% 9.3% 7.8% 62.1% 4-year Public Sample 108 5.1% 8.2% 17.9% 52.9% 4-year Public Actual 7,983 5.0% 7.0% 8.4% 54.4%
Oklahoma 2-year Sample 1,164 4.1% 2.3% 2.7% 67.6% 2-year Actual 10,885 7.2% 2.7% 2.9% 60.3% 4-year Public Sample 624 1.9% 3.5% 5.1% 60.2% 4-year Public Actual 21,495 7.2% 2.5% 3.2% 52.0% 4-year Private Sample 212 5.0% 4.8% 3.1% 51.2% 4-year Private Actual 1,896 5.6% 3.2% 1.9% 53.8%
South Carolina 2-year Sample 309 25.0% 1.2% 1.6% 72.3% 2-year Actual 18,510 28.1% 1.2% 1.4% 62.5%
112 26.8% 1.2% 1.2% 67.5% 4-year Public Actual 12,214 22.8% 1.0% 1.6% 55.1% 4-year Private Sample 84 8.1% 1.6% 0.0% 84.1% 4-year Private Actual 1,567 10.3% 1.3% 0.9% 52.0%
4-year Public Sample
86

THE NATIONAL CENTER FOR PUBLIC POLICY AND HIGHER EDUCATION
The National Center for Public Policy and Higher Education promotes public policies that enhance Americans’ opportunities to pursue and achieve high-quality education and training beyond high school. As an independent, nonprofit, nonpartisan organization, the National Center prepares action-oriented analyses of pressing policy issues facing the states and the nation regardopportunity and achievement in higher education—including two- and four-year, public and privafor-profit and nonprofit institutions. The National Center communicates performance results and findings to the public, to civic, business, and higher education leaders, and to state and federal leawho are poised to improve higher education policy.
Established in 1998, the National Center is not affiliated with any institution of higher education, with any political party, or with any government agency; it receives continuing, core financial support from a consortium of national foundations that includes The Pew Charitable TruThe Atlantic Philanthropies, and The Ford Foundation.
152 North Third Street, Suite 705, San Jose, California 95112
Telephone: 408-271-2699 • FAX: 408-271-2697 www.highereducation.org
National Center Publications The National Center publishes:
Reports and analyses commissioned by the National Center, Reports and analyses written by National Center staff, National Center Policy Reports that are approved by the National Center’s Board of Directo
and National CrossTalk, a quarterly publication.
The following National Center publications—as well as a host of other information and links—are available at www.highereducation.org. Single copies of most of these reports are also available fromNational Center. Please FAX requests to 408-271-2697 and ask for the report by publication numbe
Measuring Up 2006: The National Report Card on Higher Education (September 2006). Measuring Up 20consists of a national report card for higher education (report #06-5) and 50 state report cards (#06-4). The puof Measuring Up 2006 is to provide the public and policymakers with information to assess and improve postsecondary education in each state. For the first time, this edition offers international comparisons with stathe nation as a whole. Visit www.highereducation.org to download Measuring Up 2006 or to make your owncomparisons of state performance in higher education.
Technical Guide for Measuring Up 2006: Documenting Methodology, Indicators, and Data Sources (September 2006, #06-6).
Checks and Balances at Work: The Restructuring of Virginia’s Public Higher Education System, by Lara Couturier (June 2006, #06-3). This case study of Virginia’s 2005 Restructured Higher Education Financial anAdministrative Operations Act examines the restructured relationship between the commonwealth and its pub
87
ing te,
key ders
sts,
rs,
the r.
06 rpose
tes and
K. d lic
colleges and universities. The act gives more autonomy to the public colleges but checks it with new accountability targeted directly to the needs of the state.
American Higher Education: How Does It Measure Up for the 21st Century? by James B. Hunt Jr. and Thomas J. Tierney with a foreword by Garrey Carruthers (May 2006, #06-2). These essays by former Governor James B. Hunt Jr. and business leader Thomas J. Tierney lay out in succinct fashion the requirements of both our nation and our states for new and higher levels of performance from America’s colleges and universities.
Claiming Common Ground: State Policymaking for Improving College Readiness and Success, by Patrick M. Callan, Joni E. Finney, Michael W. Kirst, Michael D. Usdan, and Andrea Venezia (March 2006, #06-1). To improve college readiness and success, states can develop policies that better connect their K–12 and postsecondary education systems. However, state action in each of the following policy areas is needed to create college-readiness reform: alignment of coursework and assessments; state finance; statewide data systems; and accountability.
Measuring Up on College-Level Learning, by Margaret A. Miller and Peter T. Ewell (October 2005, #05-8). In this report, the National Forum on College-Level Learning proposes a model for evaluating and comparing college-level learning on a state-by-state basis, including assessing educational capital. As well as releasing the results for five participating states, the authors also explore the implications of their findings in terms of performance gaps by race/ethnicity and educating future teachers.
The Governance Divide: A Report on a Four-State Study on Improving College Readiness and Success, by Andrea Venezia, Patrick M. Callan, Joni E. Finney, Michael W. Kirst, and Michael D. Usdan (September 2005, #05-3). This report, supported by case studies in Florida, Georgia, New York, and Oregon, identifies and examines policy options available to states that are interested in creating sustained K–16 reform.
The Governance Divide: The Case Study for Florida, by Andrea Venezia and Joni E. Finney (2006, #05-4).
The Governance Divide: The Case Study for Georgia, by Andrea Venezia, Patrick M. Callan, Michael W. Kirst, and Michael D. Usdan (2006, #05-5).
The Governance Divide: The Case Study for New York, by Andrea Venezia, Michael W. Kirst, and Michael D. Usdan (2006, #05-6).
The Governance Divide: The Case Study for Oregon, by Andrea Venezia and Michael W. Kirst (2006, #05-7).
Borrowers Who Drop Out: A Neglected Aspect of the College Student Loan Trend, by Lawrence Gladieux and Laura Perna (May 2005, #05-2). This report examines the experiences of students who borrow to finance their educations, but do not complete their postsecondary programs. Using the latest comprehensive data, this report compares borrowers who drop out with other groups of students, and provides recommendations on policies and programs that would better prepare, support, and guide students—especially low-income students—in completing their degrees.
Case Study of Utah Higher Education, by Kathy Reeves Bracco and Mario Martinez (April 2005, #05-1). This report examines state policies and performance in the areas of enrollment and affordability. Compared with other states, Utah has been able to maintain a system of higher education that is more affordable for students, while enrollments have almost doubled over the past 20 years.
Measuring Up 2004: The National Report Card on Higher Education (September 2004). Measuring Up 2004 consists of a national report card for higher education (report #04-5) and 50 state report cards (#04-4). The purpose of Measuring Up 2004 is to provide the public and policymakers with information to assess and improve
88
postsecondary education in each state. For the first time, this edition provides information about each state’s improvement over the past decade. Visit www.highereducation.org to download Measuring Up 2004 or to make your own comparisons of state performance in higher education.
Technical Guide Documenting Methodology, Indicators, and Data Sources for Measuring Up 2004 (November 2004, #04-6).
Ensuring Access with Quality to California’s Community Colleges, by Gerald C. Hayward, Dennis P. Jones, Aims C. McGuinness, Jr., and Allene Timar, with a postscript by Nancy Shulock (May 2004, #04-3). This report finds that enrollment growth pressures, fee increases, and recent budget cuts in the California Community Colleges are having significant detrimental effects on student access and program quality. The report also provides recommendations for creating improvements that build from the state policy context and from existing promising practices within the community colleges.
Public Attitudes on Higher Education: A Trend Analysis, 1993 to 2003, by John Immerwahr (February 2004, #04-2). This public opinion survey, prepared by Public Agenda for the National Center, reveals that public attitudes about the importance of higher education have remained stable during the recent economic downturn. The survey also finds that there are some growing public concerns about the costs of higher education, especially for those groups most affected, including parents of high school students, African-Americans, and Hispanics.
Responding to the Crisis in College Opportunity (January 2004, #04-1). This policy statement, developed by education policy experts at Lansdowne, Virginia, proposes short-term emergency measures and long-term priorities for governors and legislators to consider for funding higher education during the current lean budget years. Responding to the Crisis suggests that in 2004 the highest priority for state higher education budgets should be to protect college access and affordability for students and families.
With Diploma in Hand: Hispanic High School Seniors Talk About Their Future, by John Immerwahr (June 2003, #03-2). This report by Public Agenda explores some of the primary obstacles that many Hispanic students face in seeking higher education—barriers that suggest opportunities for creative public policy to improve college attendance and completion rates among Hispanics.
Purposes, Policies, Performance: Higher Education and the Fulfillment of a State’s Public Agenda (February 2003, #03-1). This essay is drawn from discussions of higher education leaders and policy officials at a roundtable convened in June 2002 at New Jersey City University on the relationship between public purposes, policies, and performance of American higher education.
Measuring Up 2002: The State-by-State Report Card for Higher Education (October 2002, #02-7). This report card, which updates the inaugural edition released in 2000, grades each state on its performance in five key areas of higher education. Measuring Up 2002 also evaluates each state’s progress in relation to its own results from 2000.
Technical Guide Documenting Methodology, Indicators, and Data Sources for Measuring Up 2002 (October 2002, #02-8).
State Policy and Community College–Baccalaureate Transfer, by Jane V. Wellman (July 2002, #02-6). This report recommends state policies to energize and improve higher education performance regarding transfers from community colleges to four-year institutions.
Fund for the Improvement of Postsecondary Education: The Early Years (June 2002, #02-5). The Fund for the Improvement of Postsecondary Education (FIPSE) attained remarkable success in funding innovative and enduring
89
projects during its early years. This report, prepared by FIPSE’s early program officers, describes how those results were achieved.
Losing Ground: A National Status Report on the Affordability of American Higher Education (May 2002, #02-3). This national status report documents the declining affordability of higher education for American families, and highlights public policies that support affordable higher education. It provides state-by-state summaries as well as national findings.
The Affordability of Higher Education: A Review of Recent Survey Research, by John Immerwahr (May 2002, #02-4). This review of recent surveys by Public Agenda confirms that Americans feel that rising college costs threaten to make higher education inaccessible for many people.
Coping with Recession: Public Policy, Economic Downturns, and Higher Education, by Patrick M. Callan (February 2002, #02-2). This report outlines the major policy considerations that states and institutions of higher education face during economic downturns.
Competition and Collaboration in California Higher Education, by Kathy Reeves Bracco and Patrick M. Callan (January 2002, #02-1). This report argues that the structure of California’s state higher education system limits the system’s capacity for collaboration.
Measuring Up 2000: The State-by-State Report Card for Higher Education (November 2000, #00-3). This first-of-its-kind report card grades each state on its performance in higher education. The report card also provides comprehensive profiles of each state and brief states-at-a-glance comparisons.
Beneath the Surface: A Statistical Analysis of the Major Variables Associated with State Grades in Measuring Up 2000, by Alisa F. Cunningham and Jane V. Wellman (November 2001, #01-4). Using statistical analysis, this report explores the “drivers” that predict overall performance in Measuring Up 2000.
Supplementary Analysis for Measuring Up 2000: An Exploratory Report, by Mario Martinez (November 2001, #01-3). This supplement explores the relationships within and among the performance categories in Measuring Up 2000.
Some Next Steps for States: A Follow-up to Measuring Up 2000, by Dennis Jones and Karen Paulson (June 2001, #01-2). This report suggests a range of actions that states can take to bridge the gap between state performance identified in Measuring Up 2000 and the formulation of effective policy to improve performance in higher education.
A Review of Tests Performed on the Data in Measuring Up 2000, by Peter Ewell (June 2001, #01-1). This review describes the statistical testing performed on the data in Measuring Up 2000 by the National Center for Higher Education Management Systems.
Recent State Policy Initiatives in Education: A Supplement to Measuring Up 2000, by Aims C. McGuinness, Jr. (December 2000, #00-6). This supplement highlights education initiatives that states have adopted since 1997–98.
Assessing Student Learning Outcomes: A Supplement to Measuring Up 2000, by Peter Ewell and Paula Ries (December 2000, #00-5). This report is a national survey of state efforts to assess student learning outcomes in higher education.
Technical Guide Documenting Methodology, Indicators and Data Sources for Measuring Up 2000 (November 2000, #00-4).
90
A State-by-State Report Card on Higher Education: Prospectus (March 2000, #00-1). This document summarizes the goals of the National Center’s report-card project.
Great Expectations: How the Public and Parents—White, African-American, and Hispanic—View Higher Education, by John Immerwahr with Tony Foleno (May 2000, #00-2). This report by Public Agenda finds that Americans overwhelmingly see higher education as essential for success. Survey results are also available for the following states:
Great Expectations: How Pennsylvanians View Higher Education (May 2000, #00-2b). Great Expectations: How Floridians View Higher Education (August 2000, #00-2c). Great Expectations: How Coloradans View Higher Education (August 2000, #00-2d). Great Expectations: How Californians View Higher Education (August 2000, #00-2e). Great Expectations: How New Yorkers View Higher Education (October 2000, #00-2f). Great Expectations: How Illinois Residents View Higher Education (October 2000, #00-2h).
State Spending for Higher Education in the Next Decade: The Battle to Sustain Current Support, by Harold A. Hovey (July 1999, #99-3). This fiscal forecast of state and local spending patterns finds that the vast majority of states will face significant fiscal deficits over the next eight years, which will in turn lead to increased scrutiny of higher education in almost all states, and to curtailed spending for public higher education in many states.
South Dakota: Developing Policy-Driven Change in Higher Education, by Mario Martinez (June 1999, #99-2). This report describes the processes for change in higher education that government, business, and higher education leaders are creating and implementing in South Dakota.
Taking Responsibility: Leaders’ Expectations of Higher Education, by John Immerwahr (January 1999, #99-1). This paper reports the views of those most involved with decisionmaking about higher education, based on focus groups and a survey conducted by Public Agenda.
The Challenges and Opportunities Facing Higher Education: An Agenda for Policy Research, by Dennis Jones, Peter Ewell, and Aims McGuinness, Jr. (December 1998, #98-8). This report argues that due to substantial changes in the landscape of postsecondary education, new state-level policy frameworks must be developed and implemented.
Higher Education Governance: Balancing Institutional and Market Influences, by Richard C. Richardson, Jr., Kathy Reeves Bracco, Patrick M. Callan, and Joni E. Finney (November 1998, #98-7). This publication describes the structural relationships that affect institutional effectiveness in higher education, and argues that state policy should strive for a balance between institutional and market forces.
Federal Tuition Tax Credits and State Higher Education Policy: A Guide for State Policy Makers, by Kristin D. Conklin (December 1998, #98-6). This report examines the implications of the federal income tax provisions for students and their families, and makes recommendations for state higher education policy.
The Challenges Facing California Higher Education: A Memorandum to the Next Governor of California, by David W. Breneman (September 1998, #98-5). This memorandum argues that California should develop a new Master Plan for Higher Education.
Tidal Wave II Revisited: A Review of Earlier Enrollment Projections for California Higher Education, by Gerald C. Hayward, David W. Breneman, and Leobardo F. Estrada (September 1998, #98-4). This review finds that earlier forecasts of a surge in higher education enrollments were accurate.
91
92
Organizing for Learning: The View from the Governor’s Office, by James B. Hunt Jr., chair of the National Center for Public Policy and Higher Education, and former governor of North Carolina (June 1998, #98-3). This publication is an address to the American Association for Higher Education concerning opportunity in higher education.
The Price of Admission: The Growing Importance of Higher Education, by John Immerwahr (Spring 1998, #98-2). This report is a national survey of Americans’ views on higher education, conducted and reported by Public Agenda.
Concept Paper: A National Center to Address Higher Education Policy, by Patrick M. Callan (March 1998, #98-1). This concept paper describes the purposes of the National Center for Public Policy and Higher Education.
www.highereducation.org