Embed Size (px)
Citation preview
Technical handbook for the post weld treatment
of stainless steel
An easy to read and follow technical handbook which summarizes various collaborative reports and studies from
leading Universities and materials testing companies
The experts in weld cleaning
Stainless steel is used industry wide for its corrosion and bacteria resistant properties. To be classi�ed as stainless steel, it must contain at least 10.5% chromium. All grades of stainless steel will form a very thin “passive” layer of chromium oxide (Cr2O3) on the surface of the steel itself, and it is this passive layer which provides its corrosion resistance.
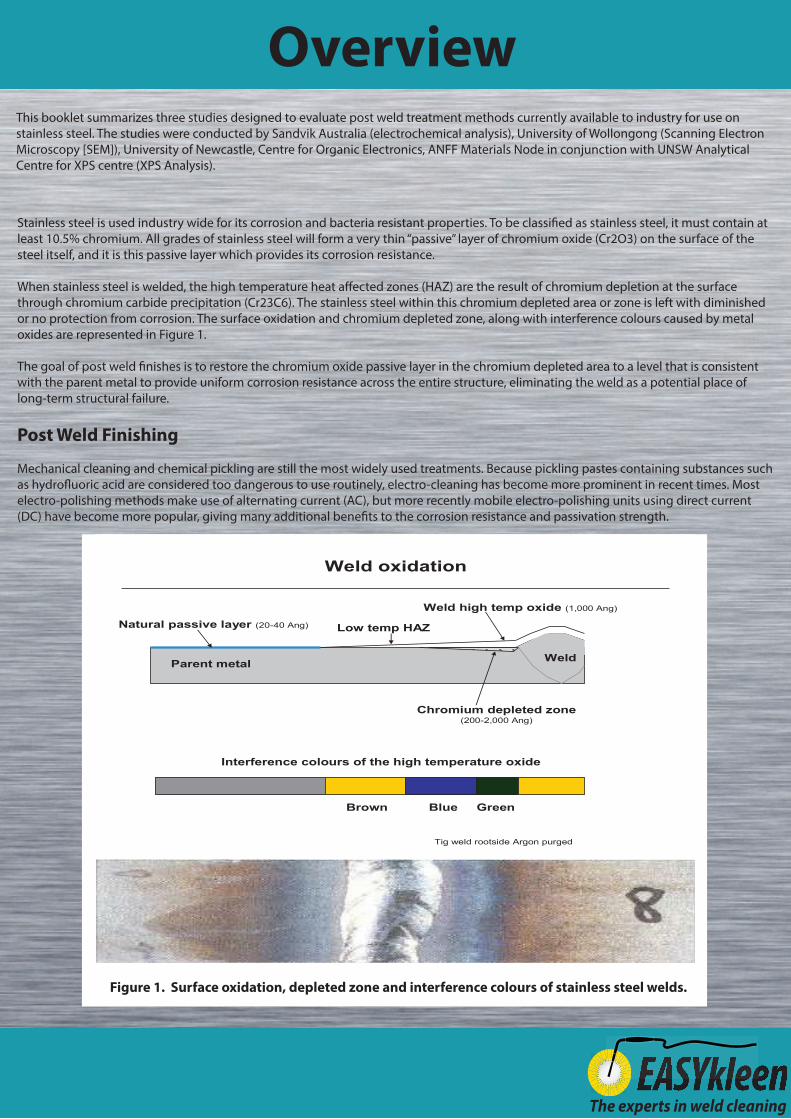
When stainless steel is welded, the high temperature heat a�ected zones (HAZ) are the result of chromium depletion at the surface through chromium carbide precipitation (Cr23C6). The stainless steel within this chromium depleted area or zone is left with diminished or no protection from corrosion. The surface oxidation and chromium depleted zone, along with interference colours caused by metal oxides are represented in Figure 1.
The goal of post weld �nishes is to restore the chromium oxide passive layer in the chromium depleted area to a level that is consistent with the parent metal to provide uniform corrosion resistance across the entire structure, eliminating the weld as a potential place of long-term structural failure.
Post Weld Finishing
Mechanical cleaning and chemical pickling are still the most widely used treatments. Because pickling pastes containing substances such as hydro�uoric acid are considered too dangerous to use routinely, electro-cleaning has become more prominent in recent times. Most electro-polishing methods make use of alternating current (AC), but more recently mobile electro-polishing units using direct current (DC) have become more popular, giving many additional bene�ts to the corrosion resistance and passivation strength.
Overview
Weld oxidation
Tig weld rootside Argon purged
Natural passive layer (20-40 Ang)
Weld high temp oxide (1,000 Ang)
Parent metal
Chromium depleted zone(200-2,000 Ang)
Weld
Low temp HAZ
Interference colours of the high temperature oxide
Brown Blue Green
Figure 1. Surface oxidation, depleted zone and interference colours of stainless steel welds.
This booklet summarizes three studies designed to evaluate post weld treatment methods currently available to industry for use on stainless steel. The studies were conducted by Sandvik Australia (electrochemical analysis), University of Wollongong (Scanning Electron Microscopy [SEM]), University of Newcastle, Centre for Organic Electronics, ANFF Materials Node in conjunction with UNSW Analytical Centre for XPS centre (XPS Analysis).
The experts in weld cleaning
Corrosion Resistance
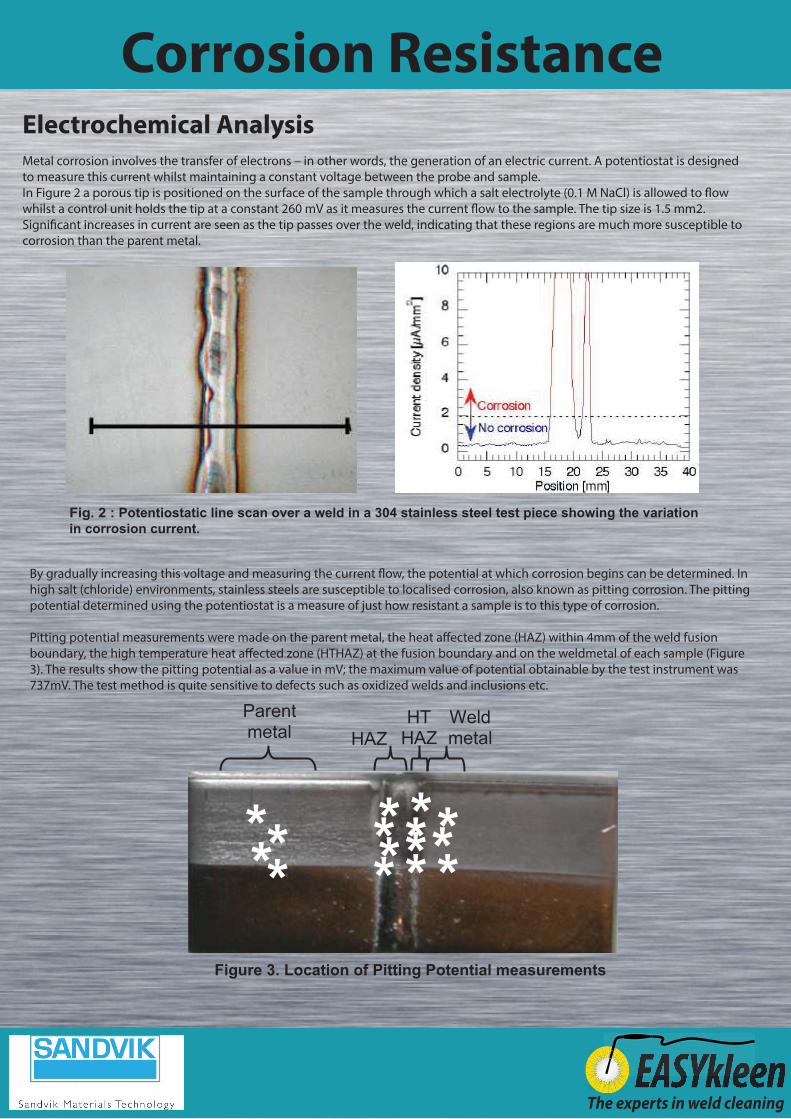
Electrochemical AnalysisMetal corrosion involves the transfer of electrons – in other words, the generation of an electric current. A potentiostat is designed to measure this current whilst maintaining a constant voltage between the probe and sample. In Figure 2 a porous tip is positioned on the surface of the sample through which a salt electrolyte (0.1 M NaCl) is allowed to �ow whilst a control unit holds the tip at a constant 260 mV as it measures the current �ow to the sample. The tip size is 1.5 mm2. Signi�cant increases in current are seen as the tip passes over the weld, indicating that these regions are much more susceptible to corrosion than the parent metal.
* * * *
* * * * * * * * * * *
Parent metal HAZ
HT HAZ
Weld metal
Fig. 2 : Potentiostatic line scan over a weld in a 304 stainless steel test piece showing the variation in corrosion current.
Figure 3. Location of Pitting Potential measurements
By gradually increasing this voltage and measuring the current �ow, the potential at which corrosion begins can be determined. In high salt (chloride) environments, stainless steels are susceptible to localised corrosion, also known as pitting corrosion. The pitting potential determined using the potentiostat is a measure of just how resistant a sample is to this type of corrosion.
Pitting potential measurements were made on the parent metal, the heat a�ected zone (HAZ) within 4mm of the weld fusion boundary, the high temperature heat a�ected zone (HTHAZ) at the fusion boundary and on the weldmetal of each sample (Figure 3). The results show the pitting potential as a value in mV; the maximum value of potential obtainable by the test instrument was 737mV. The test method is quite sensitive to defects such as oxidized welds and inclusions etc.
The experts in weld cleaning
Corrosion Resistance
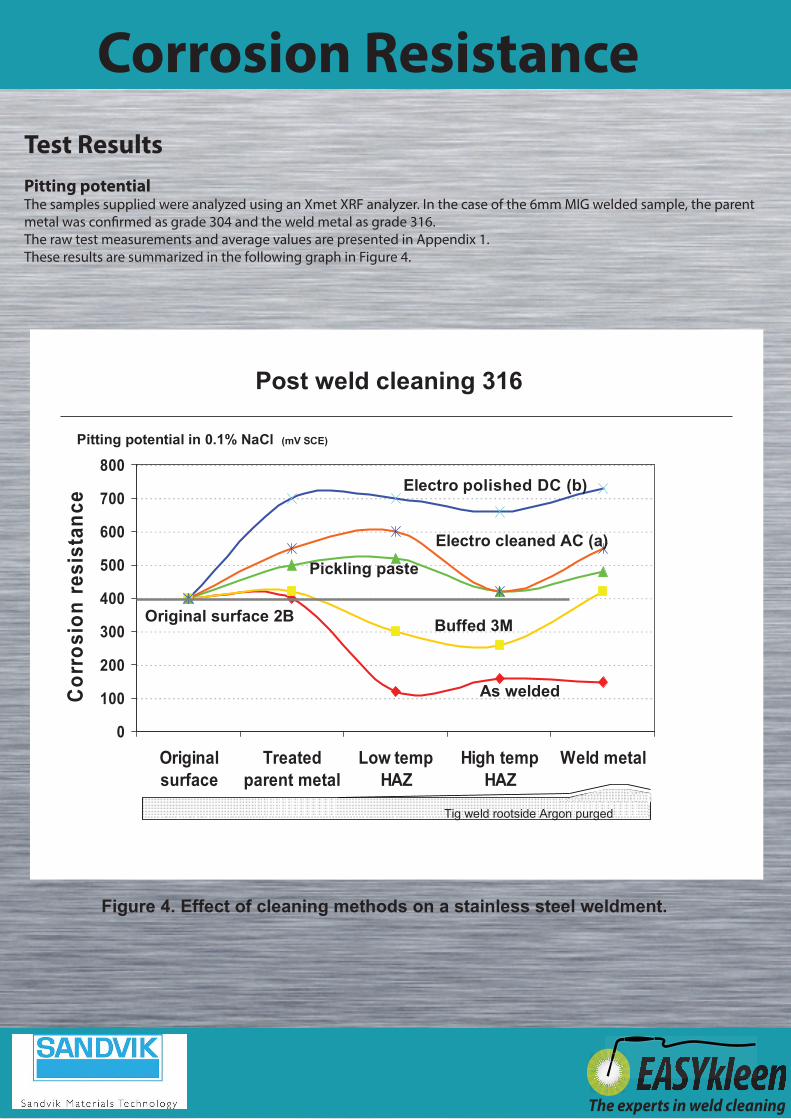
Figure 4. Effect of cleaning methods on a stainless steel weldment.
Post weld cleaning 316
Pitting potential in 0.1% NaCl (mV SCE)
0
100
200
300
400
500
600
700
800
Originalsurface
Treatedparent metal
Low tempHAZ
High tempHAZ
Weld metal
Corr
osio
n re
sist
ance
Buffed 3M
As welded
Pickling paste
Electro polished DC (b)
Original surface 2B
Tig weld rootside Argon purged
Electro cleaned AC (a)
Test ResultsPitting potential The samples supplied were analyzed using an Xmet XRF analyzer. In the case of the 6mm MIG welded sample, the parent metal was con�rmed as grade 304 and the weld metal as grade 316.The raw test measurements and average values are presented in Appendix 1. These results are summarized in the following graph in Figure 4.
The experts in weld cleaning
Corrosion Resistance
Corrosion Potential Scan - As Welded
0.14
0.15
0.16
0.17
0.18
0.19
0.2
1 3 5 7 9 11 13 15 17 19 21 23 25 27 29 31 33 35 37 39 41 43 45 47 49
Time/Distance
Pote
ntia
l (m
V)
Corrosion Potential Scan - 3
0.14
0.15
0.16
0.17
0.18
0.19
0.2
1 3 5 7 9 11 13 15 17 19 21 23 25 27 29 31 33
Time/Distance
Pote
ntia
l (m
V)
Corrosion Potential Scan - 5
0.14
0.15
0.16
0.17
0.18
0.19
0.2
1 3 5 7 9 11 13 15 17 19 21 23 25 27 29 31 33 35 37 39 41 43
Time/Distance
Pote
ntia
l (m
V)
ConclusionsThe two test methods employed to evaluate the e�ect of surface treatments on the pitting corrosion resistance of weldments produced similar results. These tests con�rmed that all cleaning methods improve the corrosion resistance of the weldments, however mechanical abrasion has the least positive e�ect. The standard method used for cleaning weldments with pickling paste showed positive results, however it did not return the surface to the same level of corrosion resistance as the parent metal in the high temperature heat a�ected zone. The largest improvement in corrosion resistance was demonstrated by the mepBLITz with the carbon �ber brush, which exceeded the performance of the pickling paste and returned the overall corrosion resistance of the entire weld-ment close to and in some areas exceeding that of the parent metal.
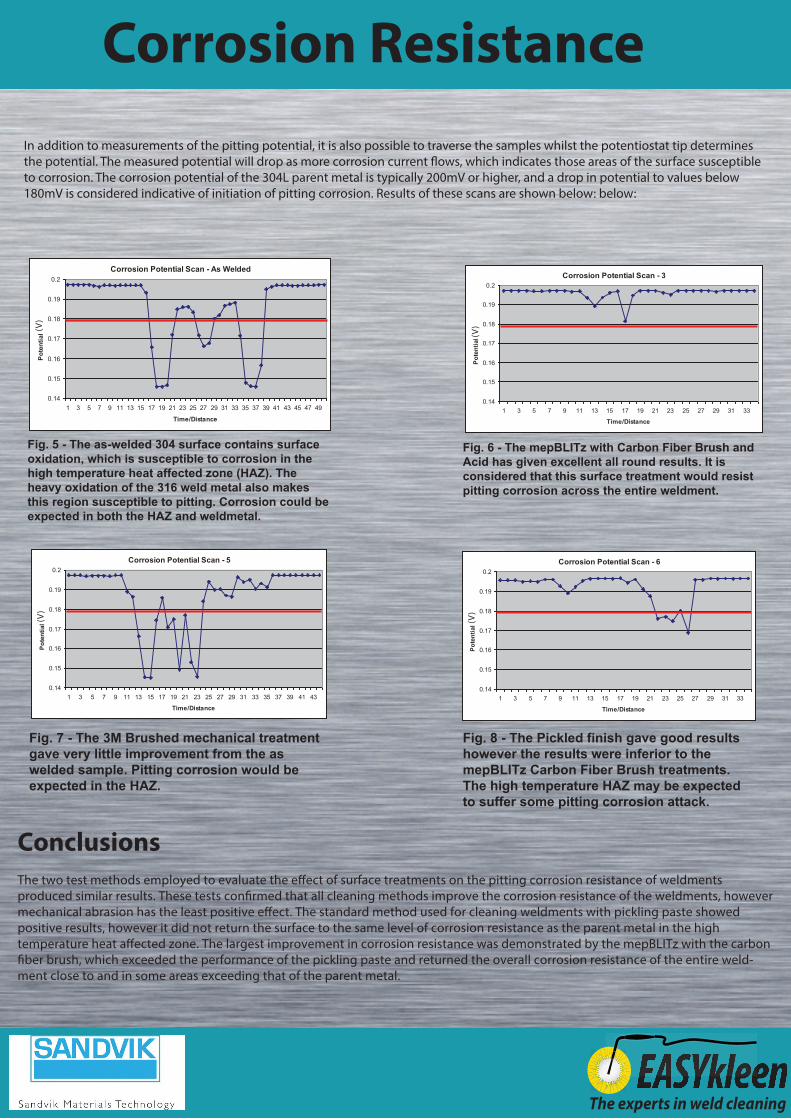
Fig. 5 - The as-welded 304 surface contains surface oxidation, which is susceptible to corrosion in the high temperature heat affected zone (HAZ). The heavy oxidation of the 316 weld metal also makes this region susceptible to pitting. Corrosion could be expected in both the HAZ and weldmetal.
Fig. 6 - The mepBLITz with Carbon Fiber Brush and Acid has given excellent all round results. It is considered that this surface treatment would resist pitting corrosion across the entire weldment.
Fig. 7 - The 3M Brushed mechanical treatment gave very little improvement from the as welded sample. Pitting corrosion would be expected in the HAZ.
Fig. 8 - The Pickled finish gave good results however the results were inferior to the mepBLITz Carbon Fiber Brush treatments. The high temperature HAZ may be expected to suffer some pitting corrosion attack.
Corrosion Potential Scan - 6
0.14
0.15
0.16
0.17
0.18
0.19
0.2
1 3 5 7 9 11 13 15 17 19 21 23 25 27 29 31 33
Time/Distance
Pote
ntia
l (m
V)(V
)
(V)
(V)
(V)
In addition to measurements of the pitting potential, it is also possible to traverse the samples whilst the potentiostat tip determines the potential. The measured potential will drop as more corrosion current �ows, which indicates those areas of the surface susceptible to corrosion. The corrosion potential of the 304L parent metal is typically 200mV or higher, and a drop in potential to values below 180mV is considered indicative of initiation of pitting corrosion. Results of these scans are shown below: below:
The experts in weld cleaning
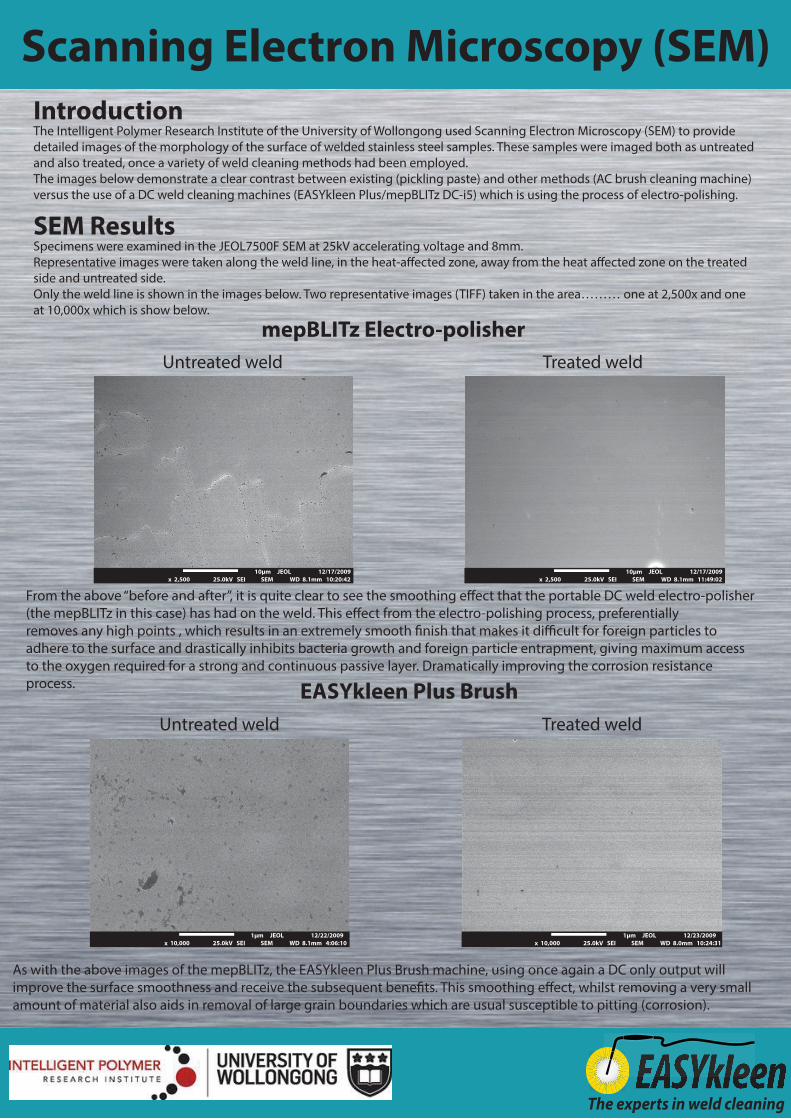
Scanning Electron Microscopy (SEM)IntroductionThe Intelligent Polymer Research Institute of the University of Wollongong used Scanning Electron Microscopy (SEM) to provide detailed images of the morphology of the surface of welded stainless steel samples. These samples were imaged both as untreated and also treated, once a variety of weld cleaning methods had been employed.The images below demonstrate a clear contrast between existing (pickling paste) and other methods (AC brush cleaning machine) versus the use of a DC weld cleaning machines (EASYkleen Plus/mepBLITz DC-i5) which is using the process of electro-polishing.
x 2,500 25.0kV SEI SEM WD 8.1mm 11:49:0210µm JEOL 12/17/2009
x 2,500 25.0kV SEI SEM WD 8.1mm 10:20:4210µm JEOL 12/17/2009
x 10,000 25.0kV SEI SEM WD 8.1mm 4:06:101µm JEOL 12/22/2009
x 10,000 25.0kV SEI SEM WD 8.0mm 10:24:311µm JEOL 12/23/2009
SEM ResultsSpecimens were examined in the JEOL7500F SEM at 25kV accelerating voltage and 8mm.Representative images were taken along the weld line, in the heat-a�ected zone, away from the heat a�ected zone on the treated side and untreated side. Only the weld line is shown in the images below. Two representative images (TIFF) taken in the area……… one at 2,500x and one at 10,000x which is show below.
mepBLITz Electro-polisherUntreated weld
Untreated weld
Treated weld
Treated weld
EASYkleen Plus Brush
From the above “before and after”, it is quite clear to see the smoothing e�ect that the portable DC weld electro-polisher (the mepBLITz in this case) has had on the weld. This e�ect from the electro-polishing process, preferentially removes any high points , which results in an extremely smooth �nish that makes it di�cult for foreign particles to adhere to the surface and drastically inhibits bacteria growth and foreign particle entrapment, giving maximum access to the oxygen required for a strong and continuous passive layer. Dramatically improving the corrosion resistance process.
As with the above images of the mepBLITz, the EASYkleen Plus Brush machine, using once again a DC only output will improve the surface smoothness and receive the subsequent bene�ts. This smoothing e�ect, whilst removing a very small amount of material also aids in removal of large grain boundaries which are usual susceptible to pitting (corrosion).
The experts in weld cleaning
x 10,000 25.0kV SEI SEM WD 8.1mm 9:22:531µm JEOL 12/16/2009
x 10,000 25.0kV SEI SEM WD 8.1mm 10:54:161µm JEOL 12/16/2009
x 10,000 25.0kV SEI SEM WD 8.0mm 3:40:061µm JEOL 1/5/2010
x 10,000 25.0kV SEI SEM WD 8.0mm 5:09:081µm JEOL 1/5/2010
Scanning Electron Microscopy (SEM)
Untreated weld
Untreated weld Treated weld
Treated weld
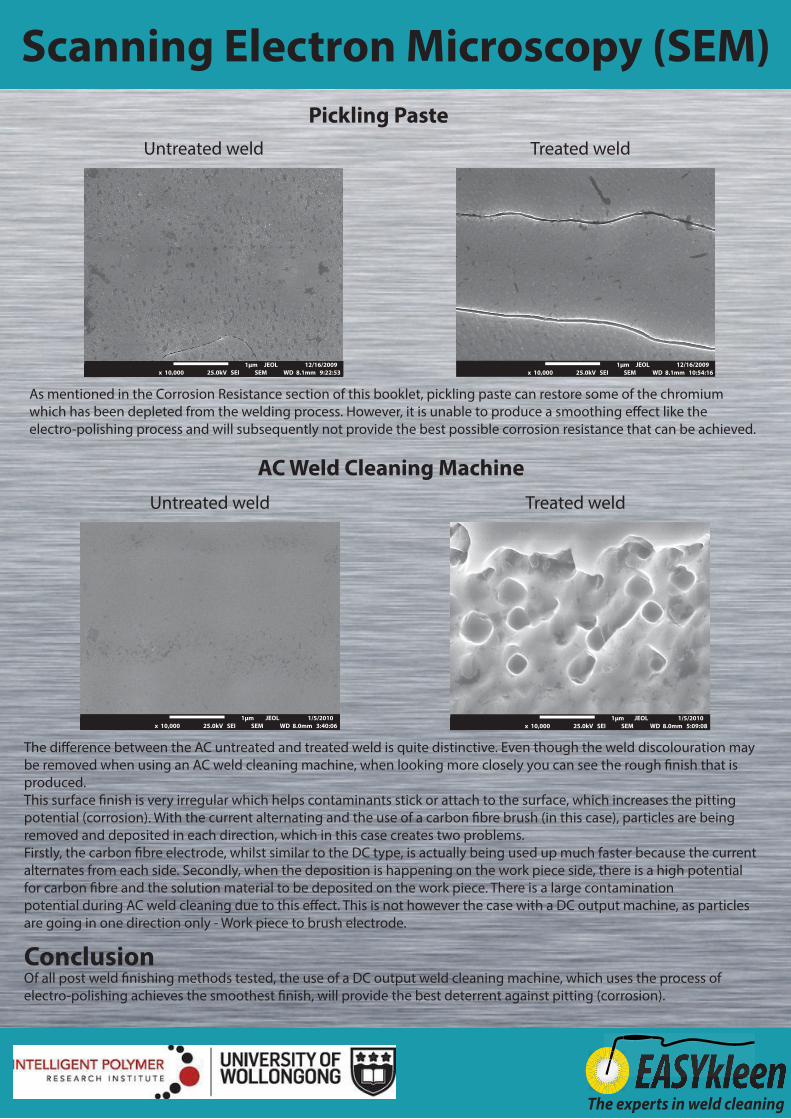
Pickling Paste
AC Weld Cleaning Machine
As mentioned in the Corrosion Resistance section of this booklet, pickling paste can restore some of the chromium which has been depleted from the welding process. However, it is unable to produce a smoothing e�ect like the electro-polishing process and will subsequently not provide the best possible corrosion resistance that can be achieved.
The di�erence between the AC untreated and treated weld is quite distinctive. Even though the weld discolouration may be removed when using an AC weld cleaning machine, when looking more closely you can see the rough �nish that is produced. This surface �nish is very irregular which helps contaminants stick or attach to the surface, which increases the pitting potential (corrosion). With the current alternating and the use of a carbon �bre brush (in this case), particles are being removed and deposited in each direction, which in this case creates two problems. Firstly, the carbon �bre electrode, whilst similar to the DC type, is actually being used up much faster because the current alternates from each side. Secondly, when the deposition is happening on the work piece side, there is a high potential for carbon �bre and the solution material to be deposited on the work piece. There is a large contamination potential during AC weld cleaning due to this e�ect. This is not however the case with a DC output machine, as particles are going in one direction only - Work piece to brush electrode.
ConclusionOf all post weld �nishing methods tested, the use of a DC output weld cleaning machine, which uses the process of electro-polishing achieves the smoothest �nish, will provide the best deterrent against pitting (corrosion).
The experts in weld cleaning
XPS Surface Analysis
Background MST has developed a number of processes to restore surface �nish and corrosion resistance in stainless steels that have been subject to welding. Although these processes are already e�ective, further optimization requires a more detailed understanding of the process chemistry. Preliminary work suggested that X-ray photoelectron spectroscopy (XPS) can provide useful information on surface chemistry. However, this work used a system with low spatial resolution (spot size of several mm). An XPS linescan across the weld at higher resolution is required to understand the process impact on things such as the heat a�ected zone near the joint. The system currently available at Newcastle is unable to perform this type of data collection, but there are several other systems available within Australian universities with the required capability (for example, LaTrobe, Queensland, Adelaide, UNSW).
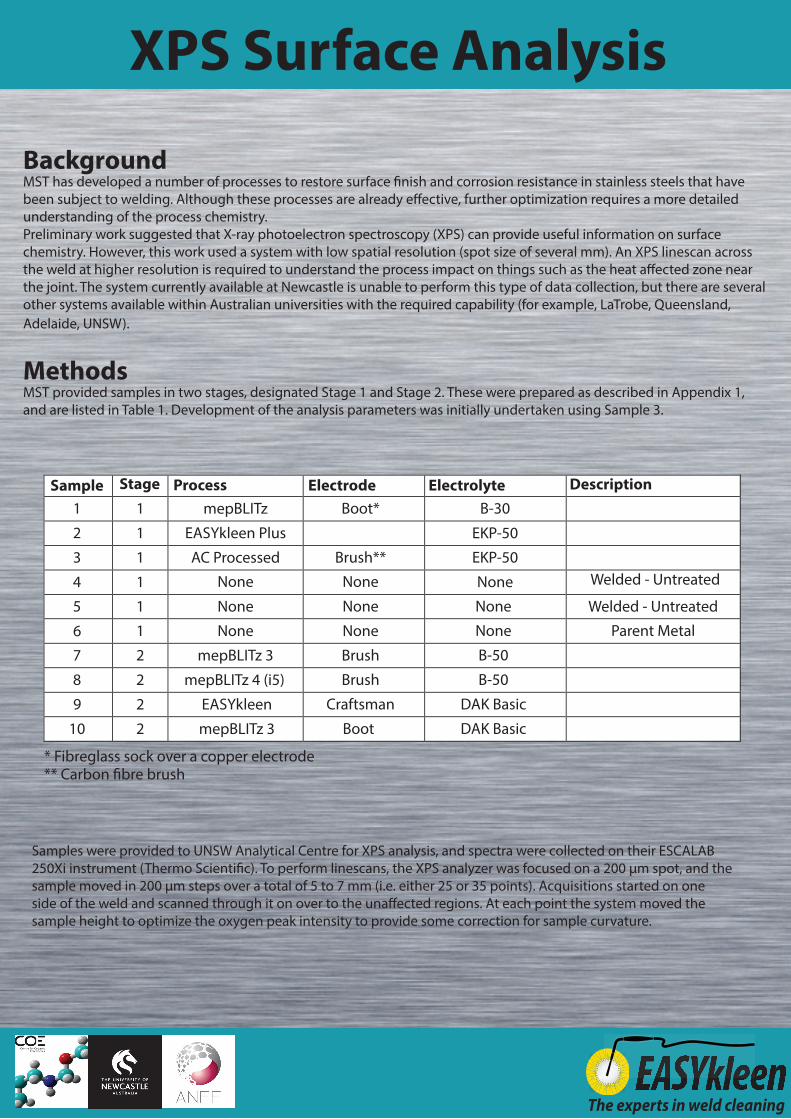
Methods MST provided samples in two stages, designated Stage 1 and Stage 2. These were prepared as described in Appendix 1, and are listed in Table 1. Development of the analysis parameters was initially undertaken using Sample 3.
Sample Stage Process Electrode Electrolyte Description1
2
3
4
5
6
7
8
9
10
1
1
1
1
1
1
2
2
2
2
mepBLITz
EASYkleen Plus
AC Processed
None
None
None
mepBLITz 3
mepBLITz 4 (i5)
mepBLITz 3
EASYkleen
None
None
None
B-50
B-50
B-30
EKP-50
EKP-50
DAK Basic
DAK Basic
Boot*
Brush**
None
None
None
Brush
Brush
Boot
Craftsman
Welded - Untreated
Welded - Untreated
Parent Metal
* Fibreglass sock over a copper electrode** Carbon �bre brush
Samples were provided to UNSW Analytical Centre for XPS analysis, and spectra were collected on their ESCALAB 250Xi instrument (Thermo Scienti�c). To perform linescans, the XPS analyzer was focused on a 200 µm spot, and the sample moved in 200 µm steps over a total of 5 to 7 mm (i.e. either 25 or 35 points). Acquisitions started on one side of the weld and scanned through it on over to the una�ected regions. At each point the system moved the sample height to optimize the oxygen peak intensity to provide some correction for sample curvature.
The experts in weld cleaning
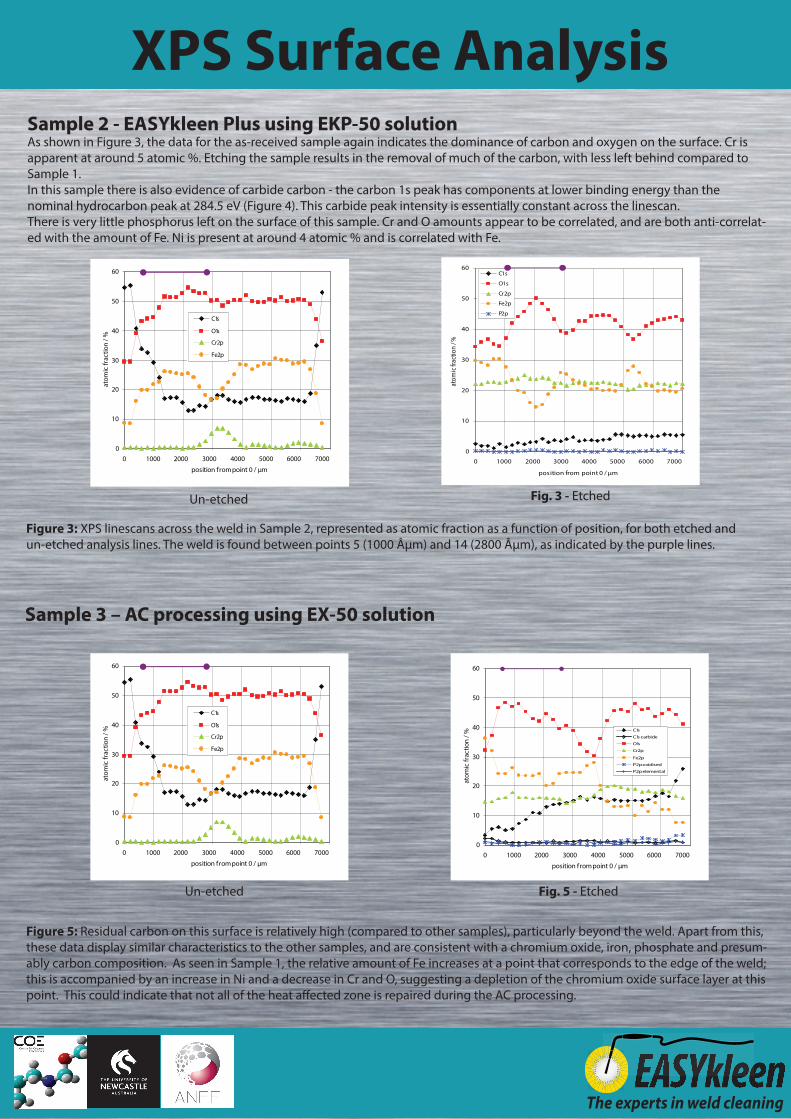
Sample 2 - EASYkleen Plus using EKP-50 solution As shown in Figure 3, the data for the as-received sample again indicates the dominance of carbon and oxygen on the surface. Cr is apparent at around 5 atomic %. Etching the sample results in the removal of much of the carbon, with less left behind compared to Sample 1. In this sample there is also evidence of carbide carbon - the carbon 1s peak has components at lower binding energy than the nominal hydrocarbon peak at 284.5 eV (Figure 4). This carbide peak intensity is essentially constant across the linescan. There is very little phosphorus left on the surface of this sample. Cr and O amounts appear to be correlated, and are both anti-correlat-ed with the amount of Fe. Ni is present at around 4 atomic % and is correlated with Fe.
0
10
20
30
40
50
60
0 1000 2000 3000 4000 5000 6000 7000
position from point 0 / µm
atom
ic fr
actio
n / %
C1s
O1s
Cr2p
Fe2p
P2p
Figure 3: XPS linescans across the weld in Sample 2, represented as atomic fraction as a function of position, for both etched and un-etched analysis lines. The weld is found between points 5 (1000 µm) and 14 (2800 µm), as indicated by the purple lines.
Figure 5: Residual carbon on this surface is relatively high (compared to other samples), particularly beyond the weld. Apart from this, these data display similar characteristics to the other samples, and are consistent with a chromium oxide, iron, phosphate and presum-ably carbon composition. As seen in Sample 1, the relative amount of Fe increases at a point that corresponds to the edge of the weld; this is accompanied by an increase in Ni and a decrease in Cr and O, suggesting a depletion of the chromium oxide surface layer at this point. This could indicate that not all of the heat a�ected zone is repaired during the AC processing.
0
10
20
30
40
50
60
0 1000 2000 3000 4000 5000 6000 7000
position from point 0 / µm
atom
ic fr
actio
n / %
C1s
O1s
Cr2p
Fe2p
Fig. 3 - Etched
Sample 3 – AC processing using EX-50 solution
Un-etched Fig. 5 - Etched
0
10
20
30
40
50
60
0 1000 2000 3000 4000 5000 6000 7000
position from point 0 / µm
atom
ic fr
actio
n / %
C1s
O1s
Cr2p
Fe2p
Un-etched
XPS Surface Analysis
0
10
20
30
40
50
60
0 1000 2000 3000 4000 5000 6000 7000
position from point 0 / µm
atom
ic fr
actio
n / %
C1s
C1s carbide
O1s
Cr2p
Fe2p
P2p oxidised
P2p elemental
The experts in weld cleaning
0
10
20
30
40
50
60
0 1000 2000 3000 4000 5000 6000 7000
position from point 0 / µm
atom
ic fr
actio
n / %
C1s
O1s
Cr2p
Fe2p
Fig. 7 - Un-etched
0
10
20
30
40
50
0 1000 2000 3000 4000 5000 6000position from point 0 / µm
atom
ic fr
actio
n / %
C1s
C1s carbide
O1s
Cr2p
Fe2p
P2p oxidised
P2p elemental
Fig. 9 - Etched
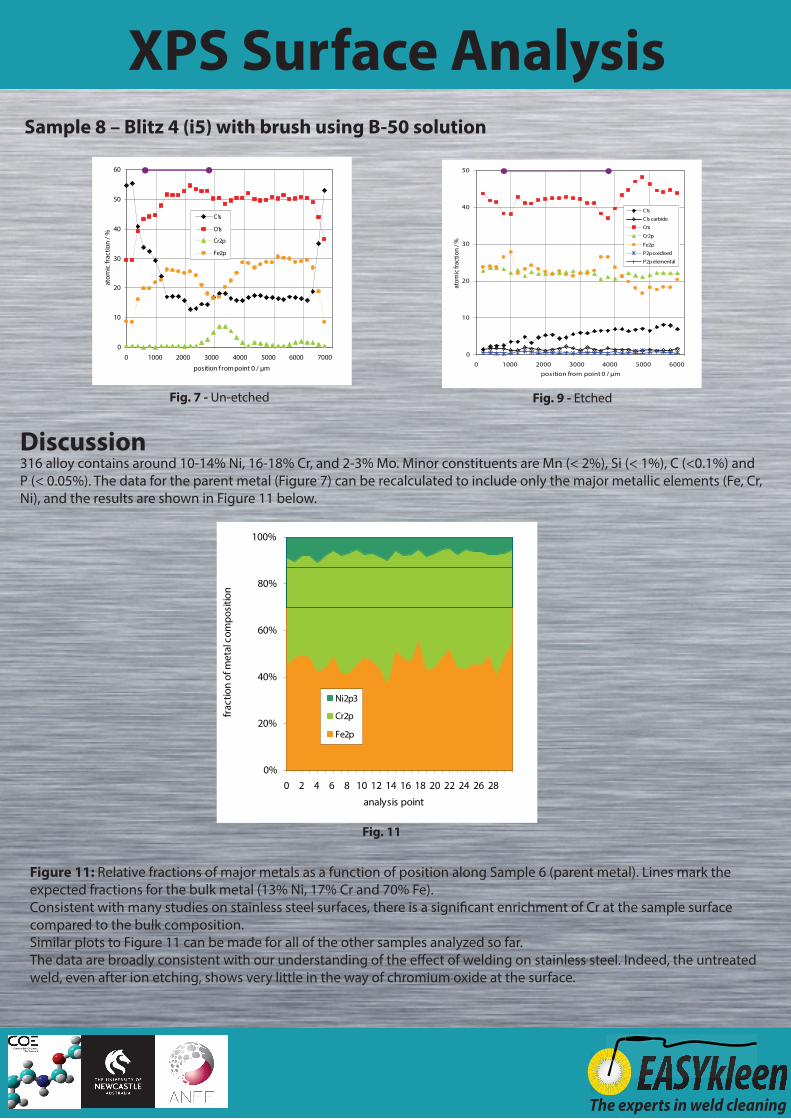
Sample 8 – Blitz 4 (i5) with brush using B-50 solution
Discussion 316 alloy contains around 10-14% Ni, 16-18% Cr, and 2-3% Mo. Minor constituents are Mn (< 2%), Si (< 1%), C (<0.1%) and P (< 0.05%). The data for the parent metal (Figure 7) can be recalculated to include only the major metallic elements (Fe, Cr, Ni), and the results are shown in Figure 11 below.
0%
20%
40%
60%
80%
100%
0 2 4 6 8 10 12 14 16 18 20 22 24 26 28
analysis point
frac
tion
of m
etal
com
posi
tion
Ni2p3
Cr2p
Fe2p
Figure 11: Relative fractions of major metals as a function of position along Sample 6 (parent metal). Lines mark the expected fractions for the bulk metal (13% Ni, 17% Cr and 70% Fe). Consistent with many studies on stainless steel surfaces, there is a signi�cant enrichment of Cr at the sample surface compared to the bulk composition. Similar plots to Figure 11 can be made for all of the other samples analyzed so far. The data are broadly consistent with our understanding of the e�ect of welding on stainless steel. Indeed, the untreated weld, even after ion etching, shows very little in the way of chromium oxide at the surface.
XPS Surface Analysis
Fig. 11
The experts in weld cleaning
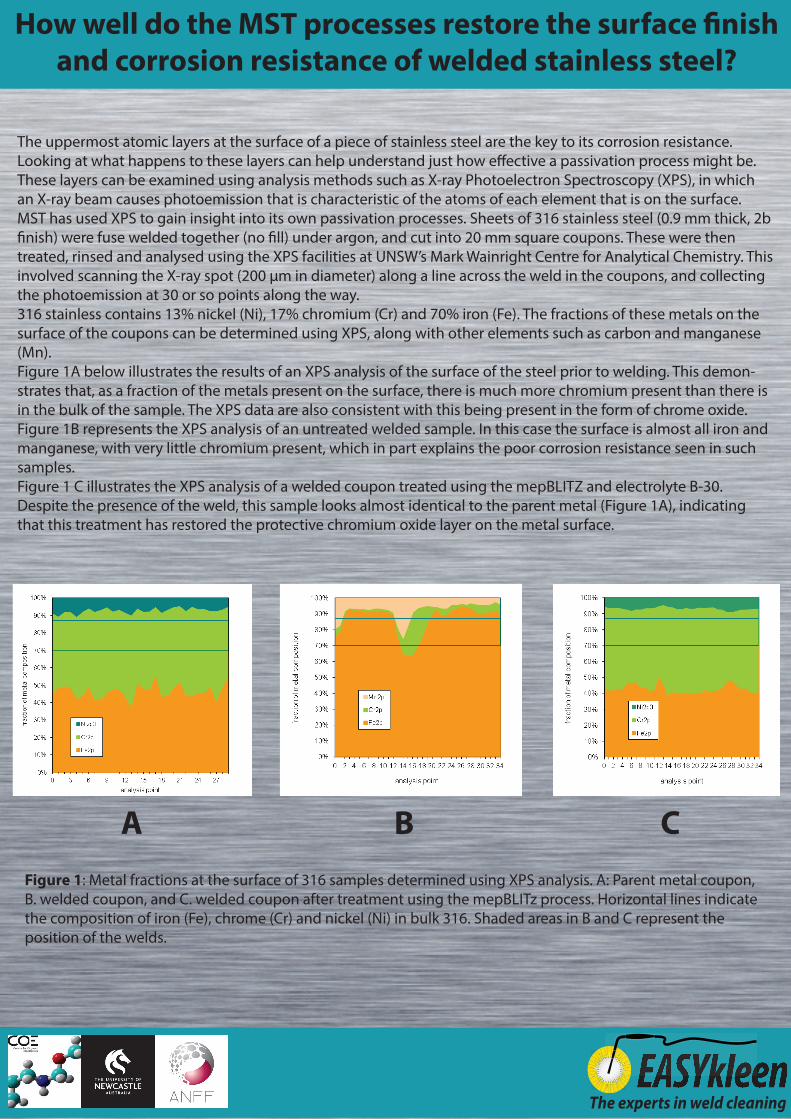
The uppermost atomic layers at the surface of a piece of stainless steel are the key to its corrosion resistance. Looking at what happens to these layers can help understand just how e�ective a passivation process might be. These layers can be examined using analysis methods such as X-ray Photoelectron Spectroscopy (XPS), in which an X-ray beam causes photoemission that is characteristic of the atoms of each element that is on the surface.MST has used XPS to gain insight into its own passivation processes. Sheets of 316 stainless steel (0.9 mm thick, 2b �nish) were fuse welded together (no �ll) under argon, and cut into 20 mm square coupons. These were then treated, rinsed and analysed using the XPS facilities at UNSW’s Mark Wainright Centre for Analytical Chemistry. This involved scanning the X-ray spot (200 µm in diameter) along a line across the weld in the coupons, and collecting the photoemission at 30 or so points along the way.316 stainless contains 13% nickel (Ni), 17% chromium (Cr) and 70% iron (Fe). The fractions of these metals on the surface of the coupons can be determined using XPS, along with other elements such as carbon and manganese (Mn). Figure 1A below illustrates the results of an XPS analysis of the surface of the steel prior to welding. This demon-strates that, as a fraction of the metals present on the surface, there is much more chromium present than there is in the bulk of the sample. The XPS data are also consistent with this being present in the form of chrome oxide. Figure 1B represents the XPS analysis of an untreated welded sample. In this case the surface is almost all iron and manganese, with very little chromium present, which in part explains the poor corrosion resistance seen in such samples. Figure 1 C illustrates the XPS analysis of a welded coupon treated using the mepBLITZ and electrolyte B-30. Despite the presence of the weld, this sample looks almost identical to the parent metal (Figure 1A), indicating that this treatment has restored the protective chromium oxide layer on the metal surface.
How well do the MST processes restore the surface �nish and corrosion resistance of welded stainless steel?
Figure 1: Metal fractions at the surface of 316 samples determined using XPS analysis. A: Parent metal coupon, B. welded coupon, and C. welded coupon after treatment using the mepBLITz process. Horizontal lines indicate the composition of iron (Fe), chrome (Cr) and nickel (Ni) in bulk 316. Shaded areas in B and C represent the position of the welds.
A B C
The experts in weld cleaning
References1. For example, see M. Seo & N. Sato, Surface characterisation of stainless steels prepared with various surface treatments, Transactions of the Japan Institute of Metals, 21 (12), 1980, pp 805-810.2. I. Ward, Report on weld cleaning methods, Sandvik Technical Report, August 2007,http://www.metalscience.com.au/Research_Weld%20Cleaning%20methods.pdf , accessed April 3, 2011.3. For example, see K. Takahashi, J. A. Bardwell, B. MacDougall & M. J. Graham, Mechanism of anodic dissolution and passivation of iron – I. Behaviour in neutral acetate bu�er solutions, Electrochimica Acta, 37 (3), 1992, 477-487.4. S-A Fager, Sandvik Welding Reporter 1990. SWR-1905. The ec-pen in quality control: Determining the corrosion resistance of stainless steel on-site. M. Büchler, C.-H. Voûte, D. Bindschedler, and F. Stalder SGK, Swiss Society for Corrosion Protection, Technoparkstr. 1, CH-8005 Zürich, Switzerland6. Estimating the Pitting Resistance of Low-Alloy Stainless Steels. M. Berner, & S. Mischler, Laboratoire de Métallurgie Chimique, Ecole Polytechnique Fédérale de Lausanne C.-O. A. Olsson, Avesta Research Centre, Outokumpu, Sweden7. A new locally resolving electrochemical sensor: Application in research and development. M. Büchler, C.-H. Voûte and F. Stalder SGK, Swiss Society for Corrosion Protection, Technoparkstr. 1, CH-8005 Zürich, Switzerland
For more information on our weld cleaning machines and products, or the complete version of any of these reports, please contact EASYkleen directly through one of the op-tions below.
Website - www.easykleen.com.auEmail - [email protected] - +612 4474 3394
Additional InformationReport AuthorsCorrosion Resistance Report:Dr. Ian WardSandvik Materials Technology, Australia
SEM Report:Intelligent Polymer Research Institute University of Wollongong
XPS Surface Analysis Report: Dr. Glenn BryantANFF Materials Node (Newcastle) Facility ManagerCentre for Organic Electronics (Physics)University of Newcastle
The experts in weld cleaning