Embed Size (px)
Citation preview

Technical Indicators
Taken From:
Technical Analysis of the Financial Markets
A Comprehensive Guide to Trading Methods & Applications
John Murphy, New York Institute of Finance, Published 1999
Technical Indicators
SMU E.y.E Investment Interactive Club
Technical IndicatorsTechnical indicators look to predict the future price levels, or simply the general price direction, of a security by looking at past patterns 1
1 http://www.investopedia.com/terms/t/technicalindicator.asp
Technical Indicators
SMU E.y.E Investment Interactive Club
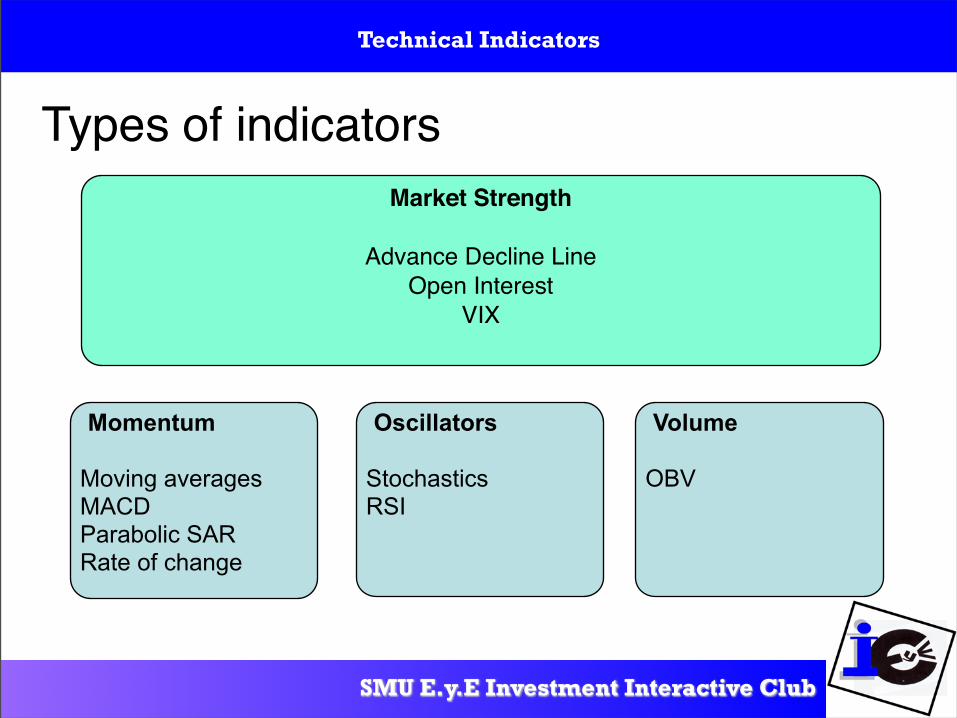
Types of indicatorsMarket Strength
Advance Decline LineOpen Interest
VIX
Momentum
Moving averagesMACDParabolic SARRate of change
Oscillators
StochasticsRSI
Volume
OBV
Technical Indicators
SMU E.y.E Investment Interactive Club
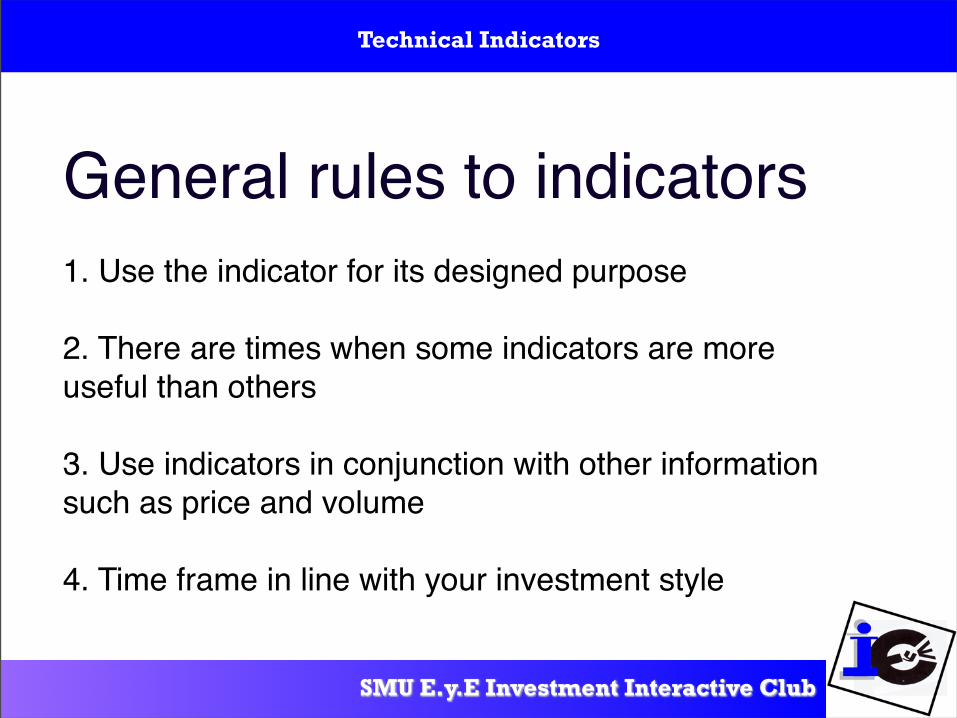
General rules to indicators1. Use the indicator for its designed purpose
2. There are times when some indicators are more useful than others
3. Use indicators in conjunction with other information such as price and volume
4. Time frame in line with your investment style
Technical Indicators
SMU E.y.E Investment Interactive Club
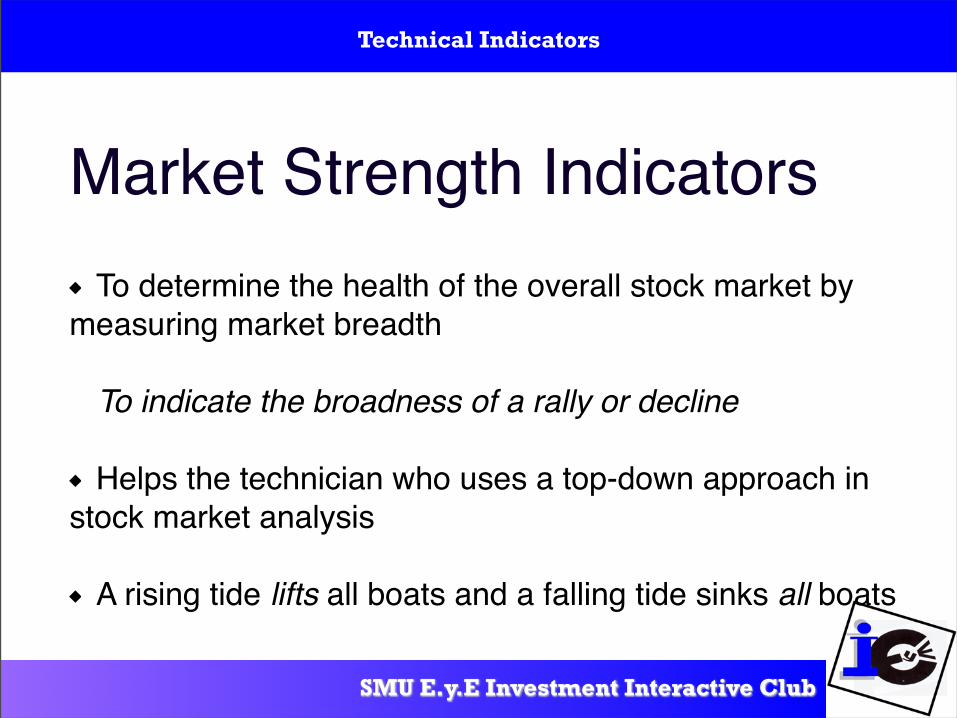
Market Strength IndicatorsTo determine the health of the overall stock market by
measuring market breadth
To indicate the broadness of a rally or decline
Helps the technician who uses a top-down approach in stock market analysis
A rising tide lifts all boats and a falling tide sinks all boats
Technical Indicators
SMU E.y.E Investment Interactive Club
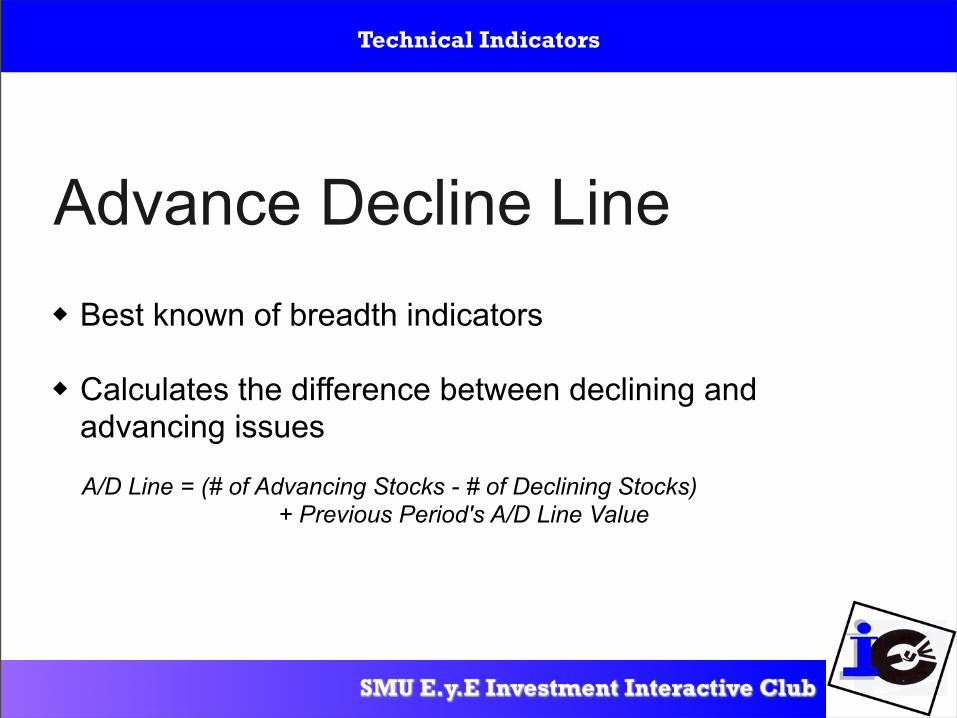
Advance Decline LineBest known of breadth indicators
Calculates the difference between declining and advancing issues
A/D Line = (# of Advancing Stocks - # of Declining Stocks) + Previous Period's A/D Line Value
SMU E.y.E Investment Interactive Club
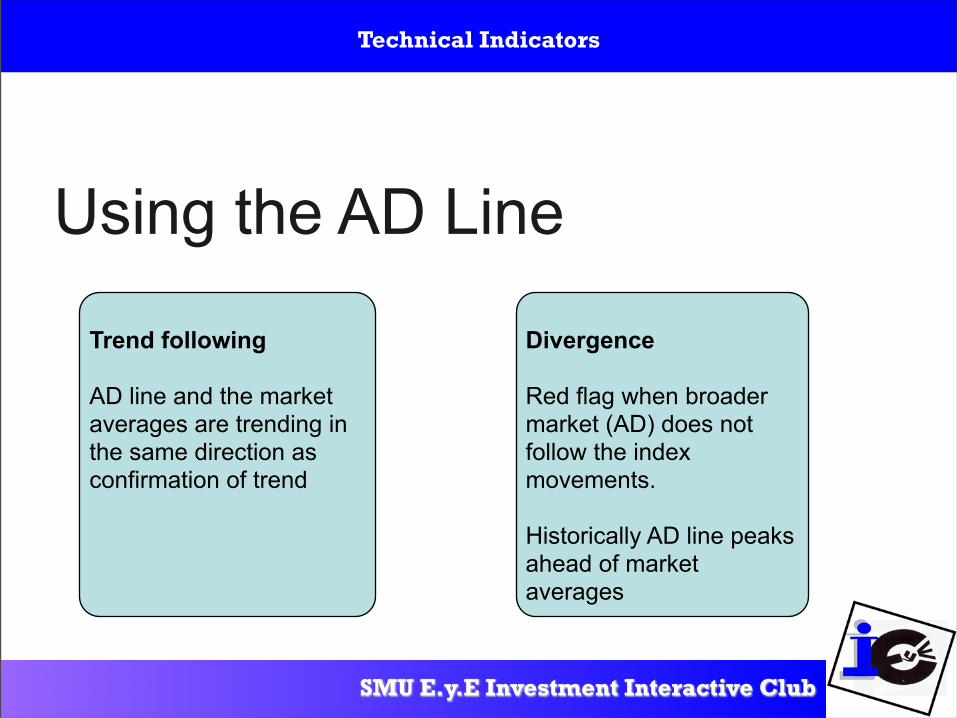
Using the AD Line
Trend following
AD line and the market averages are trending in the same direction as confirmation of trend
Divergence
Red flag when broader market (AD) does not follow the index movements.
Historically AD line peaks ahead of market averages
Technical Indicators
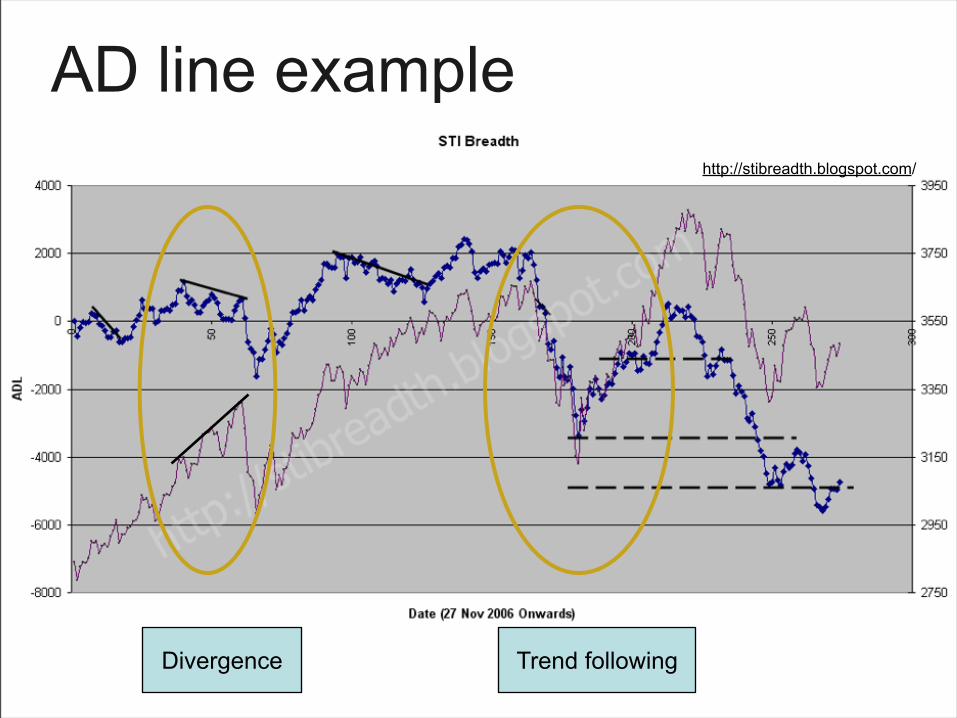
AD line examplehttp://stibreadth.blogspot.com/
Divergence Trend following
SMU E.y.E Investment Interactive Club
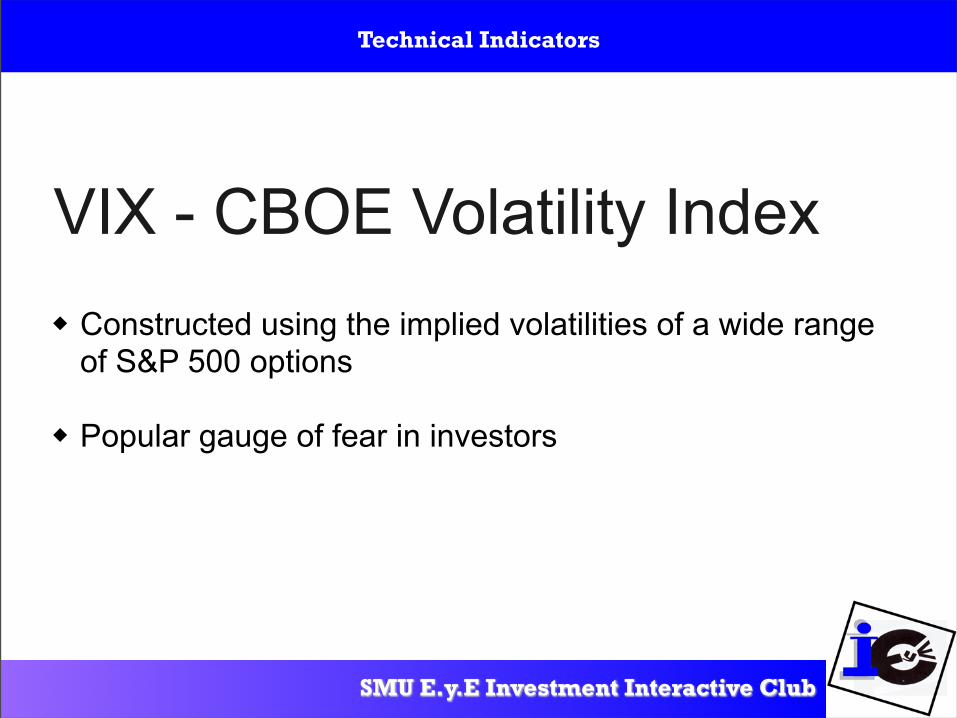
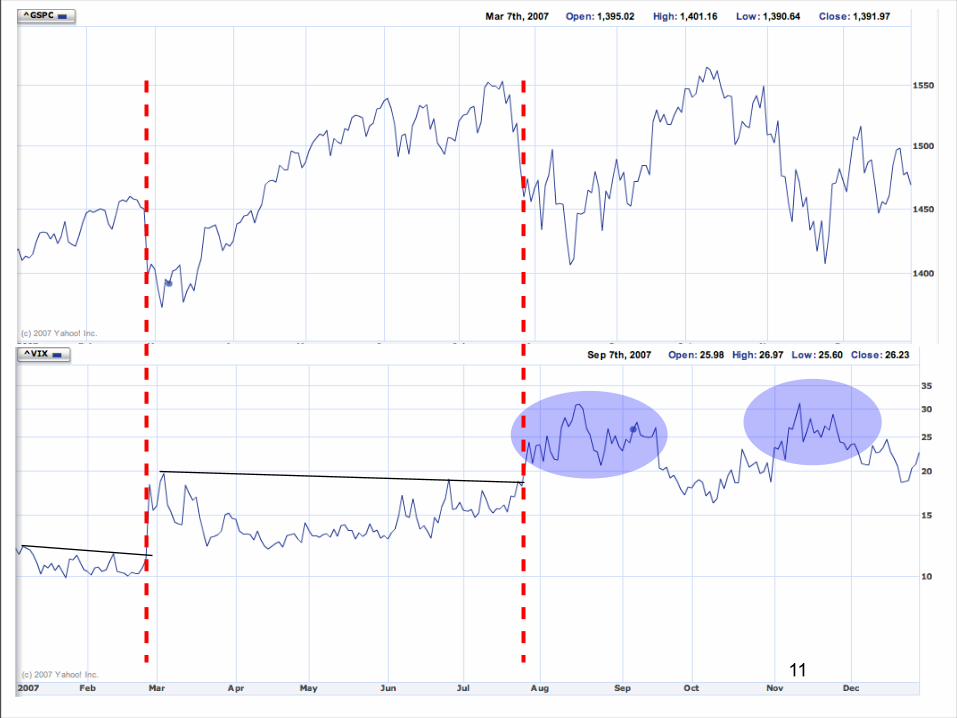
VIX - CBOE Volatility IndexConstructed using the implied volatilities of a wide rangeof S&P 500 options
Popular gauge of fear in investors
Technical Indicators
SMU E.y.E Investment Interactive Club
Using the VIX
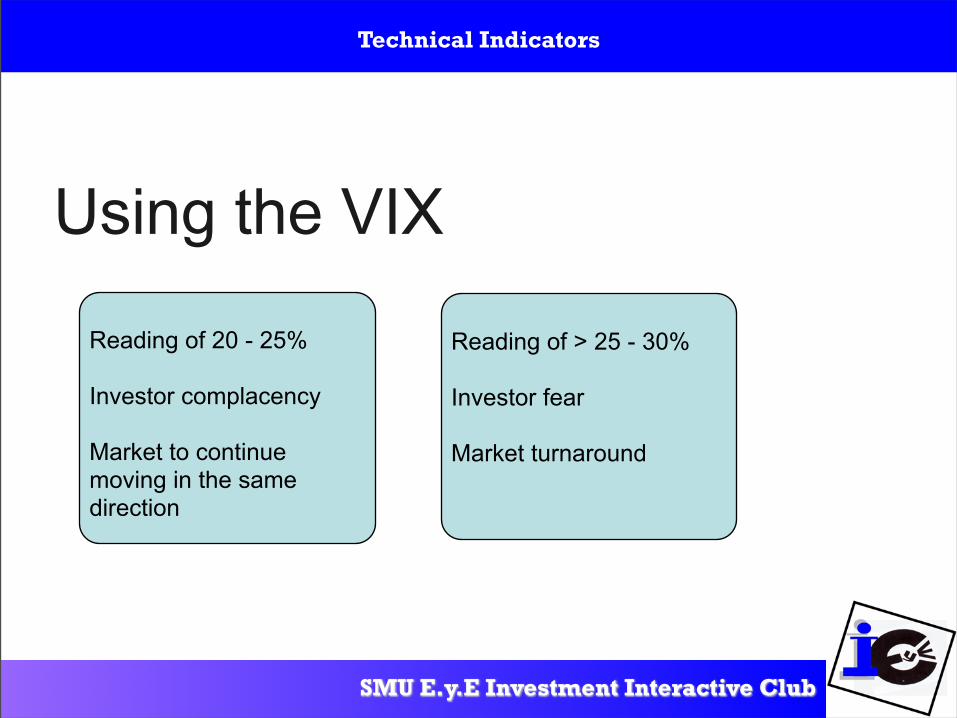
Reading of 20 - 25%
Investor complacency
Market to continue moving in the same direction
Reading of > 25 - 30%
Investor fear
Market turnaround
Technical Indicators
11
SMU E.y.E Investment Interactive Club
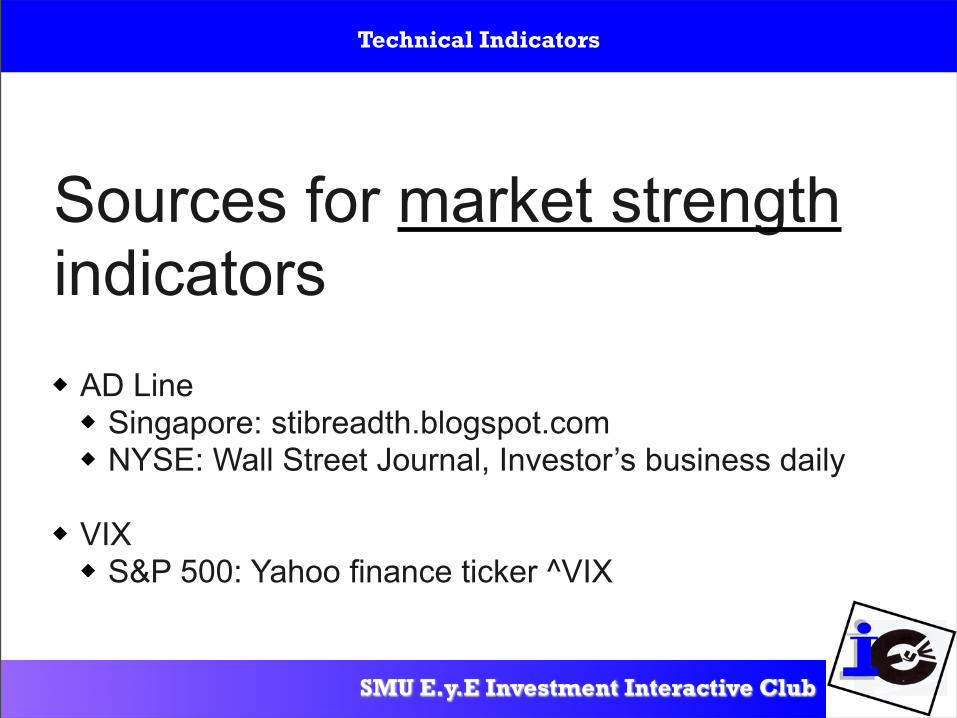
Sources for market strength indicators
AD LineSingapore: stibreadth.blogspot.comNYSE: Wall Street Journal, Investor’s business daily
VIXS&P 500: Yahoo finance ticker ^VIX
Technical Indicators
Technical Indicators
SMU E.y.E Investment Interactive Club
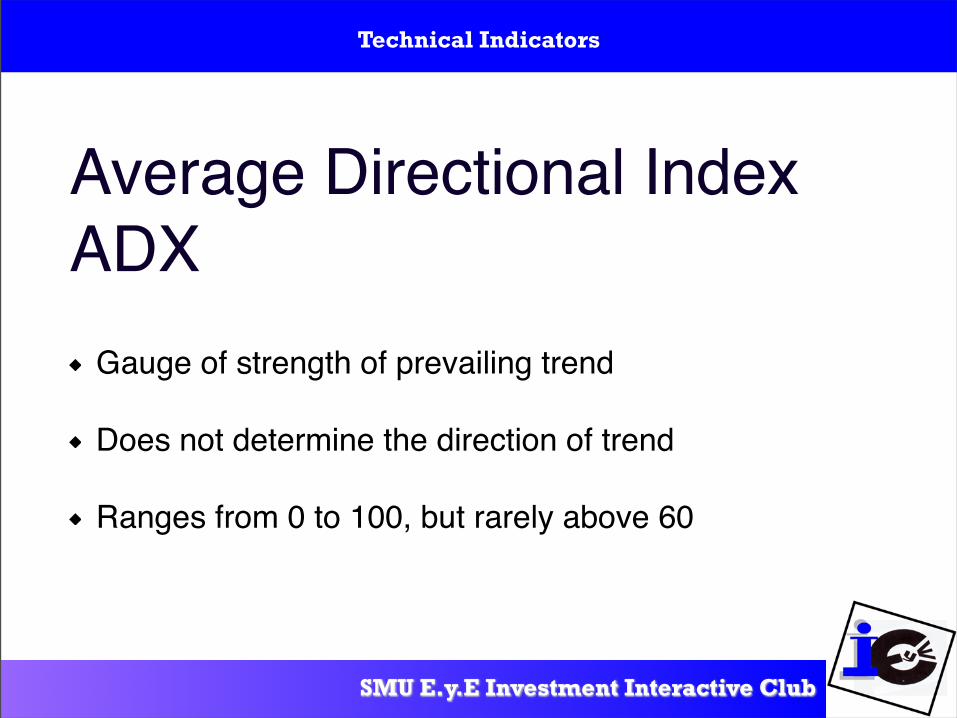
Average Directional IndexADX
Gauge of strength of prevailing trend
Does not determine the direction of trend
Ranges from 0 to 100, but rarely above 60
Technical Indicators
SMU E.y.E Investment Interactive Club
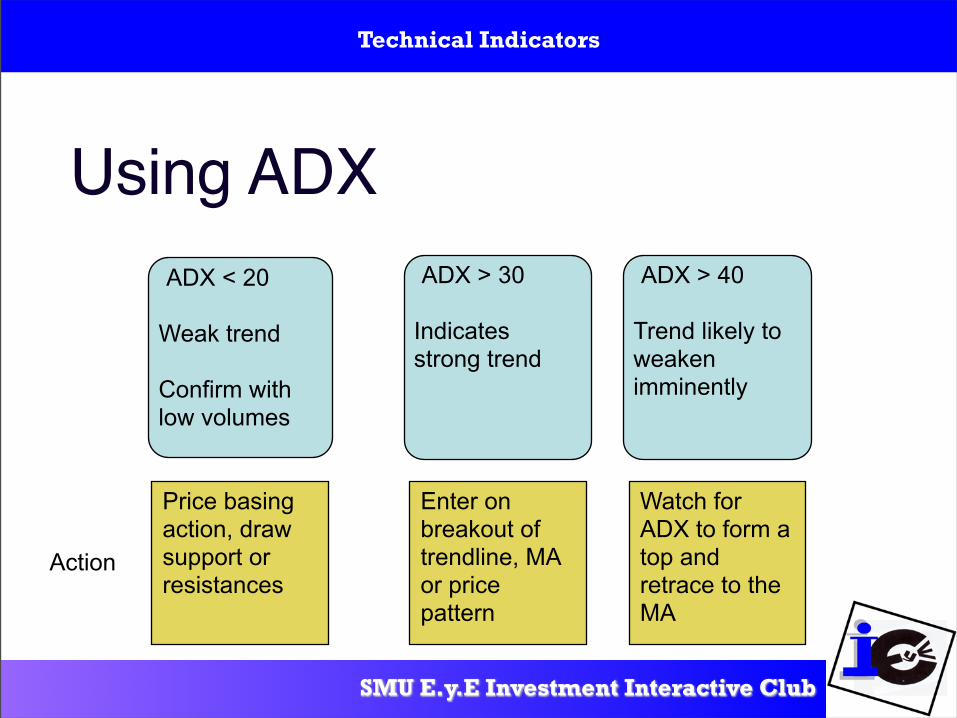
Using ADXADX > 30
Indicates strong trend
ADX < 20
Weak trend
Confirm with low volumes
ADX > 40
Trend likely to weaken imminently
Watch for ADX to form a top and retrace to the MA
Action
Enter on breakout of trendline, MA or price pattern
Price basing action, draw support or resistances
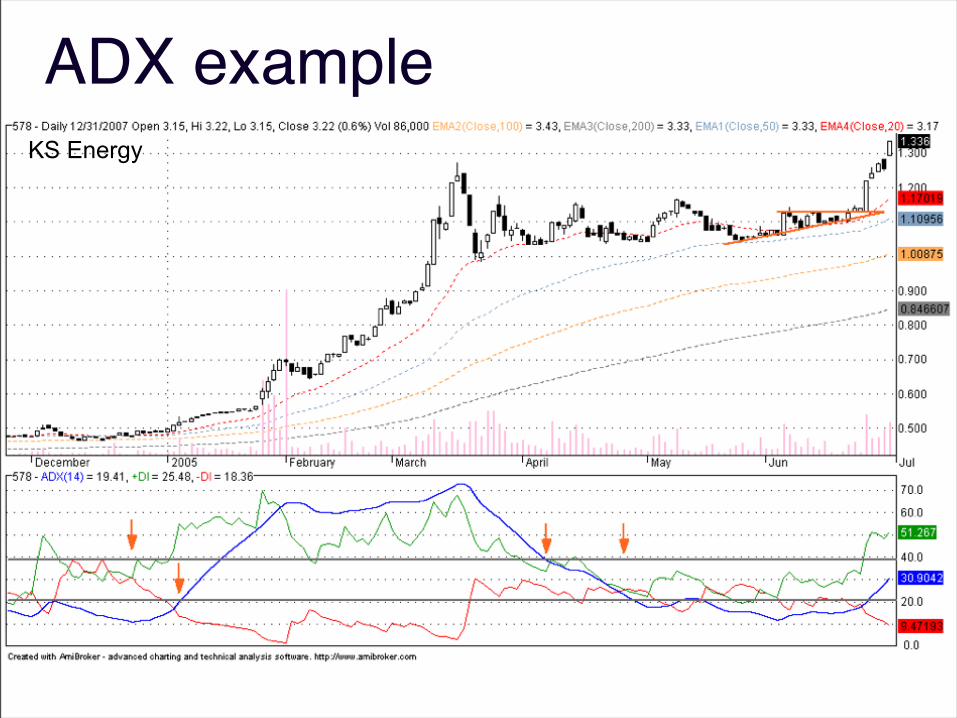
ADX exampleKS Energy
Technical Indicators
SMU E.y.E Investment Interactive Club
Momentum IndicatorsAs a guide to whether an uptrend or downtrend is sustained
Indicates the strength of the trend
Helps to spot overbought and oversold levels
Momentum precedes price
Technical Indicators
SMU E.y.E Investment Interactive Club
Caveat to momentum indicators
Prices can decline on falling momentum
Momentum indicators are secondary to price and volume
Momentum indicators most useful in trending markets
Technical Indicators
SMU E.y.E Investment Interactive Club
Rate of ChangeRate of change = Previous close / Close x days ago
Zero as an important level
Construction of formula may vary
Technical Indicators
SMU E.y.E Investment Interactive Club
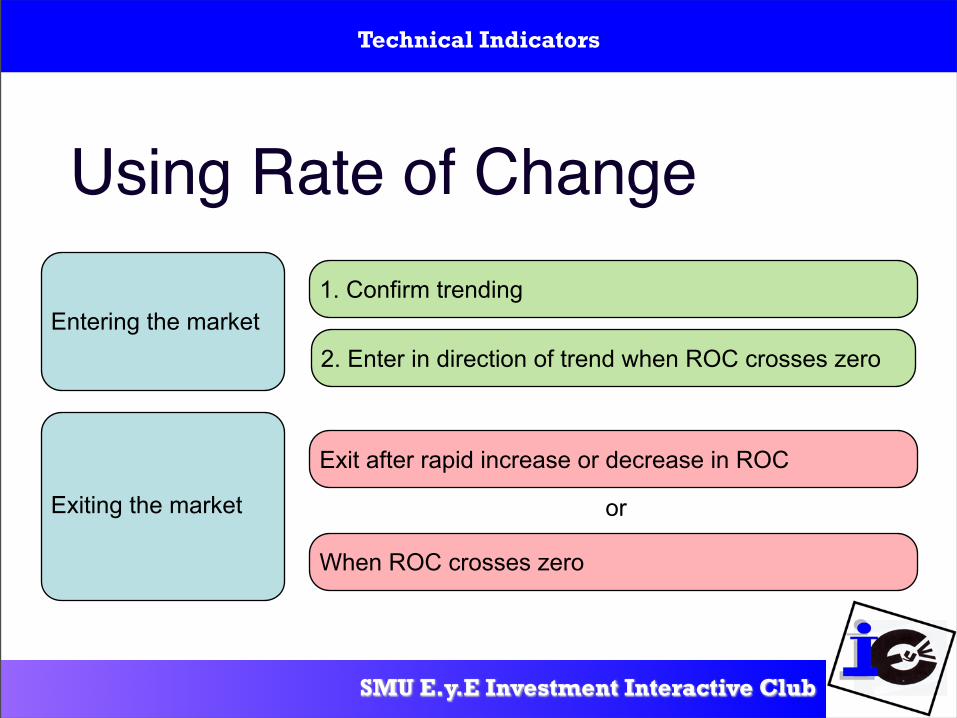
Using Rate of Change
Entering the market1. Confirm trending
2. Enter in direction of trend when ROC crosses zero
Exiting the market
Exit after rapid increase or decrease in ROC
When ROC crosses zero
or
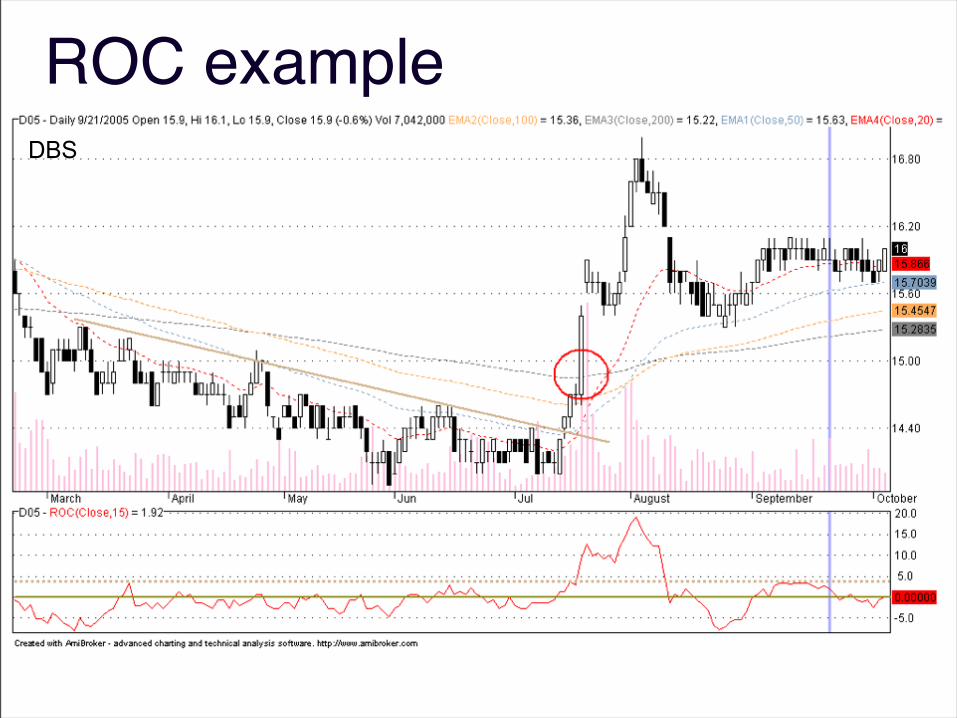
ROC exampleDBS
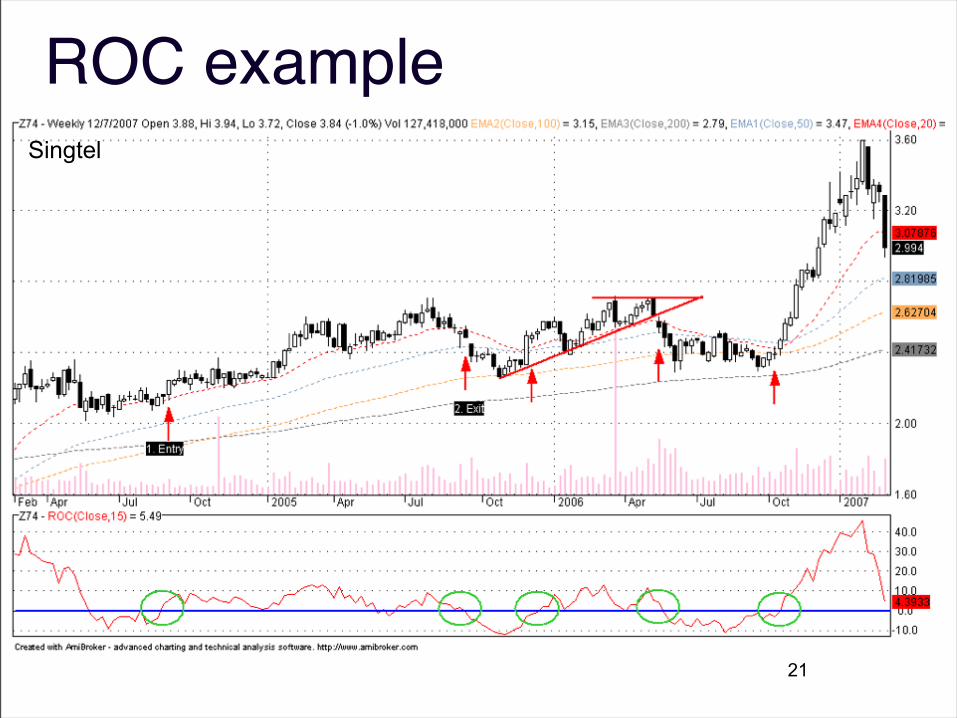
21
ROC exampleSingtel
Technical Indicators
SMU E.y.E Investment Interactive Club
Moving Average ConvergenceDivergence - MACD
Shows acceleration and deceleration of trend
Helps to spot major trend reversal
Has both moving averages and rate of change elements(lagging and leading)
Technical Indicators
SMU E.y.E Investment Interactive Club
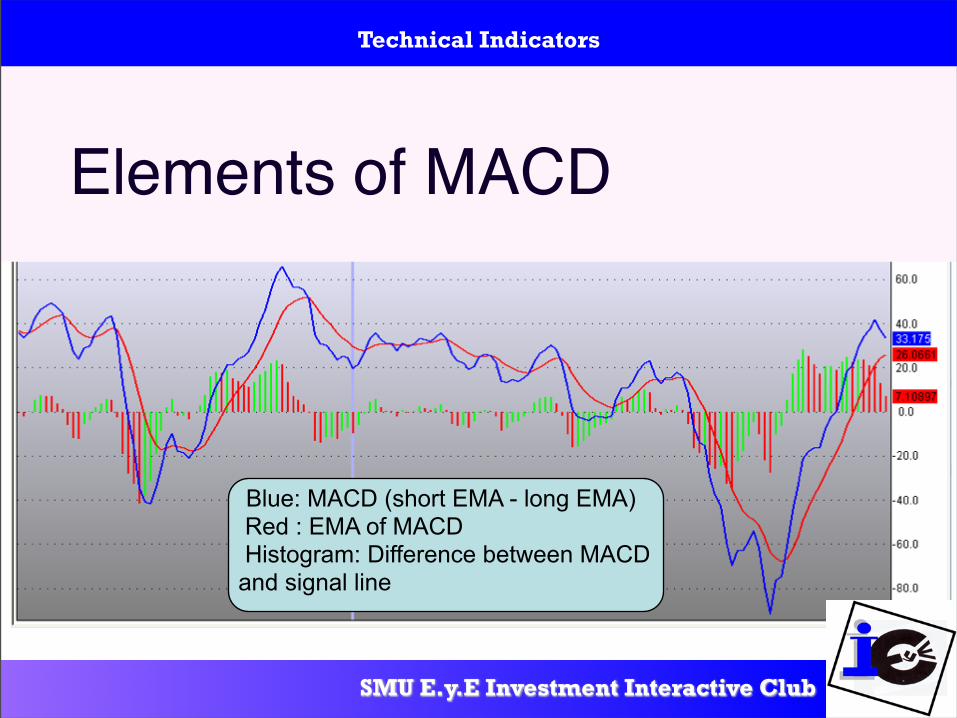
Elements of MACD
Blue: MACD (short EMA - long EMA) Red : EMA of MACD Histogram: Difference between MACD and signal line
Technical Indicators
SMU E.y.E Investment Interactive Club
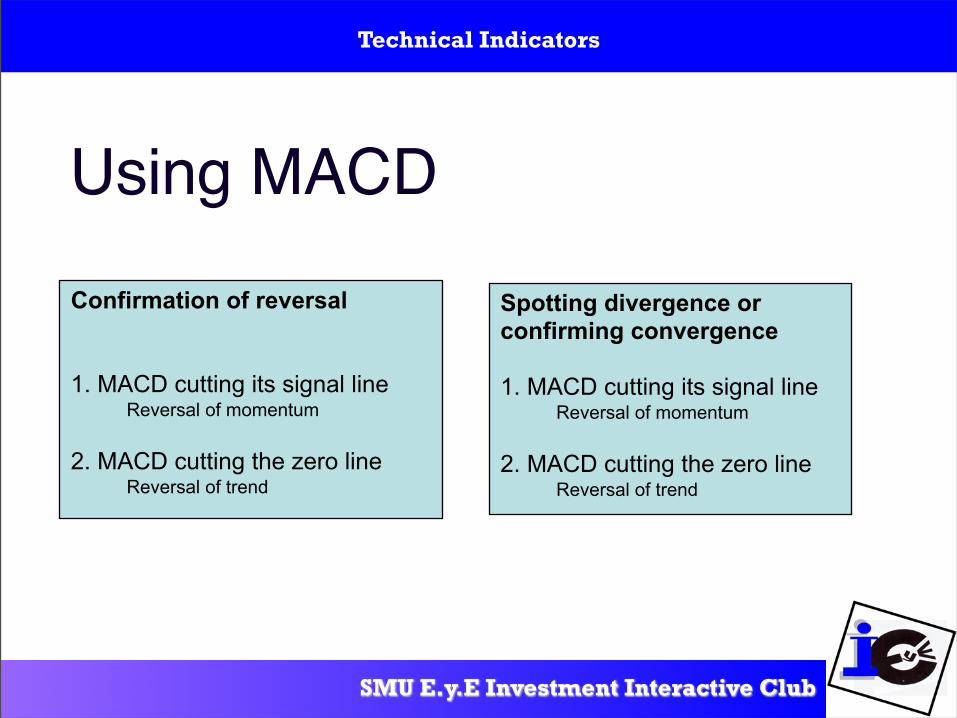
Using MACDConfirmation of reversal
1. MACD cutting its signal lineReversal of momentum
2. MACD cutting the zero lineReversal of trend
Spotting divergence or confirming convergence
1. MACD cutting its signal lineReversal of momentum
2. MACD cutting the zero lineReversal of trend
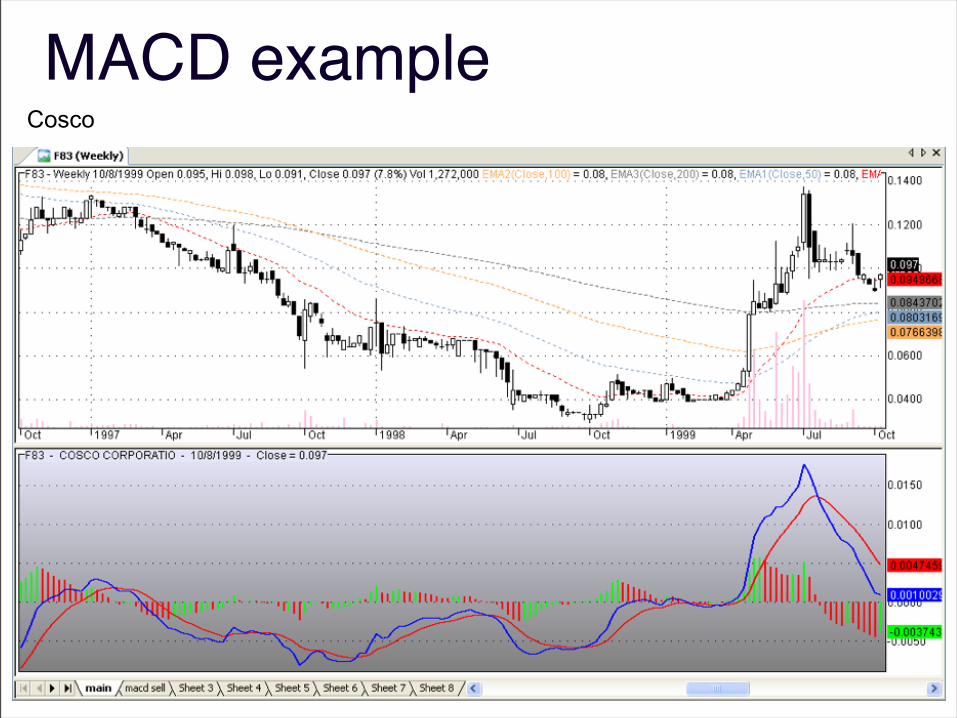
MACD exampleCosco
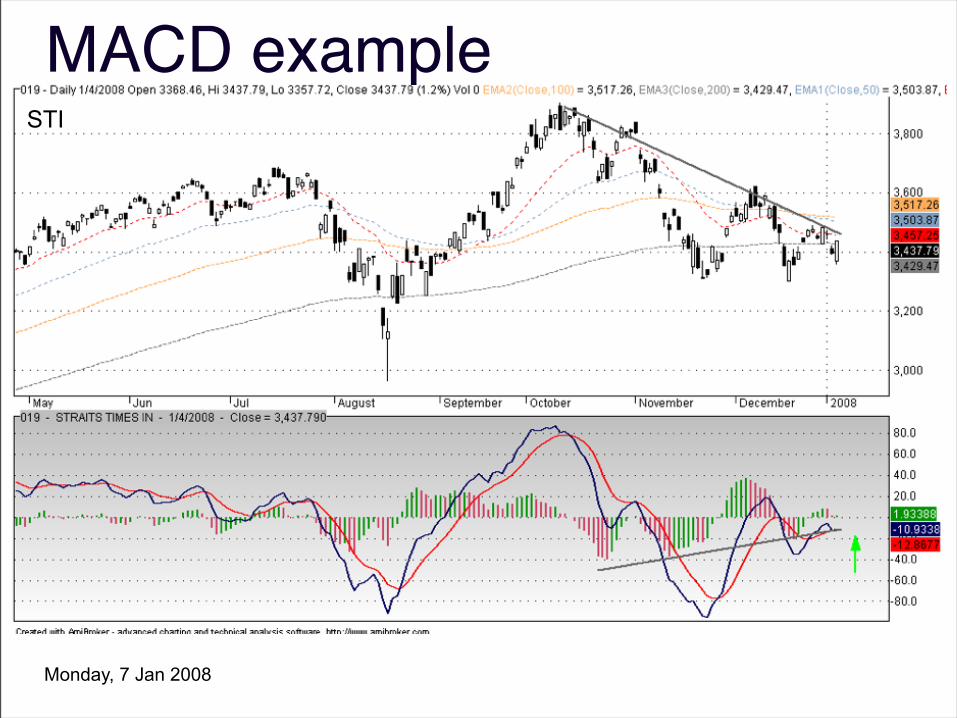
MACD exampleSTI
Monday, 7 Jan 2008
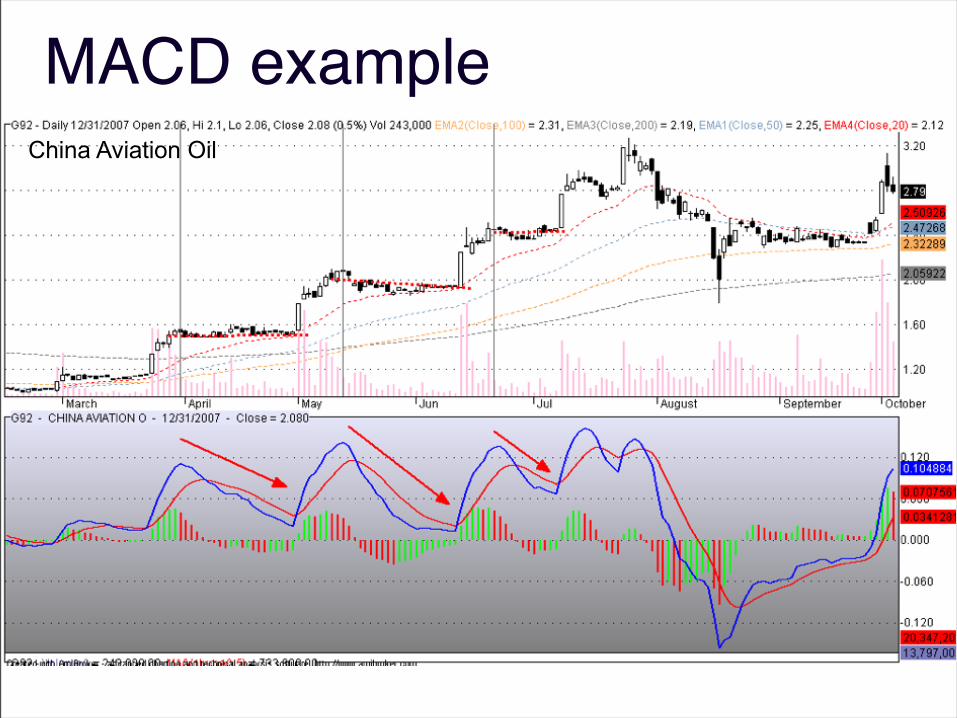
MACD exampleChina Aviation Oil
Technical Indicators
SMU E.y.E Investment Interactive Club
OscillatorsExtremely useful in a nontrending market
Identify short term market extremes
Signal divergence
Technical Indicators
SMU E.y.E Investment Interactive Club
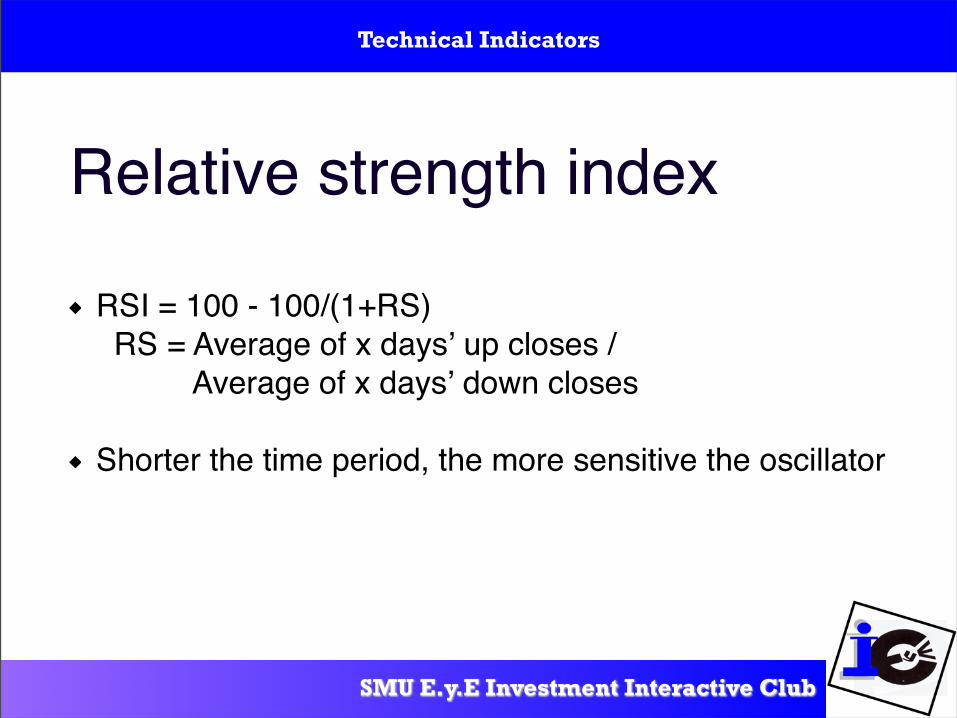
Relative strength index
RSI = 100 - 100/(1+RS) RS = Average of x daysʼ up closes / Average of x daysʼ down closes
Shorter the time period, the more sensitive the oscillator
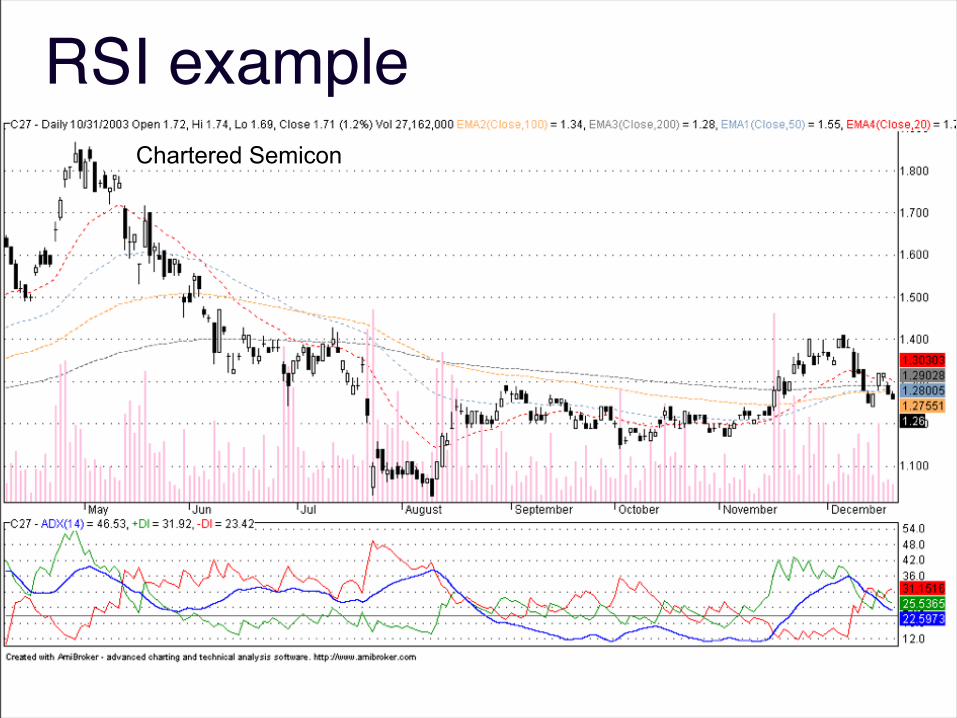
RSI exampleChartered Semicon
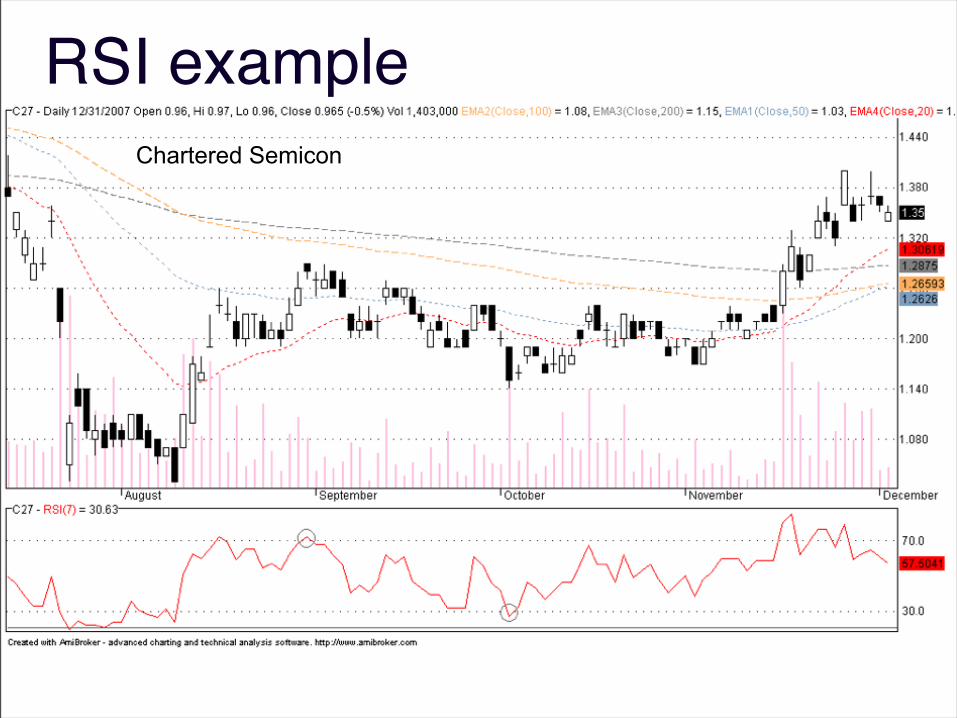
RSI exampleChartered Semicon
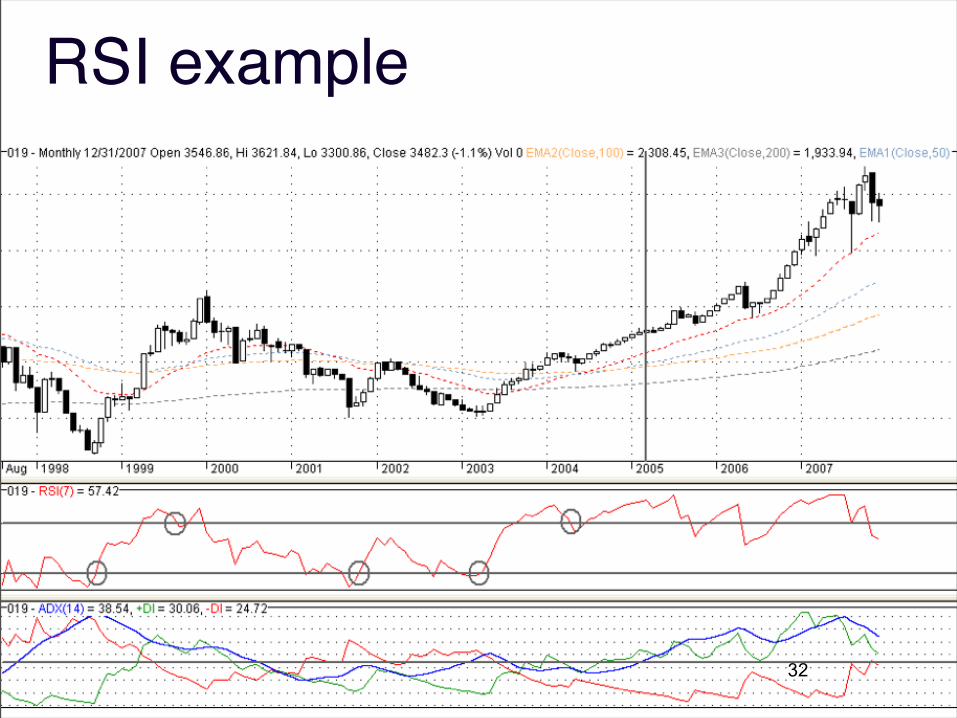
32
RSI example
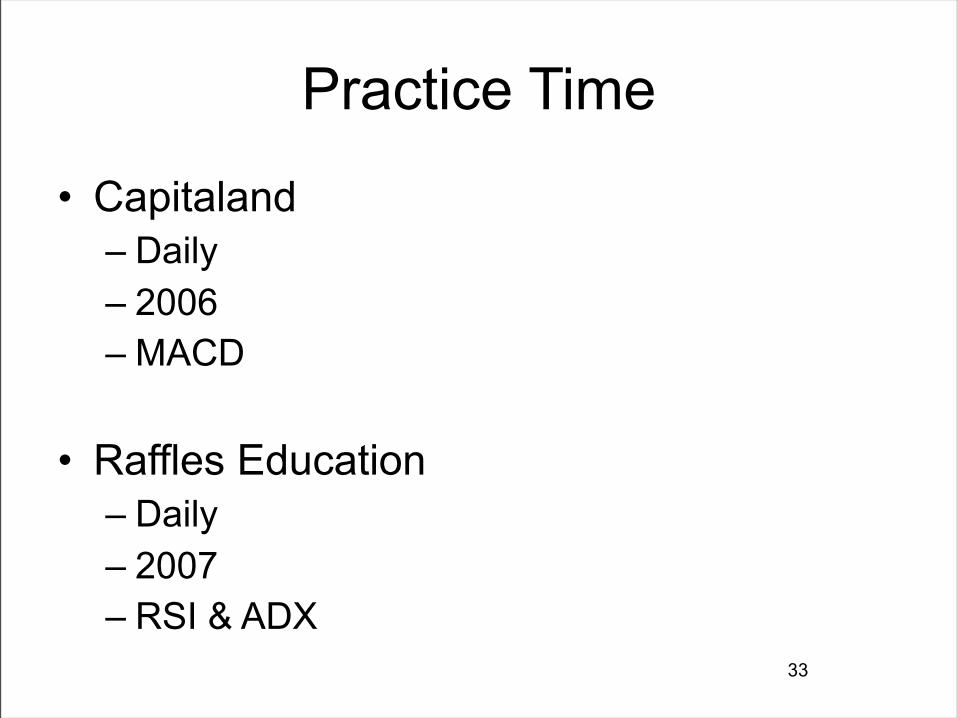
Practice Time
• Capitaland – Daily– 2006– MACD
• Raffles Education– Daily– 2007– RSI & ADX
33