Embed Size (px)
Citation preview
RESEARCH ARTICLE
Technical Insights into Highly Sensitive
Isolation and Molecular Characterization of
Fixed and Live Circulating Tumor Cells for
Early Detection of Tumor Invasion
Sophie Laget1, Lucile Broncy1,2☯, Katia Hormigos1☯, Dalia M. Dhingra3,
Fatima BenMohamed2, Thierry Capiod2, Magne Osteras4, Laurent Farinelli4,
Stephen Jackson3, Patrizia Paterlini-Brechot2*
1 Rarecells Diagnostics, Paris, France, 2 Unite INSERM U1151 (Eq 13), Faculte de Medecine Paris
Descartes, Paris, France, 3 Thermo Fisher Scientific, South San Francisco, California, United States of
America, 4 Fasteris SA, Geneva, Switzerland
☯ These authors contributed equally to this work.
Abstract
Circulating Tumor Cells (CTC) and Circulating Tumor Microemboli (CTM) are Circulating
Rare Cells (CRC) which herald tumor invasion and are expected to provide an opportunity
to improve the management of cancer patients. An unsolved technical issue in the CTC field
is how to obtain highly sensitive and unbiased collection of these fragile and heterogeneous
cells, in both live and fixed form, for their molecular study when they are extremely rare, par-
ticularly at the beginning of the invasion process. We report on a new protocol to enrich from
blood live CTC using ISET® (Isolation by SizE of Tumor/Trophoblastic Cells), an open sys-
tem originally developed for marker-independent isolation of fixed tumor cells. We have
assessed the impact of our new enrichment method on live tumor cells antigen expression,
cytoskeleton structure, cell viability and ability to expand in culture. We have also explored
the ISET® in vitro performance to collect intact fixed and live cancer cells by using spiking
analyses with extremely low number of fluorescent cultured cells. We describe results con-
sistently showing the feasibility of isolating fixed and live tumor cells with a Lower Limit of
Detection (LLOD) of one cancer cell per 10 mL of blood and a sensitivity at LLOD ranging
from 83 to 100%. This very high sensitivity threshold can be maintained when plasma is col-
lected before tumor cells isolation. Finally, we have performed a comparative next genera-
tion sequencing (NGS) analysis of tumor cells before and after isolation from blood and
culture. We established the feasibility of NGS analysis of single live and fixed tumor cells
enriched from blood by our system. This study provides new protocols for detection and
characterization of CTC collected from blood at the very early steps of tumor invasion.
PLOS ONE | DOI:10.1371/journal.pone.0169427 January 6, 2017 1 / 49
a1111111111
a1111111111
a1111111111
a1111111111
a1111111111
OPENACCESS
Citation: Laget S, Broncy L, Hormigos K, Dhingra
DM, BenMohamed F, Capiod T, et al. (2017)
Technical Insights into Highly Sensitive Isolation
and Molecular Characterization of Fixed and Live
Circulating Tumor Cells for Early Detection of
Tumor Invasion. PLoS ONE 12(1): e0169427.
doi:10.1371/journal.pone.0169427
Editor: Masaru Katoh, National Cancer Center,
JAPAN
Received: May 3, 2016
Accepted: December 16, 2016
Published: January 6, 2017
Copyright: © 2017 Laget et al. This is an open
access article distributed under the terms of the
Creative Commons Attribution License, which
permits unrestricted use, distribution, and
reproduction in any medium, provided the original
author and source are credited.
Data Availability Statement: All relevant data are
within the paper and its Supporting Information
files
Funding: This work was supported by Fondation
Bettencourt-Schueller, Fondation Lefort-Beaumont
de l’Institut de France, INSERM, Universite Paris
Descartes and Rarecells Diagnostics. Rarecells
Diagnostics, Thermo Fisher Scientific and Fasteris
SA provided support in the form of salaries for
authors SL, LB, KH, DMD, SJ, MO and LF, but did
Introduction
The most challenging goal in the Circulating Tumor Cells (CTC) field is their unbiased and
reliable detection when they are extremely rare, namely at the beginning of the invasion pro-
cess. At clinical level, this goal implies the possibility to detect invasive cancers when they are
still curable, raising the hope of tremendously reducing cancer mortality [1–4]. At biological
level, the initial spread of CTC may provide an outstanding source of material to understand
the biology of early tumor invasion. Furthermore, high sensitivity is needed to obtain a suffi-
cient number of tumor cells for theranostic analyses.
In this setting, technical challenges remain to be addressed and rigorous in vitro perfor-
mance validations are required targeting unbiased isolation and detection of CTC when they
are very rare, due to their low abundance, fragility, heterogeneity and lack of specific markers
[2].
Approximately, forty different CTC isolation/detection methods have been published [5–
9]. To our knowledge, however, no report specifically addresses the analytical issues of the use
of these technologies for the purpose of early detection of invasive cancers. This implies the
isolation without bias of selection and the identification without mistake of the very rare CTC
that are spread at the beginning of the tumor invasion process. Early detection of aggressive
cancers also implies studying the immune-molecular profile of the rare CTC as well as their
growth potential.
CTC populations consist of cancer cells with very different phenotypes, including epithelial
tumor cells, mesenchymal tumor cells, epithelial to mesenchymal hybrid tumor cells, stem
tumor cells and clusters of tumor cells called Circulating Tumor Microemboli (CTM) [2, 4,
10–13]. Furthermore, identification of cancer cells in blood is challenging because of their sim-
ilarities to non-tumor Circulating Rare Cells (CRC) such as circulating epithelial-normal cells,
epithelial-atypical cells, endothelial cells, normal stem cells and physiological-state dependent
cells (such as giant monocytes, micromegakaryocytes and fetal cells in pregnant and ex-preg-
nant women) [2]. Taking into account the vast heterogeneity of circulating rare cells and the
lack of circulating tumor cells-specific markers, the use of epithelial and/or organ specific anti-
bodies at the isolation/enrichment step or for the identification of CTC may lead to selection/
detection biases [2, 4, 13–15].
In 2000, we reported on ISET1 (Isolation by SizE of Tumor/Trophoblastic Cells), the first
antibody-independent whole blood filtration-based approach for CTC isolation. This method
relies on the larger size of all types of CRC as compared to the majority of leukocytes [10].
ISET1 is performed within 5 hours after blood collection and carefully preserves the cell mor-
phology. When combined with cytopathology, the filtration method has been shown to allow
distinguishing circulating malignant cells derived from practically all types of solid tumors
from circulating benign cells including those derived from organs [2, 4, 16].
Several studies have shown the feasibility of characterizing CTC isolated by ISET1 using
simple or multiple immuno-fluorescence labeling [11, 17, 18], simple or multiple immuno-
cytochemistry labeling [10, 12, 19, 20], FISH analyses [10, 21–23] and targeted molecular anal-
yses [10, 17, 24–26].
ISET1’s sensitivity threshold (lower limit of detection (LLOD)) was initially determined at
one tumor cell per mL of blood using a prototype [10], a result which has been subsequently
confirmed by an independent team [25]. In 2006, our team has developed a device and con-
sumables (ISET1 System) specifically designed to make our approach reproducible in other
laboratories. Independent teams have since then confirmed its in vitro LLOD of one tumor cell
per mL of blood [12, 27–29] and shown its in vivo superior sensitivity [3], including in com-
parative tests [12, 17, 20, 22, 23, 30–32].
Highly Sensitive Isolation and Analysis of Live and Fixed CTC by ISET®
PLOS ONE | DOI:10.1371/journal.pone.0169427 January 6, 2017 2 / 49
not have any additional role in the study design,
data collection and analysis, decision to publish, or
preparation of the manuscript. The specific roles of
these authors are articulated in the ‘author
contributions’ section.
Competing Interests: This study was partly funded
by Rarecells Diagnostics, the employer of Sophie
Laget, Lucile Broncy and Katia Hormigos. Dalia M.
Dhingra and Stephen Jackson are employed by
Thermo Fisher Scientific and Magne Osteras and
Laurent Farinelli by Fasteris SA. PPB, TC and SL are
co-inventors of the ISET® patents which protect
the Rarecells® Device and its consumables, as well
as the analyses performed on cells isolated using
the Rarecells® System: Method and device for the
separation of biological particles contained in a
liquid by means of vertical filtration (FR 0502945;
PPB), Process for multi-analyses of rare cells
extracted or isolated from biological samples
through filtration (US 2013/0316347 A1; PPB, SL,
TC). PPB is founder of Rarecells Diagnostics which
commercializes the ISET® technology, holds
license for the ISET® patents, and is a spin-off of
University Paris Descartes, Assistance Publique
Hopitaux de Paris and Institut National de la Sante
et Recherche Medicale (INSERM), public
Institutions which are owners of the ISET patents.
Life technologies commercializes Hotspot Cancer
Panel v2, and Fasteris a service company
specialized in next-generation sequencing. There
are no further patents, products in development or
marketed products to declare. This does not alter
our adherence to all the PLOS ONE policies on
sharing data and materials, as detailed online in the
guide for authors.
We report here the careful assessment of the ISET1 System’s in vitro analytical perfor-
mance. We have studied its LLOD as well as its sensitivity at the sensitivity threshold (LLOD).
Until now, studies have only demonstrated the ISET1 System’s ability to isolate fixed CTC
capturing them attached to filters. However, their sensitive enrichment as living cells is
required for a deeper investigation of their molecular code and to explore their possible use for
culture and drug sensitivity assays. In the present report a new variant protocol of the ISET1
System to enrich live CTC from blood and its analytical assessment is demonstrated. Our
results show that our system and protocols allow collecting fixed and live CTC from blood
with a LLOD of one CTC per 10 mL of blood. We also show that live tumor cells isolated from
blood using the new protocol maintain their initial antigen expression levels, their viability
and ability to grow. Finally, we compared by next generation sequencing (NGS) molecular
profiles of tumor cells before and after isolation from blood and culture. We address the feasi-
bility of analyzing by NGS the genetic code of individual cells enriched from blood by our
system.
These results and developments should foster clinical and fundamental studies targeting
the very early steps of tumor cells invasion.
Material and Methods
1- Blood samples collection
Blood from healthy volunteers was obtained from the French Blood Bank (Etablissement Fran-
cais du Sang) according to the local ethics rules (agreement number 2014000051/U1151).
Blood samples were drawn preferentially in liquid K3EDTA tubes (Becton Dickinson, USA)
with immediate gentle agitation after blood collection. If samples were not processed immedi-
ately after blood withdrawal, the tubes were left on a blood agitator until processing within 5
hours after blood collection.
2- Cell lines, cell size analysis of cells from cell lines
A549 (human lung adenocarcinoma), HeLa (human cervical epithelioid carcinoma), MCF-7
(human breast adenocarcinoma) and LNCaP (human prostate adenocarcinoma) cells were
obtained from American Type Culture Collection (ATCC, USA). Mouse MMTV-PyMT cells,
obtained by mammary gland-specific expression of the polyomavirus middle T antigen [33],
were a kind gift from Dr. Takemi Tanaka (Oklahoma University, USA). H2/H3-GFP-HCT116
cells (human colon cancer) were a kind gift from Dr. Guido Kroemer (Institut Gustave Roussy,
France).
A549, LNCaP and MMTV-PyMT cells were cultured in RPMI media supplemented with
10% Fetal Calf Serum (FCS) and 1% penicillin-streptomycin (P/S). MCF-7 cells were grown in
DMEM media supplemented with 10% FCS and 1% P/S. HCT116 were grown in MacCoy
media supplemented with 10% FCS and 1% P/S. All cells were cultured at 37˚C with 5% CO2,
and passaged regularly as previously described [10, 34].
For cell size analysis on ISET1 filters, trypsin-treated cultured cells were fixed with the Rar-
ecells1 Buffer (ref. 54 0203) for 10 minutes, when mixed with blood, or for 3 minutes without
blood and filtered through ISET1 filters with a nominal pore size of 8 or 5 μm. Cells on filters
were stained with the May-Grunwald Giemsa (MGG) cytopathological staining, as described
previously [35]. Analysis of cell size on ISET1 filters was performed with an Eclipse micro-
scope (Nikon, Japan) equipped with the Cell Cut System using the pre-calibrated software
(Molecular Machines and Industries, Germany). The size of at least 100 individual MGG-
stained cells was analyzed for each cell line.
Highly Sensitive Isolation and Analysis of Live and Fixed CTC by ISET®
PLOS ONE | DOI:10.1371/journal.pone.0169427 January 6, 2017 3 / 49
3- Isolation from blood of fixed tumor cells using the ISET® system
The CE-IVD labeled Rarecells1 Device and its consumables (Rarecells Diagnostics, France)
were used to assess the in vitro performance of the ISET1 standard protocol for marker-inde-
pendent isolation of fixed tumor cells from blood (Fig 1A). The Rarecells1 Buffer solution
(ref. 54 0203) was reconstituted according to the manufacturer instructions. The reconstituted
buffer solution can be stored frozen at -20˚C for up to 6 months. Before use, the pH is adjusted
to 7.2. Formaldehyde is then added for cell fixing and to obtain a 0.74% final concentration. 90
mL of Rarecells1 buffer is then used to dilute ten mL of blood (10-fold dilution) to prepare it
for filtration. Blood pretreatment has to take place for exactly 10 minutes under constant gen-
tle stirring on a horizontal mixer (CAT Ingenieurburo model# RM5-40).
A disposable cartridge (Rarecells1 Block) containing a filter having proprietary characteris-
tics and 8 microns nominal pores size is set into the device. The cartridge contains 6 compart-
ments: a large compartment for filtration of 5 mL of blood and 5 smaller compartments, each
one for filtration of 1 mL of blood. The compartments are independent, allowing filtering vari-
able volumes of blood from 10 μL to 10 mL of blood (100 μL to 100 mL of diluted blood).
Empty compartments have to be closed during filtration with Rarecells1 Block lids.
The protocol starts with filtration of 50 mL of sterile PBS to hydrate the filter, then the
diluted blood is loaded (100 mL of 1:10 diluted blood) into the Rarecells1 Block and filtered at
a typical standard calibrated depression of -10 kPa. Blood filtration lasts no longer than a
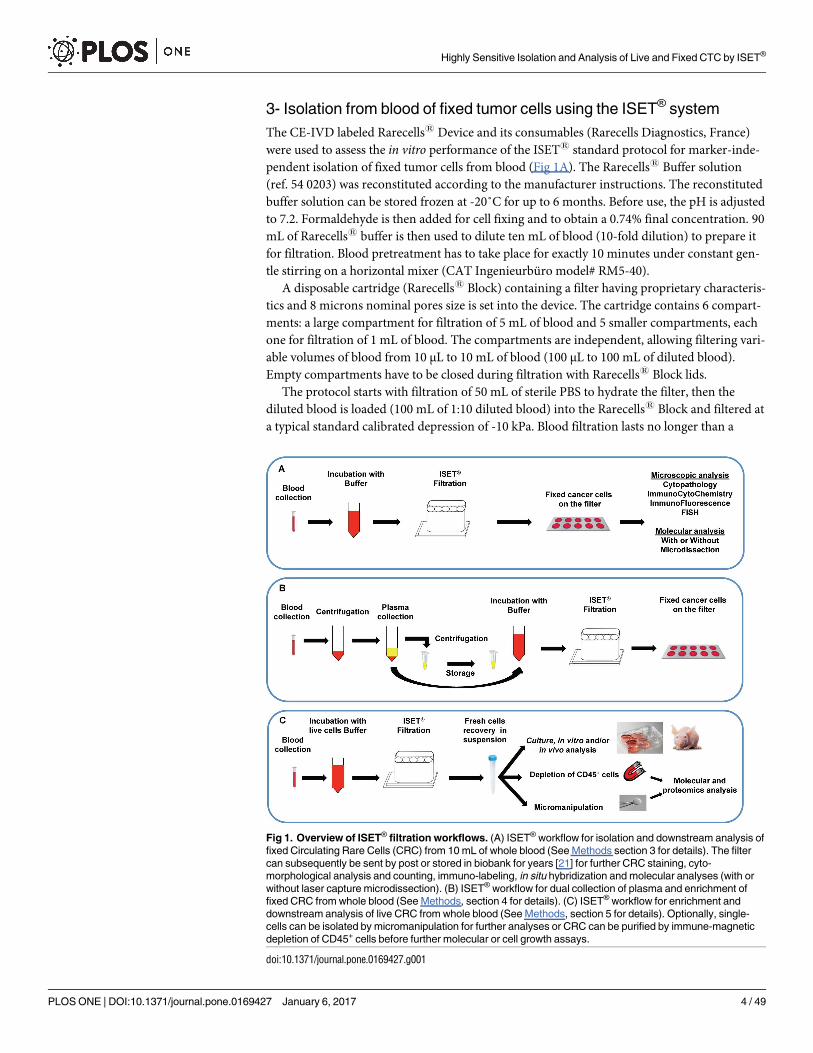
Fig 1. Overview of ISET® filtration workflows. (A) ISET® workflow for isolation and downstream analysis of
fixed Circulating Rare Cells (CRC) from 10 mL of whole blood (See Methods section 3 for details). The filter
can subsequently be sent by post or stored in biobank for years [21] for further CRC staining, cyto-
morphological analysis and counting, immuno-labeling, in situ hybridization and molecular analyses (with or
without laser capture microdissection). (B) ISET® workflow for dual collection of plasma and enrichment of
fixed CRC from whole blood (See Methods, section 4 for details). (C) ISET® workflow for enrichment and
downstream analysis of live CRC from whole blood (See Methods, section 5 for details). Optionally, single-
cells can be isolated by micromanipulation for further analyses or CRC can be purified by immune-magnetic
depletion of CD45+ cells before further molecular or cell growth assays.
doi:10.1371/journal.pone.0169427.g001
Highly Sensitive Isolation and Analysis of Live and Fixed CTC by ISET®
PLOS ONE | DOI:10.1371/journal.pone.0169427 January 6, 2017 4 / 49
minute. Since the degree of blood cellularity may be variable due to physiological or pathologi-
cal conditions and may increase blood resistance to filtration, the device allows increasing the
depression for a few seconds if needed in order to complete filtration. This method allows
maintaining a minimum shear force and sticks the cells to the filter avoiding their loss. The
tubes that contained the diluted blood are then rinsed with 100 mL of sterile PBS that is also fil-
tered in a few seconds. The cartridge is released from the device and disassembled in order to
extract and gently rinse the ISET1 filter with sterile distilled water. Fixed cells are left to dry
and attach firmly to the filter at room temperature for 15 to 30 minutes.
The filter contains 10 circular areas (spots) and each spot contains the CRC that were,
before filtration, in one mL of blood along with some residual leukocytes.
The technical characteristics of the Block allow processing 1 to 10 mL of blood by ISET1, while
the number of spots still corresponds to the number of milliliters of blood filtered. The counting
of the number of CTC per mL then conveniently corresponds to the number of spots counted.
Tumor cells distribution (intra-assay precision and accuracy) analyses. In order to
verify the random distribution of CTC on the five spots located in the large compartment of
the Rarecells1 Block, cultured A549 cells were made fluorescent and precisely counted as
described in section 6. An aliquot of 100 μL of the diluted suspension containing 50 cells was
added to 5 mL of healthy donor’s blood and processed by filtration (Fig 1A).
The number of tumor cells found on each spot (each corresponding to the filtration of 1
mL of blood) was recorded.
For each experiment, we calculated the average number of tumor cells found if considering
randomly only 1 spot, only 2 spots, only 3 spot and only 4 spots. We analyzed all possible single
spots or randomly grouped spots (any 1, any 2, any 3, any 4 spots) and calculated correspond-
ing mean values and their standard deviations. Intra-assay precision (percent coefficient of
variation, %CV) and accuracy (%Error) were calculated (formula given in section 6).
Counting of residual leukocytes. In order to evaluate the number of remaining White
Blood Cells (WBC), one mL of blood from four different healthy donors was filtered and stained
with Hematoxylin and Eosin. Leucocytes were then carefully counted under microscope.
4- Dual collection of plasma and fixed tumor cells
We have assessed the feasibility of recovering plasma from whole blood, collected on EDTA as
previously described, without losing fixed CTC (Fig 1B). Fluorescent tumor cells were added
to blood by individual cell micropipetting according to the protocol described in section 6 and
Fig 2A. Two aliquots of 5 mL of blood were transferred into 2 x 50 mL Falcon tubes and centri-
fuged at 150 g for 10 minutes and 2 x 1 mL of the upper phase (plasma) were carefully pipetted
without disturbing the interphase and transferred to a micro-centrifuge tube. The collected
plasma was then centrifuged at 15000 g for 10 minutes (to eliminate potential debris), the
supernatant carefully transferred to a new microcentrifuge tube and stored at -20˚C for further
analyses. The remaining 2 x 4 mL of blood were then carefully diluted to 50 mL volume each
with the Rarecells1 Buffer (ref 54 0203) and mixed by a gentle and slow inversion of the tube
at least 20 times. The diluted blood was then left for 10 minutes under horizontal mild agita-
tion and processed by the ISET1 system to isolate fixed tumor cells as described above.
5- Isolation from blood of live tumor cells and their characterization:
tumor cells’ size, antigen expression, viability, culture and study of
cytoskeleton markers
The Rarecells1 Device and Block were used with a new protocol developed to obtain the
marker-independent enrichment of live tumor cells from blood without sticking them to the
Highly Sensitive Isolation and Analysis of Live and Fixed CTC by ISET®
PLOS ONE | DOI:10.1371/journal.pone.0169427 January 6, 2017 5 / 49
filter (Fig 1C) and its performance was assessed. The Rarecells1 Live Cells Buffer solution (ref.
54 0208) was reconstituted according to the manufacturer instructions (Rarecells Diagnostics,
France). This solution can be used for up to a week if stored at 4˚C and for up to 6 months if
frozen and stored at -20˚C.
Blood was diluted 10 fold with the Rarecells1 Live Cells Buffer and kept at room tempera-
ture for 5 minutes under gentle constant stirring. The diluted blood (its color becomes bright
ruby) was then transferred to the Rarecells1 Block and filtered slowly using a minimal depres-
sion force (typically—3 to—6 kPa). When about 200–500 μL of diluted blood remained in the
wells, the filtration was stopped. The tubes that contained the diluted blood were rinsed with
13 mL of sterile PBS and the rinse solution was filtered with the device leaving again 500 μL of
liquid into the wells. To obtain this, the depression was stopped by closing the tap and turning
off the device so that the cells remained in suspension (not attached to the filter). The walls of
each well were further rinsed 3 times by filtration with 1 mL of PBS (or culture media) supple-
mented with 2% FCS and 3 mM EDTA, again leaving 500 μL of liquid into the well. Finally,
the liquid containing the enriched tumor cells (500 μL) was very carefully transferred with a
micropipette from the cartridge to a tube or cell culture microplate.
Optionally, live tumor cells enriched from blood by ISET1 were concentrated by centrifu-
gation for 4 minutes at 300 g. The supernatant was carefully eliminated leaving 20 to 30 μL of
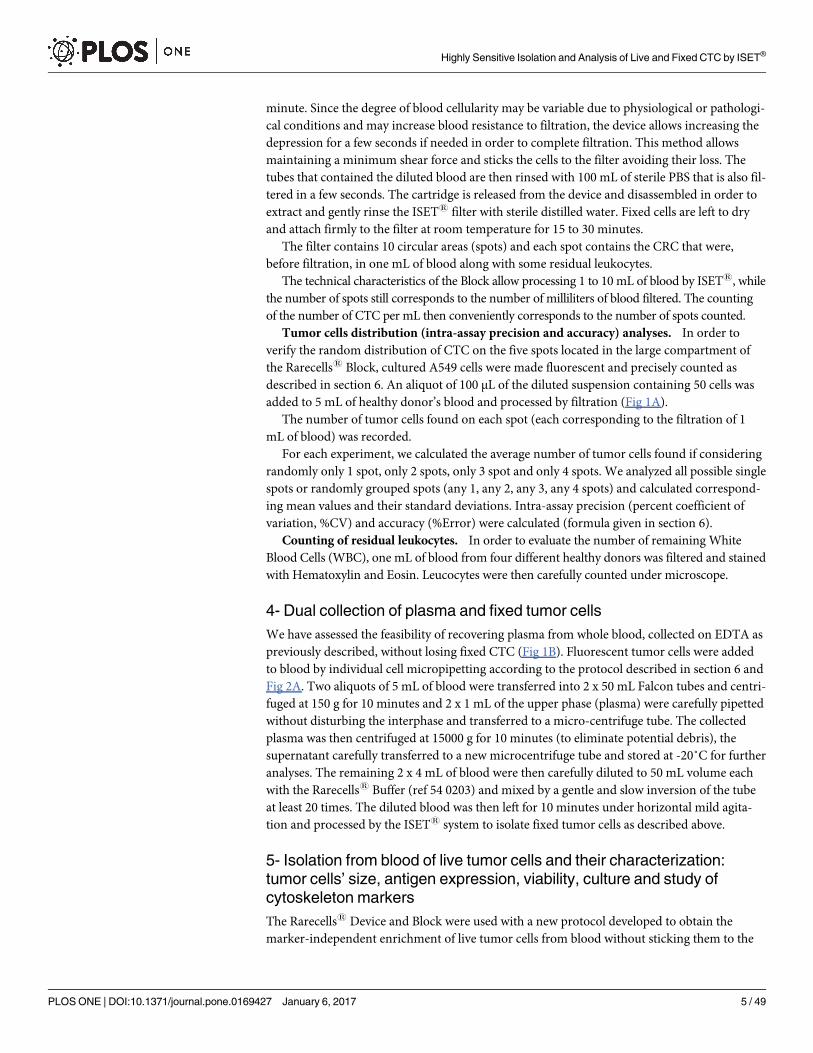
Fig 2. ISET® sensitivity in vitro assays using individually micropipetted tumor cells. (A) In vitro
sensitivity assay using the ISET® workflow described in Fig 1A (See Methods sections 3 and 6 for details).
Image: example of recovered fixed cell stained with Cell TrackerTM Orange (larger panel: TRITC filter only,
lower magnification, or smaller panels (higher magnification, TRITC filter only or merge of TRITC filter and
brightfield)). (B) In vitro sensitivity assay using the ISET® workflow described in Fig 1C (See Methods,
sections 5 and 6 for details). Image: example of recovered live cell stained with Cell TrackerTM Orange
(TRITC filter). (C) In vitro sensitivity assay using the ISET® workflow described in Fig 1A (See Methods
sections 3 and 6 for details) with precise counting of cells by dilution. Image: example of recovered fixed cell
stained with Cell TrackerTM Orange (TRITC filter only or merge of TRITC filter and brightfield)
doi:10.1371/journal.pone.0169427.g002
Highly Sensitive Isolation and Analysis of Live and Fixed CTC by ISET®
PLOS ONE | DOI:10.1371/journal.pone.0169427 January 6, 2017 6 / 49
cell suspension, which can be transferred to an 18 well-flat microchamber (Ibidi, Germany)
for microscopy evaluation and cell counting or other downstream analyses such as short-term
culture.
Optionally, the enriched live cells can be collected with a suitable fixative for downstream
analyses or with a storage fixative (Rarecells1 Fixcells, Rarecells Diagnostics, France) allowing
their storage at + 4˚C for up to 4 weeks.
Optionally, tumor cells can be isolated in suspension as fixed cells (without sticking them to
the filter). To this aim, we diluted the blood 1:10 with the Rarecells1 Buffer (ref. 54 0203).
After mild agitation for 10 min, we applied the same filtration protocol described for enrich-
ment of live tumor cells and collected the fixed tumor cells.
Counting of residual leukocytes. We assessed the number of remaining leukocytes after
live tumor cells enrichment using 2 x 5 mL of blood obtained from 2 distinct healthy donors in
2 separate tests, and using a TC20™ Automated Cell Counter (Bio Rad, USA) after cell staining
with Trypan Blue.
Elimination of residual leukocytes after live tumor cells enrichment by ISET1. We
tested the feasibility of eliminating the residual leucocytes after live tumor cells enrichment by
the ISET1 system. To this aim, the live tumor cells samples obtained with the ISET1 system
were treated with the manual column-free method EasySepTM and the ‘Human CD45 Deple-
tion kit’ (StemCell Technologies, Canada) that contains a combination of monoclonal antibod-
ies against the leucocyte marker CD45 [36]. This kit is originally intended for use with whole
blood after Ficoll-type density centrifugation, a step that is known to lead to highly significant
tumor cells loss [37, 38]. In order to adapt this kit to the protocol for isolation of live tumor
cells by ISET1, the amount of antibody and nanoparticles was reduced by 4-fold while the
other manufacturer’s recommendations were followed. In brief, CD45 positive cells were
specifically labeled with dextran-coated magnetic nanoparticles using bispecific Tetrameric
Antibody Complexes (TAC). Tumor cells were then recovered after two successive CD45
depletions using the EasySepTM Purple Magnet.
Live tumor cells’ number, size and viability after their enrichment by ISET1. Cells
were prepared and carefully counted as described in section 6. A fraction of the cell suspension
(typically 100 μL) was mixed with 1 mL of blood from a healthy donor, or 1 mL of PBS, diluted
tenfold with the Rarecells1 Live Cells Buffer and kept at room temperature for 5 minutes, or 3
minutes when cells were treated without blood, under gentle constant stirring. Filtration was
then performed with the new protocol as described above. For comparison of cell counts, sizes
and viability on the TC20™ Automated Cell Counter (Bio Rad, USA), 10 μL of either the unfil-
tered cells or the enriched fraction recovered after filtration were diluted 1:2 with Trypan Blue
and loaded into a counting slide (Dual chamber for cell counter, BioRad, USA). Three or more
counts were performed to obtain consistent counting values.
Live tumor cells antigen expression assessment before and after their enrichment by
ISET1. We assessed the potential impact of this new ISET1 filtration protocol on cell surface
antigens’ expression by fluorescent labeling of the Epithelial Cell Adhesion Marker (EpCAM)
on MCF-7 cultured cells before and after live cell enrichment by ISET1. MCF-7 cells in culture
were first incubated with 5 μg/mL of Hoechst 33342 (Sigma-Aldrich, USA) for 2 hours before
being rinsed twice with PBS, detached from the flask by incubation with trypsin (0.125%) and
resuspended in 5 mL of culture media as described in section 6. A fraction of the cell suspen-
sion (typically 100 μL) was mixed with 1 mL of blood from a healthy donor, diluted 1:10 with
the Rarecells1 Live Cells Buffer and kept at room temperature for 5 minutes under gentle con-
stant stirring. The enriched fraction recovered after live cells filtration was centrifuged for 2
minutes at 150 g. The supernatant was carefully eliminated leaving 100 μL of suspension. Fluo-
rescent labeling of EpCAM was performed on both the unfiltered cells and the enriched
Highly Sensitive Isolation and Analysis of Live and Fixed CTC by ISET®
PLOS ONE | DOI:10.1371/journal.pone.0169427 January 6, 2017 7 / 49
fraction recovered after ISET1 filtration. 20 μL of Human FcR binding inhibitor (eBioscience,
USA) were added to each 100 μL suspension and kept in the dark at 4˚C for 20 minutes. The
Alexa Fluor 488 conjugated anti-EpCAM antibody clone VU1D9 (Cell Signaling Technology,
USA) was diluted 1 to 30 in PBS and 20 μL of that dilution were then added to each sample fol-
lowed by a 30 minutes incubation in the dark at 4˚C. After washing with 1 mL of PBS, the cells
were centrifuged at 300 g for 4 minutes and transferred to a microchamber (Ibidi, Germany).
Microscopy evaluation was performed with an epi-fluorescence microscope (Zeiss, Germany).
The DAPI filter (emission at 465 nm) and the FITC filter (emission at 525 nm) were used for
the detection of the Hoechst and the EpCAM signals, respectively. Images were processed with
Image J software. To perform quantitative analysis of EpCAM fluorescence, we analyzed two
consecutive optical fields and measured the cell mean fluorescence, the cell area and the inte-
grated density (fluorescence per area) for each cell (50 MCF-7 cells before and 50 MCF-7 cells
after live cell enrichment). We then calculated the corrected total cell fluorescence (CTCF).
CTCF = Integrated_density–(Area_of _selected_cell x mean_background_fluorescence). Fur-
thermore we applied cutoffs at 91000 units and 200000 units of CTCF based on the calcula-
tions of the first and third quartiles of each data set.
Live tumor cells growth after their isolation by ISET1. We performed in vitro culture
experiments of live tumor cells enriched from blood by ISET1. In two separate tests with 3
replicates, 104 A549 cells were added to 1 mL of healthy donor’s blood before treatment with
the Rarecells1 Live Cells Buffer as described above and in section 6. Samples were incubated
for 5 min before filtration as described above.
The enriched cells were recovered and centrifuged for 2 minutes at 150 g. After removal of
the supernatant, each pellet was carefully resuspended in 100 μL of complete media, deposited
onto a round glass coverslip of 1.2 cm in diameter (MGF-slides, Microscopic Glass Factory)
and placed in a 24-wells culture plate (MultiwellTM 24, Becton Dickinson, USA). Cells were
left to attach for 2 hours in a culture incubator. Coverslips were then washed with 300 μL of
PBS and the cells were either collected for immediate microscopy observation (D0 time points)
or supplemented with fresh media and kept in culture for 48 hours (D2 time points) or up to 5
days (D5 time points) before observation.
Confocal microscopy analysis of cytoskeleton markers before enrichment and after
enrichment by ISET1 and culture for 72 hours. To assess the potential impact of our live
tumor cells isolation protocol on cytoskeleton structures, we used cytoskeleton markers and
immunofluorescence staining of actin microfilaments and microtubules together with confo-
cal microscopy. Live A549 and H2228 tumor cells were seeded onto round glass coverslips and
placed in a 24-wells culture plate before and after live cell enrichment from blood by ISET1, as
described above. Cells were kept in culture for 72h before fixation by incubating 15 minutes
with a 4% paraformaldehyde solution. Cells were then washed twice with PBS and permeabi-
lized 15 minutes in PBS containing 0,2% Triton X-100 before washing again twice with PBS.
Antigens were then blocked by incubating with PBS containing 10% FCS for 1h at room tem-
perature. Primary mouse antibody targeting human actelyl-α-Tubulin (6-11-B1 clone, Ther-
mofisher Scientific, USA) was diluted 1:200 in PBS containing 10% FCS and incubated 1h at
room temperature. Cells were then washed twice with PBS and incubated 30 minutes in the
dark with a 1:200 dilution of the secondary goat anti mouse antibody conjugated to a Dylight
488 fluorophore (Thermofisher Scientific, USA). Without washing, samples were then supple-
mented with Alexa Fluor 568 conjugated Phalloidin (Thermofisher Scientific, USA) for F-
actin labeling at 20 units/mL and kept in the dark for another 30 minutes at room temperature.
Cells were then washed three times in PBS and incubated 15 minutes at room temperature and
in the dark with PBS containing 8 μM Hoechst for nuclear staining. After rinsing twice with
PBS, coverslips were finally mounted on glass slides using Ultramount permanent mounting
Highly Sensitive Isolation and Analysis of Live and Fixed CTC by ISET®
PLOS ONE | DOI:10.1371/journal.pone.0169427 January 6, 2017 8 / 49
medium (Dako, USA). Microscopy evaluation was performed with an SP5 confocal micro-
scope (Leica, Germany) and all images were acquired with identical parameter settings. Images
were processed with Image J software and the quantitative analysis of both actin and tubulin
fluorescence was performed on 30 cells for each sample evaluated by calculating the corrected
total cell fluorescence (CTCF) of each signal as described above.
6- Sensitivity tests and spiking analyses with fluorescent cells
Spiking tests were performed to assess the performance of the ISET1 system for isolation and
enrichment of fixed and live tumor cells. The sensitivity threshold, also named lower limit of
detection (LLOD), is the lowest concentration of tumor cells detectable by a method. It is usu-
ally determined by extrapolating a plot of concentration (x) vs measurement unit (y) to the x-
axis. The intercept is the lower limit of detection. Sensitivity is the smallest concentration
change that a method is capable of detecting. It is determined from the slope of the previously
described plot [39]. Since high sensitivity is critical in the rare cells field, we emphasized our
work on determining sensitivity in a concentration range close to the LLOD.
Typically, 60–70% confluent cells were cultured and stained in flask with the addition of
fluorescent dyes—either 5 μg/mL of Hoechst 33342 (Sigma-Aldrich, USA) or 5 μM of Cell
TrackerTM Orange (Life technologies, USA) overnight or for at least two hours. Cells in culture
were rinsed twice with PBS to eliminate debris and detached from the flask by incubation with
trypsin (0.125%) for 2 minutes at 37˚C. Trypsin reaction was stopped by addition of 2 mL of
culture media. Cells were further diluted with PBS, centrifuged at 300 g for 4 minutes, and
carefully resuspended in 6 mL of culture media. 10 μL were then diluted 1:2 with Trypan Blue
and cells were counted with a manual counting slide (KOVA Glasstic slide 10 with grids,
Hycor Biomedical Inc, USA). Three or more counts were performed to obtain consistent
counting values. If needed, the cell suspension was mixed again to obtain a homogenous cell
dilution.
Fluorescent cells can also be resuspended with Rarecells1 Cytofix which allows to store
them as fixed cells at +4˚C for up to 5 days. The fluorescent staining can decrease or be lost in
some cells after this time, implying that fluorescent cells must be counted again before use.
Counted fluorescent cultured cells were added, typically within 1 hour after trypsin treat-
ment, to healthy donor blood. Very precise counting of cells used for spiking tests is critical,
thus we used two alternative protocols (Fig 2).
1. Completely accurate counting by micropipetting individual fluorescent cells (1 to 10 cells)
(Fig 2A and 2B). A 100 μL-drop of PBS containing approximately 10–40 cells was put in a
Petri dish and observed under an inverted Olympus CK30-F2000 microscope at the x10
objective. Cells were carefully picked individually using a common micropipette (Gilson
P2) and transferred one by one to the blood sample before its dilution with the Rarecells1
Buffer solution for fixed or live cells and filtration.
2. Precise counting (two serial counting) by fluorescent cells’ dilution (30 to 300 cells) (Fig
2C). After a first accurate manual cell counting performed with Kova counting slides, a first
dilution was prepared to reach the desired concentration. For instance, cells were carefully
diluted in 10 mL of PBS in order to obtain the target number of cells (from 30 to 300) per
100 μL of solution. The cell count was again verified by depositing 100 μL of that dilution
onto a petri dish and by visually identifying the cells using an inverted microscope. We
then calculated the average number of cells per μL and this second count was used to deter-
mine the amount of diluted cells used in spiking tests. (We note that this type of further
control is technically possible with Kova slides only for cell numbers from 100 to 300 per
Highly Sensitive Isolation and Analysis of Live and Fixed CTC by ISET®
PLOS ONE | DOI:10.1371/journal.pone.0169427 January 6, 2017 9 / 49
100 μL). In all spiking experiments, a positive control with 5000-cultured fluorescent tumor
cells added to 1 mL of blood was included to check for cell morphology integrity.
Blood samples with spiked-in tumor cells were then processed with one of the ISET1 filtra-
tion protocols as described above. For spiking tests with 10 mL of blood, we used a 150-mL
Falcon-type tube (Dominique Dutscher, France) rather than two 50-mL Falcon-type tubes to
dilute the blood (since 50-mL Falcon-type tubes are too small to accommodate 100 mL of
diluted blood). After filtration, filters containing isolated fixed cells stained with Cell Track-
erTM Orange were optionally stained with 8 μg/mL of nuclear staining Hoechst for 10 min,
rinsed with PBS and sterile distilled water and allowed to air dry protected from light. Option-
ally, filters were mounted between a slide and a coverslip using the mounting media ProLong1
Gold (Life Technologies, USA) before microscopic evaluation.
Fluorescent spiked tumor cells, isolated live and transferred to an 18 well-flat microcham-
ber (Ibidi, Germany), or isolated fixed on ISET1 filters, were analyzed with an epi-fluores-
cence microscope (Zeiss, Germany). The DAPI filter (emission at 465 nm) and the TRITC
filter (emission at 576 nm) were used for the detection of the Hoechst and the Cell TrackerTM
Orange signals, respectively. Criteria used to identify the spiked-in cells were: i- presence of a
cell (defined as round shape with a visible cytoplasm and nucleus) by bright field examination
of the filter and ii- detection of a genuine fluorescent signal with the TRITC filter. Presence of
auto-fluorescent cell debris was excluded by analyzing the fluorescent image using the ‘FITC’
filter of the microscope. Images were processed with Image J software and reviewed indepen-
dently by at least two operators.
For each series of tests, we measured the percentage of recovered cells, the percent coeffi-
cient of variation (%CV) and % error as follows:
%CV ¼standard deviationðmeasured dataÞ
averageðmeasured dataÞ;
%Error ¼ absolute valueð100% � average percentage of recovered cellsÞ
7- Next generation sequencing (NGS) molecular characterization of
single tumor cells and of cultured tumor cells after their isolation from
blood by ISET®
NGS analyses of single tumor cells isolated by ISET1. Live or fixed tumor cells enriched
from blood by ISET1, collected without sticking them to the filter as described in section 5,
and transferred in suspension to a cell culture plate could be gently picked up manually and
individually with a micropipette (Gilson P2) under an inverted Olympus CK30-F2000 micro-
scope at the x10 objective and transferred to an individual 0.2 mL PCR tube.
Single cells’ proteins were lysed so as to release the DNA using our in house protocol (in
15 μL, 100 mM TrisHCl pH 8 and 400 μg/mL of proteinase K incubated for 2 hours at 60˚C
followed by proteinase K inactivation for 5 min at 94˚C). The single-cell DNA was then pre-
amplified by combining our lysis protocol and by adapting it to single-cell whole genome
amplification (WGA) commercial kits: MALBAC (Yikon Genomics, China); Picoplex (Rubi-
con Genomics and New England BioLabs, USA); GenomePlex (Sigma-Aldrich, USA). Ampli-
fied DNA was then purified using the DNA Clean & Concentrator™-5 kit (Zymo Research,
Germany) and quantified by Quant-iT™ PicoGreen1 dsDNA Assay Kit (Thermo Fisher Scien-
tific, USA). The WGA products’ quality was assessed by PCR as described elsewhere [40].
For NGS single-cell analysis using the Illumina approach, 250 ng of the amplified DNA was
used to prepare libraries for high-throughput sequencing with the Nextera Exome Enrichment
Kit (Illumina, USA) following the supplier’s protocol. A fraction of the library DNA from the
Highly Sensitive Isolation and Analysis of Live and Fixed CTC by ISET®
PLOS ONE | DOI:10.1371/journal.pone.0169427 January 6, 2017 10 / 49
pre-capture step was used for whole genome analysis. The libraries were sequenced on a
HiSeq2000 (Illumina) in 2 x 100 bp paired-end runs. Data were mapped against the human
genome and the number of reads per chromosome was calculated.
In order to perform single-cell targeted theranostic mutations’ NGS analysis, we used the
ThermoFisher approach, 10 ng of purified WGA DNA was used to generate 207 amplicons
libraries including 50 oncogenes and tumor suppressor genes through the use of the optimized
primer pool “Hotspot cancer panel v2” and Ion Torrent™ Library Kit V2 (ThermoFisher,
USA), according to manufacturer’s recommendations. Briefly, Ion adapters and barcodes were
added using the “bioanalyzer protocol” (for living single cells and bulk extracted DNA) or the
“FFPE protocol” (for fixed single cells), respectively for 17 cycles and 20 cycles of pre-amplica-
tion. The quality of purified libraries was verified with the Bioanalyzer (Agilent, USA) and
quantified by qPCR using the Ion Library TaqMan™ Quantitation Kit. Libraries were tem-
plated using the Ion One-Touch system and sequenced on Ion Torrent™ 318 chips using the
Ion Personal Genome Machine™ (ThermoFisher, USA).
Data analysis was performed using the Ion Torrent™ suite (ThermoFisher, USA) and Excel
(Microsoft, USA) softwares. Sequencing artifacts in homopolymer regions were filtered out. In
theory, when analyzing diploid single cells, only three allele frequencies should be possible: 0%
(wild-type), 50% (heterozygous mutant/wild type) and 100% (homozygous mutant). However,
WGA and sequencing methods introduce variability and quantitative amplification biases. In
consequence, COSMIC hotspot mutations were included in our analysis only if present in at
least one single cell WGA sample with a quality score over 100 and 15% allele frequency while
using 10X depth amplicon coverage. Venn diagrams were drawn using a public online tool
(bioinformatics.psb.ugent.be/webtools/Venn/).
NGS analysis of tumor cells isolated by ISET1 and cultured for 72 hours. In order to
investigate the feasibility of studying possible tumor cells’ genetic changes induced by their iso-
lation from blood with our method and culture for 72 hours, we performed NGS analysis on
tumor cells before and after isolation by ISET1 and culture. Approximately 104 live A549 and 104
HCT116 live tumor cells were seeded in a 24-wells culture plate before and after their enrichment
from blood by ISET1, as described above. Cells were kept in culture for 72h before their collection
for DNA extraction by incubating them for 2 minutes with trypsin (0.125%) at 37˚C. Trypsin reac-
tion was stopped by addition of 2 mL of complete media. Cells were further diluted with PBS, cen-
trifuged at 300 g for 4 minutes, and carefully resuspended in 200 μL of PBS for DNA extraction.
We extracted bulk DNA from our samples using the QIAamp DNA Blood Mini Kit (Qia-
gen, Germany) following the manufacturer’s instructions. We then used 10 ng of extracted
bulk DNA from unfiltered control tumor cells and from tumor cells cultured for 72 hours after
ISET1 filtration using the same ThermoFisher protocols with the ‘Hotspot Cancer Panel V2’
and Ion Torrent™ Library Kit V2 (ThermoFisher, USA) used for single tumor cells.
Data from experiments on tumor cells’ populations were further processed with Sophia
DDM1 software (Sophia Genetics, Switzerland) to calculate variant fraction and coverage.
Only variants with more than 5% of allele frequency were reported.
Results
A- Cell size analysis
A comparative cell size analysis of cells from human and mouse tumor cell lines was per-
formed to characterize cells used to assess the sensitivity of tumor cells isolation by ISET1 (Fig
3A and Table A in S1 File). As detailed in the Methods section 2, at least 100 individual cells
from each cell line were analyzed after filtration through standard 8 micron-pores ISET1 fil-
ters, and MGG staining. The median diameter of cancer cells ranged from 12 μm (mouse
Highly Sensitive Isolation and Analysis of Live and Fixed CTC by ISET®
PLOS ONE | DOI:10.1371/journal.pone.0169427 January 6, 2017 11 / 49
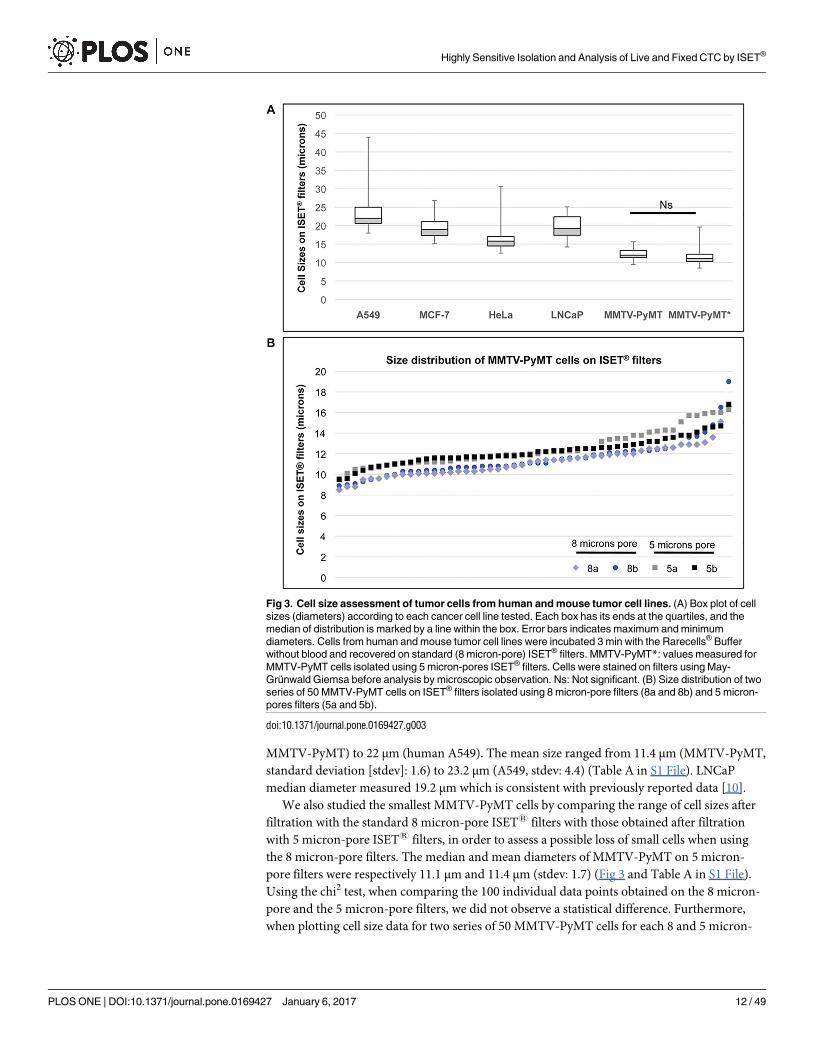
MMTV-PyMT) to 22 μm (human A549). The mean size ranged from 11.4 μm (MMTV-PyMT,
standard deviation [stdev]: 1.6) to 23.2 μm (A549, stdev: 4.4) (Table A in S1 File). LNCaP
median diameter measured 19.2 μm which is consistent with previously reported data [10].
We also studied the smallest MMTV-PyMT cells by comparing the range of cell sizes after
filtration with the standard 8 micron-pore ISET1 filters with those obtained after filtration
with 5 micron-pore ISET1 filters, in order to assess a possible loss of small cells when using
the 8 micron-pore filters. The median and mean diameters of MMTV-PyMT on 5 micron-
pore filters were respectively 11.1 μm and 11.4 μm (stdev: 1.7) (Fig 3 and Table A in S1 File).
Using the chi2 test, when comparing the 100 individual data points obtained on the 8 micron-
pore and the 5 micron-pore filters, we did not observe a statistical difference. Furthermore,
when plotting cell size data for two series of 50 MMTV-PyMT cells for each 8 and 5 micron-
Fig 3. Cell size assessment of tumor cells from human and mouse tumor cell lines. (A) Box plot of cell
sizes (diameters) according to each cancer cell line tested. Each box has its ends at the quartiles, and the
median of distribution is marked by a line within the box. Error bars indicates maximum and minimum
diameters. Cells from human and mouse tumor cell lines were incubated 3 min with the Rarecells® Buffer
without blood and recovered on standard (8 micron-pore) ISET® filters. MMTV-PyMT*: values measured for
MMTV-PyMT cells isolated using 5 micron-pores ISET® filters. Cells were stained on filters using May-
Grunwald Giemsa before analysis by microscopic observation. Ns: Not significant. (B) Size distribution of two
series of 50 MMTV-PyMT cells on ISET® filters isolated using 8 micron-pore filters (8a and 8b) and 5 micron-
pores filters (5a and 5b).
doi:10.1371/journal.pone.0169427.g003
Highly Sensitive Isolation and Analysis of Live and Fixed CTC by ISET®
PLOS ONE | DOI:10.1371/journal.pone.0169427 January 6, 2017 12 / 49
pore filters, we observed a similar distribution throughout all the size ranges (i.e. 8.5 to
16.8 μm) for both types of filters (Fig 3B), indicating that there is no size-selection bias when
isolating the small cells from this cell line with the standard pore size of ISET1 filters. Fig 3A
in fact shows that the MMTV-PyMT median cell size after ISET1 filtration through 5-micron
pores is slightly greater than that calculated after ISET1 filtration through 8-micron pores.
However, the difference is not statistically significant and could be related to different batches
of cells collected at different times.
These data are consistent with the results described in section C-1 (Table C in S1 File)
showing that the size of live MMTV-PyMT cells remains essentially the same before and after
ISET1 filtration.
B- In vitro performance of the ISET® system for isolation of fixed tumor
cells
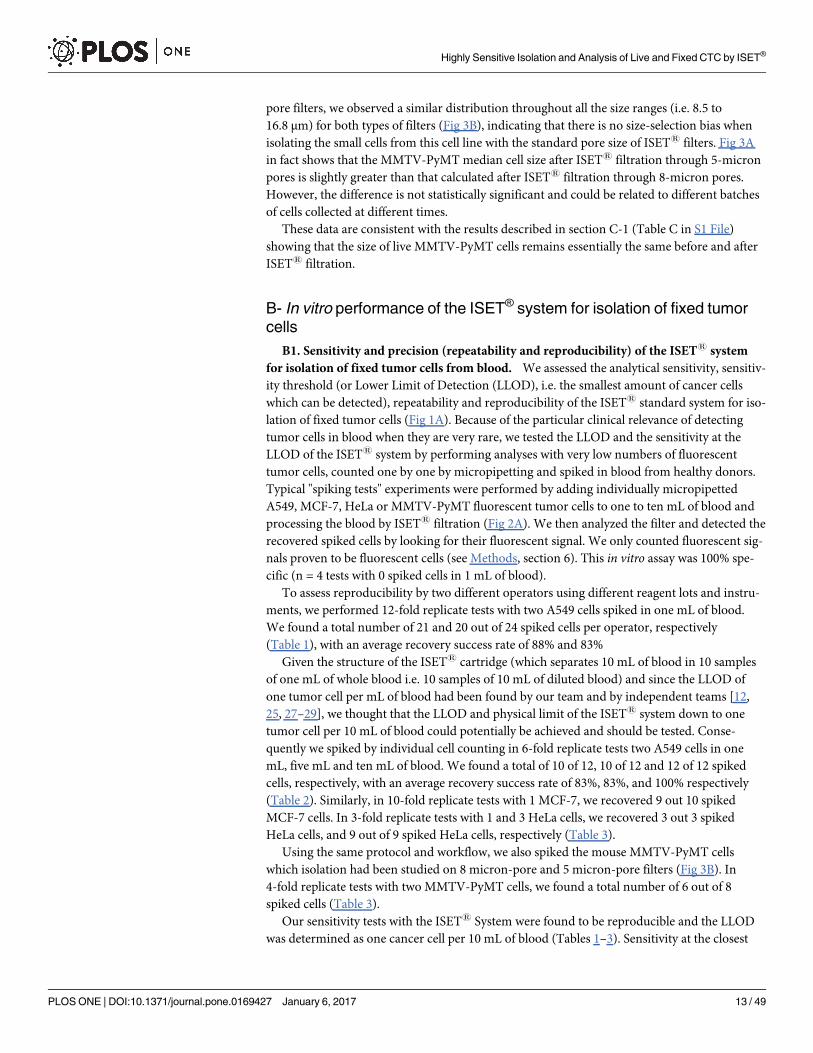
B1. Sensitivity and precision (repeatability and reproducibility) of the ISET1 system
for isolation of fixed tumor cells from blood. We assessed the analytical sensitivity, sensitiv-
ity threshold (or Lower Limit of Detection (LLOD), i.e. the smallest amount of cancer cells
which can be detected), repeatability and reproducibility of the ISET1 standard system for iso-
lation of fixed tumor cells (Fig 1A). Because of the particular clinical relevance of detecting
tumor cells in blood when they are very rare, we tested the LLOD and the sensitivity at the
LLOD of the ISET1 system by performing analyses with very low numbers of fluorescent
tumor cells, counted one by one by micropipetting and spiked in blood from healthy donors.
Typical "spiking tests" experiments were performed by adding individually micropipetted
A549, MCF-7, HeLa or MMTV-PyMT fluorescent tumor cells to one to ten mL of blood and
processing the blood by ISET1 filtration (Fig 2A). We then analyzed the filter and detected the
recovered spiked cells by looking for their fluorescent signal. We only counted fluorescent sig-
nals proven to be fluorescent cells (see Methods, section 6). This in vitro assay was 100% spe-
cific (n = 4 tests with 0 spiked cells in 1 mL of blood).
To assess reproducibility by two different operators using different reagent lots and instru-
ments, we performed 12-fold replicate tests with two A549 cells spiked in one mL of blood.
We found a total number of 21 and 20 out of 24 spiked cells per operator, respectively
(Table 1), with an average recovery success rate of 88% and 83%
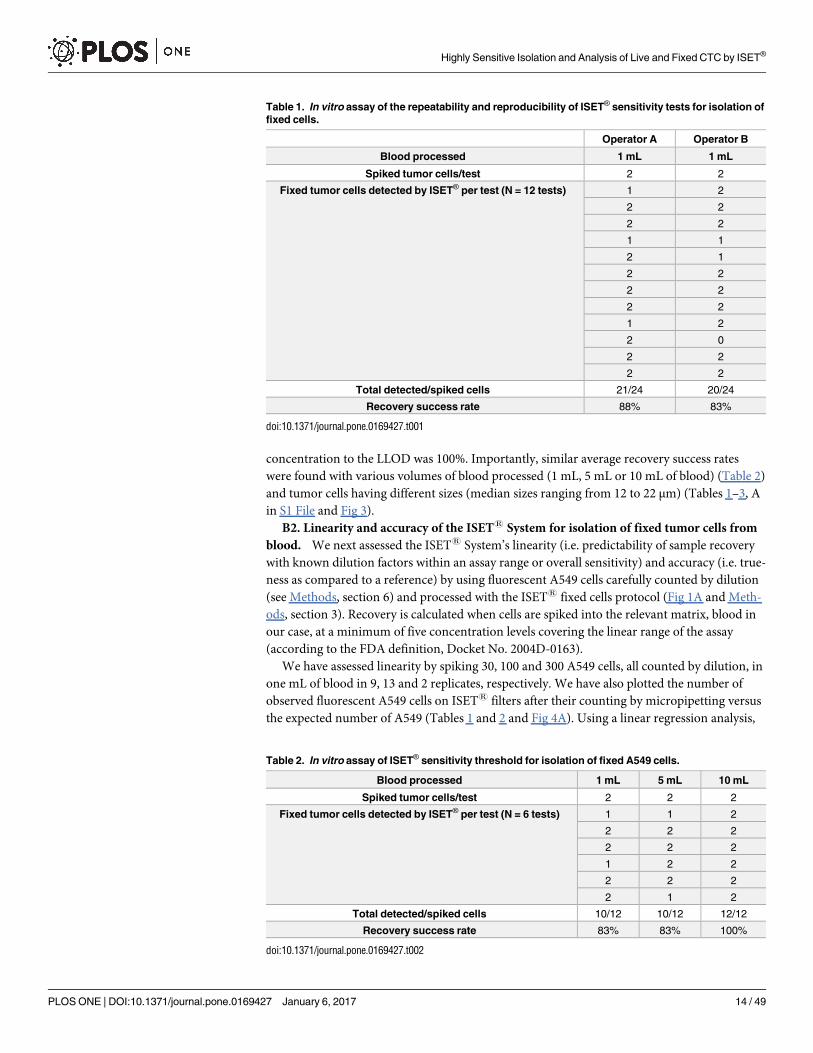
Given the structure of the ISET1 cartridge (which separates 10 mL of blood in 10 samples
of one mL of whole blood i.e. 10 samples of 10 mL of diluted blood) and since the LLOD of
one tumor cell per mL of blood had been found by our team and by independent teams [12,
25, 27–29], we thought that the LLOD and physical limit of the ISET1 system down to one
tumor cell per 10 mL of blood could potentially be achieved and should be tested. Conse-
quently we spiked by individual cell counting in 6-fold replicate tests two A549 cells in one
mL, five mL and ten mL of blood. We found a total of 10 of 12, 10 of 12 and 12 of 12 spiked
cells, respectively, with an average recovery success rate of 83%, 83%, and 100% respectively
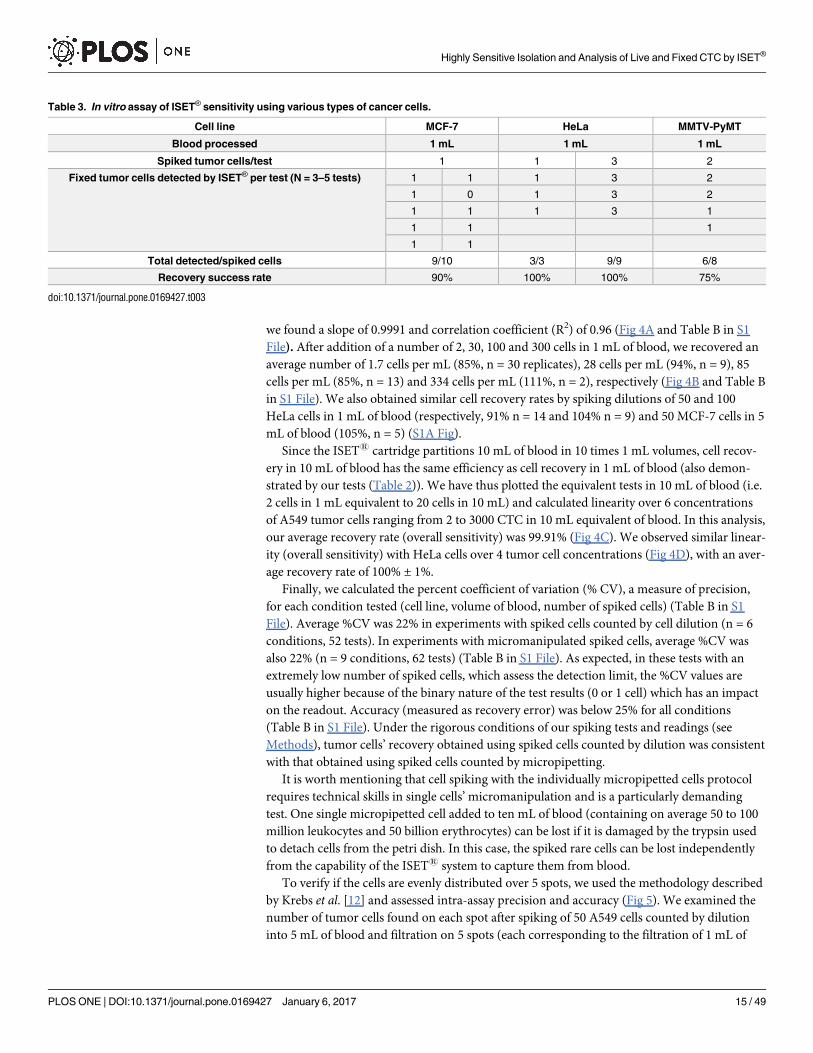
(Table 2). Similarly, in 10-fold replicate tests with 1 MCF-7, we recovered 9 out 10 spiked
MCF-7 cells. In 3-fold replicate tests with 1 and 3 HeLa cells, we recovered 3 out 3 spiked
HeLa cells, and 9 out of 9 spiked HeLa cells, respectively (Table 3).
Using the same protocol and workflow, we also spiked the mouse MMTV-PyMT cells
which isolation had been studied on 8 micron-pore and 5 micron-pore filters (Fig 3B). In
4-fold replicate tests with two MMTV-PyMT cells, we found a total number of 6 out of 8
spiked cells (Table 3).
Our sensitivity tests with the ISET1 System were found to be reproducible and the LLOD
was determined as one cancer cell per 10 mL of blood (Tables 1–3). Sensitivity at the closest
Highly Sensitive Isolation and Analysis of Live and Fixed CTC by ISET®
PLOS ONE | DOI:10.1371/journal.pone.0169427 January 6, 2017 13 / 49
concentration to the LLOD was 100%. Importantly, similar average recovery success rates
were found with various volumes of blood processed (1 mL, 5 mL or 10 mL of blood) (Table 2)
and tumor cells having different sizes (median sizes ranging from 12 to 22 μm) (Tables 1–3, A
in S1 File and Fig 3).
B2. Linearity and accuracy of the ISET1 System for isolation of fixed tumor cells from
blood. We next assessed the ISET1 System’s linearity (i.e. predictability of sample recovery
with known dilution factors within an assay range or overall sensitivity) and accuracy (i.e. true-
ness as compared to a reference) by using fluorescent A549 cells carefully counted by dilution
(see Methods, section 6) and processed with the ISET1 fixed cells protocol (Fig 1A and Meth-
ods, section 3). Recovery is calculated when cells are spiked into the relevant matrix, blood in
our case, at a minimum of five concentration levels covering the linear range of the assay
(according to the FDA definition, Docket No. 2004D-0163).
We have assessed linearity by spiking 30, 100 and 300 A549 cells, all counted by dilution, in
one mL of blood in 9, 13 and 2 replicates, respectively. We have also plotted the number of
observed fluorescent A549 cells on ISET1 filters after their counting by micropipetting versus
the expected number of A549 (Tables 1 and 2 and Fig 4A). Using a linear regression analysis,
Table 1. In vitro assay of the repeatability and reproducibility of ISET® sensitivity tests for isolation of
fixed cells.
Operator A Operator B
Blood processed 1 mL 1 mL
Spiked tumor cells/test 2 2
Fixed tumor cells detected by ISET® per test (N = 12 tests) 1 2
2 2
2 2
1 1
2 1
2 2
2 2
2 2
1 2
2 0
2 2
2 2
Total detected/spiked cells 21/24 20/24
Recovery success rate 88% 83%
doi:10.1371/journal.pone.0169427.t001
Table 2. In vitro assay of ISET® sensitivity threshold for isolation of fixed A549 cells.
Blood processed 1 mL 5 mL 10 mL
Spiked tumor cells/test 2 2 2
Fixed tumor cells detected by ISET® per test (N = 6 tests) 1 1 2
2 2 2
2 2 2
1 2 2
2 2 2
2 1 2
Total detected/spiked cells 10/12 10/12 12/12
Recovery success rate 83% 83% 100%
doi:10.1371/journal.pone.0169427.t002
Highly Sensitive Isolation and Analysis of Live and Fixed CTC by ISET®
PLOS ONE | DOI:10.1371/journal.pone.0169427 January 6, 2017 14 / 49
we found a slope of 0.9991 and correlation coefficient (R2) of 0.96 (Fig 4A and Table B in S1
File). After addition of a number of 2, 30, 100 and 300 cells in 1 mL of blood, we recovered an
average number of 1.7 cells per mL (85%, n = 30 replicates), 28 cells per mL (94%, n = 9), 85
cells per mL (85%, n = 13) and 334 cells per mL (111%, n = 2), respectively (Fig 4B and Table B
in S1 File). We also obtained similar cell recovery rates by spiking dilutions of 50 and 100
HeLa cells in 1 mL of blood (respectively, 91% n = 14 and 104% n = 9) and 50 MCF-7 cells in 5
mL of blood (105%, n = 5) (S1A Fig).
Since the ISET1 cartridge partitions 10 mL of blood in 10 times 1 mL volumes, cell recov-
ery in 10 mL of blood has the same efficiency as cell recovery in 1 mL of blood (also demon-
strated by our tests (Table 2)). We have thus plotted the equivalent tests in 10 mL of blood (i.e.
2 cells in 1 mL equivalent to 20 cells in 10 mL) and calculated linearity over 6 concentrations
of A549 tumor cells ranging from 2 to 3000 CTC in 10 mL equivalent of blood. In this analysis,
our average recovery rate (overall sensitivity) was 99.91% (Fig 4C). We observed similar linear-
ity (overall sensitivity) with HeLa cells over 4 tumor cell concentrations (Fig 4D), with an aver-
age recovery rate of 100% ± 1%.
Finally, we calculated the percent coefficient of variation (% CV), a measure of precision,
for each condition tested (cell line, volume of blood, number of spiked cells) (Table B in S1
File). Average %CV was 22% in experiments with spiked cells counted by cell dilution (n = 6
conditions, 52 tests). In experiments with micromanipulated spiked cells, average %CV was
also 22% (n = 9 conditions, 62 tests) (Table B in S1 File). As expected, in these tests with an
extremely low number of spiked cells, which assess the detection limit, the %CV values are
usually higher because of the binary nature of the test results (0 or 1 cell) which has an impact
on the readout. Accuracy (measured as recovery error) was below 25% for all conditions
(Table B in S1 File). Under the rigorous conditions of our spiking tests and readings (see
Methods), tumor cells’ recovery obtained using spiked cells counted by dilution was consistent
with that obtained using spiked cells counted by micropipetting.
It is worth mentioning that cell spiking with the individually micropipetted cells protocol
requires technical skills in single cells’ micromanipulation and is a particularly demanding
test. One single micropipetted cell added to ten mL of blood (containing on average 50 to 100
million leukocytes and 50 billion erythrocytes) can be lost if it is damaged by the trypsin used
to detach cells from the petri dish. In this case, the spiked rare cells can be lost independently
from the capability of the ISET1 system to capture them from blood.
To verify if the cells are evenly distributed over 5 spots, we used the methodology described
by Krebs et al. [12] and assessed intra-assay precision and accuracy (Fig 5). We examined the
number of tumor cells found on each spot after spiking of 50 A549 cells counted by dilution
into 5 mL of blood and filtration on 5 spots (each corresponding to the filtration of 1 mL of
Table 3. In vitro assay of ISET® sensitivity using various types of cancer cells.
Cell line MCF-7 HeLa MMTV-PyMT
Blood processed 1 mL 1 mL 1 mL
Spiked tumor cells/test 1 1 3 2
Fixed tumor cells detected by ISET® per test (N = 3–5 tests) 1 1 1 3 2
1 0 1 3 2
1 1 1 3 1
1 1 1
1 1
Total detected/spiked cells 9/10 3/3 9/9 6/8
Recovery success rate 90% 100% 100% 75%
doi:10.1371/journal.pone.0169427.t003
Highly Sensitive Isolation and Analysis of Live and Fixed CTC by ISET®
PLOS ONE | DOI:10.1371/journal.pone.0169427 January 6, 2017 15 / 49
blood). To study the impact of tumor cells’ distribution on 5 spots, we diluted tumor cells and
obtained 43 to 59 cells per 5 mL in three different experiments (on average 8.6 to 11.8 A549
per mL). For each experiment, tumor cells’ counts were calculated from all possible combina-
tions of spots (i.e. any 1, any 2, any 3, any 4). The average tumor cells’ number (± Standard
Error) with 95% confidence intervals (CI) was calculated for each experiment and each combi-
nation of spots as described by Krebs et al. [12]. In an experiment with on average 8.6 tumor
cells per mL, analyzing four spots provided an accurate estimation of the true mean (mean ±SE = 8.6 ± 0.13 tumor cells per mL, 95% CI: 8.35–8.85). When analyzing 3 spots or 2 spots, the
estimation was less accurate, respectively 8.6 ± 0.14 (CI: 8.33–8.87) and 8.6 ± 0.21 (CI: 8.19–
9.01) tumor cells per mL. Similarly, in an experiment with on average 11.8 tumor cells per mL,
analyzing four spots provided an accurate estimation of the true mean (11.8 ± 0.31, 95% CI:
11.41–12.19). When analyzing 3 spots or 2 spots, the estimation was less accurate, respectively
11.8 ± 0.22 (CI: 11.37–12.23) and 11.8 ± 0.33 (CI: 11.16–12.44) (Fig 5).
Altogether, ISET1 intra-assay average precision was 4% (range 2.9% to 5.8%) and average
accuracy was 2.7% (range 2.5% to 3.1%) when tumor cells were enumerated on 4 spots.
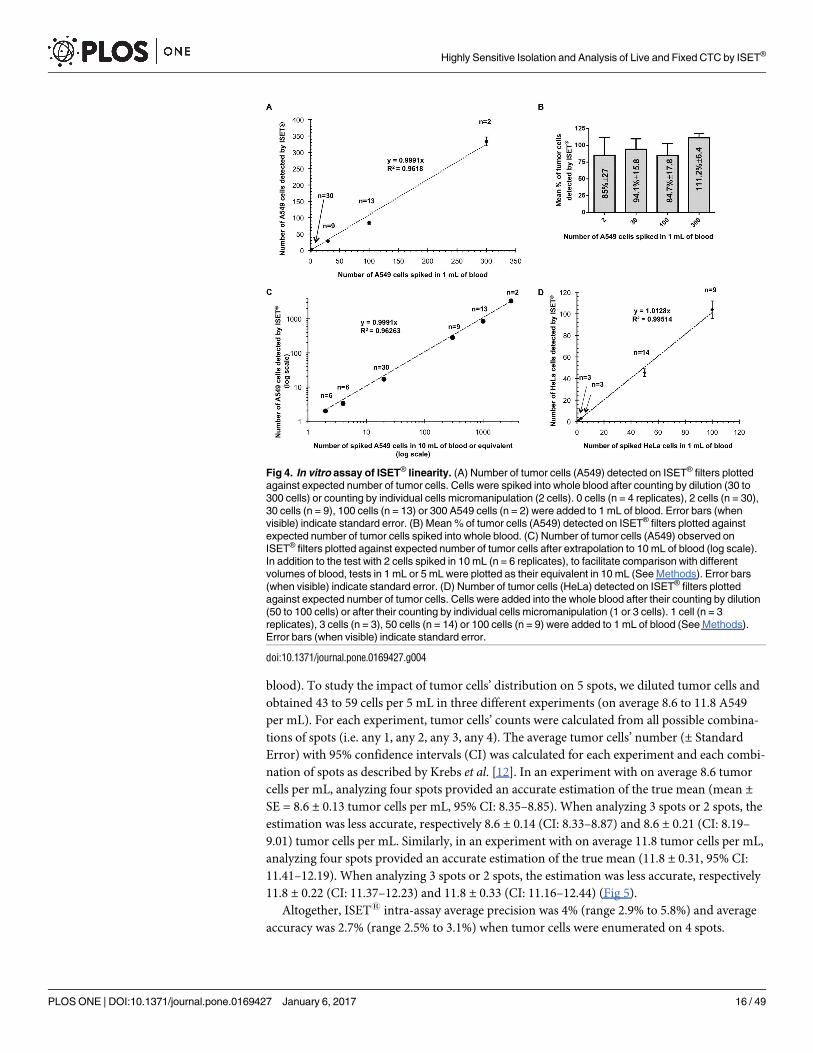
Fig 4. In vitro assay of ISET® linearity. (A) Number of tumor cells (A549) detected on ISET® filters plotted
against expected number of tumor cells. Cells were spiked into whole blood after counting by dilution (30 to
300 cells) or counting by individual cells micromanipulation (2 cells). 0 cells (n = 4 replicates), 2 cells (n = 30),
30 cells (n = 9), 100 cells (n = 13) or 300 A549 cells (n = 2) were added to 1 mL of blood. Error bars (when
visible) indicate standard error. (B) Mean % of tumor cells (A549) detected on ISET® filters plotted against
expected number of tumor cells spiked into whole blood. (C) Number of tumor cells (A549) observed on
ISET® filters plotted against expected number of tumor cells after extrapolation to 10 mL of blood (log scale).
In addition to the test with 2 cells spiked in 10 mL (n = 6 replicates), to facilitate comparison with different
volumes of blood, tests in 1 mL or 5 mL were plotted as their equivalent in 10 mL (See Methods). Error bars
(when visible) indicate standard error. (D) Number of tumor cells (HeLa) detected on ISET® filters plotted
against expected number of tumor cells. Cells were added into the whole blood after their counting by dilution
(50 to 100 cells) or after their counting by individual cells micromanipulation (1 or 3 cells). 1 cell (n = 3
replicates), 3 cells (n = 3), 50 cells (n = 14) or 100 cells (n = 9) were added to 1 mL of blood (See Methods).
Error bars (when visible) indicate standard error.
doi:10.1371/journal.pone.0169427.g004
Highly Sensitive Isolation and Analysis of Live and Fixed CTC by ISET®
PLOS ONE | DOI:10.1371/journal.pone.0169427 January 6, 2017 16 / 49
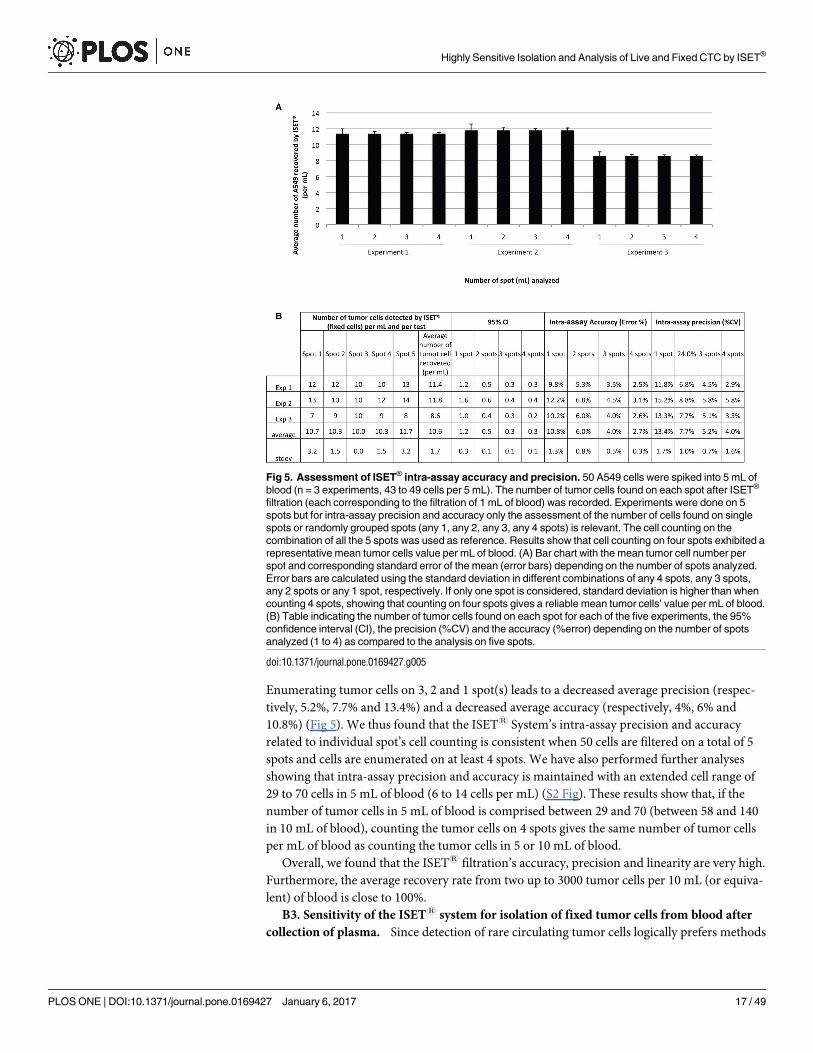
Enumerating tumor cells on 3, 2 and 1 spot(s) leads to a decreased average precision (respec-
tively, 5.2%, 7.7% and 13.4%) and a decreased average accuracy (respectively, 4%, 6% and
10.8%) (Fig 5). We thus found that the ISET1 System’s intra-assay precision and accuracy
related to individual spot’s cell counting is consistent when 50 cells are filtered on a total of 5
spots and cells are enumerated on at least 4 spots. We have also performed further analyses
showing that intra-assay precision and accuracy is maintained with an extended cell range of
29 to 70 cells in 5 mL of blood (6 to 14 cells per mL) (S2 Fig). These results show that, if the
number of tumor cells in 5 mL of blood is comprised between 29 and 70 (between 58 and 140
in 10 mL of blood), counting the tumor cells on 4 spots gives the same number of tumor cells
per mL of blood as counting the tumor cells in 5 or 10 mL of blood.
Overall, we found that the ISET1 filtration’s accuracy, precision and linearity are very high.
Furthermore, the average recovery rate from two up to 3000 tumor cells per 10 mL (or equiva-
lent) of blood is close to 100%.
B3. Sensitivity of the ISET1 system for isolation of fixed tumor cells from blood after
collection of plasma. Since detection of rare circulating tumor cells logically prefers methods
Fig 5. Assessment of ISET® intra-assay accuracy and precision. 50 A549 cells were spiked into 5 mL of
blood (n = 3 experiments, 43 to 49 cells per 5 mL). The number of tumor cells found on each spot after ISET®
filtration (each corresponding to the filtration of 1 mL of blood) was recorded. Experiments were done on 5
spots but for intra-assay precision and accuracy only the assessment of the number of cells found on single
spots or randomly grouped spots (any 1, any 2, any 3, any 4 spots) is relevant. The cell counting on the
combination of all the 5 spots was used as reference. Results show that cell counting on four spots exhibited a
representative mean tumor cells value per mL of blood. (A) Bar chart with the mean tumor cell number per
spot and corresponding standard error of the mean (error bars) depending on the number of spots analyzed.
Error bars are calculated using the standard deviation in different combinations of any 4 spots, any 3 spots,
any 2 spots or any 1 spot, respectively. If only one spot is considered, standard deviation is higher than when
counting 4 spots, showing that counting on four spots gives a reliable mean tumor cells’ value per mL of blood.
(B) Table indicating the number of tumor cells found on each spot for each of the five experiments, the 95%
confidence interval (CI), the precision (%CV) and the accuracy (%error) depending on the number of spots
analyzed (1 to 4) as compared to the analysis on five spots.
doi:10.1371/journal.pone.0169427.g005
Highly Sensitive Isolation and Analysis of Live and Fixed CTC by ISET®
PLOS ONE | DOI:10.1371/journal.pone.0169427 January 6, 2017 17 / 49
using a non-negligible volume of blood (8 to 10 mL), we checked the feasibility of isolating
plasma and tumor cells from the same blood sample. This protocol aims to perform multiple
tests using the same sample, in order to make full use of the precious patient’s blood sample
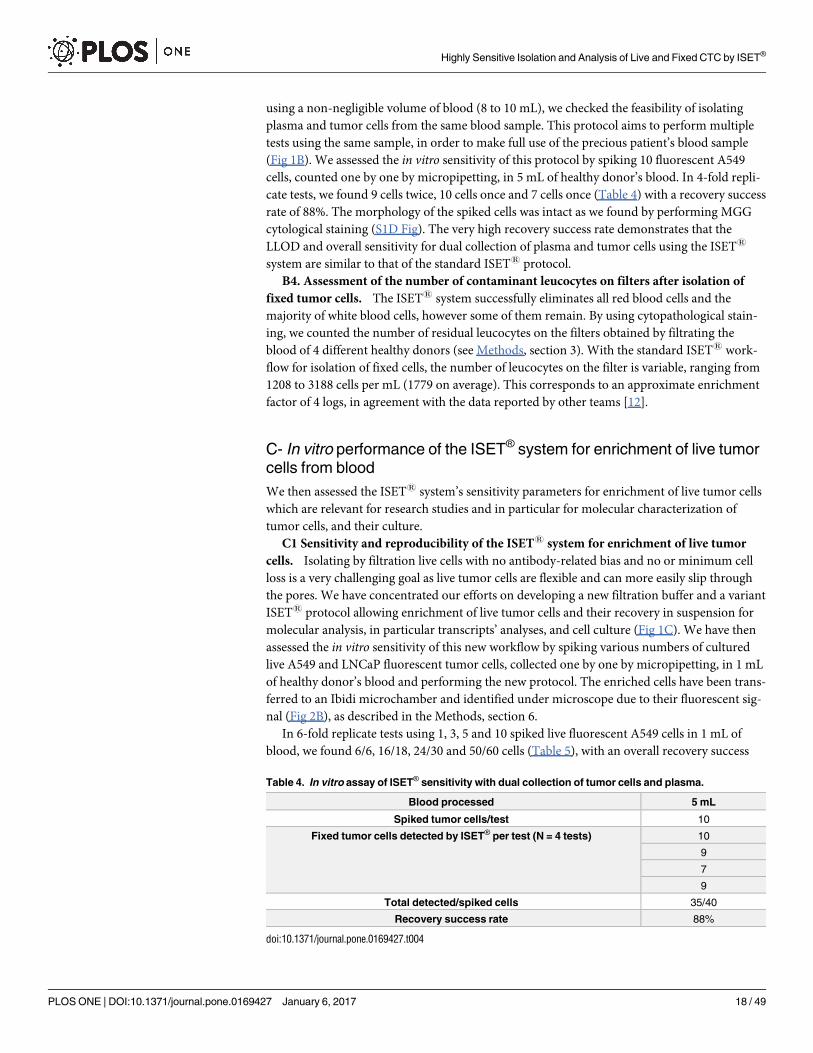
(Fig 1B). We assessed the in vitro sensitivity of this protocol by spiking 10 fluorescent A549
cells, counted one by one by micropipetting, in 5 mL of healthy donor’s blood. In 4-fold repli-
cate tests, we found 9 cells twice, 10 cells once and 7 cells once (Table 4) with a recovery success
rate of 88%. The morphology of the spiked cells was intact as we found by performing MGG
cytological staining (S1D Fig). The very high recovery success rate demonstrates that the
LLOD and overall sensitivity for dual collection of plasma and tumor cells using the ISET1
system are similar to that of the standard ISET1 protocol.
B4. Assessment of the number of contaminant leucocytes on filters after isolation of
fixed tumor cells. The ISET1 system successfully eliminates all red blood cells and the
majority of white blood cells, however some of them remain. By using cytopathological stain-
ing, we counted the number of residual leucocytes on the filters obtained by filtrating the
blood of 4 different healthy donors (see Methods, section 3). With the standard ISET1 work-
flow for isolation of fixed cells, the number of leucocytes on the filter is variable, ranging from
1208 to 3188 cells per mL (1779 on average). This corresponds to an approximate enrichment
factor of 4 logs, in agreement with the data reported by other teams [12].
C- In vitro performance of the ISET® system for enrichment of live tumor
cells from blood
We then assessed the ISET1 system’s sensitivity parameters for enrichment of live tumor cells
which are relevant for research studies and in particular for molecular characterization of
tumor cells, and their culture.
C1 Sensitivity and reproducibility of the ISET1 system for enrichment of live tumor
cells. Isolating by filtration live cells with no antibody-related bias and no or minimum cell
loss is a very challenging goal as live tumor cells are flexible and can more easily slip through
the pores. We have concentrated our efforts on developing a new filtration buffer and a variant
ISET1 protocol allowing enrichment of live tumor cells and their recovery in suspension for
molecular analysis, in particular transcripts’ analyses, and cell culture (Fig 1C). We have then
assessed the in vitro sensitivity of this new workflow by spiking various numbers of cultured
live A549 and LNCaP fluorescent tumor cells, collected one by one by micropipetting, in 1 mL
of healthy donor’s blood and performing the new protocol. The enriched cells have been trans-
ferred to an Ibidi microchamber and identified under microscope due to their fluorescent sig-
nal (Fig 2B), as described in the Methods, section 6.
In 6-fold replicate tests using 1, 3, 5 and 10 spiked live fluorescent A549 cells in 1 mL of
blood, we found 6/6, 16/18, 24/30 and 50/60 cells (Table 5), with an overall recovery success
Table 4. In vitro assay of ISET® sensitivity with dual collection of tumor cells and plasma.
Blood processed 5 mL
Spiked tumor cells/test 10
Fixed tumor cells detected by ISET® per test (N = 4 tests) 10
9
7
9
Total detected/spiked cells 35/40
Recovery success rate 88%
doi:10.1371/journal.pone.0169427.t004
Highly Sensitive Isolation and Analysis of Live and Fixed CTC by ISET®
PLOS ONE | DOI:10.1371/journal.pone.0169427 January 6, 2017 18 / 49
rate of 100%, 89%, 80% and 83%, respectively. Spiking tests were repeated with 5-fold replicate
tests using 1 and 5 spiked live fluorescent LNCaP cells in 1 mL of blood. We found a total
number of 4/5 and 21/25 cells with an overall recovery success rate of 80 and 84%, respectively
(Table 5). Furthermore, using a Trypan blue stain, we found that the viability of the enriched
live tumor cells was maintained. The recovery rate and the analytical sensitivity we obtained
with live A549 and LNCaP cells are very high. Sensitivity at the closest concentration to the
LLOD tested (i.e. 1 tumor cell in 1 mL of blood) was 100% and similar to that obtained with
the standard ISET1 protocol for isolation of fixed cells (Tables 1–3).
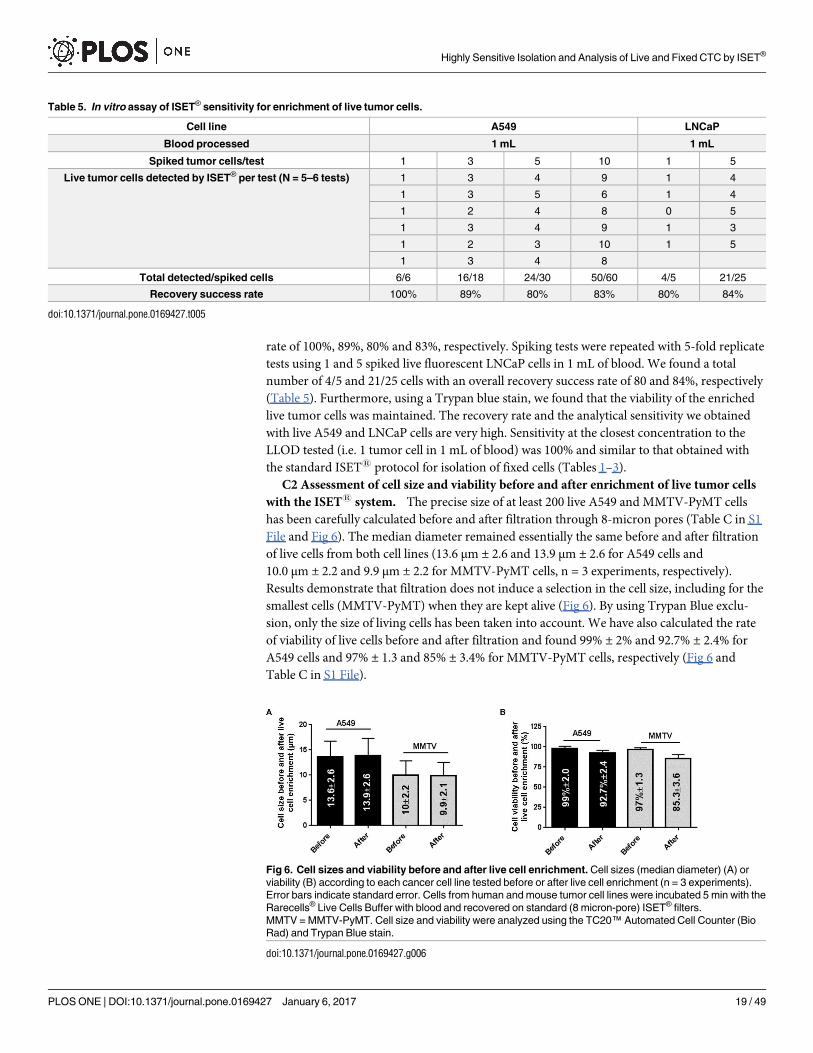
C2 Assessment of cell size and viability before and after enrichment of live tumor cells
with the ISET1 system. The precise size of at least 200 live A549 and MMTV-PyMT cells
has been carefully calculated before and after filtration through 8-micron pores (Table C in S1
File and Fig 6). The median diameter remained essentially the same before and after filtration
of live cells from both cell lines (13.6 μm ± 2.6 and 13.9 μm ± 2.6 for A549 cells and
10.0 μm ± 2.2 and 9.9 μm ± 2.2 for MMTV-PyMT cells, n = 3 experiments, respectively).
Results demonstrate that filtration does not induce a selection in the cell size, including for the
smallest cells (MMTV-PyMT) when they are kept alive (Fig 6). By using Trypan Blue exclu-
sion, only the size of living cells has been taken into account. We have also calculated the rate
of viability of live cells before and after filtration and found 99% ± 2% and 92.7% ± 2.4% for
A549 cells and 97% ± 1.3 and 85% ± 3.4% for MMTV-PyMT cells, respectively (Fig 6 and
Table C in S1 File).
Table 5. In vitro assay of ISET® sensitivity for enrichment of live tumor cells.
Cell line A549 LNCaP
Blood processed 1 mL 1 mL
Spiked tumor cells/test 1 3 5 10 1 5
Live tumor cells detected by ISET® per test (N = 5–6 tests) 1 3 4 9 1 4
1 3 5 6 1 4
1 2 4 8 0 5
1 3 4 9 1 3
1 2 3 10 1 5
1 3 4 8
Total detected/spiked cells 6/6 16/18 24/30 50/60 4/5 21/25
Recovery success rate 100% 89% 80% 83% 80% 84%
doi:10.1371/journal.pone.0169427.t005
Fig 6. Cell sizes and viability before and after live cell enrichment. Cell sizes (median diameter) (A) or
viability (B) according to each cancer cell line tested before or after live cell enrichment (n = 3 experiments).
Error bars indicate standard error. Cells from human and mouse tumor cell lines were incubated 5 min with the
Rarecells® Live Cells Buffer with blood and recovered on standard (8 micron-pore) ISET® filters.
MMTV = MMTV-PyMT. Cell size and viability were analyzed using the TC20™ Automated Cell Counter (Bio
Rad) and Trypan Blue stain.
doi:10.1371/journal.pone.0169427.g006
Highly Sensitive Isolation and Analysis of Live and Fixed CTC by ISET®
PLOS ONE | DOI:10.1371/journal.pone.0169427 January 6, 2017 19 / 49
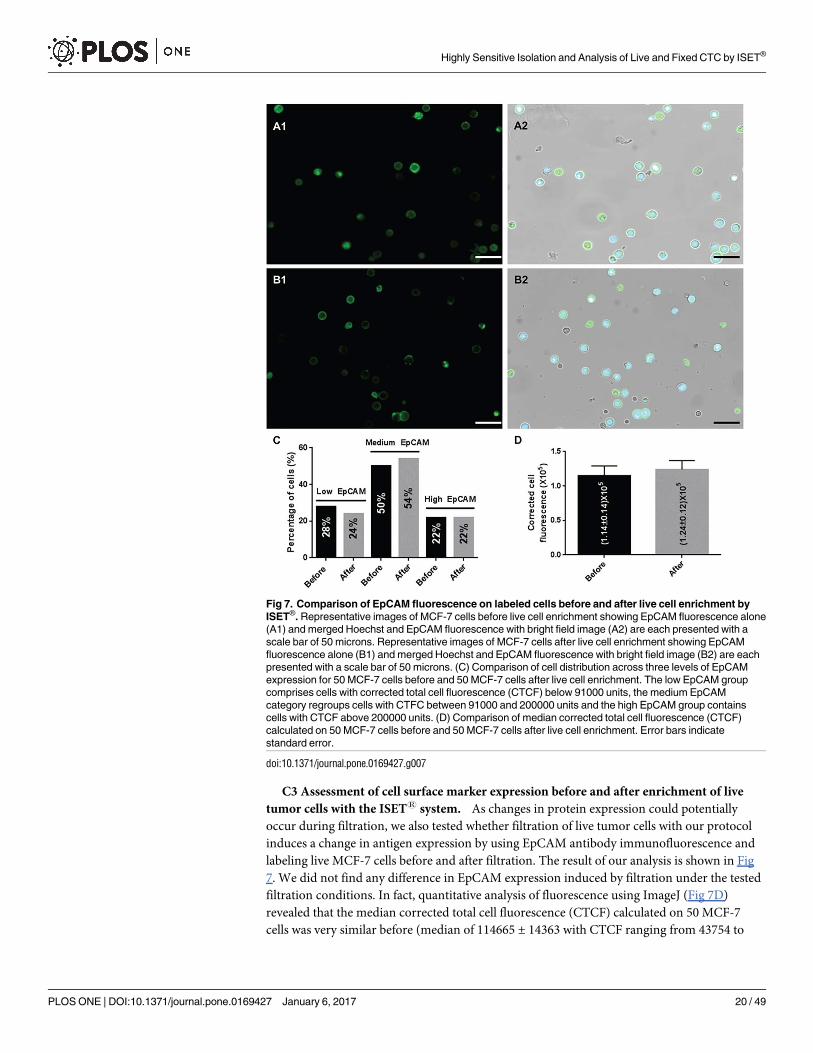
C3 Assessment of cell surface marker expression before and after enrichment of live
tumor cells with the ISET1 system. As changes in protein expression could potentially
occur during filtration, we also tested whether filtration of live tumor cells with our protocol
induces a change in antigen expression by using EpCAM antibody immunofluorescence and
labeling live MCF-7 cells before and after filtration. The result of our analysis is shown in Fig
7. We did not find any difference in EpCAM expression induced by filtration under the tested
filtration conditions. In fact, quantitative analysis of fluorescence using ImageJ (Fig 7D)
revealed that the median corrected total cell fluorescence (CTCF) calculated on 50 MCF-7
cells was very similar before (median of 114665 ± 14363 with CTCF ranging from 43754 to
Fig 7. Comparison of EpCAM fluorescence on labeled cells before and after live cell enrichment by
ISET®. Representative images of MCF-7 cells before live cell enrichment showing EpCAM fluorescence alone
(A1) and merged Hoechst and EpCAM fluorescence with bright field image (A2) are each presented with a
scale bar of 50 microns. Representative images of MCF-7 cells after live cell enrichment showing EpCAM
fluorescence alone (B1) and merged Hoechst and EpCAM fluorescence with bright field image (B2) are each
presented with a scale bar of 50 microns. (C) Comparison of cell distribution across three levels of EpCAM
expression for 50 MCF-7 cells before and 50 MCF-7 cells after live cell enrichment. The low EpCAM group
comprises cells with corrected total cell fluorescence (CTCF) below 91000 units, the medium EpCAM
category regroups cells with CTFC between 91000 and 200000 units and the high EpCAM group contains
cells with CTCF above 200000 units. (D) Comparison of median corrected total cell fluorescence (CTCF)
calculated on 50 MCF-7 cells before and 50 MCF-7 cells after live cell enrichment. Error bars indicate
standard error.
doi:10.1371/journal.pone.0169427.g007
Highly Sensitive Isolation and Analysis of Live and Fixed CTC by ISET®
PLOS ONE | DOI:10.1371/journal.pone.0169427 January 6, 2017 20 / 49
494919) and after (median of 124021 ± 12697 with CTCF ranging from 65799 to 594996 units)
live cell enrichment. Furthermore, when applying cutoffs of CTCF to distinguish cells with low
EpCAM expression from those with medium and high EpCAM expression we found very sim-
ilar distributions of cells across all three categories: 28% (low), 50% (medium), 22% (high)
before live cell enrichment and 24% (low), 54% (medium), 22% (high) after live cell enrich-
ment, respectively (Fig 7C).
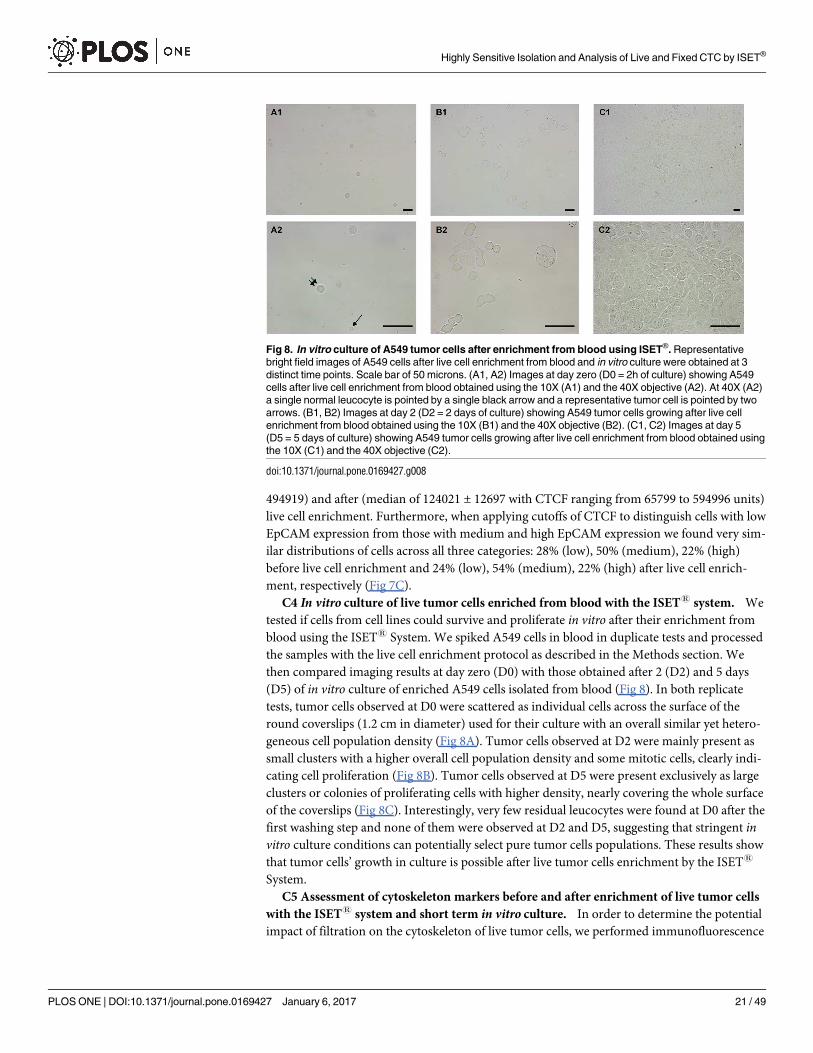
C4 In vitro culture of live tumor cells enriched from blood with the ISET1 system. We
tested if cells from cell lines could survive and proliferate in vitro after their enrichment from
blood using the ISET1 System. We spiked A549 cells in blood in duplicate tests and processed
the samples with the live cell enrichment protocol as described in the Methods section. We
then compared imaging results at day zero (D0) with those obtained after 2 (D2) and 5 days
(D5) of in vitro culture of enriched A549 cells isolated from blood (Fig 8). In both replicate
tests, tumor cells observed at D0 were scattered as individual cells across the surface of the
round coverslips (1.2 cm in diameter) used for their culture with an overall similar yet hetero-
geneous cell population density (Fig 8A). Tumor cells observed at D2 were mainly present as
small clusters with a higher overall cell population density and some mitotic cells, clearly indi-
cating cell proliferation (Fig 8B). Tumor cells observed at D5 were present exclusively as large
clusters or colonies of proliferating cells with higher density, nearly covering the whole surface
of the coverslips (Fig 8C). Interestingly, very few residual leucocytes were found at D0 after the
first washing step and none of them were observed at D2 and D5, suggesting that stringent invitro culture conditions can potentially select pure tumor cells populations. These results show
that tumor cells’ growth in culture is possible after live tumor cells enrichment by the ISET1
System.
C5 Assessment of cytoskeleton markers before and after enrichment of live tumor cells
with the ISET1 system and short term in vitro culture. In order to determine the potential
impact of filtration on the cytoskeleton of live tumor cells, we performed immunofluorescence
Fig 8. In vitro culture of A549 tumor cells after enrichment from blood using ISET®. Representative
bright field images of A549 cells after live cell enrichment from blood and in vitro culture were obtained at 3
distinct time points. Scale bar of 50 microns. (A1, A2) Images at day zero (D0 = 2h of culture) showing A549
cells after live cell enrichment from blood obtained using the 10X (A1) and the 40X objective (A2). At 40X (A2)
a single normal leucocyte is pointed by a single black arrow and a representative tumor cell is pointed by two
arrows. (B1, B2) Images at day 2 (D2 = 2 days of culture) showing A549 tumor cells growing after live cell
enrichment from blood obtained using the 10X (B1) and the 40X objective (B2). (C1, C2) Images at day 5
(D5 = 5 days of culture) showing A549 tumor cells growing after live cell enrichment from blood obtained using
the 10X (C1) and the 40X objective (C2).
doi:10.1371/journal.pone.0169427.g008
Highly Sensitive Isolation and Analysis of Live and Fixed CTC by ISET®
PLOS ONE | DOI:10.1371/journal.pone.0169427 January 6, 2017 21 / 49
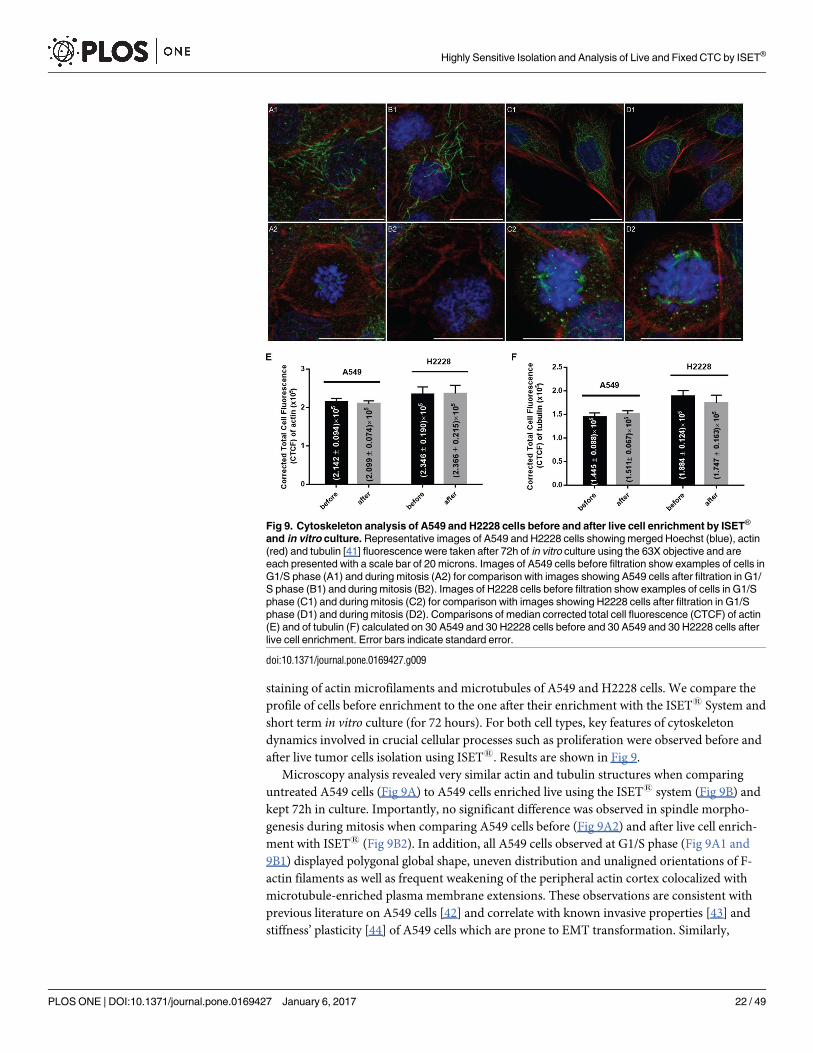
staining of actin microfilaments and microtubules of A549 and H2228 cells. We compare the
profile of cells before enrichment to the one after their enrichment with the ISET1 System and
short term in vitro culture (for 72 hours). For both cell types, key features of cytoskeleton
dynamics involved in crucial cellular processes such as proliferation were observed before and
after live tumor cells isolation using ISET1. Results are shown in Fig 9.
Microscopy analysis revealed very similar actin and tubulin structures when comparing
untreated A549 cells (Fig 9A) to A549 cells enriched live using the ISET1 system (Fig 9B) and
kept 72h in culture. Importantly, no significant difference was observed in spindle morpho-
genesis during mitosis when comparing A549 cells before (Fig 9A2) and after live cell enrich-
ment with ISET1 (Fig 9B2). In addition, all A549 cells observed at G1/S phase (Fig 9A1 and
9B1) displayed polygonal global shape, uneven distribution and unaligned orientations of F-
actin filaments as well as frequent weakening of the peripheral actin cortex colocalized with
microtubule-enriched plasma membrane extensions. These observations are consistent with
previous literature on A549 cells [42] and correlate with known invasive properties [43] and
stiffness’ plasticity [44] of A549 cells which are prone to EMT transformation. Similarly,
Fig 9. Cytoskeleton analysis of A549 and H2228 cells before and after live cell enrichment by ISET®
and in vitro culture. Representative images of A549 and H2228 cells showing merged Hoechst (blue), actin
(red) and tubulin [41] fluorescence were taken after 72h of in vitro culture using the 63X objective and are
each presented with a scale bar of 20 microns. Images of A549 cells before filtration show examples of cells in
G1/S phase (A1) and during mitosis (A2) for comparison with images showing A549 cells after filtration in G1/
S phase (B1) and during mitosis (B2). Images of H2228 cells before filtration show examples of cells in G1/S
phase (C1) and during mitosis (C2) for comparison with images showing H2228 cells after filtration in G1/S
phase (D1) and during mitosis (D2). Comparisons of median corrected total cell fluorescence (CTCF) of actin
(E) and of tubulin (F) calculated on 30 A549 and 30 H2228 cells before and 30 A549 and 30 H2228 cells after
live cell enrichment. Error bars indicate standard error.
doi:10.1371/journal.pone.0169427.g009
Highly Sensitive Isolation and Analysis of Live and Fixed CTC by ISET®
PLOS ONE | DOI:10.1371/journal.pone.0169427 January 6, 2017 22 / 49
enrichment followed by 72 hours of in vitro culture had no visible impact on the cytoskeleton
of H2228 cells (Fig 9D) as compared to untreated H2228 cells (Fig 9C). At G1/S phase, scat-
tered microtubules and long straight actin filaments were observed with thicker actin bundles
present near attachment sites of the plasma membrane for H2228 cells before (Fig 9C1) and
after live cell enrichment (Fig 9D1). Enriched H2228 cells entering mitosis (Fig 9D2) displayed
mitotic rounding, chromatin condensation and spindle morphogenesis with no apparent alter-
ation compared to untreated controls (Fig 9C2).
Furthermore, global quantitative analysis of actin fluorescence (Fig 9E) performed on
30 randomly picked cells revealed very similar results of median CTCF before (median of
214166 ± 9416 for A549 and 234552 ± 19036 for H2228) and after live cell enrichment and cul-
ture (median of 209915 ± 7405 for A549 and 236599 ± 21468 for H2228). Using a Student’s t-
test, the differences of actin CTCF before and after live cell enrichment were found to be not
significant (p value of Student test = 0.997 for A549 and 0.912 for H228).
Similarly, global quantitative analysis of tubulin fluorescence (Fig 9F) performed on 30 ran-
domly picked cells also revealed very similar results of median CTCF before (median of
144482 ± 8824 for A549 and 188390 ± 12406 for H2228) and after live cell enrichment and cul-
ture (median of 151118 ± 6732 for A549 and 174672 ± 16327 for H2228). Using a Student test,
the differences of tubulin CTCF before and after live cell enrichment were found to be not sig-
nificant (p value of Student test = 0.296 for A549 and 0.916 for H2228).
Of note, median CTCF was higher for H2228 as compared to A549, which could be due to
the larger size of H2228 cells or a higher expression level of tubulin and actin.
Altogether these results indicate that tumor cells’ morphology and cellular functions related
to the cytoskeleton distribution of F-actin and acetyl-α-tubulin can be either conserved or
restored after 72h of in vitro culture following live tumor cells isolation from blood using the
ISET1 system and protocol.
C6 Estimation of the remaining leukocytes after live tumor cells filtration and their
depletion using CD45 magnetic beads. The ISET1 System workflow for live cells success-
fully eliminates all red blood cells and the majority of white blood cells. The remaining white
blood cells (WBC) were counted in 2 tests as described in the Methods section 5. Results
showed from 640 to 2485 cells per mL of blood (1563 on average), thus similar to the amount
of WBC remaining using the fixed cell protocol, and an approximate enrichment factor of 4
logs.
We next tested the feasibility of eliminating the remaining leucocytes after live cells enrich-
ment with the ISET1 System using immuno-magnetic beads coated with CD45 antibodies
(Fig 1C). We spiked 10 A549 fluorescent cells, counting them one by one by micropipetting, in
1 mL of blood and processed the blood as described in the Methods section 6. In 9 replicate
experiments, we found 6 A549 once, 5 A549 once, 4 A549 three times and 3 A549 four times
with an average recovery rate of 40%, as shown in Table 6. As compared to the much higher
recovery rate obtained after enrichment of live cells (80 to 100%, Table 5), the additional
CD45-depletion step causes a loss of 50 to 60% of the enriched cells. However, no remaining
leucocytes were identified with this protocol and the morphology of the spiked cells remained
intact.
D- Next Generation sequencing analysis of live tumor cells isolated from
blood with the ISET® System
D1 Comparative NGS analysis of A549 and HCT116 cells before and after live tumor
cell enrichment and 72h in vitro culture. In order to further validate the potential clinical
interest of our live tumor cells filtration workflow for theranostic applications, we used Next
Highly Sensitive Isolation and Analysis of Live and Fixed CTC by ISET®
PLOS ONE | DOI:10.1371/journal.pone.0169427 January 6, 2017 23 / 49
Generation Sequencing (NGS) to study DNA mutations in A549 and HCT116 cells before and
after live tumor cells isolation followed by their short term (72h) in vitro culture. We used the
hotspot cancer panel v2 on the Ion Torrent™ platform as described in the Methods section 7.
This amplicon panel can detect 6893 possible COSMIC mutations over 50 oncogenes and
tumor suppressor genes [45].
Median coverage ranged from 1423X to 2073X among the different samples (S3 Fig).
Median sequencing depth across all variants detected was 2957X and 2357X for A549 DNA
extracted before and after live enrichment, respectively and 3103X and 3306X for HCT116
DNA extracted before and after live enrichment, respectively (Table D in S1 File). 17 SNP vari-
ants were found in A549 DNA including 11 COSMIC mutations classified as most likely path-
ogenic (Fig 10 and Table D in S1 File). Allele frequencies of all variants were concordant in the
sample ‘before filtration’ as compared to the sample ‘after filtration’ (Fig 10A and 10C).
Similarly, 25 variants were found in HCT116 cells including 23 SNPs and 2 INDELs. 16 of
these mutations are classified as most likely pathogenic (Table D in S1 File). Allele frequencies
of all variants were concordant in the sample ‘before filtration’ as compared to the sample
‘after filtration’ (Fig 10B and 10D). Of note, 4 of these heterozygous mutations were found in
the EGFR pathway (PIK3CA H1047R, SMO V404M, ABL1 Y257C and KRAS G13D) in agree-
ment with previous literature [46]. Of note, 11 variants were common in A549 and HCT116.
Interestingly, variants were also identified with confidence at a similar low frequency (6 to
10%) in both samples ‘before filtration’ and ‘after filtration’. (STK1 Q37L and FGFR3 P402P in
A549, and FGFR3 P402P in HCT116, Fig 10). This reflects a known phenomenon of genetic
and phenotypic heterogeneity of cells lines [47–49] that could be identified in our cell
populations.
In A549 DNAs, 3 regions had low coverage (under the 500X threshold) (S3 Fig). Two of
these regions were in the CDKN2A gene (amplicon coverage 0) which is depleted in A549
[50]. The last low coverage region was the same in all samples (A549 and HCT116); it corre-
sponds to a variant in CSF1R 3’UTR identified in all the samples, albeit with a coverage under
the 500X threshold (Table D in S1 File).
These results provide a proof of principle that the tumor cells’ genetic profile can remain
stable after their isolation from blood using our protocol and their short-term culture.
D2 Single-cell genetic analysis after live cell enrichment. Since studying the whole
genome of individual CTC when they are very rare is important to explore the CTC
Table 6. In vitro assay of ISET® sensitivity for enrichment of live tumor cells followed by CD45-immu-
nomagnetic mediated leukocytes depletion.
Blood processed 1 mL
Spiked tumor cells/test 10
Live tumor cells detected by ISET® after CD45-immuno-magnetic depletion per test (N = 9
tests)
4
3
3
6
4
5
4
3
3
Total detected/spiked cells 36/
90
Recovery success rate 40%
doi:10.1371/journal.pone.0169427.t006
Highly Sensitive Isolation and Analysis of Live and Fixed CTC by ISET®
PLOS ONE | DOI:10.1371/journal.pone.0169427 January 6, 2017 24 / 49
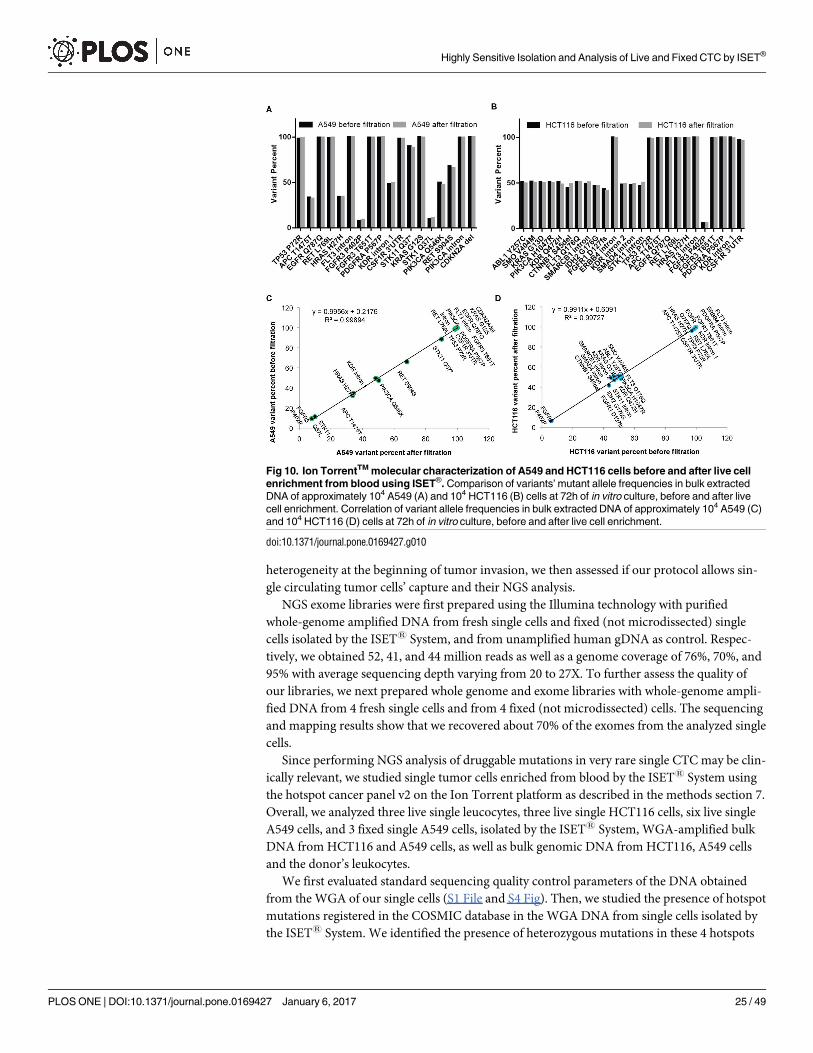
heterogeneity at the beginning of tumor invasion, we then assessed if our protocol allows sin-
gle circulating tumor cells’ capture and their NGS analysis.
NGS exome libraries were first prepared using the Illumina technology with purified
whole-genome amplified DNA from fresh single cells and fixed (not microdissected) single
cells isolated by the ISET1 System, and from unamplified human gDNA as control. Respec-
tively, we obtained 52, 41, and 44 million reads as well as a genome coverage of 76%, 70%, and
95% with average sequencing depth varying from 20 to 27X. To further assess the quality of
our libraries, we next prepared whole genome and exome libraries with whole-genome ampli-
fied DNA from 4 fresh single cells and from 4 fixed (not microdissected) cells. The sequencing
and mapping results show that we recovered about 70% of the exomes from the analyzed single
cells.
Since performing NGS analysis of druggable mutations in very rare single CTC may be clin-
ically relevant, we studied single tumor cells enriched from blood by the ISET1 System using
the hotspot cancer panel v2 on the Ion Torrent platform as described in the methods section 7.
Overall, we analyzed three live single leucocytes, three live single HCT116 cells, six live single
A549 cells, and 3 fixed single A549 cells, isolated by the ISET1 System, WGA-amplified bulk
DNA from HCT116 and A549 cells, as well as bulk genomic DNA from HCT116, A549 cells
and the donor’s leukocytes.
We first evaluated standard sequencing quality control parameters of the DNA obtained
from the WGA of our single cells (S1 File and S4 Fig). Then, we studied the presence of hotspot
mutations registered in the COSMIC database in the WGA DNA from single cells isolated by
the ISET1 System. We identified the presence of heterozygous mutations in these 4 hotspots
Fig 10. Ion TorrentTM molecular characterization of A549 and HCT116 cells before and after live cell
enrichment from blood using ISET®. Comparison of variants’ mutant allele frequencies in bulk extracted
DNA of approximately 104 A549 (A) and 104 HCT116 (B) cells at 72h of in vitro culture, before and after live
cell enrichment. Correlation of variant allele frequencies in bulk extracted DNA of approximately 104 A549 (C)
and 104 HCT116 (D) cells at 72h of in vitro culture, before and after live cell enrichment.
doi:10.1371/journal.pone.0169427.g010
Highly Sensitive Isolation and Analysis of Live and Fixed CTC by ISET®
PLOS ONE | DOI:10.1371/journal.pone.0169427 January 6, 2017 25 / 49
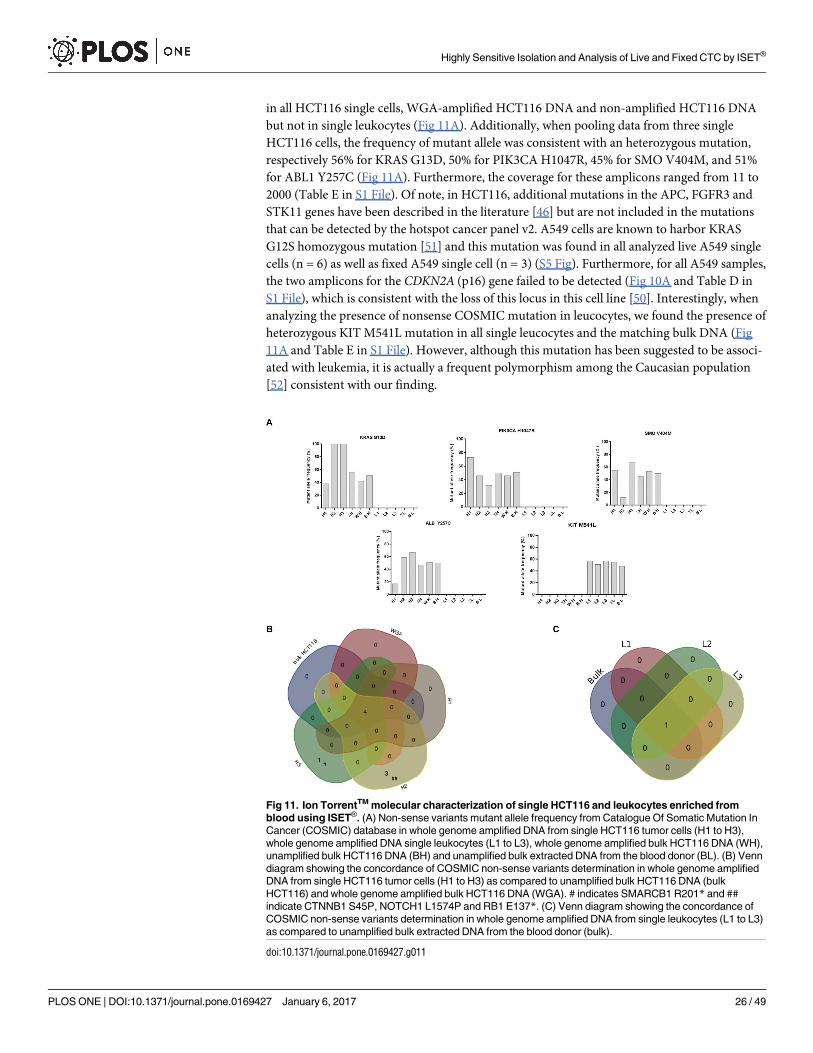
in all HCT116 single cells, WGA-amplified HCT116 DNA and non-amplified HCT116 DNA
but not in single leukocytes (Fig 11A). Additionally, when pooling data from three single
HCT116 cells, the frequency of mutant allele was consistent with an heterozygous mutation,
respectively 56% for KRAS G13D, 50% for PIK3CA H1047R, 45% for SMO V404M, and 51%
for ABL1 Y257C (Fig 11A). Furthermore, the coverage for these amplicons ranged from 11 to
2000 (Table E in S1 File). Of note, in HCT116, additional mutations in the APC, FGFR3 and
STK11 genes have been described in the literature [46] but are not included in the mutations
that can be detected by the hotspot cancer panel v2. A549 cells are known to harbor KRAS
G12S homozygous mutation [51] and this mutation was found in all analyzed live A549 single
cells (n = 6) as well as fixed A549 single cell (n = 3) (S5 Fig). Furthermore, for all A549 samples,
the two amplicons for the CDKN2A (p16) gene failed to be detected (Fig 10A and Table D in
S1 File), which is consistent with the loss of this locus in this cell line [50]. Interestingly, when
analyzing the presence of nonsense COSMIC mutation in leucocytes, we found the presence of
heterozygous KIT M541L mutation in all single leucocytes and the matching bulk DNA (Fig
11A and Table E in S1 File). However, although this mutation has been suggested to be associ-
ated with leukemia, it is actually a frequent polymorphism among the Caucasian population
[52] consistent with our finding.
Fig 11. Ion TorrentTM molecular characterization of single HCT116 and leukocytes enriched from
blood using ISET®. (A) Non-sense variants mutant allele frequency from Catalogue Of Somatic Mutation In
Cancer (COSMIC) database in whole genome amplified DNA from single HCT116 tumor cells (H1 to H3),
whole genome amplified DNA single leukocytes (L1 to L3), whole genome amplified bulk HCT116 DNA (WH),
unamplified bulk HCT116 DNA (BH) and unamplified bulk extracted DNA from the blood donor (BL). (B) Venn
diagram showing the concordance of COSMIC non-sense variants determination in whole genome amplified
DNA from single HCT116 tumor cells (H1 to H3) as compared to unamplified bulk HCT116 DNA (bulk
HCT116) and whole genome amplified bulk HCT116 DNA (WGA). # indicates SMARCB1 R201* and ##
indicate CTNNB1 S45P, NOTCH1 L1574P and RB1 E137*. (C) Venn diagram showing the concordance of
COSMIC non-sense variants determination in whole genome amplified DNA from single leukocytes (L1 to L3)
as compared to unamplified bulk extracted DNA from the blood donor (bulk).
doi:10.1371/journal.pone.0169427.g011
Highly Sensitive Isolation and Analysis of Live and Fixed CTC by ISET®
PLOS ONE | DOI:10.1371/journal.pone.0169427 January 6, 2017 26 / 49
Finally, we plotted all non-sense COSMIC mutations found in the HCT116 samples and
leucocytes and studied personal mutations (i.e. mutations which can only be identified in a
single sample). Personal mutations could reflect either heterogeneity (which is not expected
among leukocytes) or technical artifacts (error introduced by polymerase during WGA or
sequencing) (Fig 11B and 11C). While 0, 1 and 3 personal mutations were identified in the
three live single HCT116, personal mutations were not found in single leucocytes (n = 3), nor
in WGA-amplified bulk DNA from HCT116, nor in bulk DNA from HCT116 and the donor’s
leukocytes. The personal mutations found in HCT116 could represent variants, which are
present in less than 5% of the cells (the sensitivity of mutation detection in bulk DNA) or tech-
nical artifacts.
Overall, our data suggest that NGS-mediated whole genome analyses, exome analysis and
multi-genes panel analyses of tumor cells isolated by the ISET1 System are feasible. Of note,
we found consistent results with live and fixed tumor cells isolated by the ISET1 System, but
fixed cells required 3 additional cycles of pre-amplification at the NGS library preparation step
(S4A Fig). These data are susceptible to provide reliable and informative results for a deeper
understanding of CTC heterogeneity including at the critical early steps of tumor invasion.
Discussion
In this work, we describe new protocols for the study of circulating tumor cells with a particu-
lar focus on their isolation when they are extremely rare. We have assessed these protocols
using tumor cells from cell lines up to the immune-molecular characterization of the isolated
cells including through their culture. We show that the ISET1 system consistently isolates 2
cancer cells added to 1, 5 or 10 mL of blood with an average cell-recovery rate ranging from 83
to 100%. This high recovery is reproducible with different operators and with different devices.
The ISET1 system’s sensitivity threshold (or LLOD, Lower Limit Of Detection) is one tumor
cell per 10 mL of blood, which is the physical limit of the method. We also show that this level
of sensitivity is maintained when plasma is collected before isolation of tumor cells from blood
as well as when tumor cells are isolated from whole blood in a live form using a suitable modi-
fied buffer (without fixation). Finally, we show the feasibility of using the isolated live or fixed
cells for single-cell NGS analysis.
Our results show that ISET1 allows reproducible, accurate and linear detection and enu-
meration of cancer cells in blood (Tables 1–5, Figs 4 and 5 and S1 Fig). Our data are consistent
with sensitivity and linearity data previously reported by independent teams (S1B and S1C
Fig)[12, 27–29]. However, these teams did not extend ISET1’s analytical performance and its
sensitivity assessment to the extreme limits as we did. Following an independent clinical study
which demonstrated the capacity of the ISET1 system to detect CTC in patients developing
lung cancer years before the detection of tumor nodule by CT-scan [3], we decided to chal-
lenge its LLOD by testing it down to a few cells in 10 mL of blood, using an improved and
extremely precise protocol. Taken together, our results validate the in vitro analytical perfor-
mance of the ISET1 system.
We have assessed the sensitivity specifications of ISET1 with tumor cells having different
sizes. The median diameters of cultured tumor cells determined on filters typically range from
12 to 20 μm (Fig 3 and Table A in S1 File), consistently with previously published studies [10,
53, 54]. We have successfully isolated intact fixed mouse tumor cells as small as 8.5 μm in
diameter (median size on filter 12 μm) using the standard membrane with a nominal pore size
of 8 μm (Table 3, Fig 3 and Table A in S1 File). Furthermore, we could enrich by the ISET1
System live cells having a median diameter of 10 μm without bias of selection as shown by size
assessment before and after filtration (Fig 6).
Highly Sensitive Isolation and Analysis of Live and Fixed CTC by ISET®
PLOS ONE | DOI:10.1371/journal.pone.0169427 January 6, 2017 27 / 49
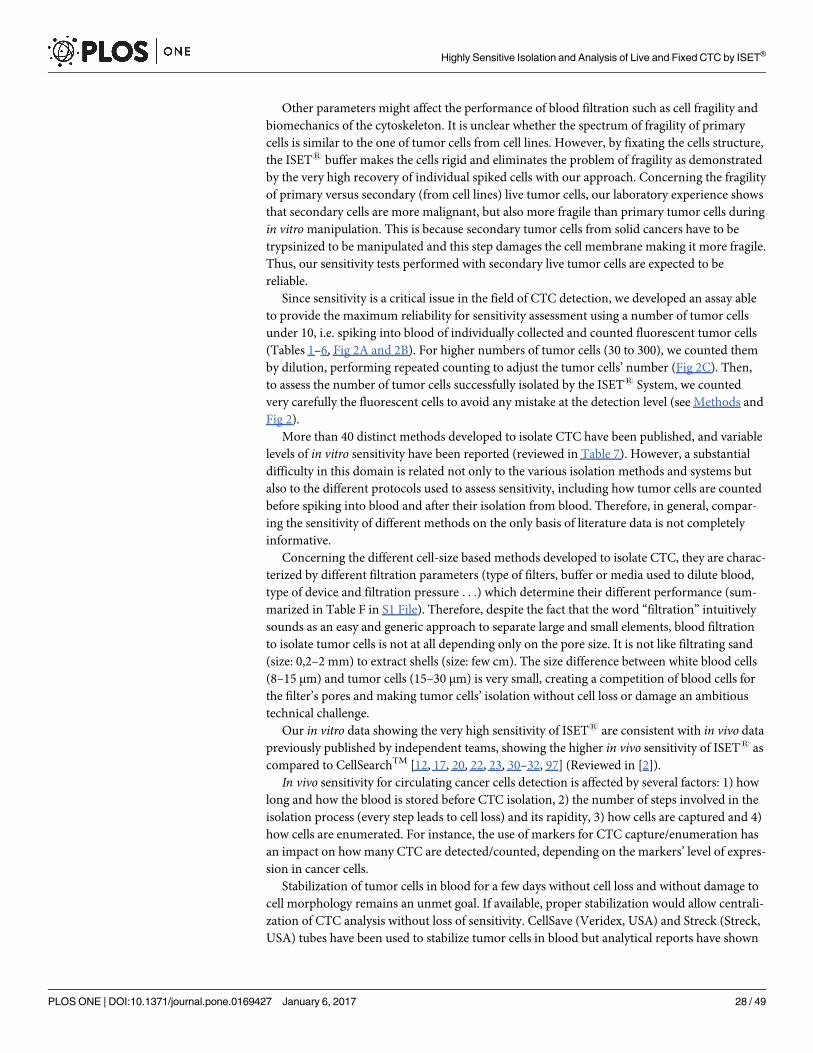
Other parameters might affect the performance of blood filtration such as cell fragility and
biomechanics of the cytoskeleton. It is unclear whether the spectrum of fragility of primary
cells is similar to the one of tumor cells from cell lines. However, by fixating the cells structure,
the ISET1 buffer makes the cells rigid and eliminates the problem of fragility as demonstrated
by the very high recovery of individual spiked cells with our approach. Concerning the fragility
of primary versus secondary (from cell lines) live tumor cells, our laboratory experience shows
that secondary cells are more malignant, but also more fragile than primary tumor cells during
in vitro manipulation. This is because secondary tumor cells from solid cancers have to be
trypsinized to be manipulated and this step damages the cell membrane making it more fragile.
Thus, our sensitivity tests performed with secondary live tumor cells are expected to be
reliable.
Since sensitivity is a critical issue in the field of CTC detection, we developed an assay able
to provide the maximum reliability for sensitivity assessment using a number of tumor cells
under 10, i.e. spiking into blood of individually collected and counted fluorescent tumor cells
(Tables 1–6, Fig 2A and 2B). For higher numbers of tumor cells (30 to 300), we counted them
by dilution, performing repeated counting to adjust the tumor cells’ number (Fig 2C). Then,
to assess the number of tumor cells successfully isolated by the ISET1 System, we counted
very carefully the fluorescent cells to avoid any mistake at the detection level (see Methods and
Fig 2).
More than 40 distinct methods developed to isolate CTC have been published, and variable
levels of in vitro sensitivity have been reported (reviewed in Table 7). However, a substantial
difficulty in this domain is related not only to the various isolation methods and systems but
also to the different protocols used to assess sensitivity, including how tumor cells are counted
before spiking into blood and after their isolation from blood. Therefore, in general, compar-
ing the sensitivity of different methods on the only basis of literature data is not completely
informative.
Concerning the different cell-size based methods developed to isolate CTC, they are charac-
terized by different filtration parameters (type of filters, buffer or media used to dilute blood,
type of device and filtration pressure . . .) which determine their different performance (sum-
marized in Table F in S1 File). Therefore, despite the fact that the word “filtration” intuitively
sounds as an easy and generic approach to separate large and small elements, blood filtration
to isolate tumor cells is not at all depending only on the pore size. It is not like filtrating sand
(size: 0,2–2 mm) to extract shells (size: few cm). The size difference between white blood cells
(8–15 μm) and tumor cells (15–30 μm) is very small, creating a competition of blood cells for
the filter’s pores and making tumor cells’ isolation without cell loss or damage an ambitious
technical challenge.
Our in vitro data showing the very high sensitivity of ISET1 are consistent with in vivo data
previously published by independent teams, showing the higher in vivo sensitivity of ISET1 as
compared to CellSearchTM [12, 17, 20, 22, 23, 30–32, 97] (Reviewed in [2]).
In vivo sensitivity for circulating cancer cells detection is affected by several factors: 1) how
long and how the blood is stored before CTC isolation, 2) the number of steps involved in the
isolation process (every step leads to cell loss) and its rapidity, 3) how cells are captured and 4)
how cells are enumerated. For instance, the use of markers for CTC capture/enumeration has
an impact on how many CTC are detected/counted, depending on the markers’ level of expres-
sion in cancer cells.
Stabilization of tumor cells in blood for a few days without cell loss and without damage to
cell morphology remains an unmet goal. If available, proper stabilization would allow centrali-
zation of CTC analysis without loss of sensitivity. CellSave (Veridex, USA) and Streck (Streck,
USA) tubes have been used to stabilize tumor cells in blood but analytical reports have shown
Highly Sensitive Isolation and Analysis of Live and Fixed CTC by ISET®
PLOS ONE | DOI:10.1371/journal.pone.0169427 January 6, 2017 28 / 49
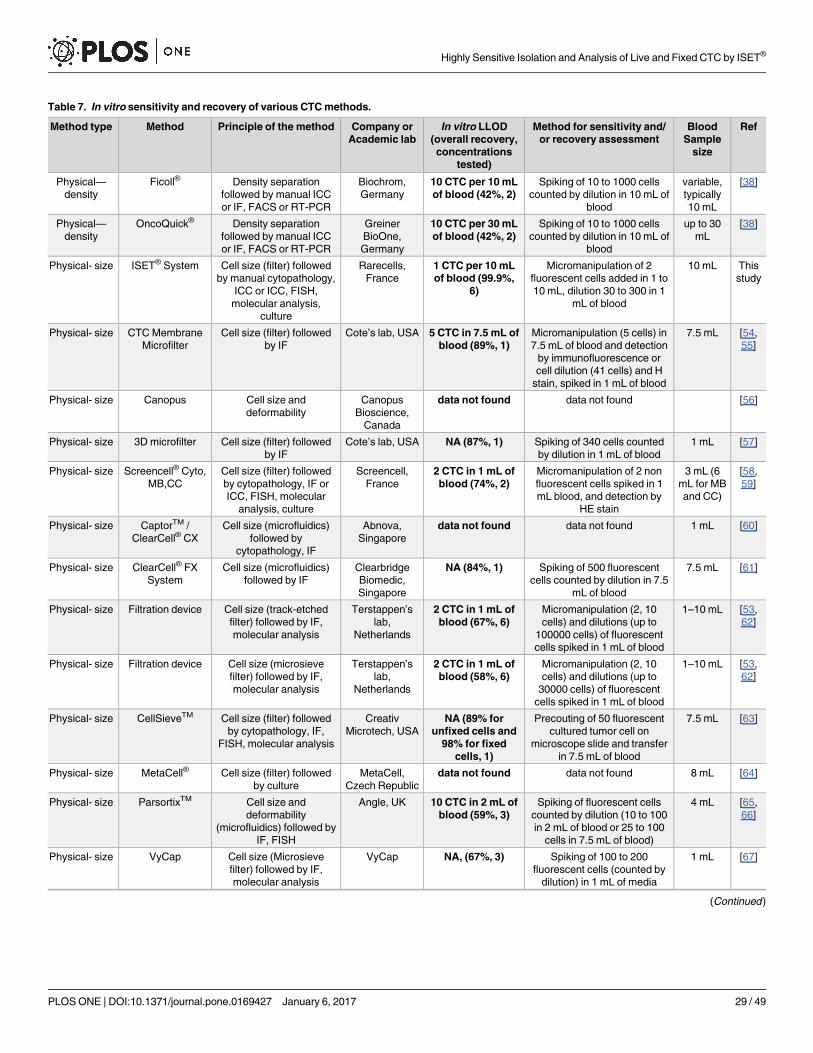
Table 7. In vitro sensitivity and recovery of various CTC methods.
Method type Method Principle of the method Company or
Academic lab
In vitro LLOD
(overall recovery,
concentrations
tested)
Method for sensitivity and/
or recovery assessment
Blood
Sample
size
Ref
Physical—
density
Ficoll® Density separation
followed by manual ICC
or IF, FACS or RT-PCR
Biochrom,
Germany
10 CTC per 10 mL
of blood (42%, 2)
Spiking of 10 to 1000 cells
counted by dilution in 10 mL of
blood
variable,
typically
10 mL
[38]
Physical—
density
OncoQuick® Density separation
followed by manual ICC
or IF, FACS or RT-PCR
Greiner
BioOne,
Germany
10 CTC per 30 mL
of blood (42%, 2)
Spiking of 10 to 1000 cells
counted by dilution in 10 mL of
blood
up to 30
mL
[38]
Physical- size ISET® System Cell size (filter) followed
by manual cytopathology,
ICC or ICC, FISH,
molecular analysis,
culture
Rarecells,
France
1 CTC per 10 mL
of blood (99.9%,
6)
Micromanipulation of 2
fluorescent cells added in 1 to
10 mL, dilution 30 to 300 in 1
mL of blood
10 mL This
study
Physical- size CTC Membrane
Microfilter
Cell size (filter) followed
by IF
Cote’s lab, USA 5 CTC in 7.5 mL of
blood (89%, 1)
Micromanipulation (5 cells) in
7.5 mL of blood and detection
by immunofluorescence or
cell dilution (41 cells) and H
stain, spiked in 1 mL of blood
7.5 mL [54,
55]
Physical- size Canopus Cell size and
deformability
Canopus
Bioscience,
Canada
data not found data not found [56]
Physical- size 3D microfilter Cell size (filter) followed
by IF
Cote’s lab, USA NA (87%, 1) Spiking of 340 cells counted
by dilution in 1 mL of blood
1 mL [57]
Physical- size Screencell® Cyto,
MB,CC
Cell size (filter) followed
by cytopathology, IF or
ICC, FISH, molecular
analysis, culture
Screencell,
France
2 CTC in 1 mL of
blood (74%, 2)
Micromanipulation of 2 non
fluorescent cells spiked in 1
mL blood, and detection by
HE stain
3 mL (6
mL for MB
and CC)
[58,
59]
Physical- size CaptorTM /
ClearCell® CX
Cell size (microfluidics)
followed by
cytopathology, IF
Abnova,
Singapore
data not found data not found 1 mL [60]
Physical- size ClearCell® FX
System
Cell size (microfluidics)
followed by IF
Clearbridge
Biomedic,
Singapore
NA (84%, 1) Spiking of 500 fluorescent
cells counted by dilution in 7.5
mL of blood
7.5 mL [61]
Physical- size Filtration device Cell size (track-etched
filter) followed by IF,
molecular analysis
Terstappen’s
lab,
Netherlands
2 CTC in 1 mL of
blood (67%, 6)
Micromanipulation (2, 10
cells) and dilutions (up to
100000 cells) of fluorescent
cells spiked in 1 mL of blood
1–10 mL [53,
62]
Physical- size Filtration device Cell size (microsieve
filter) followed by IF,
molecular analysis
Terstappen’s
lab,
Netherlands
2 CTC in 1 mL of
blood (58%, 6)
Micromanipulation (2, 10
cells) and dilutions (up to
30000 cells) of fluorescent
cells spiked in 1 mL of blood
1–10 mL [53,
62]
Physical- size CellSieveTM Cell size (filter) followed
by cytopathology, IF,
FISH, molecular analysis
Creativ
Microtech, USA
NA (89% for
unfixed cells and
98% for fixed
cells, 1)
Precouting of 50 fluorescent
cultured tumor cell on
microscope slide and transfer
in 7.5 mL of blood
7.5 mL [63]
Physical- size MetaCell® Cell size (filter) followed
by culture
MetaCell,
Czech Republic
data not found data not found 8 mL [64]
Physical- size ParsortixTM Cell size and
deformability
(microfluidics) followed by
IF, FISH
Angle, UK 10 CTC in 2 mL of
blood (59%, 3)
Spiking of fluorescent cells
counted by dilution (10 to 100
in 2 mL of blood or 25 to 100
cells in 7.5 mL of blood)
4 mL [65,
66]
Physical- size VyCap Cell size (Microsieve
filter) followed by IF,
molecular analysis
VyCap NA, (67%, 3) Spiking of 100 to 200
fluorescent cells (counted by
dilution) in 1 mL of media
1 mL [67]
(Continued )
Highly Sensitive Isolation and Analysis of Live and Fixed CTC by ISET®
PLOS ONE | DOI:10.1371/journal.pone.0169427 January 6, 2017 29 / 49
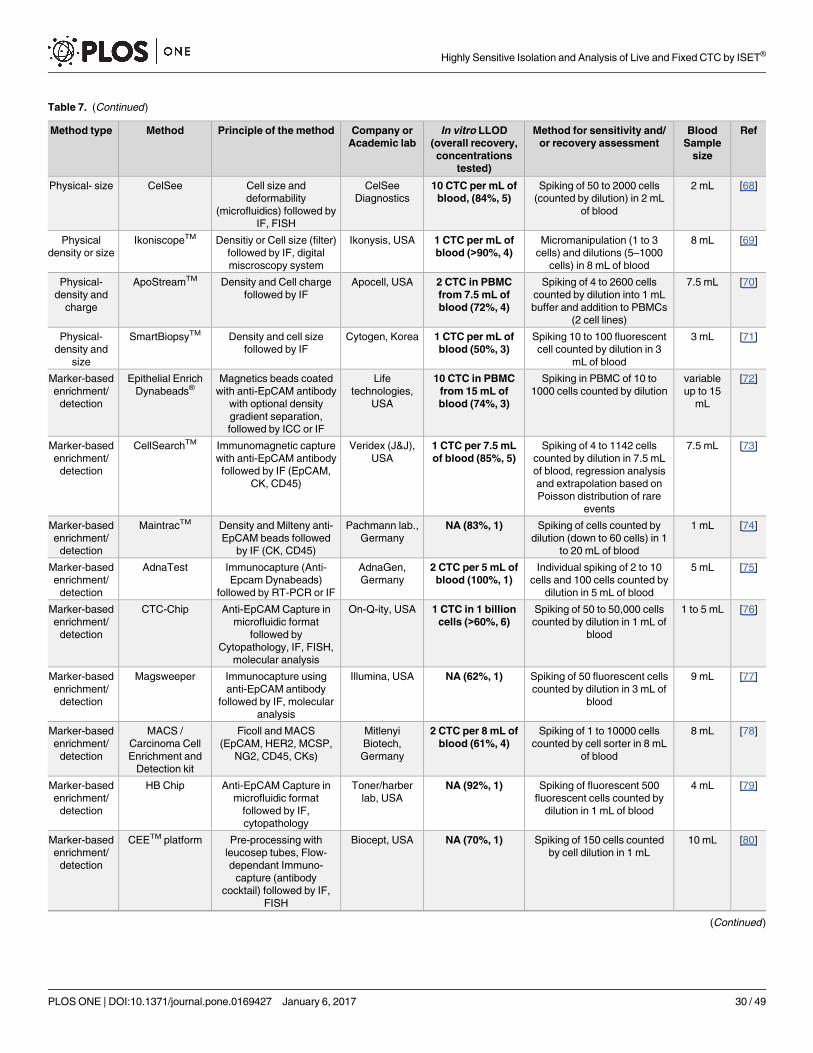
Table 7. (Continued)
Method type Method Principle of the method Company or
Academic lab
In vitro LLOD
(overall recovery,
concentrations
tested)
Method for sensitivity and/
or recovery assessment
Blood
Sample
size
Ref
Physical- size CelSee Cell size and
deformability
(microfluidics) followed by
IF, FISH
CelSee
Diagnostics
10 CTC per mL of
blood, (84%, 5)
Spiking of 50 to 2000 cells
(counted by dilution) in 2 mL
of blood
2 mL [68]
Physical
density or size
IkoniscopeTM Densitiy or Cell size (filter)
followed by IF, digital
miscroscopy system
Ikonysis, USA 1 CTC per mL of
blood (>90%, 4)
Micromanipulation (1 to 3
cells) and dilutions (5–1000
cells) in 8 mL of blood
8 mL [69]
Physical-
density and
charge
ApoStreamTM Density and Cell charge
followed by IF
Apocell, USA 2 CTC in PBMC
from 7.5 mL of
blood (72%, 4)
Spiking of 4 to 2600 cells
counted by dilution into 1 mL
buffer and addition to PBMCs
(2 cell lines)
7.5 mL [70]
Physical-
density and
size
SmartBiopsyTM Density and cell size
followed by IF
Cytogen, Korea 1 CTC per mL of
blood (50%, 3)
Spiking 10 to 100 fluorescent
cell counted by dilution in 3
mL of blood
3 mL [71]
Marker-based
enrichment/
detection
Epithelial Enrich
Dynabeads®Magnetics beads coated
with anti-EpCAM antibody
with optional density
gradient separation,
followed by ICC or IF
Life
technologies,
USA
10 CTC in PBMC
from 15 mL of
blood (74%, 3)
Spiking in PBMC of 10 to
1000 cells counted by dilution
variable
up to 15
mL
[72]
Marker-based
enrichment/
detection
CellSearchTM Immunomagnetic capture
with anti-EpCAM antibody
followed by IF (EpCAM,
CK, CD45)
Veridex (J&J),
USA
1 CTC per 7.5 mL
of blood (85%, 5)
Spiking of 4 to 1142 cells
counted by dilution in 7.5 mL
of blood, regression analysis
and extrapolation based on
Poisson distribution of rare
events
7.5 mL [73]
Marker-based
enrichment/
detection
MaintracTM Density and Milteny anti-
EpCAM beads followed
by IF (CK, CD45)
Pachmann lab.,
Germany
NA (83%, 1) Spiking of cells counted by
dilution (down to 60 cells) in 1
to 20 mL of blood
1 mL [74]
Marker-based
enrichment/
detection
AdnaTest Immunocapture (Anti-
Epcam Dynabeads)
followed by RT-PCR or IF
AdnaGen,
Germany
2 CTC per 5 mL of
blood (100%, 1)
Individual spiking of 2 to 10
cells and 100 cells counted by
dilution in 5 mL of blood
5 mL [75]
Marker-based
enrichment/
detection
CTC-Chip Anti-EpCAM Capture in
microfluidic format
followed by
Cytopathology, IF, FISH,
molecular analysis
On-Q-ity, USA 1 CTC in 1 billion
cells (>60%, 6)
Spiking of 50 to 50,000 cells
counted by dilution in 1 mL of
blood
1 to 5 mL [76]
Marker-based
enrichment/
detection
Magsweeper Immunocapture using
anti-EpCAM antibody
followed by IF, molecular
analysis
Illumina, USA NA (62%, 1) Spiking of 50 fluorescent cells
counted by dilution in 3 mL of
blood
9 mL [77]
Marker-based
enrichment/
detection
MACS /
Carcinoma Cell
Enrichment and
Detection kit
Ficoll and MACS
(EpCAM, HER2, MCSP,
NG2, CD45, CKs)
Mitlenyi
Biotech,
Germany
2 CTC per 8 mL of
blood (61%, 4)
Spiking of 1 to 10000 cells
counted by cell sorter in 8 mL
of blood
8 mL [78]
Marker-based
enrichment/
detection
HB Chip Anti-EpCAM Capture in
microfluidic format
followed by IF,
cytopathology
Toner/harber
lab, USA
NA (92%, 1) Spiking of fluorescent 500
fluorescent cells counted by
dilution in 1 mL of blood
4 mL [79]
Marker-based
enrichment/
detection
CEETM platform Pre-processing with
leucosep tubes, Flow-
dependant Immuno-
capture (antibody
cocktail) followed by IF,
FISH
Biocept, USA NA (70%, 1) Spiking of 150 cells counted
by cell dilution in 1 mL
10 mL [80]
(Continued )
Highly Sensitive Isolation and Analysis of Live and Fixed CTC by ISET®
PLOS ONE | DOI:10.1371/journal.pone.0169427 January 6, 2017 30 / 49
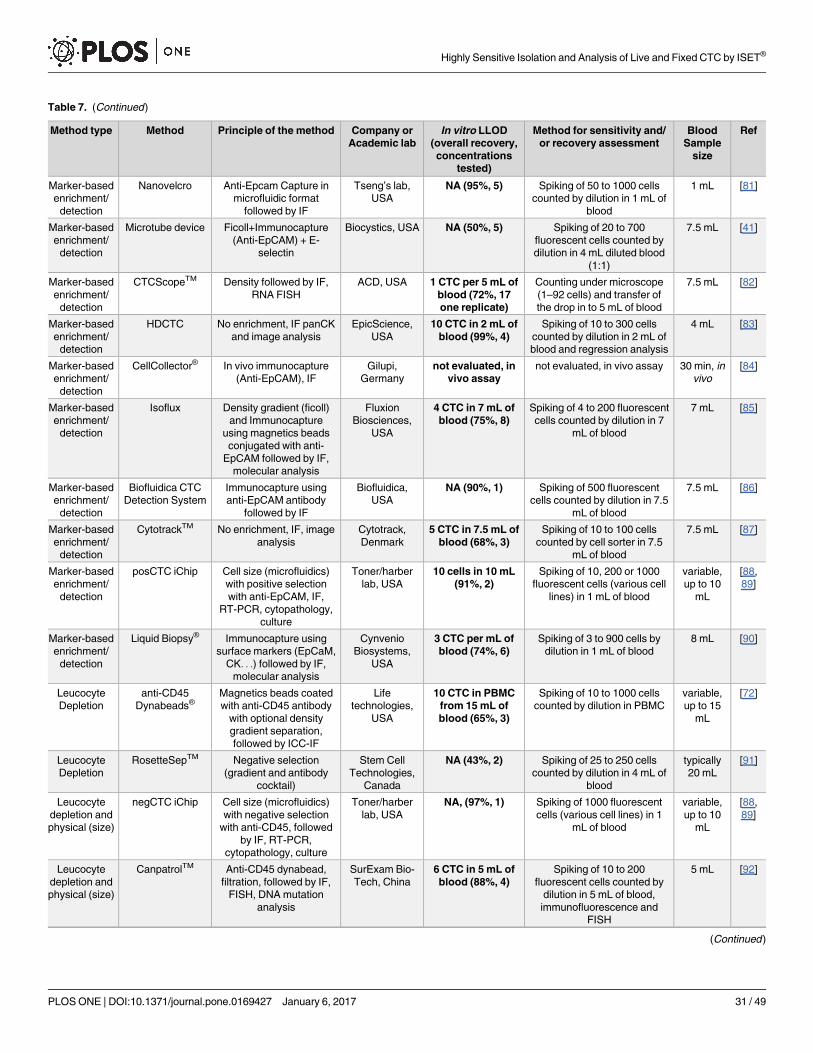
Table 7. (Continued)
Method type Method Principle of the method Company or
Academic lab
In vitro LLOD
(overall recovery,
concentrations
tested)
Method for sensitivity and/
or recovery assessment
Blood
Sample
size
Ref
Marker-based
enrichment/
detection
Nanovelcro Anti-Epcam Capture in
microfluidic format
followed by IF
Tseng’s lab,
USA
NA (95%, 5) Spiking of 50 to 1000 cells
counted by dilution in 1 mL of
blood
1 mL [81]
Marker-based
enrichment/
detection
Microtube device Ficoll+Immunocapture
(Anti-EpCAM) + E-
selectin
Biocystics, USA NA (50%, 5) Spiking of 20 to 700
fluorescent cells counted by
dilution in 4 mL diluted blood
(1:1)
7.5 mL [41]
Marker-based
enrichment/
detection
CTCScopeTM Density followed by IF,
RNA FISH
ACD, USA 1 CTC per 5 mL of
blood (72%, 17
one replicate)
Counting under microscope
(1–92 cells) and transfer of
the drop in to 5 mL of blood
7.5 mL [82]
Marker-based
enrichment/
detection
HDCTC No enrichment, IF panCK
and image analysis
EpicScience,
USA
10 CTC in 2 mL of
blood (99%, 4)
Spiking of 10 to 300 cells
counted by dilution in 2 mL of
blood and regression analysis
4 mL [83]
Marker-based
enrichment/
detection
CellCollector® In vivo immunocapture
(Anti-EpCAM), IF
Gilupi,
Germany
not evaluated, in
vivo assay
not evaluated, in vivo assay 30 min, in
vivo
[84]
Marker-based
enrichment/
detection
Isoflux Density gradient (ficoll)
and Immunocapture
using magnetics beads
conjugated with anti-
EpCAM followed by IF,
molecular analysis
Fluxion
Biosciences,
USA
4 CTC in 7 mL of
blood (75%, 8)
Spiking of 4 to 200 fluorescent
cells counted by dilution in 7
mL of blood
7 mL [85]
Marker-based
enrichment/
detection
Biofluidica CTC
Detection System
Immunocapture using
anti-EpCAM antibody
followed by IF
Biofluidica,
USA
NA (90%, 1) Spiking of 500 fluorescent
cells counted by dilution in 7.5
mL of blood
7.5 mL [86]
Marker-based
enrichment/
detection
CytotrackTM No enrichment, IF, image
analysis
Cytotrack,
Denmark
5 CTC in 7.5 mL of
blood (68%, 3)
Spiking of 10 to 100 cells
counted by cell sorter in 7.5
mL of blood
7.5 mL [87]
Marker-based
enrichment/
detection
posCTC iChip Cell size (microfluidics)
with positive selection
with anti-EpCAM, IF,
RT-PCR, cytopathology,
culture
Toner/harber
lab, USA
10 cells in 10 mL
(91%, 2)
Spiking of 10, 200 or 1000
fluorescent cells (various cell
lines) in 1 mL of blood
variable,
up to 10
mL
[88,
89]
Marker-based
enrichment/
detection
Liquid Biopsy® Immunocapture using
surface markers (EpCaM,
CK. . .) followed by IF,
molecular analysis
Cynvenio
Biosystems,
USA
3 CTC per mL of
blood (74%, 6)
Spiking of 3 to 900 cells by
dilution in 1 mL of blood
8 mL [90]
Leucocyte
Depletion
anti-CD45
Dynabeads®Magnetics beads coated
with anti-CD45 antibody
with optional density
gradient separation,
followed by ICC-IF
Life
technologies,
USA
10 CTC in PBMC
from 15 mL of
blood (65%, 3)
Spiking of 10 to 1000 cells
counted by dilution in PBMC
variable,
up to 15
mL
[72]
Leucocyte
Depletion
RosetteSepTM Negative selection
(gradient and antibody
cocktail)
Stem Cell
Technologies,
Canada
NA (43%, 2) Spiking of 25 to 250 cells
counted by dilution in 4 mL of
blood
typically
20 mL
[91]
Leucocyte
depletion and
physical (size)
negCTC iChip Cell size (microfluidics)
with negative selection
with anti-CD45, followed
by IF, RT-PCR,
cytopathology, culture
Toner/harber
lab, USA
NA, (97%, 1) Spiking of 1000 fluorescent
cells (various cell lines) in 1
mL of blood
variable,
up to 10
mL
[88,
89]
Leucocyte
depletion and
physical (size)
CanpatrolTM Anti-CD45 dynabead,
filtration, followed by IF,
FISH, DNA mutation
analysis
SurExam Bio-
Tech, China
6 CTC in 5 mL of
blood (88%, 4)
Spiking of 10 to 200
fluorescent cells counted by
dilution in 5 mL of blood,
immunofluorescence and
FISH
5 mL [92]
(Continued )
Highly Sensitive Isolation and Analysis of Live and Fixed CTC by ISET®
PLOS ONE | DOI:10.1371/journal.pone.0169427 January 6, 2017 31 / 49
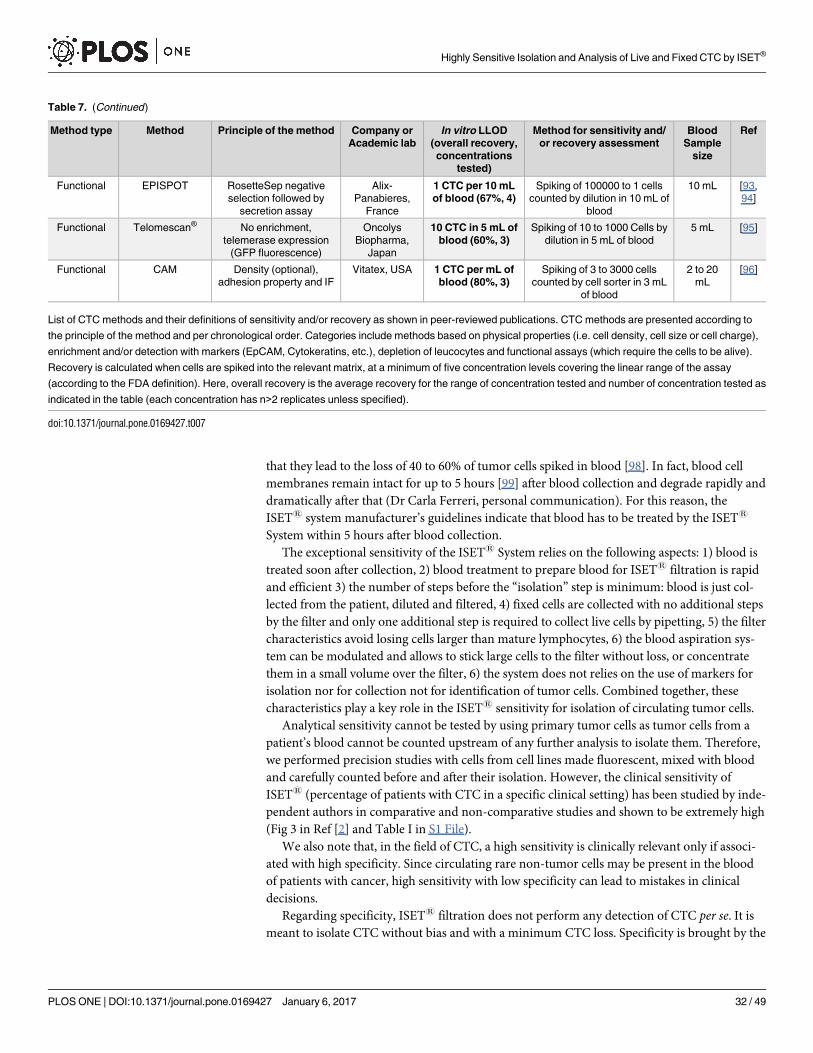
that they lead to the loss of 40 to 60% of tumor cells spiked in blood [98]. In fact, blood cell
membranes remain intact for up to 5 hours [99] after blood collection and degrade rapidly and
dramatically after that (Dr Carla Ferreri, personal communication). For this reason, the
ISET1 system manufacturer’s guidelines indicate that blood has to be treated by the ISET1
System within 5 hours after blood collection.
The exceptional sensitivity of the ISET1 System relies on the following aspects: 1) blood is
treated soon after collection, 2) blood treatment to prepare blood for ISET1 filtration is rapid
and efficient 3) the number of steps before the “isolation” step is minimum: blood is just col-
lected from the patient, diluted and filtered, 4) fixed cells are collected with no additional steps
by the filter and only one additional step is required to collect live cells by pipetting, 5) the filter
characteristics avoid losing cells larger than mature lymphocytes, 6) the blood aspiration sys-
tem can be modulated and allows to stick large cells to the filter without loss, or concentrate
them in a small volume over the filter, 6) the system does not relies on the use of markers for
isolation nor for collection not for identification of tumor cells. Combined together, these
characteristics play a key role in the ISET1 sensitivity for isolation of circulating tumor cells.
Analytical sensitivity cannot be tested by using primary tumor cells as tumor cells from a
patient’s blood cannot be counted upstream of any further analysis to isolate them. Therefore,
we performed precision studies with cells from cell lines made fluorescent, mixed with blood
and carefully counted before and after their isolation. However, the clinical sensitivity of
ISET1 (percentage of patients with CTC in a specific clinical setting) has been studied by inde-
pendent authors in comparative and non-comparative studies and shown to be extremely high
(Fig 3 in Ref [2] and Table I in S1 File).
We also note that, in the field of CTC, a high sensitivity is clinically relevant only if associ-
ated with high specificity. Since circulating rare non-tumor cells may be present in the blood
of patients with cancer, high sensitivity with low specificity can lead to mistakes in clinical
decisions.
Regarding specificity, ISET1 filtration does not perform any detection of CTC per se. It is
meant to isolate CTC without bias and with a minimum CTC loss. Specificity is brought by the
Table 7. (Continued)
Method type Method Principle of the method Company or
Academic lab
In vitro LLOD
(overall recovery,
concentrations
tested)
Method for sensitivity and/
or recovery assessment
Blood
Sample
size
Ref
Functional EPISPOT RosetteSep negative
selection followed by
secretion assay
Alix-
Panabieres,
France
1 CTC per 10 mL
of blood (67%, 4)
Spiking of 100000 to 1 cells
counted by dilution in 10 mL of
blood
10 mL [93,
94]
Functional Telomescan® No enrichment,
telemerase expression
(GFP fluorescence)
Oncolys
Biopharma,
Japan
10 CTC in 5 mL of
blood (60%, 3)
Spiking of 10 to 1000 Cells by
dilution in 5 mL of blood
5 mL [95]
Functional CAM Density (optional),
adhesion property and IF
Vitatex, USA 1 CTC per mL of
blood (80%, 3)
Spiking of 3 to 3000 cells
counted by cell sorter in 3 mL
of blood
2 to 20
mL
[96]
List of CTC methods and their definitions of sensitivity and/or recovery as shown in peer-reviewed publications. CTC methods are presented according to
the principle of the method and per chronological order. Categories include methods based on physical properties (i.e. cell density, cell size or cell charge),
enrichment and/or detection with markers (EpCAM, Cytokeratins, etc.), depletion of leucocytes and functional assays (which require the cells to be alive).
Recovery is calculated when cells are spiked into the relevant matrix, at a minimum of five concentration levels covering the linear range of the assay
(according to the FDA definition). Here, overall recovery is the average recovery for the range of concentration tested and number of concentration tested as
indicated in the table (each concentration has n>2 replicates unless specified).
doi:10.1371/journal.pone.0169427.t007
Highly Sensitive Isolation and Analysis of Live and Fixed CTC by ISET®
PLOS ONE | DOI:10.1371/journal.pone.0169427 January 6, 2017 32 / 49
subsequent step of cytopathology. Since tumor cells are isolated intact without damage, CTC
characterization is possible by a variety of downstream approaches (Fig 12). As reported and
recognized, cytopathology is the only clinically validated method to diagnose tumor cells [2].
Obtaining intact tumor cell morphology is a key factor for a reliable and diagnostic identifi-
cation and characterization of CTC. Our team, as well as other authors, have previously
emphasized the need of specific markers able to reliably identify the presence of tumor cells in
blood. Such markers are not known at present [2, 4, 13–15], and this leaves cytopathology as
the only diagnostic approach with regards of the presence of tumor cells in blood. In this set-
ting, it is noteworthy that several authors have found similar morphological and immunomor-
phological characteristics in CTC isolated by ISET1 and in tumor cells from the
correspondent tumor tissues [10, 12, 32, 103, 104]. Blood cytopathology is diagnostic “per se”
and can also be used to study circulating tumor cells after their isolation from blood and cul-
ture [105].
The hypothetical loss of small CTC by the indiscriminated filtration approach, mentioned
in various literature sources [7, 8, 12, 106, 107] has never been assessed in comparative studies
using different filtration approaches, nor clearly related to intact cells or to naked nuclei or cell
fragments. In fact, even tumor cells from Small Cell Lung Cancer (SCLC) have been detected
by ISET1 [11, 104, 108, 109]. These cells have a diameter ranging from 11.2 to 17.7 μm, i.e. 1.4
to 2.2 times larger than the 8 μm lymphocytes [110].
According to cytopathological criteria [16, 30, 111], cancer cells from patients are usually
larger than 16 microns. The presence in blood of intact cancer cells smaller than 8 microns, i.e.
smaller than mature lymphocytes, has never been diagnosed in patients [13], which comes in
support of using ISET1 to isolate all types of CTC from blood.
Hofman et al. have provided data supporting the key role of cytopathology to identify CTC.
They have published a blind multicenter study involving 10 cytopathologists and 808 cases
[16] demonstrating that the classical criteria used in standard cytopathology are valid to reli-
ably identify CTC when cells are isolated from blood using the ISET1 System. Hofman et al.showed that, under these conditions, blood cytopathology has the same advantages and the
same limitations as classical cytopathological analyses. In fact, cytopathology is not recom-
mended to diagnose cells from parathyroid and thyroid adenoma [16]. Overall, to this date,
475 healthy donor and 211 patients with benign disease have been tested by ISET1 setting the
in vivo specificity of ISET1 blood cytopathology at 98.3% (Summarized in Table G in S1 File).
The need for specificity in detection of CTC has prompted us to introduce the term “Circu-
lating Cancer Cells” (CCC) [2] referring to tumor cells isolated from blood without loss and
without antibody related bias and diagnostically identified by cytopathology. Such cancer cells
are expected to be of clinical interest [2, 4] as shown by independent clinical studies using
ISET1 [3, 17, 18, 22, 24, 26, 35, 103, 111–115] (Reviewed in Table H in S1 File).
Cancer cells isolated by ISET1 have been studied across various cancer types and stages, as
well as in patients at risk of developing cancer [10–12, 16–27, 29–32, 35, 97, 103, 104, 108,
111–119] (Reviewed in Table I in S1 File). The global number of CCC and CCM has been
reported to be higher in patients with advanced disease. For instance, for patients with
NSCLC, Krebs et al. reported the following median number of CCC per 10 mL: 5.3 in Stage
IIIA patients (n = 5), 11.3 in Stage IIIB patients (n = 12) and 50.7 in Stage IV patients (n = 23)
[12] (Table I in S1 File).
The detection of CCC by ISET1 has been proven by independent teams and studies to have
a prognostic value in follow-up prospective studies, in particular in patients with localized
lung cancer, liver cancer and uveal melanoma [24, 35, 112] (Table H in S1 File).
Although larger trials are needed, the above mentioned results are consistent with animal
studies which have shown that the risk of developing metastases correlates directly with the
Highly Sensitive Isolation and Analysis of Live and Fixed CTC by ISET®
PLOS ONE | DOI:10.1371/journal.pone.0169427 January 6, 2017 33 / 49
number of cancer cells in blood and that a higher risk is associated with the presence of CTM
[120–123].
Hofman’s team also brought a conclusive demonstration that the ISET1 blood cytopathol-
ogy is diagnostic for reliable identification of cancer cells in blood. They showed, in an indepen-
dent and prospective study, the ability of this assay to detect “sentinel tumor cells” in patients at
risk of developing lung cancer years before the detection of the tumor nodule by CT-scan, thus
demonstrating a new way for invasive cancers’ early diagnosis and treatment [3].
Early diffusion of tumor cells in blood was first observed in animal models [1, 124, 125]. On
average, about one out of 1000 cancer cells from the tumor mass is thought to be able to invade
the blood compartment [126]. This data is consistent with earlier work using animal models of
fibrosarcoma and breast cancer [127, 128]. If we take this value as a reference, a tumor contain-
ing 500 000 cells with a size of about 0.5 mm in diameter (~0.5 mg of tumor [129]) would
spread 500 cancer cells into the 5 liters of human blood. Such a small tumor could therefore be
detected by the ISET1 system which LLOD is 1 tumor cell per 10 mL of blood. Even if these
calculations are an estimate and individual cancers have different invasion capabilities, they
provide a reference value consistent with the possible detection of tumor cells before an inva-
sive tumor reaches the size of a few mm in diameter which makes it detectable by imaging. At
this stage, it could spread around 4000 tumor cells in blood, equivalent to 8 tumor cells per 10
mL of blood.
However, we do not expect that tumor cells’ spreading is continuous and constant through-
out the day. As it frequently happens with biological phenomenon, spreading could be variable
according to other biological factors such as, for instance, waves of angiogenesis and blood
flow. Consistent with this view are preliminary in vivo data related to myeloma cells [130] and
fetal cells showing circadian rhythms of circulation as well as increased cells’ circulation after
physical exercise [131]. Although such aspects have not been thoroughly explored yet, they
raise the important issue of the best-standardized way to collect blood for the maximum CTC
detection and enumeration.
We have reported a new protocol allowing collection of plasma without any loss of intact
tumor cells (Fig 1B, Table 4 and S1D Fig). By using this protocol we avoid wasting blood
obtained from ill patients. The collection of plasma is useful to detect cell-free DNA, cell-free
RNA and exosomes as complementary investigations in cancer patients. While only CTC
detection can provide information about the invasive cancer potential, the study of plasma
markers may add interesting complementary information [132]. A recent study has compared
the presence of tumor cells detected by ISET1 and methylated RASSF1A cfDNA in 68 match-
ing blood samples from controls and patients with melanoma, allowing to discriminate mela-
noma patients from controls. However, 7 out of the 68 healthy controls (10%) were scored
positive for the presence of methylated cfDNA in plasma, highlighting the challenge to find
specific genetic markers for cfDNA analyses [119].
Cancer cells isolated from blood without antibody-related bias can be further characterized,
in a second line of investigation, using immune-molecular approaches (Figs 7, 9 and 12). In
this perspective, ISET1 allows performing multiplexing tests. In fact, Krebs et al. [12] have
reported that enumeration of tumor cells on 4 ISET1 spots (corresponding to the filtration of
4 mL of blood) is as reliable as enumerating them on 10 spots (corresponding to the filtration
of 10 mL of blood). Our data further validate this finding with intra-assay precision and accu-
racy below the 15% cutoff when enumerating tumor cells on four spots (Fig 5), showing that
it is possible to count tumor cells by ISET1 on 4 spots leaving the other 6 spots for CTC
immune-molecular characterization. This approach has been demonstrated to be valid for
numbers of CTC ranging from 6 to 14 per mL of blood, by our results (Fig 5 and S2 Fig) and
for number of CTC ranging from 11 to 26 per mL of blood by Krebs et al. [12].
Highly Sensitive Isolation and Analysis of Live and Fixed CTC by ISET®
PLOS ONE | DOI:10.1371/journal.pone.0169427 January 6, 2017 34 / 49
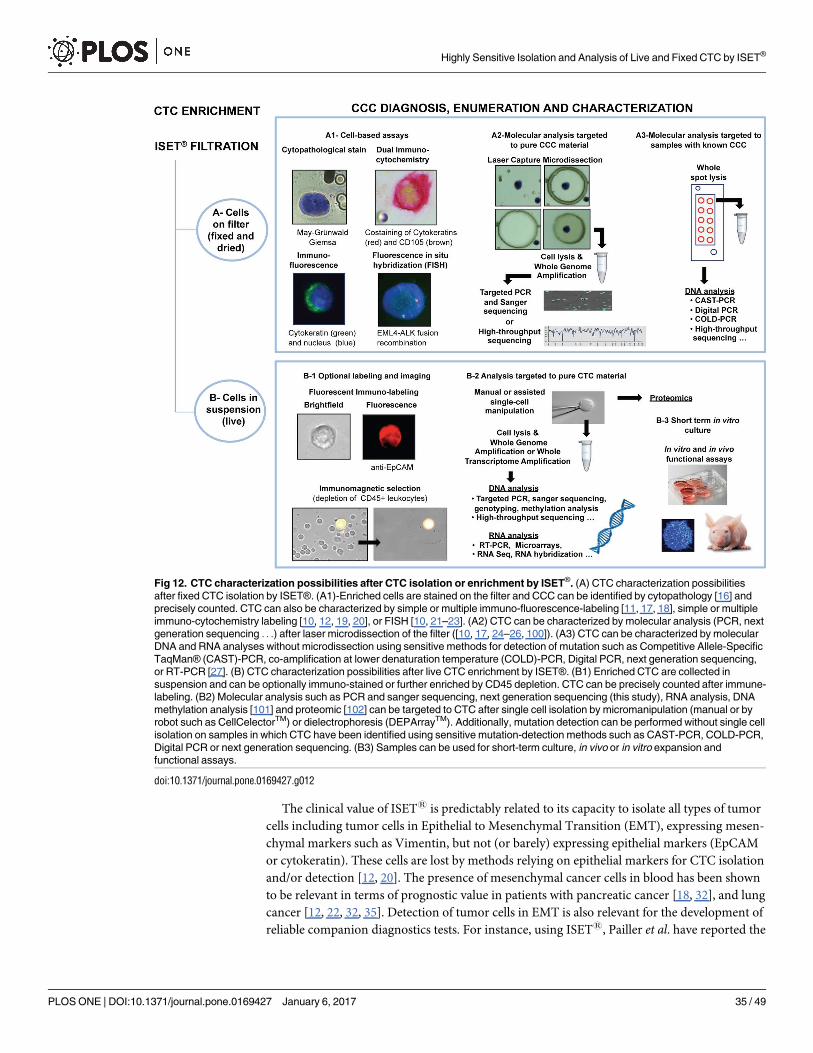
The clinical value of ISET1 is predictably related to its capacity to isolate all types of tumor
cells including tumor cells in Epithelial to Mesenchymal Transition (EMT), expressing mesen-
chymal markers such as Vimentin, but not (or barely) expressing epithelial markers (EpCAM
or cytokeratin). These cells are lost by methods relying on epithelial markers for CTC isolation
and/or detection [12, 20]. The presence of mesenchymal cancer cells in blood has been shown
to be relevant in terms of prognostic value in patients with pancreatic cancer [18, 32], and lung
cancer [12, 22, 32, 35]. Detection of tumor cells in EMT is also relevant for the development of
reliable companion diagnostics tests. For instance, using ISET1, Pailler et al. have reported the
Fig 12. CTC characterization possibilities after CTC isolation or enrichment by ISET®. (A) CTC characterization possibilities
after fixed CTC isolation by ISET®. (A1)-Enriched cells are stained on the filter and CCC can be identified by cytopathology [16] and
precisely counted. CTC can also be characterized by simple or multiple immuno-fluorescence-labeling [11, 17, 18], simple or multiple
immuno-cytochemistry labeling [10, 12, 19, 20], or FISH [10, 21–23]. (A2) CTC can be characterized by molecular analysis (PCR, next
generation sequencing . . .) after laser microdissection of the filter ([10, 17, 24–26, 100]). (A3) CTC can be characterized by molecular
DNA and RNA analyses without microdissection using sensitive methods for detection of mutation such as Competitive Allele-Specific
TaqMan® (CAST)-PCR, co-amplification at lower denaturation temperature (COLD)-PCR, Digital PCR, next generation sequencing,
or RT-PCR [27]. (B) CTC characterization possibilities after live CTC enrichment by ISET®. (B1) Enriched CTC are collected in
suspension and can be optionally immuno-stained or further enriched by CD45 depletion. CTC can be precisely counted after immune-
labeling. (B2) Molecular analysis such as PCR and sanger sequencing, next generation sequencing (this study), RNA analysis, DNA
methylation analysis [101] and proteomic [102] can be targeted to CTC after single cell isolation by micromanipulation (manual or by
robot such as CellCelectorTM) or dielectrophoresis (DEPArrayTM). Additionally, mutation detection can be performed without single cell
isolation on samples in which CTC have been identified using sensitive mutation-detection methods such as CAST-PCR, COLD-PCR,
Digital PCR or next generation sequencing. (B3) Samples can be used for short-term culture, in vivo or in vitro expansion and
functional assays.
doi:10.1371/journal.pone.0169427.g012
Highly Sensitive Isolation and Analysis of Live and Fixed CTC by ISET®
PLOS ONE | DOI:10.1371/journal.pone.0169427 January 6, 2017 35 / 49
presence of a recurrent ALK-rearrangement in CTC which also expressed mesenchymal mark-
ers, consistently with a clonal tumor cells’ selection [22]. Independent studies have reported
the interest of ISET1 for in situ detection of several theranostic biomarkers including ALK
recombination, ROS1 recombination, KRAS mutations, BRAF V600E mutation and HER2
amplification [19, 21–23, 25, 26].
To facilitate further fundamental studies, we have determined that ISET1 can isolate cancer
cells from mice blood (Fig 3, Table 3 and S6 Fig). The study of animal and human CTC with
the same tool (independently from potential antibody related bias and issues of species’ cross
reactivity) should foster studies in animals in particular for early detection of invasive cancers.
ISET1 has also been used to isolate tumor cells from rats [133], monkeys and pigs (unpub-
lished data).
Fundamental studies need live circulating tumor cells. They are required in particular for
culture-based assays allowing drug sensitivity tests and further molecular investigations.
We developed a new protocol to enrich live tumor cells from blood without immune-
related bias (Fig 1C) using a dedicated Rarecells1 live buffer and using the Rarecells1 device
and cartridge in a different way. We show that it allows a recovery rate of 80 to 100% of tumor
cells and a sensitivity threshold (LLOD) of 1 tumor cells per mL of blood in spiking tests using
individually captured single cells (Fig 2B and Table 5). Our results demonstrate that this new
protocol for isolation from blood of live tumor cells does not induce a cell-size related bias of
selection, including for the smallest cells we tested (MMTV-PyMT, Fig 6).
Biomechanics of the cytoskeleton might affect the performance of the method when using
unfixed samples. Articles in the literature indicate that non-malignant tumor cell lines are stif-
fer in comparison to malignant tumor cell lines (and also less prone to migration and invasion)
[43, 134]. Studies with cells obtained from patients’ ascites (ovarian cancer) or derived from
oral squamous carcinoma have shown that cancer cells from a given tumor cells’ population
exhibit a varying degree of stiffness, which is similar to the stiffness of cancer cell lines [135,
136]. In addition, stiffness is also correlated to the EMT status of cells: the stiffest/least invasive
cell lines expressed more E-Cadherin and less Vimentin, while the compliant/most invasive
cell lines expressed less E-Cadherin and more Vimentin [136]. In our tests with live cells, we
used both cell lines with epithelial phenotype (LNCaP) and mesenchymal phenotype (A549,
H2228, MMTV-PyMT) (details of markers expressed by LNCaP, H2228 and A549 according
to the database of DSMZ (Deutsche Sammlung von Mikroorganismen und Zellkulturen) and
by MMTV-PyMT according to [137]). Furthermore, our results obtained using quantitative
fluorescence analyses show that the level of EpCAM expression of MCF-7 tumor cells is similar
before and after their live cell enrichment by ISET1 (Fig 7).
In this report, we have also shown that live A549 tumor cells isolated from blood using
ISET1 can be cultured and expanded in vitro for at least 5 days (Fig 8), demonstrating that the
buffer and protocol used to isolate live tumor cells from blood allows their growth. Interest-
ingly, we noticed that no leucocytes remained alive after 3 days of culture.
In addition, we have assessed cytoskeleton markers by confocal analysis of F-actin and acet-
ylated α-tubulin (Fig 9) after live tumor cells isolation and culture for 72h. These markers are
known to be therapeutic targets [138, 139]. The microscopy assay we used has been shown to
directly correlate with Atomic Force Microscopy, a cell stiffness assay [140]. We have com-
pared the profiles of two cell lines, A549 and H2228. Distribution of F-actin and acetyl-α-tubu-
lin were found to be conserved (or restored) after 72h of in vitro culture following live tumor
cells isolation using the ISET1 system.
Furthermore, in the aim of studying theranostic mutations to guide the therapeutic choices,
we have demonstrated that, in our model, the basic profile of mutations, assessed with the Hot-
spot Cancer Panel V2 (Thermofisher, USA) does not change after isolation by ISET1 of tumor
Highly Sensitive Isolation and Analysis of Live and Fixed CTC by ISET®
PLOS ONE | DOI:10.1371/journal.pone.0169427 January 6, 2017 36 / 49
cells from blood and their growth in culture (Fig 10, S3 Fig and Table D in S1 File) for 72
hours. This new data may stimulate similar important analyses performed on CTC from can-
cer patients.
Taken together, these data suggest that the new ISET1 protocol to isolate live tumor cells
does not modify the cell phenotype and genotype. Consistently, tumor cells viability after their
isolation from blood remained very high (>85%) (Fig 6 and Table C in S1 File).
Since the first report of successful CTC-derived xenografts (CDX) in 2000 [141], several
research publications have focused on the ex vivo propagation of CTC via short-term in vitroculture [64, 142, 143], direct injection into immuno-compromised mice [109, 144, 145] or
long-term 3D culture by establishment of prostate and colorectal cancer cell lines derived from
CTC [142, 146]. However, long-term in vitro culture of CTC remains a technical challenge in
the field, with a generally very low percentage of successful growth. Further knowledge about
culture conditions is required to obtain in vitro growth of heterogeneous and very rare CTC
populations. However the first requirement in this aim is the possibility to extract tumor cells
from blood without selection bias, keeping their phenotype, genotype viability and growth
capabilities potentially unaffected.
The new protocol we have developed for isolation of live tumor cells from blood is highly
sensitive, rapid, direct and does not alter their biological characteristics, thus it should help fur-
ther studies focused on CTC’ ex vivo expansion and analysis.
Until now ex vivo culture of CTC has been achieved using samples from patients having
several hundreds of CTC per 7.5 mL of blood. The success rates of CTC expansion in culture
remains low [143, 146, 147] across various isolation methods and culture conditions. CTC
from patients with SCLC and NSCLC were successfully implanted into nude mice, creating
CTC-derived Xerograph (CDX) for subsequent in vivo drug testing [17, 109]. Some data
indicate that CTC which are competent for metastasis and able to proliferate in culture are
undifferentiated and EpCAM-negative [17, 147]. The excellent sensitivity of the antibody-
independent ISET1 live CTC isolation protocol (Table 5) and the proof that it allows tumor
cell growth in culture (Figs 8 and 9) should help culture assays for fundamental CTC studies
and ex vivo drug testing (Fig 12).
Very low numbers of live tumor cells can be isolated from blood by ISET1 practically with-
out loss and with a limited contamination of leukocytes. The number of residual leukocytes,
when ISET1 is performed with classical filters with pores of 8-micron nominal size, is variable
from few hundreds to more than 1000. We did not report results in term of “purity” (defined
as the number of target cells divided by the total number of remaining cells) since such calcula-
tion is misleading given the variable number of CTC detected in vivo (Table I in S1 File) and of
tumor cells spiked in blood for in vitro sensitivity tests.
Of note, the elimination of leukocytes can be increased by using filters having different
parameters, including the pore size, and suitable for maximum elimination of leukocytes while
retaining large tumor cells and tumor microemboli.
In order to reduce the number of contaminating leukocytes, we have further developed a
protocol using CD45-coated magnetic beads, which was proven to achieve a complete elimina-
tion of leukocytes. As a drawback, adding the CD45 selection leads to loss of 50 to 60% of the
spiked tumor cells (Table 6). However, given the very high sensitivity of CTC enrichment
obtained by ISET1 before CD45-depletion, the new protocol remains an interesting option to
collect live CTC not contaminated by leukocytes and without antibody-related bias for further
RNA, DNA and protein studies and for culture assays (Fig 12).
Single cancer cells capture by their microdissection from the filter has been proven to allow
targeted mutation analyses [10, 24, 25]. The new ISET1 protocols to enrich live or fixed CTC
from blood without sticking them to the filter provide new possibilities for extensive single
Highly Sensitive Isolation and Analysis of Live and Fixed CTC by ISET®
PLOS ONE | DOI:10.1371/journal.pone.0169427 January 6, 2017 37 / 49
tumor cells RNA and DNA molecular studies while avoiding microdissection (Figs 10 and 12).
Individual CTC can be simply captured manually after enrichment from blood by micropipet-
ting or by using current commercial approaches (such as CellCelectorTM or DEPArrayTM or
others).
Cancer cells’ genetic heterogeneity is increasingly investigated at single cell resolution in tis-
sues [148, 149]. Some studies have reported copy number variation by NGS analysis on single
CTC identified by CellSearchTM [109, 150–153], MagSweeper [154] or Epic Sciences [155] but,
with these approaches, CTC heterogeneity is predictably underestimated by the EpCAM-
related selection bias. An optimized workflow for molecular characterization of individual
CTC, which are sensitively isolated from blood without antibody related bias, is expected to be
an attractive tool.
We reported here an optimized workflow including: 1) highly sensitive isolation of live
CTC from blood without bias, 2) capture of individual CTC, 3) single cell whole genome
amplification, 4) efficient high throughput sequencing using a multi-gene panel analysis with
the Ion TorrentTM approach.
Our results show the feasibility of applying the AmpliSeq hotspot cancer panel V2 on Ion
TorrentTM to both live cells and fixed cells enriched from blood by ISET1 and recovered in
suspension, assessing mutations on a variety of oncogenes including KRAS (Fig 11 and S5
Fig). The study of 3 individual tumor cells allowed the detection of mutations with the same
allele frequency detected in the parent cell line (Fig 11B and 11C). To our knowledge these are
the first results obtained by NGS analysis on CTC sensitively isolated from blood without bias
related to the use of antibodies. The protocol should help discovering theranostic mutations in
CTC spread at the early steps of tumor invasion.
Overall, our results demonstrate that ISET1 is an open platform which allows a highly sen-
sitive and unbiased isolation from blood of fixed tumor cells for reliable identification and
immune-molecular study, and of live tumor cells for culture and immune-molecular analyses.
We have used cells from cell lines as a model of technical approach with potential to be applied
to clinical blood samples. These technical improvements should foster studies targeting circu-
lating cancer cells’ detection and characterization, in particular at the early steps of tumor
invasion.
Supporting Information
S1 Fig. Additional analytical performance data. (A) Recovery experiments with dilutions of
HeLa and MCF-7 cells. Mean in % of recovered HeLa and MCF-7 cells observed on ISET1 fil-
ter. 50 or 100 HeLa cells were added into 1 mL whole blood after counting by dilution. 50
MCF-7 were added to 5 mL of whole blood after counting by dilution. (B) Linearity experi-
ment reported by Chinen et al. 2014. 25, 50, 100 and 150 HT1080 cells (counted by dilution)
were added to 1 blood before processing by ISET1 (in triplicates). (C) In vitro sensitivity
experiments reported by Krebs et al. 2012 and De Giorgi et al. 2010. 1 SK-MEL-28 cell isolated
by micropipetting was added to 1 mL of blood before processing by ISET1 (n = 9 tests). 1, 10
and 50 NCI-H1299 cells isolated by micropipetting were added to 1 mL of blood before pro-
cessing by ISET1 (in triplicates). (D) Fixed tumor cell isolated in sensitivity test after collection
of plasma. Recovered cell (A and B) stained with Cell TrackerTM Orange and observed with
the TRITC microscopic filter (A: 20X objective, Scale bar: 4 μm, B: Scale bar: 8 μm) (C)
observed with bright field filter, (D) observed with bright field filter after a MGG staining.
(TIFF)
S2 Fig. Assessment of ISET1 intra-assay accuracy and precision with dilutions of MCF-7.
About 50 MCF-7 were spiked into 5 mL of blood (n = 5 experiments, 29 to 70 cells per 5 mL).
Highly Sensitive Isolation and Analysis of Live and Fixed CTC by ISET®
PLOS ONE | DOI:10.1371/journal.pone.0169427 January 6, 2017 38 / 49
Cell counting were performed without careful recounting. The number of tumor cells found
on each spot after ISET1 filtration (each corresponding to the filtration of 1 mL of blood) was
recorded. Experiments were done on 5 spots but for intra-assay precision and accuracy only
assessment of the comparison of combinations of 1, 2, 3 and 4 spots are relevant. The only
combination with the 5 spots was the reference. Four spots exhibited a representative mean
tumor cells value. (A) Bar chart with the mean tumor cell number per spot and corresponding
standard error of the mean (error bars) depending on the number of spots analyzed. Error
bars (which correspond to the Standard Error, i.e. standard deviation divided by the squared
root of the number of combinations) are calculated using the standard deviation of different
combinations of 4 spots, 3 spots, 2 spots or 1 spot. If only one spot is considered, standard
deviation is higher than when counting 4 spots. Thus error bars indicate the increased preci-
sion and accuracy when tumor cells are counted on 4 spots as compared to 3, 2 and one spot.
(B) Table indicating the number of tumor cells found on each spot for each of the five experi-
ments, the 95% confidence interval (CI), the precision and the accuracy depending on the
number of spots analyzed (1 to 4) as compared to the analysis on five spots.
(TIFF)
S3 Fig. Ion TorrentTM sequencing quality control parameters of A549 and HCT116 popu-
lations before and after live cell ISET1 enrichment. (A) Total number of reads, reads on tar-
get, low coverage regions, coverage and coverage heterogeneity for each of the 4 bulk DNA
samples. (B) Sequencing depth determination (percentage of target region coverage) for each
of the 4 bulk DNA samples.
(TIFF)
S4 Fig. Ion TorrentTM sequencing quality control parameters of bulk extracted DNA and
WGA DNA from single cell enriched from blood using ISET1. (A) Amplicon mapping and
sequencing depth uniformity across whole genome amplified single cells and bulk amplified
and unamplified DNA controls. (B) Overview coverage plots of sequencing reads obtained
from: (B1) whole genome amplified DNA from a single live A549 cell, (B2) whole genome
amplified DNA from a single fixed A549 cell, (B3) whole genome amplified from bulk A549
extracted DNA, (B4) control unamplified bulk A549 DNA and (B5) control unamplified bulk
DNA extracted from healthy donor blood. (C) Average amplicon coverage on pooled data
from whole genome amplified single cells and bulk whole genome amplified and unamplified
DNA controls.
(TIFF)
S5 Fig. Mutant KRAS G12S allele frequency by Ion TorrentTM in single cells enriched from
blood using ISET1. Mutant KRAS G12S allele frequency was determined by high throughput
sequencing of whole genome amplified single A549 cells, both live and fixed, as well as bulk
whole genome amplified (WGA) and unamplified (bulk) DNA controls extracted from A549
tumor cells.
(TIFF)
S6 Fig. Isolation of cancer cells from mouse blood. Clusters of cells with malignant features
observed in the blood of two MMTV-PyMT mice. Scale bar 8 microns. Mouse blood (200 μL,
kind gift of Dr. S. Humbert-Institut Curie, France) was collected, using a 2 mL syringe prefilled
with 8 mg of sterile K3EDTA, from two 14-week old MMTV-PyMT mice under anesthesia by
retro-orbital puncture, according to the local ethics rules, transferred to a microcentrifuge
tube and kept under gentle agitation before its treatment by ISET1 within 3 hours after collec-
tion. ISET1 was performed by diluting mouse blood 1 to 10 with the buffer and filtering it
using the standard protocol in one small compartment of the Rarecells1 Block. Up to 10
Highly Sensitive Isolation and Analysis of Live and Fixed CTC by ISET®
PLOS ONE | DOI:10.1371/journal.pone.0169427 January 6, 2017 39 / 49
different mice samples can be processed with the same cartridge.
(TIFF)
S1 File. Supplemental text and all supplemental tables. Table A in S1 File: Cell size (in
microns) on ISET1 filters of various cell lines. Cells from human and mouse tumor cell lines
were incubated 3 min with the buffer without blood and collected on standard (8 micron-
pore) filters. MMTV-PyMT�: values measured for MMTV-PyMT cells isolated using 5
micron-pore filters. Table B in S1 File: Percentage of cell Recovery of the ISET1 platform and
Precision and Accuracy of spiking tests. A549, MCF-7, MMTV-PyMT and HeLa cells were
counted by micromanipulation (for tests with 1 to 3 cells) or dilution (for tests with 30 to 300
cells) and spiked into 1 to 10 mL of blood as indicated. Precision and Accuracy among all
these independent tests were calculated as described in the methods. Precision is assessed via
calculation of percent coefficient of variation (%CV) that is equal to 0% when data are perfectly
precise. Accuracy estimated via %Error that is equal to 0% when data are perfectly accurate.
Table C in S1 File: Cell size and viability measurement before and after ISET1 filtration of live
cells. Cells from human and mouse tumor cell lines were incubated 3 min with the Live Buffer
without blood and collected on standard (8 micron-pore) filters. Table D in S1 File: Variant
list and allele frequency measured by Ion Torrent in cell populations. Cat = Sophia DDM cate-
gory of pathogenicity, Chrs = chromosome, var_% = percentage of variant. Table E in S1 File:
Non-sense COSMIC mutant allele coverage, amplicon coverage and allele frequency measured
by Ion TorrentTM in WGA-amplified single cells enriched from blood by ISET1. Table F in S1
File: Main parameters and sensitivity of CTC filtration methods. �1 Overall recovery = average
recovery for the range of concentration tested, number of concentration tested (n>2 replicates
for each concentration unless specified). �2 elimination of red blood cells by centrifugation.
Notes: methods that use Ficoll or equivalent prior to filtration or without any peer reviewed
publication are not included in this table. form. = formaldehyde. NA = not available. Table G
in S1 File: CCC detection by ISET1 in the blood of healthy donors and patients with benign
diseases. Table H in S1 File: Studies reporting prognostic value of CCC/CCM detected by
ISET1 and ISET1 longitudinal follow-up studies. CNHC: circulating non-hematological
cells include cells with benign, uncertain and malignant features. Overall Survival (OS) is
defined by the NIH-NCO as the percentage of patient in a study or treatment group who are
still alive for a certain period of time after they were diagnosed with or started treatment for a
disease, such as cancer. Progression-free survival (PFS) is defined by the NIH-NCO as length
of time during and after the treatment of a disease, such as cancer, that a patient lives with the
disease but it does not get worse. Disease-free survival (DFS) is defined by the NIH-NCO as
the length of time after primary treatment for a cancer that the patient survives without any
signs or symptoms of that cancer. Hazard ratio (HR) is defined by the NIH-NCO as, a measure
of how often a particular event happens in one group compared to how often it happens in
another group, over time. A hazard ratio of one means that there is no difference in survival
between the two groups. A hazard ratio of greater than one or less than one means that survival
was better in one of the groups. Prognostic biomarker: biomarker that can be used to estimate
the chance of recovery from a disease or the chance of the disease recurring. Predictive bio-
marker: biomarker that can be used to help predict whether a person’s cancer will respond to a
specific treatment. Predictive factor may also describe something that increases a person’s risk
of developing a condition or disease. Table I in S1 File: CCC/CCM detected by ISET1 in the
blood of cancer patients. HCC: hepatocellular carcinoma, BC: breast cancer, PrC: prostate can-
cer, PaC: pancreatic cancer, NSCLC: Non-Small Cell Lung Cancer, SCLC: Small Cell Lung
cancer, CC: Colorectal cancer, KC: Kidney cancer, HNC: Head and Neck carcinoma, Esoph-
ageal carcinoma: EC, Pleural Mesothelioma: PM, Sarcoma: Sarc, UM: uveal melanoma, CM:
Highly Sensitive Isolation and Analysis of Live and Fixed CTC by ISET®
PLOS ONE | DOI:10.1371/journal.pone.0169427 January 6, 2017 40 / 49
cutaneous melanoma, M0: localized, M1: metastatic, na: not available, ‡ if several blood sam-
pling time points are reported, number of patients with CCCs/CCMs and CCC/CTMs number
are only indicated for the baseline time point, � if average CCC and CCM numbers are not
available, the median or range are provided as indicated in the table. Usually the mean is calcu-
lated over the whole population of patients (including patients without CCCs), unless specified
otherwise in the table.
(DOCX)
Acknowledgments
The authors greatly acknowledge INSERM (Institut National de Sante et Recherche Medicale),
University Paris Descartes and Fondation Lefort-Beaumont de l’Institut de France for their
support and the INEM (Institut Necker Enfants Malades) Imaging Facility. We thank Emilie
Dugon, Astrid Girard, Karine Prevost, Davide Brechot and Igor Stzepourginski for their assis-
tance. We thank Gabriela Petkova Campbell for help in reviewing the text.
Author Contributions
Conceptualization: SL PPB.
Data curation: SL KH LB.
Formal analysis: SL LB FBM PPB.
Funding acquisition: PPB LF SJ.
Investigation: SL KH LB TC DMD SJ MO.
Methodology: SL KH LB FBM TC DMD MO LF SJ PPB.
Project administration: SL PPB.
Resources: SL PPB LF DMD.
Supervision: SL PPB.
Validation: SL KH LB FBM TC DMD MO LF SJ PPB.
Visualization: SL KH LB FBM TC DMD MO LF SJ PPB.
Writing – original draft: SL PPB.
Writing – review & editing: SL KH LB FBM TC DMD MO LF SJ PPB.
References1. Rhim AD, Mirek ET, Aiello NM, Maitra A, Bailey JM, McAllister F, et al. EMT and dissemination pre-
cede pancreatic tumor formation. Cell. 2012; 148(1–2):349–61. doi: 10.1016/j.cell.2011.11.025 PMID:
22265420
2. Paterlini-Brechot P. Circulating Tumor Cells: Who is the Killer? Cancer Microenviron. 2014; 7(3):161–
76. doi: 10.1007/s12307-014-0164-4 PMID: 25527469
3. Ilie M, Hofman V, Long-Mira E, Selva E, Vignaud JM, Padovani B, et al. "Sentinel" circulating tumor
cells allow early diagnosis of lung cancer in patients with chronic obstructive pulmonary disease. PLoS
One. 2014; 9(10):e111597. doi: 10.1371/journal.pone.0111597 PMID: 25360587
4. Paterlini-Brechot P, Benali NL. Circulating tumor cells (CTC) detection: clinical impact and future direc-
tions. Cancer Lett. 2007; 253(2):180–204. doi: 10.1016/j.canlet.2006.12.014 PMID: 17314005
Highly Sensitive Isolation and Analysis of Live and Fixed CTC by ISET®
PLOS ONE | DOI:10.1371/journal.pone.0169427 January 6, 2017 41 / 49
5. Parkinson DR, Dracopoli N, Petty BG, Compton C, Cristofanilli M, Deisseroth A, et al. Considerations
in the development of circulating tumor cell technology for clinical use. J Transl Med. 2012; 10:138.
doi: 10.1186/1479-5876-10-138 PMID: 22747748
6. Krebs MG, Metcalf RL, Carter L, Brady G, Blackhall FH, Dive C. Molecular analysis of circulating
tumour cells-biology and biomarkers. Nat Rev Clin Oncol. 2014; 11(3):129–44. doi: 10.1038/nrclinonc.
2013.253 PMID: 24445517
7. Ignatiadis M, Lee M, Jeffrey SS. Circulating Tumor Cells and Circulating Tumor DNA: Challenges and
Opportunities on the Path to Clinical Utility. Clin Cancer Res. 2015; 21(21):4786–800. doi: 10.1158/
1078-0432.CCR-14-1190 PMID: 26527805
8. Alix-Panabieres C, Pantel K. Technologies for detection of circulating tumor cells: facts and vision. Lab
Chip. 2014; 14(1):57–62. doi: 10.1039/c3lc50644d PMID: 24145967
9. Ferreira MM, Ramani VC, Jeffrey SS. Circulating tumor cell technologies. Mol Oncol. 2016; 10
(3):374–94. doi: 10.1016/j.molonc.2016.01.007 PMID: 26897752
10. Vona G, Sabile A, Louha M, Sitruk V, Romana S, Schutze K, et al. Isolation by size of epithelial tumor
cells: a new method for the immunomorphological and molecular characterization of circulatingtumor
cells. Am J Pathol. 2000; 156(1):57–63. doi: 10.1016/S0002-9440(10)64706-2 PMID: 10623654
11. Lecharpentier A, Vielh P, Perez-Moreno P, Planchard D, Soria JC, Farace F. Detection of circulating
tumour cells with a hybrid (epithelial/mesenchymal) phenotype in patients with metastatic non-small
cell lung cancer. Br J Cancer. 2011; 105(9):1338–41. doi: 10.1038/bjc.2011.405 PMID: 21970878
12. Krebs MG, Hou JM, Sloane R, Lancashire L, Priest L, Nonaka D, et al. Analysis of circulating tumor
cells in patients with non-small cell lung cancer using epithelial marker-dependent and -independent
approaches. J Thorac Oncol. 2012; 7(2):306–15. doi: 10.1097/JTO.0b013e31823c5c16 PMID:
22173704
13. Hofman V, Ilie M, Long E, Guibert N, Selva E, Washetine K, et al. Detection of circulating tumor cells
from lung cancer patients in the era of targeted therapy: promises, drawbacks and pitfalls. Curr Mol
Med. 2014; 14(4):440–56. PMID: 24730524
14. Alix-Panabieres C, Pantel K. Challenges in circulating tumour cell research. Nat Rev Cancer. 2014; 14
(9):623–31. doi: 10.1038/nrc3820 PMID: 25154812
15. Pantel K, Deneve E, Nocca D, Coffy A, Vendrell JP, Maudelonde T, et al. Circulating epithelial cells in
patients with benign colon diseases. Clin Chem. 2012; 58(5):936–40. doi: 10.1373/clinchem.2011.
175570 PMID: 22205690
16. Hofman VJ, Ilie MI, Bonnetaud C, Selva E, Long E, Molina T, et al. Cytopathologic detection of circulat-
ing tumor cells using the isolation by size of epithelial tumor cell method: promises and pitfalls. Am J
Clin Pathol. 2011; 135(1):146–56. doi: 10.1309/AJCP9X8OZBEIQVVI PMID: 21173137
17. Morrow CJ, Trapani F, Metcalf RL, Bertolini G, Hodgkinson CL, Khandelwal G, et al. Tumourigenic
Non-Small Cell Lung Cancer Mesenchymal Circulating Tumour Cells—A Clinical Case Study. Ann
Oncol. 2016.
18. Poruk KE, Valero V 3rd, Saunders T, Blackford AL, Griffin JF, Poling J, et al. Circulating Tumor Cell
Phenotype Predicts Recurrence and Survival in Pancreatic Adenocarcinoma. Ann Surg. 2016.
19. Hofman V, Ilie M, Long-Mira E, Giacchero D, Butori C, Dadone B, et al. Usefulness of immunocyto-
chemistry for the detection of the BRAF(V600E) mutation in circulating tumor cells from metastatic
melanoma patients. J Invest Dermatol. 2013; 133(5):1378–81. doi: 10.1038/jid.2012.485 PMID:
23303445
20. Hofman V, Ilie MI, Long E, Selva E, Bonnetaud C, Molina T, et al. Detection of circulating tumor cells
as a prognostic factor in patients undergoing radical surgery for non-small cell lung carcinoma: Com-
parison of the efficacy of the CellSearch Assay and the isolation by size of epithelial tumor cell method.
Int J Cancer. 2011; 2011.
21. Ilie M, Long E, Butori C, Hofman V, Coelle C, Mauro V, et al. ALK-gene rearrangement: a comparative
analysis on circulating tumour cells and tumour tissue from patients with lung adenocarcinoma. Ann
Oncol. 2012; 23(11):2907–13. doi: 10.1093/annonc/mds137 PMID: 22735679
22. Pailler E, Adam J, Barthelemy A, Oulhen M, Auger N, Valent A, et al. Detection of circulating tumor
cells harboring a unique ALK rearrangement in ALK-positive non-small-cell lung cancer. J Clin Oncol.
2013; 31(18):2273–81. doi: 10.1200/JCO.2012.44.5932 PMID: 23669222
23. Pailler E, Auger N, Lindsay CR, Vielh P, Islas-Morris-Hernandez A, Borget I, et al. High level of chro-
mosomal instability in circulating tumor cells of ROS1-rearranged non-small-cell lung cancer. Ann
Oncol. 2015; 26(7):1408–15. doi: 10.1093/annonc/mdv165 PMID: 25846554
24. Vona G, Estepa L, Beroud C, Damotte D, Capron F, Nalpas B, et al. Impact of cytomorphological
detection of circulating tumor cells in patients with liver cancer. Hepatology. 2004; 39(3):792–7. doi:
10.1002/hep.20091 PMID: 14999698
Highly Sensitive Isolation and Analysis of Live and Fixed CTC by ISET®
PLOS ONE | DOI:10.1371/journal.pone.0169427 January 6, 2017 42 / 49
25. Pinzani P, Salvadori B, Simi L, Bianchi S, Distante V, Cataliotti L, et al. Isolation by size of epithelial
tumor cells in peripheral blood of patients with breast cancer: correlation with real-time reverse tran-
scriptase-polymerase chain reaction results and feasibility of molecular analysis by laser microdissec-
tion. Hum Pathol. 2006; 37(6):711–8. doi: 10.1016/j.humpath.2006.01.026 PMID: 16733212
26. Buim ME, Fanelli MF, Souza VS, Romero J, Abdallah EA, Mello CA, et al. Detection of KRAS muta-
tions in circulating tumor cells from patients with metastatic colorectal cancer. Cancer Biol Ther. 2015;
16(9):1289–95. doi: 10.1080/15384047.2015.1070991 PMID: 26252055
27. De Giorgi V, Pinzani P, Salvianti F, Panelos J, Paglierani M, Janowska A, et al. Application of a filtra-
tion- and isolation-by-size technique for the detection of circulating tumor cells in cutaneous mela-
noma. J Invest Dermatol. 2010; 130(10):2440–7. doi: 10.1038/jid.2010.141 PMID: 20535130
28. Kallergi G, Politaki E, Alkahtani S, Stournaras C, Georgoulias V. Evaluation of Isolation Methods for
Circulating Tumor Cells (CTCs). Cell Physiol Biochem. 2016; 40(3–4):411–9. doi: 10.1159/000452556
PMID: 27889762
29. Chinen LTD MC, Abdallah EA, Ocea LMM, Buim ME, Breve NM, Gasparini JL Jr, Fanelli MF, Paterlini-
Brechot P. Isolation, detection, and immunomorphological characterization of circulating tumor cells
(CTCs) from patients with diffrent types of sarcoma using isolation by size of tumor cells: a window on
sarcoma-cell invasion. OncoTargets and Therapy. 2014; 7:1609–17. doi: 10.2147/OTT.S62349
PMID: 25258541
30. Farace F, Massard C, Vimond N, Drusch F, Jacques N, Billiot F, et al. A direct comparison of Cell-
Search and ISET for circulating tumour-cell detection in patients with metastatic carcinomas. Br J Can-
cer. 2011; 105(6):847–53. doi: 10.1038/bjc.2011.294 PMID: 21829190
31. Morris KL, Tugwood JD, Khoja L, Lancashire M, Sloane R, Burt D, et al. Circulating biomarkers in
hepatocellular carcinoma. Cancer Chemother Pharmacol. 2014; 74(2):323–32. doi: 10.1007/s00280-
014-2508-7 PMID: 24923562
32. Khoja L, Backen A, Sloane R, Menasce L, Ryder D, Krebs M, et al. A pilot study to explore circulating
tumour cells in pancreatic cancer as a novel biomarker. Br J Cancer. 2012; 106(3):508–16. doi: 10.
1038/bjc.2011.545 PMID: 22187035
33. Guy CT, Cardiff RD, Muller WJ. Induction of mammary tumors by expression of polyomavirus middle
T oncogene: a transgenic mouse model for metastatic disease. Mol Cell Biol. 1992; 12(3):954–61.
PMID: 1312220
34. Jemaa M, Galluzzi L, Kepp O, Castedo M, Rello-Varona S, Vitale I, et al. Transgenerational cell fate
profiling: a method for the graphical presentation of complex cell cycle alterations. Cell Cycle. 2013; 12
(1):183–90. doi: 10.4161/cc.23046 PMID: 23255111
35. Hofman V, Bonnetaud C, Ilie MI, Vielh P, Vignaud JM, Flejou JF, et al. Preoperative circulating tumor
cell detection using the isolation by size of epithelial tumor cell method for patients with lung cancer is
a new prognostic biomarker. Clin Cancer Res. 2011; 17(4):827–35. doi: 10.1158/1078-0432.CCR-10-
0445 PMID: 21098695
36. Balasubramanian P, Lang JC, Jatana KR, Miller B, Ozer E, Old M, et al. Multiparameter analysis,
including EMT markers, on negatively enriched blood samples from patients with squamous cell carci-
noma of the head and neck. PLoS One. 2012; 7(7):e42048. doi: 10.1371/journal.pone.0042048 PMID:
22844540
37. Balic M, Dandachi N, Hofmann G, Samonigg H, Loibner H, Obwaller A, et al. Comparison of two meth-
ods for enumerating circulating tumor cells in carcinoma patients. Cytometry B Clin Cytom. 2005; 68
(1):25–30. doi: 10.1002/cyto.b.20065 PMID: 16142788
38. Rosenberg R, Gertler R, Friederichs J, Fuehrer K, Dahm M, Phelps R, et al. Comparison of two density
gradient centrifugation systems for the enrichment of disseminated tumor cells in blood. Cytometry.
2002; 49(4):150–8. doi: 10.1002/cyto.10161 PMID: 12454978
39. Rudy JL. Differentiating between sensitivity and limit of detection. Clin Chem. 1989; 35(3):509.
40. Polzer B, Medoro G, Pasch S, Fontana F, Zorzino L, Pestka A, et al. Molecular profiling of single circu-
lating tumor cells with diagnostic intention. EMBO Mol Med. 2014; 6(11):1371–86. doi: 10.15252/
emmm.201404033 PMID: 25358515
41. Hughes AD, Mattison J, Western LT, Powderly JD, Greene BT, King MR. Microtube device for selec-
tin-mediated capture of viable circulating tumor cells from blood. Clin Chem. 2012; 58(5):846–53. doi:
10.1373/clinchem.2011.176669 PMID: 22344286
42. Jeganathan N, Predescu D, Zhang J, Sha F, Bardita C, Patel M, et al. Rac1-mediated cytoskeleton
rearrangements induced by intersectin-1s deficiency promotes lung cancer cell proliferation, migration
and metastasis. Mol Cancer. 2016; 15(1):59. doi: 10.1186/s12943-016-0543-1 PMID: 27629044
43. Xu W, Mezencev R, Kim B, Wang L, McDonald J, Sulchek T. Cell stiffness is a biomarker of the meta-
static potential of ovarian cancer cells. PLoS One. 2012; 7(10):e46609. doi: 10.1371/journal.pone.
0046609 PMID: 23056368
Highly Sensitive Isolation and Analysis of Live and Fixed CTC by ISET®
PLOS ONE | DOI:10.1371/journal.pone.0169427 January 6, 2017 43 / 49
44. Matrone MA, Whipple RA, Balzer EM, Martin SS. Microtentacles tip the balance of cytoskeletal forces
in circulating tumor cells. Cancer Res. 2010; 70(20):7737–41. doi: 10.1158/0008-5472.CAN-10-1569
PMID: 20924109
45. Lebofsky R, Decraene C, Bernard V, Kamal M, Blin A, Leroy Q, et al. Circulating tumor DNA as a non-
invasive substitute to metastasis biopsy for tumor genotyping and personalized medicine in a prospec-
tive trial across all tumor types. Mol Oncol. 2015; 9(4):783–90. doi: 10.1016/j.molonc.2014.12.003
PMID: 25579085
46. Klinger B, Sieber A, Fritsche-Guenther R, Witzel F, Berry L, Schumacher D, et al. Network quantifica-
tion of EGFR signaling unveils potential for targeted combination therapy. Mol Syst Biol. 2013; 9:673.
doi: 10.1038/msb.2013.29 PMID: 23752269
47. Masramon L, Vendrell E, Tarafa G, Capella G, Miro R, Ribas M, et al. Genetic instability and diver-
gence of clonal populations in colon cancer cells in vitro. J Cell Sci. 2006; 119(Pt 8):1477–82. doi: 10.
1242/jcs.02871 PMID: 16551697
48. Watanabe N, Dickinson DA, Krzywanski DM, Iles KE, Zhang H, Venglarik CJ, et al. A549 subclones
demonstrate heterogeneity in toxicological sensitivity and antioxidant profile. Am J Physiol Lung Cell
Mol Physiol. 2002; 283(4):L726–36. doi: 10.1152/ajplung.00025.2002 PMID: 12225949
49. Klein CA, Schmidt-Kittler O, Schardt JA, Pantel K, Speicher MR, Riethmuller G. Comparative genomic
hybridization, loss of heterozygosity, and DNA sequence analysis of single cells. Proc Natl Acad Sci U
S A. 1999; 96(8):4494–9. PMID: 10200290
50. Zhang W, Zhu J, Bai J, Jiang H, Liu F, Liu A, et al. Comparison of the inhibitory effects of three tran-
scriptional variants of CDKN2A in human lung cancer cell line A549. J Exp Clin Cancer Res. 2010;
29:74. doi: 10.1186/1756-9966-29-74 PMID: 20565749
51. Fabbri F, Carloni S, Zoli W, Ulivi P, Gallerani G, Fici P, et al. Detection and recovery of circulating
colon cancer cells using a dielectrophoresis-based device: KRAS mutation status in pure CTCs. Can-
cer Lett. 2013; 335(1):225–31. doi: 10.1016/j.canlet.2013.02.015 PMID: 23419522
52. Kruger S, Emig M, Lohse P, Ehninger G, Hochhaus A, Schackert HK. The c-kit (CD117) sequence var-
iation M541L, but not N564K, is frequent in the general population, and is not associated with CML in
Caucasians. Leukemia. 2006; 20(2):354–5; discussion 6–7. doi: 10.1038/sj.leu.2404038 PMID:
16307017
53. Coumans FA, van Dalum G, Beck M, Terstappen LW. Filter characteristics influencing circulating
tumor cell enrichment from whole blood. PLoS One. 2013; 8(4):e61770. doi: 10.1371/journal.pone.
0061770 PMID: 23626725
54. Lin HK, Zheng S, Williams AJ, Balic M, Groshen S, Scher HI, et al. Portable filter-based microdevice
for detection and characterization of circulating tumor cells. Clin Cancer Res. 2010; 16(20):5011–8.
doi: 10.1158/1078-0432.CCR-10-1105 PMID: 20876796
55. Zheng S, Lin H, Liu JQ, Balic M, Datar R, Cote RJ, et al. Membrane microfilter device for selective cap-
ture, electrolysis and genomic analysis of human circulating tumor cells. J Chromatogr A. 2007; 1162
(2):154–61. doi: 10.1016/j.chroma.2007.05.064 PMID: 17561026
56. Raz RS, inventorMethod for the separation and sorting of different biological objects utilizing differ-
ences in their viscoelastic properties2008.
57. Zheng S, Lin HK, Lu B, Williams A, Datar R, Cote RJ, et al. 3D microfilter device for viable circulating
tumor cell (CTC) enrichment from blood. Biomed Microdevices. 2011; 13(1):203–13. doi: 10.1007/
s10544-010-9485-3 PMID: 20978853
58. Desitter I, Guerrouahen BS, Benali-Furet N, Wechsler J, Janne PA, Kuang Y, et al. A new device for
rapid isolation by size and characterization of rare circulating tumor cells. Anticancer Res. 2011; 31
(2):427–41. PMID: 21378321
59. El-Heliebi A, Kroneis T, Zohrer E, Haybaeck J, Fischereder K, Kampel-Kettner K, et al. Are morpholog-
ical criteria sufficient for the identification of circulating tumor cells in renal cancer? J Transl Med.
2013; 11:214. doi: 10.1186/1479-5876-11-214 PMID: 24044779
60. Lim E, Tay A, Nicholson AG. Antibody independent microfluidic cell capture of circulating tumor cells
for the diagnosis of cancer. J Thorac Oncol. 2012; 7(12):e42–3.
61. Warkiani ME, Guan G, Luan KB, Lee WC, Bhagat AA, Chaudhuri PK, et al. Slanted spiral microfluidics
for the ultra-fast, label-free isolation of circulating tumor cells. Lab Chip. 2013; 14(1):128–37.
62. Coumans FA, van Dalum G, Beck M, Terstappen LW. Filtration parameters influencing circulating
tumor cell enrichment from whole blood. PLoS One. 2013; 8(4):e61774. doi: 10.1371/journal.pone.
0061774 PMID: 23658615
63. Adams DL, Zhu P, Makarova OV, Martin SS, Charpentier M, Chumsri S, et al. The systematic study of
circulating tumor cell isolation using lithographic microfilters. RSC Adv. 2014; 9:4334–42. doi: 10.
1039/C3RA46839A PMID: 25614802
Highly Sensitive Isolation and Analysis of Live and Fixed CTC by ISET®
PLOS ONE | DOI:10.1371/journal.pone.0169427 January 6, 2017 44 / 49
64. Bobek V, Kacprzak G, Rzechonek A, Kolostova K. Detection and cultivation of circulating tumor cells
in malignant pleural mesothelioma. Anticancer Res. 2014; 34(5):2565–9. PMID: 24778078
65. Xu L, Mao X, Imrali A, Syed F, Mutsvangwa K, Berney D, et al. Optimization and Evaluation of a Novel
Size Based Circulating Tumor Cell Isolation System. PLoS One. 2015; 10(9):e0138032. doi: 10.1371/
journal.pone.0138032 PMID: 26397728
66. Hvichia GE, Parveen Z, Wagner C, Janning M, Quidde J, Stein A, et al. A novel microfluidic platform
for size and deformability based separation and the subsequent molecular characterization of viable
circulating tumor cells. Int J Cancer. 2016; 138(12):2894–904. doi: 10.1002/ijc.30007 PMID:
26789903
67. Swennenhuis JF, Tibbe AG, Stevens M, Katika MR, van Dalum J, Tong HD, et al. Self-seeding micro-
well chip for the isolation and characterization of single cells. Lab Chip. 2015; 15(14):3039–46. doi: 10.
1039/c5lc00304k PMID: 26082273
68. Gogoi P, Sepehri S, Zhou Y, Gorin MA, Paolillo C, Capoluongo E, et al. Development of an Automated
and Sensitive Microfluidic Device for Capturing and Characterizing Circulating Tumor Cells (CTCs)
from Clinical Blood Samples. PLoS One. 2016; 11(1):e0147400. doi: 10.1371/journal.pone.0147400
PMID: 26808060
69. Ntouroupi TG, Ashraf SQ, McGregor SB, Turney BW, Seppo A, Kim Y, et al. Detection of circulating
tumour cells in peripheral blood with an automated scanning fluorescence microscope. Br J Cancer.
2008; 99(5):789–95. doi: 10.1038/sj.bjc.6604545 PMID: 18682708
70. Gupta V, Jafferji I, Garza M, Melnikova VO, Hasegawa DK, Pethig R, et al. ApoStream(), a new dielec-
trophoretic device for antibody independent isolation and recovery of viable cancer cells from blood.
Biomicrofluidics. 2012; 6(2):24133. doi: 10.1063/1.4731647 PMID: 23805171
71. Kim EH, Lee JK, Kim BC, Rhim SH, Kim JW, Kim KH, et al. Enrichment of cancer cells from whole
blood using a microfabricated porous filter. Anal Biochem. 2013; 440(1):114–6. doi: 10.1016/j.ab.
2013.05.016 PMID: 23747280
72. Naume B, Borgen E, Beiske K, Herstad TK, Ravnas G, Renolen A, et al. Immunomagnetic techniques
for the enrichment and detection of isolated breast carcinoma cells in bone marrow and peripheral
blood. J Hematother. 1997; 6(2):103–14. doi: 10.1089/scd.1.1997.6.103 PMID: 9131439
73. Allard WJ, Matera J, Miller MC, Repollet M, Connelly MC, Rao C, et al. Tumor cells circulate in the
peripheral blood of all major carcinomas but not in healthy subjects or patients with nonmalignant dis-
eases. Clin Cancer Res. 2004; 10(20):6897–904. doi: 10.1158/1078-0432.CCR-04-0378 PMID:
15501967
74. Pachmann K, Heiss P, Demel U, Tilz G. Detection and quantification of small numbers of circulating
tumour cells in peripheral blood using laser scanning cytometer (LSC). Clin Chem Lab Med. 2001; 39
(9):811–7. doi: 10.1515/CCLM.2001.134 PMID: 11601678
75. Zieglschmid V, Hollmann C, Gutierrez B, Albert W, Strothoff D, Gross E, et al. Combination of immuno-
magnetic enrichment with multiplex RT-PCR analysis for the detection of disseminated tumor cells.
Anticancer Res. 2005; 25(3A):1803–10. PMID: 16033103
76. Nagrath S, Sequist LV, Maheswaran S, Bell DW, Irimia D, Ulkus L, et al. Isolation of rare circulating
tumour cells in cancer patients by microchip technology. Nature. 2007; 450(7173):1235–9. doi: 10.
1038/nature06385 PMID: 18097410
77. Talasaz AH, Powell AA, Huber DE, Berbee JG, Roh KH, Yu W, et al. Isolating highly enriched popula-
tions of circulating epithelial cells and other rare cells from blood using a magnetic sweeper device.
Proc Natl Acad Sci U S A. 2009; 106(10):3970–5. doi: 10.1073/pnas.0813188106 PMID: 19234122
78. Pluim D, Devriese LA, Beijnen JH, Schellens JH. Validation of a multiparameter flow cytometry method
for the determination of phosphorylated extracellular-signal-regulated kinase and DNA in circulating
tumor cells. Cytometry A. 2012; 81(8):664–71. doi: 10.1002/cyto.a.22049 PMID: 22499242
79. Stott SL, Hsu CH, Tsukrov DI, Yu M, Miyamoto DT, Waltman BA, et al. Isolation of circulating tumor
cells using a microvortex-generating herringbone-chip. Proc Natl Acad Sci U S A. 2010; 107
(43):18392–7. doi: 10.1073/pnas.1012539107 PMID: 20930119
80. Nora Dickson M, Tsinberg P, Tang Z, Bischoff FZ, Wilson T, Leonard EF. Efficient capture of circulat-
ing tumor cells with a novel immunocytochemical microfluidic device. Biomicrofluidics. 2011; 5
(3):34119–3411915. doi: 10.1063/1.3623748 PMID: 22662044
81. Wang S, Liu K, Liu J, Yu ZT, Xu X, Zhao L, et al. Highly efficient capture of circulating tumor cells by
using nanostructured silicon substrates with integrated chaotic micromixers. Angew Chem Int Ed
Engl. 2011; 50(13):3084–8. doi: 10.1002/anie.201005853 PMID: 21374764
82. Payne RE, Wang F, Su N, Krell J, Zebrowski A, Yague E, et al. Viable circulating tumour cell detection
using multiplex RNA in situ hybridisation predicts progression-free survival in metastatic breast cancer
patients. Br J Cancer. 2012; 106(11):1790–7. doi: 10.1038/bjc.2012.137 PMID: 22538972
Highly Sensitive Isolation and Analysis of Live and Fixed CTC by ISET®
PLOS ONE | DOI:10.1371/journal.pone.0169427 January 6, 2017 45 / 49
83. Marrinucci D, Bethel K, Kolatkar A, Luttgen MS, Malchiodi M, Baehring F, et al. Fluid biopsy in patients
with metastatic prostate, pancreatic and breast cancers. Phys Biol. 2012; 9(1):016003. doi: 10.1088/
1478-3975/9/1/016003 PMID: 22306768
84. Saucedo-Zeni N, Mewes S, Niestroj R, Gasiorowski L, Murawa D, Nowaczyk P, et al. A novel method
for the in vivo isolation of circulating tumor cells from peripheral blood of cancer patients using a func-
tionalized and structured medical wire. Int J Oncol. 2012; 41(4):1241–50. doi: 10.3892/ijo.2012.1557
PMID: 22825490
85. Harb W, Fan A, Tran T, Danila DC, Keys D, Schwartz M, et al. Mutational Analysis of Circulating
Tumor Cells Using a Novel Microfluidic Collection Device and qPCR Assay. Transl Oncol. 2013; 6
(5):528–38. PMID: 24151533
86. Kamande JW, Hupert ML, Witek MA, Wang H, Torphy RJ, Dharmasiri U, et al. Modular microsystem
for the isolation, enumeration, and phenotyping of circulating tumor cells in patients with pancreatic
cancer. Anal Chem. 2013; 85(19):9092–100. doi: 10.1021/ac401720k PMID: 23947293
87. Hillig T, Nygaard AB, Nekiunaite L, Klingelhofer J, Soletormos G. In vitro validation of an ultra-sensitive
scanning fluorescence microscope for analysis of circulating tumor cells. APMIS. 2013; 122(6):545–
51. doi: 10.1111/apm.12183 PMID: 24164622
88. Ozkumur E, Shah AM, Ciciliano JC, Emmink BL, Miyamoto DT, Brachtel E, et al. Inertial focusing for
tumor antigen-dependent and -independent sorting of rare circulating tumor cells. Sci Transl Med.
2013; 5(179):179ra47. doi: 10.1126/scitranslmed.3005616 PMID: 23552373
89. Karabacak NM, Spuhler PS, Fachin F, Lim EJ, Pai V, Ozkumur E, et al. Microfluidic, marker-free isola-
tion of circulating tumor cells from blood samples. Nat Protoc. 2014; 9(3):694–710. doi: 10.1038/nprot.
2014.044 PMID: 24577360
90. Winer-Jones JP, Vahidi B, Arquilevich N, Fang C, Ferguson S, Harkins D, et al. Circulating tumor
cells: clinically relevant molecular access based on a novel CTC flow cell. PLoS One. 2014; 9(1):
e86717. doi: 10.1371/journal.pone.0086717 PMID: 24489774
91. Naume B, Borgen E, Tossvik S, Pavlak N, Oates D, Nesland JM. Detection of isolated tumor cells in
peripheral blood and in BM: evaluation of a new enrichment method. Cytotherapy. 2004; 6(3):244–52.
doi: 10.1080/14653240410006086 PMID: 15203981
92. Wu S, Liu Z, Liu S, Lin L, Yang W, Xu J. Enrichment and enumeration of circulating tumor cells by effi-
cient depletion of leukocyte fractions. Clin Chem Lab Med. 2013; 52(2):243–51.
93. Alix-Panabieres C, Brouillet JP, Fabbro M, Yssel H, Rousset T, Maudelonde T, et al. Characterization
and enumeration of cells secreting tumor markers in the peripheral blood of breast cancer patients. J
Immunol Methods. 2005; 299(1–2):177–88. doi: 10.1016/j.jim.2005.02.007 PMID: 15914200
94. Alix-Panabieres C, Rebillard X, Brouillet JP, Barbotte E, Iborra F, Segui B, et al. Detection of circulat-
ing prostate-specific antigen-secreting cells in prostate cancer patients. Clin Chem. 2005; 51(8):1538–
41. doi: 10.1373/clinchem.2005.049445 PMID: 16040853
95. Kojima T, Hashimoto Y, Watanabe Y, Kagawa S, Uno F, Kuroda S, et al. A simple biological imaging
system for detecting viable human circulating tumor cells. J Clin Invest. 2009; 119(10):3172–81. doi:
10.1172/JCI38609 PMID: 19729837
96. Paris PL, Kobayashi Y, Zhao Q, Zeng W, Sridharan S, Fan T, et al. Functional phenotyping and geno-
typing of circulating tumor cells from patients with castration resistant prostate cancer. Cancer Lett.
2009; 277(2):164–73. doi: 10.1016/j.canlet.2008.12.007 PMID: 19162393
97. Khoja L, Shenjere P, Hodgson C, Hodgetts J, Clack G, Hughes A, et al. Prevalence and heterogeneity
of circulating tumour cells in metastatic cutaneous melanoma. Melanoma Res. 2014; 24(1):40–6. doi:
10.1097/CMR.0000000000000025 PMID: 24201293
98. Qin J, Alt JR, Hunsley BA, Williams TL, Fernando MR. Stabilization of circulating tumor cells in blood
using a collection device with a preservative reagent. Cancer Cell Int. 2014; 14(1):23. doi: 10.1186/
1475-2867-14-23 PMID: 24602297
99. Conti M, Scanferlato R, Louka M, Sansone A, Marzetti C, Ferreri C. Building up spectral libraries for
mapping erythrocytes by hyperspectral dark field microscopy. Biomedical Spectroscopy and Imaging.
2016; 5(2):175–84.
100. Mouawia H, Saker A, Jais JP, Benachi A, Bussieres L, Lacour B, et al. Circulating trophoblastic cells
provide genetic diagnosis in 63 fetuses at risk for cystic fibrosis or spinal muscular atrophy. Reprod
Biomed Online. 2012; 25(5):508–20. doi: 10.1016/j.rbmo.2012.08.002 PMID: 23000084
101. Smallwood SA, Lee HJ, Angermueller C, Krueger F, Saadeh H, Peat J, et al. Single-cell genome-wide
bisulfite sequencing for assessing epigenetic heterogeneity. Nat Methods. 2014; 11(8):817–20. doi:
10.1038/nmeth.3035 PMID: 25042786
Highly Sensitive Isolation and Analysis of Live and Fixed CTC by ISET®
PLOS ONE | DOI:10.1371/journal.pone.0169427 January 6, 2017 46 / 49
102. Zhang Y, Tang Y, Sun S, Wang Z, Wu W, Zhao X, et al. Single-cell codetection of metabolic activity,
intracellular functional proteins, and genetic mutations from rare circulating tumor cells. Anal Chem.
2015; 87(19):9761–8. doi: 10.1021/acs.analchem.5b01901 PMID: 26378744
103. Hofman V, Long E, Ilie M, Bonnetaud C, Vignaud JM, Flejou JF, et al. Morphological analysis of circu-
lating tumour cells in patients undergoing surgery for non-small cell lung carcinoma using the isolation
by size of epithelial tumour cell (ISET) method. Cytopathology. 2011.
104. Hou JM, Krebs M, Ward T, Sloane R, Priest L, Hughes A, et al. Circulating tumor cells as a window on
metastasis biology in lung cancer. Am J Pathol. 2011; 178(3):989–96. doi: 10.1016/j.ajpath.2010.12.
003 PMID: 21356352
105. Malara N, Guzzi G, Mignogna C, Trunzo V, Camastra C, Della Torre A, et al. Non-invasive real-time
biopsy of intracranial lesions using short time expanded circulating tumor cells on glass slide: report of
two cases. BMC Neurol. 2016; 16:127. doi: 10.1186/s12883-016-0652-x PMID: 27502239
106. Pantel K, Alix-Panabieres C. Functional Studies on Viable Circulating Tumor Cells. Clin Chem. 2016;
62(2):328–34. doi: 10.1373/clinchem.2015.242537 PMID: 26637479
107. Ligthart ST, Coumans FA, Bidard FC, Simkens LH, Punt CJ, de Groot MR, et al. Circulating Tumor
Cells Count and Morphological Features in Breast, Colorectal and Prostate Cancer. PLoS One. 2013;
8(6):e67148. doi: 10.1371/journal.pone.0067148 PMID: 23826219
108. Hou JM, Krebs MG, Lancashire L, Sloane R, Backen A, Swain RK, et al. Clinical significance and
molecular characteristics of circulating tumor cells and circulating tumor microemboli in patients with
small-cell lung cancer. J Clin Oncol. 2012; 30(5):525–32. doi: 10.1200/JCO.2010.33.3716 PMID:
22253462
109. Hodgkinson CL, Morrow CJ, Li Y, Metcalf RL, Rothwell DG, Trapani F, et al. Tumorigenicity and
genetic profiling of circulating tumor cells in small-cell lung cancer. Nat Med. 2014; 20(8):897–903. doi:
10.1038/nm.3600 PMID: 24880617
110. Lee TK, Esinhart JD, Blackburn LD, Silverman JF. The size of small cell lung carcinoma cells. Ratio to
lymphocytes and correlation with specimen size and crush artifact. Anal Quant Cytol Histol. 1992; 14
(1):32–4. PMID: 1313679
111. Long E, Ilie M, Bence C, Butori C, Selva E, Lalvee S, et al. High expression of TRF2, SOX10, and
CD10 in circulating tumor microemboli detected in metastatic melanoma patients. A potential impact
for the assessment of disease aggressiveness. Cancer Med. 2016.
112. Mazzini C, Pinzani P, Salvianti F, Scatena C, Paglierani M, Ucci F, et al. Circulating tumor cells detec-
tion and counting in uveal melanomas by a filtration-based method. Cancers (Basel). 2014; 6(1):323–
32.
113. Chinen LT, de Carvalho FM, Rocha BM, Aguiar CM, Abdallah EA, Campanha D, et al. Cytokeratin-
based CTC counting unrelated to clinical follow up. J Thorac Dis. 2013; 5(5):593–9. doi: 10.3978/j.
issn.2072-1439.2013.09.18 PMID: 24255771
114. Abdallah EA, Fanelli MF, Buim ME, Machado Netto MC, Gasparini Junior JL, Souza ESV, et al. Thymi-
dylate synthase expression in circulating tumor cells: a new tool to predict 5-fluorouracil resistance in
metastatic colorectal cancer patients. Int J Cancer. 2015; 137(6):1397–405. doi: 10.1002/ijc.29495
PMID: 25721610
115. Abdallah EA, Fanelli MF, Souza ESV, Machado Netto MC, Gasparini Junior JL, Vilarim Araujo D, et al.
MRP1 expression in CTCs confers resistance to irinotecan-based treatment in metastatic colorectal
cancer. Int J Cancer. 2016.
116. Pinzani P, Mazzini C, Salvianti F, Massi D, Grifoni R, Paoletti C, et al. Tyrosinase mRNA levels in the
blood of uveal melanoma patients: correlation with the number of circulating tumor cells and tumor pro-
gression. Melanoma Res. 2010; 20(4):303–10. doi: 10.1097/CMR.0b013e32833906e3 PMID:
20442676
117. Cummings J, Sloane R, Morris K, Zhou C, Lancashire M, Moore D, et al. Optimisation of an immuno-
histochemistry method for the determination of androgen receptor expression levels in circulating
tumour cells. BMC Cancer. 2014; 14:226. doi: 10.1186/1471-2407-14-226 PMID: 24674711
118. LeBleu VS, O’Connell JT, Gonzalez Herrera KN, Wikman H, Pantel K, Haigis MC, et al. PGC-1alpha
mediates mitochondrial biogenesis and oxidative phosphorylation in cancer cells to promote metasta-
sis. Nat Cell Biol. 2014; 16(10):992–1003, 1–15. doi: 10.1038/ncb3039 PMID: 25241037
119. Salvianti F, Orlando C, Massi D, De Giorgi V, Grazzini M, Pazzagli M, et al. Tumor-Related Methylated
Cell-Free DNA and Circulating Tumor Cells in Melanoma. Front Mol Biosci. 2016; 2:76. doi: 10.3389/
fmolb.2015.00076 PMID: 26779490
120. Fidler IJ. Metastasis: quantitative analysis of distribution and fate of tumor emboli labeled with 125 I-5-
iodo-2’-deoxyuridine. J Natl Cancer Inst. 1970; 45(4):773–82. PMID: 5513503
Highly Sensitive Isolation and Analysis of Live and Fixed CTC by ISET®
PLOS ONE | DOI:10.1371/journal.pone.0169427 January 6, 2017 47 / 49
121. Liotta LA, Saidel MG, Kleinerman J. The significance of hematogenous tumor cell clumps in the meta-
static process. Cancer Res. 1976; 36(3):889–94. PMID: 1253177
122. Duda DG, Duyverman AM, Kohno M, Snuderl M, Steller EJ, Fukumura D, et al. Malignant cells facili-
tate lung metastasis by bringing their own soil. Proc Natl Acad Sci U S A. 2010; 107(50):21677–82.
doi: 10.1073/pnas.1016234107 PMID: 21098274
123. Aceto N, Bardia A, Miyamoto DT, Donaldson MC, Wittner BS, Spencer JA, et al. Circulating tumor cell
clusters are oligoclonal precursors of breast cancer metastasis. Cell. 2014; 158(5):1110–22. doi: 10.
1016/j.cell.2014.07.013 PMID: 25171411
124. Magnon C, Hall SJ, Lin J, Xue X, Gerber L, Freedland SJ, et al. Autonomic nerve development contrib-
utes to prostate cancer progression. Science. 2013; 341(6142):1236361. doi: 10.1126/science.
1236361 PMID: 23846904
125. Husemann Y, Geigl JB, Schubert F, Musiani P, Meyer M, Burghart E, et al. Systemic spread is an
early step in breast cancer. Cancer Cell. 2008; 13(1):58–68. doi: 10.1016/j.ccr.2007.12.003 PMID:
18167340
126. Chang YS, di Tomaso E, McDonald DM, Jones R, Jain RK, Munn LL. Mosaic blood vessels in tumors:
frequency of cancer cells in contact with flowing blood. Proc Natl Acad Sci U S A. 2000; 97(26):14608–
13. doi: 10.1073/pnas.97.26.14608 PMID: 11121063
127. Liotta LA, Kleinerman J, Saidel GM. Quantitative relationships of intravascular tumor cells, tumor ves-
sels, and pulmonary metastases following tumor implantation. Cancer Res. 1974; 34(5):997–1004.
PMID: 4841969
128. Butler TP, Gullino PM. Quantitation of cell shedding into efferent blood of mammary adenocarcinoma.
Cancer Res. 1975; 35(3):512–6. PMID: 1090362
129. Klein CA. Parallel progression of primary tumours and metastases. Nat Rev Cancer. 2009; 9(4):302–
12. doi: 10.1038/nrc2627 PMID: 19308069
130. Paiva B, Paino T, Sayagues JM, Garayoa M, San-Segundo L, Martin M, et al. Detailed characteriza-
tion of multiple myeloma circulating tumor cells shows unique phenotypic, cytogenetic, functional, and
circadian distribution profile. Blood. 2013; 122(22):3591–8. doi: 10.1182/blood-2013-06-510453
PMID: 24072855
131. Schlutter JM, Kirkegaard I, Ferreira AS, Hatt L, Christensen B, Kolvraa S, et al. The Number of Endo-
vascular Trophoblasts in Maternal Blood Increases Overnight and after Physical Activity: An Experi-
mental Study. Fetal Diagn Ther. 2015.
132. Pantel K, Alix-Panabieres C. Liquid biopsy: Potential and challenges. Mol Oncol. 2015; 10(3):371–3.
133. Lelievre L, Paterlini-Brechot P, Camatte S, Tartour E, Aggerbeck M, Vilde F, et al. Effect of laparos-
copy versus laparotomy on circulating tumor cells using isolation by size of epithelial tumor cells. Int J
Gynecol Cancer. 2004; 14(2):229–33. doi: 10.1111/j.1048-891X.2004.014205.x PMID: 15086721
134. Harouaka RA, Nisic M, Zheng SY. Circulating tumor cell enrichment based on physical properties. J
Lab Autom. 2013; 18(6):455–68. doi: 10.1177/2211068213494391 PMID: 23832928
135. Runge J, Reichert TE, Fritsch A, Kas J, Bertolini J, Remmerbach TW. Evaluation of single-cell biome-
chanics as potential marker for oral squamous cell carcinomas: a pilot study. Oral Dis. 2014; 20(3):
e120–7. doi: 10.1111/odi.12171 PMID: 24006964
136. Swaminathan V, Mythreye K, O’Brien ET, Berchuck A, Blobe GC, Superfine R. Mechanical stiffness
grades metastatic potential in patient tumor cells and in cancer cell lines. Cancer Res. 2011; 71
(15):5075–80. doi: 10.1158/0008-5472.CAN-11-0247 PMID: 21642375
137. Qin L, Liao L, Redmond A, Young L, Yuan Y, Chen H, et al. The AIB1 oncogene promotes breast can-
cer metastasis by activation of PEA3-mediated matrix metalloproteinase 2 (MMP2) and MMP9 expres-
sion. Mol Cell Biol. 2008; 28(19):5937–50. doi: 10.1128/MCB.00579-08 PMID: 18644862
138. Wang X, Tanaka M, Krstin S, Peixoto HS, Moura CC, Wink M. Cytoskeletal interference—A new
mode of action for the anticancer drugs camptothecin and topotecan. Eur J Pharmacol. 2016;
789:265–74. doi: 10.1016/j.ejphar.2016.07.044 PMID: 27474470
139. Dumontet C, Jordan MA. Microtubule-binding agents: a dynamic field of cancer therapeutics. Nat Rev
Drug Discov. 2010; 9(10):790–803. doi: 10.1038/nrd3253 PMID: 20885410
140. Calzado-Martin A, Encinar M, Tamayo J, Calleja M, San Paulo A. Effect of Actin Organization on the
Stiffness of Living Breast Cancer Cells Revealed by Peak-Force Modulation Atomic Force Microscopy.
ACS Nano. 2016; 10(3):3365–74. doi: 10.1021/acsnano.5b07162 PMID: 26901115
141. Pretlow TG, Schwartz S, Giaconia JM, Wright AL, Grimm HA, Edgehouse NL, et al. Prostate cancer
and other xenografts from cells in peripheral blood of patients. Cancer Res. 2000; 60(15):4033–6.
PMID: 10945604
Highly Sensitive Isolation and Analysis of Live and Fixed CTC by ISET®
PLOS ONE | DOI:10.1371/journal.pone.0169427 January 6, 2017 48 / 49
142. Gao D, Vela I, Sboner A, Iaquinta PJ, Karthaus WR, Gopalan A, et al. Organoid cultures derived from
patients with advanced prostate cancer. Cell. 2014; 159(1):176–87. doi: 10.1016/j.cell.2014.08.016
PMID: 25201530
143. Yu M, Bardia A, Aceto N, Bersani F, Madden MW, Donaldson MC, et al. Cancer therapy. Ex vivo cul-
ture of circulating breast tumor cells for individualized testing of drug susceptibility. Science. 2014; 345
(6193):216–20. doi: 10.1126/science.1253533 PMID: 25013076
144. Baccelli I, Schneeweiss A, Riethdorf S, Stenzinger A, Schillert A, Vogel V, et al. Identification of a pop-
ulation of blood circulating tumor cells from breast cancer patients that initiates metastasis in a xeno-
graft assay. Nat Biotechnol. 2013; 31(6):539–44. doi: 10.1038/nbt.2576 PMID: 23609047
145. Kolostova K, Zhang Y, Hoffman RM, Bobek V. In vitro culture and characterization of human lung can-
cer circulating tumor cells isolated by size exclusion from an orthotopic nude-mouse model expressing
fluorescent protein. J Fluoresc. 2014; 24(5):1531–6. doi: 10.1007/s10895-014-1439-3 PMID:
25141982
146. Cayrefourcq L, Mazard T, Joosse S, Solassol J, Ramos J, Assenat E, et al. Establishment and charac-
terization of a cell line from human circulating colon cancer cells. Cancer Res. 2015; 75(5):892–901.
doi: 10.1158/0008-5472.CAN-14-2613 PMID: 25592149
147. Zhang L, Ridgway LD, Wetzel MD, Ngo J, Yin W, Kumar D, et al. The identification and characteriza-
tion of breast cancer CTCs competent for brain metastasis. Sci Transl Med. 2013; 5(180):180ra48.
doi: 10.1126/scitranslmed.3005109 PMID: 23576814
148. Klein CA, Blankenstein TJ, Schmidt-Kittler O, Petronio M, Polzer B, Stoecklein NH, et al. Genetic het-
erogeneity of single disseminated tumour cells in minimal residual cancer. Lancet. 2002; 360
(9334):683–9. doi: 10.1016/S0140-6736(02)09838-0 PMID: 12241875
149. Navin N, Kendall J, Troge J, Andrews P, Rodgers L, McIndoo J, et al. Tumour evolution inferred by sin-
gle-cell sequencing. Nature. 2011; 472(7341):90–4. doi: 10.1038/nature09807 PMID: 21399628
150. Swennenhuis JF, Reumers J, Thys K, Aerssens J, Terstappen LW. Efficiency of whole genome ampli-
fication of single circulating tumor cells enriched by CellSearch and sorted by FACS. Genome Med.
2013; 5(11):106. doi: 10.1186/gm510 PMID: 24286536
151. Ni X, Zhuo M, Su Z, Duan J, Gao Y, Wang Z, et al. Reproducible copy number variation patterns
among single circulating tumor cells of lung cancer patients. Proc Natl Acad Sci U S A. 2013; 110
(52):21083–8. doi: 10.1073/pnas.1320659110 PMID: 24324171
152. De Luca F, Rotunno G, Salvianti F, Galardi F, Pestrin M, Gabellini S, et al. Mutational analysis of single
circulating tumor cells by next generation sequencing in metastatic breast cancer. Oncotarget. 2016.
153. Neumann MH, Schneck H, Decker Y, Schomer S, Franken A, Endris V, et al. Isolation and characteri-
zation of circulating tumor cells using a novel workflow combining the CellSearch(R) system and the
CellCelector. Biotechnol Prog. 2016.
154. Lohr JG, Adalsteinsson VA, Cibulskis K, Choudhury AD, Rosenberg M, Cruz-Gordillo P, et al. Whole-
exome sequencing of circulating tumor cells provides a window into metastatic prostate cancer. Nat
Biotechnol. 2014; 32(5):479–84. doi: 10.1038/nbt.2892 PMID: 24752078
155. Dago AE, Stepansky A, Carlsson A, Luttgen M, Kendall J, Baslan T, et al. Rapid phenotypic and geno-
mic change in response to therapeutic pressure in prostate cancer inferred by high content analysis of
single circulating tumor cells. PLoS One. 2014; 9(8):e101777. doi: 10.1371/journal.pone.0101777
PMID: 25084170
Highly Sensitive Isolation and Analysis of Live and Fixed CTC by ISET®
PLOS ONE | DOI:10.1371/journal.pone.0169427 January 6, 2017 49 / 49