Embed Size (px)
Citation preview
COOSBAY_COSTTM_V3.DOCX 1
T E C H N I C A L M E M O R A N D U M FINAL – Coos Bay Wastewater Treatment Plant No.2 Upgrade Cost Estimate
City of Coos Bay
PREPARED BY: Alan Chang/CH2M HILL William Leaf /CH2M HILL Miaomiao Zhang/CH2M HILL
REVIEWED BY: Doug Berschauer/CH2M HILL
Bob Lawson/CH2M HILL
DATE: May 15, 2012
Introduction This memorandum presents the cost estimate for two top alternatives selected in the Coos Bay Wastewater Treatment Plant (WWTP) No.2 Facility Plan Amendment (FPA) (Civil West, draft, September 2011), as well as two top alternatives proposed in the Value Assessment (VA) report (CH2M HILL, November 2011). These alternatives are:
• FPA alternative 1 – New plant with Sequencing Batch Reactor (SBR)
• FPA Alternative 2 – New plant with Conventional Modified Ludzack-Ettinger (MLE)
• VA Alternative 1 – Membrane Bioreactor (MBR), utilizing existing aeration basins and clarifiers
• VA Alternative 2 – Integrated Fixed Film Activated Sludge (IFAS), utilizing existing aeration basins and clarifiers
Although preliminary capital costs have been estimated for those two FPA alternatives during alternative pre-screening, the purpose of this cost estimating is to provide a fair comparison for all four alternatives at the same costing platform. CH2M HILL’s cost estimating tool CPESTM (CH2M HILL Parametric Cost Estimating System) will be used to determine the project cost, annual O&M costs and life cycle cost of each alternative. Summary of CPESTM cost estimate of each alternative is included in attachment to this memorandum.
The memorandum summarizes all the assumptions and basis used for the cost estimating and presents the comparison. The cost estimate was based on the proposing vendors’ quote as well as engineers’ experience at other construction projects. The 2035 design criteria listed within the Facility Plan Amendment are used within this evaluation. One exception is that the design wastewater temperature is proposed to be 15oC, which appears to be the low temperature for the Coos Bay WWTP No. 2 during the compliance period for Ammonia-N. The assumed design temperature used within the equipment quotes included as part of the FPA varied from 10 oC to 13 oC. It has been noted that the plant discharge monitoring reports (DMR) show that the minimum wastewater temperature from Coos Bay WWTP No. 2 is approximately 13oC.
Treatment Alternatives This section presents a description of the alternatives under consideration and the basis of design for each used to develop the cost estimate.
FPA Alternative 1 – SBR This alternative assumes the existing treatment plant No. 2 will be abandoned, with the exception of piping connections to the existing outfall. The new plant will be constructed on a new parcel, across from the existing WWTP. The new site is undeveloped, but free from any existing structures.
PREPARED FOR:
FINAL – COOS BAY WASTEWATER TREATMENT PLANT NO.2 UPGRADE COST ESTIMATE
2 COOSBAY_COSTTM_V3.DOCX
Assumptions have been made during cost estimating based on the understanding of the FPA and CH2M HILL’s experience on the similar projects. The common assumptions for both FPA alternatives include:
• The process and equipment have been sized to meet the Class I reliability requirements by Environmental Protection Agency (EPA).
• A new headworks building containing screens and grit removal systems is provided. The screening and grit disposal dumpsters are outdoor.
• No primary clarifiers are provided at the new plant.
• A Waste Activated Sludge (WAS) storage tank with over 6 day storage capacity at maximum month condition is provided. WAS is stored and then trucked offsite for treatment.
• Ultraviolet (UV) disinfection is employed to replace existing chlorine system. A high UV dose may be required due to strict discharge coliform requirement in the National Pollutant Discharge Elimination System (NPDES) permit.
• A 3,000-sqft new Administration/Operation & Maintenance (O&M) building is constructed.
• A new 200-kW emergency generator is installed onsite.
• No odor control is included as per the FPA, but this should be evaluated in detail as the project progresses. It may be warranted to have odor control on the new parcel for the headworks facility.
The assumptions specific to SBR alternative include:
• SBR sizing and cost are based on Intermittent Cycle Extended Aeration System (ICEAS) from ITT’s proposal. Although the wastewater temperature and the peak flows used in ITT’s calculation do not exactly align with the design criteria discussed in the technical memorandum “Preliminary Biological Treatment System Alternative Proposals Review” (Esvelt Environmental Engineering, August 2011), the temperature of 13oC (based on DMRs) used by ITT is conservative for the dry weather condition because the seasonal low temperature during the ammonia compliance period appears to be approximately 15oC. Therefore, the process system sizes proposed have sufficient hydraulic capacity to handle the peak hour flow.
• The scope of supply includes:
- (2) 40' Decanters with Drive Units (1 decanters per basin)
- (2) 125-HP Aeration PD Blowers (1 duty & 1 standby)
- (2) Fine Bubble Aeration Systems (1 system per tank)
- (2) Automated Air Control Valves
- (2) DO Control with Probes and Logic (one probe per tank)
- (2) Waste Activated Sludge (WAS) Pumps
- (1) ABJ Control Package (including PLC, HMI, Motor Starters/VFD’s for above listed equipment, Modem, Level Transmitters and Float Switches, and Local Decanter Control Stations)
- (10) Service Days
- (1) Freight
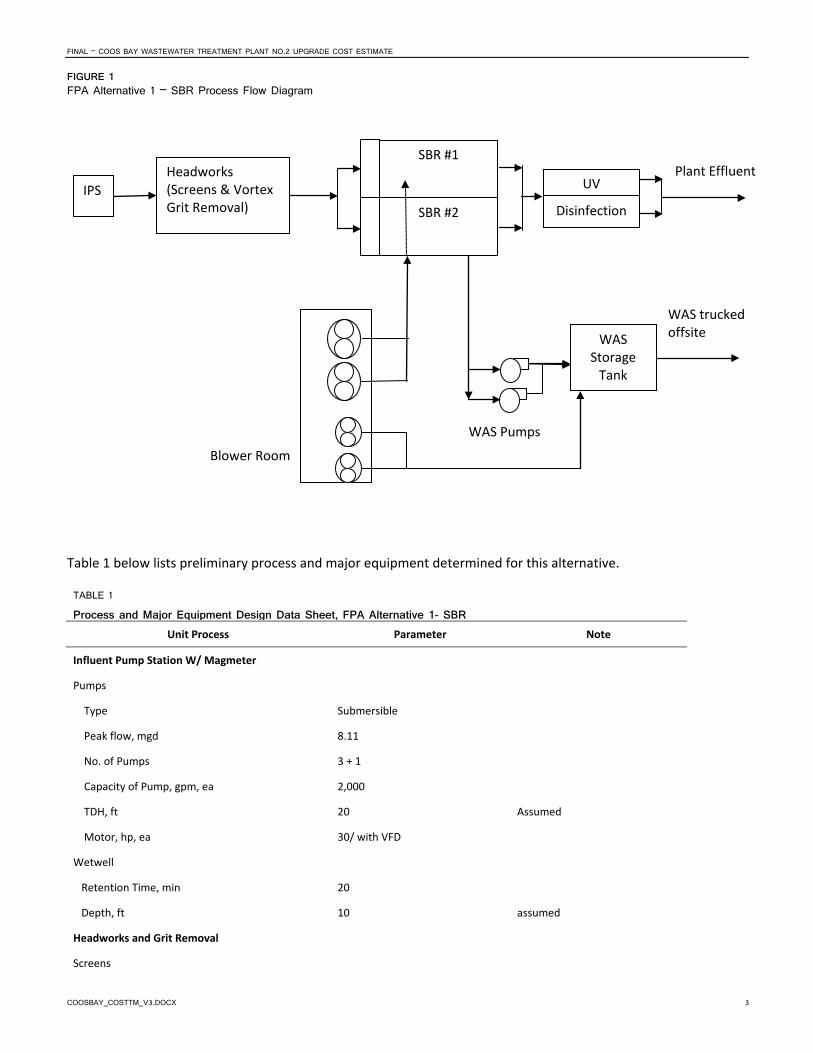
Figure 1 below illustrates the process flow diagram of SBR alternative.
FINAL – COOS BAY WASTEWATER TREATMENT PLANT NO.2 UPGRADE COST ESTIMATE
COOSBAY_COSTTM_V3.DOCX 3
FIGURE 1 FPA Alternative 1 – SBR Process Flow Diagram
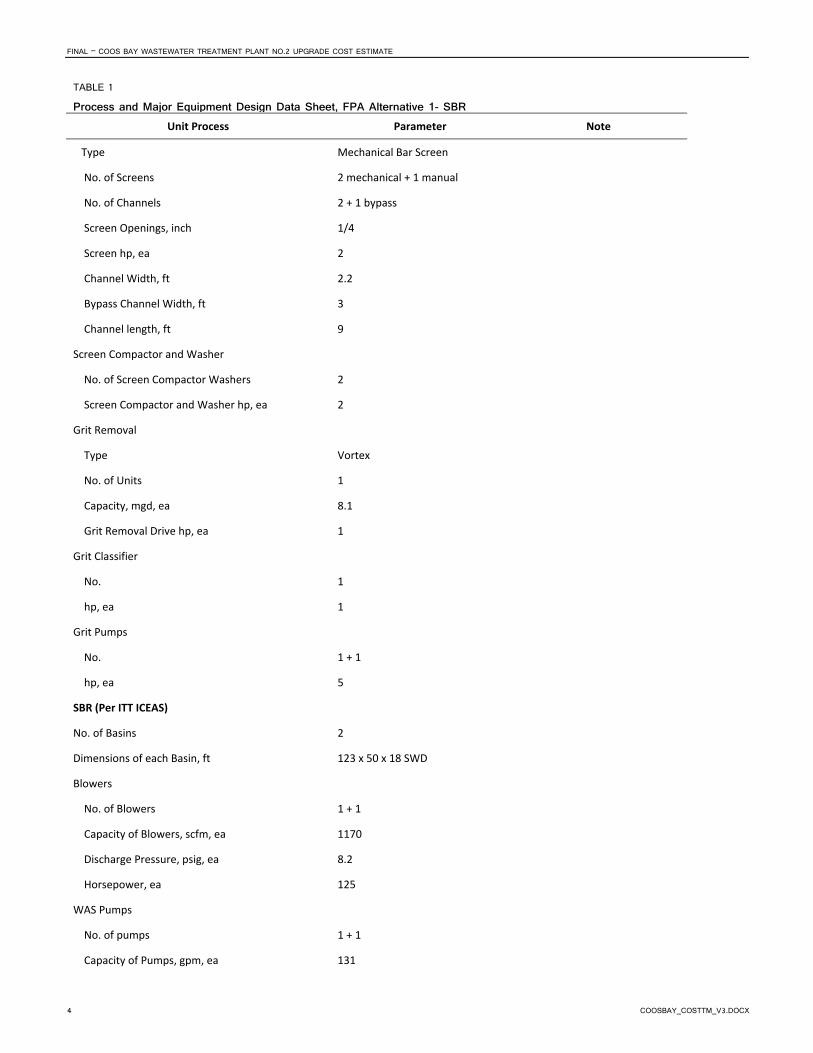
Table 1 below lists preliminary process and major equipment determined for this alternative.
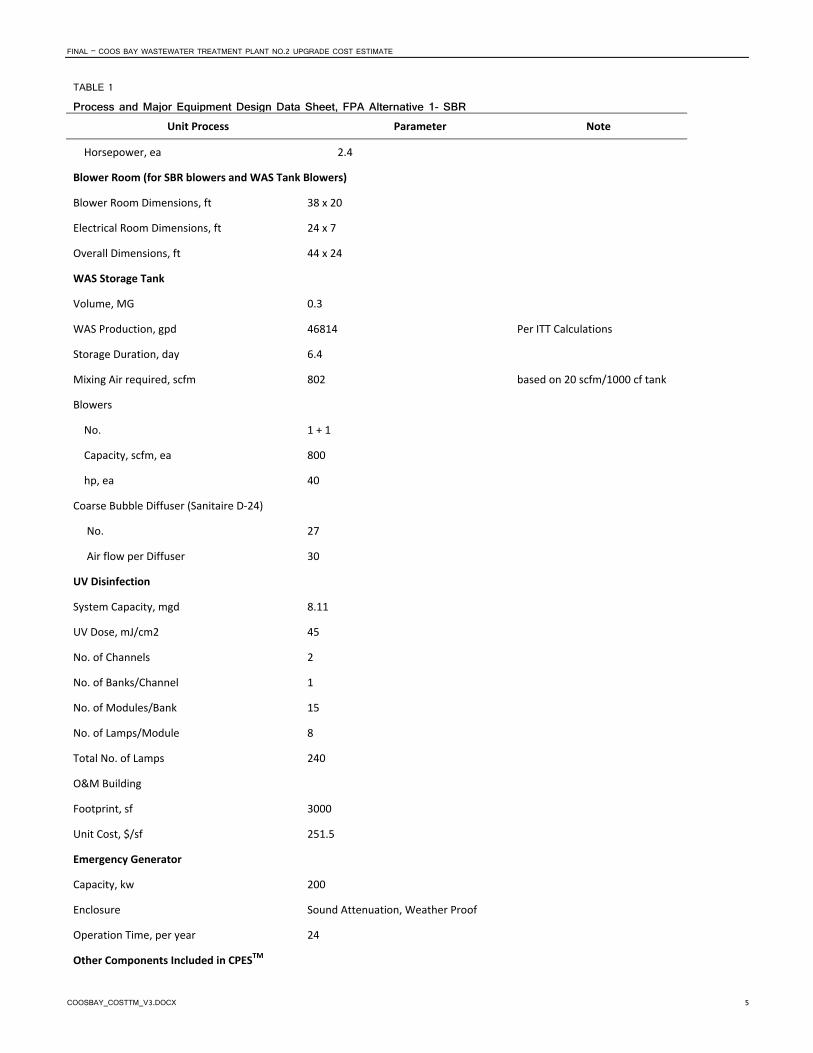
TABLE 1
Process and Major Equipment Design Data Sheet, FPA Alternative 1- SBR Unit Process Parameter Note
Influent Pump Station W/ Magmeter
Pumps
Type Submersible
Peak flow, mgd 8.11
No. of Pumps 3 + 1
Capacity of Pump, gpm, ea 2,000
TDH, ft 20 Assumed
Motor, hp, ea 30/ with VFD
Wetwell
Retention Time, min 20
Depth, ft 10 assumed
Headworks and Grit Removal
Screens
IPS Headworks (Screens & Vortex Grit Removal)
SBR #1
SBR #2
UV
Disinfection
WAS Storage
Tank
Blower Room
WAS Pumps
WAS trucked offsite
Plant Effluent
FINAL – COOS BAY WASTEWATER TREATMENT PLANT NO.2 UPGRADE COST ESTIMATE
4 COOSBAY_COSTTM_V3.DOCX
TABLE 1
Process and Major Equipment Design Data Sheet, FPA Alternative 1- SBR Unit Process Parameter Note
Type Mechanical Bar Screen
No. of Screens 2 mechanical + 1 manual
No. of Channels 2 + 1 bypass
Screen Openings, inch 1/4
Screen hp, ea 2
Channel Width, ft 2.2
Bypass Channel Width, ft 3
Channel length, ft 9
Screen Compactor and Washer
No. of Screen Compactor Washers 2
Screen Compactor and Washer hp, ea 2
Grit Removal
Type Vortex
No. of Units 1
Capacity, mgd, ea 8.1
Grit Removal Drive hp, ea 1
Grit Classifier
No. 1
hp, ea 1
Grit Pumps
No. 1 + 1
hp, ea 5
SBR (Per ITT ICEAS)
No. of Basins 2
Dimensions of each Basin, ft 123 x 50 x 18 SWD
Blowers
No. of Blowers 1 + 1
Capacity of Blowers, scfm, ea 1170
Discharge Pressure, psig, ea 8.2
Horsepower, ea 125
WAS Pumps
No. of pumps 1 + 1
Capacity of Pumps, gpm, ea 131
FINAL – COOS BAY WASTEWATER TREATMENT PLANT NO.2 UPGRADE COST ESTIMATE
COOSBAY_COSTTM_V3.DOCX 5
TABLE 1
Process and Major Equipment Design Data Sheet, FPA Alternative 1- SBR Unit Process Parameter Note
Horsepower, ea 2.4
Blower Room (for SBR blowers and WAS Tank Blowers)
Blower Room Dimensions, ft 38 x 20
Electrical Room Dimensions, ft 24 x 7
Overall Dimensions, ft 44 x 24
WAS Storage Tank
Volume, MG 0.3
WAS Production, gpd 46814 Per ITT Calculations
Storage Duration, day 6.4
Mixing Air required, scfm 802 based on 20 scfm/1000 cf tank
Blowers
No. 1 + 1
Capacity, scfm, ea 800
hp, ea 40
Coarse Bubble Diffuser (Sanitaire D-24)
No. 27
Air flow per Diffuser 30
UV Disinfection
System Capacity, mgd 8.11
UV Dose, mJ/cm2 45
No. of Channels 2
No. of Banks/Channel 1
No. of Modules/Bank 15
No. of Lamps/Module 8
Total No. of Lamps 240
O&M Building
Footprint, sf 3000
Unit Cost, $/sf 251.5
Emergency Generator
Capacity, kw 200
Enclosure Sound Attenuation, Weather Proof
Operation Time, per year 24
Other Components Included in CPESTM
FINAL – COOS BAY WASTEWATER TREATMENT PLANT NO.2 UPGRADE COST ESTIMATE
6 COOSBAY_COSTTM_V3.DOCX
TABLE 1
Process and Major Equipment Design Data Sheet, FPA Alternative 1- SBR Unit Process Parameter Note
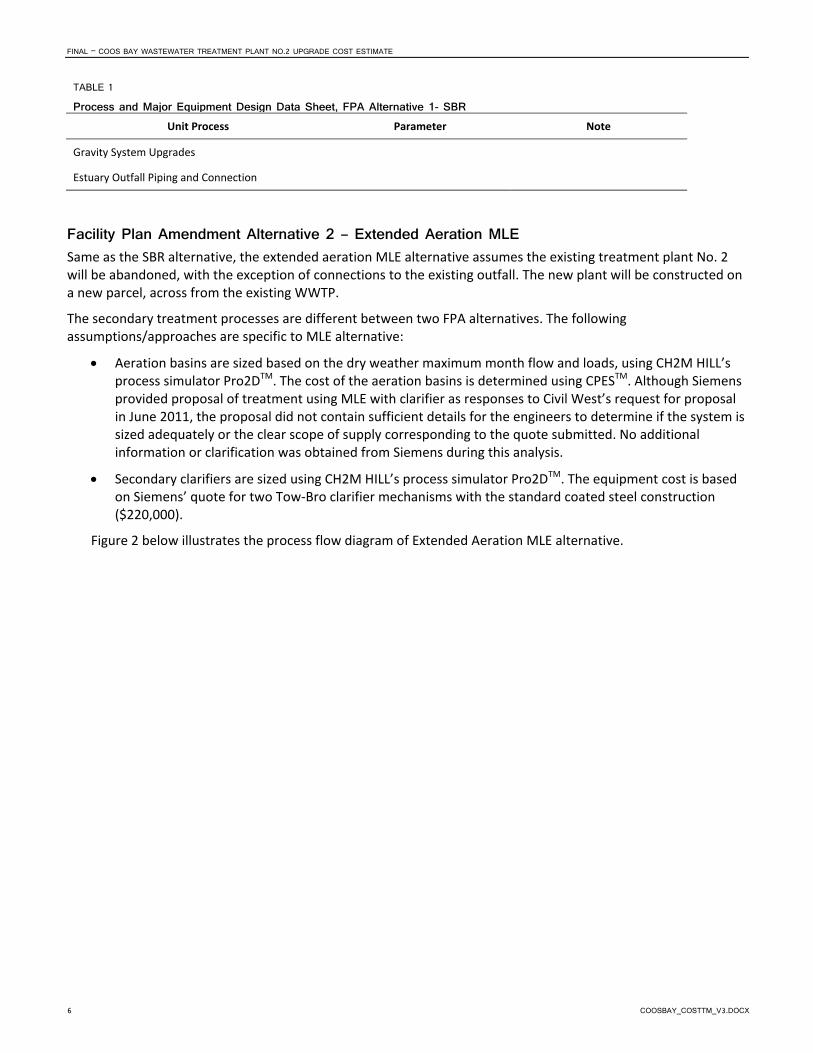
Gravity System Upgrades
Estuary Outfall Piping and Connection
Facility Plan Amendment Alternative 2 – Extended Aeration MLE Same as the SBR alternative, the extended aeration MLE alternative assumes the existing treatment plant No. 2 will be abandoned, with the exception of connections to the existing outfall. The new plant will be constructed on a new parcel, across from the existing WWTP.
The secondary treatment processes are different between two FPA alternatives. The following assumptions/approaches are specific to MLE alternative:
• Aeration basins are sized based on the dry weather maximum month flow and loads, using CH2M HILL’s process simulator Pro2DTM. The cost of the aeration basins is determined using CPESTM. Although Siemens provided proposal of treatment using MLE with clarifier as responses to Civil West’s request for proposal in June 2011, the proposal did not contain sufficient details for the engineers to determine if the system is sized adequately or the clear scope of supply corresponding to the quote submitted. No additional information or clarification was obtained from Siemens during this analysis.
• Secondary clarifiers are sized using CH2M HILL’s process simulator Pro2DTM. The equipment cost is based on Siemens’ quote for two Tow-Bro clarifier mechanisms with the standard coated steel construction ($220,000).
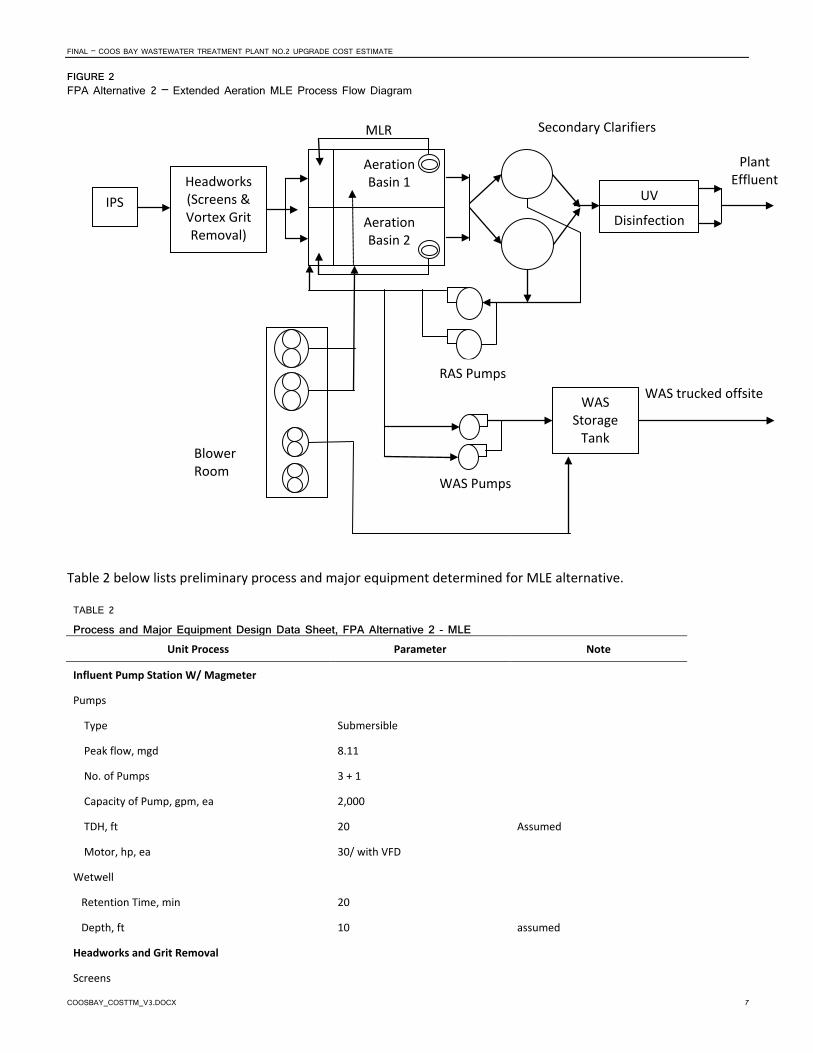
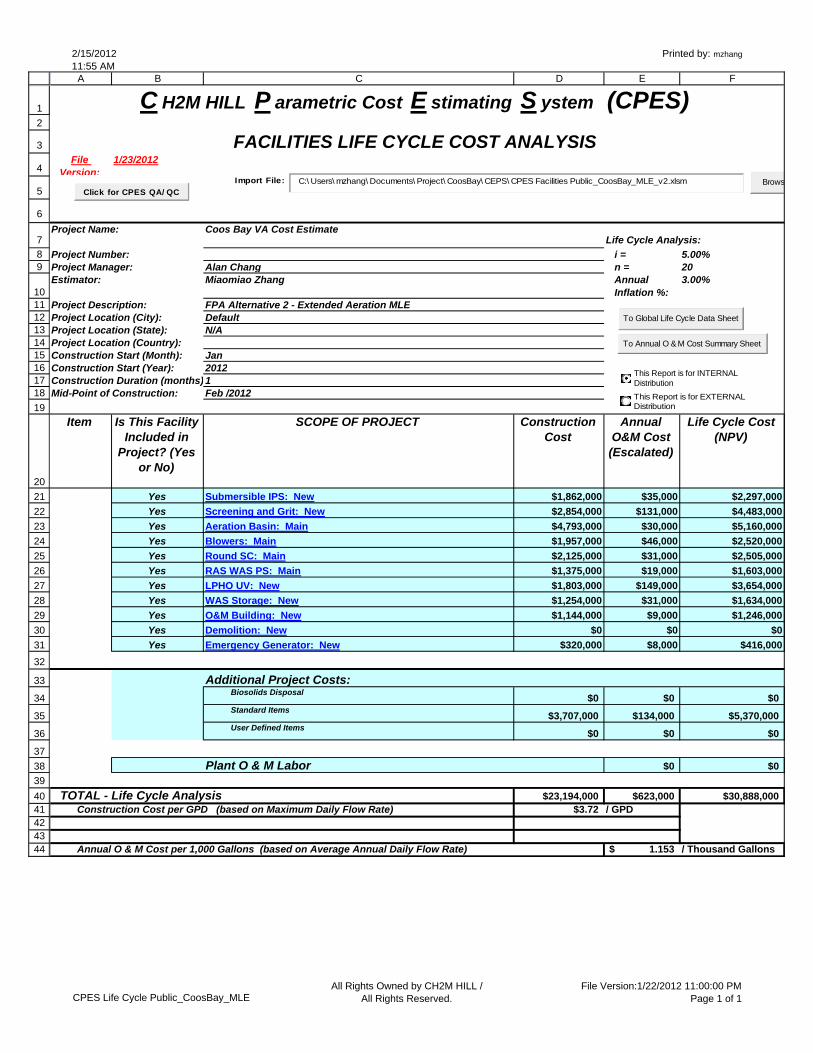
Figure 2 below illustrates the process flow diagram of Extended Aeration MLE alternative.
FINAL – COOS BAY WASTEWATER TREATMENT PLANT NO.2 UPGRADE COST ESTIMATE
COOSBAY_COSTTM_V3.DOCX 7
FIGURE 2 FPA Alternative 2 – Extended Aeration MLE Process Flow Diagram
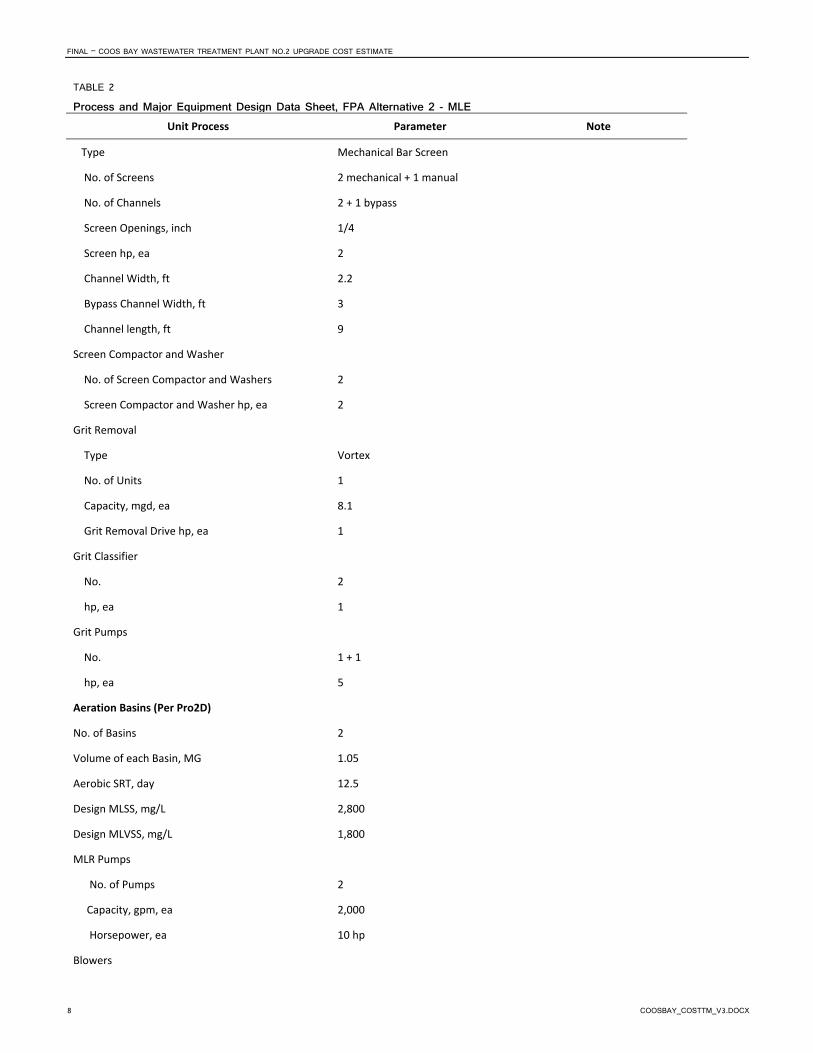
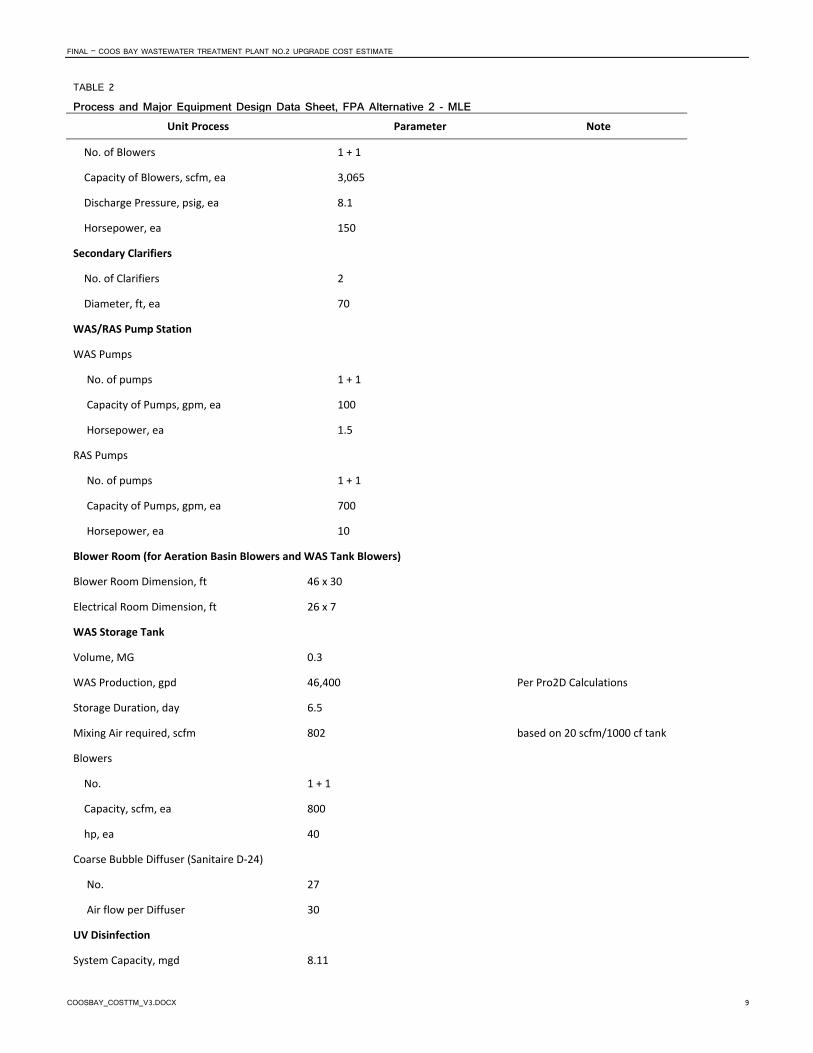
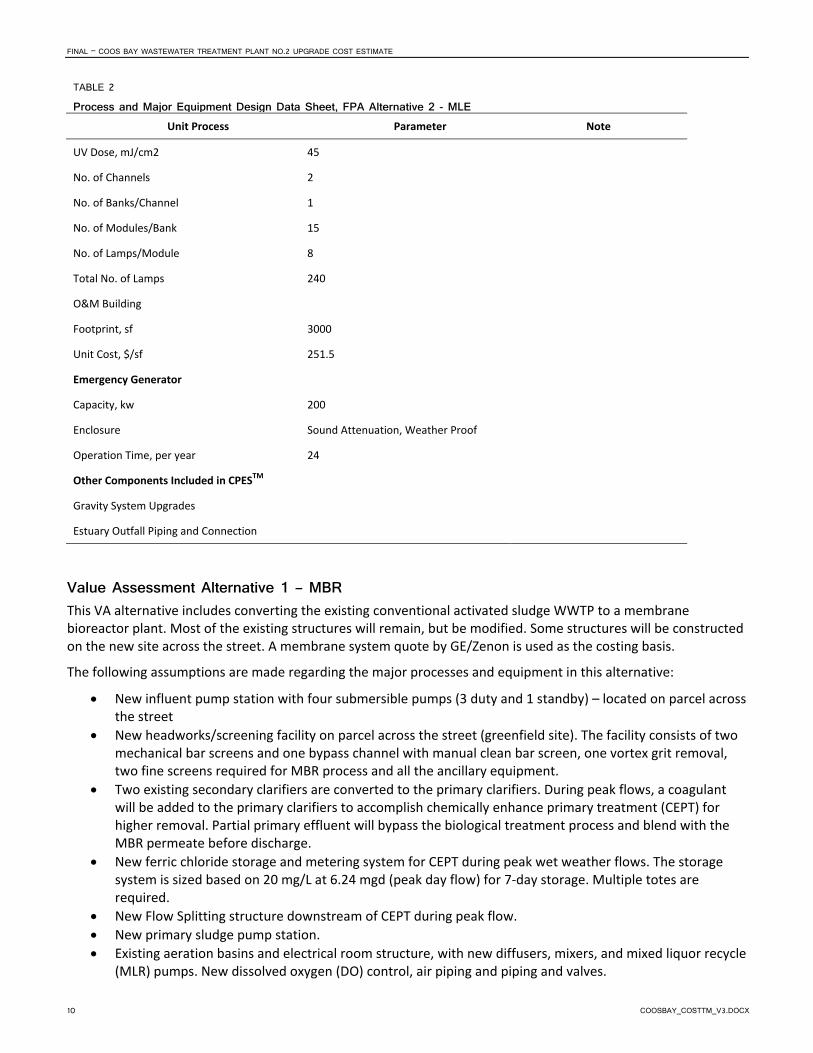
Table 2 below lists preliminary process and major equipment determined for MLE alternative.
TABLE 2
Process and Major Equipment Design Data Sheet, FPA Alternative 2 - MLE Unit Process Parameter Note
Influent Pump Station W/ Magmeter
Pumps
Type Submersible
Peak flow, mgd 8.11
No. of Pumps 3 + 1
Capacity of Pump, gpm, ea 2,000
TDH, ft 20 Assumed
Motor, hp, ea 30/ with VFD
Wetwell
Retention Time, min 20
Depth, ft 10 assumed
Headworks and Grit Removal
Screens
Aeration Basin 1
IPS Headworks (Screens & Vortex Grit Removal)
Aeration Basin 2
UV
Disinfection
WAS Storage
Tank Blower Room
WAS Pumps
WAS trucked offsite
Secondary Clarifiers
RAS Pumps
MLR
Plant Effluent
FINAL – COOS BAY WASTEWATER TREATMENT PLANT NO.2 UPGRADE COST ESTIMATE
8 COOSBAY_COSTTM_V3.DOCX
TABLE 2
Process and Major Equipment Design Data Sheet, FPA Alternative 2 - MLE Unit Process Parameter Note
Type Mechanical Bar Screen
No. of Screens 2 mechanical + 1 manual
No. of Channels 2 + 1 bypass
Screen Openings, inch 1/4
Screen hp, ea 2
Channel Width, ft 2.2
Bypass Channel Width, ft 3
Channel length, ft 9
Screen Compactor and Washer
No. of Screen Compactor and Washers 2
Screen Compactor and Washer hp, ea 2
Grit Removal
Type Vortex
No. of Units 1
Capacity, mgd, ea 8.1
Grit Removal Drive hp, ea 1
Grit Classifier
No. 2
hp, ea 1
Grit Pumps
No. 1 + 1
hp, ea 5
Aeration Basins (Per Pro2D)
No. of Basins 2
Volume of each Basin, MG 1.05
Aerobic SRT, day 12.5
Design MLSS, mg/L 2,800
Design MLVSS, mg/L 1,800
MLR Pumps
No. of Pumps 2
Capacity, gpm, ea 2,000
Horsepower, ea 10 hp
Blowers
FINAL – COOS BAY WASTEWATER TREATMENT PLANT NO.2 UPGRADE COST ESTIMATE
COOSBAY_COSTTM_V3.DOCX 9
TABLE 2
Process and Major Equipment Design Data Sheet, FPA Alternative 2 - MLE Unit Process Parameter Note
No. of Blowers 1 + 1
Capacity of Blowers, scfm, ea 3,065
Discharge Pressure, psig, ea 8.1
Horsepower, ea 150
Secondary Clarifiers
No. of Clarifiers 2
Diameter, ft, ea 70
WAS/RAS Pump Station
WAS Pumps
No. of pumps 1 + 1
Capacity of Pumps, gpm, ea 100
Horsepower, ea 1.5
RAS Pumps
No. of pumps 1 + 1
Capacity of Pumps, gpm, ea 700
Horsepower, ea 10
Blower Room (for Aeration Basin Blowers and WAS Tank Blowers)
Blower Room Dimension, ft 46 x 30
Electrical Room Dimension, ft 26 x 7
WAS Storage Tank
Volume, MG 0.3
WAS Production, gpd 46,400 Per Pro2D Calculations
Storage Duration, day 6.5
Mixing Air required, scfm 802 based on 20 scfm/1000 cf tank
Blowers
No. 1 + 1
Capacity, scfm, ea 800
hp, ea 40
Coarse Bubble Diffuser (Sanitaire D-24)
No. 27
Air flow per Diffuser 30
UV Disinfection
System Capacity, mgd 8.11
FINAL – COOS BAY WASTEWATER TREATMENT PLANT NO.2 UPGRADE COST ESTIMATE
10 COOSBAY_COSTTM_V3.DOCX
TABLE 2
Process and Major Equipment Design Data Sheet, FPA Alternative 2 - MLE Unit Process Parameter Note
UV Dose, mJ/cm2 45
No. of Channels 2
No. of Banks/Channel 1
No. of Modules/Bank 15
No. of Lamps/Module 8
Total No. of Lamps 240
O&M Building
Footprint, sf 3000
Unit Cost, $/sf 251.5
Emergency Generator
Capacity, kw 200
Enclosure Sound Attenuation, Weather Proof
Operation Time, per year 24
Other Components Included in CPESTM
Gravity System Upgrades
Estuary Outfall Piping and Connection
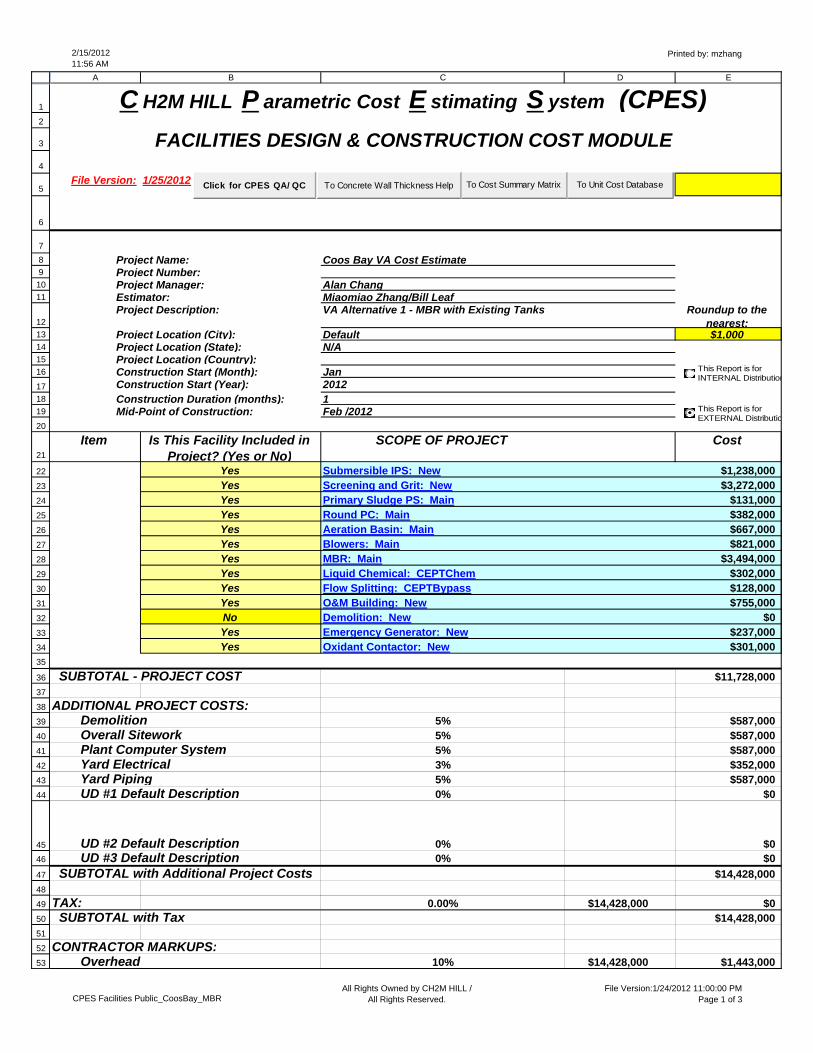
Value Assessment Alternative 1 – MBR This VA alternative includes converting the existing conventional activated sludge WWTP to a membrane bioreactor plant. Most of the existing structures will remain, but be modified. Some structures will be constructed on the new site across the street. A membrane system quote by GE/Zenon is used as the costing basis.
The following assumptions are made regarding the major processes and equipment in this alternative:
• New influent pump station with four submersible pumps (3 duty and 1 standby) – located on parcel across the street
• New headworks/screening facility on parcel across the street (greenfield site). The facility consists of two mechanical bar screens and one bypass channel with manual clean bar screen, one vortex grit removal, two fine screens required for MBR process and all the ancillary equipment.
• Two existing secondary clarifiers are converted to the primary clarifiers. During peak flows, a coagulant will be added to the primary clarifiers to accomplish chemically enhance primary treatment (CEPT) for higher removal. Partial primary effluent will bypass the biological treatment process and blend with the MBR permeate before discharge.
• New ferric chloride storage and metering system for CEPT during peak wet weather flows. The storage system is sized based on 20 mg/L at 6.24 mgd (peak day flow) for 7-day storage. Multiple totes are required.
• New Flow Splitting structure downstream of CEPT during peak flow. • New primary sludge pump station. • Existing aeration basins and electrical room structure, with new diffusers, mixers, and mixed liquor recycle
(MLR) pumps. New dissolved oxygen (DO) control, air piping and piping and valves.
FINAL – COOS BAY WASTEWATER TREATMENT PLANT NO.2 UPGRADE COST ESTIMATE
COOSBAY_COSTTM_V3.DOCX 11
• Three new aeration blowers (2 duty and 1 standby) are installed in the membrane building blower room. • Three new membrane tanks are constructed with the ancillaries, i.e. the new membrane feed pumps,
chemical cleaning system and chemical storage & metering pumps. GE/Zenon’s scope includes membrane cassettes, membrane blowers, permeate and backpulse pumps, headers and chemical feed system.
• The cost for retrofitting the existing primary clarifier to a new chlorine contact chamber is proposed and included in the cost estimate, but refinements of this alternative could modify this approach.
• As with all other alternatives, a 3,000-sqft new Administration/O&M building is constructed. • As with all other alternatives, a new emergency generator is installed onsite. For MBR alternative, the
generator capacity is 250 kw as opposed to 200 kw assumed for other three alternatives due to the higher power requirement of MBR system.
• As with all other alternatives, no odor control is included. This should be evaluated in detail as the project progresses. It may be warranted to have odor control on the new parcel for the headworks facility.
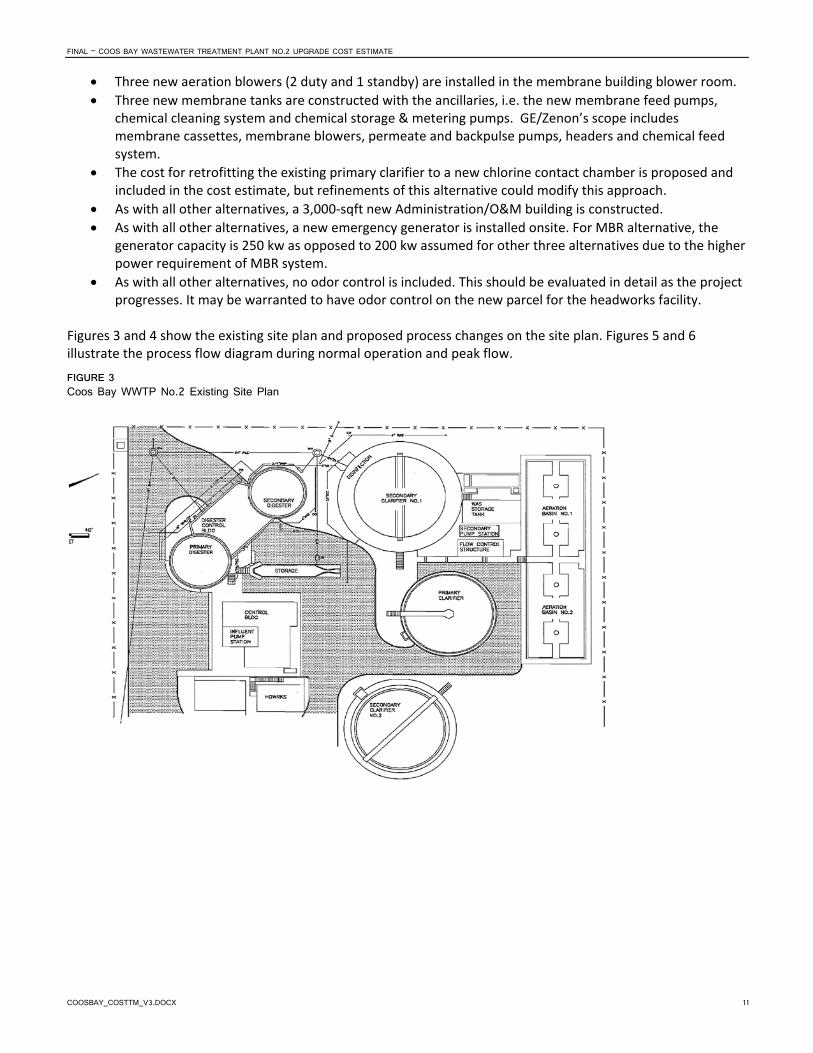
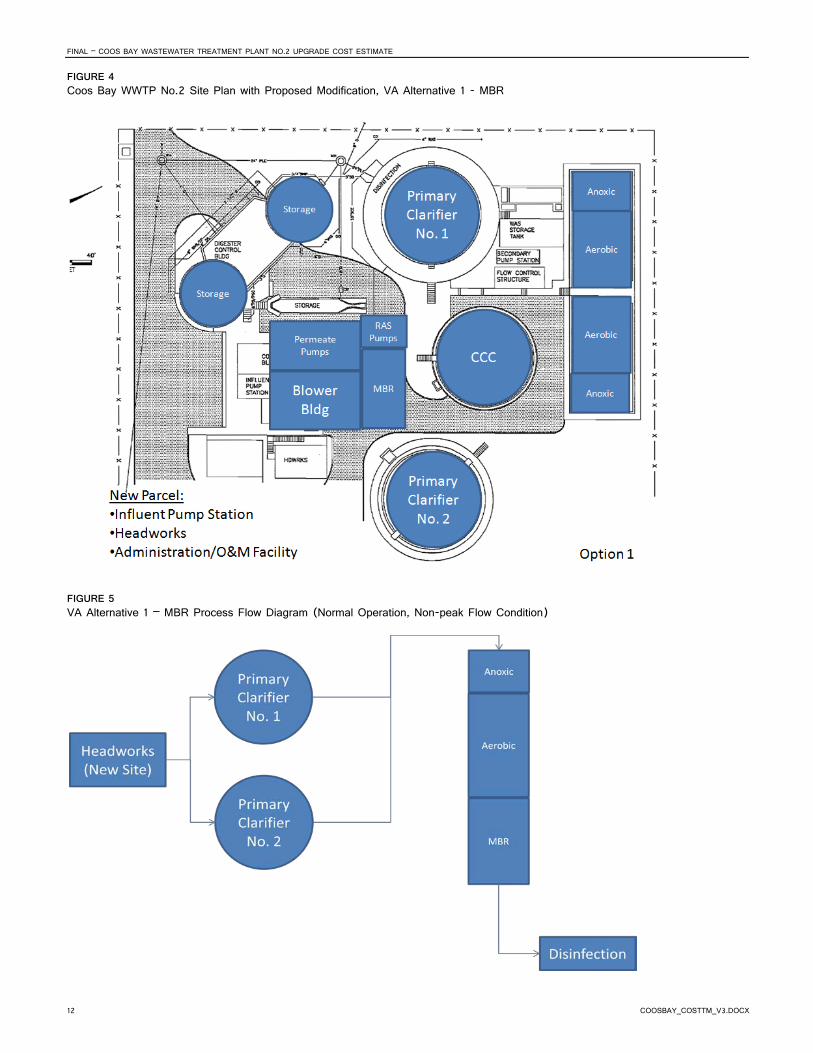
Figures 3 and 4 show the existing site plan and proposed process changes on the site plan. Figures 5 and 6 illustrate the process flow diagram during normal operation and peak flow.
FIGURE 3 Coos Bay WWTP No.2 Existing Site Plan
FINAL – COOS BAY WASTEWATER TREATMENT PLANT NO.2 UPGRADE COST ESTIMATE
12 COOSBAY_COSTTM_V3.DOCX
FIGURE 4 Coos Bay WWTP No.2 Site Plan with Proposed Modification, VA Alternative 1 - MBR
FIGURE 5 VA Alternative 1 – MBR Process Flow Diagram (Normal Operation, Non-peak Flow Condition)
FINAL – COOS BAY WASTEWATER TREATMENT PLANT NO.2 UPGRADE COST ESTIMATE
COOSBAY_COSTTM_V3.DOCX 13
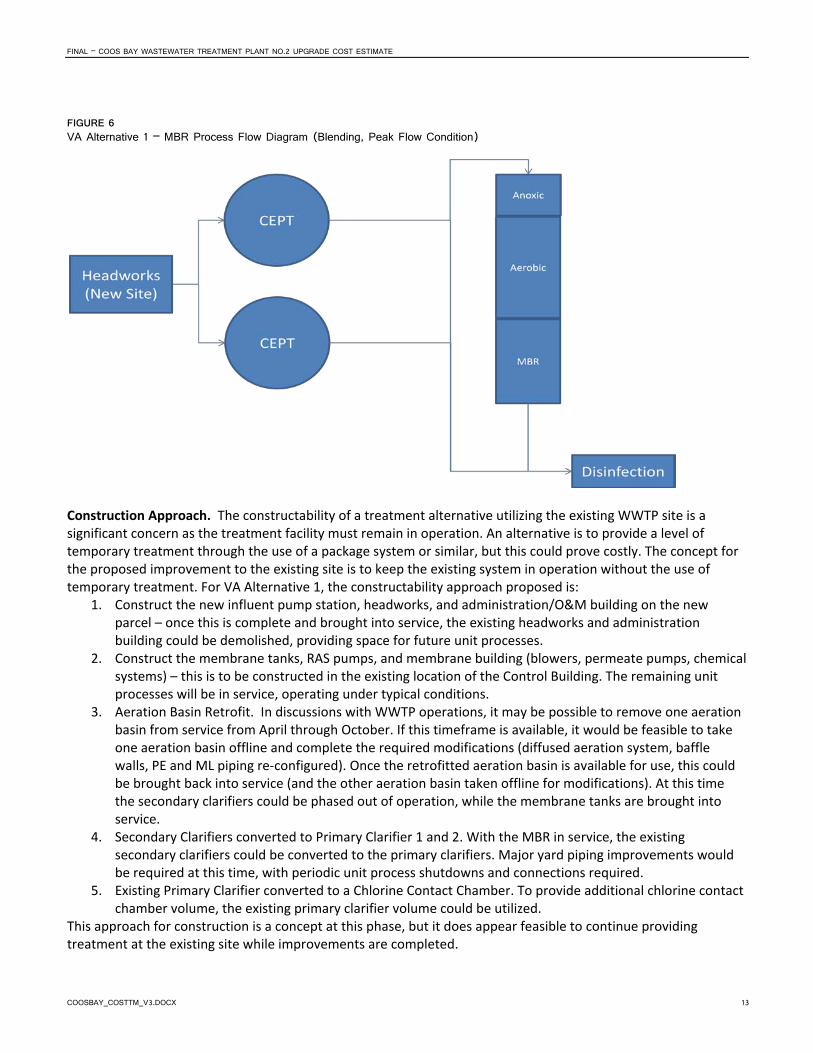
FIGURE 6 VA Alternative 1 – MBR Process Flow Diagram (Blending, Peak Flow Condition)
Construction Approach. The constructability of a treatment alternative utilizing the existing WWTP site is a significant concern as the treatment facility must remain in operation. An alternative is to provide a level of temporary treatment through the use of a package system or similar, but this could prove costly. The concept for the proposed improvement to the existing site is to keep the existing system in operation without the use of temporary treatment. For VA Alternative 1, the constructability approach proposed is:
1. Construct the new influent pump station, headworks, and administration/O&M building on the new parcel – once this is complete and brought into service, the existing headworks and administration building could be demolished, providing space for future unit processes.
2. Construct the membrane tanks, RAS pumps, and membrane building (blowers, permeate pumps, chemical systems) – this is to be constructed in the existing location of the Control Building. The remaining unit processes will be in service, operating under typical conditions.
3. Aeration Basin Retrofit. In discussions with WWTP operations, it may be possible to remove one aeration basin from service from April through October. If this timeframe is available, it would be feasible to take one aeration basin offline and complete the required modifications (diffused aeration system, baffle walls, PE and ML piping re-configured). Once the retrofitted aeration basin is available for use, this could be brought back into service (and the other aeration basin taken offline for modifications). At this time the secondary clarifiers could be phased out of operation, while the membrane tanks are brought into service.
4. Secondary Clarifiers converted to Primary Clarifier 1 and 2. With the MBR in service, the existing secondary clarifiers could be converted to the primary clarifiers. Major yard piping improvements would be required at this time, with periodic unit process shutdowns and connections required.
5. Existing Primary Clarifier converted to a Chlorine Contact Chamber. To provide additional chlorine contact chamber volume, the existing primary clarifier volume could be utilized.
This approach for construction is a concept at this phase, but it does appear feasible to continue providing treatment at the existing site while improvements are completed.
FINAL – COOS BAY WASTEWATER TREATMENT PLANT NO.2 UPGRADE COST ESTIMATE
14 COOSBAY_COSTTM_V3.DOCX
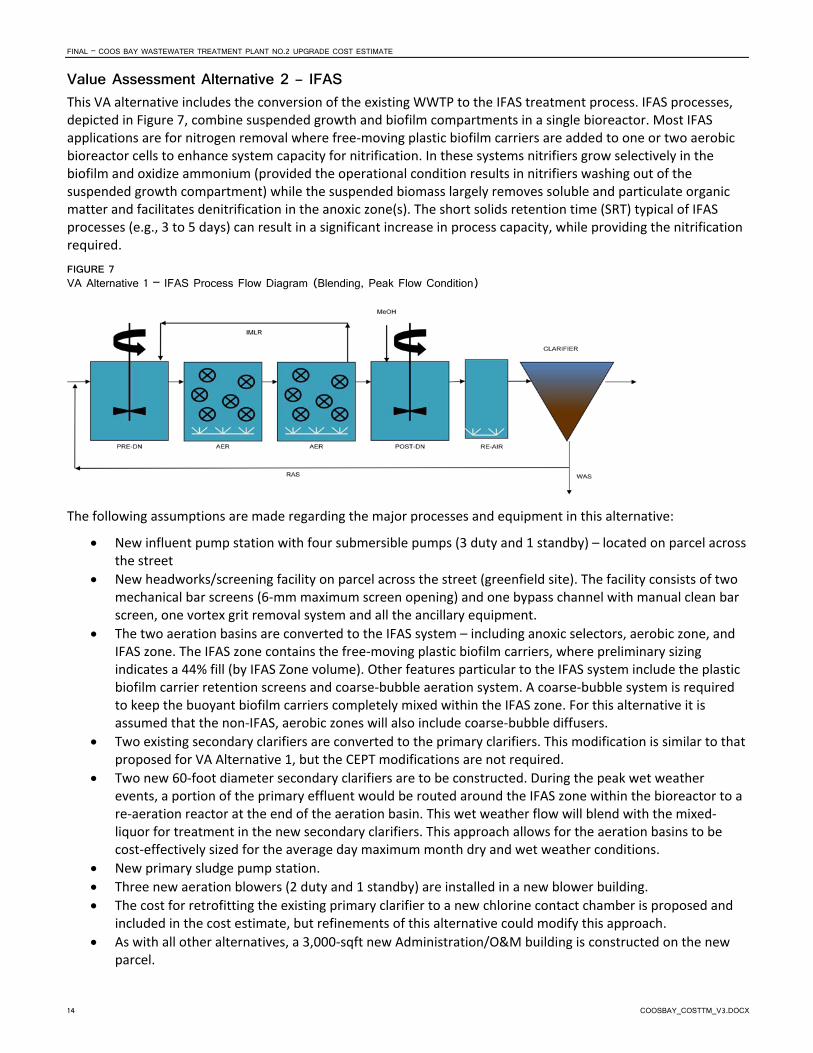
Value Assessment Alternative 2 – IFAS This VA alternative includes the conversion of the existing WWTP to the IFAS treatment process. IFAS processes, depicted in Figure 7, combine suspended growth and biofilm compartments in a single bioreactor. Most IFAS applications are for nitrogen removal where free-moving plastic biofilm carriers are added to one or two aerobic bioreactor cells to enhance system capacity for nitrification. In these systems nitrifiers grow selectively in the biofilm and oxidize ammonium (provided the operational condition results in nitrifiers washing out of the suspended growth compartment) while the suspended biomass largely removes soluble and particulate organic matter and facilitates denitrification in the anoxic zone(s). The short solids retention time (SRT) typical of IFAS processes (e.g., 3 to 5 days) can result in a significant increase in process capacity, while providing the nitrification required.
FIGURE 7 VA Alternative 1 – IFAS Process Flow Diagram (Blending, Peak Flow Condition)
The following assumptions are made regarding the major processes and equipment in this alternative:
• New influent pump station with four submersible pumps (3 duty and 1 standby) – located on parcel across the street
• New headworks/screening facility on parcel across the street (greenfield site). The facility consists of two mechanical bar screens (6-mm maximum screen opening) and one bypass channel with manual clean bar screen, one vortex grit removal system and all the ancillary equipment.
• The two aeration basins are converted to the IFAS system – including anoxic selectors, aerobic zone, and IFAS zone. The IFAS zone contains the free-moving plastic biofilm carriers, where preliminary sizing indicates a 44% fill (by IFAS Zone volume). Other features particular to the IFAS system include the plastic biofilm carrier retention screens and coarse-bubble aeration system. A coarse-bubble system is required to keep the buoyant biofilm carriers completely mixed within the IFAS zone. For this alternative it is assumed that the non-IFAS, aerobic zones will also include coarse-bubble diffusers.
• Two existing secondary clarifiers are converted to the primary clarifiers. This modification is similar to that proposed for VA Alternative 1, but the CEPT modifications are not required.
• Two new 60-foot diameter secondary clarifiers are to be constructed. During the peak wet weather events, a portion of the primary effluent would be routed around the IFAS zone within the bioreactor to a re-aeration reactor at the end of the aeration basin. This wet weather flow will blend with the mixed-liquor for treatment in the new secondary clarifiers. This approach allows for the aeration basins to be cost-effectively sized for the average day maximum month dry and wet weather conditions.
• New primary sludge pump station. • Three new aeration blowers (2 duty and 1 standby) are installed in a new blower building. • The cost for retrofitting the existing primary clarifier to a new chlorine contact chamber is proposed and
included in the cost estimate, but refinements of this alternative could modify this approach. • As with all other alternatives, a 3,000-sqft new Administration/O&M building is constructed on the new
parcel.
FINAL – COOS BAY WASTEWATER TREATMENT PLANT NO.2 UPGRADE COST ESTIMATE
COOSBAY_COSTTM_V3.DOCX 15
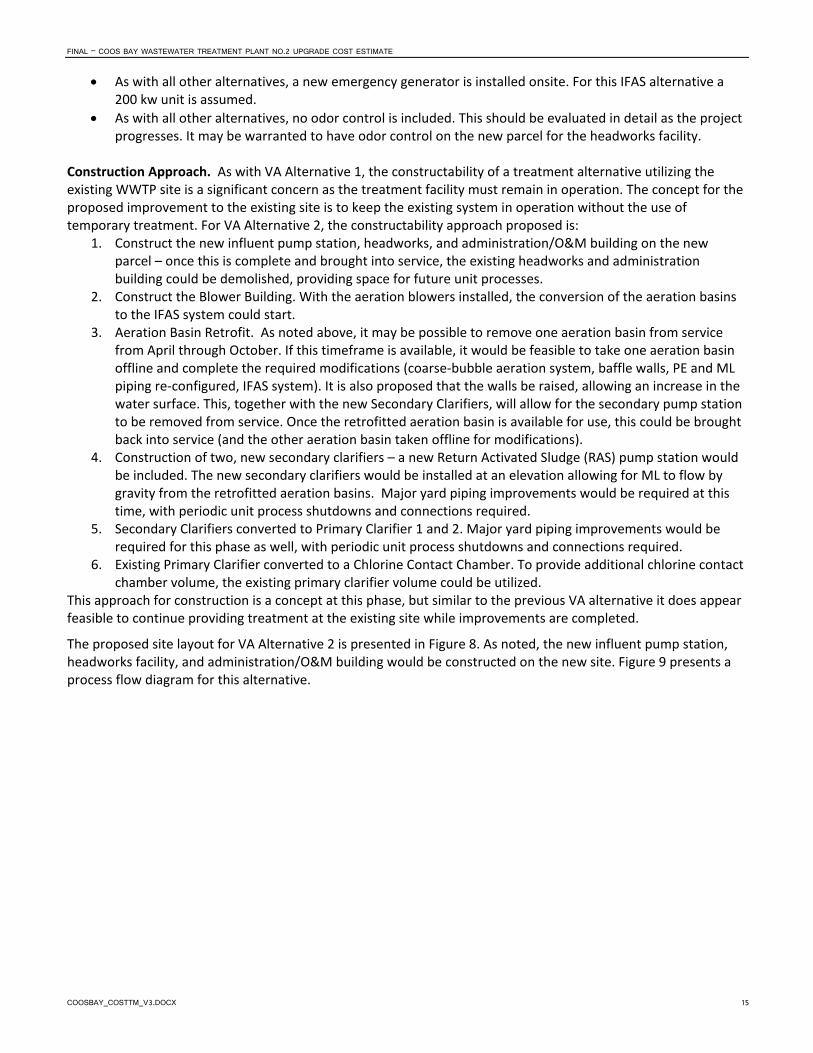
• As with all other alternatives, a new emergency generator is installed onsite. For this IFAS alternative a 200 kw unit is assumed.
• As with all other alternatives, no odor control is included. This should be evaluated in detail as the project progresses. It may be warranted to have odor control on the new parcel for the headworks facility.
Construction Approach. As with VA Alternative 1, the constructability of a treatment alternative utilizing the existing WWTP site is a significant concern as the treatment facility must remain in operation. The concept for the proposed improvement to the existing site is to keep the existing system in operation without the use of temporary treatment. For VA Alternative 2, the constructability approach proposed is:
1. Construct the new influent pump station, headworks, and administration/O&M building on the new parcel – once this is complete and brought into service, the existing headworks and administration building could be demolished, providing space for future unit processes.
2. Construct the Blower Building. With the aeration blowers installed, the conversion of the aeration basins to the IFAS system could start.
3. Aeration Basin Retrofit. As noted above, it may be possible to remove one aeration basin from service from April through October. If this timeframe is available, it would be feasible to take one aeration basin offline and complete the required modifications (coarse-bubble aeration system, baffle walls, PE and ML piping re-configured, IFAS system). It is also proposed that the walls be raised, allowing an increase in the water surface. This, together with the new Secondary Clarifiers, will allow for the secondary pump station to be removed from service. Once the retrofitted aeration basin is available for use, this could be brought back into service (and the other aeration basin taken offline for modifications).
4. Construction of two, new secondary clarifiers – a new Return Activated Sludge (RAS) pump station would be included. The new secondary clarifiers would be installed at an elevation allowing for ML to flow by gravity from the retrofitted aeration basins. Major yard piping improvements would be required at this time, with periodic unit process shutdowns and connections required.
5. Secondary Clarifiers converted to Primary Clarifier 1 and 2. Major yard piping improvements would be required for this phase as well, with periodic unit process shutdowns and connections required.
6. Existing Primary Clarifier converted to a Chlorine Contact Chamber. To provide additional chlorine contact chamber volume, the existing primary clarifier volume could be utilized.
This approach for construction is a concept at this phase, but similar to the previous VA alternative it does appear feasible to continue providing treatment at the existing site while improvements are completed.
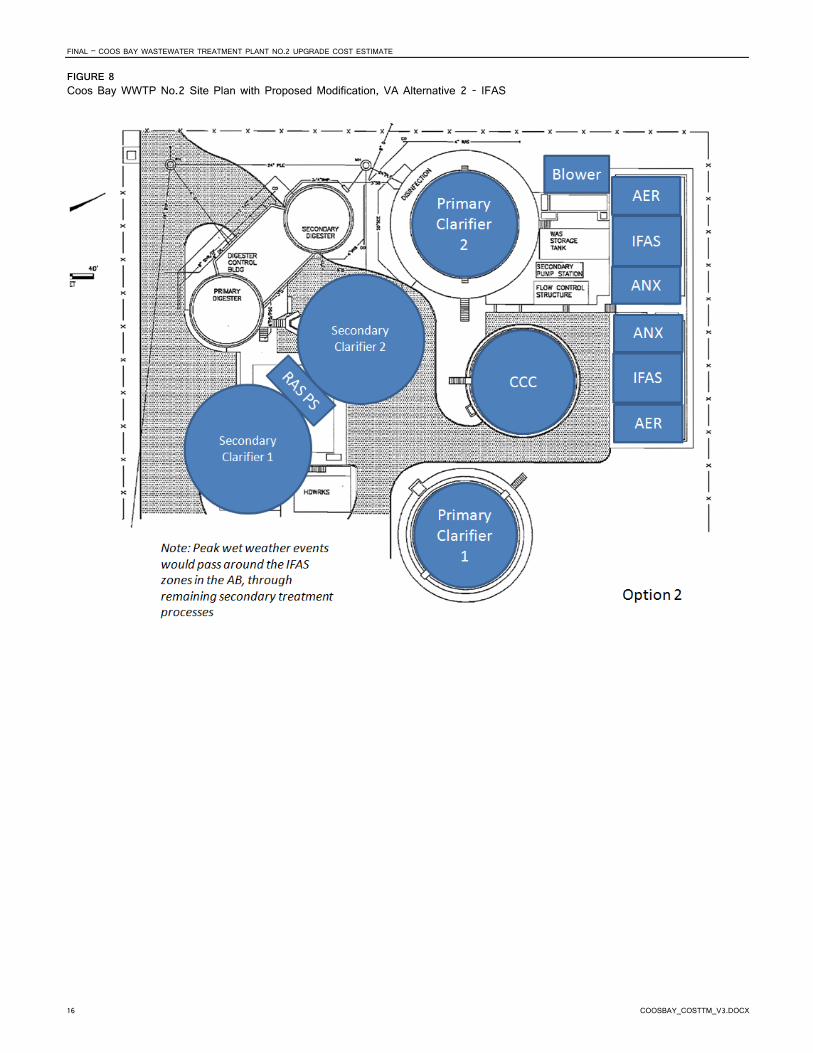
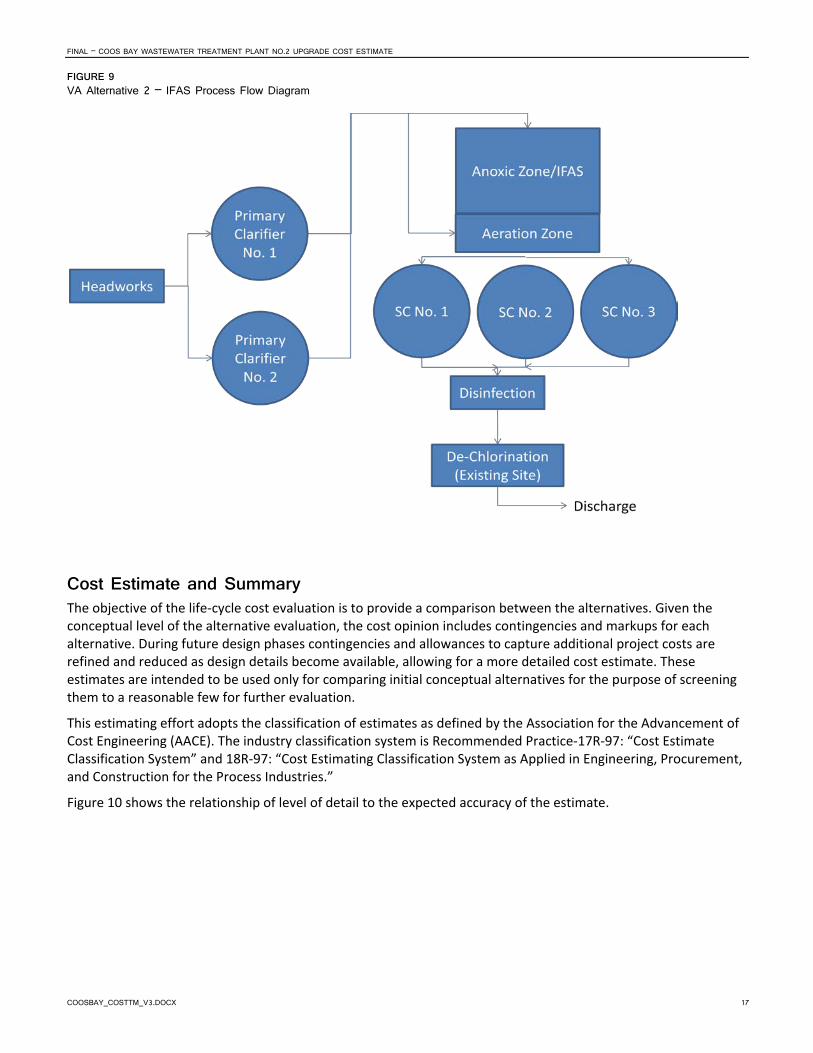
The proposed site layout for VA Alternative 2 is presented in Figure 8. As noted, the new influent pump station, headworks facility, and administration/O&M building would be constructed on the new site. Figure 9 presents a process flow diagram for this alternative.
FINAL – COOS BAY WASTEWATER TREATMENT PLANT NO.2 UPGRADE COST ESTIMATE
16 COOSBAY_COSTTM_V3.DOCX
FIGURE 8 Coos Bay WWTP No.2 Site Plan with Proposed Modification, VA Alternative 2 - IFAS
FINAL – COOS BAY WASTEWATER TREATMENT PLANT NO.2 UPGRADE COST ESTIMATE
COOSBAY_COSTTM_V3.DOCX 17
FIGURE 9 VA Alternative 2 – IFAS Process Flow Diagram
Cost Estimate and Summary The objective of the life-cycle cost evaluation is to provide a comparison between the alternatives. Given the conceptual level of the alternative evaluation, the cost opinion includes contingencies and markups for each alternative. During future design phases contingencies and allowances to capture additional project costs are refined and reduced as design details become available, allowing for a more detailed cost estimate. These estimates are intended to be used only for comparing initial conceptual alternatives for the purpose of screening them to a reasonable few for further evaluation.
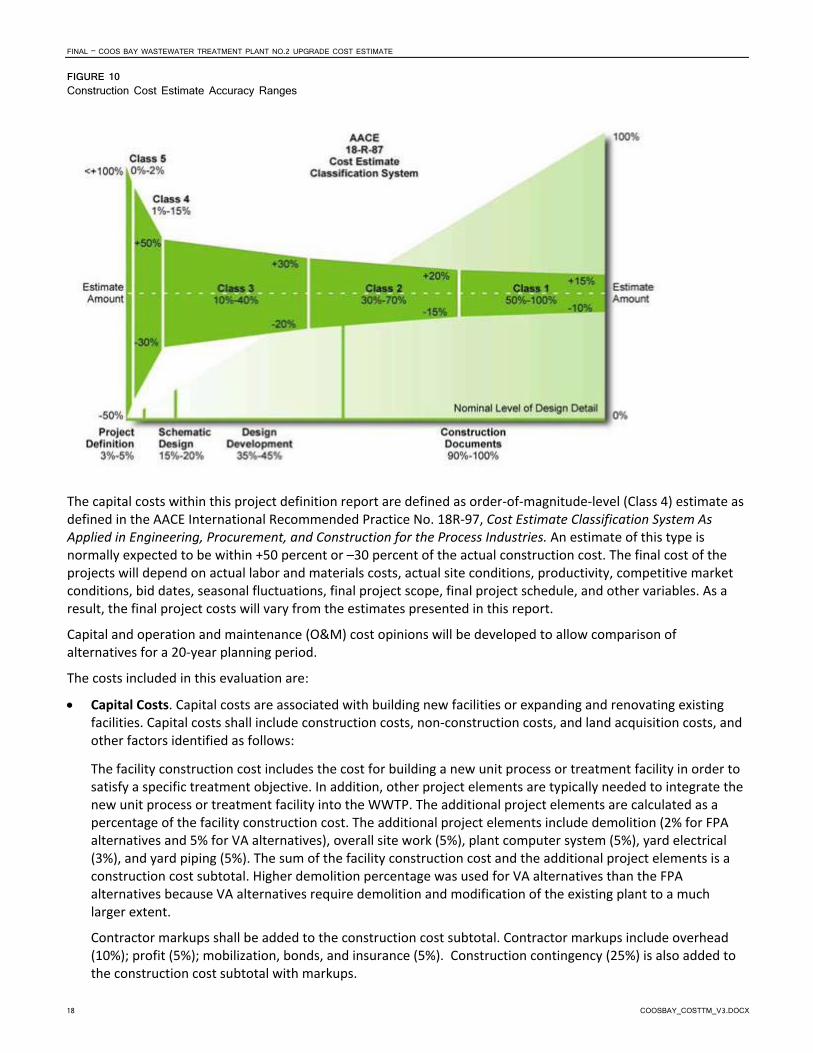
This estimating effort adopts the classification of estimates as defined by the Association for the Advancement of Cost Engineering (AACE). The industry classification system is Recommended Practice-17R-97: “Cost Estimate Classification System” and 18R-97: “Cost Estimating Classification System as Applied in Engineering, Procurement, and Construction for the Process Industries.”
Figure 10 shows the relationship of level of detail to the expected accuracy of the estimate.
FINAL – COOS BAY WASTEWATER TREATMENT PLANT NO.2 UPGRADE COST ESTIMATE
18 COOSBAY_COSTTM_V3.DOCX
FIGURE 10 Construction Cost Estimate Accuracy Ranges
The capital costs within this project definition report are defined as order-of-magnitude-level (Class 4) estimate as defined in the AACE International Recommended Practice No. 18R-97, Cost Estimate Classification System As Applied in Engineering, Procurement, and Construction for the Process Industries. An estimate of this type is normally expected to be within +50 percent or –30 percent of the actual construction cost. The final cost of the projects will depend on actual labor and materials costs, actual site conditions, productivity, competitive market conditions, bid dates, seasonal fluctuations, final project scope, final project schedule, and other variables. As a result, the final project costs will vary from the estimates presented in this report.
Capital and operation and maintenance (O&M) cost opinions will be developed to allow comparison of alternatives for a 20-year planning period.
The costs included in this evaluation are:
• Capital Costs. Capital costs are associated with building new facilities or expanding and renovating existing facilities. Capital costs shall include construction costs, non-construction costs, and land acquisition costs, and other factors identified as follows:
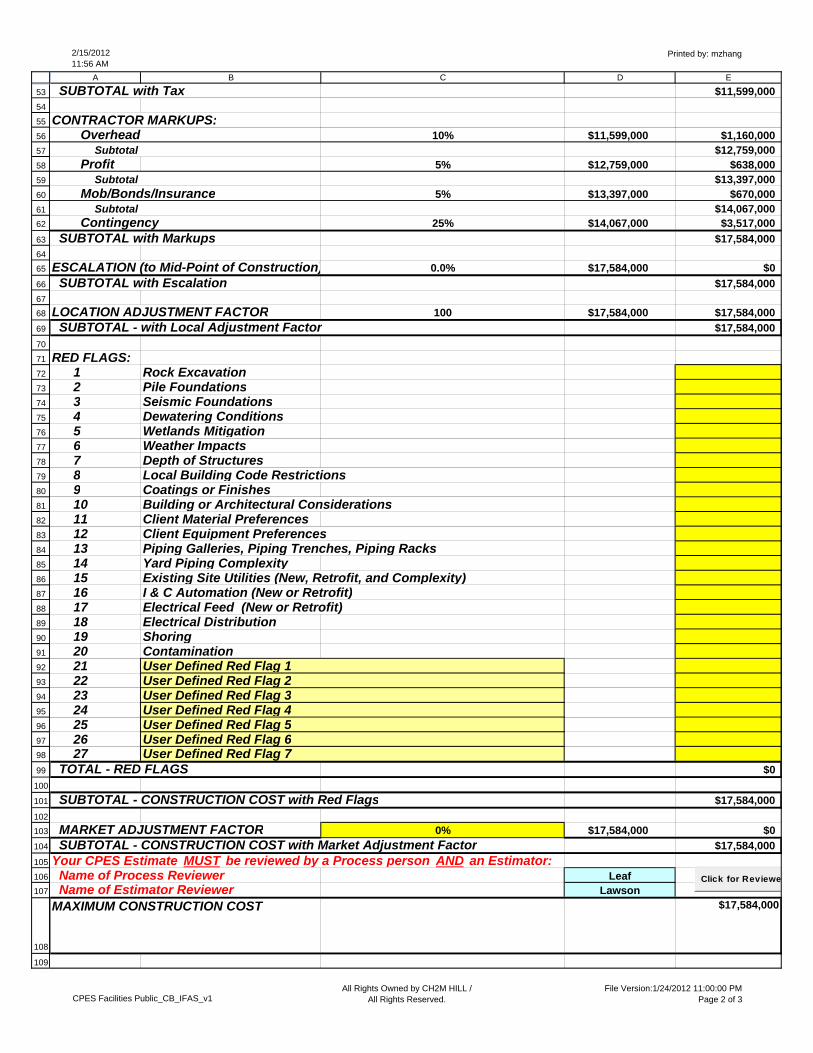
The facility construction cost includes the cost for building a new unit process or treatment facility in order to satisfy a specific treatment objective. In addition, other project elements are typically needed to integrate the new unit process or treatment facility into the WWTP. The additional project elements are calculated as a percentage of the facility construction cost. The additional project elements include demolition (2% for FPA alternatives and 5% for VA alternatives), overall site work (5%), plant computer system (5%), yard electrical (3%), and yard piping (5%). The sum of the facility construction cost and the additional project elements is a construction cost subtotal. Higher demolition percentage was used for VA alternatives than the FPA alternatives because VA alternatives require demolition and modification of the existing plant to a much larger extent.
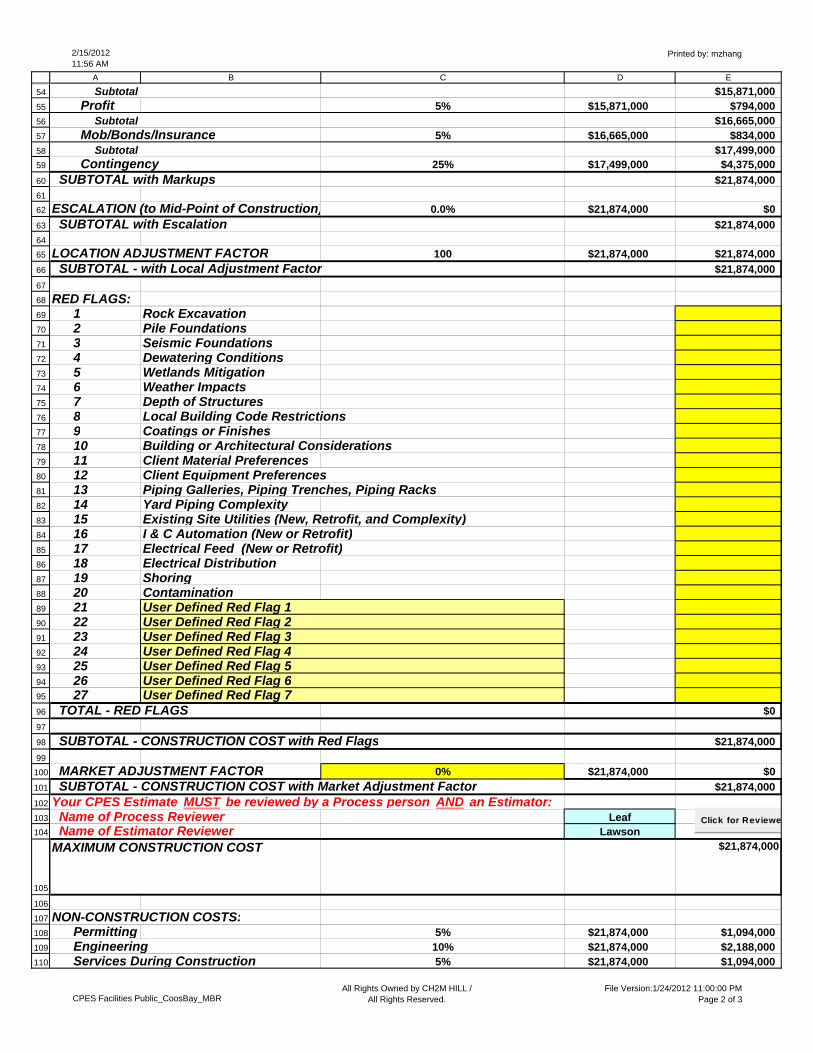
Contractor markups shall be added to the construction cost subtotal. Contractor markups include overhead (10%); profit (5%); mobilization, bonds, and insurance (5%). Construction contingency (25%) is also added to the construction cost subtotal with markups.
FINAL – COOS BAY WASTEWATER TREATMENT PLANT NO.2 UPGRADE COST ESTIMATE
COOSBAY_COSTTM_V3.DOCX 19
In addition to construction costs, an allowance for non-construction costs shall be provided. The non-construction cost allowance is calculated as percentage of the construction cost subtotal with the contractor markups. For this evaluation an allowance for permitting/admin (5%); engineering (10%), services during construction (5%); commissioning and start-up (5%) are included as non-construction costs. (25% total)
Land Acquisition costs are assumed to be zero for the WWTP as the City owns all existing property required.
For this evaluation all capital costs are based on January 2012 dollars. An escalation factor to adjust the construction cost subtotal to the mid-point of construction in order to properly budget and account for inflation that may occur during planning, design, and construction of the project should be included once the project is better defined. Current economic conditions have resulted in a very competitive bid environment that has the effect of lowering contractor bid prices. CH2M HILL anticipates construction costs to be higher in Coos Bay, Oregon, but expects the current competitive bid environment to offset the higher costs. Therefore, there is no net effect on the overall construction cost estimates presented.
• Operation and Maintenance Costs. O&M costs are associated with the daily requirements for maintaining and operating the wastewater treatment facilities. O&M costs include labor, power, chemicals, equipment maintenance, and equipment replacement. An additional increment of O&M costs are estimated for each alternative and presented in 2012 dollars for the first year and then escalated based on the inflation rate for 20 years. A 20-percent contingency is added to obtain the total estimated incremental O&M costs. The incremental O&M costs are increased each year by 3 percent. For this evaluation the O&M costs are based on the following factors:
- Labor: no additional labor is planned for the four alternatives evaluated
- Power: $0.082/kilowatt-hour (includes usage, demand, and transmission charges)
- Ferric chloride used in CEPT is approximately 40 mg/L for four month per year in winter. Ferric Chloride (40 percent solution): $372/dry ton
- Equipment Maintenance Materials: Figured as a percentage of the initial capital cost (2% finishes, 1% equipment, 0.1% mechanical, and 1% electrical)
• Life-cycle Cost. The life-cycle cost analysis converts all expenditures that occur during the project into a single equivalent present value sum at the time of the analysis. Thus, the streams of expenditures associated with each alternative can be compared on the same basis.
It is assumed that the construction can be financed at an annual discount rate of 5 percent per year, and inflation is about 3 percent per year. The real value of money is the discount rate less the inflation rate, or about 2 percent per year.
The life-cycle cost is defined as the following, where Pw is the present worth: Life Cycle Cost = Pw
(Construction Cost) + Pw (Operation and Maintenance Cost).
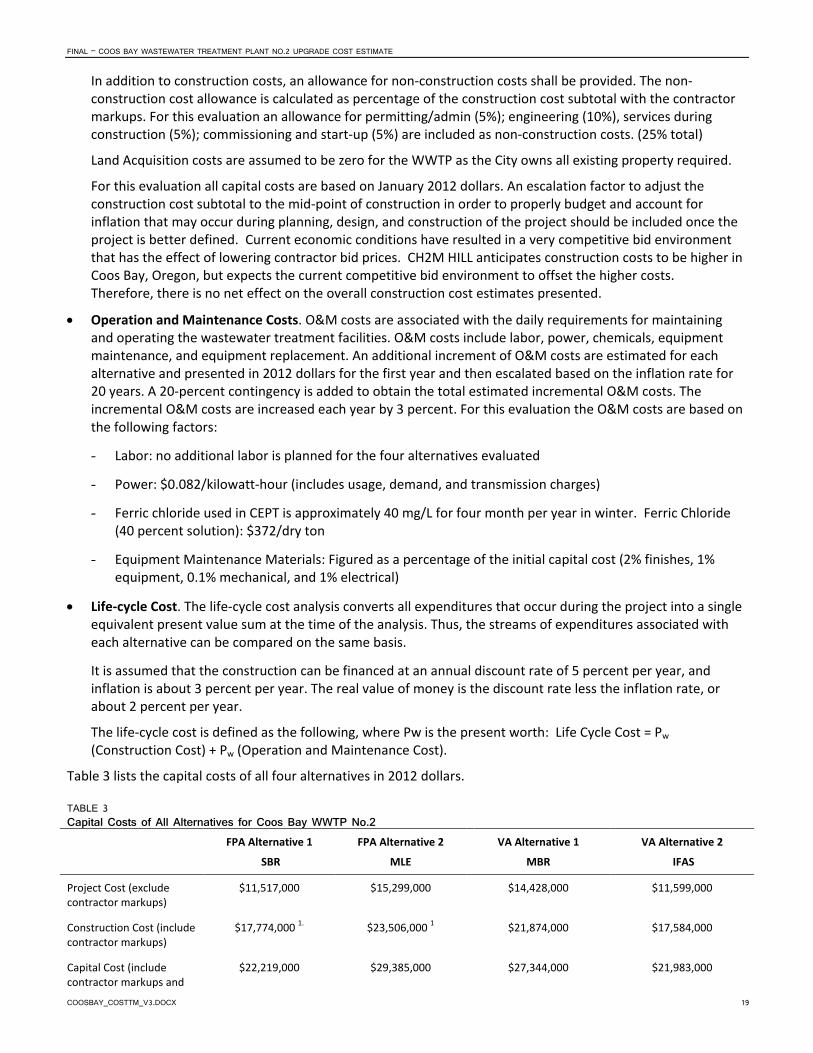
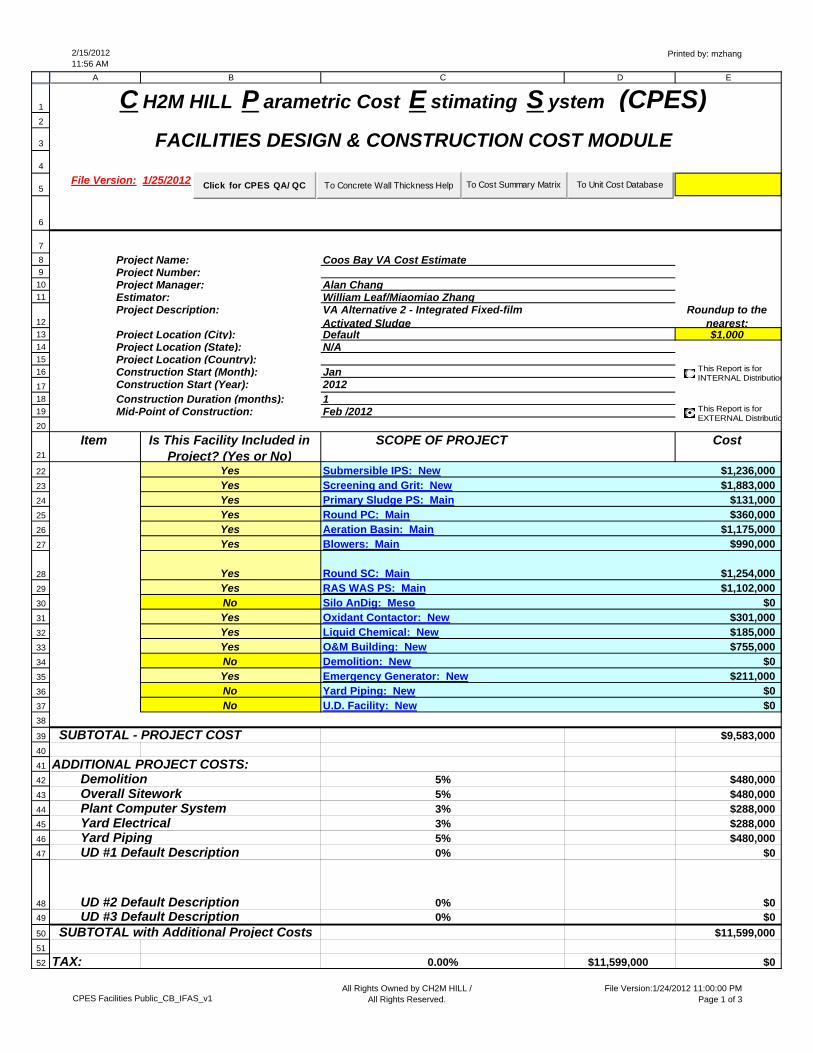
Table 3 lists the capital costs of all four alternatives in 2012 dollars.
TABLE 3 Capital Costs of All Alternatives for Coos Bay WWTP No.2
FPA Alternative 1
SBR
FPA Alternative 2
MLE
VA Alternative 1
MBR
VA Alternative 2
IFAS
Project Cost (exclude contractor markups)
$11,517,000 $15,299,000 $14,428,000 $11,599,000
Construction Cost (include contractor markups)
$17,774,000 1. $23,506,000 1 $21,874,000 $17,584,000
Capital Cost (include contractor markups and
$22,219,000 $29,385,000 $27,344,000 $21,983,000
FINAL – COOS BAY WASTEWATER TREATMENT PLANT NO.2 UPGRADE COST ESTIMATE
20 COOSBAY_COSTTM_V3.DOCX
TABLE 3 Capital Costs of All Alternatives for Coos Bay WWTP No.2
FPA Alternative 1
SBR
FPA Alternative 2
MLE
VA Alternative 1
MBR
VA Alternative 2
IFAS
non-construction cost)
Note 1: The construction cost for the Facility Plan Alternatives includes the allowance provided in the report for gravity system upgrades and estuary outfall piping and connection.
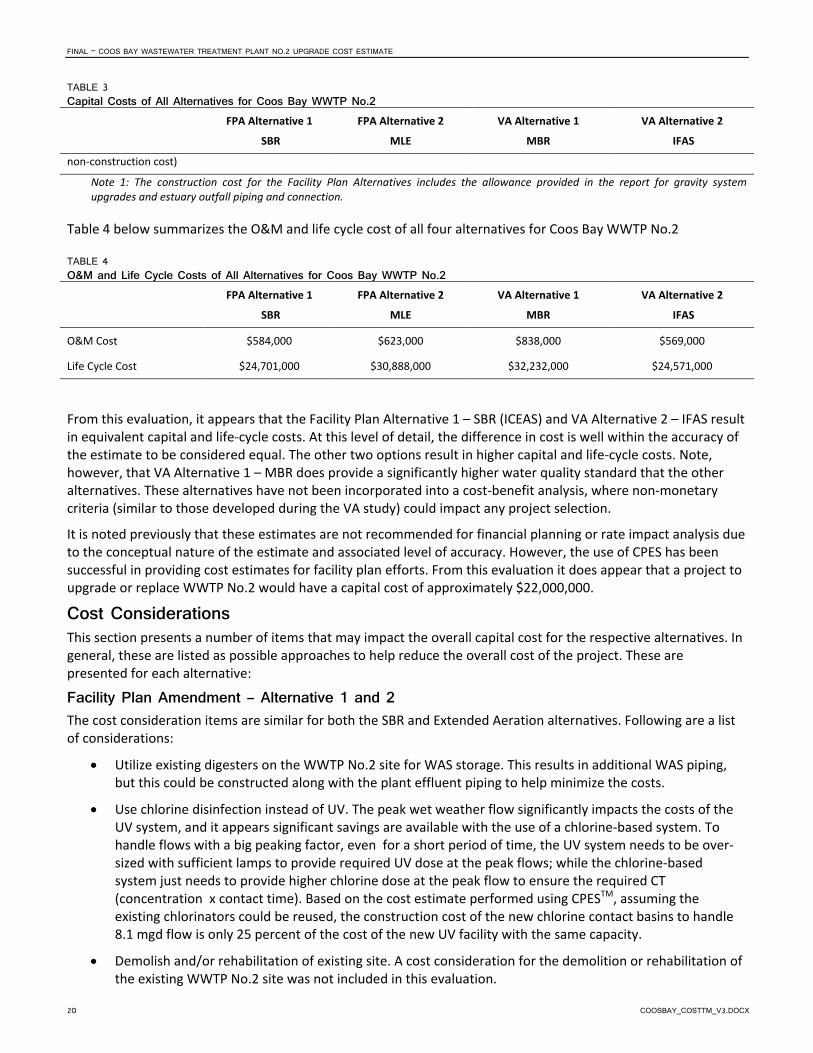
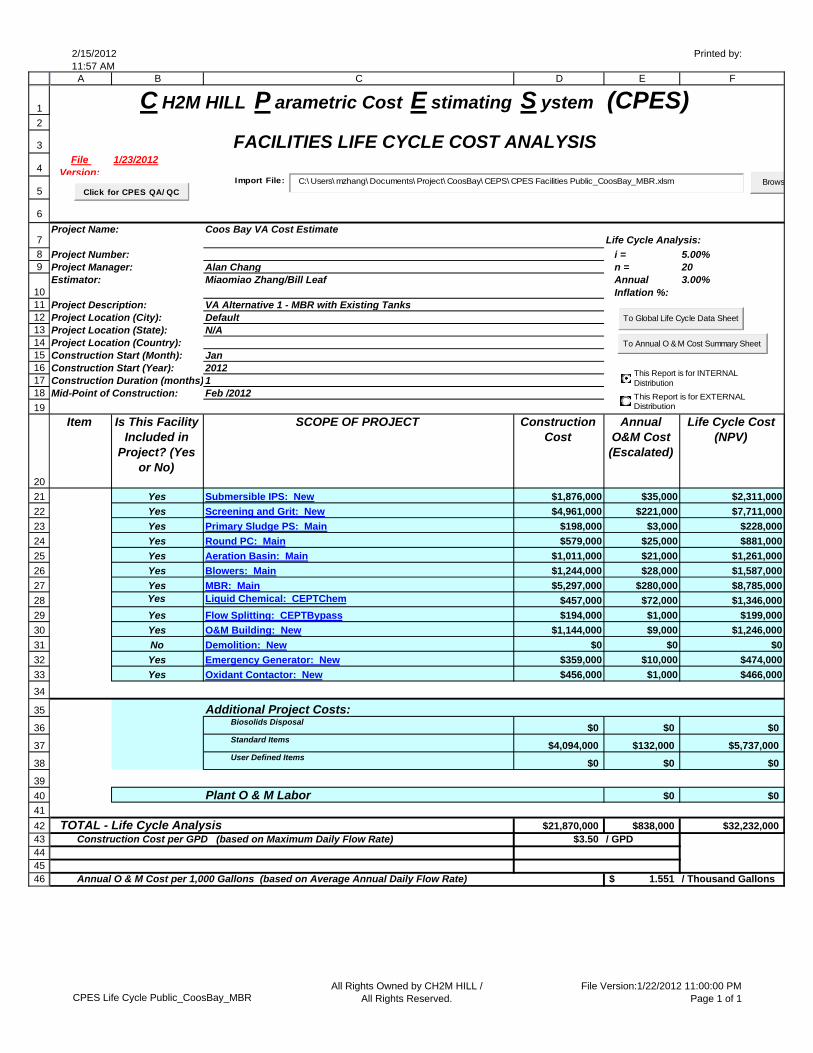
Table 4 below summarizes the O&M and life cycle cost of all four alternatives for Coos Bay WWTP No.2
TABLE 4 O&M and Life Cycle Costs of All Alternatives for Coos Bay WWTP No.2
FPA Alternative 1
SBR
FPA Alternative 2
MLE
VA Alternative 1
MBR
VA Alternative 2
IFAS
O&M Cost $584,000 $623,000 $838,000 $569,000
Life Cycle Cost $24,701,000 $30,888,000 $32,232,000 $24,571,000
From this evaluation, it appears that the Facility Plan Alternative 1 – SBR (ICEAS) and VA Alternative 2 – IFAS result in equivalent capital and life-cycle costs. At this level of detail, the difference in cost is well within the accuracy of the estimate to be considered equal. The other two options result in higher capital and life-cycle costs. Note, however, that VA Alternative 1 – MBR does provide a significantly higher water quality standard that the other alternatives. These alternatives have not been incorporated into a cost-benefit analysis, where non-monetary criteria (similar to those developed during the VA study) could impact any project selection.
It is noted previously that these estimates are not recommended for financial planning or rate impact analysis due to the conceptual nature of the estimate and associated level of accuracy. However, the use of CPES has been successful in providing cost estimates for facility plan efforts. From this evaluation it does appear that a project to upgrade or replace WWTP No.2 would have a capital cost of approximately $22,000,000. Cost Considerations This section presents a number of items that may impact the overall capital cost for the respective alternatives. In general, these are listed as possible approaches to help reduce the overall cost of the project. These are presented for each alternative:
Facility Plan Amendment – Alternative 1 and 2 The cost consideration items are similar for both the SBR and Extended Aeration alternatives. Following are a list of considerations:
• Utilize existing digesters on the WWTP No.2 site for WAS storage. This results in additional WAS piping, but this could be constructed along with the plant effluent piping to help minimize the costs.
• Use chlorine disinfection instead of UV. The peak wet weather flow significantly impacts the costs of the UV system, and it appears significant savings are available with the use of a chlorine-based system. To handle flows with a big peaking factor, even for a short period of time, the UV system needs to be over-sized with sufficient lamps to provide required UV dose at the peak flows; while the chlorine-based system just needs to provide higher chlorine dose at the peak flow to ensure the required CT (concentration x contact time). Based on the cost estimate performed using CPESTM, assuming the existing chlorinators could be reused, the construction cost of the new chlorine contact basins to handle 8.1 mgd flow is only 25 percent of the cost of the new UV facility with the same capacity.
• Demolish and/or rehabilitation of existing site. A cost consideration for the demolition or rehabilitation of the existing WWTP No.2 site was not included in this evaluation.
FINAL – COOS BAY WASTEWATER TREATMENT PLANT NO.2 UPGRADE COST ESTIMATE
COOSBAY_COSTTM_V3.DOCX 21
• Odor control should be considered for the headworks facility at the new parcel.
Value Assessment – Alternative 1 and 2 • Rebuild existing clarifier mechanisms instead of complete replacement. For this evaluation, the complete
replacement of the clarifier mechanisms is assumed but possible savings may be available through the refurbishment of the systems.
• Construction Phasing Opportunities. With the continued use of the existing site, there appears to be opportunities to phase the construction over time if warranted. As an example, a new Headworks Facility could be constructed on the new parcel in the initial phase – with continued use of the existing WWTP No.2. Improvements to existing WWTP No.2 (or additional construction on the new parcel) could follow.
• For Alternative 2 there may be an opportunity to complete the work on new parcel as noted, followed by the conversion to the IFAS system. However, the continued use of the existing primary clarifier and secondary clarifiers may be a possibility. Allowances for addressing the periodic peak wet weather conditions would be required, but there may be an opportunity to reduce the overall project cost.
• Odor control should be considered for the headworks facility at the new parcel.
Attachment
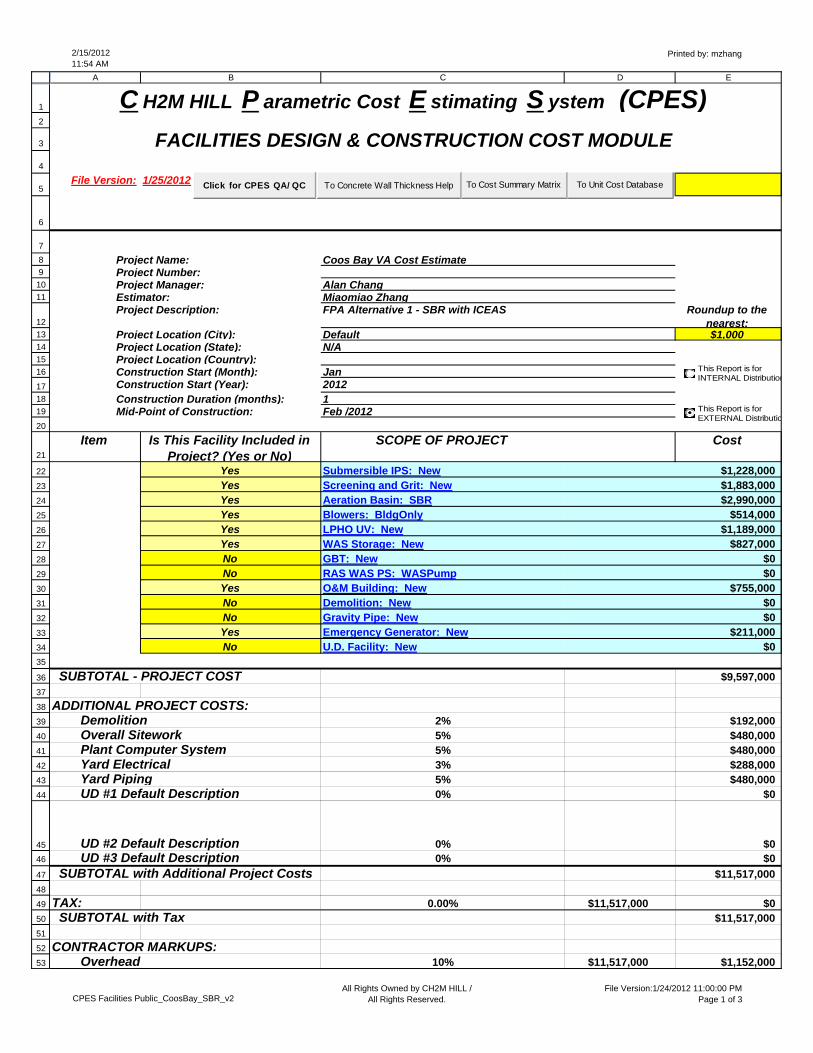
CPESTM Cost Estimate Summary

FPA Alternative 1 ‐ SBR
2/15/201211:54 AM
Printed by: mzhang
1
2
3
4
5
6
7
8
9
10
11
12
13
14
15
16
17
18
19
20
21
22
23
24
25
26
27
28
29
30
31
32
33
34
35
36
37
38
39
40
41
42
43
44
45
46
47
48
49
50
51
52
53
A B C D E
File Version: 1/25/2012
Project Name: Coos Bay VA Cost EstimateProject Number:Project Manager: Alan ChangEstimator: Miaomiao ZhangProject Description: FPA Alternative 1 - SBR with ICEAS Roundup to the
nearest:Project Location (City): Default $1,000 Project Location (State): N/AProject Location (Country):Construction Start (Month): JanConstruction Start (Year): 2012Construction Duration (months): 1Mid-Point of Construction: Feb /2012
Item Is This Facility Included in Project? (Yes or No)
SCOPE OF PROJECT Cost
Yes Submersible IPS: New $1,228,000Yes Screening and Grit: New $1,883,000Yes Aeration Basin: SBR $2,990,000Yes Blowers: BldgOnly $514,000Yes LPHO UV: New $1,189,000Yes WAS Storage: New $827,000No GBT: New $0No RAS WAS PS: WASPump $0Yes O&M Building: New $755,000No Demolition: New $0No Gravity Pipe: New $0Yes Emergency Generator: New $211,000No U.D. Facility: New $0
SUBTOTAL - PROJECT COST $9,597,000
ADDITIONAL PROJECT COSTS:Demolition 2% $192,000Overall Sitework 5% $480,000Plant Computer System 5% $480,000Yard Electrical 3% $288,000Yard Piping 5% $480,000UD #1 Default Description 0% $0
UD #2 Default Description 0% $0UD #3 Default Description 0% $0
SUBTOTAL with Additional Project Costs $11,517,000
TAX: 0.00% $11,517,000 $0SUBTOTAL with Tax $11,517,000
CONTRACTOR MARKUPS:Overhead 10% $11,517,000 $1,152,000
C H2M HILL P arametric Cost E stimating S ystem (CPES)
FACILITIES DESIGN & CONSTRUCTION COST MODULE
To Cost Summary Matrix
This Report is for INTERNAL Distribution
This Report is for EXTERNAL Distributio
Click for CPES QA/ QC To Concrete Wall Thickness Help To Unit Cost Database
All Rights Owned by CH2M HILL /All Rights Reserved.CPES Facilities Public_CoosBay_SBR_v2
File Version:1/24/2012 11:00:00 PM Page 1 of 3
2/15/201211:54 AM
Printed by: mzhang
54
55
56
57
58
59
60
61
62
63
64
65
66
67
68
69
70
71
72
73
74
75
76
77
78
79
80
81
82
83
84
85
86
87
88
89
90
91
92
93
94
95
96
97
98
99
100
101
102
103
104
105
106
107
108
109
110
A B C D E
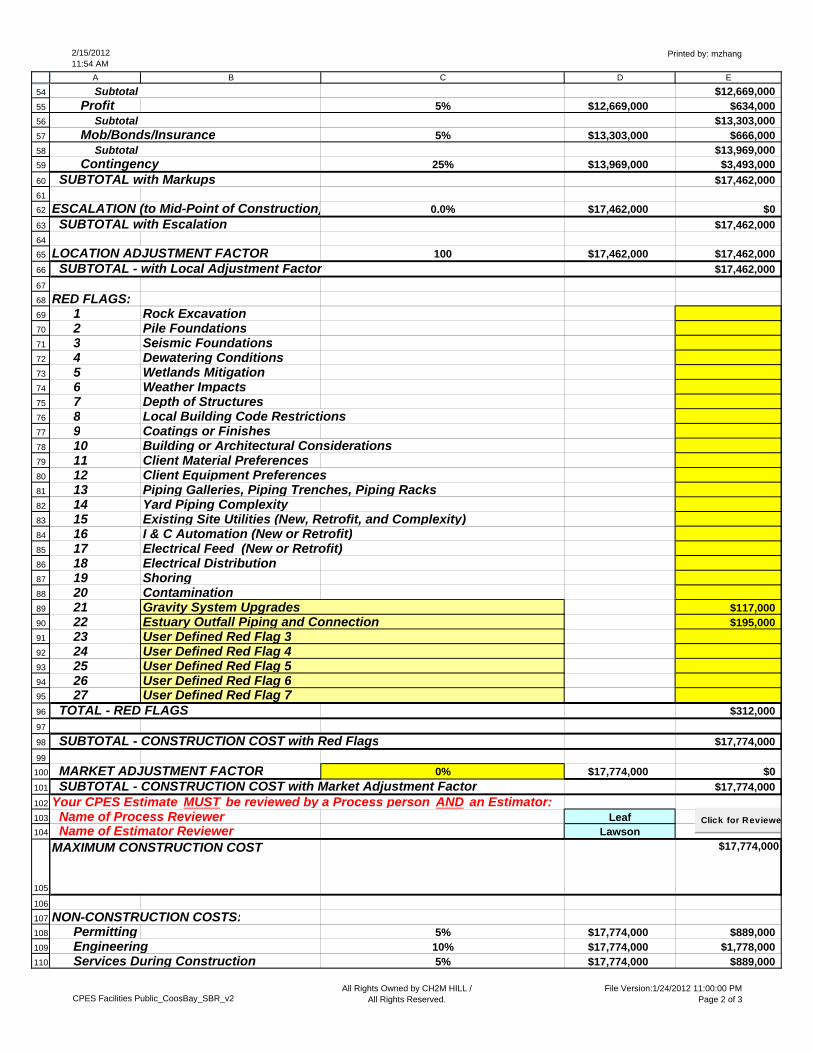
Subtotal $12,669,000Profit 5% $12,669,000 $634,000
Subtotal $13,303,000Mob/Bonds/Insurance 5% $13,303,000 $666,000
Subtotal $13,969,000Contingency 25% $13,969,000 $3,493,000
SUBTOTAL with Markups $17,462,000
ESCALATION (to Mid-Point of Construction) 0.0% $17,462,000 $0
SUBTOTAL with Escalation $17,462,000
LOCATION ADJUSTMENT FACTOR 100 $17,462,000 $17,462,000
SUBTOTAL - with Local Adjustment Factor $17,462,000
RED FLAGS:1 Rock Excavation2 Pile Foundations3 Seismic Foundations4 Dewatering Conditions5 Wetlands Mitigation6 Weather Impacts7 Depth of Structures8 Local Building Code Restrictions9 Coatings or Finishes10 Building or Architectural Considerations11 Client Material Preferences12 Client Equipment Preferences13 Piping Galleries, Piping Trenches, Piping Racks14 Yard Piping Complexity15 Existing Site Utilities (New, Retrofit, and Complexity)16 I & C Automation (New or Retrofit)17 Electrical Feed (New or Retrofit)18 Electrical Distribution 19 Shoring20 Contamination21 Gravity System Upgrades $117,00022 Estuary Outfall Piping and Connection $195,00023 User Defined Red Flag 324 User Defined Red Flag 425 User Defined Red Flag 526 User Defined Red Flag 627 User Defined Red Flag 7
TOTAL - RED FLAGS $312,000
SUBTOTAL - CONSTRUCTION COST with Red Flags $17,774,000
MARKET ADJUSTMENT FACTOR 0% $17,774,000 $0
SUBTOTAL - CONSTRUCTION COST with Market Adjustment Factor $17,774,000
Your CPES Estimate MUST be reviewed by a Process person AND an Estimator:Name of Process Reviewer LeafName of Estimator Reviewer Lawson
1 $17,774,000
NON-CONSTRUCTION COSTS:Permitting 5% $17,774,000 $889,000Engineering 10% $17,774,000 $1,778,000Services During Construction 5% $17,774,000 $889,000
MAXIMUM CONSTRUCTION COST
Click for Reviewe
All Rights Owned by CH2M HILL /All Rights Reserved.CPES Facilities Public_CoosBay_SBR_v2
File Version:1/24/2012 11:00:00 PM Page 2 of 3
2/15/201211:54 AM
Printed by: mzhang
111
112
113
114
115
116
117
118
119
120
121
A B C D E
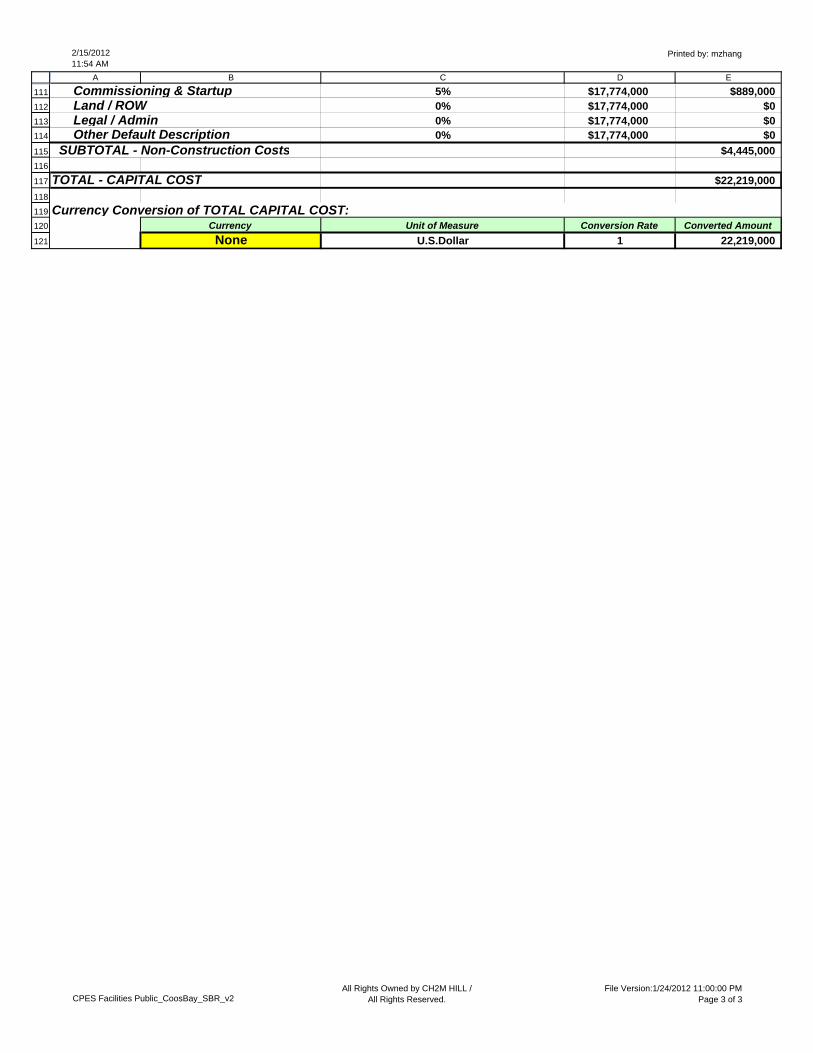
Commissioning & Startup 5% $17,774,000 $889,000Land / ROW 0% $17,774,000 $0Legal / Admin 0% $17,774,000 $0Other Default Description 0% $17,774,000 $0
SUBTOTAL - Non-Construction Costs $4,445,000
TOTAL - CAPITAL COST $22,219,000
Currency Conversion of TOTAL CAPITAL COST:Currency Unit of Measure Conversion Rate Converted Amount
None U.S.Dollar 1 22,219,000
All Rights Owned by CH2M HILL /All Rights Reserved.CPES Facilities Public_CoosBay_SBR_v2
File Version:1/24/2012 11:00:00 PM Page 3 of 3
2/15/201211:54 AM
Printed by:
1
2
3
4
5
6
7
89
101112131415161718
19
20
21
22
23
24
25
26
27
28
29
30
31
32
33
34
35
36
37
38
39
40
41
4243444546
A B C D E F
File Version:
1/23/2012
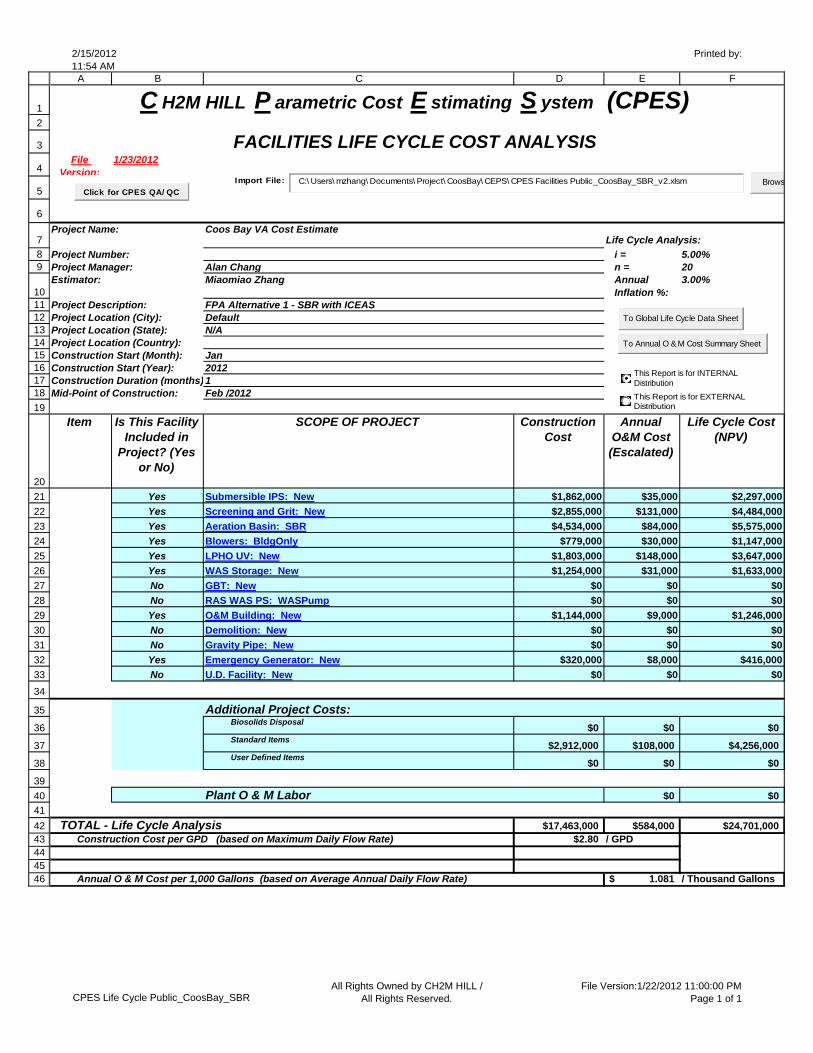
Project Name: Coos Bay VA Cost EstimateLife Cycle Analysis:
Project Number: i = 5.00%Project Manager: Alan Chang n = 20Estimator: Miaomiao Zhang Annual
Inflation %:3.00%
Project Description: FPA Alternative 1 - SBR with ICEASProject Location (City): DefaultProject Location (State): N/AProject Location (Country):Construction Start (Month): JanConstruction Start (Year): 2012Construction Duration (months) 1Mid-Point of Construction: Feb /2012
Item Is This Facility Included in
Project? (Yes or No)
SCOPE OF PROJECT Construction Cost
Annual O&M Cost (Escalated)
Life Cycle Cost (NPV)
Yes Submersible IPS: New $1,862,000 $35,000 $2,297,000
Yes Screening and Grit: New $2,855,000 $131,000 $4,484,000
Yes Aeration Basin: SBR $4,534,000 $84,000 $5,575,000
Yes Blowers: BldgOnly $779,000 $30,000 $1,147,000
Yes LPHO UV: New $1,803,000 $148,000 $3,647,000
Yes WAS Storage: New $1,254,000 $31,000 $1,633,000
No GBT: New $0 $0 $0
No RAS WAS PS: WASPump $0 $0 $0
Yes O&M Building: New $1,144,000 $9,000 $1,246,000
No Demolition: New $0 $0 $0
No Gravity Pipe: New $0 $0 $0
Yes Emergency Generator: New $320,000 $8,000 $416,000
No U.D. Facility: New $0 $0 $0
Additional Project Costs:Biosolids Disposal
$0 $0 $0Standard Items
$2,912,000 $108,000 $4,256,000User Defined Items
$0 $0 $0
Plant O & M Labor $0 $0
TOTAL - Life Cycle Analysis $17,463,000 $584,000 $24,701,000Construction Cost per GPD (based on Maximum Daily Flow Rate) $2.80 / GPD
Annual O & M Cost per 1,000 Gallons (based on Average Annual Daily Flow Rate) 1.081$ / Thousand Gallons
C H2M HILL P arametric Cost E stimating S ystem (CPES)
FACILITIES LIFE CYCLE COST ANALYSIS
BrowsC:\ Users\ mzhang\ Documents\ Project\ CoosBay\ CEPS\ CPES Facilities Public_CoosBay_SBR_v2.xlsmImport File:
To Global Life Cycle Data Sheet
To Annual O & M Cost Summary Sheet
This Report is for INTERNAL Distribution
This Report is for EXTERNAL Distribution
Click for CPES QA/ QC
All Rights Owned by CH2M HILL /All Rights Reserved.CPES Life Cycle Public_CoosBay_SBR
File Version:1/22/2012 11:00:00 PMPage 1 of 1
FPA Alternative 2 ‐ MLE
2/15/201211:55 AM
Printed by:
1
2
3
4
5
6
7
8
9
10
11
12
13
14
15
16
17
18
19
20
21
22
23
24
25
26
27
28
29
30
31
32
33
34
35
36
37
38
39
40
41
42
43
44
45
46
47
48
49
50
51
52
53
A B C D E
File Version: 1/25/2012
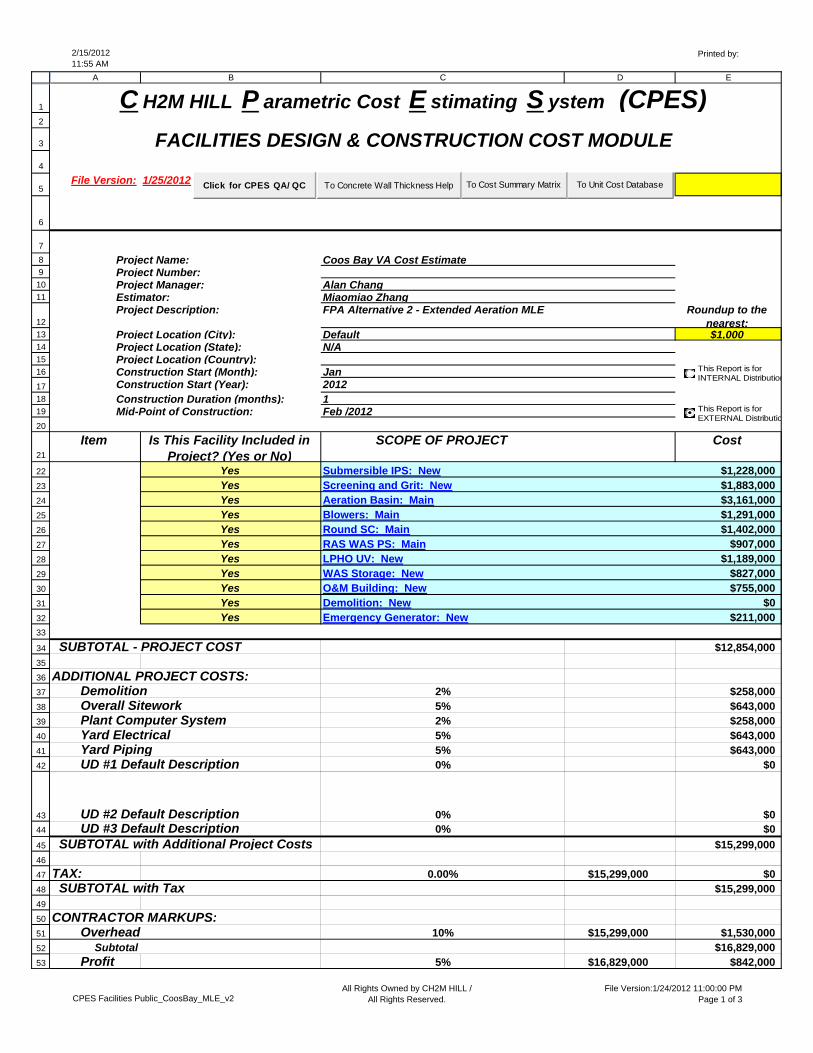
Project Name: Coos Bay VA Cost EstimateProject Number:Project Manager: Alan ChangEstimator: Miaomiao ZhangProject Description: FPA Alternative 2 - Extended Aeration MLE Roundup to the
nearest:Project Location (City): Default $1,000 Project Location (State): N/AProject Location (Country):Construction Start (Month): JanConstruction Start (Year): 2012Construction Duration (months): 1Mid-Point of Construction: Feb /2012
Item Is This Facility Included in Project? (Yes or No)
SCOPE OF PROJECT Cost
Yes Submersible IPS: New $1,228,000Yes Screening and Grit: New $1,883,000Yes Aeration Basin: Main $3,161,000Yes Blowers: Main $1,291,000Yes Round SC: Main $1,402,000Yes RAS WAS PS: Main $907,000Yes LPHO UV: New $1,189,000Yes WAS Storage: New $827,000Yes O&M Building: New $755,000Yes Demolition: New $0Yes Emergency Generator: New $211,000
SUBTOTAL - PROJECT COST $12,854,000
ADDITIONAL PROJECT COSTS:Demolition 2% $258,000Overall Sitework 5% $643,000Plant Computer System 2% $258,000Yard Electrical 5% $643,000Yard Piping 5% $643,000UD #1 Default Description 0% $0
UD #2 Default Description 0% $0UD #3 Default Description 0% $0
SUBTOTAL with Additional Project Costs $15,299,000
TAX: 0.00% $15,299,000 $0SUBTOTAL with Tax $15,299,000
CONTRACTOR MARKUPS:Overhead 10% $15,299,000 $1,530,000
Subtotal $16,829,000Profit 5% $16,829,000 $842,000
C H2M HILL P arametric Cost E stimating S ystem (CPES)
FACILITIES DESIGN & CONSTRUCTION COST MODULE
To Cost Summary Matrix
This Report is for INTERNAL Distribution
This Report is for EXTERNAL Distributio
Click for CPES QA/ QC To Concrete Wall Thickness Help To Unit Cost Database
All Rights Owned by CH2M HILL /All Rights Reserved.CPES Facilities Public_CoosBay_MLE_v2
File Version:1/24/2012 11:00:00 PM Page 1 of 3
2/15/201211:55 AM
Printed by:
54
55
56
57
58
59
60
61
62
63
64
65
66
67
68
69
70
71
72
73
74
75
76
77
78
79
80
81
82
83
84
85
86
87
88
89
90
91
92
93
94
95
96
97
98
99
100
101
102
103
104
105
106
107
108
109
110
A B C D E
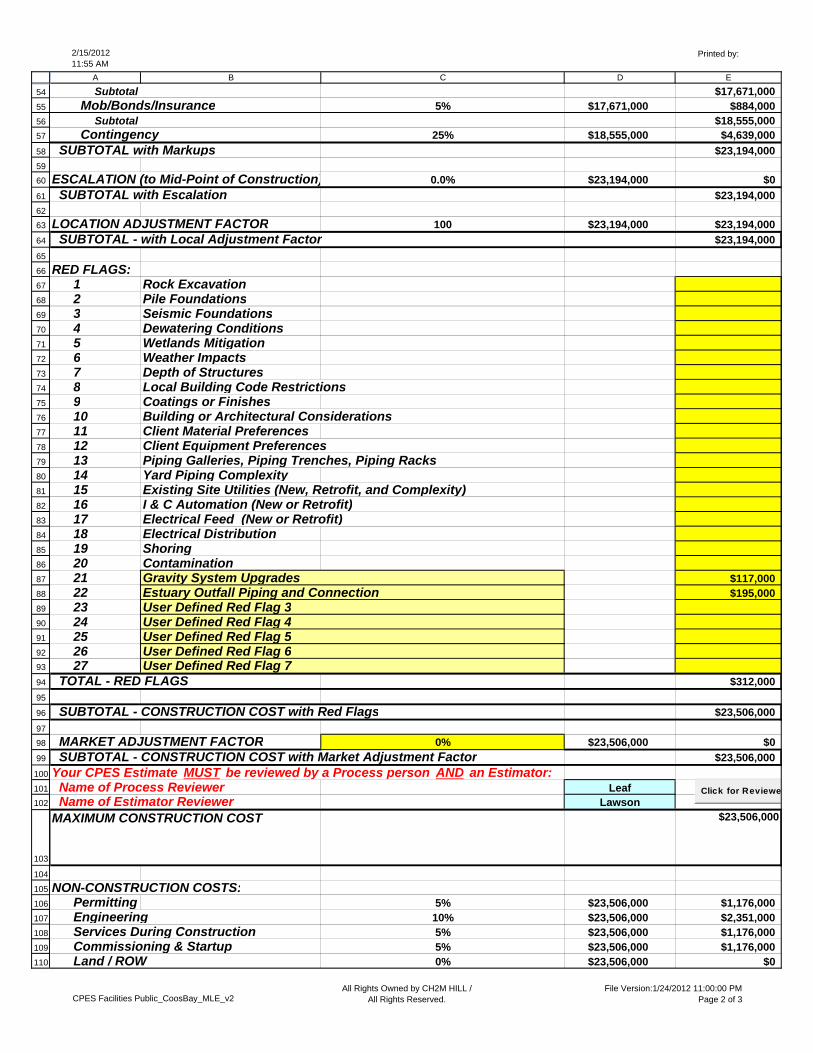
Subtotal $17,671,000Mob/Bonds/Insurance 5% $17,671,000 $884,000
Subtotal $18,555,000Contingency 25% $18,555,000 $4,639,000
SUBTOTAL with Markups $23,194,000
ESCALATION (to Mid-Point of Construction) 0.0% $23,194,000 $0
SUBTOTAL with Escalation $23,194,000
LOCATION ADJUSTMENT FACTOR 100 $23,194,000 $23,194,000
SUBTOTAL - with Local Adjustment Factor $23,194,000
RED FLAGS:1 Rock Excavation2 Pile Foundations3 Seismic Foundations4 Dewatering Conditions5 Wetlands Mitigation6 Weather Impacts7 Depth of Structures8 Local Building Code Restrictions9 Coatings or Finishes10 Building or Architectural Considerations11 Client Material Preferences12 Client Equipment Preferences13 Piping Galleries, Piping Trenches, Piping Racks14 Yard Piping Complexity15 Existing Site Utilities (New, Retrofit, and Complexity)16 I & C Automation (New or Retrofit)17 Electrical Feed (New or Retrofit)18 Electrical Distribution 19 Shoring20 Contamination21 Gravity System Upgrades $117,00022 Estuary Outfall Piping and Connection $195,00023 User Defined Red Flag 324 User Defined Red Flag 425 User Defined Red Flag 526 User Defined Red Flag 627 User Defined Red Flag 7
TOTAL - RED FLAGS $312,000
SUBTOTAL - CONSTRUCTION COST with Red Flags $23,506,000
MARKET ADJUSTMENT FACTOR 0% $23,506,000 $0
SUBTOTAL - CONSTRUCTION COST with Market Adjustment Factor $23,506,000
Your CPES Estimate MUST be reviewed by a Process person AND an Estimator:Name of Process Reviewer LeafName of Estimator Reviewer Lawson
1 $23,506,000
NON-CONSTRUCTION COSTS:Permitting 5% $23,506,000 $1,176,000Engineering 10% $23,506,000 $2,351,000Services During Construction 5% $23,506,000 $1,176,000Commissioning & Startup 5% $23,506,000 $1,176,000Land / ROW 0% $23,506,000 $0
MAXIMUM CONSTRUCTION COST
Click for Reviewe
All Rights Owned by CH2M HILL /All Rights Reserved.CPES Facilities Public_CoosBay_MLE_v2
File Version:1/24/2012 11:00:00 PM Page 2 of 3
2/15/201211:55 AM
Printed by:
111
112
113
114
115
116
117
118
119
A B C D E
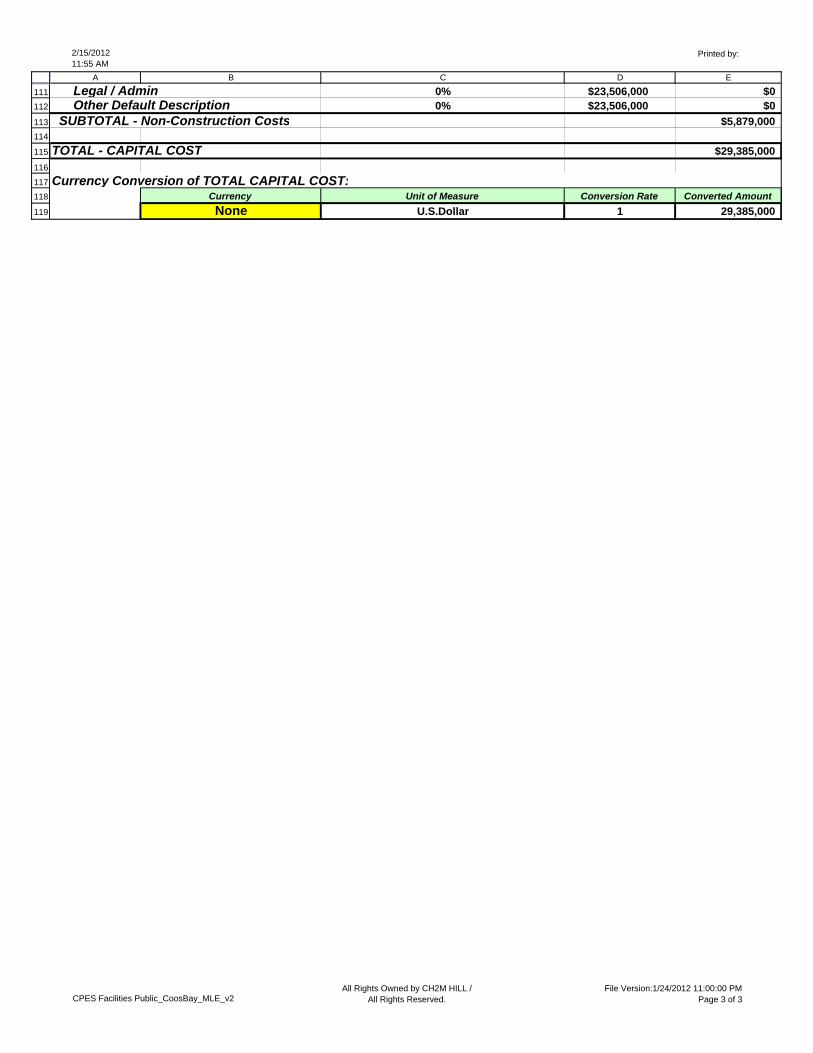
Legal / Admin 0% $23,506,000 $0Other Default Description 0% $23,506,000 $0
SUBTOTAL - Non-Construction Costs $5,879,000
TOTAL - CAPITAL COST $29,385,000
Currency Conversion of TOTAL CAPITAL COST:Currency Unit of Measure Conversion Rate Converted Amount
None U.S.Dollar 1 29,385,000
All Rights Owned by CH2M HILL /All Rights Reserved.CPES Facilities Public_CoosBay_MLE_v2
File Version:1/24/2012 11:00:00 PM Page 3 of 3
2/15/201211:55 AM
Printed by: mzhang
1
2
3
4
5
6
7
89
101112131415161718
19
20
21
22
23
24
25
26
27
28
29
30
31
32
33
34
35
36
37
38
39
4041424344
A B C D E F
File Version:
1/23/2012
Project Name: Coos Bay VA Cost EstimateLife Cycle Analysis:
Project Number: i = 5.00%Project Manager: Alan Chang n = 20Estimator: Miaomiao Zhang Annual
Inflation %:3.00%
Project Description: FPA Alternative 2 - Extended Aeration MLEProject Location (City): DefaultProject Location (State): N/AProject Location (Country):Construction Start (Month): JanConstruction Start (Year): 2012Construction Duration (months) 1Mid-Point of Construction: Feb /2012
Item Is This Facility Included in
Project? (Yes or No)
SCOPE OF PROJECT Construction Cost
Annual O&M Cost (Escalated)
Life Cycle Cost (NPV)
Yes Submersible IPS: New $1,862,000 $35,000 $2,297,000
Yes Screening and Grit: New $2,854,000 $131,000 $4,483,000
Yes Aeration Basin: Main $4,793,000 $30,000 $5,160,000
Yes Blowers: Main $1,957,000 $46,000 $2,520,000
Yes Round SC: Main $2,125,000 $31,000 $2,505,000
Yes RAS WAS PS: Main $1,375,000 $19,000 $1,603,000
Yes LPHO UV: New $1,803,000 $149,000 $3,654,000
Yes WAS Storage: New $1,254,000 $31,000 $1,634,000
Yes O&M Building: New $1,144,000 $9,000 $1,246,000
Yes Demolition: New $0 $0 $0
Yes Emergency Generator: New $320,000 $8,000 $416,000
Additional Project Costs:Biosolids Disposal
$0 $0 $0Standard Items
$3,707,000 $134,000 $5,370,000User Defined Items
$0 $0 $0
Plant O & M Labor $0 $0
TOTAL - Life Cycle Analysis $23,194,000 $623,000 $30,888,000Construction Cost per GPD (based on Maximum Daily Flow Rate) $3.72 / GPD
Annual O & M Cost per 1,000 Gallons (based on Average Annual Daily Flow Rate) 1.153$ / Thousand Gallons
C H2M HILL P arametric Cost E stimating S ystem (CPES)
FACILITIES LIFE CYCLE COST ANALYSIS
BrowsC:\ Users\ mzhang\ Documents\ Project\ CoosBay\ CEPS\ CPES Facilities Public_CoosBay_MLE_v2.xlsmImport File:
To Global Life Cycle Data Sheet
To Annual O & M Cost Summary Sheet
This Report is for INTERNAL Distribution
This Report is for EXTERNAL Distribution
Click for CPES QA/ QC
All Rights Owned by CH2M HILL /All Rights Reserved.CPES Life Cycle Public_CoosBay_MLE
File Version:1/22/2012 11:00:00 PMPage 1 of 1
VA Alternative 1 ‐ MBR
2/15/201211:56 AM
Printed by: mzhang
1
2
3
4
5
6
7
8
9
10
11
12
13
14
15
16
17
18
19
20
21
22
23
24
25
26
27
28
29
30
31
32
33
34
35
36
37
38
39
40
41
42
43
44
45
46
47
48
49
50
51
52
53
A B C D E
File Version: 1/25/2012
Project Name: Coos Bay VA Cost EstimateProject Number:Project Manager: Alan ChangEstimator: Miaomiao Zhang/Bill LeafProject Description: VA Alternative 1 - MBR with Existing Tanks Roundup to the
nearest:Project Location (City): Default $1,000 Project Location (State): N/AProject Location (Country):Construction Start (Month): JanConstruction Start (Year): 2012Construction Duration (months): 1Mid-Point of Construction: Feb /2012
Item Is This Facility Included in Project? (Yes or No)
SCOPE OF PROJECT Cost
Yes Submersible IPS: New $1,238,000Yes Screening and Grit: New $3,272,000Yes Primary Sludge PS: Main $131,000Yes Round PC: Main $382,000Yes Aeration Basin: Main $667,000Yes Blowers: Main $821,000Yes MBR: Main $3,494,000Yes Liquid Chemical: CEPTChem $302,000Yes Flow Splitting: CEPTBypass $128,000Yes O&M Building: New $755,000No Demolition: New $0Yes Emergency Generator: New $237,000Yes Oxidant Contactor: New $301,000
SUBTOTAL - PROJECT COST $11,728,000
ADDITIONAL PROJECT COSTS:Demolition 5% $587,000Overall Sitework 5% $587,000Plant Computer System 5% $587,000Yard Electrical 3% $352,000Yard Piping 5% $587,000UD #1 Default Description 0% $0
UD #2 Default Description 0% $0UD #3 Default Description 0% $0
SUBTOTAL with Additional Project Costs $14,428,000
TAX: 0.00% $14,428,000 $0SUBTOTAL with Tax $14,428,000
CONTRACTOR MARKUPS:Overhead 10% $14,428,000 $1,443,000
C H2M HILL P arametric Cost E stimating S ystem (CPES)
FACILITIES DESIGN & CONSTRUCTION COST MODULE
To Cost Summary Matrix
This Report is for INTERNAL Distribution
This Report is for EXTERNAL Distributio
Click for CPES QA/ QC To Concrete Wall Thickness Help To Unit Cost Database
All Rights Owned by CH2M HILL /All Rights Reserved.CPES Facilities Public_CoosBay_MBR
File Version:1/24/2012 11:00:00 PM Page 1 of 3
2/15/201211:56 AM
Printed by: mzhang
54
55
56
57
58
59
60
61
62
63
64
65
66
67
68
69
70
71
72
73
74
75
76
77
78
79
80
81
82
83
84
85
86
87
88
89
90
91
92
93
94
95
96
97
98
99
100
101
102
103
104
105
106
107
108
109
110
A B C D E
Subtotal $15,871,000Profit 5% $15,871,000 $794,000
Subtotal $16,665,000Mob/Bonds/Insurance 5% $16,665,000 $834,000
Subtotal $17,499,000Contingency 25% $17,499,000 $4,375,000
SUBTOTAL with Markups $21,874,000
ESCALATION (to Mid-Point of Construction) 0.0% $21,874,000 $0
SUBTOTAL with Escalation $21,874,000
LOCATION ADJUSTMENT FACTOR 100 $21,874,000 $21,874,000
SUBTOTAL - with Local Adjustment Factor $21,874,000
RED FLAGS:1 Rock Excavation2 Pile Foundations3 Seismic Foundations4 Dewatering Conditions5 Wetlands Mitigation6 Weather Impacts7 Depth of Structures8 Local Building Code Restrictions9 Coatings or Finishes10 Building or Architectural Considerations11 Client Material Preferences12 Client Equipment Preferences13 Piping Galleries, Piping Trenches, Piping Racks14 Yard Piping Complexity15 Existing Site Utilities (New, Retrofit, and Complexity)16 I & C Automation (New or Retrofit)17 Electrical Feed (New or Retrofit)18 Electrical Distribution 19 Shoring20 Contamination21 User Defined Red Flag 122 User Defined Red Flag 223 User Defined Red Flag 324 User Defined Red Flag 425 User Defined Red Flag 526 User Defined Red Flag 627 User Defined Red Flag 7
TOTAL - RED FLAGS $0
SUBTOTAL - CONSTRUCTION COST with Red Flags $21,874,000
MARKET ADJUSTMENT FACTOR 0% $21,874,000 $0
SUBTOTAL - CONSTRUCTION COST with Market Adjustment Factor $21,874,000
Your CPES Estimate MUST be reviewed by a Process person AND an Estimator:Name of Process Reviewer LeafName of Estimator Reviewer Lawson
1 $21,874,000
NON-CONSTRUCTION COSTS:Permitting 5% $21,874,000 $1,094,000Engineering 10% $21,874,000 $2,188,000Services During Construction 5% $21,874,000 $1,094,000
MAXIMUM CONSTRUCTION COST
Click for Reviewe
All Rights Owned by CH2M HILL /All Rights Reserved.CPES Facilities Public_CoosBay_MBR
File Version:1/24/2012 11:00:00 PM Page 2 of 3

2/15/201211:56 AM
Printed by: mzhang
111
112
113
114
115
116
117
118
119
120
121
A B C D E
Commissioning & Startup 5% $21,874,000 $1,094,000Land / ROW 0% $21,874,000 $0Legal / Admin 0% $21,874,000 $0Other Default Description 0% $21,874,000 $0
SUBTOTAL - Non-Construction Costs $5,470,000
TOTAL - CAPITAL COST $27,344,000
Currency Conversion of TOTAL CAPITAL COST:Currency Unit of Measure Conversion Rate Converted Amount
None U.S.Dollar 1 27,344,000
All Rights Owned by CH2M HILL /All Rights Reserved.CPES Facilities Public_CoosBay_MBR
File Version:1/24/2012 11:00:00 PM Page 3 of 3
2/15/201211:57 AM
Printed by:
1
2
3
4
5
6
7
89
101112131415161718
19
20
21
22
23
24
25
26
27
28
29
30
31
32
33
34
35
36
37
38
39
40
41
4243444546
A B C D E F
File Version:
1/23/2012
Project Name: Coos Bay VA Cost EstimateLife Cycle Analysis:
Project Number: i = 5.00%Project Manager: Alan Chang n = 20Estimator: Miaomiao Zhang/Bill Leaf Annual
Inflation %:3.00%
Project Description: VA Alternative 1 - MBR with Existing TanksProject Location (City): DefaultProject Location (State): N/AProject Location (Country):Construction Start (Month): JanConstruction Start (Year): 2012Construction Duration (months) 1Mid-Point of Construction: Feb /2012
Item Is This Facility Included in
Project? (Yes or No)
SCOPE OF PROJECT Construction Cost
Annual O&M Cost (Escalated)
Life Cycle Cost (NPV)
Yes Submersible IPS: New $1,876,000 $35,000 $2,311,000
Yes Screening and Grit: New $4,961,000 $221,000 $7,711,000
Yes Primary Sludge PS: Main $198,000 $3,000 $228,000
Yes Round PC: Main $579,000 $25,000 $881,000
Yes Aeration Basin: Main $1,011,000 $21,000 $1,261,000
Yes Blowers: Main $1,244,000 $28,000 $1,587,000
Yes MBR: Main $5,297,000 $280,000 $8,785,000Yes Liquid Chemical: CEPTChem $457,000 $72,000 $1,346,000
Yes Flow Splitting: CEPTBypass $194,000 $1,000 $199,000
Yes O&M Building: New $1,144,000 $9,000 $1,246,000
No Demolition: New $0 $0 $0
Yes Emergency Generator: New $359,000 $10,000 $474,000
Yes Oxidant Contactor: New $456,000 $1,000 $466,000
Additional Project Costs:Biosolids Disposal
$0 $0 $0Standard Items
$4,094,000 $132,000 $5,737,000User Defined Items
$0 $0 $0
Plant O & M Labor $0 $0
TOTAL - Life Cycle Analysis $21,870,000 $838,000 $32,232,000Construction Cost per GPD (based on Maximum Daily Flow Rate) $3.50 / GPD
Annual O & M Cost per 1,000 Gallons (based on Average Annual Daily Flow Rate) 1.551$ / Thousand Gallons
C H2M HILL P arametric Cost E stimating S ystem (CPES)
FACILITIES LIFE CYCLE COST ANALYSIS
BrowsC:\ Users\ mzhang\ Documents\ Project\ CoosBay\ CEPS\ CPES Facilities Public_CoosBay_MBR.xlsmImport File:
To Global Life Cycle Data Sheet
To Annual O & M Cost Summary Sheet
This Report is for INTERNAL Distribution
This Report is for EXTERNAL Distribution
Click for CPES QA/ QC
All Rights Owned by CH2M HILL /All Rights Reserved.CPES Life Cycle Public_CoosBay_MBR
File Version:1/22/2012 11:00:00 PMPage 1 of 1
VA Alternative 2 ‐ IFAS
2/15/201211:56 AM
Printed by: mzhang
1
2
3
4
5
6
7
8
9
10
11
12
13
14
15
16
17
18
19
20
21
22
23
24
25
26
27
28
29
30
31
32
33
34
35
36
37
38
39
40
41
42
43
44
45
46
47
48
49
50
51
52
A B C D E
File Version: 1/25/2012
Project Name: Coos Bay VA Cost EstimateProject Number:Project Manager: Alan ChangEstimator: William Leaf/Miaomiao ZhangProject Description: VA Alternative 2 - Integrated Fixed-film
Activated SludgeRoundup to the
nearest:Project Location (City): Default $1,000 Project Location (State): N/AProject Location (Country):Construction Start (Month): JanConstruction Start (Year): 2012Construction Duration (months): 1Mid-Point of Construction: Feb /2012
Item Is This Facility Included in Project? (Yes or No)
SCOPE OF PROJECT Cost
Yes Submersible IPS: New $1,236,000Yes Screening and Grit: New $1,883,000Yes Primary Sludge PS: Main $131,000Yes Round PC: Main $360,000Yes Aeration Basin: Main $1,175,000Yes Blowers: Main $990,000
Yes Round SC: Main $1,254,000Yes RAS WAS PS: Main $1,102,000No Silo AnDig: Meso $0Yes Oxidant Contactor: New $301,000Yes Liquid Chemical: New $185,000Yes O&M Building: New $755,000No Demolition: New $0Yes Emergency Generator: New $211,000No Yard Piping: New $0No U.D. Facility: New $0
SUBTOTAL - PROJECT COST $9,583,000
ADDITIONAL PROJECT COSTS:Demolition 5% $480,000Overall Sitework 5% $480,000Plant Computer System 3% $288,000Yard Electrical 3% $288,000Yard Piping 5% $480,000UD #1 Default Description 0% $0
UD #2 Default Description 0% $0UD #3 Default Description 0% $0
SUBTOTAL with Additional Project Costs $11,599,000
TAX: 0.00% $11,599,000 $0
C H2M HILL P arametric Cost E stimating S ystem (CPES)
FACILITIES DESIGN & CONSTRUCTION COST MODULE
To Cost Summary Matrix
This Report is for INTERNAL Distribution
This Report is for EXTERNAL Distributio
Click for CPES QA/ QC To Concrete Wall Thickness Help To Unit Cost Database
All Rights Owned by CH2M HILL /All Rights Reserved.CPES Facilities Public_CB_IFAS_v1
File Version:1/24/2012 11:00:00 PM Page 1 of 3
2/15/201211:56 AM
Printed by: mzhang
53
54
55
56
57
58
59
60
61
62
63
64
65
66
67
68
69
70
71
72
73
74
75
76
77
78
79
80
81
82
83
84
85
86
87
88
89
90
91
92
93
94
95
96
97
98
99
100
101
102
103
104
105
106
107
108
109
A B C D E
SUBTOTAL with Tax $11,599,000
CONTRACTOR MARKUPS:Overhead 10% $11,599,000 $1,160,000
Subtotal $12,759,000Profit 5% $12,759,000 $638,000
Subtotal $13,397,000Mob/Bonds/Insurance 5% $13,397,000 $670,000
Subtotal $14,067,000Contingency 25% $14,067,000 $3,517,000
SUBTOTAL with Markups $17,584,000
ESCALATION (to Mid-Point of Construction) 0.0% $17,584,000 $0
SUBTOTAL with Escalation $17,584,000
LOCATION ADJUSTMENT FACTOR 100 $17,584,000 $17,584,000
SUBTOTAL - with Local Adjustment Factor $17,584,000
RED FLAGS:1 Rock Excavation2 Pile Foundations3 Seismic Foundations4 Dewatering Conditions5 Wetlands Mitigation6 Weather Impacts7 Depth of Structures8 Local Building Code Restrictions9 Coatings or Finishes10 Building or Architectural Considerations11 Client Material Preferences12 Client Equipment Preferences13 Piping Galleries, Piping Trenches, Piping Racks14 Yard Piping Complexity15 Existing Site Utilities (New, Retrofit, and Complexity)16 I & C Automation (New or Retrofit)17 Electrical Feed (New or Retrofit)18 Electrical Distribution 19 Shoring20 Contamination21 User Defined Red Flag 122 User Defined Red Flag 223 User Defined Red Flag 324 User Defined Red Flag 425 User Defined Red Flag 526 User Defined Red Flag 627 User Defined Red Flag 7
TOTAL - RED FLAGS $0
SUBTOTAL - CONSTRUCTION COST with Red Flags $17,584,000
MARKET ADJUSTMENT FACTOR 0% $17,584,000 $0
SUBTOTAL - CONSTRUCTION COST with Market Adjustment Factor $17,584,000
Your CPES Estimate MUST be reviewed by a Process person AND an Estimator:Name of Process Reviewer LeafName of Estimator Reviewer Lawson
1 $17,584,000 MAXIMUM CONSTRUCTION COST
Click for Reviewe
All Rights Owned by CH2M HILL /All Rights Reserved.CPES Facilities Public_CB_IFAS_v1
File Version:1/24/2012 11:00:00 PM Page 2 of 3
2/15/201211:56 AM
Printed by: mzhang
110
111
112
113
114
115
116
117
118
119
120
121
122
123
124
A B C D E
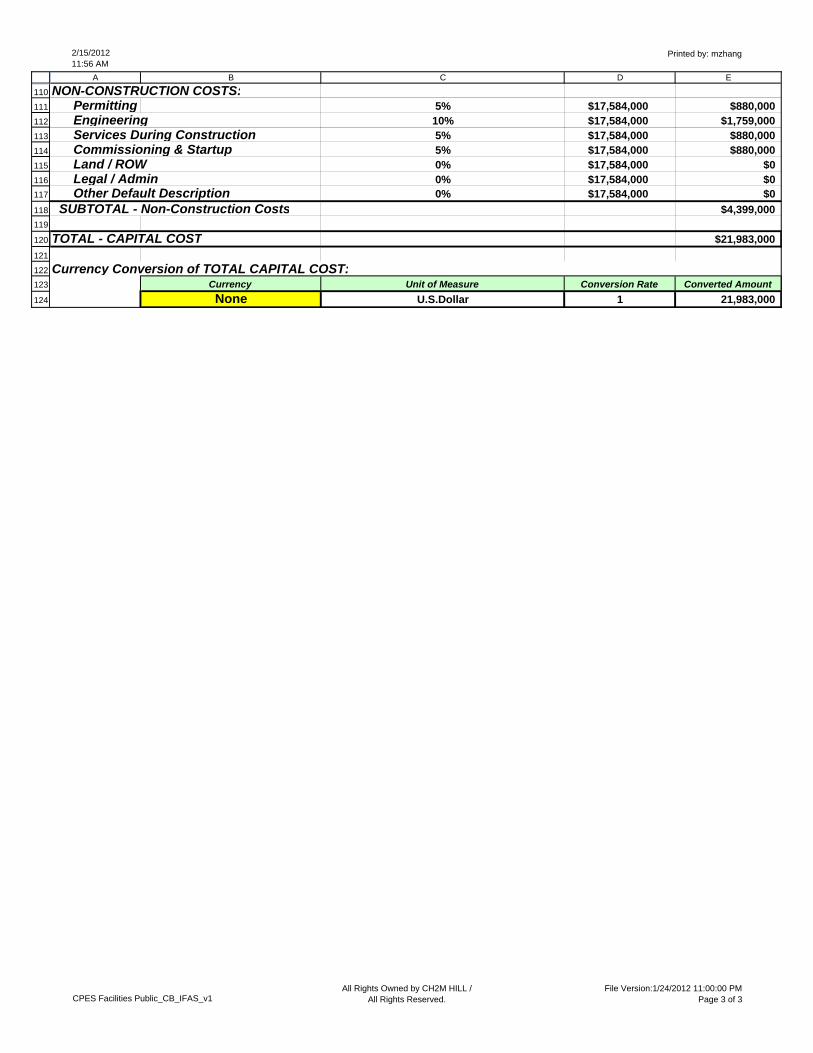
NON-CONSTRUCTION COSTS:Permitting 5% $17,584,000 $880,000Engineering 10% $17,584,000 $1,759,000Services During Construction 5% $17,584,000 $880,000Commissioning & Startup 5% $17,584,000 $880,000Land / ROW 0% $17,584,000 $0Legal / Admin 0% $17,584,000 $0Other Default Description 0% $17,584,000 $0
SUBTOTAL - Non-Construction Costs $4,399,000
TOTAL - CAPITAL COST $21,983,000
Currency Conversion of TOTAL CAPITAL COST:Currency Unit of Measure Conversion Rate Converted Amount
None U.S.Dollar 1 21,983,000
All Rights Owned by CH2M HILL /All Rights Reserved.CPES Facilities Public_CB_IFAS_v1
File Version:1/24/2012 11:00:00 PM Page 3 of 3
2/15/201211:57 AM
Printed by: mzhang
1
2
3
4
5
6
7
89
101112131415161718
19
20
21
22
23
24
25
26
27
28
29
30
31
32
33
34
35
36
37
38
39
40
41
42
43
44
4546474849
A B C D E F
File Version:
1/23/2012
Project Name: Coos Bay VA Cost EstimateLife Cycle Analysis:
Project Number: i = 5.00%Project Manager: Alan Chang n = 20Estimator: William Leaf/Miaomiao Zhang Annual
Inflation %:3.00%
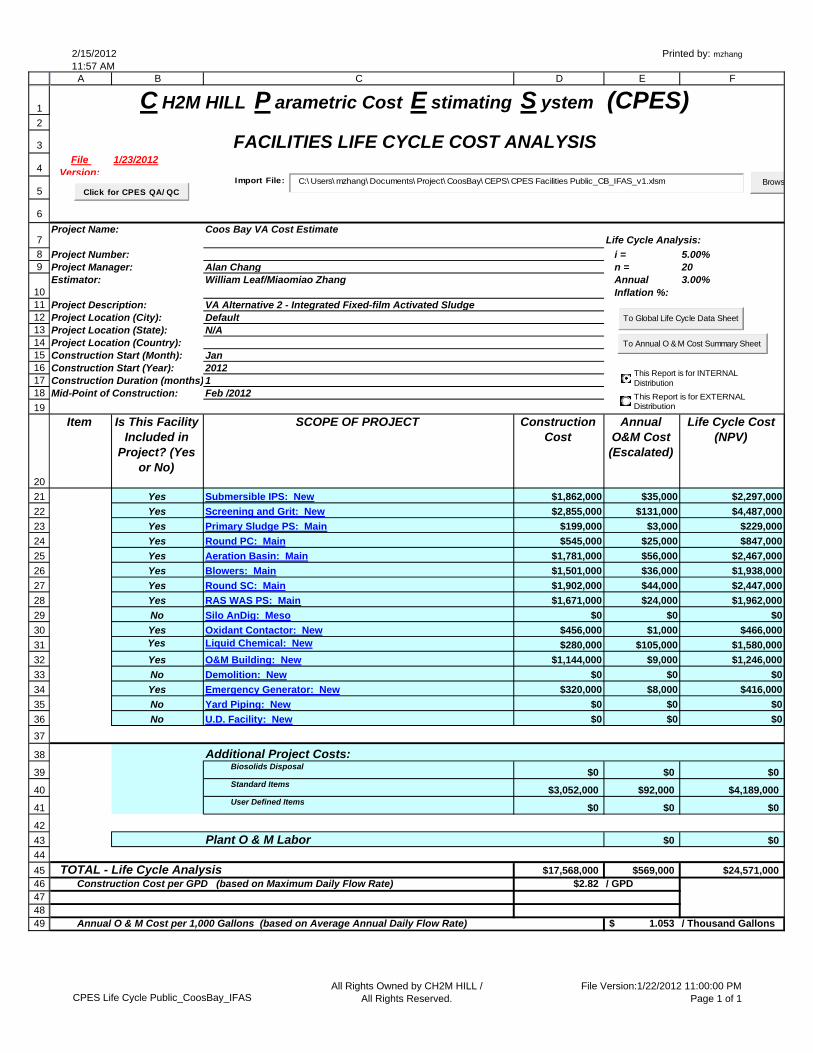
Project Description: VA Alternative 2 - Integrated Fixed-film Activated SludgeProject Location (City): DefaultProject Location (State): N/AProject Location (Country):Construction Start (Month): JanConstruction Start (Year): 2012Construction Duration (months) 1Mid-Point of Construction: Feb /2012
Item Is This Facility Included in
Project? (Yes or No)
SCOPE OF PROJECT Construction Cost
Annual O&M Cost (Escalated)
Life Cycle Cost (NPV)
Yes Submersible IPS: New $1,862,000 $35,000 $2,297,000
Yes Screening and Grit: New $2,855,000 $131,000 $4,487,000
Yes Primary Sludge PS: Main $199,000 $3,000 $229,000
Yes Round PC: Main $545,000 $25,000 $847,000
Yes Aeration Basin: Main $1,781,000 $56,000 $2,467,000
Yes Blowers: Main $1,501,000 $36,000 $1,938,000
Yes Round SC: Main $1,902,000 $44,000 $2,447,000
Yes RAS WAS PS: Main $1,671,000 $24,000 $1,962,000
No Silo AnDig: Meso $0 $0 $0
Yes Oxidant Contactor: New $456,000 $1,000 $466,000Yes Liquid Chemical: New $280,000 $105,000 $1,580,000
Yes O&M Building: New $1,144,000 $9,000 $1,246,000
No Demolition: New $0 $0 $0
Yes Emergency Generator: New $320,000 $8,000 $416,000
No Yard Piping: New $0 $0 $0
No U.D. Facility: New $0 $0 $0
Additional Project Costs:Biosolids Disposal
$0 $0 $0Standard Items
$3,052,000 $92,000 $4,189,000User Defined Items
$0 $0 $0
Plant O & M Labor $0 $0
TOTAL - Life Cycle Analysis $17,568,000 $569,000 $24,571,000Construction Cost per GPD (based on Maximum Daily Flow Rate) $2.82 / GPD
Annual O & M Cost per 1,000 Gallons (based on Average Annual Daily Flow Rate) 1.053$ / Thousand Gallons
C H2M HILL P arametric Cost E stimating S ystem (CPES)
FACILITIES LIFE CYCLE COST ANALYSIS
BrowsC:\ Users\ mzhang\ Documents\ Project\ CoosBay\ CEPS\ CPES Facilities Public_CB_IFAS_v1.xlsmImport File:
To Global Life Cycle Data Sheet
To Annual O & M Cost Summary Sheet
This Report is for INTERNAL Distribution
This Report is for EXTERNAL Distribution
Click for CPES QA/ QC
All Rights Owned by CH2M HILL /All Rights Reserved.CPES Life Cycle Public_CoosBay_IFAS
File Version:1/22/2012 11:00:00 PMPage 1 of 1