Embed Size (px)
Citation preview

1
ROADS TASK FORCE Thematic Analysis
Roads Task Force - Technical Note 10 What is the capacity of the road network for private motorised traffic and how has this changed over time? Introduction
This paper forms one of a series of thematic analyses, produced to contribute to the Roads Task Force Evidence Base. It looks at the topic of “Road capacity in London” and changes in capacity over time.
Summary
• Road capacity, defined as the maximum design capacity of a given roadway in London at link and junction level for motorised traffic, is well understood for different lanes and carriageway widths.
• “Effective” capacity is the capacity available after many random influences such as the driver behaviour of individuals, changing road conditions and weather have interacted to remove an element of available capacity. The “effective” capacity at the link, junction and network level available for utilisation by traffic is not currently monitored or fully understood.
• The TLRN is characterised by east - west high volume roads with limited changes in capacity across their length, e.g. the A13. London’s north – south corridors are characterised by high variations in capacity along their length e.g. A24.
• The north - south corridors have a higher share of movement by buses and coaches, and effective movement on roads is also determined by capacity utilisation by public transport.
• TfL has calculated the proportion of network capacity for private motorised trips lost relative to 1996. This is estimated to be 30 per cent in central London, 15 per cent in inner London and 5 per cent in outer London.
• Between 2008/09 and 2011/12 the total number of capacity constrained junctions across London has decreased from 380 to 354, a decrease of 7 per cent.
• In considering the capacity of the road network, it is important to consider the capacity in terms of ‘total people movement’, including travel by public transport, cycle and on foot. Where capacity for general traffic has been moved, this often (but not always) reflects reallocation of available capacity to other forms of ‘on road’ movement.

2
ROADS TASK FORCE Thematic Analysis
What is road capacity and how does it differ for different road types?
Road capacity is the maximum potential capacity of a given roadway. It is usually expressed in terms of vehicles per hour or day. The UK Highways Agency in advice note TA 79/99 has analysed the traffic flows on urban trunk roads in Greater and Outer London to assess the capacities that can be achieved for different road types and widths. In TA 79/99 capacity is defined as the maximum sustainable flow of traffic passing in one hour, under favourable road and traffic conditions.
Figure 1 Types of urban roads and the features that distinguish them based on national guidelines issued by the Highways Agency
The flows (design link capacities) given in the tables are the maximum that typical inter-urban roads based on national guidelines can carry consistently in an hour. The principal factors including lanes and carriageway widths that may affect flow levels on urban roads are given in Figures 1, 2 and 3.
The capacity of the lower width roads will be significantly reduced by parking and temporary width restrictions caused by such activities as maintenance and road works. The lowest widths are unlikely to be suitable for bus routes or for significant volumes of heavy goods vehicles.

3
ROADS TASK FORCE Thematic Analysis
When a road is designed, traffic engineers assume there are no limits to how a road can be utilised. They assume all roads are open, for example, and limitations such as weather which could hamper driving conditions are not factored in.
Figure 2 Capacities of urban roads – one-way hourly flows in each direction
Figure 3 Capacities of urban one-way roads, hourly flows
There are numerous limitations on road capacity which make it highly unusual for roads to attain their stated design capacities. Furthermore, in many cases efforts are undertaken to restrain road capacity for the purposes of limiting traffic to reduce congestion, improve journey time reliability or address environmental problems.
One of the biggest constraints on road capacity is driver behaviour. Inattentive driving, speeding, reckless driving and other behaviour can slow overall traffic. Likewise, failure to merge in an orderly fashion, frequent exits and entrances, also cause traffic to slow.
Therefore any change in prevailing conditions results in a change in the capacity of a road or road network. In other words capacity is stochastic in nature (involving chance or probability), because of differences in individual driver behaviour and changing road and weather conditions.
4
ROADS TASK FORCE Thematic Analysis
Capacity is a central concept in the design of roads and traffic control. It is desirable to be able to predict the times and places where congestion occurs, the amount of delay involved, and the volumes of traffic expected in bottle necks. Therefore it is important that capacity is clearly defined, is measurable, and can be used in modelling and operational decision making.
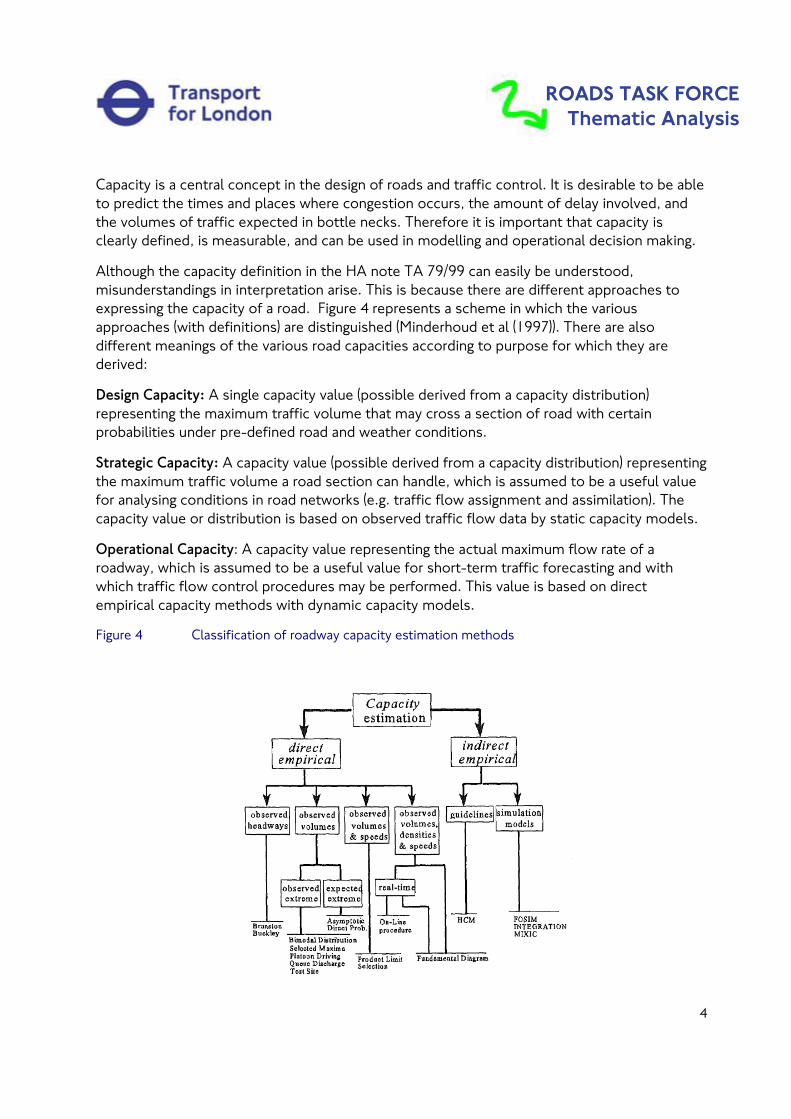
Although the capacity definition in the HA note TA 79/99 can easily be understood, misunderstandings in interpretation arise. This is because there are different approaches to expressing the capacity of a road. Figure 4 represents a scheme in which the various approaches (with definitions) are distinguished (Minderhoud et al (1997)). There are also different meanings of the various road capacities according to purpose for which they are derived:
Design Capacity: A single capacity value (possible derived from a capacity distribution) representing the maximum traffic volume that may cross a section of road with certain probabilities under pre-defined road and weather conditions.
Strategic Capacity: A capacity value (possible derived from a capacity distribution) representing the maximum traffic volume a road section can handle, which is assumed to be a useful value for analysing conditions in road networks (e.g. traffic flow assignment and assimilation). The capacity value or distribution is based on observed traffic flow data by static capacity models.
Operational Capacity: A capacity value representing the actual maximum flow rate of a roadway, which is assumed to be a useful value for short-term traffic forecasting and with which traffic flow control procedures may be performed. This value is based on direct empirical capacity methods with dynamic capacity models.
Figure 4 Classification of roadway capacity estimation methods

5
ROADS TASK FORCE Thematic Analysis
Estimation of capacities on single links
Estimation of empirical capacity values in practical circumstances is not a trivial problem. Capacity is a theoretical notion that lacks a generally accepted operational definition from which an unambiguous method of measurement may be defined.
There is, however, a more fundamental issue that will need addressing. In conventional link-based network analysis capacity is defined by the maximum number of vehicles (or passenger car units) that can pass a point in a fixed time. Such throughput capacity can depend on other flows in the system, so leading to a ‘non-separable’ problem, and the effective capacity of a channel can be limited by that of a bottleneck, where links are connected dynamically by the route pattern. Therefore, summing link capacities is not sufficient to define the effective capacity of a network.
In summary, even at link level an empirically well-measurable, theoretically valid, quantitative expression of roadway capacity is still lacking and further research must be carried out to determine a useful definition of link capacity for various applications.
Utilisation of capacity on the TLRN
An analysis of the width of carriageway on the TLRN (the top 5 per cent of the London road network that carries 30 per cent of the network traffic) shows large differences the capacity available for network operations, see Figure 5. The network is characterised by east - west high volume roads with limited changes in capacity across their length, e.g. the A13. The north – south corridors are characterised by high variations in capacity along their length e.g. A24.

6
ROADS TASK FORCE Thematic Analysis
Figure 5 Width of carriageway on the TLRN
The efficiency of the TLRN in moving traffic can be characterised by dividing the annual average daily flow by metre of carriageway width. Figure 6 shows in more stark contrast the capability of east - west corridors and the top part of the outer orbital (A406) TLRN corridors to deliver high volumes of traffic compared to the north - south corridors.
Figure 6 Flow per metre of carriageway width on the TLRN
The north - south corridors have a higher share of movement by buses and coaches, so that effective movement on roads is also determined by capacity utilisation by public transport.
7
ROADS TASK FORCE Thematic Analysis
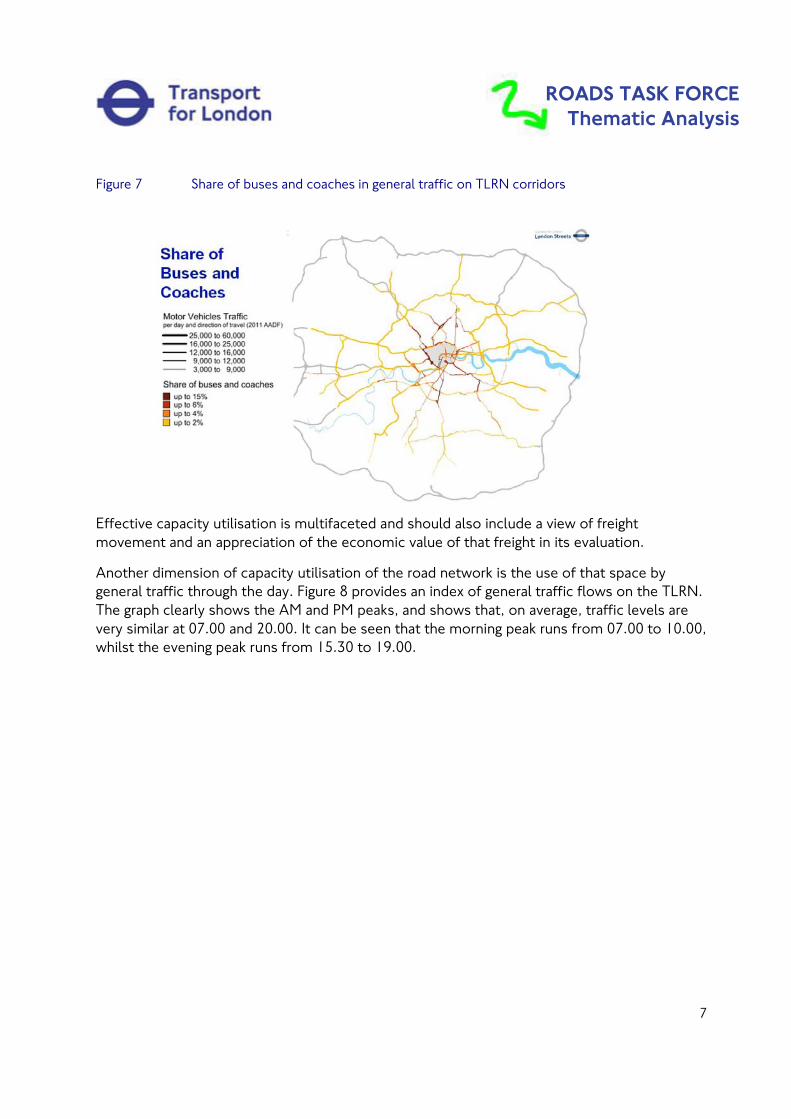
Figure 7 Share of buses and coaches in general traffic on TLRN corridors
Effective capacity utilisation is multifaceted and should also include a view of freight movement and an appreciation of the economic value of that freight in its evaluation.
Another dimension of capacity utilisation of the road network is the use of that space by general traffic through the day. Figure 8 provides an index of general traffic flows on the TLRN. The graph clearly shows the AM and PM peaks, and shows that, on average, traffic levels are very similar at 07.00 and 20.00. It can be seen that the morning peak runs from 07.00 to 10.00, whilst the evening peak runs from 15.30 to 19.00.

8
ROADS TASK FORCE Thematic Analysis
Figure 8 TLRN 24 hour weekday flow index profile
0.00
0.20
0.40
0.60
0.80
1.00
1.20
1.40
1.60
1.80
Mid
nigh
t to
1am
1am
to 2
am
2am
to 3
am
3am
to 4
am
4am
to 5
am
5am
to 6
am
6am
to 7
am
7am
to 8
am
8am
to 9
am
9am
to 1
0am
10am
to 1
1am
11am
to 1
2pm
12pm
to 1
pm
1pm
to 2
pm
2pm
to 3
pm
3pm
to 4
pm
4pm
to 5
pm
5pm
to 6
pm
6pm
to 7
pm
7pm
to 8
pm
8pm
to 9
pm
9pm
to 1
0pm
10pm
to 1
1pm
11pm
to M
idni
ght
Any strategies that help make traffic flow smoother across the day enable better overall capacity utilisation of the road network. Such strategies include the charging of road works in traffic sensitive times and changes in work patterns by making working hours more flexible, among others.
Estimation of capacities of the road network across London
In London where the road network is characterised by a dense road network, junctions, signalised junctions and key pinch points (e.g. Blackwall Tunnel and other river crossings) are the controlling factor in determining effective traffic throughput and ultimately the capacity of the network.
Many factors come into play when attempting to calculate the capacity of signalised junctions and the capacity of junctions and these vary greatly on a case by case basis. Thus, it is difficult to state a range of values for the capacity of a junction arm in order to state a best case – worst case range of capacity for the network.
In a road network made up of links and junctions both static and throughput capacities contribute to and ultimately determine the effective capacity of the whole network. The complexities of road network layouts in terms of nodes and junctions and their interconnections, driver behaviour, and constant dynamic interventions on the network e.g. road works mean that network capacities are lower than the capacities of their individual links.
9
ROADS TASK FORCE Thematic Analysis
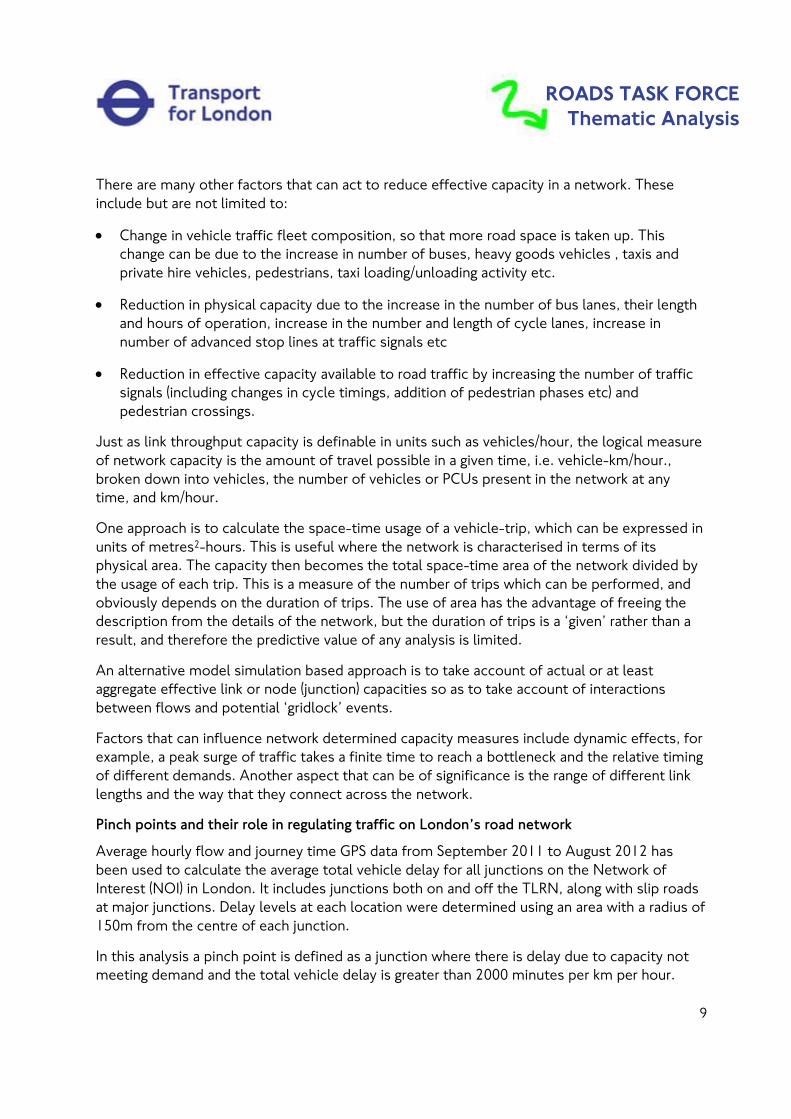
There are many other factors that can act to reduce effective capacity in a network. These include but are not limited to:
• Change in vehicle traffic fleet composition, so that more road space is taken up. This change can be due to the increase in number of buses, heavy goods vehicles , taxis and private hire vehicles, pedestrians, taxi loading/unloading activity etc.
• Reduction in physical capacity due to the increase in the number of bus lanes, their length and hours of operation, increase in the number and length of cycle lanes, increase in number of advanced stop lines at traffic signals etc
• Reduction in effective capacity available to road traffic by increasing the number of traffic signals (including changes in cycle timings, addition of pedestrian phases etc) and pedestrian crossings.
Just as link throughput capacity is definable in units such as vehicles/hour, the logical measure of network capacity is the amount of travel possible in a given time, i.e. vehicle-km/hour., broken down into vehicles, the number of vehicles or PCUs present in the network at any time, and km/hour.
One approach is to calculate the space-time usage of a vehicle-trip, which can be expressed in units of metres2-hours. This is useful where the network is characterised in terms of its physical area. The capacity then becomes the total space-time area of the network divided by the usage of each trip. This is a measure of the number of trips which can be performed, and obviously depends on the duration of trips. The use of area has the advantage of freeing the description from the details of the network, but the duration of trips is a ‘given’ rather than a result, and therefore the predictive value of any analysis is limited.
An alternative model simulation based approach is to take account of actual or at least aggregate effective link or node (junction) capacities so as to take account of interactions between flows and potential ‘gridlock’ events.
Factors that can influence network determined capacity measures include dynamic effects, for example, a peak surge of traffic takes a finite time to reach a bottleneck and the relative timing of different demands. Another aspect that can be of significance is the range of different link lengths and the way that they connect across the network.
Pinch points and their role in regulating traffic on London’s road network
Average hourly flow and journey time GPS data from September 2011 to August 2012 has been used to calculate the average total vehicle delay for all junctions on the Network of Interest (NOI) in London. It includes junctions both on and off the TLRN, along with slip roads at major junctions. Delay levels at each location were determined using an area with a radius of 150m from the centre of each junction.
In this analysis a pinch point is defined as a junction where there is delay due to capacity not meeting demand and the total vehicle delay is greater than 2000 minutes per km per hour.
10
ROADS TASK FORCE Thematic Analysis
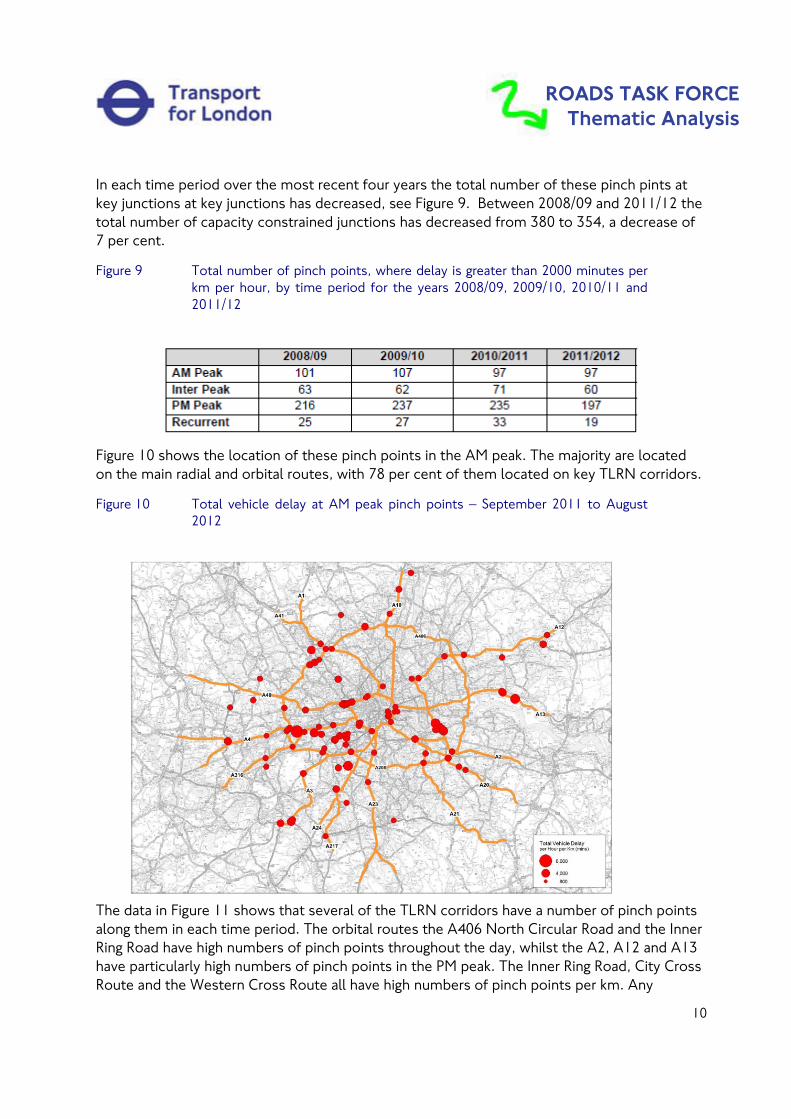
In each time period over the most recent four years the total number of these pinch pints at key junctions at key junctions has decreased, see Figure 9. Between 2008/09 and 2011/12 the total number of capacity constrained junctions has decreased from 380 to 354, a decrease of 7 per cent.
Figure 9 Total number of pinch points, where delay is greater than 2000 minutes per km per hour, by time period for the years 2008/09, 2009/10, 2010/11 and 2011/12
Figure 10 shows the location of these pinch points in the AM peak. The majority are located on the main radial and orbital routes, with 78 per cent of them located on key TLRN corridors.
Figure 10 Total vehicle delay at AM peak pinch points – September 2011 to August 2012
The data in Figure 11 shows that several of the TLRN corridors have a number of pinch points along them in each time period. The orbital routes the A406 North Circular Road and the Inner Ring Road have high numbers of pinch points throughout the day, whilst the A2, A12 and A13 have particularly high numbers of pinch points in the PM peak. The Inner Ring Road, City Cross Route and the Western Cross Route all have high numbers of pinch points per km. Any

11
ROADS TASK FORCE Thematic Analysis
possible improvements on these routes may be of a higher priority in order to smooth traffic flow along them.
Figure 11 Number of pinch points on key routes, 2008/09 to 2011/12
MIT study – Evidence for the influence of intervention factors on network capacity
The Massachusetts Institute of Technology built a simulation model for TfL to understand the influence of street works and parking interventions in reducing capacity, where different levels of these interventions were measured in a common capacity (PCU-km per hour) and compared with the base case which did not include any interventions for two sub networks (Victoria station area and Marylebone Road).
The Victoria station area and Marylebone Road were modelled in proprietary software called MITSIMLab with each network flooded by vehicles by scaling the origin-destination (OD) matrix. The network is assumed to reach its capacity when pre-trip queues start forming, that is no further vehicles can be loaded in the network. The total distance travelled by all the vehicles in one hour when the network has reached its capacity were noted and converted to PCU-km per hour. The average speeds of the vehicles at capacity were also compared.

12
ROADS TASK FORCE Thematic Analysis
The results of the capacity analysis predicted a drop in network capacities and average speeds under the modelled scenarios correctly as expected. The comparisons of network and link capacities in the models reveal that the capacities of the critical links are usually lower than the overall network capacities.
The study found that while research had been done to analyse capacity using the speed-flow diagram and other approaches, there had been few similar simulation based methods undertaken where capacity has been determined by increasing the travel demand and recording the maximum throughput. Where it had been carried out the analysis had been limited to the link level and no literature was found on application of this methodology at the network level.
A key recommendation was the requirement to understand the relationship between link, junction and overall network capacity, in aiding the highway authority to maintain the highest level of effective network capacity.
Empirical evidence relating to the measurement of capacity on London’s roads
The best empirical evidence comes from an estimation technique that uses changes in the relationship between traffic speeds and flows in central, inner and outer London over the past 20 years.
Capacity can be defined as the amount of traffic a system can accommodate for a given traffic speed. If capacity is held constant, and traffic increases, then traffic speeds will fall. The proportional change between these two factors can be expressed as an elasticity of traffic speed with respect to flow. These factors tell us if traffic flow increased how much we would expect the associated traffic speed for that functional area to fall.
Using established elasticities if the speeds change by a different amount than expected, then the difference will reflect a change in the capacity of the road network.
The general relationship observed is that across all sectors of London traffic volumes have fallen, as have speeds in the long term although recently in the last six years or so traffic speeds have broadly stabilised. Normally as traffic volumes fall we would expect traffic speeds to increase. The change in speeds we have observed suggests that the capacity available to move traffic has fallen.
TfL has calculated for each of the years for which speed and flow data are available an index of estimated road network capacity based on the position in 1996, Figure 12 (TfL, 2011). It is seen that capacity reduced most in central London – down by about 30 per cent. The loss of capacity in this area as in inner and outer London has been fairly steady, other than around the introduction of congestion charging in 2003. In inner London the loss was about 15 per cent, with an approximate 5 per cent loss in outer London. This reduced capacity has impacted on levels of service on the road network, reducing average traffic speeds and increasing congestion. All other things being equal this reduced level of service will cause marginal road users to make alternative travel arrangements, moving their trips onto alternative modes, feeding back in the form of reduced ‘expressed demand’ on the network.

13
ROADS TASK FORCE Thematic Analysis
Figure 12 Index of London’s highway capacity (1996=100)
70
80
90
100
110
1992 1994 1996 1998 2000 2002 2004 2006 2008 2010
Hig
hway
capa
city
, 199
6 =
100
Outer Inner Central
TLRN and borough roads Unfortunately an equivalent similar long term data series for traffic flows and speeds on the TLRN and BPRN stretching back 20 years does not exist making it difficult to establish appropriate elasticities to repeat this work for these road networks. In the 10 year period between 2000 and 2010, traffic in greater London has fallen 10 per cent while that on the TLRN has only fallen 1.5 per cent. The TLRN is 5 per cent of the capital’s road network by length but carries 30 per cent of the Capitals traffic by volume. Traffic speeds on the TLRN have been broadly static over the last six years, but here the key observation is that prior to 2006, before reliable speed observations exist, there were large changes in capacity on London’s roads led primarily by the introduction of bus lanes. Figure 13 details the cumulative bus lane introductions across London (mainly on the TLRN) between 2000 and 2008, and it can be seen that by 2006 the take of capacity by bus lanes had largely stabilised (Closure of LB1 programme 1999 -2006).

14
ROADS TASK FORCE Thematic Analysis
Figure 13 Cumulative bus lane km introduced onto the London road network between 2000 and 2008
Londonwide2000 2001 2002 2003 2004 2005 2006 2007 2008
Cumulative bus lane km on the London network. 162 181 227 245 257 263 273 275 279Change since previous year 18.3 46.1 18.6 11.7 5.9 9.9 2.7 3.9 Both the TLRN and BPRN operate above capacity in most AM and PM peaks. In these time slots, when traffic flow approaches the maximum capacity of the network, then small increases in traffic, or small reductions in effective road space (such as incidents reducing capacity short term), have large disproportionate effects on journey times leading to congestion and increased unreliability. Recommendations and conclusion Road capacity as the maximum design capacity of a given roadway in London at link and junction level is well understood for different lanes and carriageway widths. The “effective” road capacity is the capacity available after many random influences such as the driver behaviour of individuals, changing road conditions and weather have interacted to remove an element of available capacity. The “effective” capacity at the link, junction and network level available for utilisation by traffic is not currently monitored or fully understood. Transport for London has a requirement to identify, measure and monitor the capacity of the road network in London in order that it can understand how it can manage the supply of physical and effective road capacity and in turn through management of road capacity influence road network outcomes such as journey time reliability. The ability to account for road capacity is characterised as the need to solve a number of research problems: • The need for a framework that can account for road capacities at the link and junction
level, that also allows the business to aggregate these capacities to produce a capacity value for different geographic parts of the road network. The business understands that summing link capacities is not sufficient to define the effective capacity of a network as throughput capacity can depend on other flows in the system. Both static and throughput capacities contribute to and ultimately determine the effective capacity of the whole network.
• The need to understand how disruption events and activities on the network account for changes to capacity at the link and junction level and in turn their impact on road capacity at the network level. The location of disruption events in both space and time will have different impacts on road network capacity. It is important to know which are the most important disruption events and activities to manage in order to maintain the highest level of effective network capacity. This could best be achieved through the identification of a
15
ROADS TASK FORCE Thematic Analysis
modelling or simulation framework, so that the capacity impacts of interventions, either in the aggregate or individually, can be quantified.
• The need to develop a common currency of capacity impacts such that different disruption events and activities on the network can be expressed on a common basis. This would facilitate exploration of traffic impacts in conjunction with a suitable modelling or simulation framework, and would provide a basis for assessing the relative scale or intensity of the different types of intervention. Given that the effective capacity of an urban road network is largely determined by its junctions, the emphasis might be concentrated in terms of factors affecting junction performance.
The development of tools and new models will enable TfL to make significant progress in understanding the linkages between link, junction and network level capacity in the next couple of years. References Design Manual for Roads and Bridges Part 3, Part 3, TA 79/99 Amendment NO 1 Traffic Capacity of Urban Roads, Highways Agency, May 1999. Minderhoud, M. M., Botma, H., and Bovy, P. H. L. (1997), “Assessment of Roadway Capacity Estimation Methods”, Transportation Research Record No. 1572, pp. 59-67. Identification of Pinch Points, Valves and Hotspots in London, Traffic Analysis Centre, Network Performance, Traffic Directorate, (March 2013). Massachusetts Institute of Technology Evaluating the Impact of Interventions on Network Capacity ITS Lab, Massachusetts Institute of Technology, May 7, 2010. Travel in London – Report 4, Transport for London (2011).
![Technical Note No.31 CAPACITY SELECTION II [CALCULATION ... · PDF fileinverter technical note no. 31 capacity selection ii [calculation procedure] (continuous operation) (cyclic operation)](https://img.pdfslide.net/doc/110x75/5a7953c27f8b9aee3b8cec01/technical-note-no31-capacity-selection-ii-calculation-technical-note-no-31.jpg)


![Capacity Development Practice Note - UNDPUNDP Practice Note: Capacity Development 3 SECTION I: CAPACITY DEVELOPMENT BASICS …[C]apacity development is much more than supporting training](https://img.pdfslide.net/doc/110x75/60add3446bc2ba0752724784/capacity-development-practice-note-undp-practice-note-capacity-development-3.jpg)


![TECHNICAL NOTE No. 30 CAPACITY SELECTION II … TECHNICAL NOTE No. 30 CAPACITY SELECTION II [DATA] INVERTER SH-060003ENG-G (1009) Specifications subject to change without notice. INVERTER](https://img.pdfslide.net/doc/110x75/5b0d7cd17f8b9af65e8db64d/technical-note-no-30-capacity-selection-ii-technical-note-no-30-capacity-selection.jpg)