Embed Size (px)
Citation preview

TECHNICAL NOTE 75 The hydraulic characteristics of plastic land drainage pipe
c. W. DENNIS, ANCAE.1MIAgrE'
Land drainage in the UK is conventionally carried out using short lengths of clayware pipe, water entry to the system being via the gap between individual pipes. Since 1965 plastic drain pipes, of both smooth and corrugated construction, have been gradually introduced, in which the water enters via holes or perforations in the pipe wall. Hydraulic design data for the new product was lacking and could not readily be extracted from existing literature because of the unusual types of roughness involved. Laboratory tests, which form the basis of this Note, were carried out and plotted in the conventional form of friction factor against Reynolds' number. These graphs give information on flow in the laminar region and on the different types of change to transitional flow which may occur. More practically, the tests show that the pipes currently available can be divided into three broad categories based on the type of roughness. Finally, it is suggested that the three categories can form a basis for hydraulic design, thus removing the need to test each new land drainage pipe as it appears on the market.
Notation D internal diameter f friction factor, 2gDi/Va g gravitational acceleration, LIT2 i hydraulic gradient R Reynolds' number, VD/v
Y kinematic viscosity V average forward velocity
Introduction For many years land drainage in the UK has been conventionally carried out using clayware pipes in the internal diameter range 63-230 mm, the most com- mon sizes being 76 mm and 102 mm. Water entry with such a system is by way of the gaps between the individual 304 mm long pipes, the amount penetrating the pipe wall being negligible.
2. Since 1965 the use of smooth walled and corrugated plastic pipe, in which entry is via sawn or punched perforations, has gradually increased. In 1972 such pipes took 5-10% of the total market. In order to be competi- tive with the traditional product on a cost basis the plastic pipes have generally been produced with an internal diameter of 45-60 mm, although larger sizes have been available in order to provide a complete system of lateral and main drains obtainable from one manufacturer. The hydraulic capacity of the smaller plastic pipes has necessarily been considerably less than that of the usual sizes of clayware pipe and this has imposed a restriction on the area of land that can be drained by each lateral. Design criterial.a give the area drained per lateral for various combinations of drain gradient and drainage ~ _ _ _ ~ ~ Written discussion closes 15 May, 1973 for publication in Proceedings, Part 2.
Experimental Unit, Cambridge. * Higher Scientific Officer, Ministry of Agriculture, Fisheries and Food, Field Drainage
27 3
T E C H N I C A L N O T E 7 5
design rate, the design rate being the depth of water which is required to be removed every 24 hours.
3. When the problem of providing design criteria for the new plastic pipes was first tackled in the UK the amount of relevant hydraulic data was found to be small. Thus, Yarnell and Woodward3 carried out comprehensive tests on clayware pipes and numerous workers have investigated the flow in large and, in particular, non-corrugated pipes. For example, Ackers4 produced design criteria for most types of non-corrugated pipe and Colebrook and White5-7 had earlier worked on artificially roughened pipes, the reduction of carrying capacity with age and behaviour in the transitional region. MorrisB considered the effect of different types of roughness, while Prosser et aL9 con- sidered the validity of using one of the exponential formulae rather than the Colebrook-White transition law. The amount of published data on slotted or perforated pipe in the diameters and of the types concerned was restricted to Brink and NilssonlO who investigated unperforated pipes, both smooth and corrugated, and one smooth perforated pipe.
4. In view of the lack of information it was decided to test a representative selection of the pipes on the market in the UK. This Paper presents the data obtained and suggests a method which will reduce the need to test each individual new plastic pipe as it appears on the land drainage market.
Principles 5. Land drainage pipes are laid at absolute gradients which range from
virtually zero up to about S%, although the more common range is from 0.1 % to 5%. Water enters the pipe along the whole length via the gaps or perfora- tions; the philosophy of design in the UK is that, at the design rate, the drain should flow part full for most of its length and just full, but under very low pressure, for the last few metres. On occasions when the design rate is exceed- ed, perhaps two or three times a year, the whole pipe runs under pressure, with a consequent elevation of the water table.
6. The chief difference between the present laboratory approach and actual field conditions is that in the former case there is no lateral inflow into the pipe through the perforations but in the latter there is. Wesseling and Hornmall investigated this point and concluded that the extra resistance caused by lateral inflow was insignificant in the range covered by their experiment, i.e. up to velocities through the perforation of 19 mm/s. Some idea of the inflow velocities occurring in practice can be obtained by considering a 50 mm smooth plastic pipe which will carry 2.3 l/s at 4% gradient. If the completely typical case of 20 m drain spacing and a design rate of 12.7 mm is taken, again a t 4% gradient, then the area served by the drain is 1.57 ha and the length of the drain 780 m. Since the area of perforation per metre length of the parti- cular pipe concerned is 620 mm2 it follows that the mean inflow velocity is 4.7 mm/s, which is well within the limit of 19 mm/s. However, it is as well to bear in mind that both the design rate and the drain spacing could be doubled, to give a velocity of 18.8 mmjs.
7. Van Der Bekenla concluded that lateral inflows up to 3 ml/s per metre could be ignored, this being a rather different expression of the same problem, which may be compared with 2.9 ml/s per metre for the 20 m, 12.7 mm case 274
PLASTIC LAND DRAINAGE P IPE
Slou.hlready p m d
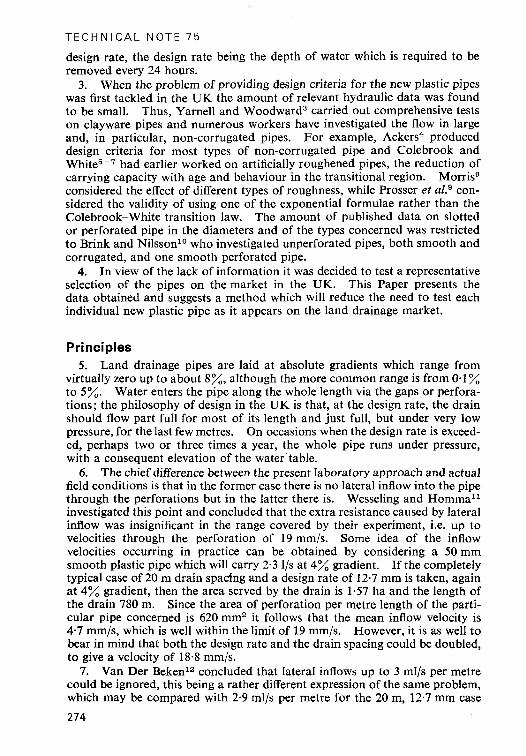
Fig. 1. General layout of experimental apparatus . - l
b
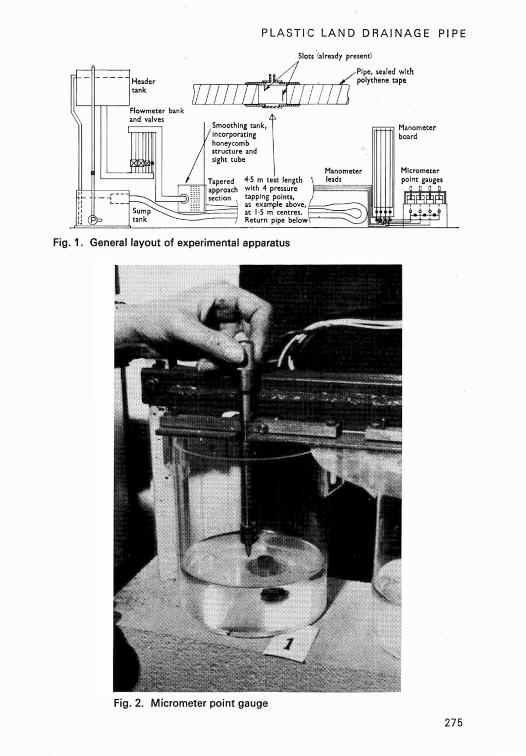
Fig. 2. Micrometer point gauge
275
T E C H N I C A L N O T E 7 5 .. - . , ,'l.., i.,l'f.T ,.,,-, -c --- :
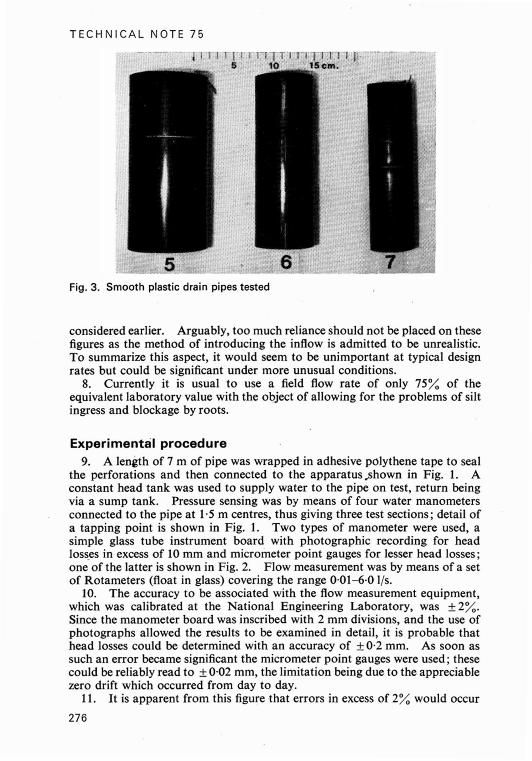
6 Fig. 3. Smooth plastic drain pipes tested
considered earlier. Arguably, too much reliance should not be placed on these figures as the method of introducing the inflow is admitted to be unrealistic. To summarize this aspect, it would seem to be unimportant at typical design rates but could be significant under more unusual conditions.
equivalent laboratory value with the object of allowing for the problems of silt 8. Currently it is usual to use a field flow rate of only 75% of the
ingress and blockage by roots.
Experimental procedure 9. A length of 7 m of pipe was wrapped in adhesive polythene tape to seal
the perforations and then connected to the apparatus-shown in Fig. 1. A constant head tank was used to supply water to the pipe on test, return being via a sump tank. Pressure sensing was by means of four water manometers connected to the pipe at 1.5 m centres, thus giving three test sections; detail of a tapping point is shown in Fig. 1. Two types of manometer were used, a simple glass tube instrument board with photographic recording for head losses in excess of 10 mm and micrometer point gauges for lesser head losses; one of the latter is shown in Fig. 2. Flow measurement was by means of a set of Rotameters (float in glass) covering the range 0.01-6.0 11s.
which was calibrated at the National Engineering Laboratory, was +2%. 10. The accuracy to be associated with the flow measurement equipment,
Since the manometer board was inscribed with 2 mm divisions, and the use of photographs allowed the results to be examined in detail, it is probable that head losses could be determined with an accuracy of fO.2 mm. As soon as
could be reliably read to f 0.02 mm, the limitation being due to the appreciable such an error became significant the micrometer point gauges were used; these
zero drift which occurred from day to day. 11. I t is apparent from this figure that errors in excess of 2% would occur
276
PLASTIC LAND DRAINAGE P IPE
*!
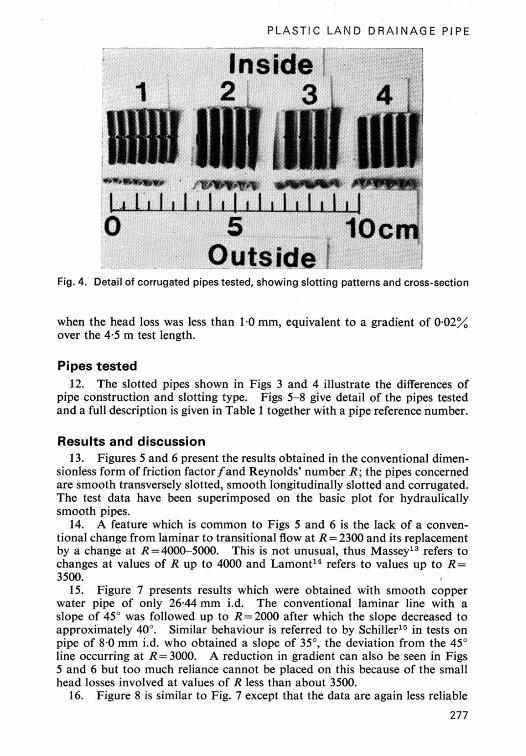
Fig. 4. Detail of corrugated pipes tested, showing slotting patterns and cross-section
when the head loss was less than 1.0 mm, equivalent to a gradient of 0.02% over the 4.5 m test length.
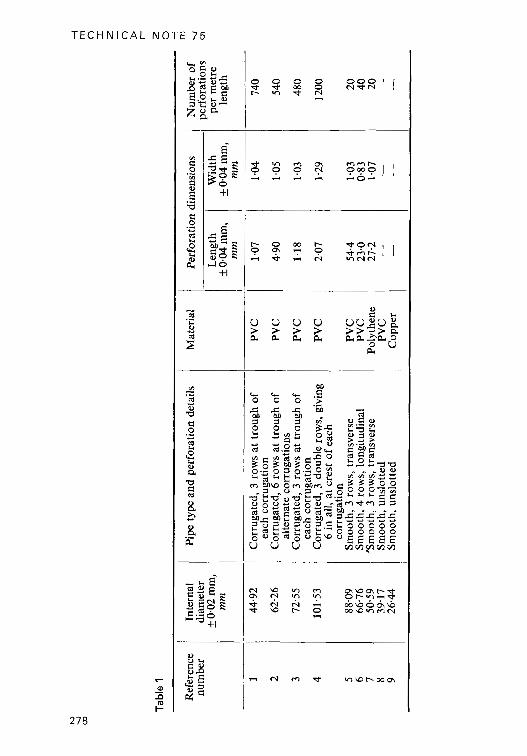
Pipes tested 12. The slotted pipes shown in Figs 3 and 4 illustrate the differences of
pipe construction and slotting type. Figs 5-8 give detail of the pipes tested and a full description is given in Table 1 together with a pipe reference number.
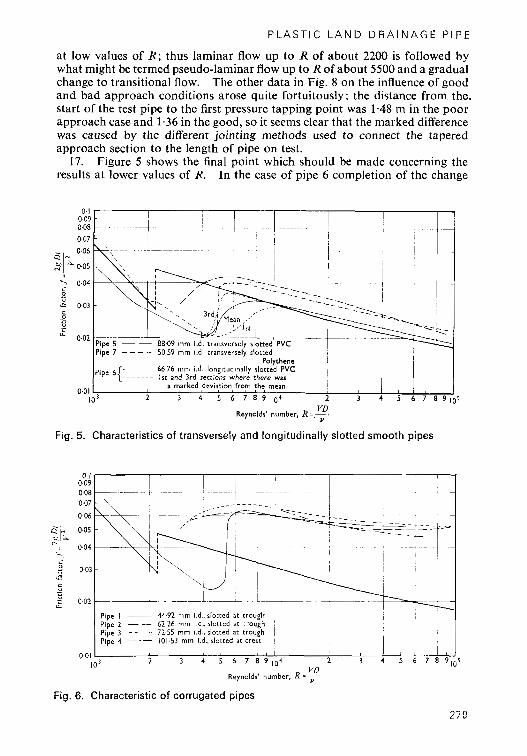
Results and discussion 13. Figures 5 and 6 present the results obtained in the conventional dimen-
sionless form of friction factor f and Reynolds' number R; the pipes concerned are smooth transversely slotted, smooth longitudinally slotted and corrugated. The test data have been superimposed on the basic plot for hydraulically smooth pipes.
tional change from laminar to transitional flow at R=2300 and its replacement 14. A feature which is common to Figs 5 and 6 is the lack of a conven-
by a change at R=4000-5000. This is not unusual, thus MasseyL3 refers to changes at values of R up to 4ooo and Lamontl4 refers to values up to R= 3500.
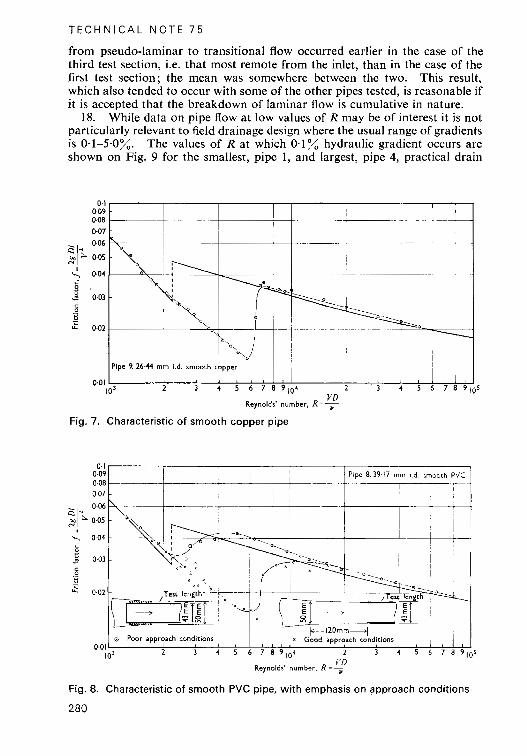
15. Figure 7 presents results which were obtained with smooth copper water pipe of only 26.44 mm i.d. The conventional laminar line with a slope of 45' was followed up to R = 2 W after which the slope decreased t o approximately 40". Similar behaviour is referred to by Schiller16 in tests on pipe of 8.0 mm i.d. who obtained a slope of 35', the deviation from the 45" line occurring at R=3000. A reduction in gradient can also be seen in Figs 5 and 6 but too much reliance cannot be placed on this because of the small head losses involved at values of R less than about 3500.
16. Figure 8 is similar to Fig. 7 except that the data are again less reliable
277
T E C H N I C A L N O T E 7 5
278
E" S E
cl0 +I
__
E E
P L A S T I C L A N D D R A I N A G E P I P E
at low values of R ; thus laminar flow up to R of about 2200 is followed by what might be termed pseudo-laminar flow up to R of about 5500 and a gradual change to transitional flow. The other data in Fig. 8 on the influence of good and bad approach conditions arose quite fortuitously; the distance from the. start of the test pipe to the first pressure tapping point was 1.48 m in the poor approach case and 1.36 in the good, so it seems clear that the marked difference was caused by the different jointing methods used to connect the tapered approach section to the length of pipe on test.
17. Figure 5 shows the final point which should be made concerning the results at lower values of R. In the case of pipe 6 completion of the change
Polythene i
~
66.76 mm i.d. longitudinally slotted PVC 1 s t and 3rd sections where there was
a marked deviation from the mean 0.01 l ,
I Q 3 2 3 4 5 6 7 8 9 1 0 4 2 3 4 5 6 7 8 9 ( 0 5
Reynolds' number, R =,- VD
Fig. 5. Characteristics of transversely and longitudinally slotted smooth pipes
0- l 0 0 9 0.08 , ~~~
- l i ,. ~~~~ ~~~ ~
Y
Pipe I ~ 44.92 mm #.d.. slotted a t trough i Plpe 2 - - 62.26 mm ,.d.. slotted at trough ~
Pipe 3 --- -- 72 55 mm 1.d. slotted a t trough l Pipe 4 101.53 mm i.d.. slotted a t crest I i
,
0.01 I , l 101 2 3 4 5 6 7 8 9 1 ~ 4 2 3 4 5 6 7 8 1
Reynoldr' number, R '7 VD
Fig. 6. Characteristic of corrugated pipes
27 9
T E C H N I C A L N O T E 7 5
from pseudo-laminar to transitional flow occurred earlier in the case of the third test section, i.e. that most remote from the inlet, than in the case of the first test section; the mean was somewhere between the two. This result, which also tended to occur with some of the other pipes tested, is reasonable if it is accepted that the breakdown of laminar flow is cumulative in nature.
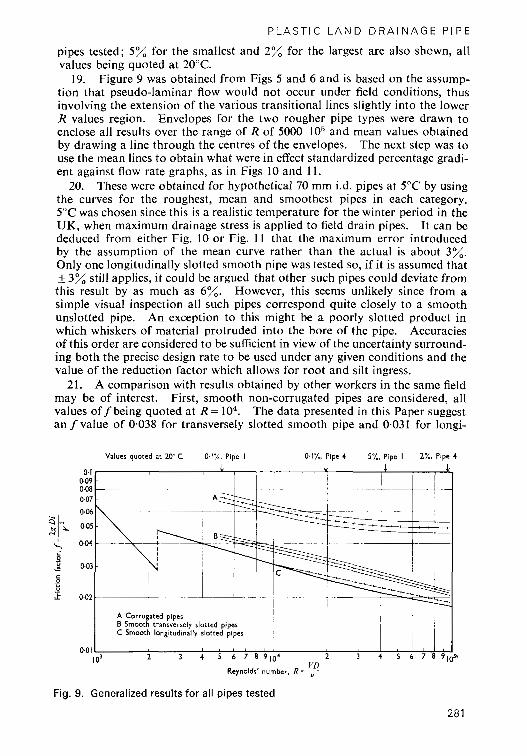
18. While data on pipe flow at low values of R may be of interest it is not particularly relevant to field drainage design where the usual range of gradients is 0.1-5.0%. The values of R at which 0.1% hydraulic gradient occurs are shown on Fig. 9 for the smallest, pipe l , and largest, pipe 4, practical drain
0.01 10’ 2 3 4 5 6 7 8 9 1 0 4 2 3 4 5 6 7 8 9105
VD Reynoldr’ number, R = y
Fig. 7. Characteristic of smooth copper pipe
103 1 3 4 5 6 7 8 9 , 0 4 2 3 4 5 6 7 8 9 1 Reynoldr’ number. R =-
VD 5
Fig. 8. Characteristic of smooth PVC pipe, with emphasis on approach conditions
280
PLASTIC L A N D DRAINAGE PIPE
pipes tested; 5% for the smallest and 2% for the largest are also shcwn, all values being quoted at 20°C.
19. Figure 9 was obtained from Figs 5 and 6 and is based on the assump- tion that pseudo-laminar flow would not occur under field conditions, thus involving the extension of the various transitional lines slightly into the lower R values region. Envelopes for the two rougher pipe types were drawn to enclose all results over the range of R of 5000-105 and mean values obtained by drawing a line through the centres of the envelopes. The next step was to use the mean lines to obtain what were in effect standardized percentage gradi- ent against flow rate graphs, as in Figs 10 and 1 l .
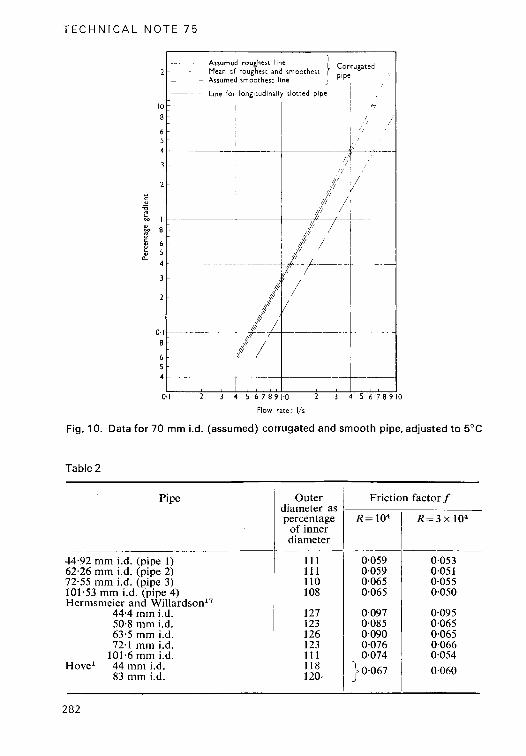
20. These were obtained for hypothetical 70 mm i.d. pipes at 5°C by using the curves for the roughest, mean and smoothest pipes in each category. 5°C was chosen since this is a realistic temperature for the winter period in the UK, when maximum drainage stress is applied to field drain pipes. It can be deduced from either Fig. 10 or Fig. 1 1 that the maximum error introduced by the assumption of the mean curve rather than the actual is about 3%. Only one longitudinally slotted smooth pipe was tested so, if it is assumed that
this result by as much as 6%. However, this seems unlikely since from a simple visual inspection all such pipes correspond quite closely to a smooth unslotted pipe. An exception to this might be a poorly slotted product in which whiskers of material protruded into the bore of the pipe. Accuracies of this order are considered to be sufficient in view of the uncertainty surround- ing both the precise design rate to be used under any given conditions and the value of the reduction factor which allows for root and silt ingress.
21. A comparison with results obtained by other workers in the same field may be of interest. First, smooth non-corrugated pipes are considered, all values off being quoted at R = 104. The data presented in this Paper suggest an fvalue of 0.038 for transversely slotted smooth pipe and 0.031 for longi-
- + 3% still applies, it could be argued that other such pipes could deviate from
Values quoted at ZO'C O.I'/.. Pipe I O.I%, Pipe 4 5%. Pipe I 2%, Pipe 4
I o3 2 3 4 5 6 7 8 9104 V D
Reynoldr' number. R = 7
Fig. 9. Generalized results for all pipes tested
281
T E C H N I C A L N O T E 7 5
. Assumed roughest line ~
' l
Mean of roughest and rrnootherr 1
t 2 c
t
2 3
c i 4 0
Flow r a t e - I/s
Fig. 10. Data for 70 mm i.d. (assumed) corrugated and smooth pipe, adjusted to 5°C
Table 2
Pipe
44.92 mm i.d. (pipe 1)
72.55 mm i.d. (pipe 3) 62.26 mm i.d. (pipe 2)
101.53 mm i.d. (pipe 4) Hermsmeier and Willardson17
44.4 mm i.d. 50.8 mm i.d. 63.5 mm i.d. 72.1 mm i.d.
101.6 mm i.d. Hovel 44 mm i.d.
83 mm i.d.
Outer diameter as percentage
of inner diameter
111 111 110 108
127
126 123
123 111 118 120.
- i l Friction factor f
R= 104
0.059 0.059 0.065 0.065
0.097 0.085 0.090 0.076 0.074 0.067
l -1-
R = 3 X 10⁴
0.053 0.051 0.055 0.050
0.095 0.065 0.065 0.066 0.054 0.060
282
PLASTIC LAND DRAINAGE P IPE
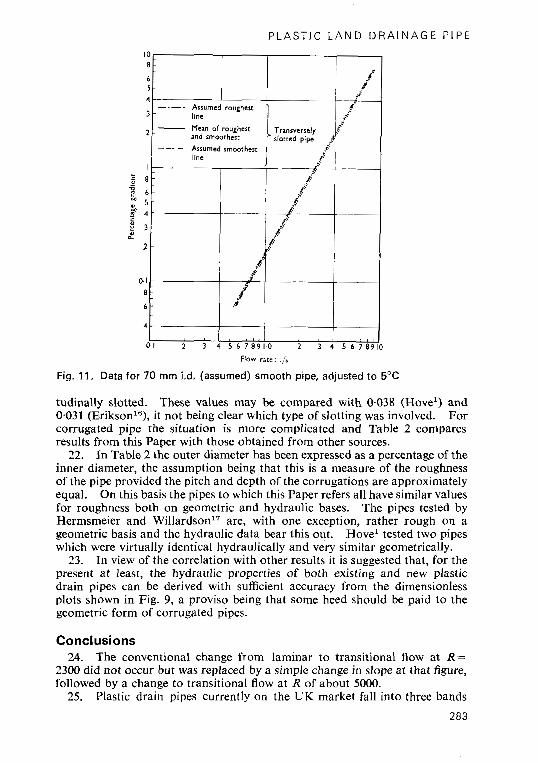
Fig. 11. Data for 70 mm i.d. (assumed) smooth pipe, adjusted to 5°C
tudinally slotted. These values may be compared with 0.038 (Hovel) and 0.031 (Erikson16), it not being clear which type of slotting was involved. For corrugated pipe the situation is more complicated and Table 2 compares results from this Paper with those obtained from other sources.
22. In Table 2 the outer diameter has been expressed as a percentage of the inner diameter, the assumption being that this is a measure of the roughness of the pipe provided the pitch and depth of the corrugations are approximately equal. On this basis the pipes to which this Paper refers all have similar values for roughness both on geometric and hydraulic bases. The pipes tested by Hermsmeier and Willardson17 are, with one exception, rather rough on a geometric basis and the hydraulic data bear this out. Hovel tested two pipes which were virtually identical hydraulically and very similar geometrically.
23. In view of the correlation with other results it is suggested that, for the present at least, the hydraulic properties of both existing and new plastic drain pipes can be derived with sufficient accuracy from the dimensionless plots shown in Fig. 9, a proviso being that some heed should be paid to the geometric form of corrugated pipes.
Conclusions 24. The conventional change from laminar to transitional flow at R =
2300 did not occur but was replaced by a simple change in slope at that figure, followed by a change to transitional flow at R of about 5000.
25. Plastic drain pipes currently on the UK market fall into three bands
283
T E C H N I C A L N O T E 7 5
when their hydraulic characteristics are plotted in the form of friction factor against Reynolds’ number.
26. If the mean of the band referred to in fj 25 is used for all pipes in that category, the error introduced from the point of view of flow at a given gradi- ent is approximately 3%. In view of the other variables presently inherent in field drainage, which mask a figure as low as 3%, it is suggested that the three mean lines on the dimensionless plot can be used as a basis for hydraulic design.
27. A criticism of the approach described in this Paper is that it takes no account of the effect of lateral inflow of water on the hydraulic characteristics of the drain. However, there is evidence which suggests that this aspect is not particularly important.
References 1 . HOVE P. Hydrauliske egenskaper til drenrm (The hydraulic properties of drain-
pipes). Report 15, Agricultural College of Norway, Institute of Agricultural Hydrotechnics, 1969.
2. ZUIDEMA F. C. and SCHOLTEN, J. De afvoercapaciteit van geribbelde plastieken draineerbuizen (The discharge capcity of corrugated plastic drainage pipes). Van Zee Tot Land, 1971,49, Aspecten van het onderzoek in Oostelijk Flevoland,
3. YARNELL D. L. and WOODWARD S. M. The flow of water in drain tile. Bull.
4. ACKERS P. Resistance of fluids flowing in channels and piges. Hydraulics Re-
5. COLEBROOKE C. F. and WHITE C. M. Experiments with fluid friction in royghen-
6. COLEBROOK C. F. and WHITE C. M. The reduction of carrying capacity of pipes
7. COLEBROOK C. F. Turbulent flow in DiDes. with particular reference to the
73-103.
U.S. Dep. Agric., 1920, No. 854.
search Paper 1 , HMSO, London, 1958.
ed pipes. Proc. R . Soc., 1937, 161, Part 906, 367-381.
with age. J. Znstn Civ. Engrs, 1937, 7, Nov., 99-118.
8.
9.
10.
11.
12.
13 .
14.
15.
16.
17.
transition region between the smooth and rough pipe laws. J . Znstn Civ. Engrs, 1939, 11, Feb., 133-156.
MORRIS H. M. Flow in rough conduits. Trans. Am. Soc. Civ. Engrs, 1955,
PROSSER L. E. ef al . Friction losses in turbulent pipe-flow. Proc. Insfn Mech.
BRINK N. and NILSSON S . Das Leistungsvermogen von Dranrohren aus Kunst-
WESSELING J . and HOMMA F. Hydraulic resistances of drain pipes. Neth. J .
VAN DER BEKEN A. Note of an experiment of spatially varied flow in a labora-
MASSEY B. S. Mechanics offluids, 2nd edn. Van Nostrand Reinhold, London,
LAMONT P. A. A review of pipe-friction data and formulae, with a proposed set of exponential formulae based on the theory of roughness. Proc. Znsrn Ciu. Engrs, 1954, Part 3, 3, Apr., 248-275.
SCHILLER L. Experimentelle Untersuchungen zum Turbulenzproblem (Experi- mental investigations into the problem of turbulence). Z. Angew. Math. Mech.,
ERIKSSON J. The flow of water in earthenware and plastic drainpipes. J.
HERMSMEIER L. F. and WILLARDSON L. S. Friction factors for corrugated plastic
120, 373-398.
Engrs, 1951, 165, 88-94.
stoff. Z. Kult-tech. Flurbereinig, 1965, 1, 44-51.
Agric. Sci., 1967, 15, No. 3, 183-197.
tory drain. Private communication, 1967.
1970, 129-130.
1921, 1, NO. 6, 436-444.
Agric. Rationalisation Land Zmprov., 1966, 19, No. 2, 185-190.
tubing. J. Irrig. Drain. Diu. Am. Soc. Civ. Engrs, 1970, 96, 265-271. 284