Embed Size (px)
Citation preview

Technical Protocol for Using Soluble Carbohydrates to Enhance Reductive Dechlorination of Chlorinated Aliphatic
Hydrocarbons
Prepared under Contract #F41624-99-C-8032
December 19, 2002 Final
3207 Sydney Brooks Brooks AFB, Texas 78235-5344
901 North Stuart Street, Suite 303 Arlington, Virginia 22203

Report Documentation Page Form ApprovedOMB No. 0704-0188
Public reporting burden for the collection of information is estimated to average 1 hour per response, including the time for reviewing instructions, searching existing data sources, gathering andmaintaining the data needed, and completing and reviewing the collection of information. Send comments regarding this burden estimate or any other aspect of this collection of information,including suggestions for reducing this burden, to Washington Headquarters Services, Directorate for Information Operations and Reports, 1215 Jefferson Davis Highway, Suite 1204, ArlingtonVA 22202-4302. Respondents should be aware that notwithstanding any other provision of law, no person shall be subject to a penalty for failing to comply with a collection of information if itdoes not display a currently valid OMB control number.
1. REPORT DATE 19 DEC 2002 2. REPORT TYPE
3. DATES COVERED 00-00-2002 to 00-00-2002
4. TITLE AND SUBTITLE Technical Protocol for Using Soluble Carbohydrates to EnhanceReductive Dechlorination of Chlorinated Aliphatic Hydrocarbons
5a. CONTRACT NUMBER
5b. GRANT NUMBER
5c. PROGRAM ELEMENT NUMBER
6. AUTHOR(S) 5d. PROJECT NUMBER
5e. TASK NUMBER
5f. WORK UNIT NUMBER
7. PERFORMING ORGANIZATION NAME(S) AND ADDRESS(ES) ARCADIS G&M, Inc,4915 Prospectus Dr., Suite F,Durham,NC,27713
8. PERFORMING ORGANIZATIONREPORT NUMBER
9. SPONSORING/MONITORING AGENCY NAME(S) AND ADDRESS(ES) 10. SPONSOR/MONITOR’S ACRONYM(S)
11. SPONSOR/MONITOR’S REPORT NUMBER(S)
12. DISTRIBUTION/AVAILABILITY STATEMENT Approved for public release; distribution unlimited
13. SUPPLEMENTARY NOTES
14. ABSTRACT
15. SUBJECT TERMS
16. SECURITY CLASSIFICATION OF: 17. LIMITATION OF ABSTRACT Same as
Report (SAR)
18. NUMBEROF PAGES
173
19a. NAME OFRESPONSIBLE PERSON
a. REPORT unclassified
b. ABSTRACT unclassified
c. THIS PAGE unclassified
Standard Form 298 (Rev. 8-98) Prescribed by ANSI Std Z39-18

X X X X X X X
X
ii
Final: Technical Protocol for Using Soluble Carbohydrates to Enhance Reductive Dechlorination of Chlorinated
Aliphatic Hydrocarbons
Prepared for: Air Force Center for Environmental Excellence (AFCEE)
3207 Sydney Brooks Brooks AFB, Texas 78235-5344
POC: Mr. Jerry Hansen
and
Environmental Security Technology Certification Program (ESTCP)
901 North Stuart Street, Suite 303 Arlington, Virginia 22203
POC: Dr. Andrea Leeson
Prepared by: ARCADIS G&M, Inc.
4915 Prospectus Dr., Suite F Durham, North Carolina 27713
Suthan S. Suthersan, Ph.D., P.E.
Christopher C. Lutes Peter L. Palmer, P.E., P.G.
Frank Lenzo, P.E. Fredrick C. Payne, Ph.D.
David S. Liles Jeffrey Burdick
December 19, 2002
Under Contract #F41624-99-C-8032

X X X X X X X
X
iii
TABLE OF CONTENTS
List of Figures (including figures from appendices)...................................................................................vii List of Tables .............................................................................................................................................viii List of Tables – Appendix A......................................................................................................................viii List of Tables – Appendix B......................................................................................................................viii List of Acronyms ......................................................................................................................................... ix Preface ........................................................................................................................................................xii 1.0 INTRODUCTION.................................................................................................................................. 1
1.1 General ERD Operating Principle ............................................................................................. 1 1.2 Applications, Advantages and Limitations................................................................................ 4
1.2.1 Applications ................................................................................................................. 4 1.2.2 Advantages of the Technology..................................................................................... 4 1.2.3 Limitations of the Technology ..................................................................................... 5
1.3 Microbiology of CAH Degradation........................................................................................... 6 1.3.1 Specific Bacterial Types Capable of CAH Bioremediation ......................................... 7
1.3.1.1 Methanogens ................................................................................................... 8 1.3.1.2 Sulfate Reducing Bacteria ............................................................................... 8 1.3.1.3 Dehalorespiring Bacteria................................................................................. 9
1.3.2 Fermentation................................................................................................................. 9 1.3.3 Distribution of CAH Degrading Bacteria................................................................... 11 1.3.4 The Role of Hydrogen and Competition for Molecular Hydrogen ............................ 11
1.4 Overview of ERD Technology Evaluation and Implementation Approach............................ 12 2.0 SITE SCREENING .............................................................................................................................. 14
2.1 General Site Selection Criterion and Information Needs ........................................................ 14 2.2 Interpretation of Historical Trends in Contaminant Concentration and Electron Acceptor
Processes ................................................................................................................................. 16 3.0 BIOGEOCHEMICAL SITE CHARACTERIZATION, AND ERD SYSTEM MONITORING ........ 18
3.1 Sampling and Analysis Methodologies and Their Applications ............................................. 18 3.2 Groundwater Sampling and Analysis...................................................................................... 20
3.2.1 Dissolved Gas Analysis and Management ................................................................. 21 3.2.2 Dissolved Hydrogen Measurement ............................................................................ 21 3.2.3 Dissolved Oxygen Field Measurement ...................................................................... 22
3.3 Saturated Soil Sampling .......................................................................................................... 22 3.4 Microbial Assessments............................................................................................................ 27 3.5 Process and Performance Monitoring ..................................................................................... 30
3.5.1 Process Monitoring .................................................................................................... 30 3.5.2 Performance Monitoring ............................................................................................ 31
4.0 System Design...................................................................................................................................... 32 4.1 Design Considerations............................................................................................................. 32
4.1.1 Hydrogeology............................................................................................................. 32 4.1.1.1 Hydraulic Conductivity ................................................................................. 33 4.1.1.2 Groundwater Flow Characteristics ................................................................ 33 4.1.1.3 Saturated Thickness and Depth to Water ...................................................... 35

X X X X X X X
X
iv
4.1.1.4 Geochemistry ................................................................................................ 36 4.1.2 Groundwater Chemistry ............................................................................................. 37
4.1.2.1 pH.................................................................................................................. 38 4.1.2.2 Role of Sulfur in Enhanced Bioremediation of CAHs .................................. 38 4.1.2.3 Salinity .......................................................................................................... 39
4.2 ERD Layout Options ............................................................................................................... 40 4.2.1 Injection Well/Point Placement.................................................................................. 42 4.2.2 Monitoring Well Placement ....................................................................................... 46
4.3 Reagents .................................................................................................................................. 46 4.3.1 Desorption Effects...................................................................................................... 48 4.3.2 Suitability of Differing Electron Donors for Differing Conditions............................ 51
4.4 Delivery System Design.......................................................................................................... 53 4.5 Reagent Injection Strategy and Feed Mechanisms.................................................................. 57 4.6 Gas Generation ........................................................................................................................ 61
5.0 PILOT TESTING ................................................................................................................................. 62 5.1 Pilot Test Wells – Number and Location ................................................................................ 62 5.2 Site Preparation, Equipment, and Materials ............................................................................ 63 5.3 Reagent Injection..................................................................................................................... 64 5.4 Duration of Pilot Study............................................................................................................ 65 5.5 Field Pilot Test Process and Performance Monitoring............................................................ 66 5.6 Pilot Test Result Interpretation................................................................................................ 66 5.7 Scale Up Issues........................................................................................................................ 67
6.0 FULL SCALE SYSTEM OPERATION AND MAINTENANCE ...................................................... 69 6.1 General .................................................................................................................................... 69 6.2 System Modifications to Control pH Reduction ..................................................................... 69 6.3 System Modifications To Deal With Specific Site Conditions ............................................... 69 6.4 Sustainability & Reliability ..................................................................................................... 70 6.5 Site Closure Strategies............................................................................................................. 71
7.0 REGULATORY ISSUES..................................................................................................................... 75 8.0 REFERENCES..................................................................................................................................... 77 9.0 ACKNOWLEDGMENTS.................................................................................................................... 85 APPENDIX A. CASE STUDIES AND COST DATA ............................................................................. 86
A-1 Introduction ............................................................................................................................... 1 A-2 Case Studies .............................................................................................................................. 1
A-2.1 Manufacturing Facility, Central Pennsylvania ............................................................. 1 Background .................................................................................................................. 1 Approach ...................................................................................................................... 7 System Installation and Operation ............................................................................... 7 CAH Results and Discussion ....................................................................................... 8
A-2.2 Enhanced Reductive Dechlorination Of PCE in Bedrock: Northeastern U.S. ............. 9 Background ................................................................................................................ 10 Geology/Hydrogeology .............................................................................................. 10 Baseline Biogeochemical Assessment ....................................................................... 11 Pilot Study .................................................................................................................. 11 Bulk Attenuation Rates .............................................................................................. 13 Full-Scale System....................................................................................................... 15
A-2.3 Manufacturing Facility, Southeast England ............................................................... 15

X X X X X X X
X
v
Background ................................................................................................................ 16 Approach .................................................................................................................... 16 Injection System Design............................................................................................. 17 System Start Up, Operation and Maintenance ........................................................... 18 Results and Discussion............................................................................................... 19 Summary and Conclusions......................................................................................... 21
A-2.4 Dry Cleaner Wisconsin .............................................................................................. 21 Background ................................................................................................................ 22 Approach .................................................................................................................... 23 Materials and Methods ............................................................................................... 23 Results 24
A-2.5 Chemical Manufacturer, Eastern Pennsylvania.......................................................... 26 Background ................................................................................................................ 26 Summary of Remedial Activities ............................................................................... 27 Results and Conclusion .............................................................................................. 28
A-2.6 Industrial Laundry/Dry Cleaning Facility, Eastern Pennsylvania .............................. 29 Background ................................................................................................................ 30 ERD Implementation.................................................................................................. 30
A-2.7 Chlorinated Solvent and Uranium Processing Facility, Eastern U.S. ........................ 32 Background ................................................................................................................ 34 Approach .................................................................................................................... 34 Pilot Study Results ..................................................................................................... 35
A-2.8 State Voluntary Cleanup of Hexavalent Chromium and TCE ................................... 36 Full-Scale Implementation and Results...................................................................... 36
A-2.9 Carbon Tetrachloride, Chloroform, and Trichloroethene Clean-up in South Carolina.................................................................................................................................... 40
A-2.10 Hanscom and Vandenberg AFBs .............................................................................. 40 A-2.11 Liberty Superfund Site ............................................................................................... 50 A.2.12 OH Industrial Site....................................................................................................... 50 A.2.13 NC Industrial Facility .................................................................................................. 51 A.2.14 Former Landfill Site .................................................................................................. 52 A.2.15 Michigan site ............................................................................................................... 52
A-3 Case studies (Non-ARCADIS)................................................................................................ 53 Background ................................................................................................................ 53 Description of Remedial System................................................................................ 54 Results ........................................................................................................................ 54 Background ................................................................................................................ 54 Description of Treatability Study ............................................................................... 55 Results ........................................................................................................................ 55 Conclusions ................................................................................................................ 55 Background. ............................................................................................................... 56 Description of Field Study ......................................................................................... 56 Results ........................................................................................................................ 56 Background ................................................................................................................ 58 Description of Field Study ......................................................................................... 58 Results ........................................................................................................................ 58 Background ................................................................................................................ 59 Pilot Test Setup .......................................................................................................... 59 Results ........................................................................................................................ 59 Background ................................................................................................................ 60
X X X X X X X
X
vi
Pilot Test Setup .......................................................................................................... 60 Results ........................................................................................................................ 60
A-4 Comparison of Natural Attenuation Rates with rates of Enhanced Reductive Dechlorination ......................................................................................................................... 60
A-5 Case Study Cost Information .................................................................................................. 60 Appendix B. Theory of Competition for Molecular Hydrogen and why some sites “stall” ...................... 63
B-1 Theory of Competition for Molecular Hydrogen ...................................................................... 1 B-2 The Issue of Competition for Hydrogen Viewed in the Perspective of Technology Migration
From Laboratory to Field .......................................................................................................... 4 B-3 Why Sites “Stall” Explained in Terms of a “Zonation” Theory of Enhanced Bioremediation
Microbiology............................................................................................................................. 7 Appendix C. Dissolved Hydrogen Sampling and Analysis ....................................................................... 10

X X X X X X X
X
vii
LIST OF FIGURES (INCLUDING FIGURES FROM APPENDICES)
Figure 1-1. Anaerobic Transformations of Selected CAHs and their Daughter Products (after Vogel et al., 1987 and McCarty et al. 1993).............................................................................................................. 2
Figure 1-2. Schematic of Bacterial Carbohydrate Processing in an ERD.................................................... 8 Figure 1-3. Generalized Flow Chart for ERD Technology Implementation Using Soluble Carbohydrates
............................................................................................................................................................ 13 Figure 4.1. Variation in Lateral Distribution of Reagent from a Single Injection Point Under Various
Hydraulic Conductivities (Schematic) ................................................................................................ 34 Figure 4-2. Schematic of In-Situ Recirculation Well (Suthersan 2001) .................................................... 36 Figure 4-3. Conceptual design for an ERD system layout......................................................................... 40 Figure 4-4. Vehicle Mounted Molasses Injection Rig ............................................................................... 41 Figure 4-5. Physical layout of permanent injection distribution system.................................................... 41 Figure 4-6. In-situ Reactive Zones based on the Curtain Concept (A: One curtain at downgradient edge.
B. Two curtains at downgradient edge and at source area. C: Three curtains to remediate the plume faster) .................................................................................................................................................. 44
Figure 4-7. Plume-Wide or Source Area Reactive Zone – Note, Source Area Applications Should Also Include a Preestablished Downgradient Curtain ................................................................................. 45
Figure 4-8. CAH Distribution as a Function of Organic Carbon Koc values are expressed as L/kg......... 49 Figure 4-9. Analytical Results for Well at Abandoned Manufacturing Facility ........................................ 51 Figure 4-10. Injection Well Construction Detail........................................................................................ 55 Figure 4-11. Multiple Cluster Injection Points when Contamination is Deep ........................................... 59 Figure 6-1. Long Term Operation of ERD at a Site in Southwest Ohio .................................................... 72 Figure A-1. Concentration Trends and Degradation Rates for COCs in Groundwater at the Pilot Study
Area....................................................................................................................................................... 9 Figure A-2. Concentration Trends and Degradation Rates for COCs in Groundwater During Full Scale
Treatment .............................................................................................................................................. 9 Figure A-3. Reactive Zone Bulk Attenuation Rates .................................................................................. 14 Figure A-4. Injection Building Interior...................................................................................................... 18 Figure A-5. CVOC Trends and Rate Calculations for One Well............................................................... 22 Figure A-6. Changes in the Molar Concentration Over Time of the Parent Compound (PCE) and its
Daughter Products (TCE, DCE, VC, ethene, ethane) ......................................................................... 25 Figure A-7. Degradation of chlorinated VOCs in site groundwater .......................................................... 29 Figure A-8. Summary of Groundwater Analytical Data MW-4 ................................................................ 33 Figure A-9. Summary of Groundwater Analytical Data MW-4 ................................................................ 33 Figure A-10. Average Chromium Concentrations Over Time................................................................... 39 Figure A-11. Average CAH Concentrations Over Time. .......................................................................... 39 Figure A-12. Changing Composition of Total Aqueous-Phase Alkenes in High-Carbonate Aquifer ....... 51 Figure A-13. Concentrations of CAHs in Observation Well POW-1........................................................ 52 Figure B-1. Range of Hydrogen Concentrations for the Different Anaerobic metabolic Pathways (after
Wiedemeier et al., 1999) ....................................................................................................................... 5

X X X X X X X
X
viii
LIST OF TABLES
Table 1-1. Reductive Dechlorination Processes ........................................................................................ 10 Table 2-1. Suitability of Site Screening Characteristics for IRZ Implementation ..................................... 15 Table 3-1 Analytical Methods, Holding Times, and Sample Containers for Groundwater Paramaters ..... 23 Table 3-2. Parameters Included In Soil Monitoring Events....................................................................... 26 Table 3-3. Summary of Microbial Assessment Techniques ...................................................................... 28 Table 4-1. Summary of Reagent Cost Ranges for Selected Soluble Carbohydrates.................................. 34 Table 4-2. Engineering Characteristics of Reagents Applied in ERD ....................................................... 45 Table 4-3. Relative Cost of Various Electron Donors That Have Been Used To Enhance Reductive
Dechlorination Per Lb of TOC and Per LB of PCE Treated1............................................................... 51
Table 4-4. Specific geologic/hydrogeologic parameters required for the design of an IRZ ...................... 54 Table 6-1. System Modifications to Deal with Special Site Conditions.................................................... 64
LIST OF TABLES – APPENDIX A
Table A-1. ARCADIS ERD Site Experience............................................................................................... 2 Table A-2a. Summary of Biogeochemical Data (Baseline; Min/Max)...................................................... 18 Table A-2b. Summary of CVOCs, TOC and Degradation Products (Baseline; Min/Max)....................... 18 Table A-3a. Summary of Post Treatment Biochemical Data (Min/Max) .................................................. 18 Table A-3b. Summary of CVOCs, TOC and Degradation Products (Post Treatment; Min/Max) ............ 18 Table A-4. Calculated Site Biodegradation Rates (day1)........................................................................... 23 Table A-5. Summary of Technology Application Costs............................................................................ 56
LIST OF TABLES – APPENDIX B
Table B-1. Concentration Thresholds .......................................................................................................... 2 Table B-2. Maximum specific growth rate (µmax) and half saturation coefficient (Ks) for Various H2
utilizing bacteria (modified from Wiedemeier et al., 1999) ................................................................... 4

X X X X X X X
X
ix
LIST OF ACRONYMS
1,1-DCE 1,1-Dichloroethene 1,2-DCA 1,2-Dichloroethane 1,1,1-TCA 1,1,1-Trichloroethane AFB Air Force Base AFCEE Air Force Center for Environmental Excellence ALARA As Low As Reasonably Achievable bgs below ground surface BOD Biological Oxygen Demand CA Chloroethane CAH Chlorinated Aliphatic Hydrocarbons CERCLA Comprehensive Environmental Response Compensation and Liability Act CF Chloroform cis-DCE cis-Dichloroethene cis-DCE cis-1,2-Dichloroethene cm centimeters CMS Corrective Measures Study COC Constituents of Concern COD Chemicals Oxygen Demand COTS Commercially Off-The-Shelf CT Carbon Tetrachloride CVOC Chlorinated Volatile Organic Compound DCA Dichloroethane DCE Dichloroethene DCM Dichloromethane DGEE Denaturing Gradient Gel Electrophoresis DNAPL Dense, Non-Aqueous Phase Liquid DO Dissolved Oxygen DOC Dissolved Organic Carbon ERD Enhanced Reductive Dechlorination ESTCP Environmental Security Technology Certification Program ETH Ethene GC Gas Chromatrograph H2 Hydrogen HDPE High-Density Polyethylene HFCS High Fructose Corn Syrup HRC Hydrogen Release Compound HAS Hollow Stem Auger IRZ In-situ Reactive Zone Zone K Hydraulic Conductivity

X X X X X X X
X
x
KOC organic carbon partition coefficient Ksp Solubility Product kW kilowatt L Liters MC Methylene Chloride MCL Maximum Contaminant Level mg/L Milligrams per Liter mmax Maximum Specific Growth Rate MNA Monitored Natural Attenuation MOC Metals of Concern NAS National Academy of Science NRC Nuclear Regulatory Commission O&M Operation and Maintenance ORP Oxidation-Reduction Potential PADEP Pennsylvania Department of Environmental Protection PCE Tetrachloroethene PCP Pentachlorphenol PCR Polymerase Chain Reaction PFA Phosopholipid Fatty Acid PLC Programmable Logic Controller PVC Polyvinyl Chloride QA Quality Assurance RAA Remedial Alternative Analysis RCRA Resource Conservation and Recovery Act RFI RCRA Facility Investigation RD/RA Remedial Design/Remedial Action Redox Oxygenation/reduction potential SCAPS Site Characterization and Analysis Penetrometer System SRB Sulfate Reducing Bacteria SU Standard Units SVE Soil Vapor Extraction TBP Tributyl Phosphate TCA Trichloroethane TCE Trichloroethene TDEC State of Tennessee Department of Environment and Conservation TOC Total Organic Carbon TPH Total Petroleum Hydrocarbon trans-DCE trans-1,2-Dichloroethene VAFB Vandenberg Air Force Base VC Vinyl chloride

X X X X X X X
X
xi
VOC Volatile Organic Compound µg/L micrograms per liter UIC Underground Injection Control

X X X X X X X
X
xii
PREFACE
ARCADIS is the owner of Contractor Patented Technology for the in-situ addition of carbohydrate substrate material to create reactive zones for the removal of chlorinated hydrocarbons from groundwater as set forth in U.S. Patent Nos. 6,143,177 and 6,322,700. To discuss application of this technology at government sites please contact: Van Sands at ARCADIS in Denver CO 720-344-3792 regarding legal and contractual matters and Chris Lutes of ARCADIS in Durham, NC at 919-544-4535 or [email protected] regarding
technical information, or Jerry Hansen at AFCEE 210-536-4353 or [email protected].
For commercial application please contact ARCADIS only, at the above listed phone numbers.

X X X X X X X
X
1
1.0 INTRODUCTION
Chlorinated aliphatic hydrocarbons (CAHs) are proving to be one of the most widespread, recalcitrant constituents of concern (COC) encountered in the age of environmental awareness. This class of compounds includes widely used solvents such as carbon tetrachloride (CT), methylene chloride, trichloroethane (TCA), trichloroethene (TCE) and tetrachloroethene (PCE). In addition to their roles in many industrial processes, CAHs have historically been used for cleaning and degreasing such diverse products as aircraft engines, automobile parts, electronic components and clothing in both the military and civilian sectors. Contamination of groundwater by mobile metals (e.g., chromium, lead, arsenic, nickel, mercury and cadmium) is also widespread at the same military facilities due to the use of these metals in ordnance, armament, armor, and as components of corrosion prevention coatings on vehicles. Both the number and complexity of sites impacted by CAHs and the threat to human and ecological health represented by this class of anthropogenic chemicals have resulted in mounting costs for the implementation of conventional remediation methods. This is related, in part, to the generally low solubility of the typical “source” solvents, and their tendency to sink in an aquifer after release or to adsorb to the aquifer materials. The more traditional remediation methods that rely on the extraction of groundwater will quickly reach an asymptotic state of mass removal and will be diffusion limited. In addition, risk based levels for TCE have been recently decreased in some jurisdictions making remediation more costly. As late as 1998, conventional remediation options for sites contaminated with CAHs were considered to be pump and treat with treatment consisting of air stripping, granular activated carbon adsorption, and ultraviolet oxidation (Nyer 1998). Rising costs related to conventional CAH remediation have generated numerous attempts to control costs through the demonstration of innovative remediation technologies that are often performed in-situ. The purpose of this protocol is to provide guidance for successful site selection and application of enhanced reductive dechlorination (ERD) technology for CAH remediation through stimulation by soluble carbohydrates (Suthersan, 1996, 2000, 2001). We have applied this technology to eighty or more sites over the last eight years. In addition to sites impacted by CAHs, ERD technology using soluble carbohydrates has proven effective for the remediation of selected, dissolved metals, other inorganic chemicals generally classified as nutrients such as nitrate, explosive compounds, and oxidizers such as perchlorate. However, this protocol is focused exclusively on CAH treatment. Although this technology is well demonstrated in the field, it continues to evolve. Therefore this protocol should be considered a snap shot of the current state of engineering practice at the time of writing.
1.1 General ERD Operating Principle
ERD technology is intended to facilitate and expedite the biological reductive dechlorination of CAHs through the well-documented mechanisms pictured in Figure 1-1. The ERD technology stimulates indigenous microbiological organisms through the engineered addition of electron donors, which contain degradeable organic carbon sources. The general mechanism behind the application of ERD technology relies on enhancing or inducing the bioremediation of CAHs through periodic subsurface injection of a soluble electron donor solution (typically comprised of a carbohydrate such as molasses, whey, high fructose corn syrup (HFCS), lactate, butyrate, benzoate). Through periodic subsurface substrate injection, the ERD technology alters existing aerobic or mildly anoxic aquifers to anaerobic, microbiologically diverse, reactive treatment zones. Within such zones, conditions are conducive for the bioremediation of CAHs.

X X X X X X X
X
2
Figure 1-1. Anaerobic Transformations of Selected CAHs and their Daughter Products (after Vogel et al., 1987 and McCarty et al. 1993)
ERD technology is intended to facilitate and expedite the degradation of CAHs through biological reductive dechlorination. Chlorinated compound reduction can be a biologically mediated reaction that entails transferring electrons to the substrate of interest from various initial electron donors. The more oxidized the chlorinated compound is, the more susceptible it is to reduction. Reductive dechlorination occurs when aquifer bacteria utilize chlorinated solvent molecules as electron acceptors in the oxidation of their carbonaceous food source (electron donors). The reduction of chlorinated solvent molecules that are used as electron acceptors cleaves one or two of their chlorine atoms, leading to the sequential dechlorination pattern observed in many contaminated aquifers. Several bacterially mediated reactions that may lead to reductive dechlorination are discussed in detail in later sections. The energy gained by bacteria in metabolic reactions is determined by the nature of the electron acceptor and electron donor compounds. Chlorinated solvent molecules yield very little energy to the bacteria that utilize them as electron acceptors. As a result, the populations of bacteria that can utilize chlorinated solvents as electron acceptors can be suppressed by competing species that utilize more beneficial electron acceptors such as oxygen, nitrate, and oxidized forms of iron and manganese. That is why reductive dechlorination is only observed in aquifers where oxygen and nitrate replenishment is minimal or cut off, or they have been consumed in the degradation of available carbon supplies.
CCl2 = CCl2 (PCE)
CHCl = CCl2 (TCE)
CHCl = CHCl (cis-DCE)
CH2 = CHCl (VC)
CH2 = CH2 (Ethylene)
PCE - TetrachloroetheneTCE - Trichloroethenecis-DCE - cis-1,2 -DichloroetheneVC - Vinyl ChlorideCT - Carbon TetrachlorideCF - ChloroformMC - Methylene ChlorideCM - Chloromethane
CCl4 (CT)
CHCl3 (CF)
CH3Cl (CM)
CH2CL2 (MC)

X X X X X X X
X
3
By injecting a degradable carbon source into the aquifer, the rate and extent of bacterial reductive dechlorination can be enhanced to levels that provide a cost-effective remedial method (see the discussion of rates in Appendix A). Bacterial consumption of the degradable carbon consumes matching quantities of electron acceptor compounds. When the rate of carbon consumption exceeds the rate of high-yield electron acceptor recharge, an In-Situ Reactive Zone (IRZ) is created that provides full dechlorination of target alkenes such as PCE, TCE, and TCA. In practice, enhanced reductive dechlorination can be operated as an in-situ bioreactor that forms downgradient from a line of degradable substrate injection wells placed in a line perpendicular to groundwater flow. If sufficient carbon substrate is injected, oxygen and nitrate metabolism dominates near the injection line, while sulfate reduction, methanogenesis and reductive dechlorination zones form farther downgradient. The technology operates most effectively when groundwater is passing through the sulfate-reducing zone, still bearing a degradable carbon load that will support methanogenesis and reductive dechlorination. Under these circumstances, cis-dichloroethene (cis-DCE) is degraded (in net effect) directly to ethene or ethane without a measurable buildup of vinyl chloride. This “high-performance” reductive dechlorination can only be achieved when the rate of electron donor consumption exceeds the rate of electron acceptor recharge. The carbon source must by highly mobile and highly degradable, and injected at rates commensurate with the overall flux of groundwater, electron acceptors and CAHs that move into the treatment zone. The organic acids that form must be buffered by aquifer carbonates or by the addition of carbonates and bicarbonates to the injection mix. Certain site hydrogeologic characteristics require modification of the high-performance approach, but most can still be treated by ERD systems that are more cost effective than alternate approaches. Examples of these are sites requiring modification are those with very low groundwater flow velocities and those with high electron acceptor concentrations such as the high sulfates. This protocol focuses on a particular class of enhanced anaerobic bioremediation systems for chlorinated aliphatic hydrocarbons – those that use a soluble carbohydrate as the substrate (such as molasses, whey, high fructose corn syrup (HFCS), glucose, lactate, butyrate, benzoate). Other approaches to enhanced anaerobic bioremediation exist, but will not be treated in detail in this document because the engineering methodology for these systems differs in some particulars. For example, some have advocated the stimulation of CAH biodegradation by the direct injection of Hydrogen gas (Newell 1999) or the injection of sparingly soluble, slow release carbohydrates, such as Hydrogen Release Compounds (HRC). Others have suggested the use of substances that are insoluble or sparingly soluble in water such as Vegetable Oil (Wiedemeier 2002, Borden 2002) or Bark Mulch (Hass 2000). As discussed further in Sections 1.3 and 4.5 it is desirable at the majority of sites to introduce a relatively large mass of degradable carbon into the system, so as to consume influxes of electron acceptors such as oxygen and nitrate and to sustain optimal conditions for high rate degradation. For this purpose soluble substrates have a distinct advantage over nonsoluble or sparingly soluble materials, and slow release carbohydrates. However there are other sites, where the influx of electron acceptors is lower where these substrates may be more suitable. A nearly uniform release rate of degradable volatile fatty acids and hydrogen over a period of many months creates optimal conditions to develop a microbial consortium under reducing conditions that is capable of enhanced CAH degradation (see Section 1.3). Thus a substrate that is very rapidly bioavailable may require more frequent injections in order to develop and sustain this consortium, which has cost implications (see also Sections 4.5 and 5.3). Hydrogen gas is the extreme example of rapid bioavailability and utilization. Methanol is another example of rapid bioavailability.

X X X X X X X
X
4
The soluble carbohydrates and similar substances include both pure compounds (i.e. glucose, lactate) and complex mixtures of multiple compounds (i.e. molasses). The engineering application procedures and mode of action for both classes as outlined in this protocol are essentially similar. However we generally advocate the use of the complex food grade mixtures (i.e. HFCS and molasses) for the following reasons:
• The ability of complex mixtures to encourage the growth of a more diverse microbial community
• Their moderate rate of biological utilization In preparing this document we have drawn heavily without repeatedly referencing, from three previously published discussions of this technology by the lead author’s firm:
• Suthersan, S., “Remediation Engineering: Design Concepts (Chapter 8),” CRC Press, Inc., Boca Raton, FL, 1997.
• Lenzo, F., “Reactive Zone Remediation (Chapter 8)” in “In situ Treatment Technology,” 2nd Ed., Nyer, E.K., et al., Lewis Publishers, CRC Press, Inc., Boca Raton, FL, 2000
• Suthersan, S., “Natural and Enhanced Remediation Systems,” Lewis Publishers, CRC Press, Inc., Boca Raton, FL, 2001.
1.2 Applications, Advantages and Limitations
1.2.1 Applications
For a remediation technology to be considered valuable, it must be flexible with regard to the types of conditions under which it can be used. The ERD/IRZ has been successfully applied under the following conditions:
• At Various Constituent Concentrations –Areas containing dissolved CAH concentrations in excess of 50 milligrams per liter (mg/L) have been successfully treated. Much more dilute plumes with concentrations of target constituents in the 10 – 100 micrograms per liter (µg/L) range have also been treated successfully.
• In Varied Geologies –The ERD technology has been applied at sites with widely differing geologic and hydrogeologic settings, from low permeability silts and clays, to high permeability alluvial deposits, to bedrock settings and with groundwater velocities ranging from a few feet per year to several feet per day. However, as discussed in Section 2.1, there are permeability and velocity limits beyond which the technology cannot be applied.
• Under Multiple Regulatory Programs – The ERD technology has been applied under multiple regulatory programs, including Comprehensive Environmental Response Compensation and Liability Act (CERCLA) and Resource Conservation and Recovery Act (RCRA), and under the jurisdiction of politically sensitive regulatory agencies such as the California Regional Water Quality Control Board. It has also been applied in several countries outside the U.S.
Site listings and case studies upon which these generalizations are based are found in Appendix A and in the three books mentioned at the end of Section 1.1.
1.2.2 Advantages of the Technology
The primary advantages for ERD using soluble carbohydrates can be summarized as follows (many of these will be discussed in more detail later in this document):

X X X X X X X
X
5
• In-situ process eliminates the need for transferring contaminant mass to other media (such as groundwater pumping and subsequent treatment with air stripping
• ERD processes have a potential application to a wide spectrum of contaminants and co-contaminants such as:
– chlorinated aliphatic hydrocarbons - PCE, TCA, DCA, CT, MC, TCE, DCE, VC
– chlorinated cyclic hydrocarbons – pentachlorphenol (PCP)
– chlorinated pesticides – chlorinated propanes, lindane
– metal precipitation - Cr(VI) to Cr(III), other examples (metal sulfide complexes, i.e. nickel and copper, plus metal-humic complexes, beryllium for example)
– other halogenated organic contaminants
• No ex-situ waste is generated
• The process usually uses electron donor sources that are typically easily accepted by regulators and the public
• The biologically mediated reactions involved can generally be driven by indigenous microflora
• The technology is flexible in application, yielding a spectrum of contaminant mass treatment options from passive/containment barrier applications to aggressive source area applications
• Promotes reduction of residual contaminant mass through desorption and disruption of the contaminant phase equilibrium
• Enhances natural attenuation processes
• Applicable to various geological settings and aquifer conditions
• Electron donor source is highly soluble and can move through both diffusive and advective processes into difficult lithologies such as fractured bedrock
• Systems can be designed with flexible operation approaches ranging from automated systems to manual bulk application
• Can be used in tandem with existing remediation systems to optimize performance
• Can be designed with minimal site and facility operation disturbance
1.2.3 Limitations of the Technology
All in-situ remediation technologies have an inherent limitation associated with subsurface conditions. The geology in which the technology is being applied will exert considerable control over remediation efficacy. Mass transfer and distribution rates in porous media are the primary factors influencing the efficiency of the ERD technology using soluble carbohydrates. This can be compensated for to a great extent by a complete understanding of the geochemical and hydrological conditions of the aquifer system to be treated. A good conceptual model of the aquifer will produce a more effective IRZ design. As is true for all remediation technologies, there are certain site-specific factors that will raise the cost of ERD implementation. Similarly, all remediation technologies have aspects that are undesirable, but do not prevent their use in most circumstances. Potential limitations to the application of the ERD technology using soluble carbohydrates can be summarized as follows (many of these will be discussed in more detail later in this document):

X X X X X X X
X
6
• Excessive depth of contamination tends to raise costs
• Low permeability soils require a larger number of injection points
• High permeability soils with high groundwater flows require an excessive amount of reactant to establish a reducing environment due to dilution and oxygen recharge
• Heterogeneous lithology, which incorporates preferential flow paths, can limit the distribution of the injected substrate
• Limited porosity of contaminated media such as fractured bedrock minimizes the propagation of treated area
• Biological fouling of injection wells or aquifer resulting from reagent injection is theoretically possible but is rarely observed in practice
• Systems with large amounts or influxes of electron acceptors such as oxygen, nitrate or soluble iron can require large doses of substrate, however, substrate cost is typically a small fraction of the total project cost
• Potential production of excessive quantities of reduced gasses such as methane can be problematic in the vicinity of confined structures. Also, production of byproduct organic compounds containing reduced sulfur or nitrogen, including hydrogen sulfide is possible.
• Longer lag times prior to effective treatment are noted in low concentration plumes
• Intermediate products such as vinyl chloride can be formed, however proper system design can ensure their further degradation
• Highly brackish aquifers can pose problematic microbial ecology
• Effectiveness on large pools of free-phase DNAPL has not been proven although it does appear to be applicable to sorbed or residual DNAPL
• If not carefully controlled fermentation effects of excessive molasses loading can create conditions conducive to formation of aldehydes, ketones and mercaptans, which, however, can then be further degrded biologically. Excessive fermentation can also decrease pH and potentially mobilize naturally occurring metals.
These potential limitations are general guidelines to be considered when evaluating potential sites for ERD treatment. Site-specific constraints should be considered for all remediation technology options. The limitations associated with site conditions such as lithology, hydrology, geochemistry and access will also affect most other in-situ technologies.
1.3 Microbiology of CAH Degradation
Microbially catalyzed processes that take place in ERD are a result of the interaction between the chemical conditions instilled by ERD implementation, and the complex, dynamic and unique bacterial community. Ecological selection pressures can define the site-specific ERD bacterial community. These pressures include changing availability of electron acceptors, pH, and electron donor availability. The ERD bacterial community is capable of surviving and thriving in the conditions that exist within the ERD. Within this chemically and microbially complex environment, there is not any one CAH remediation mechanism, nor is there one bacterium that is completely “responsible” for the biodegradation process. It is a consortium of microorganisms and a variety of mechanisms that bring about desired CAH treatment. Bacteria need an electron acceptor to metabolize any carbon source. Under aerobic conditions, oxygen is the most thermodynamically preferred electron acceptor for microbes. Under anaerobic conditions, many

X X X X X X X
X
7
other alternate electron acceptors can be utilized by a variety of bacterial species that are typically present in the aquifer. The sequential reduction of these alternate electron acceptors is as follows (from most thermodynamically favorable to least): Oxygen Reduction → Denitrification (Nitrate reduction) → Iron and Manganese Reduction → Sulfate Reduction → Methanogenesis (Carbon Dioxide Reduction). The depletion of the more thermodynamically favorable electron acceptors, such as oxygen and nitrate, is needed to create more reduced conditions that foster processes such as sulfate reduction and methanogenesis. It is in this environment that reductive dechlorination can occur. When the ERD technology is applied, an environmental transformation occurs in the aquifer. Indigenous heterotrophic microorganisms, present in the aquifer at the time of the initial application, will degrade the injected carbohydrates and as a result grow. This metabolic process utilizes the available dissolved oxygen present in the groundwater, which in turn drives the system to a more anaerobic and reduced state. The bacterial community present in the aquifer prior to carbohydrate injection is shifted towards species better adapted to a more reduced environment. However, some of the initial bacterial species will remain and continue to metabolize injected carbohydrates as groundwater containing dissolved oxygen recharges the system. As a result of the carbohydrate injections, an anaerobic environment is created downgradient of the injection site. In this environment, there is often an absence of externally available electron acceptors. Many organisms can perform internally balanced oxidation-reduction reactions of organic compounds with the production of energy. This process is called fermentation (Brock and Madigan, 1991). Fermentation end products, such as volatile fatty acids, alcohols, and hydrogen, are generated as the endpoints of carbohydrate fermentation in this environment (Figure 1-2). These products, in turn, become the desired electron donor(s) for microorganisms capable of degrading CAHs. Once the desired aquifer conditions and corresponding microbial population has been established, carefully timed subsequent additions of carbohydrates are applied to the aquifer to maintain the reduced aquifer conditions. Injections continue until the desired reduction in contaminant concentrations is achieved. The carbohydrate dosing occurs at regular intervals to avoid fluctuations in the size of various components of the bacterial community. Excessive or irregular carbohydrate dosing during the maintenance portion of this process can complicate the complex environment present in the ERD. In addition, inconsistent carbohydrate dosing potentially complicates efforts to interpret aquifer microbiology using biogeochemical-monitoring parameters.
1.3.1 Specific Bacterial Types Capable of CAH Bioremediation
Many phylogenetic classifications of bacteria participate in the aerobic carbohydrate metabolism and the carbohydrate fermentation that occurs in the upgradient portions of an ERD zone. However, the portion of the reactive zone that carries out reductive dechlorination is populated by only a few metabolic classifications of bacteria. These groups behave very differently from one another, and include methanogens, sulfate-reducing bacteria, and dehalorespiring bacteria. They are discussed in greater detail below.

X X X X X X X
X
8
Electron Donors
Mixed Complex OrganicMaterials like Molasses
Hydrolysis
Organic Monomers
Fermentation
Alcohols & Organic Acids
Acetate and Hydrogen Formation
Acetate Hydrogen
Oxidation OxidationElectron Acceptors End Products
Sulfate
Iron (III)
Carbon
Sulfide
Iron (II)
Methane
Figure 1-2. Schematic of Bacterial Carbohydrate Processing in an ERD
1.3.1.1 Methanogens
Methanogens are obligate anaerobic bacteria that are capable of reducing carbon dioxide to methane. Many methanogens use hydrogen as their electron donor while reducing carbon dioxide. These bacteria are called “autotrophic,” since they use both an inorganic electron donor and acceptor for metabolism. Some species of methanogens can also reduce formate, carbon monoxide, methanol, various amines, and acetate to methane. Many of these methanogenic electron acceptors are produced within an ERD via fermentation. Methanogens are also capable of degrading CAH compounds, although this process does not yield any metabolic benefit for the bacteria. This unproductive (for the bacteria) and fortuitous degradation is called “cometabolic.” Each reductive dechlorination event leads to the release of a chloride ion resulting in the formation of a lesser-chlorinated daughter product. Because of the fortuitous nature of each dechlorination event, the probability of a subsequent dechlorination event, and therefore the overall rate of reductive dechlorination, can vary with the number of chlorinated constituents present. Species capable of cometabolic dechlorination include Methanosarcina mazei, which can dechlorinate PCE to TCE, and Methanobacterium thermoautotrophicum and Methanothrix soehngenii, both capable of reductively dechlorinating cis-DCE to chloroethane (Fantroussi et al., 1998).
1.3.1.2 Sulfate Reducing Bacteria
Microorganisms that use sulfate as a terminal electron acceptor are called sulfate-reducing bacteria (SRBs). SRBs produce sulfide as a waste product while obtaining electrons from molecules such as alcohols or organic acids, both of which are end products of carbohydrate fermentation in ERDs. ARCADIS has relied on SRBs and sulfide production during ERD implementation for the precipitation of certain metals. However, several of the SRB species can also be useful in the cometabolic reduction of CAHs. Desulfitobacterium frappieri and Desulfomonile tiedjei are capable of degrading PCE to cis-DCE

X X X X X X X
X
9
(Gerritise et al., 1996; Townsend and Suflita, 1996). Desulfitobacterium chlororespirans has been shown to degrade other CAHs such as 3-chloro-4-hydroxybenzoate (Gerritise et al., 1996). The idea of SRBs being capable of reductive dechlorination has been widely accepted (Table 1-1).
1.3.1.3 Dehalorespiring Bacteria
Organisms termed dehalorespirers couple reductive dechlorination to growth (Holliger 1993; Neumann et al., 1994), utilizing CAHs as metabolic electron acceptors. During dehalorespiration, the chlorinated organic compounds are used directly as electron acceptors while dissolved hydrogen serves as an electron donor as shown in the following reaction: (McCarty et. al., 1994; Wiedemeier et. al., 1997)
−+ ++−⇒−+ ClHHCClCH 2
where ClC − represents the chlorine bond to the carbon in the chlorinated aliphatic molecule.
Although the ecology of dehalorespiring microorganisms is still being determined experimentally, it is known that dehalorespiring bacteria are able to reductively dechlorinate CAHs at rates on a per organism basis that far exceed those typical of systems dominated by methanogens. Different PCE dechlorination activities are observed in the field (Alleman and Leeson, 1997), and it appears that there are a variety of microorganisms capable of varying degrees of PCE dechlorination. Some dechlorinating strains sequentially dechlorinate PCE to TCE, some to cis-DCE (Schumacher and Holliger, 1996), and some to vinyl chloride (VC) (Flynn et al., 2000). The dechlorinating organism, Dehalobacter restrictus, uses only hydrogen as the electron donor and can couple growth to the reduction of PCE or TCE to cis-DCE. Complete degradation of PCE to ethene by a single species, Dehalococcoides ethenogenes has also been observed (Magnuson et al., 1998). Dehalococcoides ethenogenes strain 195 couples growth to rapid dehalogenation of PCE to VC, followed by a substantially slower reduction to ethene (Maymo-Gatell et al., 1995). Conversely, Flynn et al., (2000) found that at least two populations of dehalorespirers were responsible for the sequential dechlorination of PCE to ethene in one mixed anaerobic culture.
1.3.2 Fermentation
In ERD two distinct processes are needed in order for dehalorespiration to occur; fermentation to produce an electron donor, and uptake of the electron donor by the dehalorespiring bacteria. During primary or secondary fermentation, organic compounds are transformed to compounds such as acetate, water, carbon dioxide, and dissolved hydrogen. Fermentable substrates can be biodegradable, nonchlorinated contaminants (i.e. BTEX-benzene, toluene, ethyl benzene, and xylenes), naturally occurring organic carbon, or added electron donors (i.e. sugar). Once fermentation has occurred, the dehalorespiring microbial consortia can utilize the hydrogen produced by fermentation for reductive dechlorination. Other bacteria such as methanogens also utilize hydrogen produced by fermentation. For example, methane has been observed at many sites where BTEX compounds are present in groundwater (Wiedemeier et al., 1999). The presence of methane is an indicator that the fermentation process is occurring.
X X X X X X X
X
10
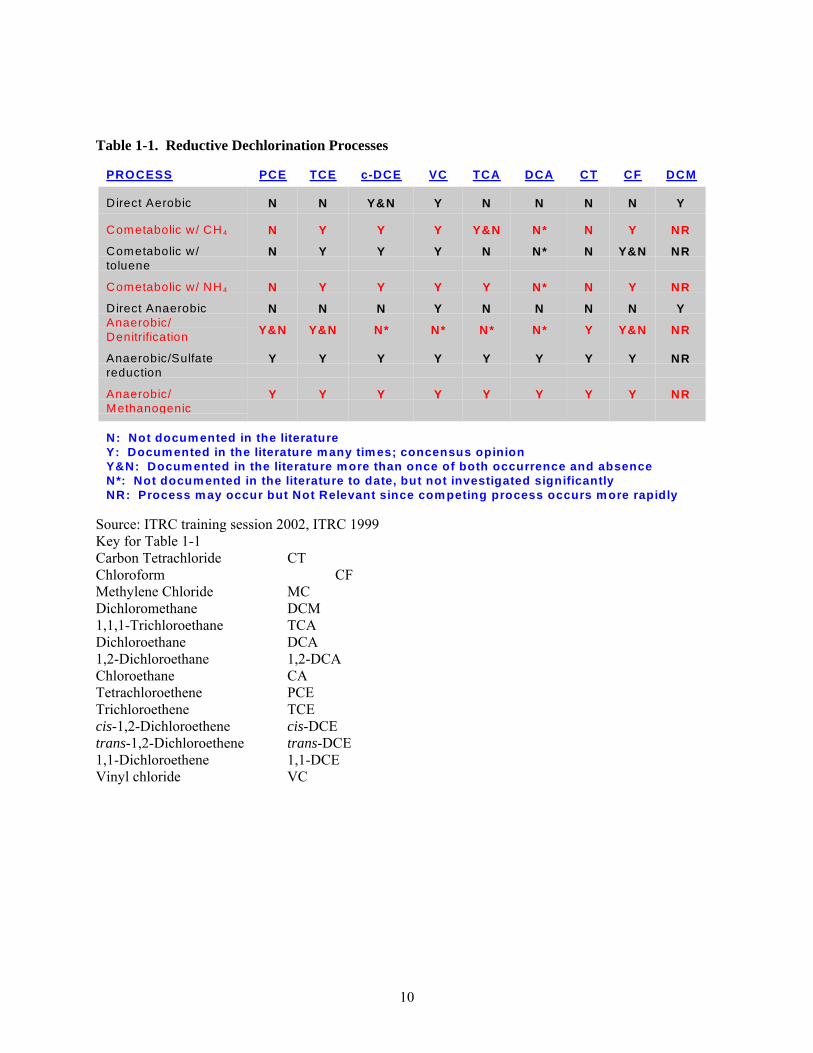
Table 1-1. Reductive Dechlorination Processes
Source: ITRC training session 2002, ITRC 1999 Key for Table 1-1 Carbon Tetrachloride CT Chloroform CF Methylene Chloride MC Dichloromethane DCM 1,1,1-Trichloroethane TCA Dichloroethane DCA 1,2-Dichloroethane 1,2-DCA Chloroethane CA Tetrachloroethene PCE Trichloroethene TCE cis-1,2-Dichloroethene cis-DCE trans-1,2-Dichloroethene trans-DCE 1,1-Dichloroethene 1,1-DCE Vinyl chloride VC
PROCESS PCE TCE c-DCE VC TCA DCA CT CF DCM
Direct Aerobic N N Y&N Y N N N N Y
Cometabolic w/ CH 4 N Y Y Y Y&N N* N Y NR
Cometabolic w/toluene
N Y Y Y N N* N Y&N NR
Cometabolic w/ NH 4 N Y Y Y Y N* N Y NR
Direct Anaerobic N N N Y N N N N YAnaerobic/Denitrification Y&N Y&N N* N* N* N* Y Y&N NR
Anaerobic/Sulfatereduction
Y Y Y Y Y Y Y Y NR
Anaerobic/Methanogenic
Y Y Y Y Y Y Y Y NR
N: Not docum ented in the literatureY: Docum ented in the literature m any tim es; concensus opinionY&N: Docum ented in the literature more than once of both occurrence and absenceN*: Not docum ented in the literature to date, but not investigated significantlyNR: Process m ay occur but Not Relevant since com peting process occurs m ore rapidly

X X X X X X X
X
11
During the application of ERD technology, a highly reduced biogeochemical environment is created throughout the treatment zone. In addition, this zone contains an excess of organic carbon. Aquifer parameters, such as low permeability (10-5 cm/sec or less), or low alkalinity (low buffering capacity), can result in the formation of excess organic acids in the groundwater via fermentation. Optimal sulfate reduction and methanogenesis will occur at pH values ranging from 6 to 8. Low pH conditions (<5) are detrimental to sulfate-reducing and methanogenic bacteria. However, fermentative organisms favor lower pH conditions, and therefore will out-compete both sulfate reducing and methanogenic bacteria in this environment. This can result in the formation of undesirable low molecular weight organic byproducts of fermentation, such as ketones, alcohols and aldehydes. Thus, minimal generation of the low-pH zones is needed in order to avoid excessive fermentation. Control of these zones can be achieved through balancing the mineralogy, buffering capacity, ground water flow velocity, and injection rate into the aquifer. Total Organic Carbon (TOC) and pH in groundwater should be sampled periodically, and if these or other indicators suggest the electron donor solution is overloading the system, the injection rate is reduced or a buffer introduced. In summary, some fermentation is a necessary and natural part of ERD. However, control of the injection area is necessary as too much fermentation can be detrimental to ERD.
1.3.3 Distribution of CAH Degrading Bacteria
On a global scale the distribution of well-understood bacteria such as methanogens and SRBs is assumed to be universal by microbiologists (Chapelle 1993; Brock and Madigan, 1988). Since both of these bacterial are obligately anaerobic, larger concentrations are expected in anaerobic environments. Even in aerobic soil environments, anaerobic “microsites” provide for the survival of obligately anaerobic bacteria. Additionally, some types of SRBs can form spores under adverse conditions which germinate upon the reestablishment of suitable growth conditions. Microbiologists have only recently begun to research the distribution of dehalorespiring bacteria. Perhaps the first assemblage of information on dehalorespiration distribution is the work of Hendrickson et al. from February 2002. Hendrickson and co-researchers examined soil samples from eight widely scattered CAH contaminated sites in both temperate and subtropical zones within the United States. The samples were analyzed for 16S rDNA sequences specific to the genus Dehalococcoides. Additionally, microcosms were established with soil samples to establish the completeness of CAH reductive dechlorination that each site-specific bacterial community was capable of. 16S rDNA consistent with Dehalococcoides was found at all eight sites. The presence of Dehalococcoides 16S rDNA was also highly correlated with complete dechlorination of CAHs. Additionally, groundwater samples collected from eight CAH contaminated sites across the United States and Europe where CAH dechlorination proceeded to completion contained Dehalococcoides 16S rDNA. The results of this study initially support widespread distribution of one genus of bacteria that exhibits the ability to rapidly and completely dechlorinate CAHs using the process previously described as dehalorespiration.
1.3.4 The Role of Hydrogen and Competition for Molecular Hydrogen
Recent studies have indicated a prominent role for molecular hydrogen (H2) in the reductive dechlorination of chloroethenes (Wiedermeier et al., 1997; Wild et al., 1996; Schumacher and Holliger, 1996). Known dechlorinating bacteria such as Dehalococcoides ethenogenes, Dehalospirillum multivorans, and Dehalobacter restrictus can use a hydrogen atom (H2) as an electron donor. In addition to dehalorespirers, a wide variety of bacteria such as denitrifiers, ferric iron [Fe (III)] reducers, sulfate reducers and methanogens can utilize hydrogen as an electron donor. Microorganisms that can use H2 as an electron donor are known as hydrogenotrophic bacteria. The importance of hydrogen utilization in

X X X X X X X
X
12
ERD systems is becoming increasingly apparent. Consequently we have included an in-depth discussion of the competition for molecular hydrogen as Appendix B of this document. The take home lesson from this discussion is clear: that an increased rate of hydrogen production will result in increased halorespiration without affecting the competition between various bacteria for the available hydrogen. Attempting to stimulate halorespiration with poor fermentation substrates may unnecessarily limit the amount of dechlorination taking place. Attempts to limit hydrogen concentration in practical heterotrophic field systems may result in significant portions of the targeted zone not reaching sufficiently reducing conditions for optimum treatment, which can result in sites “stalling” at cis-DCE and vinyl chloride (see Appendix B.3 for a full discussion of this issue). Other potential causes of stalling and remedies to prevent stalling are covered in Section 6.3.
1.4 Overview of ERD Technology Evaluation and Implementation Approach
The implementation of ERD technology, using soluble carbohydrates for the remediation of sites impacted with CAHs, generally parallels implementation strategies for other remediation alternatives (e.g., natural attenuation), beginning with increasingly detailed site characterization tasks, and proceeding through design and pilot-testing phases prior to full-scale implementation. A basic implementation flow chart is provided as Figure 1-3. This flow chart should serve to emphasize that screening and site characterization steps are particularly important in the selection and design of ERD as a remedial technology. The nuances of each technology implementation step shown in the flow chart are described in detail in succeeding sections. The entire implementation process may be completed with typical site closure times of 2 to 5 years, provided the technology is effectively deployed.

X X X X X X X
X
13
Figure 1-3. Generalized Flow Chart for ERD Technology Implementation Using Soluble Carbohydrates
- aerobic or aerobic/ anaerobic conditions- permeability > 1 ft/day, velocity > 30 ft/year- initial pH between 5.0 and 9.0
Initial Site Screening
Technology Suitable?
Biogeochemical Characterization
- groundwater, soil sampling/analysis- gas sampling/analysis- microbiological analyses
- site-specific hydrogeology and geology- CAH concentrations- general groundwater quality parameters- existing biogeochemical data- site history, regulatory drivers, etc.
Detailed Site Screening
Technology Suitable?
Pilot System Design- ERD layout- reagent selection- delivery system design- reagent injection strategy/feed mechanism- monitoring- possible gas generation accommodations
- pilot test well number/location- site preparations- reagent injection- performance monitoring- scale-up
Pilot Testing
Successful?
Full-Scale Design and Implementation
- system modifications and control strategies to deal with site conditions
System Operation
Site Closure
YES
YES
YES
NOChoose Alternate Technology
NOChoose Alternate Technology
NO
Modify Designor
Choose Alternate or Supplemental Technology
- system modifications and control strategies to deal with site conditions

X X X X X X X
X
14
2.0 SITE SCREENING
2.1 General Site Selection Criterion and Information Needs
Although application of ERD using soluble carbohydrates can occur in a variety of hydrogeologic settings, there are certain conditions that are better suited for cost effective use of the technology. One of the most important criteria is permeability. Generally, permeability of the aquifer needs to be greater than 1 ft/day and when coupled with hydraulic gradients, groundwater velocities on the order of 30 ft per year, or greater, are desirable. Another important criteria is the pH which needs to be initially in the range from about pH≥5, to pH≤9 in order to have a microbial population suitable for microbial activity. Other general site selection criteria include:
• Site has completed an initial investigation, is in remedy selection or has an operating pump and treat system in place, or has an ERD system in place that is stalled at cis-DCE but can be upgraded.
• No large quantities of pooled dense, non-aqueous phase liquid (DNAPL) are present or DNAPL remedy selected/implemented but a polishing step needed. (Note that the application of this technology for moderate amounts of, for example, emulsified or sorbed free product is an active area of technology development. This is possible, just not as rapid as applications for dissolved/sorbed CAH contamination). Elevated concentrations of solvents may act as toxic inhibitors to biodegradation as well, especially for sites where the release is relatively recent (i.e. within 1 to 3 years) and the bio-community has had little time to adapt and diversify.
• Sites that show some evidence of slow biodegradation, including those “stopped” at DCE and VC are desirable.
• Biodegradation rates will also be directly affected by the mean groundwater temperature for the area of the particular site. It should be expected that biodegradation will be slower and lag times will be greater in colder climates. The experience presented in this protocol is for sites in temporal climates of the continental U.S. and Europe.
• The depth of the plume is also a factor in determining the cost effectiveness of an in-situ approach. The capital expense related to installing multiple injection wells in deep settings (greater than 50 ft bgs), or in installing recirculation wells across thick homogenous settings needs to be compared to the costs associated with competing technologies.
• The presence of natural heavy metals in the aquifer matrix or in other anthropogenic sources should also be evaluated prior to implementing an in-situ anaerobic approach, as many metals will be more soluble and mobile in an extremely reducing environment. Some of the metals can be naturally precipitated in reducing environments, and most will drop out of solution in the aerobic fringe that generally exists downgradient of the treatment area. Nevertheless, the fate of metals and potential consequences to receptors should be evaluated prior to implementing this technology.
• Sites that are located in brackish (saline) settings may also show a lack of biological diversity, and only partial degradation. Often this is related to elevated concentrations of sulfate which. results in slower rates of biodegradation and longer lag times. Our experience shows that in-situ enhancements are possible, albeit slower, at sites where sulfate is less than 500 to 700 mg/L.
Existing conditions that are anaerobic or borderline aerobic/anaerobic but with insufficient TOC can be most rapidly treated. Conditions that are anaerobic and already have sufficient degradable TOC may not be aided substantially by addition of soluble carbohydrates.

X X X X X X X
X
15
Table 2-1 summarizes suitable and unsuitable criteria for implementing IRZ technology at a given site per the site screening parameters listed above. Once a preliminary determination that ERD is an appropriate technology option to consider for the site, a more detailed data set needs to be gathered. Information required to fully review a site for ERD includes:
• Site specific geology and hydrogeology, including: fraction of organic carbon (Foc) in the aquifer matrix, boring logs, predominant aquifer lithology, aquifer permeability, horizontal and vertical hydraulic gradient, groundwater velocity, and depth to water
• CAH concentrations and distribution, both current and historical, if available
• If available, data on general groundwater quality such as TDS, conductivity, pH, dissolved organic carbon (DOC), carbonate and bicarbonate alkalinity, and general cation/anion scan [calcium (Ca), magnesium (Mg), sodium (Na), potassium (K), chloride (Cl), sulfate (SO4), Nitrate (NO3)]
• Any previously gathered biogeochemical data, including oxidation reduction potential (ORP), nitrate, sulfate/hydrogen sulfide (H2S), ferric/ferrous iron, dissolved oxygen, trace gasses (including methane, carbon dioxide, ethane, and ethene)
• The site's situation (regulatory drivers, stage in the investigation/remediation process, clean-up goals and time frames, future plans for the site)
• Some brief historical information on the site (source of CAH, estimated date of release, and duration of release events)
• Maps showing the relationship of active operational areas (buildings, etc.) and impervious surfaces (roads and parking lots) to the contaminant plume(s)
Table 2-1. Suitability of Site Screening Characteristics for IRZ Implementation Site Characteristic Suitable for IRZ Marginally suitable
for IRZ Unsuitable for IRZ
Aquifer permeability > 1 ft/day 0.01 ft/day – 1 ft/day <0.01 ft/day Groundwater velocity 30 ft/year - 5
ft/day < 30 ft/year, > 5 ft/day
pH 6.0 – 8.0 5.0 – 6.0, 8.0 – 9.0 < 5.0, > 9.0 Natural attenuation of CAHs
Slow, complete degradation, or stalled degradation
No degradation
DNAPL presence None, or emulsified, sorbed, or residuals
IRZ not appropriate for targeting pooled DNAPL at this point in technology development
Sulfate < 700 ppm > 700 ppm (with caution)
CAH concentration Non-toxic Toxic Co-existing metals or TPH
Suitable provided that it is considered in design process

X X X X X X X
X
16
2.2 Interpretation of Historical Trends in Contaminant Concentration and Electron Acceptor Processes
The process of performing a detailed analysis of a CAH site in order to assess the potential of the site for ERD technology treatment has much in common with the assessment performed for CAH natural attenuation (NAS 2000). Such an assessment bases decision making on a review of data on electron donors, electron acceptors, metabolic byproducts, geochemical master indicator parameters, degradation byproducts/trends and hydrogeology. In particular, the trend analysis should help determine whether an on going source exists at the site that is contributing dissolved phase CAHs at a rate that natural attenuation processes cannot overcome (i.e. increasing trends). In such a situation, ERD may accelerate biodegradation sufficiently. In extreme cases a more aggressive source removal approach may need to be initiated first. If however natural attenuation is consuming CAHs at an acceptable rate, then ERD may not be needed. If decreasing trends in CAH concentrations are observed, then the contribution of destructive degradation processes should be discerned from non-destructive attenuation processes such as dilution and/or diffusion, before concluding that biological processes are present that can be enhanced. This can be accomplished by deriving bulk attenuation rates for individual CAHs, and then subtracting the effects of dilution using the synoptic trends of conservative tracers (see appendix C page 3-37 through 3-48 in Wiedemeir et al., 1998). For example, historical data on a non-reactive conservative cation such as sodium, or anion such as chloride could be used, or the aquifer could be spiked with bromide and the effects of dilution derived from the trends on bromide analysis over time. More expensive carbon, oxygen and hydrogen isotope chemistry (for example, tritium) can also be used in tracer studies. Generally the cost of laboratory analysis precludes these techniques at most environmental sites and historical data from a site will generally not contain a record of these more costly analyses. In general if the trends for source and daughter products are identical for many wells located throughout the plume, then dilution may be playing a large part of the overall attenuation that is being observed. At a minimum, qualitative trend analysis should be considered using the concepts discussed above. Quantitative trend analysis using a technique such as the Mann Whitney analysis can also be helpful. The process for assessing a site for CAH monitored natural attenuation (MNA) is thoroughly discussed in the literature:
• Chapter 4 “Approaches for Evaluating Natural Attenuation in “Natural Attenuation for Groundwater Remediation”, National Academy of Sciences (NAS 2000)
• Chapter 7 “In-Situ Bioremediation” by G. Boettcher in Nyer et al., (2001)
• Wiedemeir et al., (1998) (Sections 2.4 through 2.6 and particularly Appendix C3)
Rather than repeating the material that is already covered in these references, we will comment in this section on the differences and similarities between site assessment for MNA and site assessment using ERD. First and foremost an assessment for MNA strives to assure that bioremediation processes, without outside assistance, can meet regulatory requirements for protection of human health and the environment. Therefore, many trends and observations that might disqualify a site from consideration for MNA, need not be a barrier to ERD implementation if the implementation of the ERD will remedy these problems. For example, Wiedemeir presents a scoring system in which indicators of aerobic conditions, such as high oxygen, high redox potential and the absence of daughter products, indicate inadequate evidence of biodegradation. Implementation of ERD will drive the conditions more anaerobic so that initially aerobic

X X X X X X X
X
17
conditions need not be a barrier to ERD. Other factors that, in the Wiedemeier system, cause low marks, such as unusually high or low pHs, would suggest that the site is also not a good candidate for IRZ using ERD. It should be noted that if inappropriate field purging and sampling methods are used to collect the generally sensitive screening data, false negative aerobically influenced data will be generated and can result in aerobically-biased low screening scores. Many of the concepts used in an MNA assessment are very useful for assessing whether conditions are appropriate for ERD and even for interpreting data from an operating ERD. For example, the use of multiple lines of evidence for decision-making can keep decisions from being influenced by a few spurious data points. The development of conceptual models to summarize routes of contaminant migration and links to potential receptors is highly recommended. The exercise of developing a conceptual model can also ensure that the developer identify the processes, if any, that are controlling contaminant movement at the site currently, so that they can work with those processes to advance the remedy. The use of isoconcentration maps/horizontal contour plots to display the distribution of oxidation-reduction processes and contaminants across the site is helpful and can be used to follow the changes induced by the ERD. The use of time-series plots to understand changes in CAH concentrations over time is vital. The use of vertical contour plots oriented along the axis of the plume as recommended by the National Academy of Science (NAS) to understand vertical migration is important. Boettcher and Nyer also present a flow chart that can be used to assign the predominant terminal electron acceptor processes for a given system prior to treatment. Wiedemeier, Boettcher and Nyer recommend comparing contaminant transport rates to biodegradation rates and then determining if potential exposure routes are complete. If the biodegradation rate is sufficient to prevent exposure under background conditions, an MNA remedy may be appropriate. ERD is used to substantially enhance the biodegradation rate when the background biodegradation rate is not sufficient. One of the basic tenants of the NAS document is that decreases in contaminant concentration alone is not sufficient ground for acceptance of an MNA remedy. Rather they stress that scientific documentation “that the mechanism claimed as responsible for contaminant destruction or control is scientifically feasible” and that “the proposed mechanism is actually occurring at the site.” Thus, in addition to documenting contaminant removal in a pilot test or full-scale treatment process, an ERD practitioner should also demonstrate that the “footprints” of the degradation processes appear - to use the terminology of the NAS document. These would include the appearance of intermediate degradation products (for example, cis-DCE and ethene for TCE/PCE), the appearance of indicators that the desired alternate electron acceptor processes are operative (for example, reduced dissolved oxygen (DO) and ORP, increased methane and hydrogen sulfide) and the utilization of appropriate electron donors. The electron donors may include other co-released contaminants such as petroleum hydrocarbons or introduced carbon substrates. The electron donor concentration is often measured and tracked with grouped parameters such as TOC, dissolved organic carbon (DOC), biological oxygen demand (BOD) or total petroleum hydrocarbon (TPH). The NAS document argues that “Complete and sustainable natural attenuation of a chlorinated solvent plume due to a plume of petroleum hydrocarbons should be considered the exception rather than the rule” because the two plumes may not perfectly overlap in space and time. However in a situation where petroleum hydrocarbons are supporting incomplete degradation of CAHs, enhancement of degradation by provision of an introduced substrate should generally be easy.

X X X X X X X
X
18
3.0 BIOGEOCHEMICAL SITE CHARACTERIZATION, AND ERD SYSTEM MONITORING
Biogeochemical characterization is a key element in understanding site conditions so that an ERD system can be designed. Biogeochemical characterization is intended to confirm or refute the applicability of the technology to the site, help establish the baseline along with historical data, and provide data that helps guide system design. Biogeochemical characterization data can be used to modify the design in numerous ways. Some illustrative examples are presented below.
• High ORP and dissolved oxygen measurements indicate that higher amounts of carbon source are required to create and maintain the desired reducing environment. Higher amounts of carbon may be delivered by increasing the amount and/or frequency of reagent injections. This process modification could in turn influence judgments about the size of reagent tankage needed onsite. If the groundwater velocity or the potential for oxygen recharge were also high, a more dense injection well network and more frequent injection would be a likely response.
• Low pH in the existing system and geology suggests the use of buffers would be appropriate. With low permeability and/or hydraulic gradient, the potential for fermentative conditions within the treatment area would suggest that low rates of injection are appropriate.
• In systems with high levels of alternate electron acceptors, such as sulfate, nitrate, or soluble iron, it is likely that the amount of injected electron donor and required time for consumption of electron acceptors (and thus the establishment of methanogenic conditions ideal for biological removal of CAHs) would be increased.
Concentrations of alternate electron acceptors, and the products of their use, as well as dissolved hydrogen concentrations, can be used to draw conclusions about the likely predominant biological processes under natural conditions and to estimate likely treatment times. In general, the available electron acceptors need to be exhausted, in the sequence of their desirability from a metabolic energetics perspective, in order to reach the strongly reducing conditions that are desirable for reductive dechlorination. In turn, information about likely treatment time and likely frequency of injection influences the degree of system automation designed. Oftentimes biogeochemical characterization data are available from site characterization studies, especially if natural attenuation alternatives have been evaluated; however, where not available, a sampling program needs to be implemented before final design of an ERD system, and initiation of any pilot studies. This section discusses the methodologies of sampling and their application as part of the biogeochemical characterization program. Sampling also occurs during ERD implementation, both to control the formation of reducing conditions critical in ERD (process monitoring) and to monitor its effectiveness (performance monitoring). These topics are discussed at the end of this section
3.1 Sampling and Analysis Methodologies and Their Applications
Most of the sampling and analyses required for biogeochemical characterization are routine analyses for soil and groundwater contaminants and have been thoroughly described elsewhere (EPA 1998b). However, even routine analyses need to be carried out with a high level of quality assurance and quality control. In addition, there are certain dissolved gas analyses for indicator parameters of biogeochemical conditions that are less often performed and that only a select group of laboratories are fully competent in conducting. Recommended analyses are listed in the ensuing subsections. Certain parameters, such as pH, dissolved oxygen, ORP, conductivity, sulfide and temperature, will typically be measured in the field.

X X X X X X X
X
19
Determination of the baseline conditions of the appropriate biogeochemical parameters is a key element for the design of an ERD system. This evaluation will give a clear indication of the existing conditions and the necessary steps to be taken to optimize the environment to achieve the target reactions. Furthermore, on-going monitoring of key biogeochemical characteristics of the site is critical to the proper operation and maintenance of the system. Generally speaking, monitoring should be conducted more frequently (e.g., monthly or bi-weekly) during the initial operation of the system and less often (e.g., quarterly or semi-annually) as desired conditions are established. In the beginning, it is often desirable to schedule monitoring rounds to occur between injection events, so that the results of field measurements can be used to refine injection sizes and frequencies. Key groundwater characteristics that should be sampled in most monitoring round include the following process monitoring parameters:
• pH
• Redox potential
• Dissolved oxygen
• Conductivity
• Organic carbon These parameters provide information on the efficacy of carbon delivery to the reducing zone and the redox condition of the zone. From this information, carbon injection regimes can be fine-tuned and more involved monitoring events can be effectively scheduled. In selected monitoring rounds including the baseline, the contaminants of concern (typically, EPA method 8260 analysis for VOCs) and their known degradation products should be measured to determine treatment effectiveness. Some information about initial degradation products can be obtained from the initial 8260 analyses but later concentrations of other dissolved gases (ethane, ethene, etc.) will need to be measured to determine if complete treatment has been achieved. In sampling rounds where ethane and ethene are being analyzed; the incremental cost of measuring other dissolved gasses (such as CO2, N2, CH4), which are used primarily to describe the general biogeochemical processes ongoing in the system is low. While the above-listed parameters are of utmost importance in assessing performance of an ERD system, a number of other parameters may provide important information. These other parameters, which should be measured during the pre-design, baseline geochemical characterization stage, as well as during select-monitoring events during treatment, generally fall into one of two categories: 1) co-contaminants or potentially mobilized metals that may be needed at a specific site depending on geology or history, and 2) additional biogeochemical parameters to assist in the understanding of conditions at the site or in the treatment area (e.g., to determine which electron acceptors are being used). This more complete list of parameters may need to be monitored only once or twice once treatment begins at simple sites. At more difficult sites they may be monitored more frequently to ensure that the desired biogeochemical changes have occurred. These supplemental biogeochemical parameters include the following
• Temperature
• Total dissolved solids

X X X X X X X
X
20
• Total suspended solids
• NO3-
• NO2-
• SO42-
• S—
• Fe (total and dissolved)
• Mn (total and dissolved)
• Carbonate content
• Alkalinity
• Dissolved hydrocarbons (if there is a reason to suspect a co-occurrence of petroleum hydrocarbons)
• Any other organic or inorganic parameters that have the potential to interfere with the target reactions
• Metals: target metals (filtered and unfiltered), iron (total), iron (ferrous), manganese (total and dissolved)
The number of specific parameters that need to be included in the list of baseline measurements will be site specific and is dependent on geology and the presence/absence of co-contaminants. The most common groundwater and soil analyses used for these purposes and their methods are summarized in Tables 3-1 and 3-2. Measurement of dissolved H2 concentrations discussed further below has been recommended as a diagnostic tool for identifying the prevailing biological processes in-situ. However, this is a difficult and time consuming sampling technique that, while it can yield useful information, can often be omitted.
3.2 Groundwater Sampling and Analysis
Groundwater sampling methods during ERD projects should utilize low-flow, or micropurge procedures, consistent with published protocols (EPA 1998b). Detailed descriptions of such standard procedures, as well as routine, standard sampling methods, are not repeated in this protocol. The basic tenant of the micropurge technique is to collect groundwater from a discrete portion of the well screen at a rate that most closely replicates the natural recharge of groundwater from the formation into the well screen. This is accomplished by removing groundwater at low flow rates (typically between 100 and 500 mL/minute) while monitoring the water level within the well to ensure minimal (or preferably no) draw down. While the well is being purged, field parameters are monitored at the wellhead using a flow through cell. DO, ORP, temperature, pH and conductivity are monitored and recorded at (typically) ten minute intervals while the well is purged. When these readings stabilize within 10%, the groundwater is considered to be representative of the aquifer (as opposed to stagnant water within the well) and groundwater samples for laboratory analysis are collected directly from the pump discharge at the surface. Depending on the depth to water and diameter of the existing wells at the site, different pumps should be utilized. For example, a suitable pump is a submersible Grundfoss Rediflow 2 pump, which can be inserted into wells two inches in diameter or larger and can purge at low rates with a constant flow (important for measuring parameters which are influenced by atmospheric conditions). These pumps can be used for depths up to approximately 125 ft bgs. At extreme depths, the pumps tend to get hot, which can also volatilize constituents in the sample. For deeper depths to groundwater, a bladder pump will be the preferred pump. These pumps require a compressed gas supply and an appropriate cycling control

X X X X X X X
X
21
mechanism at the surface to achieve relatively continuous sample delivery (Scalf et al., 1981). The operating pressure should only limit the depth capability of a bladder pump, as it affects the burst strength of the various pump components (Gibb et al., 1981). Bladder pumps have only a minimal potential for chemical alteration of the sample, and can be used to sample groundwater up to 400 ft bgs. However, these pumps are generally more expensive than low flow submersible or peristaltic systems. Sites that have small diameter wells and shallow depth to water may require the use of a peristaltic pump. A peristaltic pump acts by lifting water using a small vacuum (suction) created at the surface. These pumps cost very little and are useful for sampling shallow groundwater to water table depths of 26 ft bgs or less. At any site, efforts should be made to use the same pump and purging method, so that any variability associated with the purging method can be minimized in the generated data set. Table 3-1 listed the methods used for most biogeochemical analyses needed to support system design and monitoring. Most of the parameters listed in Table 3-1 are typically analyzed off-site, but DO, pH, redox, conductivity, sulfide, and iron should be done in the field. There are few standard EPA methods for the analysis of dissolved gases. Some frequently used, modified gas methods are listed in Table 3-1 and described in Section 3.2.1 below. The other methods for sample analysis are drawn from standard reference works such as “Standard Methods for the Examination of Water and Wastewater” (APHA 1998), and thus will not be discussed in depth here.
3.2.1 Dissolved Gas Analysis and Management
ERD processes produce gases that can provide useful information about the process. Additionally, in some cases, the gasses produced may need to be managed for health and safety reasons. The production of methane can help determine if desirable alternate electron acceptors are being utilized, while the increased production of ethene and/or ethane indicates CAH treatment is proceeding to completion. It is widely accepted that ethene is a product of CAH biodegradation under anaerobic conditions. Evidence from our case studies and peer-reviewed literature (DeBruin et al., 1992) suggest that the production of ethane correlates well with the complete dechlorination of CAHs in an ERD system. Indeed, like ethene, naturally occuring concentrations of ethane are generally quite low and the appearance of significant concentrations of both are generally not observed until CAH dechlorination proceeds. On the other hand, hydrogen sulfide and methane are potential process by-products that must be controlled if generated and/or released near confined structures. Gas generation health and safety issues should be considered during the engineering design of an individual system. The depth to the zone of interest, likely paths for vapor migration, proximity of structures and other receptors, and potential volumes of gasses produced must be assessed in this context. The potential volumes of methane and hydrogen sulfide (H2S) gases produced can be estimated from the amount of CAHs present and the amount of reagent to be applied. When the potential risk of vapor exposure is significant, the engineering design should be modified accordingly to prevent or negate such exposures. Analytical methods for the light hydrocarbon gasses and CO2 typically rely on gas chromatographic techniques similar to those reported by Kampbell et al., (1989), using SW3810 Modified, which is a static headspace technique for extracting volatile organic compounds from samples.
3.2.2 Dissolved Hydrogen Measurement
As previously mentioned, dissolved hydrogen (H2) can be a diagnostic parameter to monitor in groundwater from ERD monitoring wells as it can suggest which microbially-mediated redox processes are predominating in the reactive zone. Sampling and measurement of dissolved hydrogen from monitoring well groundwater, though subject to several potential problems, is feasible. However, the cost

X X X X X X X
X
22
of this process is generally not justified at routine sites since the predominant redox processes in various zones can normally be delineated from chemical measurements such as those discussed in Section 3.1. More information on sampling for hydrogen is provided in Appendix C.
3.2.3 Dissolved Oxygen Field Measurement
While DO probes/meters are usually quite reliable when used in conjunction with a down-hole sonde or flow-through cell, they tend to be relatively expensive, require maintenance and calibration, and may be subject to interferences by temperature, salinity, and other dissolved gasses. As such, various simple test kits are offered by field instrument vendors (e.g., Hach, Chemetrics, LaMotte) and are available as an alternate approach to measuring DO with a probe. These test kits are typically based on one of several methods, including the Winkler (iodometric) titration method, the indigo carmine method whereby the reduced form of indigo carmine reacts with DO to form a blue product, and methods developed using proprietary reagents such as Chemetrics’ Rhodazine D method for measuring trace levels of DO. The choice of which kit to use should primarily be based on its specified range, detection limit, and sensitivity, while considering the kit’s ease of use and applicability. For field-testing DO at ERD systems, a range of zero to 10 mg/L, and detection limit and sensitivity of 0.2 mg/L would be sufficient, though these are not by any means strict requirements. It is very important to follow strict low-flow purging and sampling procedures when sampling for DO measurement. Furthermore, note that DO samples may not be diluted to get the measurement within the range of the analytical method. Samples must be tested immediately after sampling.
3.3 Saturated Soil Sampling
The objective of the saturated soil sampling program is not typically to assess the effectiveness of the technology (since taking sufficient soil samples before and after treatment to assess the mass of CAH sorbed to the matrix is generally not cost effective). Rather, it is intended to supplement the existing body of soil data at the site and help to fill the gaps in our understanding of contaminant distribution and geology between existing wells. Thus it will serve as an aid to system design. It may also help predict and evaluate desorption effects in the groundwater data. TOC data can also be used to establish retardation factors, which can assist in rate calculations (Payne et al., 2001). The methods to be used in soil sample collection and analysis will vary from site to site, based on the hydrogeology and drilling methods necessary at each site (EPA 1998a). These analytical methods and analytes used typically for soil are listed in Table 3-2. Soil samples collected from within the saturated portion of each aquifer targeted for treatment are often collected by driving a Shelby tube into the formation using the drill rig hydraulics (or a 140 lb. hammer). This method should be sufficient for collecting silty to clayey soils. Where sandy soils are expected, split spoons will be utilized instead of a Shelby tube. When sufficient lithologic information is available for the site (e.g., based on existing drilling logs), the injection and monitoring wells may be drilled ‘blind’ to specified depths. Drilling should cease once the target soil depth is encountered - the drill bit should be removed and the Shelby tube advanced ahead of the bit or augers. However, since hydrogeologic information is often key to success, careful consideration should be given to whether logging is needed at a given site.

X X X X X X X
23
Table 3-1. Analytical Methods, Holding Times, and Sample Containers for Groundwater Paramaters
Parameter Analytical Method Concentration Reporting Units
Volume, Container, Preservative & Storage
Requirements
Hold Time Location of Test
Temperature EPA 170.1 Degrees C NA Analyze immediately
Field
ORP U.S. Geological Survey, National Field Manual for the Collection of Water-Quality Data, 1997
MV NA Analyze immediately
Field
Dissolved Oxygen EPA 360.1 mg/L NA Analyze immediately
Field
pH EPA 150.1 S.U. NA Analyze immediately
Field
Conductance Standard methods for examination of water & wastewater, 15th edition method 205 or USEDA method 120.1
Milisiemens NA Analyze immediately
Field
Alkalinity EPA Method 310.1 mg/L 250 mL Glass or plastic Cool to 4 °C
14 days Fixed Lab
Nitrate EPA Method 300.0A mg/L 250 mL Glass or plastic Cool to 4 °C
48 hours Fixed Lab
Nitrite EPA Method 300.0A mg/L 250 mL Glass or plastic Cool to 4 °C
48 hours Fixed Lab

X X X X X X X
24
Parameter Analytical Method Concentration Reporting Units
Volume, Container, Preservative & Storage
Requirements
Hold Time Location of Test
Sulfate EPA Method 300.0A mg/L 100 mL Glass or plastic Cool to 4 °C
28 days Fixed Lab
Chloride EPA Method 300.0A mg/L 250 mL Glass or plastic
28 days Fixed Lab
Methane, ethane, ethene See text µg/L Glass VOA vials 7 days Fixed Specialty Gas Lab
Carbon Dioxide See text mg/L Glass VOA vials 7 days Fixed Specialty Gas Lab
Chemical Oxygen Demand
EPA Method 410.4 or 410.1
mg/L 250 mL Glass or Plastic Cool to 4 °C H2SO4 to pH<2
28 days Fixed Lab
Biochemical Oxygen Demand
EPA Method 405.1 mg/L 100 mL Glass or plastic
Cool to 4 °C
48 hours Fixed Lab
Total Organic Carbon (TOC)
EPA Method 415.1 mg/L 100 mL Glass or Plastic Cool to 4 °C H2SO4 to pH<2
28 days Fixed Lab
EPA Method 415.1 mg/L 100 mL Glass or Plastic Cool to 4 °C H2SO4 to pH<2
28 days Fixed Lab
Ammonia EPA Method 350.1 mg/L 500 mL Glass or Plastic Cool to 4 °C H2SO4 to pH<2
28 days Fixed Lab
Sulfide Color Chart/ Effervescence of H2S (Hach Kit 25378-00)
mg/L 500 mL Glass or Plastic Cool to 4 °C H2SO4 to pH<2
7 days Field
Total Iron 6010B and/or CHEMetrics kit in field
µg/L 1 L Glass or plastic HNO3 to pH<2
6 months Fixed Lab or Field
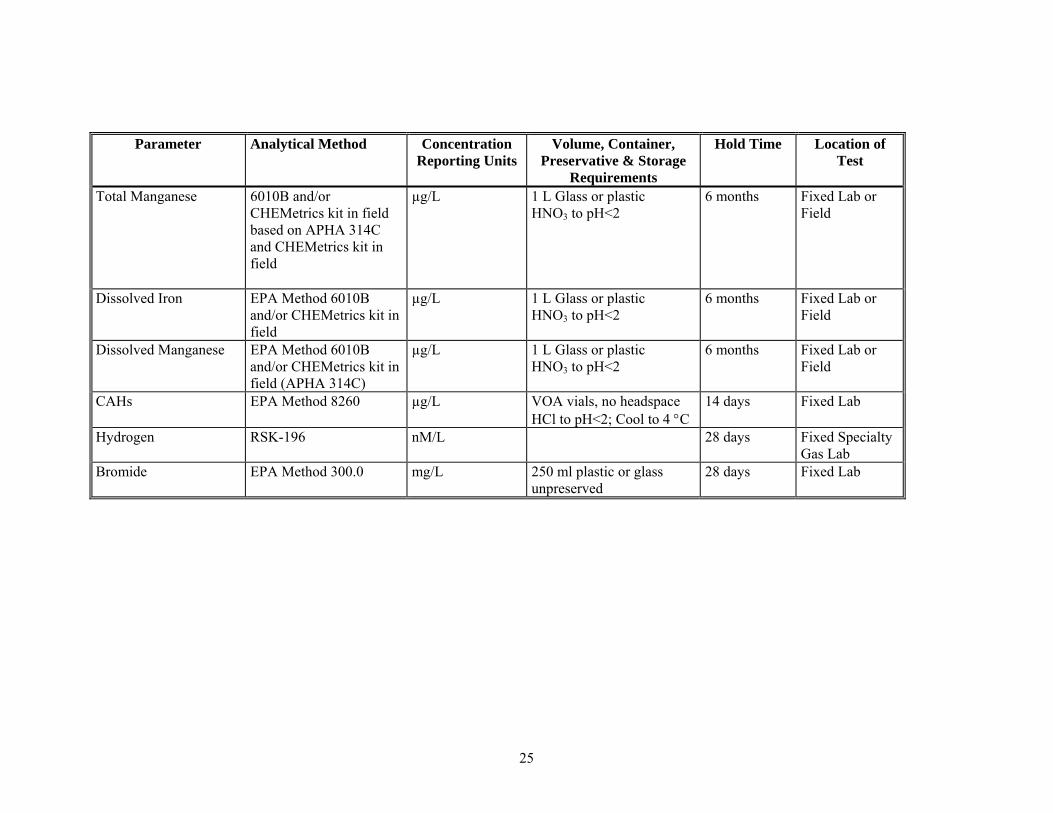
X X X X X X X
25
Parameter Analytical Method Concentration Reporting Units
Volume, Container, Preservative & Storage
Requirements
Hold Time Location of Test
Total Manganese 6010B and/or CHEMetrics kit in field based on APHA 314C and CHEMetrics kit in field
µg/L 1 L Glass or plastic HNO3 to pH<2
6 months Fixed Lab or Field
Dissolved Iron EPA Method 6010B and/or CHEMetrics kit in field
µg/L 1 L Glass or plastic HNO3 to pH<2
6 months Fixed Lab or Field
Dissolved Manganese EPA Method 6010B and/or CHEMetrics kit in field (APHA 314C)
µg/L 1 L Glass or plastic HNO3 to pH<2
6 months Fixed Lab or Field
CAHs EPA Method 8260 µg/L VOA vials, no headspace HCl to pH<2; Cool to 4 °C
14 days Fixed Lab
Hydrogen
RSK-196 nM/L 28 days Fixed Specialty Gas Lab
Bromide EPA Method 300.0 mg/L 250 ml plastic or glass unpreserved
28 days Fixed Lab

X X X X X X X
26
Table 3-2. Parameters Typically Included In Soil Monitoring Events Parameter Analytical
Method Concentration Units Reported In
Container & Preservative Requirements
Hold Time Location of test
Total Organic Carbon (TOC) 9060 mg/kg None specified 28 days Y Fixed Lab
CAHs 8260 µg/kg 4 oz. Glass with Teflon lined septa; store @ 4 °C
14 days Y Fixed Lab
Grain Size ASTM D-422 % passing 500 mL wide
mouth glass or plastic (purchased by field crew)
None Y Geotechnical Lab

X X X X X X X
27
3.4 Microbial Assessments
Typically we recommend evaluation of biogeochemical data and pilot testing before the design and installation of a full-scale ERD system (pilot testing is further discussed in Section 5). Evaluation of hydrogeologic and biogeochemical data generally is sufficient to determine whether or not ERD is feasible at a site. Pilot tests are conducted to provide predesign data on injection well spacings, reagent requirements, and injection frequency. Laboratory scale studies are generally not required because the data generated is generally not needed in the design of an ERD system when a pilot test is already being performed, and the costs in time and dollars can be similar for laboratory and pilot scale efforts. If there is a reason in the biogeochemical data to significantly doubt if the system will be successful, a laboratory study may be warranted. Laboratory study costs can vary significantly. For instance, Denaturing Gradient Gel Electrophoresis (DGGE) and Phospholipid Fatty Acid (PLFA) techniques used for microbial screening have a low cost per sample (<$600) and can thus be used to screen for the presence of microorganisms at multiple areas of the site. In addition, Polymerase chain reaction (PCR) analysis used for the identification of dehalorespiring bacteria can cost from $900 to $4,000 per sample when completed commercially. On the other hand, microcosm studies can range from $10,000 to $40,000, and may take four to twelve months to complete (Lutes et al., 2002a). See Table 3-3 for a more complete description of these methods. Microcosm studies coupled to microbial identification techniques can be useful in determining whether or not complete dechlorination will likely occur at a site. For example, at Cape Canaveral Air Station in Florida, a combination of microcosm studies, PCR analysis and site data were used to assess the indigenous reductive dechlorination potential in a trichloroethene (TCE)-contaminated (Fennell et al., 2001). The authors concluded that the study “confirms that a combination of field data, microcosm studies and PCR analysis for a specific organism proved complementary information about the likely response of a native microbial community to in-situ enhancement.” However, they also state that the “heterogeneous distribution of dechlorinating activity… points to potential weaknesses in using microcosms to predict responses at a given site.” In addition they state “The time, trouble, and expense involved in running microcosms studies clearly dictate that the locations for testing must be carefully chosen according to the best and most current site data.” Sites that are candidates for the technology should be further characterized if necessary, and the microcosm study should be as expansive as possible, including running studies with sediment from a number of promising locations and/or compositing sediment samples from multiple locations in preparing microcosms.” This clearly increases the expense of running microcosm studies by increasing the number of sediment cores needed to accurately run a microcosm study at a site. When looking at a site and the alternatives available to determine the feasibility of using reductive dechlorination as a treatment option, the costs may be similar for either a complex microcosm study or for installation and completion of a simple pilot test. Note that a pilot test presumably allows organisms that may be initially present in only a minority of subsurface locations to flourish and become more widely distributed after a substrate is introduced.

X X X X X X X
28
Table 3-3. Summary of Microbial Assessment Techniques Test Method Description Data Required Method of Data
Collection Pros Cons References
High Complexity Microcosm Tests
Microcosm tests including various easily utilized pure carbon sources coupled with small highly instrumented field pilot tests.
Laboratory data includes COC data from both liquid and headspace and donor taken from liquid. Field data included COCs from groundwater
Lab: gas-tight glass and teflon syringe for GC analysis
Field: Low-flow/micropurge methods
Detailed, definitive information on contaminant removal, info for substrate and nutrient selection and dose is generated
High cost and extended time needed, pilot testing must be used to define design parameters, primarily uses pure substrates that have a higher cost associated with them.
Fennel et al. 2001
Loffler et al. 2000
Lower-Cost, Lower Complexity Microcosm Testing
Microcosms tests using single complex low-cost carbon sources such as molasses, vegetable oil etc.
Lab data includes COCs from liquid.
Gastight glass and Teflon syringe
Directly yields information on contaminant removal and completeness of treatment. Guidance to substrate dose selection
Moderate cost and time. Must be coupled with an engineering assessment or pilot test to evaluate reagent distribution.
Findlay and Fogel, 2000
Phospholipid Fatty Acid (PFA) and Denaturing Gradient Gel Electrophoresis (DGGE)
Analysis provides a determination of total viable biomass, characterizes the types of organisms present and their general physiological status.
Soil or groundwater sample
Soil coring from shelby tube or split spoon
Low-flow/micropurge procedures
Provides detailed information on microbial community. Can identify known degraders. Low cost per sample, can screen multiple areas of site.
Specific only for known degraders, excludes other species that have not yet been identified.
White et al, 1997
Stahl, 1997

X X X X X X X
29
Dehalorespiration Genetic Screening Tool (PCR analysis)
DNA-based screening technique to detect the presence of Dehalococcoides
Soil or Groundwater sample
Soil coring from shelby tube or split spoon
Low-flow/micropurge procedures
High correlation between complete degradation of chlorinated compounds and presence of Dehalococcoides. Can screen multiple areas of site.
Specific only for Dehalococcoides, excludes other species or consortia known to have the same capability.
Fennel et al 2001
Hendrickson et al 2002

X X X X X X X
30
The amount of time required for the onset of complete dechlorination is an important issue in both field and laboratory scale testing. Pilot tests performed in the field can take many months to a year to complete. Frequent sampling for at least the primary contaminants of concern is often required if the acclimation time is unknown. If a microcosm test has been previously performed a less intensive sampling program may be involved since acclimation time may be more predictable. As mentioned above, laboratory microcosm studies can also take an extended period of time (four months to a year) to achieve complete dechlorination due to the same acclimation time problem. Since microcosm testing must almost always be followed by pilot scale testing, an extended period (more then twice the acclimation time) may be required if microcosm and pilot testing are done sequentially. PCR analysis can yield a positive for the bacterial species Dehalococcoides, but overlooks many other species of bacteria that are capable of reductive dechlorination. Dehalococcoides has been chosen as an indicator microorganism as it is capable of completely degrading PCE to ethene. However, a study by Flynn et al. (2000) found that at least two populations of dehalorespirers were responsible for the sequential dechlorination of PCE to ethene in one mixed anaerobic culture. Hendrickson et al (2002) performed a study to evaluate how widely distributed Dehalococcoides strains were in the environment and to determine their association with dechlorination at chloroethene-contaminated sites. Their findings determined that “Dehalococcoides organisms are widely distributed in the environment and are associated with full dechlorinating processes,” which suggest there may be little need for routine microbial assessments. However they also stated “It also remains to be seen if there are other organisms in the environment that can catalyze the conversion of PCE and TCE to ethene, specifically transforming cDCE or VC to ethene. The DHC PCR assay is easy to implement, and when it is used in combination with microcosm and field data, it provides a new tool for evaluating the potential for dechlorination activity and for tracking changes in dechlorinating organisms in populations.” This study indicates that the organism Dehalococcoides had a wide spread distribution, and also stresses that other organisms may be capable of converting PCE to ethene. Thus there currently is no universally applicable answer regarding what techniques should be used and when they should be applied in determining whether or not enhanced reductive dechlorination will be successful at a site. The benefits associated with bench scale microbial assessment generally do not outweigh the costs of performing them when the biogeochemical data is favorable. When bench scale work is needed, simple microcosms studies coupled with PCR identification appear to be the most helpful bench scale tools in predicting to what extent reductive dechlorination will occur.
3.5 Process and Performance Monitoring
Monitoring of an ERD implementation is done for two purposes: to help control the system (process monitoring) and to evaluate its performance (performance monitoring). Each of these is discussed below.
3.5.1 Process Monitoring
Groundwater sampling for process monitoring should be performed both in select injection wells (if wells are used) and associated monitoring wells (ones immediately downgradient of the IRZ). The intent is not to verify or quantify the effectiveness of the technology, but rather, to provide near real-time feedback to control the ERD process and maintain it within the specified pH, DO, ORP and TOC ranges to optimize treatment efficiency. The times for these sampling events should be selected as the process is ongoing. However it is likely that these events will be more frequent near the beginning of the injection program, when the optimum reagent-dosing plan for each site is being established. A typical frequency is weekly
X X X X X X X
31
to bi-weekly during the first month of testing, bi-weekly or monthly during the next two to three months of testing, and bi-monthly to quarterly for the remainder of the first year. Long-term process monitoring is generally quarterly to semi-annual. The minimum parameter list for these events will be pH, DO, and ORP (measured in the field) as well as TOC (laboratory analysis). For most cases these process-monitoring parameters should be maintained within the ranges listed in Section 5.3. Monitoring frequency should always remain flexible during the life cycle of the reactive zone. This concept is critical to the health of the reactive zone and the success of the process. Disclosure of the need to be flexible is critical to the regulatory agency perceptions of the monitoring effort and the client’s understanding of the budget and schedule.
3.5.2 Performance Monitoring
Performance monitoring is needed to determine the treatment’s effectiveness. Performance monitoring generally includes a baseline sampling event, which occurs during the biogeochemical characterization phase previously discussed, and periodic monitoring events during the period of testing. All samples should be collected using low-flow purge techniques and appropriate QA/QC procedures that were discussed in earlier sections of this protocol. After process monitoring has demonstrated that the IRZ has formed, performance monitoring would be initiated. The list of parameters measured during performance monitoring will likely include CAHs and degradation products, such as cis-DCE, vinyl chloride, ethane, and ethene. The frequency of monitoring will vary between the monitoring wells associated with the IRZ system and other monitoring wells located at the site. Generally the IRZ associated monitoring wells will be measured more frequently, i.e. quarterly, than the site-wide monitoring wells that may be analyzed on a semiannual to annual basis. Many of the same tools discussed in Section 2.2 for interpretation of data before implementation of the ERD are used during ERD implementation as well. However some additional tools become valuable during and after implementation. For example, comparisons of rates of change of CAH concentration before and after treatment from time series plots are often helpful in demonstrating the effectiveness of the remedy (see Section C.3.3 of Wiedemeier or a chemical kinetics textbook such as D. Katakis and G. Gordon “Mechanisms of Inorganic Reactions” for rate calculations). However since enhanced biodegradation is a process that proceeds through several mechanisms and is controlled by microbial population dynamics and desorption processes, the changes in CAH concentration will not necessarily fit a simple kinetic model. Graphing the ratio of contaminant to product such as TCE/cis-DCE before and after treatment can be helpful in determining if biodegradation has been enhanced in the presence of effects such as desorption. Time series plots can be done on a molar rather than mass basis so that the effects of sequential degradation processes can be more clearly perceived. A mass budgeting type approach as recommended by NAS could be useful in understanding the system. If a DNAPL is present estimation of the mass flux from the DNAPL before and after implementation of the ERD becomes important. Appendix Section C.3.2 of Wiedemeir presents approaches for this type of calculation. The mass flux from the DNAPL would then need to be compared to the estimated DNAPL mass and biodegradation rate in the dissolved phase to assess the degree of treatment. Numerical solute transport models incorporating a biological term are not usually needed but can be helpful in complex cases.

X X X X X X X
32
4.0 SYSTEM DESIGN
4.1 Design Considerations
There are a number of design considerations that need to be understood in successfully implementing IRZ technology using ERD. The goal is to create subsurface environmental conditions that optimize biochemical reactions to accelerate remediation of CAHs. Among the critical design considerations for ERD are:
• Hydrogeology
• Groundwater chemistry
• Microbiology (covered primarily in Section 1.3)
• ERD layout options
• Baseline definition (covered in Section 2)
• Reagent selection Selection of drilling techniques would also be considered part of the system design. Because many alternate documents (e.g., EPA 1998a) adequately cover this issue, it is not included in this protocol. Another important factor in design consideration is cost of implementation – including both capital and operation and maintenance costs. Budgetary cost limitations can often directly or indirectly affect design decisions such as source reduction versus plume-wide treatment. Appendix A of this Protocol contains specific information regarding the technology application cost (capital and operation and maintenance) at a variety of Sites in which ERD has been successfully applied by ARCADIS. Based on our experience and analysis the two largest cost factors for ERD implementation are the injection well installation and reagent injections. Therefore, the three Site-specific factors that contribute to the cost of the technology implementation are as follows;
• Plume Size to be Treated – This is the primary factor driving the cost of the technology as the larger the plume area to be treated the more wells are needed (drilling costs) and the more time it takes for reagent delivery.
• Depth of Target Zone – Drilling costs are the primary factor affecting overall technology cost. Therefore, deep contaminant settings and/or those requiring specialized drilling techniques (bedrock drilling, multiple conductor casings, etc.) can significantly increase costs.
• Groundwater Flux through Zone of Treatment – Reagent injections also play a large role in overall technology costs. At sites in which there is a high groundwater flux, more substrate will be required, thereby increasing costs.
In turn, these factors need to be given special consideration during design in order to develop the most cost effective approach for site remediation.
4.1.1 Hydrogeology
It is important to obtain specific hydrogeologic data in order to design a delivery system to deliver the carbohydrates and other additives (such as buffering solutions, tracers, etc.) at the desired concentrations

X X X X X X X
33
and distribution to the target zone. While a complicated lithology can place constraints on the use of ERD, in most cases it will not completely eliminate ERD as a remedial option. Complex lithologies are likely to be equally problematic for most in-situ treatment technology. By properly placing injection well screen zones or other delivery mechanisms to target specific impacted groundwater bearing layers, the technology can be effectively applied in most environments. From a design perspective, delivery in complex settings will more often be dictated by remedial goals and timeframes, economic considerations, or non-technical factors such as regulatory and public perception. Thus, understanding the complexity and defining the lithologic variability as it relates to the groundwater impacts is an important first step in design. A tool that can be part of evaluation of a site’s suitability for ERD is aquifer testing such as pumping tests. This can be important as a means to refine the knowledge of hydrogeology and thus predict the performance of a full-scale delivery system. It can help reduce the cost of pilot testing by allowing the monitoring strategy, including the locations of the wells, to be refined.
4.1.1.1 Hydraulic Conductivity
Understanding a formation’s hydraulic conductivity is critical to designing ERD systems. A formation’s hydraulic conductivity is used, along with hydraulic gradient, to determine the amount of reagent to be injected and in determining injection well spacing and distances between injection well arrays. The higher the hydraulic conductivity of the formation the easier it is to deliver the reagent into the subsurface and the more effective a single delivery point can be. As the hydraulic conductivity increases – all other factors remaining equal - the distribution of reagent from a single injection point along the direction of advective flow increases but the radius of influence perpendicular to the flow direction decreases (see Figure 4-1). In addition, lower permeability will generally contribute to lower groundwater flow velocities and advective transport of the reagent. This, in turn, must be carefully considered when evaluating the design of full-scale treatment systems (i.e. spacing of injection points in the direction of groundwater flow in order to treat the impacts in a timeframe consistent with remediation goals) as well as pilot-scale or demonstration systems (i.e. where to place observation points/samples to see desirable results within the timeframe of the study
4.1.1.2 Groundwater Flow Characteristics
Groundwater flow characteristics are another important consideration in the design of reactive zones. The groundwater velocity, flow direction, and the horizontal and vertical gradients impact the effectiveness of reagent injections and the speed with which the reagent will spread and mix with the groundwater. Low velocity systems typically require lower reagent mass feed rates since the groundwater flux is reduced – all other conditions being equal. This is also an important criterion for the concentration and amount of additive that is needed to create the reactive zone. While the composition of interstitial water is the most sensitive indicator of the types and the extent of reactions that will take place between contaminants and the injected reagents in the aqueous phase, groundwater flow direction and gradients are also important to consider. It is critical to understand the dynamics of groundwater flow to assure that the reagent injections will form a reactive zone in the target area. Horizontal and vertical gradients are used to define the lateral (well point or injection device) and vertical (screen or delivery zone) location of the injection and monitoring points. It is also important to understand the heterogeneity of the aquifer. The groundwater is the carrier that will take the reagents downgradient of the delivery system. This advective transport accounts for the majority of the creation of the IRZ. Evidence collected as part of an Environmental Security Technology Certification Program

X X X X X X X
34
Figure 4.1. Variation in Lateral Distribution of Reagent from a Single Injection Point Under Various Hydraulic Conductivities (Schematic)
(ESTCP) demonstration project (Lutes 2002) does suggest that some influences of the reactive zone will propagate faster than would be predicted by advective transport, although this contribution is likely immaterial for design consideration. If there are areas where groundwater movement is very slow, then the additives will have difficulty reaching those areas and the environment will not be appreciably changed in the short term. We will not be able to create the IRZ in the low flow areas except through the slow process of diffusion. (See Nyer et al., 2001, for an extensive discussion of these issues.) Advection is the main process that moves the reagents downgradient of the delivery system and dispersion moves the reagents in directions perpendicular to groundwater flow (this is referred to as transverse dispersion). Advection is movement by bulk motion, and is quantified by the value of the groundwater velocity. Under most conditions, groundwater is constantly moving, although this movement is usually slow (typically 30-900 feet/year). Groundwater flow rate may be calculated using Darcy’s Law.
Q = KIA Rearranging this equation yields an expression for velocity:
HIGHER GROUNDWATER
VELOCITY
LOWER GROUNDWATER
VELOCITY

X X X X X X X
35
V = KI/ne
where V = pore water velocity [L/T]; K = average hydraulic conductivity, a measure of the ability of the porous media to transmit water [L/T]; ne = effective porosity of the aquifer matrix and I = the horizontal hydraulic gradient.
Using Darcy's Law to calculate an initial estimate of groundwater velocity at a potential site is a basic first step in the design of ERD systems.
4.1.1.3 Saturated Thickness and Depth to Water
The depth to groundwater will define well design and contribute significantly to the capital cost of a full-scale system. The saturated thickness can also have an influence on cost, since there are practical limits on the maximum screened interval that can effectively be used in an injection well. Based on our experience, a 25-foot screened interval represents a practical limit for an injection point. Of course, this limit will be impacted by the heterogeneity of the subsurface lithology, hydraulic conductivity, and the resulting effects on permeability and groundwater flow characteristics. For example, if the lithology and resultant groundwater flow characteristics are such that there are variations in the flow characteristics that change within the target saturated interval, the use of multiple screened zones or multiple well points should be considered – even if the interval is less than 25 feet. In faster groundwater flow systems, the limited transverse dispersion in groundwater can limit the extent of the reactive zone created by an individual injection point. This is of particular importance in settings where drilling costs may be high, i.e. deep settings or complex geology. In such cases, an in-situ recirculation well can yield considerable cost savings over use of direct injection wells. This in-situ recirculation well concept aims primarily at delivering reagents in a cost effective manner while remediating larger, deeper contaminant plumes at sites with relatively high groundwater velocities (see Figure 4-2). In a general sense, with an ERD system, the cost of the reagent material itself is relatively insignificant. The majority of the costs related to reagent injection include the labor associated with preparing the reagent mixture and injecting the material into the wells/points along with related costs (mobilization to the Site, record keeping, preparation, etc.) When using non-specialized, reagents such as carbohydrates the cost per pound of TOC delivered is typically very low as outlined on Table 4-1. Table 4-1. Summary of Reagent Cost Ranges for Selected Soluble Carbohydrates Range of Costs (Per Pound of TOC) Reagent Low High Molasses (Food Grade) $ 0.25 $ 0.60 Corn Syrup $ 0.25 $ 0.44 Whey (Powder) $ 1.17 $ 1.33 Sodium Lactate $ 1.25 $ 1.46

X X X X X X X
36
Figure 4-2. Schematic of In-Situ Recirculation Well (Suthersan 2001)
The range of costs presented above take into account both cost variations in differing locations across the United States as well as the variations in reagent cost between the purchase of small batches (tens of gallons) versus bulk purchase (200+ gallons). Mass loading rates of the carbohydrate reagents are controlled primarily via the rate of groundwater flux through the zones to be treated. Based on experience carbon loading rates of between 0.001 and 0.01 pounds of organic carbon per gallon of groundwater flux per day are sufficient to create and maintain a reducing reactive zone. Additional discussion of mass loading rates as well as the relative cost implications to overall project costs have been included in Appendix A of this Protocol.
4.1.1.4 Geochemistry
Organic carbon fraction (foc) and buffering capacity are other geochemical characteristics that are important to consider during design The fraction of organic carbon (foc) will impact the amount of available organic carbon dissolved in the groundwater, as well as the sorptive capacity of the soil matrix for contaminants. Site characterized by high foc soils will have a high contaminant sorptive capacity. Accordingly, these sites will generally have considerably higher solid-phase concentrations of contaminants. Thus, as ERD treatment proceeds, there is the potential to release a larger mass of contaminant via desorption at sites with high foc soils. As such, the layout of the injection wells and planned treatment time should consider desorption effects. For example, caution should be exercised in installing systems in areas close (measured in groundwater travel

X X X X X X X
37
time) to risk receptors (e.g., adjacent to a drinking water supply well). A careful “outside –in” approach would be needed in those cases to ensure that desorbed contaminants do not impact the receptor. In addition to having a high sorptive capacity for contaminants, such sites tend to also similarly retard the spread of injected carbon. The generation of low-pH groundwater zones during ERD implementation needs to be minimized in order to maintain high reaction rates. The pH of an aquifer system is a function of the buffering capacity of the aquifer, a characteristic primarily imparted by the aquifer solids. Aquifer systems with lower buffering capacities are more susceptible to pH drops. Measuring the alkalinity of its groundwater can generically assess the buffering capacity of an aquifer system. However, because of the importance of the aquifer solids in establishing buffering capacity, groundwater alkalinity will present only a partial picture of and is likely to underestimate the true buffering capacity. Groundwater alkalinity samples are fairly stable and can thus be analyzed off-site, though alkalinity may also be readily measured in the field. Field test kits are readily available and should be sufficient for quickly field-screening the buffering capacity of an aquifer system. Bicarbonates, carbonates, and hydroxides in the aquifer solids usually impart alkalinity, though borates, silicates, and phosphates may also contribute. Because of the importance of carbonates in establishing the buffering capacity of a groundwater system, groundwater systems containing limestone minerals such as calcite (CaCO3) and dolomite (CaMgCO3) tend to yield the highest alkalinities, and therefore buffering capacity. In aquifers where buffering capacity is low, buffering additives may need to be incorporated into the design of the reagent solution.
4.1.2 Groundwater Chemistry
Groundwater chemistry includes an understanding of the target CAH’s, their daughter products, and the biogeochemical parameters. Understanding the conditions present in the groundwater will make the selection and application of reactive zones more likely to succeed. Lacking that understanding one may end up trying to undo nature and find that it is necessary to spend twice the effort to bring about the desired result. A key factor to keep in mind is that no single measurement or result should be relied on to define the predominant biological processes ongoing at the site. Redox processes in natural systems are rarely in equilibrium. Moreover, the predominant electron acceptor being utilized often varies in zones across the site. Instead, the full list of parameters analyzed in accordance with Section 3.1 should be reviewed both on a well by well and a site-wide basis, to determine which of the electron acceptors are primarily being utilized. As discussed previously, the enhancement of natural conditions takes advantage of natural processes that are already contributing to the degradation of the target compounds. Of particular importance is the presence of degradation products, the presence and nature of electron acceptors, a definition of the redox conditions (ORP) and the presence of electron donors. The presence of degradation products that indicate that a particular environment has established itself is typically easy to verify. For many sites historical CAH data is available that may date back years and can be used to establish the presence of degradation products, as well as to evaluate trends in source and daughter products over time. These data can also provide information regarding historical impacts of variable organic substances that may have served as electron donors. For example, at a site in central-Pennsylvania, historical impacts of benzene provided a source of electron donors for indigenous microbial populations. This resulted in the degradation of TCE to ethene via the anaerobic reducing pathway described earlier. As the benzene source “burned out” the reductive dechlorination process stalled at DCE. Thus it is important in reviewing historical trends to understand the conditions that existed throughout the historical record.

X X X X X X X
38
Reducing reactive zones rely on the presence of an adequate source of electron donors (in the form of organic carbon) to establish and maintain a bacterial population that can maintain an anaerobic environment. The organic carbon may take the form of natural organic matter or anthropogenic carbon sources – other organic COCs, such as BTEX, PHCs, ketones, or alcohols. Many times the natural source of organic carbon is weak, or absent and as a result supplemental sources must be considered to enhance the naturally reducing environment.
4.1.2.1 pH
While microbial populations can endure a wide range of pH, a pH close to neutral (5-9) is the most conducive to the proliferation of healthy, diverse microbial populations necessary for ERD implementation. In particular, low groundwater pH may indicate and/or encourage fermentative biochemical reactions unfavorable to ERD systems. In such cases, pH buffering, typically using common basic salts, may be required during implementation to raise pH and/or neutralize pH against further decreases. Sites with pH outside of the 5-9 range indicated may require more thorough biological screening (e.g., using microcosm studies) to evaluate the effect of pH manipulation on the efficacy of existing microbial populations. Sites characterized by large areas having very high or very low pH as a result of their contamination chemistry may be poor choices for ERD implementation unless large-scale pH manipulation is feasible. The natural buffering capacity of a site against such pH changes can be generically assessed via the measurement of groundwater alkalinity and the consideration of bulk mineralogy as discussed in detail in Section 4.1.1.4 and 4.2.1. Control of pH during substrate injection is further discussed in Section 4.5.
4.1.2.2 Role of Sulfur in Enhanced Bioremediation of CAHs
The role of sulfur in the effectiveness of enhanced bioremediation of CAHs is complex and multifaceted. Existing guidance documents tend to suggest that anaerobic bioremediation of CAHs proceeds best under methanogenic conditions. Even though they do document that CAH degradation under sulfate reducing conditions is feasible, it appears anecdotally to us that the majority opinion of field practitioners is that sulfate is problematic for CAH degradation. For example, Wiedemeier states, “Concentrations of sulfate greater than 20 mg/L may cause competitive exclusion of dechlorination. However, in many plumes with high concentrations of sulfate, reductive dechlorination still occurs” (Wiedemeier 1998). The Wiedemeier protocol scores a site more poorly if sulfate exceeds that level, as does Morse (1998). The ITRC guidelines state, “abundant electron acceptors such as sulfate, may inhibit reductive biodegradation.” Further, “high sulfate concentrations may prevent methanogenic conditions from developing,” and “the documentation of high sulfate mineral abundance can be used….to explain slow rates of reductive dechlorination.” Sulfate, whether contributed in the injected reagent or already present, indeed must be reduced in order to reach methanogenic conditions, but there is ample evidence in the literature for dechlorination of a wide variety of CAHs under sulfate reducing conditions (ITRC 1998; Devlin and Muller, 1999). It has also been postulated that the presence of abundant electron acceptors, including sulfate, can interfere with the enhancement of dehalorespirators and that dehalorespiring organisms compete for electron donors such as hydrogen with both methanogenic and sulfate reducing organisms (Morse 1998; Suthersan 2002). Morse writes, “Depletion of electron acceptors should effectively eliminate competition between dechlorinators and such groups as nitrate reducers, iron reducers and sulfate reducers. Competition from Methanogens on the other hand may never be eliminated and must be managed by

X X X X X X X
39
choice and delivery of electron donor.” Suthersan, however, reviews the most recent literature and argues that “halorespirators can outcompete methanogens and sulfate reducers at any hydrogen concentration,” and, thus, the strategies that limit the generation of hydrogen to favor dehalorespirators is not necessary (Suthersan 2002; Drzyzga 2002). Generation of hydrogen sulfide can be a problem in certain applications, including those under structures and where there is a direct route between the reactive zones and receptors, although this can be controlled with engineered gas recovery systems. Generation of other reduced sulfur compounds, such as thiols (also known as mercaptans), is most likely to occur where the hydrogeology is unfavorable for dispersion due to low permeability or lack of gradient leading to conditions where extreme fermentation predominates. However, sulfur, whether contained in the formulation of a donor such as molasses or present in the system already, offers important advantages, including sulfide production for metals precipitation and potentially aiding biological degradation of CAHs (Lutes 2002c). Sulfur and sulfur containing compounds can aid the degradation of CAHs through a variety of mechanisms:
• Involvement (as reductants and/or intermediates) in the degradation mechanisms of CAHs (Bushman 1999)
• Through the stimulation of dehalogenation by sulfate reducers (Zwiernik et al., 1998)
• Through abiotic degradation of CAHs by FeS (Butler and Hayes, 1999) ARCADIS has successfully applied enhanced anaerobic bioremediation at sites with up to 500-700 ppm of sulfate. We have reviewed data that suggests natural attenuation at even higher levels (up to 2,000 ppm). Thus, it is clear that CAHs can be effectively treated under sulfate reducing conditions and that sulfur can be directly involved in several processes that enhance this degradation. Practitioners should recognize that multiple complex processes occur in these systems, that research on them is ongoing, and that the presence of substantial sulfate concentrations will not necessarily preclude enhancement of CAH bioremediation to cost-effective rates. The amount of sulfur already in the groundwater system cannot be controlled. However, the amount of sulfur added to the system can be controlled by selection of the donor reagent including low sulfur (i.e., corn syrup less than 1 mg/L sulfate) and medium sulfur (fancy, edible-grade molasses, 250 ppm sulfate) reagents. [Sulfate concentrations are given for 10% solutions, which is the typical injected concentration, substantial further dilution should be expected in the aquifer.] Thus, the amount of additional sulfur provided to the system can be controlled to some extent by the selection of product and grade among those electron donors commercially available in the food industry. Additional discussion regarding the selection of and application considerations for the various reagents is provided in Section 4.3.
4.1.2.3 Salinity
Sites that are located in brackish- (saline) settings may also show a lack of biological diversity, and only partial degradation. Often this is related to elevated concentrations of sulfate (see the more extensive discussion of the role of sulfur in Section 4.1.2.2). This will result in slower rates of biodegradation and longer lag times. Experience shows that in-situ enhancements are possible, albeit slower, at sites where sulfate is less than 500 to 700 mg/L. Again, pre-screening and baseline analysis will allow for a determination if brackish/high sulfate groundwater may be inhibitory in any particular instance. Very

X X X X X X X
40
recent work at Cornell suggests that a newly isolated organism may be capable of effective CAH degradation under brackish conditions. (Zinder 2002)
4.2 ERD Layout Options
There are a number of options available for delivery of reagents to form an IRZ using ERD. The most commonly used method is the use of direct injection wells or direct push well points to inject the reagent into the target zone. However, other delivery mechanisms would include: gravity flooding via trenches/infiltration galleries for shallow plumes, in-situ recirculation wells for deeper/thicker plumes, horizontal wells for shallow/thin plumes and plumes beneath buildings or other structures, and recirculation-well systems consisting of a closed system of extraction and injection wells oriented perpendicular to groundwater flow. For purposes of demonstrating options for applying ERD via IRZs we will focus on injection wells as the delivery mechanism. Figure 4-3 shows a conceptual design for an ERD system layout. The injection system may be mounted on a truck (Figure 4-4) or may be placed in a (semi-) permanent structure. Figure 4-5 shows the interior of such a structure as well as the physical layout of the injection distribution system. As shown in figures 4-3 through and 4-5 systems can either be manually controlled or automated using Programmable Logic Controllers (PLC).
Figure 4-3. Conceptual design for an ERD system layout
Molasses TankBatch Tank
Feed PumpsReactive Zone
Injection WellsPiping Network
PLC
Potable water
Figure 3 - Molasses Injection System Conceptual Design

X X X X X X X
41
Figure 4-4. Vehicle Mounted Molasses Injection Rig
Figure 4-5. Physical layout of permanent injection distribution system
Picture 2 Molasses Injection System
Batch Tank
Molasses Tank
Solenoid/Distribution
X X X X X X X
42
4.2.1 Injection Well/Point Placement
Reactive zones are applied in a number of different configurations and using a variety of approaches. The variety and combinations used are limited only by the variety of potential scenarios that may be encountered in the field and the goals of the project. For the purposes of this text three basic layouts will be discussed: cutoff/barrier, plume-wide, and hot spots. Cutoff/Barriers or containment curtains (or “fences”) consist of a series of reagent injection wells or points typically established in a row perpendicular to the groundwater flow direction along a line that represents a critical boundary for remediation (Figure 4-6). This layout is commonly employed along or near a property line, or other boundaries established for the purpose of remediation or regulatory closure. The location of this layout can also be selected based on practical means (e.g., located near a road for drilling and injection access) or in an available open area in developed settings. In most cases the cutoff layout is less expensive to deploy, from a capital cost perspective, because the entire plume is not being remediated, therefore fewer injection points are required. However, life cycle costs could be significantly higher if the source of the CAHs upgradient of the cutoff barrier is not being addressed. Plume-wide reactive zones target a large portion of the impacted groundwater for much more aggressive and short-term treatment. Typically the injection points will be spaced throughout the target-impacted groundwater (Figure 4-7). By applying the reactive zone across the entire plume site closure can be achieved more readily. Obviously, there are cost implications, with such an application: higher capital costs are traded for shorter remedial timeframes and the potential commensurate reduction in total O&M costs. Hot-spot reactive zones target the source area. This layout is often employed in-situations where the natural remediation process or a barrier method (including IRZ, permeable reactive barriers or hydraulic containment – pump and treat) is successfully controlling the movement of the contaminant plume, but there is a need – regulatory or other – to speed up the overall remediation. In this case the source area is targeted for an IRZ, in order to reduce contaminant mass quickly. Once the IRZ has brought concentrations in the source area down to target concentrations, injections in the source area can cease. An IRZ in the source area is likely to result in a release of daughter compounds as well as the source constituent due to desorption from the soil matrix. Thus it is important to design the IRZ so that ERD has been established on the downgradient “edge” before beginning ERD treatment within the “heart” of the source area. In a number of cases, the remediation strategy includes establishing an IRZ in the source area along with installing one or more IRZs (injection well arrays) downgradient of the source area. The most appropriate application of ERD is site specific and will be based on a site strategy that combines, among other things, costs, regulatory issues, and future use of the site. Upon selection of the injection well layout or layouts for a given Site, the specific reagent injection well spacing must be addressed. Spacing consideration will include both parallel and perpendicular to the direction of groundwater flow. Proper well spacing in the direction perpendicular to the direction of groundwater flow is more critical to the successful application of the ERD technology as it will have a greater bearing on the ability to create a

X X X X X X X
43
complete (i.e. overlapping) IRZ downgradient of the injection area thus assuring complete treatment. In the absence of Site specific well spacing information obtained via an ERD pilot study (see Section 5.1 for

X X X X X X X
44
Figure 4-6. In-situ Reactive Zones based on the Curtain Concept (A: One curtain at downgradient edge. B. Two curtains at downgradient edge and at source area. C: Three curtains to remediate
the plume faster)

X X X X X X X
45
Contaminant Plume
Reactive Zones
Injection Wells (typ)
Figure 4-7. Plume-Wide or Source Area Reactive Zone – Note, Source Area Applications Should Also Include a Preestablished Downgradient Curtain

X X X X X X X
46
initial spacing recommendations during a pilot study) well spacing between 20 to 50 feet is recommended. This spacing is based on evaluation of expected transverse dispersion of reagents following injection as well as experience obtained for field applications. Well spacing on the lower end of the range is recommended for more permeable, higher groundwater flow sites or in cases where aggressive treatment of high concentration or sources areas is desired. Proper well spacing in the direction parallel to groundwater flow is less important in terms of overall IRZ success and rather is affected more by the balance between budget and desired cost for treatment. Empirical application experience suggests the length of an IRZ in which we can expect aggressive treatment of both dissolved and adsorbed phase impacts is generally 100 days of groundwater travel time from the point of injection. Beyond this distance the IRZ application will result in treatment of groundwater impacts in a more indirect manner (i.e. due to the flow of “clean” water into the downgradient area). Hence, the optimal spacing of injection wells for plume wide treatment would be at the 100-day travel time distance. However, this distance could be increased in order to trade-off capital and initial operating costs for duration of treatment.
4.2.2 Monitoring Well Placement
The selection of monitoring or observation well placement for an IRZ application will be dictated by the degree of interest in monitoring the results from the regulatory agencies and customers. In terms of monitoring well placement and/or utilization of monitoring wells it is first advisable to utilize one or more previously existing monitoring wells for performance evaluation. This is because existing wells most often have useful (sometime extensive) historical data regarding the trends in constituent concentrations and can often offer clues on seasonal variability of the monitoring data. This is important as it often provides clear proof of increase in constituent degradation rates related to the implementation of the IRZ. New monitoring wells are typically placed at month intervals of groundwater travel time predicted for an unretained tracer. For example, wells could be placed a distances of one, two and three months travel time from the location of the injection wells. This ensures that the monitoring well system will be able to observe various stages of substrate utilization. This also makes the success of the monitoring program less vulnerable to variations in biological process rates or groundwater velocity. However, it should be recognized that on low groundwater flow settings, one or even two months travel time may be unrealistically close to the injection wells. It is advised that the minimum spacing between injection and observation wells be 10 feet, unless other constraints dictate closer placement. Since most real world systems display preferential flow paths and temporal variation in groundwater flow direction it is also advised to use transects of multiple monitoring wells perpendicular to the direction and/or to stagger the lateral placement of wells as you move downgradient from the injection area.
4.3 Reagents
There are a variety of reagents that are being used in ERD. Table 4-2 identifies a number of soluble carbohydrate reagents reported in the literature.
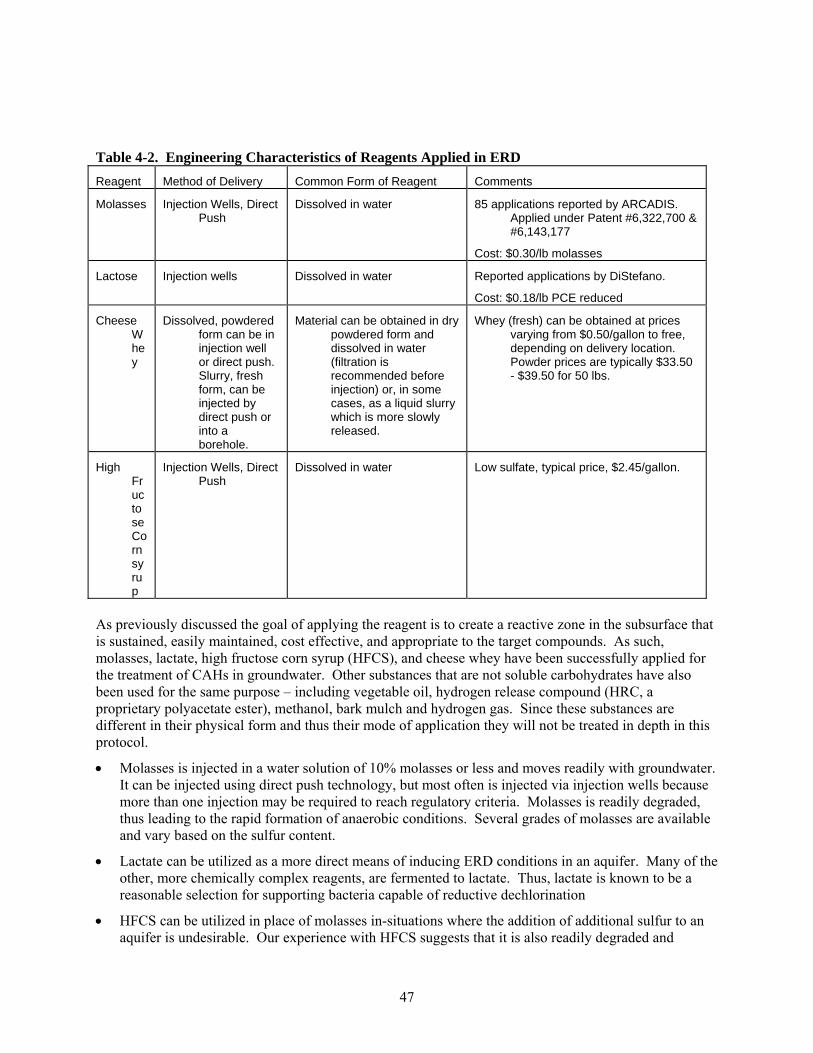
X X X X X X X
47
Table 4-2. Engineering Characteristics of Reagents Applied in ERD Reagent Method of Delivery Common Form of Reagent Comments
Molasses Injection Wells, Direct Push
Dissolved in water 85 applications reported by ARCADIS. Applied under Patent #6,322,700 & #6,143,177
Cost: $0.30/lb molasses
Lactose Injection wells Dissolved in water Reported applications by DiStefano.
Cost: $0.18/lb PCE reduced
Cheese Whey
Dissolved, powdered form can be in injection well or direct push. Slurry, fresh form, can be injected by direct push or into a borehole.
Material can be obtained in dry powdered form and dissolved in water (filtration is recommended before injection) or, in some cases, as a liquid slurry which is more slowly released.
Whey (fresh) can be obtained at prices varying from $0.50/gallon to free, depending on delivery location. Powder prices are typically $33.50 - $39.50 for 50 lbs.
High Fructose Corn syrup
Injection Wells, Direct Push
Dissolved in water Low sulfate, typical price, $2.45/gallon.
As previously discussed the goal of applying the reagent is to create a reactive zone in the subsurface that is sustained, easily maintained, cost effective, and appropriate to the target compounds. As such, molasses, lactate, high fructose corn syrup (HFCS), and cheese whey have been successfully applied for the treatment of CAHs in groundwater. Other substances that are not soluble carbohydrates have also been used for the same purpose – including vegetable oil, hydrogen release compound (HRC, a proprietary polyacetate ester), methanol, bark mulch and hydrogen gas. Since these substances are different in their physical form and thus their mode of application they will not be treated in depth in this protocol.
• Molasses is injected in a water solution of 10% molasses or less and moves readily with groundwater. It can be injected using direct push technology, but most often is injected via injection wells because more than one injection may be required to reach regulatory criteria. Molasses is readily degraded, thus leading to the rapid formation of anaerobic conditions. Several grades of molasses are available and vary based on the sulfur content.
• Lactate can be utilized as a more direct means of inducing ERD conditions in an aquifer. Many of the other, more chemically complex reagents, are fermented to lactate. Thus, lactate is known to be a reasonable selection for supporting bacteria capable of reductive dechlorination
• HFCS can be utilized in place of molasses in-situations where the addition of additional sulfur to an aquifer is undesirable. Our experience with HFCS suggests that it is also readily degraded and

X X X X X X X
48
capable of rapidly forming an anaerobic zone.
• Cheese whey is perhaps the most chemically complex of the soluble carbohydrates. Its increased chemical complexity makes it longer acting in the aquifer. Fresh whey can be obtained extremely cheaply – typically the only cost is transportation. Powered whey is substantially more costly, but is easier to obtain, ship and store.
As the efficacy of ERD has been demonstrated in the field by numerous parties, the number of soluble substrates applied has grown. Table 4-2 lists only a few of the many reagents tested in the laboratory or in the field. Other substrates include methanol, ethanol, sucrose, cellulose, pure hydrogen, and proprietary blends of these and other sources of soluble organic carbon. ITRC (1998) reviews application of numerous substrates for CAH bioremediation. Appendix A provides a compilation of case studies of the application of soluble carbohydrates from the work of the authors’ firm and the literature. The selection of the substrate must take into account reagent unit cost, reagent availability, expected variations in rate of anaerobic zone generation, rate at which the substrate is utilized and target aquifer inorganic water quality goals. Many reagents are being selected from the wide variety of available food-grade organic carbon sources (molasses, sucrose and vegetable oils for example). Reagent selection as discussed below should also be driven by engineering considerations chiefly regarding its physical state, speed of utilization, and relative cost.
4.3.1 Desorption Effects
Substrates do not only stimulate biodegradation – they also can cause desorption effects in the aquifer. Understanding and thus being able to engineer these effects is a critical part of the overall reagent selection and design process. The use of degradable biological surfactants has previously been studied and demonstrated to be effective for increasing mass recovery at petroleum hydrocarbon sites. Bench scale and some field studies have applied this approach to CAHs. Experience reveals that a common effect of the soluble organic carbon injections related to IRZ application is an increase in the CAH dissolved concentrations in groundwater in the area of and downgradient of the injections. In some cases this increase can be significant (greater than 100% increase). These concentration increases are a natural consequence of four mechanisms: progressive decreases in organic carbon partition coefficient (KOC) values as dechlorination proceeds, biosurfactant production by microbial consortia, co-solvency of fermentation products, and aqueous-phase carbon flooding. At sites where soil pH is well buffered or a buffer is provided, ERD can be managed specifically to attack sorbed-phase contaminant (source zones) that is otherwise unexposed to remedial measures. (See Figure 4-8). ERD reactions as is the case with many remediation techniques primarily occur or address the aqueous phase. Hence the process, in terms of an overall remediation and mass removal/reduction perspective is limited by the availability of contaminants in the dissolved phase. For many chlorinated CAHs, a large portion of the mass in an aquifer can reside in sorbed phase, unavailable to ERD reactions (Scow and Jackson, 1997). Figure 4-8 shows the portion of sorbed CAH mass as a function of organic carbon fraction in the aquifer materials. For example, at moderate levels of soil organic matter, less than 15 percent of PCE in an aquifer can be found in the dissolved phase. Substantial mass transfer from adsorbed to dissolved phase must occur, along with reductive dechlorination reactions, to fully treat most aquifer formations. The four mechanisms associated with the ERD process force desorption of contaminants as detailed below.

X X X X X X X
49
Koc Value Changes. As an example, in the common reductive dechlorination sequence of PCE, the organic carbon partition coefficients, which define the distribution of mass between the adsorbed and dissolved phases, decrease from 265 to 17. Therefore, as reductive dechlorination proceeds, the products resulting from each step in the sequence are less susceptible to adsorption than the previous compound in the sequence. Thus the aqueous phase concentration of CAHs increases.
Organic Carbon Fraction (foc)0.000 0.002 0.004 0.006 0.008 0.010
Perc
ent S
orbe
d
0
20
40
60
80
100
Koc = 265 (PCE)
Koc = 36 (cis-1,2-DCE)
Koc = 94 (TCE)
Koc = 19 (vinyl chloride)
blan
king
Figure 4-8. CAH Distribution as a Function of Organic Carbon Koc values are expressed as L/kg
Biosurfactants. The injection of an abundant source of degradable carbon during ERD results in rapid increases in microbial population. This large population increase will also result in an increase in the production of natural biosurfactants and bioemulsifiers by the microorganisms. To assimilate less soluble substrates, such as chlorinated solvents, microorganisms require a large contact area between themselves and the contaminant. They achieve this by emulsifying the adsorbed contaminants into the dissolved phase. Microbes frequently synthesize and excrete chemicals that promote such emulsification, biosurfactants and bioemulsifiers. [Biosurfactants reduce the interfacial tension between water and the chlorinated contaminant, so that the chlorinated contaminant is easily micro-emulsified into the water phase. These micro-emulsion droplets are smaller than the microbial cells.] Several studies have demonstrated the potential for mobilization of hydrophobic contaminants by bacterial glycolipids and rhamnolipid biosurfactants produced by Pseudomonas species in fermentation processes (Mercade and Manresa, 1994; Noordman et al., 2000; Zhang and Miller, 1992). The genus Rhodococcus also produces effective biosurfactants (Kanga et al., 1997). Biosurfactants can microemulsify contaminants and increase the apparent solubilities by partitioning the contaminants into surfactant micelles. Fermentation Products. Fermentation of carbon sources creates organic acids, alcohols, ketones, fatty acids and other soluble constituents that may act as solvents, mobilizing a portion of the non-aqueous soil organic matter. This in turn will increase the partitioning from the adsorbed phase to the dissolved phase

X X X X X X X
50
as outlined above due to a reduction in soil organic content. Dissolved Organic Carbon Flooding. Under normal aquifer conditions, dissolved-phase organic matter is dwarfed by solid-phase natural organic matter. However, the soluble and colloidal organic carbon flooding of an aquifer during ERD provides a large pool of relatively mobile uncontaminated organic matter. Simple equilibrium partitioning with the added carbon will drive a portion of the adsorbed phase contaminants into the dissolved phase. This effect was observed by Hunchak-Kariouck et al. (1997), even though the levels of dissolved organic matter they studied were two orders of magnitude below those applied in field applications of ERD. These desorption effects are observed in many biological treatment processes as an increase in the constituent levels both in the treatment zone and, in some cases, downgradient of the treatment zone. In other cases, the constituent concentrations in the treatment zone remain constant even when biodegradation end-product data supports the conclusion that the ERD processes are degrading sufficient mass. Figure 4-9 is from a monitoring well from a successful full-scale ERD remediation and illustrates a typical natural surfactant enhanced peak in target source CAH concentrations followed by sequential formation and degradation of daughter products. Intuitively, the increased desorption of target constituents allows for greater access to typically “inaccessible” constituent mass. However, this natural surfactant effect must be anticipated and pilot- and/or full-scale treatment should incorporate provisions to evaluate and account for it. For example:
• The potential for initial increases of stable parent constituent trends can be of concern to both clients and regulatory bodies as the data would tend to indicate the technology is not only not working, but could be considered as actually making conditions worse. Therefore, during the project or pilot test planning stages the possibility of this desorption effect must be evaluated in detail and carefully explained to stakeholders.
• The possibility for an increase of dissolved CAHs to occur in areas downgradient of the treatment area must be addressed in regards to possible off-site migration and/or migration towards sensitive receptors. If these issues are of concern, the possibility for expansion of the ERD to treat these areas and/or the provision for additional downgradient monitoring and/or possible containment of the groundwater must be explored. Typically, an “outside-in” approach is applied whereby ERD is established in a downgradient, lower concentration portion of the plume before applying ERD to a source area. Desorbed VOCs would then move into an area already amenable for treatment.

X X X X X X X
51
Figure 4-9. Analytical Results for Well at Abandoned Manufacturing Facility
4.3.2 Suitability of Differing Electron Donors for Differing Conditions
All commercially available carbon substrates have some similar characteristics, including some degree of degradability and solubility. They differ in the speed with which the material becomes bio-available and is degraded, in the complexity of their composition and in their cost. Complexity in composition is viewed as a desirable substrate feature, because it thus stimulates a more diverse microbial community. As we discussed earlier substrates range from those that slowly release soluble degradable carbon, to those that immediately produce soluble, degradable carbon. The effectiveness of ERD systems is governed by many site-specific conditions. The geochemical character of the matrix and groundwater, and hydrologic conditions such as groundwater velocity, influence the efficacy and areal extent of the IRZ. In cases where extensive CAH plumes are being treated, it is desirable that carbon supplements be consumed at a rate sufficient to lower redox conditions, but low enough to propagate the maximum area of desired treatment from a given injection point. The rate of the carbon supplement release and consumption will influence the volume of aquifer being treated with each injection point and should thus be considered based on site-specific conditions. Excessive application can result in the production of excess levels of unwanted by-products such as methane or organic acids. Also, an excessive consumption rate can result in inadequate temporal distribution of the carbon substrate, resulting in an increase in frequency of injections and/or an increase in the number of injection points required to cover a given treatment area. It has been argued that a slow steady release over time of hydrogen from degradation of the electron donor is desirable to optimize the biological conditions for CAH degradation (Smatalak 1996), although, as discussed in Section 1.3.4 and Appendix B, this may not be necessary and may even be counter-productive. The economic application of soluble carbon substrates thus requires the ability to match the biogeochemical
0
500
1000
1500
2000
2500
3000
3500
4000
4500
Dec-96 Apr-97 Jun-97 Oct-97 Dec-97 Jul-98 Oct-98
Date
Con
cent
ratio
n (u
g/L
)
TCEDCEVC
Injection Event (April 1997)
Injection Event (February 1998)

X X X X X X X
52
and hydrodynamic character of the aquifer to the biogeochemical character of one or more sources of soluble carbon. Extensive bench scale work has been performed by numerous workers to test several potential carbon sources; (Fennel 1997; Semprini 1999; Alleman 1999; Gibson 1992; Morse 1998; Schollhorn 1997; Gao et al., 1997; Gibson and Sewell(1992; Becvar 1997, and references cited therein). The selection of a carbon substrate(s) will be primarily driven by overall reaction rates, which are, in turn, controlled by the site conditions. A goal should be to minimize overall project cost by minimizing the number of required injection points, the number of injection events, and reagent cost (Harkness 2000). The physical characteristics of the substrate (i.e. phase and solubility) may also make certain substrates more suitable than others in particular applications. Examples of candidate carbon substrate products for widespread field application include:
• Hydrogen, (gas, very rapidly used)
• Butyrate, lactate, etc. (soluble, pure compounds, rapidly used)
• Corn syrup (soluble, readily consumed)
• Molasses (soluble, readily consumed)
• Vegetable oils (partially soluble, readily consumed)
• Yeast extract (partially soluble, readily consumed)
• Whey or other milk solids (solid, which can be dissolved in water and then is readily consumed or liquid, slowly-to-readily consumed)
• Soluble humates (soluble, slowly consumed)
• Chitin (partially soluble, slow release)
• Organic mulches (partially soluble, slowly-to-readily consumed)
• HRCTM (solid, slow releasing)
• Combination of various products Where groundwater velocities are relatively high, the effect of the carbon supplements may be reduced by dilution into a large volume of oxygenated groundwater, and thus a high consumption of substrate may be necessary to reach anaerobic conditions required for treatment. In systems that are naturally aerobic, it may be necessary to use a rapidly acting carbon substrate to initially drive the redox potential down. Additionally, a highly degradable substrate may aid in overcoming the microbial lag phase attributed to anaerobic bacteria. Once reducing conditions are achieved, a more slowly acting carbon substrate may be desirable to minimize the cost of maintaining reducing conditions. Thus, using a mixture or cocktail of fast and slow acting products may be desirable in some cases. Where the groundwater velocities are relatively low, the issue of mixing with oxygenated groundwater is less critical. However, stimulated bacterial populations may increase to levels that too rapidly consume simple carbon substrates, making the volume of the treatment area relatively small. A cost comparison for a variety of different substrates is presented in Table 4-3 of (Suthersan 2002) (see also Harkness 2000). This makes clear that there are dramatic price differences on a cost per pound basis for various substrates. However, as discussed previously, cost per pound should not be the sole criteria for substrate selection.
X X X X X X X
53
Additional details are provided in Table 4-1. The cost ranges presented in Table 4-1 are F.O.B. project Site and represent a range of costs observed throughout the United States and also represent both low volume (i.e. tens of gallons) and bulk (200+ gallon) purchases. Based on experience, loading rates for differing scenarios are expected to be on the order of 0.001 – 0.01 pounds of TOC per gallon of groundwater flux per day.
4.4 Delivery System Design
As discussed previously, there are a number of injection or delivery systems used in ERD including injection wells, direct-push well points, in-situ recirculation wells, recirculation well systems, and infiltration galleries. Permanent wells are constructed with materials appropriate for the geological formation, groundwater quality and selected reagent. A typical injection well is shown in Figure 4-10. Wells in an unconsolidated formation are typically 2 to 4-inch diameter Schedule 40 or 80 polyvinyl chloride (PVC) construction with slotted screens sized for the formation. In bedrock, an open borehole in the target-saturated zone is acceptable with a PVC or steel casing in the overburden. However, conversion of existing open-hole wells in bedrock to screened wells has been performed in order to focus delivery of reagents into the fracture zones requiring treatment. Wells constructed in this fashion provide a permanent and repeatable means of delivering reagent to the subsurface. They are commonly applied in situations where readily soluble and degradable organic substrates – such as molasses – are applied. Permanent wells allow for multiple injections to establish and maintain the reactive zone. Permanent delivery systems are also necessary in-situations where depths, or soil strata make direct-push techniques impractical. Permanent delivery systems can also be implemented in situations where existing wells or remediation wells from a previous remediation system are reused to reagent delivery.

X X X X X X X
54
Table 4-3. Relative Cost of Various Electron Donors That Have Been Used To Enhance Reductive Dechlorination Per Lb of TOC and Per LB of PCE Treated1
Electron Donor Bulk Price $/lb of TOC $/lb of PCE Treated
Molasses 0.20 – 0.35 0.16
Sugar (Corn Syrup) 0.25 – 0.30 0.40
Sodium Lactate 1.25 – 1.46 NA
Whey (Powdered, Dry) 1.17 NA
Whey (Fresh) 0.05 0.04
Edible Oils 0.20 – 0.50 NA
Flour (Starch) 0.30 0.85
Cellulose 0.40 – 0.80 NA
Chitin 2.25 – 3.00 NA
Methyl Cellulose 4.00 – 5.00 NA
HRC™ (Regenesis Commercial Material) 5.00 – 6.002 NA NA – Not Analyzed Note 1, References: Harkness 2000; DiStefano, 2000. Note 2, Personal Communication, Leeson, 2002

X X X X X X X
55
Figure 4-10. Injection Well Construction Detail

X X X X X X X
56
Direct-push techniques are also used for reactive zones in select applications. This type of delivery point is limited to shallow, unconsolidated formations at depths typically limited to 50 feet. This technique is also constrained by the soil characteristics, particularly grain size. In some cases, where direct-push wells are used, a permanent or temporary well point is placed using a direct-push drilling rig such as a cone penetrometer (CPT). This type of well is a small diameter point and is commonly applied where the number of injections will be limited and the need for well maintenance is minimal. This design is recommended only when the groundwater flow relatively slow (less than 0.1 – 0.2 feet per day) and therefore the direct push deployment of the reagent can be made on intervals that make sense economically (6 – 12 months). Depending on the delivery layout (see Section 4.4) this technique may require a large number of injection points and the repeated nature of the temporary point must be carefully considered in this layout.Another type of direct-push well point is a temporary geoprobe or hydro-punch well. In this case, the well drilling process is an injection process. Thus as the well point is placed, the reagent is injected. When the injection process is complete, no well points remain. This approach is applicable for slow-release materials such as polylactate ester or whey, which will dissolve slowly and typically require injection points on 2- to 5-foot centers to treat the target zone. As with CPT, this technique is limited by depth and geology. IRZ wells must be designed to target the impacted groundwater. Thus the depth and screened interval will be determined by the vertical delineation of the groundwater impacts – with all the limitations this implies. In addition, the lithology can have an impact on the well design and screened interval since the injected reagent will flow with groundwater, following the path of least resistance. As a result, it is important to understand both the geology and the contaminant distribution when designing the wells. Where the saturated thickness exceeds this limit, multiple well points are recommended. As an alternative a single well point can be used in which multiple screened intervals are present and separated by packers during injections. The number of injection points and the spatial distribution of these points are a function of the contaminant distribution, the hydrogeology of the impacted zone, the type of injection point selected, and the type of reagent being used. The injection wells need to cover the entire area targeted by the reactive zone. The geology and groundwater velocity will control how wide an area a single point can impact. For example, in a tight geologic unit, groundwater is likely to move relatively slowly, and the ability to inject is limited by the permeability of the formation. As a result, the reactive zone developed from a single point will have a limited impact laterally from the injection point and in the direction of groundwater flow. Therefore more points will be needed on a closer spacing. (See Section 4.1.1.1) The type of reagent used also can effect the spatial distribution of the injection points. If a water-soluble reagent, such as molasses or sucrose is used, the reagent will have flow characteristics very nearly identical to that of water and thus will move readily with the groundwater. As the reagent becomes more viscous, the ability to inject and achieve good lateral distribution will decline. As a result, in the latter case, more closely spaced well points will be required. As outlined in Section 4.2 there are a number of ERD delivery options available. By far the most common is the batch injection system (Figure 4-4). In this case a given batch of reagent (water and carbohydrate) is generated manually and injected manually into an injection well(s) using a portable system.
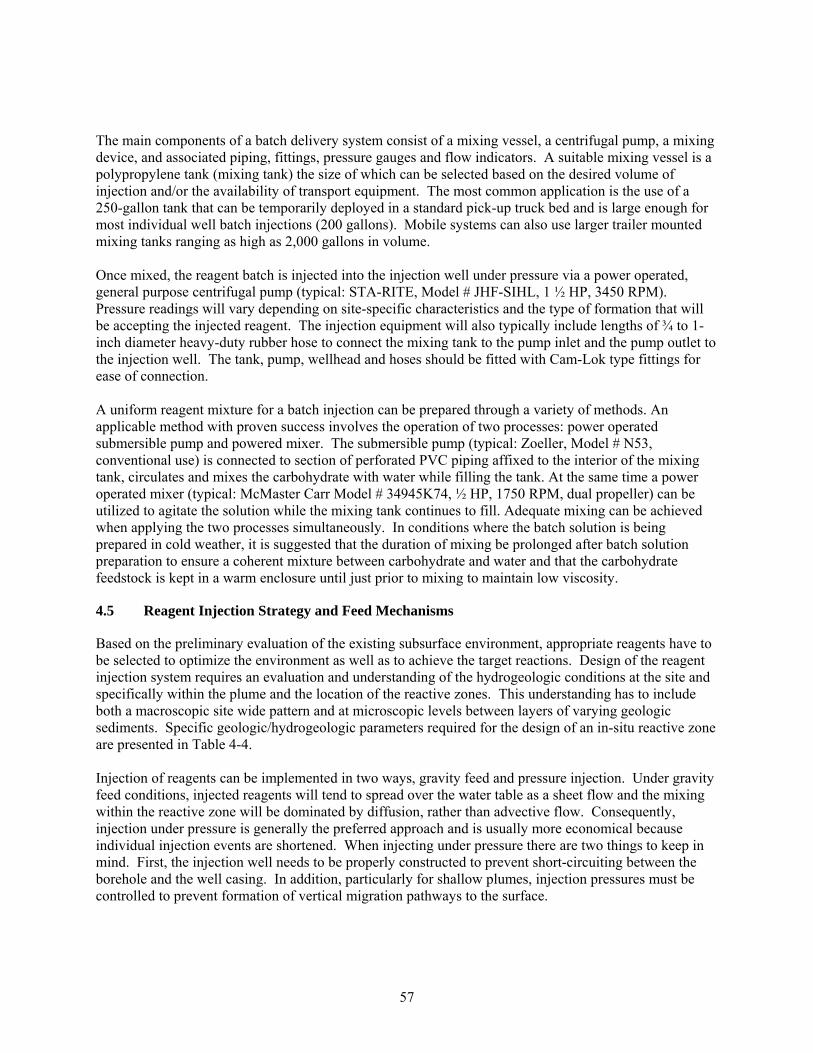
X X X X X X X
57
The main components of a batch delivery system consist of a mixing vessel, a centrifugal pump, a mixing device, and associated piping, fittings, pressure gauges and flow indicators. A suitable mixing vessel is a polypropylene tank (mixing tank) the size of which can be selected based on the desired volume of injection and/or the availability of transport equipment. The most common application is the use of a 250-gallon tank that can be temporarily deployed in a standard pick-up truck bed and is large enough for most individual well batch injections (200 gallons). Mobile systems can also use larger trailer mounted mixing tanks ranging as high as 2,000 gallons in volume. Once mixed, the reagent batch is injected into the injection well under pressure via a power operated, general purpose centrifugal pump (typical: STA-RITE, Model # JHF-SIHL, 1 ½ HP, 3450 RPM). Pressure readings will vary depending on site-specific characteristics and the type of formation that will be accepting the injected reagent. The injection equipment will also typically include lengths of ¾ to 1-inch diameter heavy-duty rubber hose to connect the mixing tank to the pump inlet and the pump outlet to the injection well. The tank, pump, wellhead and hoses should be fitted with Cam-Lok type fittings for ease of connection. A uniform reagent mixture for a batch injection can be prepared through a variety of methods. An applicable method with proven success involves the operation of two processes: power operated submersible pump and powered mixer. The submersible pump (typical: Zoeller, Model # N53, conventional use) is connected to section of perforated PVC piping affixed to the interior of the mixing tank, circulates and mixes the carbohydrate with water while filling the tank. At the same time a power operated mixer (typical: McMaster Carr Model # 34945K74, ½ HP, 1750 RPM, dual propeller) can be utilized to agitate the solution while the mixing tank continues to fill. Adequate mixing can be achieved when applying the two processes simultaneously. In conditions where the batch solution is being prepared in cold weather, it is suggested that the duration of mixing be prolonged after batch solution preparation to ensure a coherent mixture between carbohydrate and water and that the carbohydrate feedstock is kept in a warm enclosure until just prior to mixing to maintain low viscosity.
4.5 Reagent Injection Strategy and Feed Mechanisms
Based on the preliminary evaluation of the existing subsurface environment, appropriate reagents have to be selected to optimize the environment as well as to achieve the target reactions. Design of the reagent injection system requires an evaluation and understanding of the hydrogeologic conditions at the site and specifically within the plume and the location of the reactive zones. This understanding has to include both a macroscopic site wide pattern and at microscopic levels between layers of varying geologic sediments. Specific geologic/hydrogeologic parameters required for the design of an in-situ reactive zone are presented in Table 4-4. Injection of reagents can be implemented in two ways, gravity feed and pressure injection. Under gravity feed conditions, injected reagents will tend to spread over the water table as a sheet flow and the mixing within the reactive zone will be dominated by diffusion, rather than advective flow. Consequently, injection under pressure is generally the preferred approach and is usually more economical because individual injection events are shortened. When injecting under pressure there are two things to keep in mind. First, the injection well needs to be properly constructed to prevent short-circuiting between the borehole and the well casing. In addition, particularly for shallow plumes, injection pressures must be controlled to prevent formation of vertical migration pathways to the surface.

X X X X X X X
58
Table 4-4. Specific Geologic/Hydrogeologic Parameters Required for the Design of an IRZ
Geologic/hydrogeologlc parameter Design impact
Depth to impacted groundwater Injection well depth and screen locations
Width of contaminant plume Number of injection wells
Thickness of contaminant plume Number of injection points within a well cluster
Pressure injection vs. gravity feed
Groundwater velocity Injection volume and frequency, residence time for the target reactions
Dilution of end products
Hydraulic conductivity (horizontal and vertical)
Mixing zones of reagents, extent of reactive zone
Number of injection points within a well cluster
Geologic variations, layering of various soil sediments
Location of well screens at injection points
Soil porosity and grain size distribution Removal of end products resulting from immobilization reactions (such as heavy metals precipitation)
When the depth of contamination is deeper, multiple injection points may be required within a well cluster at each injection point (Figure 4-11). The reagent solution will have to be injected under pressure into each injection well. Concentration of the injected feed solution should be dilute enough to avoid downward migration due to density differences between the reagent and groundwater, unless such density driven migration is intended.
Once the injection strategy has been determined and there is an understanding of the number of injection events that are needed, a decision needs to be made whether to do manual or automatic injections. Normally that decision is made based on costs. However, other factors may need to be weighed into the consideration. In some cases, although manual injections may be the selected methodology, site conditions dictate that a central distribution system be used to deliver the reagents to individual injection wells. For example, where injection wells are in a high traffic area, such as a parking lot, a central distribution system may be desirable, even though it adds to the cost of the remedial program. The successful application of ERD is first and foremost reliant on the timely, cost effective, and consistent delivery of the electron donor to the treatment zone in quantities carefully tuned to produce the desired effect on the subsurface. Based on the application experiences with ERD technology to date, electron donor delivery becomes most complicated in low permeability geologic environments [10-5 centimeters per second (cm/sec) (3 x 10⁻² ft/day) or less] or those with low groundwater flow velocities (less than 30 feet/year). These settings can limit the area of influence of individual reagent injection points due to the absence of sufficient electron donor dispersion.

X X X X X X X
59
Figure 4-11. Multiple Cluster Injection Points when Contamination is Deep Poor donor delivery can also result in other potential complications. These complications include uneven application of electron donor/uneven contaminant treatment, lack of sufficient or timely technology demonstration during pilot phase, and/or requirement of too many injection points for a cost effective full-scale application. In low permeability (i.e. 10-5 cm/sec or less), and/or low groundwater velocity environments, electron donor can also accumulate in the vicinity of the injection point resulting in the formation of excess organic acids in the groundwater as part of the degradation process. As a result of the formation of these acids, the ambient pH in the treatment zone can be lowered and in turn conditions conducive to fermentation-based reactions are then created. This environment can create low pH conditions that are detrimental to methanogenic bacteria. Thus the formation of undesirable byproducts, including acetone and 2-butanone has been observed at sites where reagent dosing has commenced without careful monitoring of groundwater conditions near the injection wells. The occurrences of these byproducts are generally limited in extent and often sporadic in nature. It is expected that microbes in the IRZ also utilize these ketones. Almost all of these products are readily aerobically degradable as well and so are degraded on the downgradient edge of the ERD zone. Furthermore almost all have higher risk based limits, i.e. maximum contaminant levels (MCL) than the target compounds of the ERD system. However, the possibility of production of these byproducts needs to be accounted for in the project planning and operations stages. Monitoring of groundwater within the treatment zone should thus be provided in order to ensure that pH levels are not depressed (pH < 4.5 at monitoring wells) and TOC levels are not excessive (site specific, but generally above 9,000 mg/L in injection wells) The remedial plan for application of ERD should be flexible enough to allow for modification of both the delivery frequency and mass of organic carbon delivered preventing the build-up of organic carbon and creation of conditions amenable to creation of excessive amounts of these byproducts. Modifications in reagent delivery should be tied to the pH and TOC monitoring in the treatment zone.

X X X X X X X
60
A detailed review of the site-specific hydrogeology must be performed in order to determine if the electron donor can be delivered to the desired portions of the impacted area. For these reasons, in a low groundwater velocity environment, ERD may prove to be more cost effective when applied as a means of providing constituent containment strategy. Also, large doses of substrate with buffer along with more widely spaced injection intervals (many months apart) in multiple low-cost Geoprobe® installed points may be an effective strategy. Alternatively, a more dilute injection or injections with water flushes may be more effective. Conversely, in high groundwater velocity settings, the limited transverse dispersion in groundwater can limit the extent of the reactive zone created by an individual injection point. This is of particular importance in settings where drilling costs may be high, i.e. deep settings or complex geology. In such cases, modeling may be required to assess if reagent dispersal through a modified in-situ recirculation well approach can yield considerable cost savings. The feed rate, solution strength and frequency of injection all relate to the target CAH concentration and the flux of electron acceptors. For ERD the reagent feed characteristics of rate, strength and frequency need to be optimized to deliver adequate organic carbon, in the form of the selected reagent, in order to create and maintain reducing conditions in the subsurface. There are two criteria that must be met to create the reactive zone. First, enough organic carbon reagent must be added to ensure that the electron acceptors that are more thermodynamically favorable than sulfate and CO2 in the groundwater are utilized. These include O2, nitrate, manganese, and iron. This organic carbon feed rate can be derived based upon the total concentration of the various electron acceptors (primarily DO, nitrate and sulfate), and the groundwater flow rate. The product of the electron acceptor concentration and the groundwater flow rate is the electron acceptor flux. The ERD design must supply enough substrate to overcome the electron acceptor flux. Second, there must be enough substrate to drive the entire zone into highly reducing conditions. Typically the goal is to maintain between 50 and 100 times as much dissolved organic carbon in the reactive zone as there is CAH in the target area (i.e. 100 ppm of DOC for every 1 ppm of CAH). Based on experience, this translates to 1 or 2 orders of magnitude higher target DOC concentration in the injection wells. The reason higher concentrations must be fed in the injection wells relates to the fact that the organic carbon will be metabolized as it flows with groundwater. Therefore it is necessary to establish a DOC gradient between the injection points and the rest of the reactive zone. It is important to keep in mind that the CAH flux through a target zone is related to the groundwater flow velocity, the saturated thickness and the CAH concentration. Both of these criteria are simply guidelines for a preliminary calculation of the donor feed rate. Experience has proven them to be adequate means to define a reasonable organic carbon feed rate to begin the reactive zone. Field data collected AFTER the reactive zone has been started is the true measure of the adequacy of the reagent feed. Field analytical data (in particular redox potential, pH and TOC) from the injection wells and monitoring wells within the reactive zone should be used to confirm that the reactive zone has been established and is expanding with groundwater flow. Pilot and full-scale data has shown that during the initial stages of reactive zones the organic carbon load to the injection well needs to be maintained between 50 and 9000 mg/L of organic carbon. In the long term, once the reactive zone is established, these concentrations can be reduced somewhat, with a sustainable target of 50 to 200 mg/L of organic carbon within the reactive zone. The solution strength, while related to the target organic carbon feed rate, is also impacted by other factors such as the groundwater flux, the ease with which a solution can be injected, and the cost to perform the injection. In the example above involving a tight geology, the amount of reagent is reduced

X X X X X X X
61
since the groundwater flow and the contaminant flux is low, thus fewer reagents are required to deliver the required DOC load. In this situation a slow-dissolving substrate may be more applicable. Conversely, if the groundwater velocity is high, the CAH flux will be proportionally higher and the need for organic carbon higher. In this situation a readily soluble, easily injected reagent is more applicable. It is worth noting that the transverse, advective dispersion in a high groundwater velocity environment is relatively low, thus the reactive zone formed will be narrow, but long. Therefore more injection points will be required across the plume (perpendicular to groundwater flow), but the arrays of injection wells can be spaced further apart in the direction of groundwater flow. Finally, in designing an injection strategy, the advantages of frequent, low dose reagent injections, which can give the practitioner the opportunity to carefully control the dosing on the basis of feedback from field parameters, must be weighed against less frequent, higher dose buffered injections that can provide important economic advantages at many sites.
4.6 Gas Generation
The required sub-surface biochemical reactions can and often should result in the noticeable production of gases such as methane, hydrogen sulfide, and carbon dioxide, and the potential migration and accumulation of these gases in the vadose zone. High concentrations of these gases can be accumulated in the subsurface, when subsurface structures in the vicinity of the ERD project do not allow for passive diffusion of these gases. For this reason, vapor-phase concentrations of these compounds are monitored when a potential concern exists to ensure that safe conditions are maintained. If required, venting of subsurface gases, using a soil vapor extraction (SVE) system, will be used to protect against exposure or accumulation. Alternately, in some situations it can be more cost effective to reduce dosing rates, and thus accept a longer CAH treatment time to reduce gas generation. This issue is not considered to be a major impediment to IRZ implementation. The evaluation of the potential for problems with gas generation is generally done as part of the engineering design of an individual system. The depth to the zone of interest, likely pathways for vapor migration, proximity of structures and other receptors and potential volumes of gasses produced are assessed in this context. The potential volumes of gas produced can be based on the amount of CAH present for VC and based on the amount of reagent planned for methane and hydrogen sulfide (H2S). The design of the IRZ system may include a soil gas-monitoring program, directly above the treatment zone, for the measurement of these gases as a precautionary measure.

X X X X X X X
62
5.0 PILOT TESTING
A pilot or demonstration test is used to gather critical design data - well spacing and reagent feed rate, strength and frequency - as well as to demonstrate the efficacy of the technology and satisfy regulatory agency concerns regarding the technique. The pilot test should always focus on a significant area of concern within the plume and can be used as an interim remedial measure. Because of its importance, pilot testing is treated as a separate section in this protocol. Please also refer to the general design section (Section 4) for additional information.
5.1 Pilot Test Wells – Number and Location
To properly evaluate the ERD technology in the field, a network of injection wells and monitoring wells are required. The injection wells need to be located in an area of the site where sufficient impacts are present, and should be installed in a manner similar to wells that would be employed in a full-scale system. The combination of injection and monitoring wells must be sufficient to create an IRZ that is of sufficient size for a realistic field test and that includes the locations of more than one monitoring well. The monitoring wells need to be located downgradient in the direction of groundwater flow in order to compute substrate utilization, constituent degradation reaction rates, local groundwater velocities and the zone of influence of the ERD. It is also preferable to have at least one monitoring well with some historical CAH data. The monitoring wells should be located in a manner to evaluate both the performance of the degradation process and the extent, both parallel and perpendicular to the direction of groundwater flow, of the IRZ. These objectives can be achieved with different configurations of monitoring and injection wells. The field test must employ a minimum at one injection well, preferably two, that can be used to deliver reagent to the target zone. The screened interval should intercept the impacted zone, with consideration given to the lithology and groundwater flow conditions. The injection wells should be constructed as described above using appropriate drilling techniques. If there is little, or poor quality, geologic data available, consideration should be given to the need to gather supplemental geological data using split-spoon sampling techniques during installation or other appropriate means. Following installation, the well should be developed to remove fine material and ensure hydraulic communication with the surrounding aquifer. It is preferable for monitoring wells to be located at variable distances from the injection wells both parallel to the direction of groundwater flow and perpendicular to the direction of groundwater flow. The wells or transects are typically spaced at 1, 2, and 3 months groundwater flow time down gradient (based on predicted travel times derived from existing site data). This will allow the reactive zone to be defined parallel and perpendicular to groundwater flow. Once again, consideration should be given to the variability of the site geology in locating screened intervals. It may be necessary to monitor multiple intervals if the geology dictates. Heterogeneity can also lead to channeling into preferential flow pathways, thus requiring more pilot test wells to ensure adequate evaluation. When possible, existing monitoring wells may be used as injection or observation wells in order to control costs. A potentially difficult and time-consuming endeavor in the pilot phase is determining the optimal spacing of the injection wells and positioning of the monitoring wells. This can be accomplished using analytical solutions as a starting point, using computer modeling to predict injectant travel and behavior, using a tracer in the field or by utilizing monitoring wells to view the effects over time. The first two methods require some knowledge of the longitudinal (αL, length) and transverse (αT, width) dispersivity of the aquifer. The ratio of these two parameters αL/αT, will affect the shape of the plume aerially. From field studies it has been shown that αL/αT ratios are typically in the range of 6 to 20, with 6 being a relatively

X X X X X X X
63
broad shaped plume, and 20 being a thin cigar shaped plume. If the plume from a site was created by a point source, the shape of the delineated plume can be used to determine this ratio, and the transverse dispersion estimated at a smaller scale for determining of pilot well spacing. Dispersivity can also be estimated using a one dimensional dispersion equation and placing fluids through soil columns (Brigham 1974). These data can be input into a groundwater flow model to predict plume shape, given the known hydraulic characteristics of the aquifer and the estimate of dispersivity. The effects of injection can also be predicted using a numerical groundwater flow model such as MODFLOW, in conjunction with a transport model such as MT3D. By manipulating the injection/extraction rates and durations, the longitudinal and transverse movement of the injected substrates can be evaluated and used to develop a pilot program. The accuracy of this approach is consistent with the available site data (it is only as good as the parameters input into the model) and is intended to form the basis for quantitative assessments of various pilot test configurations. It is fiscally prudent to collect data at the field scale and use this information to design the larger scale program. A common approach is to inject a conservative tracer mixed with the substrate and monitor for this tracer under natural or induced gradients at downgradient wells. A tracer such as sodium bromide is typically injected at a concentration approximately 100 times its method detection limit. This will allow for a more realistic derivation of the actual dispersivities and groundwater velocities that could be expected in the field during treatment. Downgradient concentrations will also indicate whether or not there are preferential flow paths related to subtle changes related to deposition (i.e. grain size, and lithology). However, injecting an organic carbon substrate is much different from a conservative tracer since the reagent is degradable, sorbed to the geologic matrix and because the utilization of this reagent by a microbial population is transient. Monitoring for electrical conductivity and TOC at monitoring wells placed downgradient of the injection well is a good first step to determine the dispersivity (both length and width) of the reagent. A typical pilot test would consist of a single injection well with 4 or 5 monitoring wells placed at monthly average flow distances downgradient and deviated from the downgradient center line by 10 to 50% of the monthly flow velocity. Actual TOC travel will be a fraction of the average Darcian velocity, and by conducting a pilot test over 6 to 9 months, the actual field scale longitudinal and transverse dispersion can be determined based on water quality monitoring. A full-scale system can then be designed so that both the transverse and longitudinal dispersion of an individual injection well overlaps with that of other injection wells. Numerous pilot test examples are discussed in Appendix A.
5.2 Site Preparation, Equipment, and Materials
Site preparation activities for the pilot tests go beyond the installation of the injection wells and monitoring wells. For each pilot test, the reagent solution injection should require solution mixing and injection equipment. In many cases, no permanent equipment other than injection wells is required. In this case equipment needed for reagent mixing and injection is mobilized to the site. The temporary equipment required for the injections includes a solution mixing/holding tank, a portable mixer, a transfer pump, and injection piping/hose. This equipment should be sized and consistent with use at the pilot test site and can be mobilized to each site in a conventional pick-up truck or by trailer. The mixer can be simple, i.e. a paddle, or agitation of the tank through truck movement. A nontoxic, nonreactive tracer, or pH buffers may also be included in the reagent solutions. Permanent equipment at the various injections wells includes a removable well seal for the injection wellhead, removable perforated diffuser tubing (to assure even reagent distribution along the screened interval of the well), and

X X X X X X X
64
quick-disconnect fittings to allow easy attachment of the injection piping/hose to the diffuser tubes for the injection itself. In some cases more complex systems, in which frequent, automated injections are desired, require more permanent injection systems. These systems typically consist of the mixing and delivery equipment outlined above being deployed in an enclosure, shed, or building, near the injection wells. The reagent is stored within the shed, and periodically a batch of solution is mixed and injected into the wells via piping to the wells. Note that molasses stores better in concentrated form. Mixing and injection operations may be controlled by a simple, programmable logic control system. Using either the temporary/mobile equipment set-up or the more permanent set-up, utility requirements should be minimal. A readily available source of potable water, preferably with a large flow rate capacity and preferably located within close proximity to the test area is needed. An electric power source for the permanent injection system would also be required. ERD reagents are typically commercially off-the-shelf (COTS) components. For example, molasses is readily available from animal feed stores and food wholesalers and is routinely delivered in bulk quantities from suppliers. Powdered whey and corn syrup can also be obtained from food wholesalers. Fresh whey can be obtained as a byproduct from cheese manufacturers. Lactate solution can be obtained from food wholesalers and specialized bioremediation vendors.
5.3 Reagent Injection
The composition of the reagent feed solution that will be used during field testing, the solution injection rate, and the injection procedures are discussed in this section. (Also see Section 4.5). The composition and volume of the reagent feed solution may need to be varied during the field test, based on field measurements from the wells and the analytical results gathered during the groundwater monitoring program. The amount of reagent injected in the injection well(s) during the field testing can also be varied by increasing or decreasing the amount of solution injected, by changing the concentration injected, or by changing the frequency of injections. The frequency of injections will vary with the geologic, biogeochemical and hydrogeologic conditions of each site. As a result the frequency of injections can vary from once a day to once every six months. However, initially weekly injections are typical with less frequent injections after the IRZ has formed and the zone becomes reducing. An initial loading rate of approximately 40 to 80 lbs of carbohydrate per injection well per week is generally proposed for the initial loading, but these rates will undoubtedly be adjusted based on the results of field monitoring. An appropriate reagent feed rate must be established and maintained in order to ensure that adequate electron donor solution is added and that the available electron acceptors are fully metabolized in the reactive zone in order to maintain a strongly reducing environment. At the same time, the feed rate needs to be controlled so as to minimize cost and avoid low pH conditions in which fermentation processes dominate. The proposed solution feed rate can be calculated based on achieving a sufficient DOC concentration in the groundwater that passes through the injection well area. For the field test, the volume of solution and solution strength should be calculated to achieve the target levels discussed below using a reasonable number of injection events – in most cases pilot tests are conducted using a batch type injection program.

X X X X X X X
65
The target concentrations or ranges for various field parameters that will be used to measure process and performance are as follows:
• pH - > 4.0 s.u. in the injection wells; > 5.0 s.u. in the monitoring wells
• DO - < 1.0 mg/L in both monitoring and injection wells
• ORP - > -400 mv and < -250 mv in the injection wells; < -100 mv in the monitoring wells. Note however that these ORP values should not be taken as absolutes since ORP is pH dependent. For sites where reducing environments are identified in the groundwater prior to initiation of reagent injections, a target goal of lowering the ORP by 200 mv in the injection wells and 100 mv in the monitoring wells should be employed.
• TOC - >500 mg/L and < 9,000 mg/L in the injection wells and > 50 mg/L in the monitoring wells
• Conductance – order of magnitude increase in the injection wells; 20 to 50 % increase in monitoring wells
During approximately the first month or two of system operation a special problem may exist in that the first downgradient monitoring well may not yet show the effects of the introduced substrate. During such circumstances it is especially important to purge the injection well adequately so that the groundwater used for process monitoring represents an area several feet away from the injection well. If such a careful purge is performed one week after injection and the pH measured is < 4 or the TOC is >5,000 mg/l then the substrate dosing should be reduced.
5.4 Duration of Pilot Study
Typical pilot studies last between 6 and 12 months. The rate of groundwater flow, biogeochemical considerations, and the proposed observation well locations will determine the site-specific duration of the test – the closer the observation wells are to the injection well(s) and the faster groundwater moves, the sooner results can be expected and the shorter the pilot test needs to be. Once substrate has been delivered to an area within the aquifer, a period of several additional months is often required for the successive consumption of various electron acceptors, which in turn requires successive changes in the microbial community. The “testing” is complete when the following criteria have been achieved:
• Redox conditions downgradient of the injection well(s) are reduced (ORP less than –100 mV)
– Ratio of target CAH to daughter products has declined – i.e. the source material is degrading
• Amount of end-product (i.e. ethene) has increased These results may actually be achieved within one or two months of implementation of the pilot test program; however longer duration is generally needed to collect design data on the zone of influence of the injection well(s). Additional information may be necessary to satisfy regulators or clients and in order to optimize the full-scale design. For this reason the pilot is often extended beyond a simple demonstration of success using these criteria. Many times the “testing” ends, but the injections continue. Once the reactive zone is established within the plume, maintenance dosages of the reagent will allow the zone to continue to serve as an interim remedial measure, until such time as the system is expanded or the clean-up goals are achieved.

X X X X X X X
66
5.5 Field Pilot Test Process and Performance Monitoring
The most critical portion of the ERD pilot test is process and performance monitoring. In this portion of the test, field monitoring of selected indicator parameters and groundwater sampling for field and laboratory analyses are conducted. The data collected from monitoring activities are used to adjust reagent feed rates and, if necessary, the frequency of sample collection. A detailed discussion of process and performance monitoring and the relevant sampling and analysis methods has been presented in Section 3.
5.6 Pilot Test Result Interpretation
IRZ data interpretation has been discussed earlier in Sections 2.3 and 3.5.2. This section will extend those discussions by covering some topics specific to pilot tests. Regulators or other stakeholders often seek assurance that the technology is effective. One of the criteria to be evaluated is that observed apparent treatment results are real and not due to dilution, dispersion or natural attenuation. Matched, side-by-side, untreated controls rarely exist in the real world. Essentially two types of “controls” are feasible in pilot test design, upgradient wells and wells with good historical data trends in the treatment zone. Upgradient wells can help control for the effect of natural attenuation. Similarly sharp changes in the historical trends of contaminant concentration at the site after the implementation of IRZ can help rule out natural attenuation as an explanation for the observed treatment. Clear trends in the concentrations of products such as cis-DCE and ethene or ethane can also be used to determine the effectiveness of treatment. The water level should be routinely recorded during all sampling events and volume injected during all injection events. The potential for significant contaminant spreading through injection displacement can be evaluated first with relatively simple hydrogeologic computations. Then, if that potential exists, either the injection can be modified or a proposal submitted to deal more extensively with this issue through numerical modeling or additional field measurements. At many sites, calculations will indicate that the expected volume of solution added over the test period is equal to less than 10% of the volume of groundwater expected to move through the subject zone. In addition at many sites the pilot test treatment zone is well within the existing plume. Thus there is not likely to be a detectable spreading effect at these sites. Including a non-reactive bromide tracer in the pilot study enhances the ability to track the dispersion of the injected reagents. The bromide tracer also allows a simple computation of the magnitude of the potential observed “dilution effect” by comparing the concentration of bromide in the monitoring wells to the injected concentration (assuming a minimal initial groundwater concentration of bromide and true conservative behavior). The observed concentrations of CAHs can then be adjusted for the dilution effect. We should note however that these computations often underpredict treatment, because they assume in the extreme case that a groundwater composed of injected fluid only would have a zero concentration of CAH, while it would actually have a substantial concentration due to desorption effects in many situations. In cases where several historical data points of concentration of contaminants are available for a given well in the treatment zone a one-sided t-test can be used to compare concentration before and after treatment. This may be done either by comparing a set of values before treatment to a set of values collected after a given period of treatment or by using t-test to determine if the trend during and after treatment is significantly decreasing in concentration. In cases where no historical data is available a t-

X X X X X X X
67
test can be applied to the trend based on the single data point collected in each well during the biogeochemical characterization phase and several samples collected during and after treatment. Also in such a case one can calculate the difference in concentration between each downgradient well and an appropriate upgradient well, conduct a regression analysis on this difference with time and use a nonparametric procedure (Sen’s nonparametric estimator of slope [Gilbert 1987]) to estimate the slope when the Mann-Kendall test indicates an increasing or decreasing trend in data. The results from a pilot test can also be used to:
• Demonstrate the efficacy of the technology at a particular site, by providing empirical, site-specific, field data for the technology
• Determine the reagent feed rate, the frequency of injections, and the solution strength required
• Define the well spacing perpendicular and along the groundwater flow direction based on the extent to which the reactive zone was established during the test
Once the pilot test program has defined the critical design criteria, full-scale design can be completed and full-scale system authorizations obtained. Regulatory approval will likely be required along with well construction permits, injection permits and possibly construction permits
5.7 Scale Up Issues
Following demonstration of this technology via a pilot study, site-specific scale-up to a larger or full-scale system is, typically, fairly simple. The main issue facing scale-up will be the addition of more injection wells to create a larger IRZ and perhaps multiple IRZs. As shown in the case studies, Appendix A, the authors and others already have extensive full-scale commercial experience in applying this technology. With this in mind, if pilot testing indicates that the effective area of influence of a given injection well does not propagate far from the injection well itself, many additional injection wells may be required for the ultimate system if the system is being used to treat the entire plume rather than to form a barrier or treat a source area. This could be a scale-up issue of concern since if a large number of wells is required, or if drilling costs are excessive due to the depth or to methodology required to install the well, the overall cost to move into a full-scale system will become prohibitive. However this is generally understood prior to the pilot study and the preferred implementation strategy becomes use of one or more arrays of injection wells to “segment” the plume versus trying to remediate the entire plume all at once. The only other scale-up issue regarding the technology is that of reagent injection methodology. In many cases even with a larger number of injection wells, the frequency and volume of the injection is such that it is still advantageous to use a manual batch injection mode. However, in some cases scale-up to a full-scale system will require the implementation of an automatic reagent feed system. This type of system would be equipped with a source of bulk carbohydrate (such as molasses in 250-gallon “totes”), a source of potable water, metering and mixing equipment and a network of injection piping that would allow for the metered injection of the solution to each well automatically. Generally these systems are easy to construct, operate and maintain given they are made up of commonly used equipment and technology (i.e. tanks, valves, piping, wells and automation controls). Given the in-situ nature of the technology, possible interference during scale-up is expected to be minimal. The main interference concern would be if a portion of the contaminant plume needing to be treated were located beneath a building or other permanent structure. Hence, installation of reagent

X X X X X X X
68
injection wells and performing injections (either batch or automatic) could be an issue. Gas generation under buildings or parking lots could also require installation of passive or active venting systems (see Section 4.6). However, given the nature of the technology these potential interference issues could be overcome through strategic design of the full-scale remedy (i.e. creating IRZs before and/or after the groundwater move past the interference). Alternately, horizontal wells could be used for installation at some additional cost.

X X X X X X X
69
6.0 FULL SCALE SYSTEM OPERATION AND MAINTENANCE
6.1 General
Most considerations applicable to full-scale system design, operation, and maintenance have been covered in previous sections since full-scale systems and pilot systems are very similar for this technology. Of special importance for full-scale and continued operation is the fact that the technology produces no wastes or by-products other than those associated with well installation and sampling.
6.2 System Modifications to Control pH Reduction
The pH of the groundwater system generally decreases during the injection of degradable organic substrates to enhance in-situ bioremediation. The magnitude of the pH decrease depends on the dose of substrate and the natural buffering capacity of the system (both the groundwater and the aquifer solids). As discussed previously, pH below 4.0 s.u. in injection wells and below 5.0 in monitoring wells should generally be avoided. The two sites involved in our current Air Force Center for Environmental Excellence/Environmental Security Technology Certification Program (AFCEE/ESTCP)demonstration projects (Lutes 2002a; Lutes 2002b) exhibit relatively low buffering capacity. In these cases, pH has been controlled by careful carbon dose control and injection of a clean water push following reagent injection to disperse the dose away from the immediate vicinity of the well. Buffer can also be introduced in the injection solution to control pH declines (i.e. carbonates, bicarbonates or phosphates) and is often the preferable way to control pH declines.
6.3 System Modifications To Deal With Specific Site Conditions
Table 6-1 lists various system modifications that can be made in full-scale design and operation to deal with various site-specific situations. Table 6-1. System Modifications to Deal with Special Site Conditions Condition Modification Low pH or low buffering capacity Use of buffer
Use of water push Use of slower-release substrate.
Low permeability/velocity Closely spaced direct push injections made less frequently
Salinity Low sulfate donor (e.g., corn syrup) Larger TOC dose
Buildings above reactive zone Gas monitoring systems Gas control systems

X X X X X X X
70
In some limited cases, bioaugmentation (with commercial pure cultures or organisms from another site) can be implemented if it has been ascertained that indigenous bacterial communities are ill suited for ERD or if it is decided that the added cost of bioaugmentation is justifiable by an unusual need for very fast treatment such as can be motivated by a client’s land use requirements. For example, property transfer/redevelopment projects often provide strong economic incentives for rapid treatment. In these cases, bioaugmentation might be considered. Bioaugmentation has been attempted in the in-situ bioremediation field for many years with a mixed record of success (Dybas 2002; Ellis 2000). Although it has been successfully applied in limited field trials for CAHs recently the economics of such systems are a concern. Thus prior to selecting bioaugmentation, the ERD implementer and the site owner should review the challenges and high costs associated with it. The primary technical challenge during any bioaugmentation effort is transport of the bacteria away from the addition point to effect a large enough area of the contaminant plume to be significant. This factor limits the type of geological conditions where bioaugmentation is achievable. Bioaugmentation efforts can be greatly enhanced with the addition of a recirculation loop to the remedial system. Though such recirculation loops can make bioaugmentation feasible, they come with associated costs and are thus not practical at all contaminated sites. Most of the field scale bioaugmentation systems that have been reported in the literature have involved pumping to the surface and reinjecting all or a very large percentage of the total volume of groundwater treated (Dybas 2002; Ellis 2000) which limits the potential cost advantages of such a system when compared to conventional pump and treat. When making an addition of non-native bacteria to the subsurface, the nutritional requirements of the non-native bacteria must be well understood and provided for in the receiving aquifer. Provision of adequate nutrition is essential to enable the non-native bacteria to successfully compete with the existing microbial community. If competition is unsuccessful, the non-native bacteria will “go extinct”. Bioaugmentation also requires regulatory approval, and the introduction of microorganisms not native to the site generally undergoes significant regulatory and stakeholder scrutiny.
6.4 Sustainability & Reliability
The implementation of an ERD project is a dynamic process which requires a detailed understanding of the site geochemistry and hydrogeologic conditions before implementation and as it changes as a result of pilot or full-scale implementation. The ERD can be successful when there is considerable process monitoring during the initial deployment of the pilot test that allows for adjustment of reagent deliverability (strength and frequency). Where ERD has failed, or has required longer than expected treatment periods, it is usually the result of improper monitoring (the wrong parameters or the wrong frequency) or data evaluation in the early stages of the pilot test. TOC loading and induced gradients must be reviewed early in the pilot process to allow delivery rates to be increased, for greater spreading and greater TOC levels within the treatment area, or reduced (or a buffering agent added), if pH levels drop too quickly. Similarly, the effects of reagent injections must be reviewed in the context of how the addition of aqueous solutions affect hydraulic gradients (i.e. mounding) and flow directions. Groundwater flow directions and gradients should be viewed both in a macro and micro scale before and during the demonstrations. For either the manual solution injections or the more permanent system approach, the overall treatment system is expected to be reliable and easy to reproduce from one injection event to the next. The types of equipment being employed (transfer pumps, tanks, mixers, and controls) are commonly used for similar applications and can be expected to perform as designed and intended for the duration of the
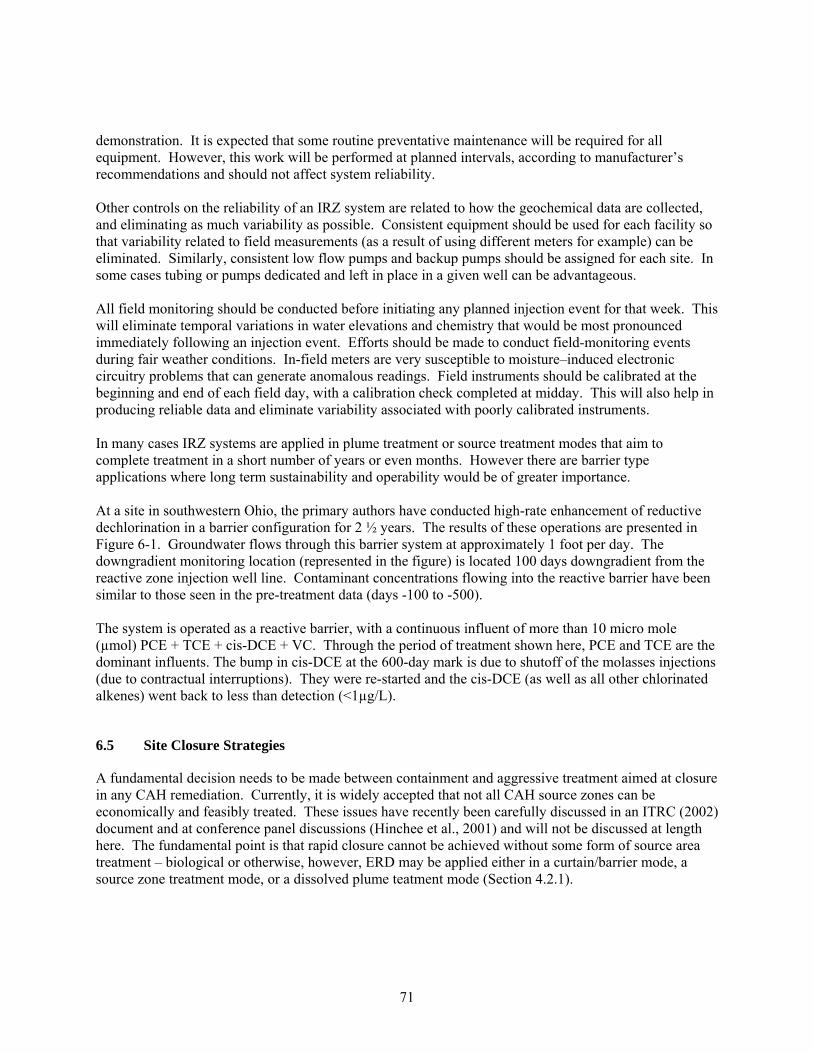
X X X X X X X
71
demonstration. It is expected that some routine preventative maintenance will be required for all equipment. However, this work will be performed at planned intervals, according to manufacturer’s recommendations and should not affect system reliability. Other controls on the reliability of an IRZ system are related to how the geochemical data are collected, and eliminating as much variability as possible. Consistent equipment should be used for each facility so that variability related to field measurements (as a result of using different meters for example) can be eliminated. Similarly, consistent low flow pumps and backup pumps should be assigned for each site. In some cases tubing or pumps dedicated and left in place in a given well can be advantageous. All field monitoring should be conducted before initiating any planned injection event for that week. This will eliminate temporal variations in water elevations and chemistry that would be most pronounced immediately following an injection event. Efforts should be made to conduct field-monitoring events during fair weather conditions. In-field meters are very susceptible to moisture–induced electronic circuitry problems that can generate anomalous readings. Field instruments should be calibrated at the beginning and end of each field day, with a calibration check completed at midday. This will also help in producing reliable data and eliminate variability associated with poorly calibrated instruments. In many cases IRZ systems are applied in plume treatment or source treatment modes that aim to complete treatment in a short number of years or even months. However there are barrier type applications where long term sustainability and operability would be of greater importance. At a site in southwestern Ohio, the primary authors have conducted high-rate enhancement of reductive dechlorination in a barrier configuration for 2 ½ years. The results of these operations are presented in Figure 6-1. Groundwater flows through this barrier system at approximately 1 foot per day. The downgradient monitoring location (represented in the figure) is located 100 days downgradient from the reactive zone injection well line. Contaminant concentrations flowing into the reactive barrier have been similar to those seen in the pre-treatment data (days -100 to -500). The system is operated as a reactive barrier, with a continuous influent of more than 10 micro mole (µmol) PCE + TCE + cis-DCE + VC. Through the period of treatment shown here, PCE and TCE are the dominant influents. The bump in cis-DCE at the 600-day mark is due to shutoff of the molasses injections (due to contractual interruptions). They were re-started and the cis-DCE (as well as all other chlorinated alkenes) went back to less than detection (<1µg/L).
6.5 Site Closure Strategies
A fundamental decision needs to be made between containment and aggressive treatment aimed at closure in any CAH remediation. Currently, it is widely accepted that not all CAH source zones can be economically and feasibly treated. These issues have recently been carefully discussed in an ITRC (2002) document and at conference panel discussions (Hinchee et al., 2001) and will not be discussed at length here. The fundamental point is that rapid closure cannot be achieved without some form of source area treatment – biological or otherwise, however, ERD may be applied either in a curtain/barrier mode, a source zone treatment mode, or a dissolved plume teatment mode (Section 4.2.1).

X X X X X X X
72
Elapsed Time (days)-600 -400 -200 0 200 400 600 800 1000
Alk
ene
Con
cent
ratio
ns (u
mol
/L)
0
10
20
30
40
50
60
70
Dis
solv
ed O
rgan
ic C
arbo
n (m
g/L)
0
200
400
600
800
Met
hane
(um
ol/L
)
0
200
400
600
800
1000
1200
1400PCE
TCEcis-1,2-DCEVinyl chlorideEtheneDissolved Organic CarbonMethane (umol/L)
Carbon Injection Periods
Figure 6-1. Long Term Operation of ERD at a Site in Southwest Ohio The area and depth of the CAH plume, the hydraulic characteristics of the aquifer and the costs associated with installing and maintaining different injection well layouts will ultimately dictate the potential remedial scenarios and cleanup time frames for a given site. For smaller sites (less than an acre), pilot testing can be used to define achievable field scale degradation rates and radius of influence from injection points. A grid of injection wells can then be set across the entire footprint of the plume and periodic injections completed over 2 to 4 years. For relatively thin, lower permeability or low velocity settings this may only require 2 or 3 injection events during this time period. At sites where larger plumes are present (>2 acres), or the depth of the plume makes installing injection wells difficult and expensive, multiple treatment lines can be established located perpendicular to flow directions. The spacing of the lines can be determined from pilot data, or to be conservative, separated by 3 to 6 months travel time. At some larger sites, treatment lines have been spaced at 1.5-year travel time intervals to be cost effective. In summary, capital cost can often be traded off against time. The better the injection well coverage, the quicker closure can be achieved.

X X X X X X X
73
At any site there will be a ramp up period where TOC needs to be delivered and mixed into the aquifer to create a reducing environment. The systems discussed in this protocol are generally passive systems that rely on aquifer advection, dispersion and diffusion for delivery. In deeper, or thicker settings, recirculation can also be used to achieve mixing more rapidly. These systems also require more maintenance and tend to foul, due to the anaerobic/aerobic interfaces in the system that causes rapid accumulation of floc. It generally takes 1 to 3 months to create a reducing environment across the site. Desorption of source material from the aquifer sediments is observed after TOC has been delivered and reducing environments created. The desorbed mass can then be treated within the reactive zone. Lag times on treatment of the intermediates are sometimes observed after the TOC delivery and desorption periods. These lag times range from a month to 14 months. Once the lag phase is complete, degradation rates increase and periodic maintenance dosing of the system is required to maintain reducing conditions and also provide an organic substrate for the ever-growing microbial population. As the system becomes dominated by lesser-chlorinated daughter products, the TOC feed rates can be gradually reduced to allow an aerobic perimeter to encroach on the treatment area. The lesser-chlorinated daughter products, especially VC are much more rapidly degraded under aerobic environments and this technique can shorten the overall treatment period. When conservative placement of injection points and dosing is utilized, it has been our experience that levels of constituents of concern near the detection limits can be realized. Given the desorption that occurs within the treatment area, the effects of rebound are minimal as compared to other technologies that address only the dissolved phase. Some other strategies to utilize in an ongoing IRZ to speed up treatment and achieve closure are as follows:
• Monitored Natural Attenuation (MNA): MNA can sometimes be employed as a polishing technique after ERD is used to address the more concentrated part of the plume.
• Starvation/Dormancy: By cutting off the source of organic carbon for microbes, they will significantly shrink in size and become dormant. After shutting off the TOC supply to an aquifer and allowing the redox conditions to regress, a high velocity injection event of clean water or reagent can be used to spread the dormant microbes further from the injection wells, and deeper into the pores of the aquifer sediments. When regular reagent injections commence, the active microbial zone will be larger and more effective. Dormancy periods may also force the microbes to adapt and diversify more quickly, resulting in shorter lag times.
• Passive Mixing/On-Site BioAugmentation. At sites where older plumes and different sources co-mingle, there is often evidence of more diverse microbial populations and more complete degradation occurring in one area of the site than another. To shorten lag times in areas of the site where less degradation is being observed, purge water from wells located in the biologically active areas of the site can be used in one-time mixes with the reagent for delivery to the slower degradation areas of the site. This is essentially batch recirculation, without the piping, vessels and typically excessive O&M requirements. Based on other research efforts, inclusion of microorganisms from a favorable portion of the site in an injection event at a problematic portion of the site can only be expected to result in limited lateral bacterial transport on the order of several meters (Dybas et.al., 2002). However, it is expected that indigenous microorganisms would be better adapted to site conditions and thus more easily sustained during remediation than a non-native, bioaugmented species.
• Maximizing Mass Removal of Ongoing Treatment Techniques. Many sites have inefficient long term pumping systems in place to contain the plume, remove mass or comply with an administrative order.

X X X X X X X
74
These systems are notoriously diffusion limited and relatively slow to remove mass, resulting in asymptotic recovery over time. An IRZ approach can be used in conjunction with ongoing pumping by taking advantage of the desorption created within the IRZ to recover much greater amounts of mass. This allows for maintaining containment of the plume, while increasing mass removal and phasing out the extraction wells as a much lower asymptote is realized on their recovery.
In some limited cases, bioaugmentation can be implemented if it has been ascertained that indigenous bacterial communities are ill suited for ERD or if it is decided that the added cost of bioaugmentation is justifiable by an unusual need for very fast treatment such as can be motivated by a client’s land use requirements. For example, property transfer/redevelopment projects often provide strong economic incentives for rapid treatment. In these cases, bioaugmentation might be considered. Prior to selecting bioaugmentation, the ERD implementer and the site owner should review the challenges and costs associated with it. A brief review of the associated challenges follows. Bioaugmentation requires regulatory approval, and the introduction of microorganisms not native to the site generally undergoes significant regulatory and stakeholder scrutiny. Once permitting is accomplished the two primary technical areas of concern for bioaugmentation are bacterial competition and bacterial transport. When making an addition of non-native bacteria to the subsurface, the nutritional requirements of the non-native bacteria must be well understood and provided for in the receiving aquifer. Provision of adequate nutrition is essential to enable the non-native bacteria to successfully compete with the existing microbial community. If competition is unsuccessful, the non-native bacteria will “go extinct.” The second technical challenge during any bioaugmentation effort is transport of the bacteria away from the addition point to effect a large enough area of the contaminant plume to be significant during remedial efforts. This factor limits the type of geological conditions where bioaugmentation is achievable. B Bioaugmentation efforts can be greatly enhanced with the addition of a recirculation loop to the remedial system. Though such recirculation loops can make bioaugmentation feasible, they come with associated costs and are thus not practical at all contaminated sites. Most of the field scale bioaugmentation systems that have been reported in the literature have involved pumping to the surface and reinjecting all or a very large percentage of the total volume of groundwater treated (Dybas 2002; Ellis 2000) which limits the potential cost advantages of such a system when compared to conventional pump and treat.

X X X X X X X
75
7.0 REGULATORY ISSUES
Potential regulations that affect IRZ projects are similar to those applicable to other in-situ remediation technologies. While this text does not attempt to cover the range of regulatory environments and issues that exist, it is important to consider the regulatory arena in which the remedial work is being conducted and during the reagent selection process. Characteristics of the carbohydrate reagents recommended include:
• Food-grade
• No chemical residuals
• Historic applications approved by other state or federal agencies All of the above contribute to the rapid acceptance of this technology. The amount of interaction with regulatory agencies required to execute the ERD projects is sometimes substantially greater than with traditional technologies, until a particular regulatory agency becomes familiar and comfortable with these technologies. However, the long record of successful application discussed in Appendix A attests that the technology has been successfully permitted in numerous jurisdictions and that the regulatory personnel’s experience base is growing. Many states regulate the injection of materials into the subsurface and may require a Safe Drinking Water Act-mandated Underground Injection Control (UIC) permit prior to implementing the demonstration. The UIC permit includes information regarding the chemical nature of the substrate solution, and addresses potential concerns with water quality resulting from the injection process. UIC permitting for injection of carbohydrates is generally waived or is implemented with minimal paperwork (for example, permitting by rule). This issue is not considered to be a major impediment to ERD implementation. Previous experience with state regulatory agencies where ERD technology has been performed indicates that an initial meeting to establish the proposed course of action for the project is the most effective process. The concerns of the UIC permit staff at state regulatory agencies must be addressed at the onset of the project to avoid delays. Usually, the information required to satisfy the requirements of the UIC permits is readily available, and should not represent a major regulatory hurdle. Continued close communications with the regulatory agencies during the planning and execution of ERD will greatly increase the potential for a successful demonstration. A teaming relationship with the local environmental regulatory agencies is important to technology success. Public participation during the technology process should be addressed on a site-specific basis. Inquiries on behalf of public entities should be addressed, in a timely manner, by the project management members. The ERD technology is a relatively straightforward and non-threatening process, and thus it is anticipated that any public communications will be favorably received. The production of intermediate products is a potential concern to regulatory agencies. The ERD process converts more highly chlorinated CAHs to less chlorinated and eventually non-chlorinated end products. The cascading reactions can result in the production of vinyl chloride. This product is more carcinogenic than the parent compound. Reductive dechlorination of vinyl chloride should also occur with the ERD process, and it is also quickly biodegraded by aerobic microorganisms. For these reasons, the production

X X X X X X X
76
of vinyl chloride or other intermediate products is considered a temporary situation and does not represent a major impediment to the technology but should be monitored during application of the technology. Another regulatory issue can be the production of gases such as methane, hydrogen sulfide, and carbon dioxide, and the migration and potential accumulation of these gases in the vadose zone. Concentrations of these gases can accumulate in the subsurface, when structures in the vicinity do not allow for passive diffusion of these gases. For this reason, vapor-phase concentrations of these compounds are monitored when a potential concern exists to ensure that safe conditions are maintained. If required, venting of subsurface gases or a modified donor injection routine will be used to protect against exposure or accumulation (see Section 4.6). This issue is not considered to be a major impediment to technology implementation, but must be considered. There are no unusual issues involving the transport, storage or disposal of wastes and treatment residuals. The standard issues of drill cuttings produced during injection well installation and purge water generated during sampling apply. Secondary water quality impacts from ERD can occur due to the desorption and mobilization of contaminants and/or their by-products (see further discussion in Sections 4.1.1.4 and 4.3.1). Secondary water quality impacts can also occur from mobilization of metals naturally occurring in the solid phase into the groundwater. Other parameters of interest with regard to secondary water quality impacts are COD, BOD, TDS, taste, odor, and sulfides. In general, enhanced anaerobic in-situ bioremediation processes will reduce the mobility of many metals (indeed it has been successfully used for the treatment of many) but it will solubilize some other naturally occurring metals in the reactive zone (e.g., iron, manganese, and arsenic). However even in solubilized form under anaerobic conditions metals such as arsenic are substantially retarded by adsorption to the aquifer matrix. Furthermore, it is generally believed that they will be reprecipitated/immobilized downgradient of the reactive zone when the conditions return to their preexisting state (which, for the purposes of this discussion, is assumed to be aerobic). Similarly, reprecipitation/immobilization will occur within the IRZ area some time after system shutdown. These reducing conditions are by no means unique to IRZ systems – they occur, for example, at sites of TPH releases and landfills as well. COD, BOD, TDS, taste, and odor are necessarily elevated in the reactive zone because the substrate contributes to these parameters. However as the substrate is consumed biologically downgradient these parameters typically return to near background values. Sulfides are typically produced under anaerobic conditions, but are again not typically found in aerobic zones further downgradient. Thus the potential for secondary water quality impacts needs to be fully identified and addressed during design and in consultation with all applicable regulatory agencies and the public.

X X X X X X X
77
8.0 REFERENCES
Air Force Research Laboratory (AFRL). (2001). Reductive anaerobic biological in-situ treatment technology (RABITT) treatability test interim report. ESTCP Interim Report.
Alleman, B.C., et al. (1999). Technical Session No. 1B. Partners in Environmental Technology, Technical Symposium & Workshop, November/December 1999, Arlington, VA.
Allen, H.E., Perdue, E.M., and Brown, D.S. (1993). Metals in groundwater. Chelsea, MI: Lewis Publishers.
APHA, (1998). Standard Methods for the Examination of Water and Wastewater (20th ed.). American Public Health Organization/American Water Works Organization/Water Environment Federation. Baltimore, MD: United Book Press. ISBN 0-87553-235-7.
ARCADIS. (2000). Technology demonstration plan Vandenberg AFB: Technology demonstration in-situ substrate addition to create reactive zones for treatment of chlorinated aliphatic hydrocarbons (Rep. dated April 11, 2000). Research Triangle Park, NC.
Ballapragada, B.S., et al. (1997). Effect of hydrogen on reductive dechlorination of chlorinated ethenes. Environ. Sci. Technol., 31, 1728-1734.
Becvar, E., et al. (1997, August/September). The Military Engineer, 586, 60-61.
Bjerg, P.L., Jakobsen, R., Bay, H., Rasmussen, M., Albrechtsen, H., and Christensen, T.H. (1997). Effects of sampling well construction on H2 measurements made for characterization of redox conditions in a contaminated aquifer. Environ. Sci. Tech., 31(10).
Boettcher, G., and Nyer, E.K. (2000). Chapter 7: In situ bioremediation, in In situ treatment technology (2nd ed.). Boca Raton, FL: Lewis Publishers.
Borden, R.C. (2002). Anaerobic treatment using edible oil. Presented at Air Force Center for Environmental Excellence CleanUp Technology Transfer Workshop, March 4-7, 2002. San Antonio, TX.
Bouwer, E.J., and McCarty, P.L.M. (1983). Transformations of 1 and 2-carbon halogenated aliphatic organic compounds under methanogenic conditions. Appl. Environ. Microbiol., 45, 1286-1294.
Bouwer, E.J., Rittmann, B.E., and McCarty, P.L. (1987). Anaerobic degradation of halogenated 1-, and 2- carbon organic compounds. Environ. Sci. Technol., 15, 596-599.
Bradley, P.M., and Chappelle, F.H. (1996). Anaerobic mineralization of vinyl chloride in Fe (III) reducing aquifer sediments. Environ. Sci. Technol., 30, 2084-2086.
Brigham, W.E. (1974). Mixing equations in short laboratory columns. Society of Petroleum Engineers Journal, 14, 91-99.
Brock, T., and Madigan, M. (1988). Biology of Microorganisms (5th ed.). Prentice Hall. ISBN 013076829-4.
Burdick, J., and Jacobs, D. (1998). Field scale applications to demonstrate enhanced transformation of chlorinated aliphatic hydrocarbons. Proceedings of National Groundwater Association Northeast Regional Conference, October 1998, Burlington, VT.
Buscheck, and Alcantar. (1995). Regression techniques and analytical solutions to demonstrate intrinsic bioremediation. intrinsic bioremediation. Battelle Press.

X X X X X X X
78
Bushmann, J., Angst, W., and Schwarzenbach, R.P. (1999). Iron porphyrin and cysteine mediated reduction of ten polyhalogenated methanes in homogeneous aqueous solution: product analyses and mechanistic considerations. Environ. Sci. Technol., 33(7), 1015-1020.
Butler, E.C., and Hayes, K.F. (1999). Kinetics of the transformation of trichloroethylene and tetrachloroethylene by iron sulfide. Environ. Sci. Technol., 33(12), 2021-2027.
Carr, C.S., and Hughes, J.B. (1998). Enrichment of high-rate PCE dechlorination and comparative study of lactate, methanol, and hydrogen as electron donors to sustain activity. Environ. Sci. Technol., 32, 1817-1824.
Chapelle, F.H., Vroblesky, D.A., Woodward, J.C., and Lovley, D.R. (1997). Practical considerations for measuring hydrogen concentrations in groundwater, Environ. Sci Technol., 31(10).
Christiansen, N., et al. (1997). Transformation of tetrachloroethene in an upflow anaerobic sludge blanket reactor. Appl. Microbiol. Biotechnol., 47, 91-94.
Cirpka, O.A., Windfuhr, C., Bisch, G., et al. (1999, September). Microbial reductive dechlorination in large scale sandbox model. J. Environ. Eng., 861–870.
Cope, N., and Hughes, J.B. (2001). Biologically-enhanced removal of PCE from NAPL source zones. Environ. Sci. Technol., 35(10), 2014-2021.
DeBruin, W.P., et al. (1992). Complete biological reductive transformation of tetrachloroethene to ethane. J. Appl. Environ. Microbiol., 58, 1996-2000.
Devlin, J.F, and Muller, D. (1999). Field and laboratory studies of carbon tetrachloride transformation in a sandy aquifer under sulfate reducing conditions. Environ. Sci. Technol., 33, 1021-1027.
DiStefano, T.D. (2000). PCE dechlorination with complex electron donors. Proceedings of 2nd International Conference on Remediation of Chlorinated Recalcitrant Compounds, May 22-25, Wickramanayake, G.B., et al. (Eds.). Columbus, OH: Battelle Press.
DiStefano, T.D., et al. (1991). Reductive dechlorination of high concentrations of tetrachloroethene to ethene by an anaerobic enrichment culture in the absence of methanogenesis. J. Appl. Environ. Microbiol., 57, 2287-2292.
DiStefano, T.D., Gossett, J.M., and Zinder, S.H. (1992). Hydrogen as an electron donor for dechlorination of tetrachloroethene by an anaerobic mixed culture. J. Appl. Environ. Microbiol., 58, 3622-3629.
Drzyzga, O., and Gottschal, J.C. (2002). Tetrachloroethene dehalorespiration and growth of desulfitobacterium frappieri TCE1 in strict dependence on the activity of Desulfovibrio fructosivorans. J. Appl. Environ. Microbiol. February 2002, 642-649.
Dybas, M. J., et al. (2002). Development, operation and long-term performance of a full-scale biocurtain utilizing bioaugmentation. Environ. Sci. Technol., 36, 3635-3644.
Dybas, M. J., Hyndman, D.W., Heine, R., Tiedje, J., Linning, K., Wiggert, D., Voice, T., Zhao, X., Dybas, L., and Criddle, C.S. (2002). Development, operation, and long-term performance of a full-scale biocurtain utilizing bioaugmentation. Environ. Sci. Technol., 36(16), 3635-3644.
Ellis, D.E., et al. (2000). Bioaugmentation for accelerated in situ anaerobic bioremediation. Environ. Sci. Technol., 34(11), 2254-2260.
Fathepure, B.Z., and Vogel, T.M. (1991). Complete degradation of polychlorinated hydrocarbons by a two stage biofilm reactor. J. Appl. Environ. Microbiol., 57, 3418-3422.

X X X X X X X
79
Fennell, D., Carroll, A., Gossett, J., and Zinder, S. (2001). assessment of indigenous reductive dechlorination potential at a TCE-contaminated site using microcosms, polymerase chain reaction analysis, and site data. Enivron. Sci. Technol., 35(9), 1830-1839.
Fennell, D.E., et al. (1997). Comparison of butyric acid, ethanol, lactic acid and propionic acid as hydrogen donors for the reductive dechlorination of tetrachloroethene. Environ. Sci. Technol., 31, 918-926.
Findlay, M., and Fogel, S. (2000, February/March). Microcosm test for natural attenuation of chlorinated solvents. Soil Sediment & Groundwater, 13-18.
Flynn, S., Loffler, F., and Tiedje, J. (2000). Microbial community changes associated with a shift from reductive dechlorination of PCE to reductive dechlorination of cis-DCE and VC. Enivron. Sci. Technol., 34(6), 1056-1061.
Freedman, D.L. and Gossett, J.M. (1989). Biological reductive dehalogenation of tetrachloroethylene and trichloroethylene to ethylene under methanogenic conditions. J. Appl. Environ. Microbiol., 55, 1009-1014.
Gao, J, et al. (1997, October). Water Research, 31(10), 2479-2486.
Gerritse, J., et al. (1997). Complete degradation of tetrachloroethene in couple anoxic and oxic chemostats. Appl. Microbiol. Biotechnol., 48, 553-562.
Gibb, J.P., Schuller, R.M., and Griffin, R.A. (1981). Procedures for the collection of representative water quality data from monitoring wells. Illinois State Water Survey/Geological Survey Cooperative Groundwater Report #7.
Gibson, S.A., and Sewell, G.W. (1992). Stimulation of reductive dechlorination of tetrachloroethene in anaerobic aquifer microcosms by addition of short-chain acids or alcohols. Appl. Environ. Microbiol., 58, 1392-1393.
Gilbert, R.O. (1987). Statistical methods for environmental pollution monitoring. New York: Van Nostrand Reinhold: New York.
Gossett, J.M. (1987). Environ. Sci. Technol., 21, 202-208.
Guiot, S.R., et al. (1995). Anaerobic and aerobic/anaerobic treatment for tetrachloroethylene (PCE). Proceedings of 3rd International In Situ On-Site Bioreclamation Symposium (pp. 297-305). Hinchee, R.E., Leeson, A., and Semprini, L. (Eds.). San Diego, CA: Battelle Press.
Haas, P.E., Cork, P., Aziz, C.E., and Hampton, M. (2000). In situ biowall containing mulch promotes chlorinated solvent bioremediation. In Wickramanayake, G.B., Gavaskar, A.R., Alleman, B.C., and Magar, V.S. (Eds.), Bioremediation and phytoremediation of chlorinated and recalcitrant compounds. Battelle Second International Conference on Remediation of Chlorinated and Recalcitrant Compounds. May 22-25, 2000. Monterey, CA.
Harkness, M.R. (2000). Economic considerations in enhanced anaerobic biodegradation. Proceedings of. 2nd International Conference on Remedation of Chlorinated Recalcitrant Compounds, May 22-25, 2000. Wickramanayake, G.B., et al. (Eds.). Columbus, OH: Battelle Press.
Hendrickson, E.R., Payne, J.A., Young, R.M., Starr, M.G., Perry, M.P., Fahnestock, S., Ellis, D.E., and Ebersole, R.C. (2002). Molecular analysis of Dehalococcoides 16S Ribosomal DNA from chloroethene-contaminated sites throughout North America and Europe. Appl. Environ. Microbiol., 68(2), 485-495.

X X X X X X X
80
Hinchee, R.E. (Moderator) (2001). DNAPL source zone remediation. Panel discussion at SERDP/ESTCP’s Partners in Environmental Technology Conference, November 29, 2001. Washington, DC. Other presenters included Stroo, H, Mercer, J., Hughes, J., Enfield,. C, and Sale, T.
Hollinger, C., et al. (1993). A highly purified enrichment culture couples the reductive dechlorination of tetrachloroethene to growth. Appl. Environ. Microbiol., 59, 2991-2997.
Horst, J.F., Beil, K.A., Burdick, J.S., and Suthersan, S.S. (2000). Comparison of natural and enhanced attenuation rates through substrate amendments. Proceedings of the 2nd International Conference on Remediation of Chlorinated and Recalcitrant Compounds, May 2000. Proceedings available at www.battelle.org.
Howard, P., Boethling, R., et al. (1991). Handbook of environmental degradation rates. Lewis Publishers.
Hughes, J.B. (2001). Enhancement of DNAPL dissolution by dechlorination processes. Presented at 2001 SERDP/ESTCP Symposium: Partners in Environmental Technology, Nov 27-29, 2001. Washington, DC.
Hunchak-Kariouck, K., Schweitzer, L., and Suffet, I.H. (1997). Partitioning of 2,2,4,4, tetrachlrobiphenyl by dissolved organic matter in oxic and anoxic porewaters. Envorn. Sci. Technol., 31, 639-645.
Interstate Technology and Regulatory Cooperation (ITRC) Work Group. (2002, April). DNAPL source reduction: Facing the challenge. http://www.itrcweb.org.
Interstate Technology and Regulatory Cooperation (ITRC) Work Group. (1999, May). Natural attenuation of chlorinated solvents in groundwater: Principals and practices. http://www.itrcweb.org.
Interstate Technology and Regulatory Cooperation (ITRC) Work Group. (1998, December). Technical and regulatory requirements for enhanced in situ bioremediation of chlorinated solvents in groundwater. http://www.itrcweb.org.
Kampbell, D.H., and Wilson, J.T. (1998). Analysis of dissolved methane, ethane, ethene in groundwater by a standard gas chromatographic technique. J. Chromatogr., 36, 253-256.
Kampbell, D.H., Wilson, J.T., and Vandergrift, S.A. (1989). Dissolved oxygen and methane in water by a GC headspace equilibrium technique. Int. J. Environ. Anal. Chem., 36, 249-257.
Kanga, S.A., Bonner, J.S., Page, C.A., Mills, M.A., and Auntenrieth, R.L. (1997). Solubilization of naphthalene and methyl-substituted naphthalenes from crude oil using biosurfactants. Environ. Sci. Technol., 31(2), 556-561.
Kastner, M. (1991). Reductive dechlorination of trichloroethylenes and tetrachloroethylenes depends on transition from aerobic to anaerobic conditions. J. Appl. Environ. Microbiol., 57, 2039-2046.
Katakis, D., and Gordon, G. (1987). Mechanisms of inorganic reactions. John Wiley & Sons.
Kleopfer, R.D., et al. (1985). Anaerobic degradation of trichloroethylene in soil. Environ. Sci. Technol., 19, 277-280.
Krumholz, L.R. (1997). Desulfuromonas chloroethenica sp. nov. uses tetrachloroethylene and trichloroethylene as electron acceptors. Int. J. Syst. Bacteriol., 47, 1262-1263.
Lenzo, F.C. (1999). Remedial technology evolution – science meets strategy in the third millennium. Strategic Environ. Management, 1(3).
Lide, D.R. (1992). Handbook of chemistry and physics. Boca Raton, FL: CRC Press.

X X X X X X X
81
Liles, D.S., and Shetty, N. (1999). Application of in situ reactive zone to enhance the remediation of chlorinated aliphatic hydrocarbons. Presented at the AICHE Spring Meeting, March 1999. Houston, TX.
Loffler, F., Sun, Q., Li, J., and Tiedje, J. (2000). 16S rRNA gene-based detection of tetrachloroethene-dechlorinating desulfuromonas and dehalococoides species. Appl. Environ. Microbiol., 66(4), 1369-1374.
Lutes, C.C. (2002a). Utilization of treatability and pilot tests to predict CAH bioremediation. Submitted for publication in the proceedings of this conference.
Lutes, C.C. (2002b). Development of an AFCEE/ESTCP substrate enhanced CAH bioremediation protocol. Submitted for publication in the proceedings of this conference.
Lutes, C.C., et al. (2002c). Advances in understanding and predicting enhanced anaerobic CAH bioremediation. Proceedings of the 3rd International Conference on Remediation of Chlorinated and Recalcitrant Compounds, May 20-23, 2002. Monterey, CA: Battelle.
Maymo-Gatell, X., et al. (1995). Characterization of an H2-utilizing enrichment culture that reductively dechlorinates tetrachloroethene to vinyl chloride and ethene in the absence of methanogenesis and acetogenesis. Appl. Environ. Microbiol., 61(11), 3928-3933.
Maymo-Gatell, X., et al. (1997). Isolation of a bacterium that reductively dechlorinates tetrachloroethene to ethane. Science, 276, 1568-1571.
McCarty, P. (1996). Biotic and abiotic transformations of chlorinated solvents in groundwater. Symposium on Natural Attenuation of Chlorinated Organics in Groundwater, September 11-13, 1996. Dallas, TX: EPA.
McCarty, P.L. (1997). Breathing with chlorinated solvents. Science, 276, 1521-1522.
McCarty, P.L., and Semprini, L. (1994). Groundwater treatment for chlorinated solvents. In Norris, R.D., et al., (Eds.), Handbook of bioremediation. Boca Raton, FL: Lewis Publishers.
Mercade, M.E., and Manresa, M.A., (1994). The use of agroindustrial by-products for biosurfactant production. J. Amer. Oil Chemists Soc., 71(1), 61-64.
Microseeps. Marketing literature and sampling instructions. Pittsburgh, PA: www.microseeps.com.
Miller, E., et al. (1998). Comparative studies on tetrachloroethene reductive dechlorination mediated by Desulfitobacterium sp. strain PCE-S. Arch. Microbiol., 168, 613-619.
Morse J.J., Alleman, B.C., Gossett, J.M., Zinder, S.H., Fennell, D.E., Sewell, G.W., and Vogel, C.M. (1998). Draft technical protocol: A treatability test for evaluating the potential applicability of the reductive anaerobic biological in situ treatment technology (RABITT) to remediate chloroethenes. ESTCP, February 23, 1998.
Nandi, R., and Sengupta, S. (1998). Microbial production of hydrogen: an overview, CRC Rev. Microbiol., 24, 61-84.
National Academy of Sciences (NAS). (2000). Natural attenuation for groundwater remediation. prepublication copy available at www.nap.edu/openbook/0309069327/html/r1.html.
Newell, C; Hass, P.E., Hughes, J.B., and Khan. T.A. (1999). Results from two direct hydrogen delivery field tests for enhanced dechlorination. Biotechnol. Bioeng., 62, 160-165. (Poster Presented at Partners in Environmental Technology, Technology Symposium and Workshop [1999]. Nielsen, R.B., and Keasling, J.D. (Eds.). Washington, DC.)

X X X X X X X
82
Noordman, W.H., Bruining, J.W., Wietzes, P., and Janssen, D.B. (2000). Facilitated transport of a PAH mixture by a rhamnolipid biosurfactant in porous silica matrices. J. Contam. Hydrol., 44(2), 119-140.
Nyer, E., (1998). Groundwater and soil remediation: Practical methods and strategies. Chelsea, MI: Ann Arbor Press.
Nyer, E., et al. (2001). In situ treatment technology (2nd ed.). ARCADIS Geraghty & Miller Environ-mental Science and Engineering Series. Washington DC: Lewis Publishers. ISBN 1-56670-528-2.
Nyer, E., Lenzo, F.L., and Burdick, J. (1998). In situ reactive zones: dehalogenation of chlorinated hydrocarbons. Groundwater Monitoring Review, Spring 1998.
Parsons, F., Wood, P.R., and DeMarco, J. (1984). Transformations of tetrachloroethylene and trichloroethene in microcosms and groundwater. J. Am. Water Works Assoc., 76, 56-59.
Payne, F.C., D’Amato, V.A., Lutes, C.C., and Suthersan, S.S. (2001). Effects of soil organic content on in-situ oxidation. Presented at the Fourth Tri-Service Environmental Technology Symposium, June 18-20, 2001. San Diego, CA.
Scalf, M.R., McNabb, J.F., Dunlap, W.J., Cosby, R.C. and Fryberger, J. (1981). Manual of groundwater sampling procedures (p. 93). NWWA/EPA Series. Worthington, OH: National Water Well Association.
Schollhorn, A., et al. (1997, June) Water Research, 31(6), 1275.
Schumacher, W. and Holliger, C.L. (1996). The proton electron ratio of the menaquinone dependent electron transport from dihydrogen to tetrachloroethene in Dehalobacter restrictus. J. Bacteriol., 178, 2328-2333.
Scow, K.M., and Johnson, C.R. (1997). Effect of sorption on biodegradation of soil pollutants. Adv. Agron., 58, 1-56.
Semprini, L., et al. (1999). Technical session no. 1B. Partners in Environmental Technology, Technical Symposium & Workshop, November/December 1999. Arlington, VA.
Sharma, P.K., and McCarty, P.L. (1996). Appl. Environ. Microbiol., 62, 761-765.
Smatlak, C.R., Grossett, J.M., and Zinder, S.H. (1996). Comparative kinetics of hydrogen utilization from reductive dechlorination of tetrachloroethene and methanogenesis in an anaerobic enrichment culture. Environ. Sci Technol., 30, 2850-2858.
Stahl, D.A. (1997). Molecular approaches for the measurement of density, diversity, and phylogeny. In Hurst, C.J., Knudsen, G.R., McInerney, M.J., Stetzenbach, L.D., and Walter, M.V. (Eds.), Management of Environmental Microbiology (pp. 102-111). Washington DC: ASM Press.
Suthersan, S. (1997). Remediation engineering: Design concepts. ARCADIS Geraghty & Miller Environmental Science and Engineering Series. Washington DC: Lewis Publishers. ISBN 1-56670-137-6.
Suthersan, S. (2002). Natural and enhanced remediation systems. ARCADIS Environmental Science and Engineering Series. Boca Raton, FL: CRC Press. ISBN 1-56670-282-8.
Suthersan, S.S., Engineered in situ anaerobic reactive zones. U.S. Patent 6,143,177, November 7, 2000.
Suthersan, S.S., Engineered in situ anaerobic reactive zones. U.S. Patent 6,322,700, November 27, 2001.
Suthersan, S.S., In situ anaerobic reactive zone for in situ metals precipitation and to achieve microbial denitrification. U.S. Patent 5,554,290, September 10, 1996.

X X X X X X X
83
Tandoi, V., et al. (1994). Environ. Sci. Technol., 28, 973-979.
U.S. Geological Survey. (1997 to present). National field manual for the collection of water-quality data: U.S. Geological Survey Techniques of Water-Resources Investigations (Book 9, Chapters A1-A9, 2 v., variously paged). Also available online at http://pubs.water.usgs.gov/twri9A. Chapters originally were published from 1997-1999; updates and revisions are ongoing and are summarized at: http://water.usgs.gov/owq/FieldManual/mastererrata.html
USEPA. (1998a, March). Field Sampling Matrix and Reference Guide (1st ed.). Prepared by Naval Facilities Engineering Command for the Environmental Protection Agency. EPA/542/B-98/002.
USEPA. (1998b, September). Technical protocol for evaluating natural attenuation of chlorinated solvents in groundwater. Cincinnati, OH: National Risk Management Research Laboratory, Office Of Research And Development, U. S. Environmental Protection Agency. EPA/600/R-98/128.
USEPA. (1998c). Guidance for data quality assessment. Practical Methods for Data Analysis. EPA/600/R-96/084.
USEPA. (1999). Engineered approaches to in situ bioremediation of chlorinated solvents: Fundamentals and field applications. Draft Report.
Vaportech Services, Inc. Instructions for sampling dissolved hydrogen in groundwater using the Vaportech Stripper with off-site analysis. Valencia, PA. Tel: (724) 898-2622.
Vogel, T.M., and McCarty, P.L. (1985). Biotransformation of tetrachloroethylene to trichloroethylene, dichloroethylene, vinyl chloride, and carbon dioxide under methanogenic conditions. J. Appl. Environ. Microbiol., 49, 1080-1083.
Vogel, T.M., Criddle, C.S., and McCarty, P.L. (1987). Transformations of halogenated aliphatic compounds. Environ. Sci. Technol., 21(8), 722-736.
White, D.C., Pinkart, H.C., and Ringelberg, D.B. (1997). Biomass measurements: Biochemical approaches. In Hurst, C.J., Knudsen, G.R., McInerney, M.J., Stetzenbach, L.D., and Walter, M.V. (Eds.), .Management of environmental microbiology (pp. 91-101). Washington DC: ASM Press.
Wiedemeier, T.H. (2002). Enhanced reductive dechlorination via vegetable oil injection, Presented at AFCEE Cleanup Technology Transfer Workshop, March 4-7, 2002. San Antonio, TX.
Wiedemeier, T.H., et al. (1996). Technical protocol for evaluating natural attenuation of chlorinated solvents in groundwater. Cincinnati, OH: National Risk Management Research Laboratory, Office Of Research And Development, U.S. Environmental Protection Agency.
Wiedemeier, T.H., et al. (1997). Protocol for supporting natural attenuation of chlorinated solvents with examples, in In Situ and on-site bioremediation 3. Columbus, OH: Battelle Press.
Wiedemeier, T.H., et al. (1998). Technical protocol for evaluating natural attenuation of chlorinated solvents in groundwater. EPA/600/R-98/128.
Wiedemeier, T.H., et al. (1999). Natural attenuation of fuels and chlorinated solvents in the subsurface. New York: John Wiley & Sons.
Wild, A., et al. (1996). Isolation of an anaerobic bacterium which reductively dechlorinates tetrachloroethene and trichloroethene. Biodegradation, 7, 507-511.
Yang, Y., and McCarty, P.L. (2000). Biologically enhanced dissolution of tetrachloroethene DNAPL. Environ. Sci. Technol., 34(14), 2979-2984.

X X X X X X X
84
Zhang, Y., and Miller, R.M. (1992). Enhanced octadecane dispersion and biodegradation by a psuedomonas rhamnolipid surfactant (biosurfactant). Appl. Environ. Microbiol. 58(10), 3276-3282.
Zinder, S.H. (2002). Personal communication to C.C. Lutes. Ithaca, NY: Cornell Department of Microbiology.
Zwiernik, M.J., Quensen III, J.F., and Boyd, S.A. (1998). FeSO4 amendments stimulate extensive anaerobic PCB dechlorination. Environ. Sci. Technol., 32(21), 3360-3365.

X X X X X X X
85
9.0 ACKNOWLEDGMENTS
The authors would like to acknowledge the support and guidance of Jerry Hansen and Major Jeff Cornell of AFCEE as well as Cathy Vogel and Dr Andrea Leeson of ESTCP. Hans Stroo and Marvin Unger, Ph.D. of ThermoRetec Consulting have served as technical reviewers for ESTCP on this project and have contributed greatly through their probing questions. In addition to the ARCADIS staff listed as coauthors of this document, several additional ARCADIS staff played important roles. Mike Hansen P.E. reviewed portions of the document, contributed to the engineering sections and has had an important role in guiding the engineering of many of the commercial systems discussed in the case studies. Victor D'Amato P.E. drafted several subsections of this document and was heavily involved in the overall AFCEE/ESTCP project as assistant project manager. Denice Nelson also drafted several subsections of the document. Evan K. Nyer, Kurt A. Beil, John F. Horst, Scott Potter Ph.D. P.E. and Hoa Voscott also made technical contributions. Michiel R.J. Doorn served as the primary compiler of the rough first draft. Billie Comstock and Rus A. Hames edited the document.

X X X X X X X
Appendix A
APPENDIX A. CASE STUDIES AND COST DATA
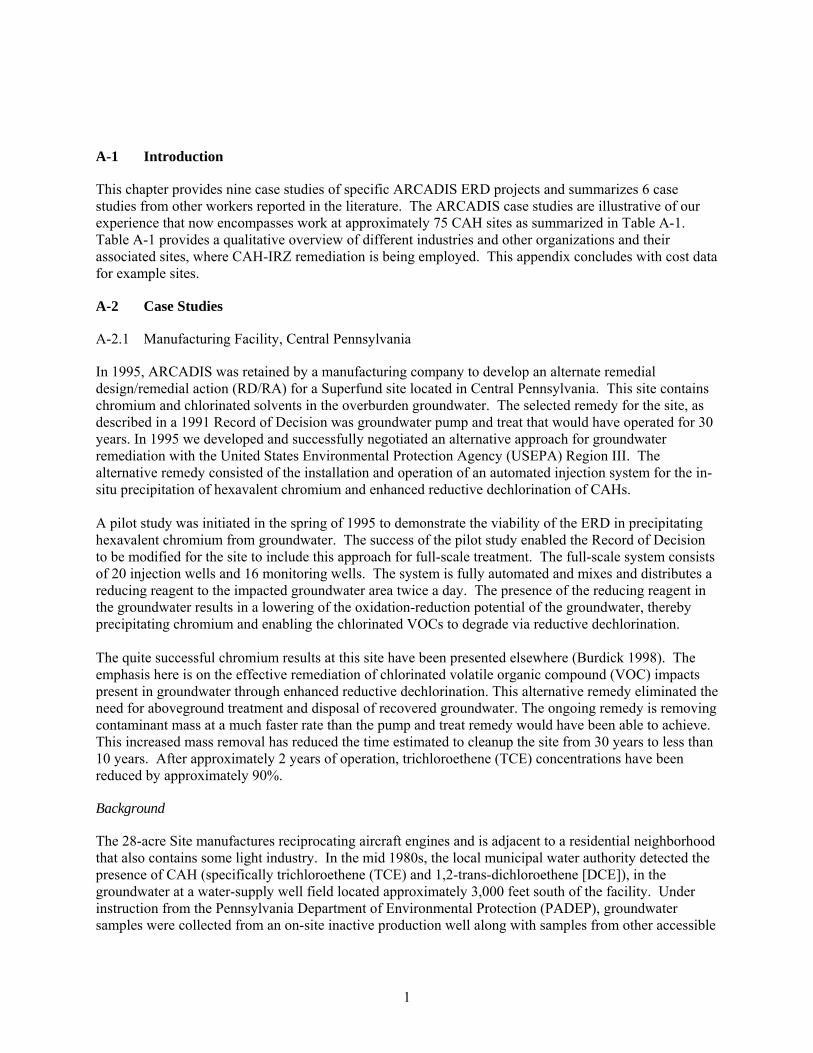
X X X X X X X
1
A-1 Introduction
This chapter provides nine case studies of specific ARCADIS ERD projects and summarizes 6 case studies from other workers reported in the literature. The ARCADIS case studies are illustrative of our experience that now encompasses work at approximately 75 CAH sites as summarized in Table A-1. Table A-1 provides a qualitative overview of different industries and other organizations and their associated sites, where CAH-IRZ remediation is being employed. This appendix concludes with cost data for example sites.
A-2 Case Studies
A-2.1 Manufacturing Facility, Central Pennsylvania
In 1995, ARCADIS was retained by a manufacturing company to develop an alternate remedial design/remedial action (RD/RA) for a Superfund site located in Central Pennsylvania. This site contains chromium and chlorinated solvents in the overburden groundwater. The selected remedy for the site, as described in a 1991 Record of Decision was groundwater pump and treat that would have operated for 30 years. In 1995 we developed and successfully negotiated an alternative approach for groundwater remediation with the United States Environmental Protection Agency (USEPA) Region III. The alternative remedy consisted of the installation and operation of an automated injection system for the in-situ precipitation of hexavalent chromium and enhanced reductive dechlorination of CAHs. A pilot study was initiated in the spring of 1995 to demonstrate the viability of the ERD in precipitating hexavalent chromium from groundwater. The success of the pilot study enabled the Record of Decision to be modified for the site to include this approach for full-scale treatment. The full-scale system consists of 20 injection wells and 16 monitoring wells. The system is fully automated and mixes and distributes a reducing reagent to the impacted groundwater area twice a day. The presence of the reducing reagent in the groundwater results in a lowering of the oxidation-reduction potential of the groundwater, thereby precipitating chromium and enabling the chlorinated VOCs to degrade via reductive dechlorination. The quite successful chromium results at this site have been presented elsewhere (Burdick 1998). The emphasis here is on the effective remediation of chlorinated volatile organic compound (VOC) impacts present in groundwater through enhanced reductive dechlorination. This alternative remedy eliminated the need for aboveground treatment and disposal of recovered groundwater. The ongoing remedy is removing contaminant mass at a much faster rate than the pump and treat remedy would have been able to achieve. This increased mass removal has reduced the time estimated to cleanup the site from 30 years to less than 10 years. After approximately 2 years of operation, trichloroethene (TCE) concentrations have been reduced by approximately 90%.
Background
The 28-acre Site manufactures reciprocating aircraft engines and is adjacent to a residential neighborhood that also contains some light industry. In the mid 1980s, the local municipal water authority detected the presence of CAH (specifically trichloroethene (TCE) and 1,2-trans-dichloroethene [DCE]), in the groundwater at a water-supply well field located approximately 3,000 feet south of the facility. Under instruction from the Pennsylvania Department of Environmental Protection (PADEP), groundwater samples were collected from an on-site inactive production well along with samples from other accessible

X X X X X X X
2
Table A-1. ARCADIS ERD Site Experience*
# City State Description Regulatory Authority Target COCs Status Results/Remarks
1 Williamsport PA Aircraft Manufacturing
CERCLA Cr+6, TCE, DCE, VC
Pilot 1995; Full-Scale 1996 90% reduction of VOCs/Cr+6
2 Saegertown PA Chemical Manufacturing
CERCLA Chlorinated VOCs
Pilot 1998; ongoing
3 Reading PA Manufacturer/ Textile Equipment
PA ACT 2 TCE, Cr+6, Pb, Cd
Pilot/Full-Scale 1997-1998. 100% Cr+6, 95% VOC reduction. Cd and Pb treatment also effective
4 Ambler PA Chemical Manufacturer
PADEP, voluntary
TCE, TCA, Ni Pilot/Interim Remedial Measures complete
VOC levels red. 50-80%. Nickel reduced 60% (to below action levels).
5 Northeastern US NJ Pharmaceutical NJDEP ISRA PCE Pilot 1998, full scale in progress
99.9% reduction of PCE; ND levels of PCE and daughters achieved
6 Northeastern US XX Pharmaceutical TCE Site Screening, Pilot 2002, full scale in reg. approval process.
7 Utica NY Defense Contractor CERCLA TCE, DCE Pilot 1999. Complete
8 Jamestown NY Manufacturer NYSDEC TCE, DCE On hold 9 Collesville NY Landfill USEPA &
NYDEC PCE, TCA, Chlorinated Propanes
Pilot completed 2000; Full-scale design complete. Constr. 2001.
10 Long Island NY Former electronics manufacturer
EPA Region II Cr+6, TCE Pilot 1998-1999
11 Binghamton NY Landfill TCA, TCE, BTEX, chlorinated propanes
Pilot 1998-1999 showed good treatment, Full-Scale Design, ongoing.
12 Wooster OH Former Parts Machining Op.
Ohio EPA TCE, DCE, VC Pilot completed in 1999.

X X X X X X X
3
# City State Description Regulatory Authority Target COCs Status Results/Remarks
13 Greenville SC Manufacturer SC DHEC CT, CF Pilot complete 1998, Full-Scale impl. in 2001
85% – 99% reduction in CT concentrations,
14 Oxford NC Manufacturer CERCLA PCE, TCE Pilot 1999 complete; awaiting full scale
Starting from 150 ppm TCE, achieved 90% removal in monitoring wells.
15 Blairsville GA Former Laboratory GA DEP PCE,TCE Pilot 1998; Full-Scale Design ongoing
16 Crawfordsville IN Former metal parts manufacturer
IDEM, voluntary TCE, DCE Pilot 1998, IRM in 1999 Some red. In TCE
17 San Angelo TX Medical Products Manufacturer
TNRCC PCE, TCE Pilot test ongoing 2001
18 Houston TX Drycleaner TNRCC PCE, TCE, DCE Full-Scale 1997 60% reduction in VOC mass 19 Houston TX Drycleaner TNRCC PCE, TCE, DCE Full-Scale 1997, ongoing 20 Houston TX Shopping Mall TNRCC PCE, TCE Pilot 1996; Full-Scale 1997
ongoing
21 Chattanooga TN Former Manfacturing Facility
TN DSWM/SRP PCE Pilot 1999, Full-scale now ongoing
22 Rogersville TN Parts manuf. for trucks
TDSF under VOAP
PCE, TCA Pilot 2000-2001. >90% red. VOCs. State approved conditional site closure, pending volutary clean-up of other cont.
23 Oak Ridge TN Electronics Manufacturer
TN DSF/VOAP TCE, trichlorofluoro-methane
Pilot 2000 ongoing; FFS ongoing for full scale implementation
>70% reduction in TCE; >50% in TCFM;
24 Woodland Park MI Railcar Spill Site MI DEQ 1,1 DCE, TCE,TCA
Pilot, Interim Remedial Measures in 2002
25 New Hudson MI Landfill MI DEQ PCE, TCE, CA Pilot completed Failed due to hydrogeology 26 Emoryville CA Metal Plating
Manufacturer CA Central TCE, DCE, Cr+6 Pilot 1996, Full-Scale 1997-
1999 complete. 99% reduction in VOCs, 99% reduction in Cr+6
27 Fresno CA Pesticide Manufacturer
CA Central DCP, DBCP, Cr+6Pilot 1999-2001 Showed successful treatment

X X X X X X X
4
# City State Description Regulatory Authority Target COCs Status Results/Remarks
28 Monterey CA Shopping Mall CA Coastal PCE, TCE Pilot 1997, Full-Scale 1999, ongoing
29 Santa Barbara CA Shopping Mall Development
CA Central PCE Pilot 1997, Full-scale 1998, closed 2000. Project complete.
30 Palo Alto CA Aerospace Company
CA Central TCE,DCE Pilot 2001
31 East Palo Alto CA Manufacturing Facility
CA Central/EPA TCE Pilot 2001
32 Dominguez CA Chemical TCE, DCE Not implemented 33 Pinebend MN Landfill MN DEP PCE, TCE Pilot design 1996 unknown 34 Washington WI Shopping Mall PCE, TCE Pilot 1998; Full-Scale,
ongoing
35 London UK Automobile Manufacturer
Env. Agency U.K.
PCE, TCE Full-Scale 1998, ongoing
36 confidential WI ESTCP-AFCEE Demonstration
ESTCP demo CVOCs, metals, and energetics
Site Assessment complete, Pilot
37 Bedford MA ESTCP-AFCEE Demonstration
USEPA/MADEPCVOCs Pilot study underway 2000-2001.
Preliminary results indicate 98% TCE reduction.
38 Lompoc CA ESTCP-AFCEE Demonstration
USEPA CVOCs Site Assessment and Pilot Study, 2001
39 Dallas TX NFESC Demonstration
USEPA CVOCs Large-Scale Pilot underway
41 Palatine IL Metal Plating Facility
Illinois EPA CVOCs and Cr+6 Pilot 1998-1999; Full-Scale 1999, ongoing
42 Oakland/San Leandro
CA Former coffee processing site
SFRWQCB TCE Two pilot tests 2000-2001. source area red. TCE from 50,000 µg/L to bdl.
43 Milwaukee WI Washington Square Mall
WINDR PCE, TCE Full-scale IRZ 1999, Site closed 2001
44 Cedarburg WI Drycleaner WINDR PCE Full-scale IRZ

X X X X X X X
5
# City State Description Regulatory Authority Target COCs Status Results/Remarks
45 Milwaukee WI Electronics WINDR PCE, TCE Completed Pilot Study, Full-scale being designed
46 Milwaukee WI Paint WINDR TCE Pilot Test ongoing 47 Milwaukee WI Drycleaner WINDR PCE Pilot Scale ongoing 48 Los Angeles CA Former Electronics
Manufacturer RWQCB TCE Pilot Study to start
49 Newport Beach CA Former Automotive Manufacturer
RWQCB TCE Pilot study 2001
50 Anderson IN Former auto manufacturer
EPA V PCE, TCE Full scale barrier, to be expanded to source
Barrier, met 1st milestone, >50% red., 2nd milestone MCLS
51 Tuckahoe NY Electronics Company
NYSDEC TCE Pilot and Intermediate Remedial Measures, 2000-2001. Complete
IRZ established in < 2 months. TCE reduced from 3,100 to 0 ppb in 8 months.
52 San Diego CA Aerospace Company
RWQCB PCE/TCE Pilot study 2001, ongoing
53 Hollister CA Aerospace Company
RWQCB Perchlorate/TCE Full scale IRZ, 2001
54 Silver Springs MD Drycleaner MDE PCE/TCE Pilot 2001 55 Bristol PA Drycleaner PADEP PCE Full Scale started in Jan.
2001. sing. red. in PCE
56 Williamsburg VA Former Chemical Manufacurer
VDEQ CVOC’s Site assessment/Pilot study Design Phase
57 St Petersburg FL Electronics CVOC’s Pilot completed 11/2000 evaluating full scale
58 San Marcos CA Aerospace Company TCE, 1,1-DCE Site assessment/Pilot study Design Phase
59 Mission Viejo CA Dry Cleaner PCE Pilot Test (Started in Oct. 2001)
60 Torrance CA Former Aerospace Company
TCE, 1,1-DCE Full scale to begin 2002
61 City of Industry CA Manufacturing PCE Full scale to begin 2002

X X X X X X X
6
# City State Description Regulatory Authority Target COCs Status Results/Remarks
62 Newbury Park CA Former Aerospace Company
PCE Pilot Test (Started in October 2001)
63 Utrecht Neth. Former drycleaner PCE Pilot (started 10/1/01)
64 Eindhoven Neth. Textile Dye/printing company
PCE, CVOC (cis DCE plume)
Pilot
65 Frankfurt Germ. TCE/DCE Pilot complete. Full scale upgrade underway.
100% TCE removal; 80% cis DCE removal
66 Liverpool UK Automotive parts manuf.
TCE Pilot complete. 95% removal in 5 months program
67 Vicellon SC Pharmaceuticals PCE Full scale as of July 2001 68 Eastern TN TN Fuel Facility PCE,
radionuclides Pilot 2000-2001 ongoing. Full scale design ongoing.
>90% red. in PCE; >60% red.in dissolved Ur
69 Fort Devens MA Former parachute cleaning facility
EPA Region I, superfund.
PCE Site assessment/Pilot study Design Phase
70 Loveland CO Manufacturing PCE Pilot test, 2001 71 Dayton OH Autmotive EPA 5, RCRA PCE, TCE, DCE,
VC Pilot compl in 2000. Full-scale since 2001
Remed. target levels (RTLs) have been met in the IRZ immed. down-gradient of source area.
72 Freehold NJ Manufacturing NJDEP PCE Pilot started in Jan 2002 *Only sites where CAHs are a contaminant of concern are listed.

X X X X X X X
7
wells in the area. Based on the findings, additional monitoring wells were installed at the facility. Investigations indicated that volatile organic constituents in the overburden groundwater aquifer beneath the plant were migrating from the plant in a southerly direction. Air stripping towers were installed to treat groundwater withdrawn from the municipal well field. Soon after, heavy metals was also discovered within the groundwater (in particular, total and hexavalent chromium). In the late 1980’s, the EPA executed an Administrative Order of Consent for the purpose of conducting a Remedial Investigation, Endangerment Assessment, and Feasibility Study at this facility. In the early 1990s, the pump and treat Record of Decision was issued for the area within the plant boundaries and soon after the EPA issued an Administrative Order to implement the remedy. The site is underlain by unconsolidated alluvial and glacial deposits (sand, gravel, cobbles, and small boulders with relatively minor amounts of silt and clay) with a maximum thickness of approximately 37 feet. The depth to groundwater ranges from approximately 15 to 28 feet below land surface (ft bgs). Groundwater flows primarily in a southerly direction with minor components to the southwest and southeast. A hydraulic connection between the overburden and the bedrock has been demonstrated. Maximum total CAH concentrations in groundwater in the pilot study area were on the order of 20,000 µg/L. The primary organic constituents of concern in the overburden aquifer are TCE and DCE. Vinyl chloride and, to a lesser extent, chromium are also present.
Approach
In September 1995, molasses injection and monitoring wells were installed in the western portion of the site and the pilot study was initiated on November 21, 1995. Field measurements collected on November 30 and December 7, 1995 demonstrated a decrease in oxidation/reduction potential (Redox), indicating that reducing conditions had developed in both injection and monitoring wells. Decreases in dissolved oxygen (DO) were also observed in the injection wells.
System Installation and Operation
During the pilot test, information necessary to design a full-scale system was collected. The field test indicated that individual injection wells had reactive zones ranging in width from 25 to 40 feet in a downgradient direction. The components of the full-scale system included the following:
• A series of molasses injection wells
• Mixing tanks for molasses solution
• Pumps, piping, and associated equipment for molasses injection
• A programmable logic controller (PLC) to automatically control the amount of solution injected The full-scale system consisted of installing twenty injection wells along four treatment lines. Each well is constructed of four-inch PVC and installed to approximately 25 ft below land surface (bgs). Approximately 1,200 feet of trenching was installed to connect the four treatment lines to one main distribution line. The trenches contained the piping necessary to distribute the molasses solution. One central solution feed station consisting of a heated shed, controls, and tankage was also installed at the site. The shed also contained the molasses feed tank, a batch mixing tank and a solenoid distribution network to ensure that the proper volume of reagent was injected into individual wells. The reducing reagent (in this case, a mixture of edible blackstrap molasses, water and proprietary reagents) was added

X X X X X X X
8
twice a day at low volumes (10 to 20 gallons per well), and at variable rates and concentrations (from 1:200 to 1:20 strength). The treatment system went on-line in January 1997 and monthly to quarterly sampling has been conducted since this time.
CAH Results and Discussion
Groundwater samples were collected quarterly throughout the treatment period. Samples were collected using low flow sampling methods and a peristaltic pump. The groundwater samples have been analyzed for CAHs using USEPA approved analytical methods. A baseline-sampling event was conducted in January 1997 to document geochemical conditions prior to initiation of reagent injections. The baseline-sampling event indicated that anaerobic and reducing conditions were only present near the pilot injection wells. Prior to reagent injections, TCE was detected in four wells; however, appreciable concentrations of cis-1, 2 DCE were detected only in the two wells that exhibited an anaerobic environment. During the full-scale phase, maximum total CAH concentrations in groundwater of approximately 700 µg/L in individual wells were found. Data collected since the initiation of full-scale treatment from the site shows that enhanced transformation of the CAHs has resulted in significant decreases of CAHs in groundwater. Data collected after the in-situ treatment zones (or “reactive zones”) were established, show significant increases in the total organic carbon content of the groundwater, the amount of sulfide being generated by sulfate reducing bacteria, and a significant drop in the oxidation-reduction potential (ORP) of the groundwater. These reducing effects on groundwater were observed over an approximately 12,000-ft2 area at the Site. Degradation has resulted in an observed 70 to 100% reduction in source concentrations of TCE in groundwater. Figure A-1 and A-2 show on a logarithmic scale the concentration trends and degradation rates achieved for the pilot and central area of the full-scale remediation system respectively.
y = 1028.2e-0.0085x
R2 = 0.9057
y = 205.7e-0.0087x
R2 = 0.9106
y = 41.6e-0.008x
R2 = 0.9245
1.0
10.0
100.0
1000.0
10000.0
0 50 100 150 200 250 300
Time (days)
Log
Conc
entr
atio
n (u
g/L)
Trichloroethene
1,2-Dichloroethene
Vinyl Chloride
Exponential regression

X X X X X X X
9
Figure A-1. Concentration Trends and Degradation Rates for COCs in Groundwater at the Pilot Study Area
Figure A-2. Concentration Trends and Degradation Rates for COCs in Groundwater During Full Scale Treatment
A-2.2 Enhanced Reductive Dechlorination Of PCE in Bedrock: Northeastern U.S.
Pilot and full-scale results are presented for the enhanced reductive dechlorination of tetrachloroethene (PCE) in bedrock groundwater using an in-situ reactive zone (IRZ) in the northeastern US. ARCADIS implemented a pilot test was implemented in the mid-portion of an approximately 3,000-foot long plume. Initial PCE groundwater concentrations were approximately 120 micrograms per liter (µg/L). A pilot test was initiated that consisted of an injection well and two downgradient monitoring wells. A reagent of molasses and water was injected on a weekly to monthly interval. The results of the pilot tests indicate anaerobic and reducing conditions were established and organic carbon concentrations increased in and downgradient of the injection wells. The increased amount of organic carbon coupled with the anaerobic and reducing conditions promoted the reductive dechlorination of PCE to lesser chlorinated compounds (TCE, DCE, VC, and ethene). The increased rate of attenuation decreased the ratio of PCE to daughter products, and reduced overall VOC mass within the pilot test areas. The results of the 15-month long pilot test were used to implement a full-scale in-situ treatment system for the site. The following sections discuss the IRZ process and present more detail on the implementation and results of both the pilot and full-scale approach at this site.
y = 275.8e-0.0064x
R2 = 0.8407
y = 838.6e-0.0059x
R2 = 0.9093
y = 17.3e-0.0026x
R2 = 0.4654
1.0
10.0
100.0
1000.0
0 100 200 300 400 500 600 700
Time (days)
Log
Con
cent
ratio
n (u
g/L)
Trichloroethene
1,2-Dichloroethene
Vinyl Chloride
Exponential regression

X X X X X X X
10
Background
A tetrachloroethene (PCE) spill was discovered in 1985 at a northeastern United States manufacturing plant. A subsequent groundwater investigation resulted in the installation of approximately 40 wells to delineate the PCE plume. All site wells were installed in bedrock, which is a succession of Triassic-aged siltstones and shales. The overburden at the site consists of relatively thin and dry glacial till. PCE has been delineated horizontally and vertically at the site, and a dissolved PCE plume has been defined. Low concentrations of PCE (1 µg/L) extend approximately 3,000 feet (914 meters) downgradient of the spill area. Historical groundwater monitoring indicates that the plume is currently at equilibrium. This is most likely a result of the low solubility and adsorption of PCE onto the aquifer material in and downgradient of the source area, and to a lesser degree from natural attenuation of PCE in various portions of the site. Hydraulic control has been established at the site through pumping. Low concentrations of PCE breakdown products (such as TCE and cis-1,2-DCE) were detected in the former source area during the ongoing groundwater monitoring at the site, indicating that natural reductive dechlorination of PCE was taking place prior to initiating the bioremediation pilot test. The observed reductive dechlorination in the source area was a result of favorable geochemical conditions: anaerobic and reducing conditions and the presence of organic carbon (electron donor) in groundwater. Less favorable conditions that exist outside the former source area (more aerobic and oxygenated groundwater and a lack of electron donor) do not promote continued degradation of the PCE plume. Soil vapor extraction (SVE) had been employed in the former source area at the site, but the mass recovery was low and had reached asymptotic levels. Pumping of groundwater in the former source area and upgradient of the stream has been ongoing at the site since 1987. The pumping remedy has been effective in protecting the stream and containing any further migration of PCE from the site. However, due to the inefficiency of pump and treat, and the elevated long-term costs associated with this technique, we evaluated the site in order to determine if a more cost effective and efficient remedy could be implemented. A pilot test was initiated in October 1998 to evaluate if the rate of reductive dechlorination downgradient of the source area could be enhanced via an anaerobic IRZ. The IRZ technology implemented here involves the injection of molasses as a carbon amendment into groundwater to promote anaerobic and reducing conditions and provide the electron donor (carbon) necessary for microbial degradation.
Geology/Hydrogeology
The overburden at the site consists of a thin layer of glacially deposited sands, silts, and clays and is approximately 10 to 20 feet (3 to 6 meters) thick. The overburden contains little groundwater and therefore the majority of the site wells were installed in bedrock, which consists of Triassic-aged, low-permeability siltstones and shales. Results of several pumping tests completed at the site indicate that the bedrock at the site has a hydraulic conductivity (K) in the range of 0.14 to 1.78 feet per day (0.04 to 0.54 meter per day). The groundwater velocity for the site is within a range of approximately 10 to 70 feet per year (3.1 to 21.3 meters per year). The bedrock is primarily fractured along horizontal bedding planes that strike to the northwest with a slight dip (9°) to the northeast. Minor vertical fractures are also present in the bedrock. Groundwater flow is believed to be primarily along the horizontal bedding plane partings that are coincident with the strike of the rock. Groundwater flow is generally south-southeast with the orientation of the plume being

X X X X X X X
11
coincidental with strike. There is historical evidence supporting the interconnection of the bedding plane fractures through previous pumping and injection tests on the aquifer. Monitoring and pumping wells have been installed in the bedrock to various depths ranging from 50 to 190 feet (15 to 58 meters) below ground surface (bgs).
Baseline Biogeochemical Assessment
A baseline biogeochemical sampling event was performed prior to initiating the pilot test to determine background conditions at the site, and to evaluate the biogeochemical environments present in various portions of the plume, including the pilot test area. Groundwater samples were collected utilizing low-flow sampling procedures from a background well located upgradient of the assumed source area and the pilot test area. Field parameters (dissolved oxygen (DO), oxidation-reduction potential [ORP], pH, temperature, and conductivity) were collected at the well head using a flow-through cell and a multi-meter, and samples were collected for a full suite of biogeochemical parameters. The laboratory parameters included VOCs, alkalinity, ammonia, biochemical oxygen demand, chemical oxygen demand, chloride, total and dissolved iron and manganese, nitrate/nitrite, sulfate/sulfide, dissolved organic carbon (DOC), and total organic carbon (TOC). Samples were also analyzed in the field utilizing a spectrophotometer for ferrous iron and sulfide, and submitted to a specialty lab for analysis of permanent gases (carbon dioxide, oxygen, nitrogen, methane, and carbon dioxide) and light hydrocarbons (methane, ethene and ethane.) The background biogeochemical environment flowing onto the site was fairly aerobic (DO = 7.09 mg/L) and oxidizing (ORP +42.7millivolts [mV]). VOCs were not detected at this upgradient location. Background groundwater contained low levels of some electron acceptors: non-detectable levels of nitrate; < 1 mg/L of iron and manganese; and carbon dioxide concentrations of 9.7 mg/L. Ethene and ethane, the final products of reductive dechlorination of PCE, were non detect (< 5 nanograms per liter [ng/L]) in upgradient groundwater. The baseline biogeochemical environment in the pilot test area was transitional: DO levels indicated anaerobic conditions in two of the three pilot test wells, while ORP levels were in the +19 to +160 mV range. Total VOCs in this portion of the plume ranged from 1 to 813 µg/L. The only PCE degradation product detected was TCE in two of the three pilot test wells. Levels of ethene and ethane were low and not significantly above background, indicating that little natural reductive dechlorination was ongoing in this portion of the plume. The pilot test wells showed a significant increase (compared to background) in the amount of nitrate in the groundwater during the baseline-sampling event, which could also be a result of lawn watering (and fertilizer). Detectable concentrations of ammonia and the most elevated level of dissolved nitrogen detected during the initial baseline assessment at the site were also identified in this area, suggesting that some of the nitrate is being reduced in this area. ORP measurements suggest that the environment may be favorable for denitrification.
Pilot Study
Reagent injections were initiated in October 1998. Approximately 200-gallons of reagent were initially injected under pressure on a weekly basis and consisted of a 10:1 (vol:vol) ratio of molasses to water. Molasses was used as the electron donor due to its relatively low cost ($0.30/lb), high organic carbon

X X X X X X X
12
content (approximately 60% by weight), and its ability to create a strong reducing environment in a short time period (as opposed to some other electron donors and delivery techniques that rely on dissolution and diffusion). The frequency of injection was modified to bi-weekly in May 1999, and the ratio of molasses to water varied from a 10:1 to 20:1 ratio based on the performance monitoring performed during the pilot test. The reagent was injected under pressure (up to 30 psi) for a more thorough distribution into the bedrock aquifer system. Parameters associated with the performance monitoring focused on PCE and associated degradation products, DO, ORP, TOC and ethene. Approximately two months after commencement of the pilot test, performance monitoring was initiated to monitor the development of the IRZ. Initial performance monitoring events focused on field parameters (primarily DO and ORP) and measuring TOC concentrations in groundwater. VOC monitoring was initiated after a TOC gradient had been established within groundwater in the pilot test area. During the December 1998 performance monitoring event, anaerobic and reducing conditions had been established in the injection well and first downgradient monitoring well (MW-1). TOC concentrations had significantly increased in the injection well, but little change in TOC concentrations were observed in the three downgradient wells. In January 1999, the injection well was deepened by 10 feet (3 meters) to encounter a more highly fractured bedrock zone, and increase the ability to deliver the reagent to the more impacted portion of the aquifer. VOC concentrations in MW-1 significantly increased (PCE = 400 µg/L, TCE = 40 µg/L, and cis-1,2-DCE = 22 µg/L). This increase was likely due to a biological surfactant effect resulting from the increased microbial activity of the expanding microbial community. Reductive dechlorination was reducing an increased amount of TCE to cis-1,2-DCE, but increased rates of the reductive dechlorination of PCE to TCE were not occurring. The mass ratio of PCE to TCE during the background-sampling event was 9:1; this ratio was 10:1 in February 1999, presumably due to natural surfactants. The mass ratio of PCE to cis-1,2 DCE was 85:1 during the background-sampling event, and this ratio was 18:1 during the initial surfactant effect. The increased degradation of TCE to DCE was due to the anaerobic and reducing conditions that had been established in the area of the well. However, significantly increased rates for the complete reductive dechlorination of PCE to ethene could not occur since the electron donor (carbon) injected in IW-1 had not reached this downgradient location. TOC concentrations continued to increase and the more strongly anaerobic and reducing conditions necessary for increased attenuation rates via reductive dechlorination were established in Well MW-1 through March 1999. Anaerobic and reducing conditions were present in IW-1, MW-1, and MW-3 during the April 1999 monitoring event, and aerobic and oxidizing conditions continued in MW-2. MW-3 is located adjacent to MW-2, and has a deeper open borehole interval. Monitoring was initiated in MW-3 since anaerobic and reducing conditions had not been observed in MW-2. Elevated TOC concentrations continued to be present in the injection well (> 3,000 mg/L), and increased TOC concentrations (469 mg/L) were observed in downgradient Well MW-1. PCE concentrations in Well MW-1 had been reduced from 400 µg/L to < 5 µg/L. The reduced concentration was due to increased reductive dechlorination due to the availability of electron donor, and the ratio of PCE to TCE and DCE has also improved. The ratio of PCE to TCE was 4:1, and the ratio of DCE to PCE was 1.4:1. The most significant evidence for the increased rate of reductive dechlorination was the ethene data. Baseline concentrations in Well MW-1 for ethene were 12 ng/L. Ethene was detected at 408 ng/L during the April 1999 sampling event. Anaerobic and reducing conditions were present in Well MW-3 and ethene concentrations were also higher than background conditions (92 ng/L).

X X X X X X X
13
Subsequent monitoring events performed between May 1999 and August 2000 have indicated that the anaerobic and reducing conditions present in Wells IW-1, MW-1, and MW-3 have been maintained, and TOC concentrations in Well MW-1 have continued to increase. PCE and associated degradation products have continued to decline in Well MW-1. These declines are due to reductive dechlorination since significant increases in the concentration of ethene have been observed throughout this same time period. Increased TOC concentrations have not been observed in MW-3. This appears due to the increased rates of microbial activity upgradient of these wells. However, PCE concentrations in Well MW-3 continue to decline after a slight biological surfactant effect was observed in May 1999, and ethene concentrations continue to be more elevated than background conditions.
Bulk Attenuation Rates
The rate by which a dissolved constituent attenuates at a particular site can be estimated through first-order kinetics. It is important to note that the calculation of attenuation rates are only approximations of the complex processes that are occurring in nature. It should further be noted that the attenuation rates presented in this section consist of the effects of both destructive (biotic attenuation) and non-destructive (dilution) mechanisms. Based on the minimal volume of reagent delivered to the aquifer, and the increases in degradation daughter products that have been observed at the site, the lowering of PCE mass that has been observed is believed to be effected minimally by dilution. PCE concentrations versus time from August 1999 to August 2000 are plotted as shown (in Figure A-3). A trendline for the exponential regression of PCE is also presented. The equation describing the exponential regression is posted on the plot. This is the equation describing the exponential regression, where the first order attenuation constant (k) is –0.008 and x represents time in days. The correlation coefficient (R2) is also presented. Regressions with values of R2 at and above 0.8 are generally considered to be useful.

X X X X X X X
14
Figure A-3. Reactive Zone Bulk Attenuation Rates
y = 213.89e-0.008x
R2 = 0.932
1
10
100
1000
0 50 100 150 200 250 300 350 400 450
Time (days)
PCE
(ug/
L)
PCE
Trendline
båÜ~åÅÉÇ=o~íÉ
k~íìê~ä=o~íÉ

X X X X X X X
15
Based on an attenuation constant (k) of –0.008, the half-life for PCE is approximately 80 days. This is significant due to the stable nature of the plume prior to the pilot test (little degradation) and in light of published half-lives for PCE in groundwater that range from 1 to 2 years (Howard and Boeling, 1991). The results of the pilot test demonstrate that the rate of reductive dechlorination in the bedrock aquifer was enhanced by the reagent injections associated with the reactive zone. The increased concentration of organic carbon quickly established the anaerobic and reducing conditions necessary for the complete degradation of PCE to ethene in the injection well. The anaerobic and reducing conditions migrated from the injection well to a well located approximately 240 feet downgradient (MW-3). After initial desorption of PCE (presumably from a biological surfactant effect) PCE concentrations in the downgradient wells have declined to concentrations significantly below the equilibrium conditions present prior to initiation of the pilot test. This is considered significant due to the elevated levels of ethene concurrently measured during the test. The amount of time necessary to observe a significant reduction in overall source mass indicates some conditioning of the microbial population was necessary to enhance the natural degradation mechanisms. However, bioaugmentation was not necessary to provide the microbial populations to the bedrock groundwater environment, demonstrating that the microbial populations in bedrock at this site were ubiquitous.
Full-Scale System
A full-scale bioremediation treatment system was installed at the site during the first quarter of 2000 and injections were initiated in May 2000. The reactive zone technology is also currently being evaluated in the source area (PCE concentration > 10,000 µg/L). The success of the bioremediation program has allowed for the discontinuation of groundwater extraction from some site wells, and will allow groundwater extraction to eventually be phased out for the site. This will result in a significantly more cost-effective groundwater remedy for the treatment of chlorinated VOCs in bedrock groundwater at this site compared to traditional alternatives. The full-scale system consists of eleven injection wells located perpendicular to groundwater flow in two parallel lines between the source area and the stream. The wells are placed 70 feet on center along each line. The parallel lines of wells are approximately 250 feet apart. The full-scale injection wells have been used to establish a reactive zone throughout the impacted groundwater thus cutting off the source of mass to the downgradient plume. Eventually the downgradient portion of the plume is expected to naturally attenuate. The full-scale system is expected to operate between two and five years before injections are terminated.
A-2.3 Manufacturing Facility, Southeast England
In this section the results of a full-scale in-situ dechlorination treatment system designed by ARCADIS are presented for a trichloroethene (TCE) groundwater plume located beneath an active manufacturing facility in Southeast England (“England site”). The full-scale system was integrated into the construction of an expanded facility. Injection wells were installed below the facility prior to construction and a carbon reagent tank was installed on the roof to facilitate gravity-fed injections. A vapor membrane was installed below the building, as well as a small vapor recovery system to recover potential methane, hydrogen sulfide and vinyl chloride (VC) vapors during the reductive dechlorination process. An electron donor reagent solution consisting of varying strengths of molasses and water has been injected via the gravity feed system since 1999. Reductive dechlorination has been enhanced at the site
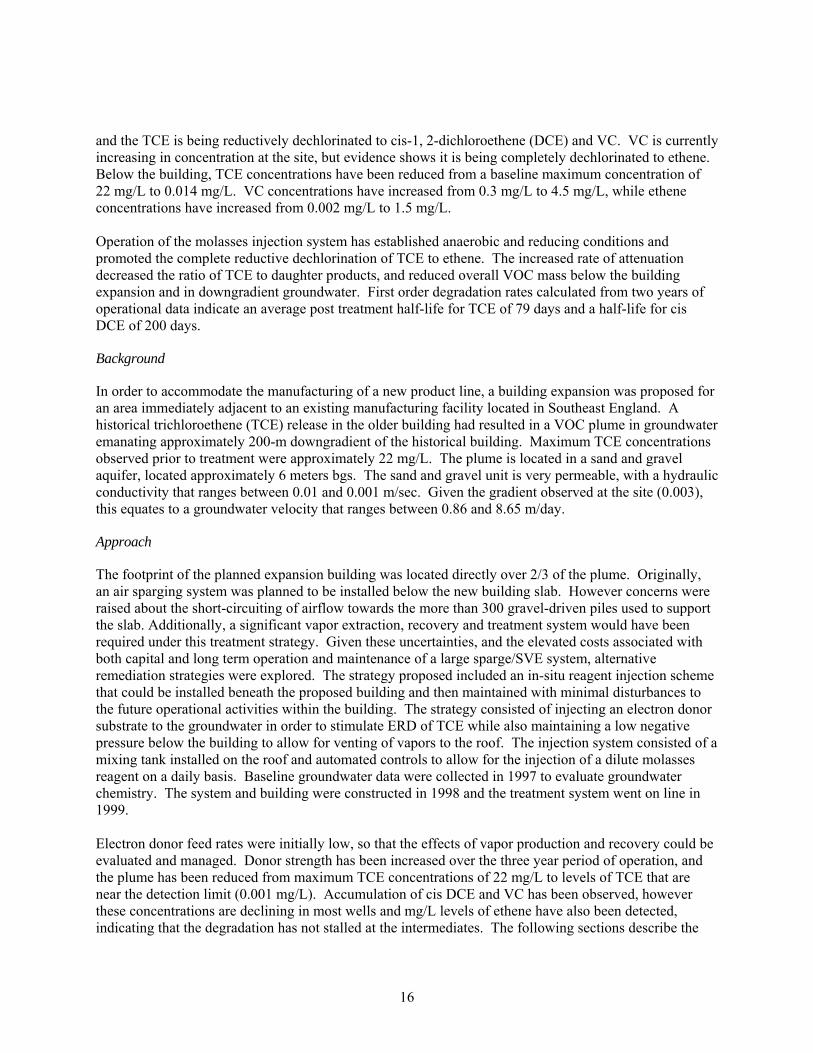
X X X X X X X
16
and the TCE is being reductively dechlorinated to cis-1, 2-dichloroethene (DCE) and VC. VC is currently increasing in concentration at the site, but evidence shows it is being completely dechlorinated to ethene. Below the building, TCE concentrations have been reduced from a baseline maximum concentration of 22 mg/L to 0.014 mg/L. VC concentrations have increased from 0.3 mg/L to 4.5 mg/L, while ethene concentrations have increased from 0.002 mg/L to 1.5 mg/L. Operation of the molasses injection system has established anaerobic and reducing conditions and promoted the complete reductive dechlorination of TCE to ethene. The increased rate of attenuation decreased the ratio of TCE to daughter products, and reduced overall VOC mass below the building expansion and in downgradient groundwater. First order degradation rates calculated from two years of operational data indicate an average post treatment half-life for TCE of 79 days and a half-life for cis DCE of 200 days.
Background
In order to accommodate the manufacturing of a new product line, a building expansion was proposed for an area immediately adjacent to an existing manufacturing facility located in Southeast England. A historical trichloroethene (TCE) release in the older building had resulted in a VOC plume in groundwater emanating approximately 200-m downgradient of the historical building. Maximum TCE concentrations observed prior to treatment were approximately 22 mg/L. The plume is located in a sand and gravel aquifer, located approximately 6 meters bgs. The sand and gravel unit is very permeable, with a hydraulic conductivity that ranges between 0.01 and 0.001 m/sec. Given the gradient observed at the site (0.003), this equates to a groundwater velocity that ranges between 0.86 and 8.65 m/day.
Approach
The footprint of the planned expansion building was located directly over 2/3 of the plume. Originally, an air sparging system was planned to be installed below the new building slab. However concerns were raised about the short-circuiting of airflow towards the more than 300 gravel-driven piles used to support the slab. Additionally, a significant vapor extraction, recovery and treatment system would have been required under this treatment strategy. Given these uncertainties, and the elevated costs associated with both capital and long term operation and maintenance of a large sparge/SVE system, alternative remediation strategies were explored. The strategy proposed included an in-situ reagent injection scheme that could be installed beneath the proposed building and then maintained with minimal disturbances to the future operational activities within the building. The strategy consisted of injecting an electron donor substrate to the groundwater in order to stimulate ERD of TCE while also maintaining a low negative pressure below the building to allow for venting of vapors to the roof. The injection system consisted of a mixing tank installed on the roof and automated controls to allow for the injection of a dilute molasses reagent on a daily basis. Baseline groundwater data were collected in 1997 to evaluate groundwater chemistry. The system and building were constructed in 1998 and the treatment system went on line in 1999. Electron donor feed rates were initially low, so that the effects of vapor production and recovery could be evaluated and managed. Donor strength has been increased over the three year period of operation, and the plume has been reduced from maximum TCE concentrations of 22 mg/L to levels of TCE that are near the detection limit (0.001 mg/L). Accumulation of cis DCE and VC has been observed, however these concentrations are declining in most wells and mg/L levels of ethene have also been detected, indicating that the degradation has not stalled at the intermediates. The following sections describe the

X X X X X X X
17
enhanced reductive dechlorination process, the design of the treatment system, operation and maintenance activities and also discuss and present the results from groundwater monitoring.
Injection System Design
Prior to completion of the new building, two rows of injection wells were installed in trenches installed in the concrete slab of the new building floor. The northern and southern injection lines are oriented perpendicular to the orientation of the plume and groundwater flow. A total of 53 injection wells were installed. The treatment rows were designed to cut off the entire width of the plume, where it enters and exits the area beneath the building. Injection wells were installed to approximately six meters below ground surface, in a sand and gravel alluvium, which overlies the London Clay (a thick regional aquitard). Six vapor extraction wells were installed below the building in addition to a vapor membrane below the building. The injection lines were designed to be low profile so as not to disturb ongoing manufacturing activities. The trenches were covered with removable concrete vaults, to facilitate maintenance on the injection and SVE points. Each injection well was connected to the automated reagent injection distribution system located on the roof of the building. The roof building contains a heated molasses holding tank, a mixing vessel, a potable water feed line, a small blower, a knockout tank, and the electrical controls for the system (Figure A-4). The control panel allows for the selection of injection into individual injection points. This feature was important in the early stages of commissioning, when injections were gradually increased from 10 wells to 53 wells, while assessing vapor production. All injections are completed via gravity with an automated solenoid system, which delivers a pre-set volume and strength of reagent to individual wells.

X X X X X X X
18
Figure A-4. Injection Building Interior Seven groundwater-monitoring wells were also installed at the site. Four of the monitoring wells were installed through the building foundation in order to assess groundwater chemistry and treatment effectiveness between the north and south injection lines. Three additional monitoring wells were installed downgradient and south of the southern injection line in the distal portion of the plume. A small scale LNAPL skimming system was also installed in the vicinity of Well 7. In this area the solvent plume comingles with dissolved phase petroleum hydrocarbons as wells as LNAPL.
System Start Up, Operation and Maintenance
The primary exposure pathway at the site is the potential for vapors to enter the manufacturing building above the plume. Groundwater in the shallow alluvium is not used for potable purposes, and sheet piling on the nearby river restricts groundwater discharge into the river. Given the scrutiny of the vapor exposure pathway, air modeling and a risk assessment was completed prior to system commissioning. This work identified action levels for vapors escaping to the building. The system was commissioned gradually by slowly increasing the number of injection wells utilized and the strengths of the delivered reagent. Vapor monitoring was completed during this scale up period. The system was commissioned in June 1999, by injecting a 50:1 strength reagent into 10 injection wells along the northern injection line. Currently half of the injection points in each line are utilized. The system operates on a 24-hour cycle with injections occurring daily between 10 a.m. and 6 p.m. During the first two years of operation (June 1999 to June 2001), approximately 8,500 liters of raw molasses was delivered to the impacted groundwater at the England site. This equates to a total of approximately 15,000 pounds of delivered organic carbon, or about 21 lbs delivered per day to the entire plume. An increase in feed strength was initiated in September 2001 and is designed to foster more strongly reducing conditions to increase the mass removal rate of cis DCE and VC. The increased reagent strength results in an organic carbon dose of approximately 57 lbs/day. It should be noted that molasses was selected as the electron donor at this site due to its cost. The price for organic carbon in the form of molasses is only $0.2 per lb; making reagent costs a relatively small portion of the operation and maintenance (O&M) fees. Current O&M consists of a molasses delivery about once per month (1,000 liters). Molasses is pumped from a delivery truck into a piping vault installed on the side of the building up into the holding tank in the treatment building. The temperature of the molasses is checked during the winter and summer to ensure that the viscosity of the molasses is low enough to allow for mixing, and not hot enough to promote extreme fermentation prior to injection. The tankage in the treatment building is also checked for biofilms, which are removed as necessary (approximately quarterly). The most significant form of O&M has been related to the valves on the injection points. The system was shut down for 3 weeks in the first year of operation and a month in the second year due to degradation of the rubber seals in each solenoid valve at each of the injection points. These valves have since been replaced with VitonTM seals, which has corrected the problem. Quarterly groundwater monitoring is also part of the O&M.

X X X X X X X
19
Results and Discussion
Low-flow (micro purge) groundwater sampling methods are used at the site to collect VOCs and sensitive biogeochemical parameters. Baseline sampling was performed in October 1997. The baseline analysis indicated that anaerobic and reducing conditions were present downgradient of the building expansion and transitional conditions were present below the building expansion. The anaerobic and reducing conditions were attributed to the comingling of the chlorinated VOC plume with a plume of dissolved petroleum hydrocarbons. The presence of TCE degradation products [cis-1, 2-dichloroethene (DCE), vinyl chloride (VC), and ethene] indicated that some microbial degradation was occurring in the natural environment. However, the biogeochemical environment observed below the building expansion was transitional (nitrate to iron reducing) and not strongly reducing enough to enable the complete dechlorination of the target VOCs (Table A-2a, A-2b). Low levels of nitrate and oxygen were still present in the impacted groundwater at the site. Table A-2a. Summary of Biogeochemical Data (Baseline; Min/Max)
DO ORP pH Nitrate Sulfate Sulfide Chloride (mg/L) (mV) (s.u.) (mg/L) (mg/L) (mg/L) (mg/L) Within Plume
3.68 4.80
37 76
6.63 6.81
0.6 0.7
160 210
2.4 3.0
59.5 80
Distal Plume
3.7 4.9
-66 -123
7.1 7.8
0.2 0.6
190 210
2.2 2.4
58.5 67
Table A-2b. Summary of CVOCs, TOC and Degradation Products (Baseline; Min/Max)
TCE c-DCE VC Ethene Ethane TOC CO2 Methane (mg/L) (mg/L) (mg/L) (mg/L) (mg/L) (mg/L) (mg/L) (mg/L) Within Plume
1.9 22
2.8 12
0.06 0.45
<0.001 0.002
0.007 0.01
8.6 14.5
8.9 10.5
0.078 0.143
Distal Plume
7.7 12
6.4 12
0.13 0.3.
<0.001 0.002
0.003 0.006
13.9 14.4
1.4 14.3
0.035 0.068
Table A-3a. Summary of Post Treatment Biogeochemical Data (Min/Max)
DO ORP pH Nitrate Sulfate Sulfide Chloride (mg/L) (mV) (s.u.) (mg/L) (mg/L) (mg/L) (mg/L) Within Plume
0.02 0.32
-113 -178
6.95 7.1
Nd (<0.3) 0.9
33 124
0.03 0.04
74 157
Distal Plume
0.01 0.26
-62 -98
6.95 7.15
0.7 3.5
38 107
0.03 0.04
79 102
Table A-3b. Summary of CVOCs, TOC and Degradation Products (Post Treatment; Min/Max)
TCE c-DCE VC Ethene Ethane TOC Methane

X X X X X X X
20
(mg/L) (mg/L) (mg/L) (mg/L) (mg/L) (mg/L) (mg/L) Within Plume
0.003 0.014
0.056 20.8
0.009 4.5
<0.001 1.1
0.008 0.08
8 11
0.03 3.3
Distal Plume
0.002 0.003
0.164 0.370
0.303 0.514
0.31 0.78
0.037 0.17
8 9
3.4 4.2

X X X X X X X
21
Twelve rounds of monitoring have been completed at the site since the system was initiated. Tables A-3a and A-3b summarize the ranges of various indicator parameters and VOCs that are present in the groundwater after two years of operation. It should be noted that even though 15,000 lbs of organic carbon were delivered to the groundwater environment during this period, individual TOC measurements at monitoring wells located between and downgradient of the injection points have remained similar to baseline measurements. This is significant, because TCE has been reduced from approximately 20 mg/L to 0.014 mg/L, without the relatively large carbon dosing employed at most IRZ sites. The accumulation of cis DCE and VC is being observed, however ethene detected in the mg/L range show that the solvents are being degraded to completion. Dissolved oxygen levels were significantly reduced throughout the entire treatment area footprint. Increases in iron, and decreases in nitrates and sulfates also indicate that a reducing environment was created at the site. Groundwater pH remained relatively neutral throughout the treatment process, indicating that the aquifer system contained sufficient buffering capacity. The TOC loading was low enough to avoid the extreme fermentation and by product formation that has been observed at some sites.
Summary and Conclusions
Operation of the molasses injection system has established anaerobic and reducing conditions and promoted the complete reductive dechlorination of TCE to ethene at the England Site. The increased rate of attenuation decreased the ratio of TCE to daughter products, and reduced overall VOC mass below the building expansion. First order degradation rates calculated from two years of operational data indicate an average post treatment half life for TCE of 79 days and a half life for cis DCE of 200 days (see Figure A-5). Half lives as low as 14 days have been observed for TCE at other ERD sites, however given the caution employed here in dosing due to vapor concerns, the England rates are acceptable. The plume has not moved outside of the treatment area and an increase in TOC dosing is expected to help increase the rates of treatment for DCE and VC in the future.
A-2.4 Dry Cleaner Wisconsin
ARCADIS utilized its in-situ enhanced reductive dechlorination (ERD) process to treat groundwater impacted with tetrachloroethylene (PCE) and its daughter products at a former dry cleaning facility located in Wisconsin. A dilute molasses solution was utilized as the electron donor. The use of a full-scale ERD approach at this site resulted in complete PCE degradation and conversion to innocuous end products in less than a two-year time frame. Regulatory closure was achieved in less than 2.5 years after initiating treatment. Prior to implementing the ERD process, the source of PCE that caused site groundwater contamination at the former dry cleaning facility was effectively removed through soil excavation and off-site disposal. Twenty months after implementing the ERD process, PCE concentrations within the plume decreased from pre-remediation levels of approximately 1,500 to 4,000 micrograms per liter (µg/L) to non-detectable levels. As expected, there was a corresponding increase in cis-1,2-dichlorethylene (DCE) and vinyl chloride (VC) concentrations, which occurred in conjunction with the decrease in PCE concentrations. The corresponding build-up of DCE and vinyl chloride peaked at approximately 6 and 14 months, respectively, after initiating the ERD process. The DCE and vinyl chloride levels then dropped sharply over the next 6 months. ethene and ethane levels increased over two orders of magnitude (exceeding 400 µg/L) in conjunction with the decreasing concentrations of DCE and vinyl chloride.

X X X X X X X
22
y = 1486.9e-0.0033x
R2 = 0.8469
y = 184.58e-0.0036x
R2 = 0.5658
y = 19.095e-0.0019x
R2 = 0.1905
1
10
100
1000
10000
0 200 400 600 800 1000 1200 1400
Time (days)
Log
Con
cent
ratio
n (u
g/L)
TCEcis-1,2-DCEVCExpon. (cis-1,2-DCE)Expon. (TCE)Expon. (VC)
Figure A-5. CVOC Trends and Rate Calculations for One Well
This project demonstrates that source removal and proper implementation of the ERD process can greatly expedite the remediation time frame for PCE contaminated groundwater. Twenty months after implementing the ERD process, PCE concentrations within the plume decreased from pre-remediation levels of approximately 1,500 to 4,000 µg/L to non-detectable levels. Based on stoichiometric relationships, it is estimated that more than 90% of the PCE was degraded to ethene and ethane within the 20-month period. Regulatory approval for site closure was received in January 2001, less than 2½ years after initiating the ERD process.
Background
Prior to 1998, the former dry cleaning facility was part of a dilapidated retail center. This property was redeveloped concurrently with the site remediation activities. Contamination at the site resulted from historic releases of PCE, a common dry cleaning solvent, from a dry cleaning facility that operated within the former retail center. A soil remediation program was completed in August 1998 and involved the excavation and off-site disposal of approximately 3,125 tons (3 million kg) of PCE-impacted soils. The excavation extended down to the water table, which was even with the top of a saturated sand seam at a depth of approximately 14 ft (4.3 m) below initial grade. In order to maintain suitable conditions for backfilling and to achieve additional contaminant mass removal, provisions were included for the temporary recovery of groundwater from the base of the excavation. Approximately 88,375 gallons (335,000 L) of water

X X X X X X X
23
were pumped from the excavation and discharged to the sanitary sewer in August 1998. It is estimated that approximately 25,000 gal (95,000L) of this volume was attributable to precipitation or surface water run-in that accumulated in the excavation, and the remainder was groundwater recovered from the sand seam that was penetrated by the deep excavation. The lateral and vertical extent of affected groundwater was defined, and was approx. 30,000 square ft (3,000 m2) in plan size, extending to a depth of approx. 20 ft (6 m) below grade. The investigation results suggested that the affected groundwater had spread laterally from the source area primarily through a 2 to 5 ft (0.6 to 1.5 m) thick silt and sand seam that is approx. 13 to 18 ft (4 to 5.5 m) below grade. Within this seam, the extent of impacted groundwater was estimated to be 150 feet (45 m) in width by 200 feet (60 m) in length.
Approach
The groundwater remediation process involved the periodic injection of an organic carbon (molasses) solution to enhance the reductive dechlorination of the chlorinated solvents present in site groundwater (i.e. an in-situ bioremediation process). By injecting an organic carbon source, anaerobic and strong reducing conditions were created within the in-situ reaction zone.
Materials and Methods
Following completion of the soil excavation activities, the groundwater remediation program was implemented at the site. An initial injection event was conducted in August and September 1998, using 182 temporary Geoprobe® injection points. The Geoprobes® were advanced in a grid-like pattern across the groundwater target area. The spacing between each Geoprobe® was approximately 10 ft (3 m). The borings were advanced to intersect the sand seam ranging from 13 to 18 feet (4 - 5.5 m) below ground surface. The temporary injection wells were constructed of 1-inch (2.54-cm) diameter PVC pipe for the well screen and riser. Bentonite pellets were used to seal the temporary wells. Edible blackstrap molasses was used for the initial injection. The edible blackstrap molasses is approximately 47% carbohydrates by weight. The molasses solution was mixed in a plastic tank on site using potable water. Approximately 15 to 25 gallons (57 to 95 L) of the dilute molasses solution [the dilution ratio was 25 gallons (95 L) of water to each gallon (3.8 L) of molasses] were injected into each temporary well using a grout pump. Approximately 3,200 gal (12,000 L) of the dilute molasses solution were injected into the temporary injection points over 11 days. A permanent injection system was installed concurrently with the initial injection event. Twelve fixed injection wells were installed at the site using conventional hollow-stem auger drilling techniques [4¼-inch (0.11 meter) inside diameter augers]. The fixed injection wells consisted of a 2-inch (5-cm) diameter Schedule 40 PVC riser with a 2-inch (5-cm) diameter Schedule 40 PVC well screen. Each injection well screen consisted of a 5-foot (1.5 meter) length of 0.010-inch (0.25 mm) slotted well screen placed to intersect the sand seam approximately 13 to 18 ft (4 to 5.5 m) below ground surface. The annular space between the well screen and borehole was filled with a clean silica sand filter pack from the bottom of the boring to one foot above the top of the screen. Approximately 1 ft (0.3 m) of fine sand was placed above the filter pack, and a bentonite seal was installed to the depth where the conveyance piping would be connected to the well. To facilitate the redevelopment at the site, the injection wells were cut off approximately 6 ft (1.8 m) below ground surface and connected to 1-inch (2.54 cm) high-density polyethylene (HDPE) buried conveyance piping.

X X X X X X X
24
A network of 1-inch (2.54-cm) HDPE conveyance piping was installed below grade between the injection equipment building and the permanent injection wells. The remedial system equipment was housed within a small heated and insulated building. The remedial equipment included a 250-gallon (946 liters) plastic mix tank, a piping manifold, and 1/3 horsepower (0.25 kW) rotary gear pump. After the fixed injection system was installed, four additional injection events were completed at the site. The molasses solution was added to the mix tank and pumped through the manifold to the injection wells at a dilution ratio of 25 gal (95 L) of water to each gallon (3.8 L) of molasses. The molasses used for the permanent injection wells was a low-sulfur, cane juice molasses that contained approximately 66% carbohydrates by weight. A total of 2,985 gallons (11,300 L) of the molasses solution was injected into the aquifer through the permanent injection wells during the four injection events completed over a six-month period from March 1999 to September 1999. The quantity of the dilute molasses solution injected into the aquifer and the timing of each event was determined based on changes in biodegradation indicator parameters and the rate of reductive dechlorination determined from the groundwater monitoring data collected over time from the site monitoring well network. The optimum values for groundwater indicator parameters for the ERD process included an oxidation-reduction potential of less than –200 mV, total organic carbon in the range of 25-100 mg/L, and a pH above 5. Due to site redevelopment activities occurring concurrently with the groundwater remediation, post-injection groundwater monitoring did not begin until 6 months following the initial injection event. The site monitoring well network consisted of four monitoring wells within the limits of the plume and eight monitoring wells located outside of the plume.
Results
Six rounds of groundwater sampling were completed from February 1999 to April 2000 following implementation of groundwater remediation at the site. Over the 20-month period following completion of soil remediation activities and the initial carbon injection event (August 1998), PCE concentrations within the plume decreased to non-detectable levels (April 2000). As expected, a temporary increase in DCE and VC concentrations occurred in conjunction with the decrease in PCE concentrations. The corresponding build-up of DCE and VC peaked at approximately 6 and 14 months, respectively, after initiating the ERD process. The DCE and VC levels then dropped sharply over the next six months. A buildup of the non-toxic, innocuous end products of the reductive dechlorination process (e.g., ethene, ethane, carbon dioxide) indicated that the source PCE was being completely transformed. The monitoring data collected indicated significant production of ethene and ethane within the groundwater plume. ethene and ethane concentrations in the four monitoring wells within the plume were detected approximately one to two orders of magnitude higher than the ethene and ethane levels measured in the monitoring wells located along the fringe of the plume. This was clear evidence that the reductive dechlorination process was going to completion. Based on the use of first-order degradation kinetics, the biodegradation rates for the chlorinated constituents at the site can be determined (U.S. EPA 1998). Table A-4 lists the average site-specific biodegradation rates determined from the collected data for each of the monitoring wells within the groundwater plume. The site-specific biodegradation rates are approximately two to eight times higher than average published biodegradation rates under natural conditions (U.S. EPA 1998). This demonstrates that the ERD process can greatly accelerate biodegradation rates. Note that the total molasses solution injected was only approximately two percent of the total volume of groundwater in the target area, indicating that dilution effects on the observed rates were minimal.

X X X X X X X
25
Table A-4. Calculated Site Biodegradation Rates (day-1)
Monitoring Well Compound MW-13 MW-14 MW-15 MW-16 PCE Not applicable 0.027 Not applicable 0.021
TCE 0.011 0.005 Not applicable 0.023
DCE 0.010 0.004 0.011 0.017
VC 0.015 0.003 0.011 0.018
Changes in the molar concentration over time of the parent compound (PCE) and its daughter products (TCE, DCE, VC, ethene, ethane) are presented in Figure A-6 for one of the monitoring wells located within the plume. This data illustrates that within 6 months of implementing the ERD process, over 90% of the PCE was degraded to DCE. In addition, within 20 months of initiating the ERD process, over 90% of the PCE in the groundwater plume was degraded to ethene and ethane.
Figure A-6. Changes in the Molar Concentration Over Time of the Parent Compound (PCE) and its Daughter Products (TCE, DCE, VC, ethene, ethane)
Time (days following initial injection)
MolarConcentration
µmole/L
0
5
10
15
20
25
30
1 192 262 338 428 519 603
EthaneEtheneVCDCETCEPCE
PCE TCE DCE VC Ethene Ethane

X X X X X X X
26
A-2.5 Chemical Manufacturer, Eastern Pennsylvania
A dilute molasses solution (consisting of readily degradable carbohydrates) was used to modify biogeochemical conditions in a shallow groundwater system as part of a voluntary cleanup program at a chemical manufacturing site, located in Eastern Pennsylvania. The primary constituents of concern (COCs) at the site include trichloroethene (TCE) and its degradation daughter products, including cis-1, 2-dichloroethene (DCE) and vinyl chloride (VC), as well as dissolved nickel. Based on the results of a preliminary natural attenuation evaluation, an IRZ approach designed by ARCADIS was implemented at the site and reagent injections were conducted for a period of two years. The application of the IRZ technology at the site has resulted in the reduction of constituent concentrations in site groundwater to levels below the applicable health standards for all site COCs, including chlorinated VOCs and nickel. Furthermore, the application of IRZ technology provided the basis to shutdown a maintenance-intensive and expensive groundwater extraction and treatment system. A network of nine monitoring wells installed at the site has been periodically sampled since the early 1980s when investigation activities commenced at the site. Groundwater sampling activities at the site indicated that low levels of chlorinated VOCs and nickel were present in site groundwater at concentrations exceeding of the Pennsylvania Department of Environmental Protection (PADEP) “Used Aquifer” groundwater health standards. A groundwater extraction and treatment system was operated at the site for over 10 years and although COC concentrations in groundwater had been reduced over this period of time, the system was unable to achieve the closure goals established for the site. The results of a natural attenuation evaluation for groundwater suggested that natural attenuation of VOCs and metals was occurring in the groundwater underlying the site. However, the analysis also indicated that the rate of attenuation was limited based on the presence of only slightly anaerobic and reducing conditions, as well as the absence of sufficient sulfide and organic carbon required to support further degradation of the site COCs. Therefore, the chemical manufacturer entered into a voluntary remediation program at the site using an in-situ reactive zone (IRZ) approach.
Background
The geology underlying the site consists of varying amounts of fill material, underlain by clayey-sandy silt. Shale and sandstone bedrock of the Upper Triassic Stockton Formation was encountered at a depth of approximately 12 feet bgs. A total of nine monitoring wells are currently installed on-site, eight of which screened through the upper zone. The upper zone consists of fill, a sandy silt/clay layer, and varying amounts of weathered sandstones and shales, and a single groundwater monitoring well installed into bedrock. Groundwater has historically been encountered at depths of approximately 2 to 11 feet bls. Groundwater flow at the site is generally to the south, towards a nearby creek, with a southeasterly component along the southern property boundary. Historical investigation activities dating back to 1982 indicated the presence of dissolved metals and chlorinated VOCs in the groundwater underlying the site. A baseline groundwater-sampling event was conducted at the site in April 1998 in order to conduct the natural attenuation evaluation and to determine the initial groundwater conditions prior to the implementation of a remedial strategy at the site. Groundwater samples were collected from five of the on-site monitoring wells and analyzed for dissolved metals, VOCs, and a suite of natural attenuation parameters. Dissolved metals historically detected in site groundwater included nickel, zinc, and low levels of chromium. Nickel was the only metal detected at concentrations in excedance of the statewide health standard (100 µg/L). Dissolved nickel concentrations

X X X X X X X
27
from the baseline groundwater sampling event ranged from non-detectable levels (< 20 µg/L) to 410 µg/L in different wells. Chlorinated VOCs detected in site groundwater included TCE, DCE, 1,2-dichloroethane (1,2-DCA), and chloroform. Although each of these compounds was retained as a site-specific COC, TCE was established as the primary focus of the remedial activities at the site and was the only VOC detected at concentrations in exceedance of the statewide health standard (5 µg/L). Specifically, TCE was detected at concentrations ranging from non-detect (< 1.0 µg/L) to 21 µg/L at different wells. Nickel can be precipitated in reduced to slightly oxidized conditions as a carbonate (in geochemical environmental systems with carbonate), or as a sulfide in systems lacking carbonate (Allen et. al., 1993). The solubility product (Ksp) value for nickel carbonate (NiCO3) is 1.42 x 10⁻⁷, which indicates limited solubility (Lides 1992). The Ksp value of nickel sulfide (NiS) is 1.07 x 10⁻²¹, which indicates very little solubility and is the same general order of magnitude as most stable metallic sulfides (Lides 1992). Sulfide precipitation, which can only take place in a reduced environment, is the most efficient process as evidenced by Ksp values.
Summary of Remedial Activities
A baseline groundwater-sampling event was conducted at the site in April 1998 in order to conduct the natural attenuation evaluation and to determine the initial groundwater conditions, prior to the implementation of a remedial strategy at the site. Groundwater samples were collected from five of the on-site monitoring wells and analyzed for VOCs, dissolved metals, and a suite of natural attenuation parameters, including total and dissolved iron, total and dissolved manganese, alkalinity, nitrate, nitrite, nitrogen, sulfate, sulfide, chloride, methane, ethene, ethane, carbon dioxide, BOD, total organic carbon (TOC), dissolved organic carbon (DOC), and ammonia. Additionally, field parameters, including DO, ORP, pH, specific conductance, and temperature, were collected in the field during the sampling activities. An evaluation of the baseline sampling results indicated that anaerobic and reducing conditions (DO less than 1.0 mg/L and ORP less than 0 mV) were initially observed in portions of the site in the vicinity of monitoring well B-9, while more transitional (i.e. DO less than 1.0 mg/L and ORP greater than 0 mV) and aerobic/oxidizing (i.e. DO greater than 1.0 mg/L and ORP greater that 0 mV) conditions were initially observed in the remaining portions of the site. Evidence of naturally occurring degradation included the presence of cis-1, 2-dichloroethene (DCE), a daughter product resulting from the degradation of trichloroethene (TCE), depletion of nitrate in the “source” area, presence of sulfide (reduced form of sulfate), and elevated levels of carbon dioxide. Based on these observations, an enhanced bioremediation approach was implemented to address the remaining impacts in site groundwater. Reagent injections commenced in March 1999 and continued through April 2001. In an effort to cost-effectively implement the IRZ program at the site, injections were conducted using on-site facility personnel and equipment under our direction. Each injection event consisted of the addition of approximately 10 to 20 gallons of a dilute solution of food-grade blackstrap molasses and potable water to each of the five injection wells. Injection strengths, frequencies, and volumes were adjusted throughout the remediation program, based on the results of field monitoring and interim groundwater sampling. Additional modifications to the injection plan included occasional injections of strictly potable water in order to regulate the organic carbon loading and to maintain the desired groundwater pH. Following the onset of injections at the site, an interim monitoring program was implemented to evaluate the development of a reactive zone and the effects of the IRZ on constituent concentrations in

X X X X X X X
28
groundwater. The first two interim reduced field-monitoring events, which included the collection of DO, ORP, and pH measurements, were conducted in July and December 1999. Subsequently, monitoring events consisting of a full suite of VOCs, dissolved metals, field parameters, dissolved gases, and biogeochemical parameters were conducted in April 2000 and May 2001.
Results and Conclusion
The initial baseline groundwater conditions, prior to the implementation of the IRZ technology at the site, indicated that low levels of chlorinated VOCs and nickel were present in site groundwater, with exceedances of the PADEP used aquifer groundwater health standards reported at three site wells. Concentrations exceeding the PADEP health standard for TCE (5 µg/L) ranged from 13 µg/L to 21 µg/L at different wells, while concentrations exceeding the PADEP health standard for dissolved nickel (100 µg/L) ranged from 300 µg/L to 410 µg/L at two wells. Constituent concentrations in the remaining site wells were all below the applicable PADEP standards. As previously stated, reagent injections commenced at the site in March 1999 and were conducted for a period of approximately two years. Anaerobic and reducing conditions were created and maintained throughout the IRZ program in each of the targeted site wells, with DO concentrations ranging from 0 mg/L to 0.6 mg/L and ORP ranging from –40 mV to –190 mV during the IRZ program. Dissolved gas concentrations, including ethane, ethene, and carbon dioxide, typically increased with time as the IRZ was established across the site, indicating the degradation of chlorinated VOCs in site groundwater (see Figure A-7).

X X X X X X X
29
Figure A-7. Degradation of chlorinated VOCs in site groundwater Constituent concentrations have declined steadily since the IRZ program was implemented at the site, and currently all constituents analyzed (including TCE and nickel) are below the applicable PADEP standards. TCE concentrations have significantly decreased in three wells, which previously had concentrations exceeding the applicable groundwater criteria. Specifically, TCE decreased from 18 µg/L to 2.8 µg/L, from 21 µg/L to 4.3 µg/L, and from 13 µg/L to 3.3 µg/L in three different wells The voluntary remediation activities conducted at the site have resulted in a reduction in groundwater concentrations to levels below the applicable PADEP health standards for the entire suite of site COCs, including chlorinated VOCs and nickel, through the implementation of an IRZ. Furthermore, the implementation of an IRZ technology at the site facilitated the shut-down of a costly pump and treat system that was previously unable to achieve the site remediation goals.
A-2.6 Industrial Laundry/Dry Cleaning Facility, Eastern Pennsylvania
ARCADIS was retained in June 1999 to assist a former dry cleaning facility in addressing soil and groundwater impacted with tetrachloroethene (PCE). A soil vapor extraction system (SVE) was applied to the source area as a short term mass removal approach, while an in-situ enhanced reductive dechlorination (ERD) technique was applied as a containment remedy for the dissolved plume in the downgradient area of the site. The SVE system operated for 12 months and was recently decommissioned in February 2002. The SVE was successful in removing the source material, as evidenced by a significant decrease in PCE observed in groundwater near the source (from 46 mg/L to 5 mg/L). The ERD injection system was installed concurrently with the upgradient SVE system and has operated at the site for 12 months. The ERD injection points were installed in an area between 120 and 180 feet downgradient of the SVE. PCE concentrations in the downgradient monitoring wells have shown a decrease from 5.3 mg/L to 0.1 mg/L over this time period. The trends observed in downgradient
0
50
100
150
200
250
300
350
400
450
Jan-98 Ju l-98 Feb-99 Aug-99 M ar-00 O ct-00 Apr-01 Nov-01Tim e
TCE
and
Nic
kel
0
50
100
150
200
250
300
350
400
450
Ethe
ne, E
than
e, a
nd C
arbo
n D
ioxi
de
Trich loroethene (ug/L) D issolved N icke l (ug/L) E thene (ng/L) E thane (ng/L) C arbon D ioxide (m g/L)

X X X X X X X
30
monitoring wells are attributable to the implementation of ERD, given the distance (and travel time) from the upgradient SVE and also the complete transformation of PCE that has been observed in groundwater in this portion of the site. Temporal increases in daughter products, and an overall increase in ethene and ethane indicate that the ERD is effective in the complete destruction of PCE and its daughter products at this site. The ERD system is currently being expanded into the source area to remove the residual PCE that is present in this area. The downgradient ERD system will continue to be operated for another 12 to 15 months. The following sections provide more detail on the background, rationale and details regarding the implementation of groundwater remediation at this site.
Background
The site was originally developed in the mid-1960’s, and was operated as an industrial laundry/dry cleaning facility through the end of 1999. The historical dry cleaning operations resulted in the release of tetrachloroethene (PCE) into the soil and groundwater beneath the building. The site occupies approximately 1.6 acres in an industrial park in Eastern Pennsylvania. A single building occupies approximately 23,000 square feet of the site, with the balance covered by asphalt paving. The geology at the site consists of primarily alluvial overburden deposits. A layer of silt and silty-sand extends to an average depth of approximately six feet below land surface (feet bls). This overlies a more permeable layer of sand and gravel, which coarsens downward to a depth of at least 30 feet bls. Groundwater at the site flows to the south-southwest and occurs under unconfined (water table) conditions at depths ranging between 2 and 6 feet bls. A short-term pumping test was initially utilized to derive a hydraulic conductivity (K) value for the sand and gravel layer at the site. The results of the pumping test indicate a K value of approximately 50 ft/day for the sand and gravel, which corresponds to a seepage velocity of approximately 180 feet per year. Movement of the CVOCs, would be expected to be retarded by up to 50% of the calculated seepage velocities. PCE was delineated in soil and determined to cover approximately 10,000 square feet beneath the eastern portion of the site building, [ranging up to 350 milligrams per kilogram (mg/kg)]. Maximum concentrations of PCE in groundwater were observed at approximately 46 milligrams per liter (mg/L) in the area of the soil impacts. We were retained in the spring of 1999 to address the soil and groundwater impacts observed during the previous site investigations. This site is being investigated and remediated under the provisions of ACT 2 with the Pennsylvania Department of Environmental Protection (PADEP). Based on the results of the site investigations and the geology present at the site, we proposed active remediation of the source area soil using soil vapor extraction (SVE) and remediation of the groundwater at the downgradient portion of the plume using enhanced reductive dechlorination (ERD). In addition, ERD was proposed for the treatment of groundwater in the source area, upon completion of the SVE.
ERD Implementation
The ERD well network was set up across the downgradient portion of the Site. The network includes five injection wells positioned on 40-foot centers. This initial spacing assumes that each injection well has a 20-foot effective radius of coverage (provisions were made to add additional injection wells pending the results of downgradient monitoring). During installation of three wells, a lens of tight clay was encountered, which necessitated the replacement of one of the wells with a new injection point. All but one injection well were completed to a total depth of approximately 25 feet bls with a screened interval from 5 to 25 feet bls. This depth interval was selected based on the vertical distribution of dissolved PCE

X X X X X X X
31
concentrations detected during the previous site investigations. Also four monitoring wells were positioned downgradient of the injection wells. ERD injections were initiated on January 3, 2001. Injections were completed in batches using a 210-gallon polyethylene pickup tank and a 3.5-horsepower engine driven centrifugal transfer pump. The injections involved the delivery of a dilute solution of molasses and potable water to the subsurface to enhance biodegradation of the PCE. Prior to each injection event, the depth to water and pH were recorded at each injection well. The depth to water measurements were collected to verify that the injections were not creating mounding of the water table and disrupting the natural groundwater flow pattern. The water: molasses ratio was adjusted to prevent the pH from dipping below 5 standard units (SU). ERD performance is generally demonstrated through groundwater monitoring. The performance monitoring included “full” events involving measurement of field parameters, laboratory analysis for VOCs, and laboratory analysis for a suite of geochemical parameters; and “interim” events involving measurement of field parameters and a limited suite of laboratory parameters. The data collected from performance monitoring events was compared to a baseline and evaluated against remedial objectives for the Site. The data collected during the baseline and subsequent groundwater sampling events was evaluated to determine whether the ERD technology was performing as intended. The main objectives of implementing ERD at the site were twofold: (1) to successfully establish an anaerobic and reducing in-situ reactive zone (IRZ) evident by declining dissolved oxygen (DO) concentrations, declining Oxidation-Reduction Potential (ORP), and an increase in total organic carbon (TOC) at the observation wells; and (2) to document successful in-situ transformation of PCE into progressively less chlorinated intermediates (such as DCE and VC) and degradation end products (ethene, ethane, and carbon dioxide). Based on the data collected during performance monitoring events, the main ERD performance objectives have been successfully achieved. The key observations that can be made from the monitoring well data are as follows:
• Following initiation of the ERD injections in January 2001, DO levels in the downgradient monitoring wells decreased. This indicates that microbes in the site subsurface are metabolizing excess organic carbon at a rate greater than the natural recharge of dissolved oxygen. Consequently, a similar decrease in ORP was observed as the microbes began to utilize alternative electron acceptors, such as ferric iron (Fe3+), to support respiration. Figure A-8 depicts DO and ORP trends along with ferrous iron (Fe2+) concentration trends at one monitoring well located downgradient of the center of the ERD injection area
• Evidence of the successful transformation of PCE into progressively less chlorinated intermediates and degradation end products is also apparent. As an example, CVOC concentration trends observed at the aforementioned monitoring well over the duration of the pilot test are presented in (Figure A-9). The trends show a significant drop in PCE and TCE concentrations within the first two months of ERD injections. Given the travel time between the upgradient SVE area and the downgradient ERD area, these changes in concentration would not be attributable to upgradient source removal. Further evidence of degradation is provided by the sharp increase in DCE concentrations observed in these first two months, with DCE peaking at approximately 11,000 µg/L before decreasing to below 2,000 µg/L in the last few months. A similar rise and fall of VC was observed at much lower concentrations. Concentrations of ethene and ethane (final degradation end-products) increased in

X X X X X X X
32
most of the downgradient observation wells, in some cases up to an order of magnitude. These trends are typical of the complete enhanced reductive dechlorination process in the presence of a fully developed anaerobic and reducing IRZ
Dramatic reductions in PCE and TCE concentrations across the site were reported. Specifically, the maximum PCE and TCE concentrations observed in groundwater during the baseline (pre treatment) sampling event were 46,000 µg/L and 3,400 µg/L, respectively in one well. After approximately 12 months of system operation, the maximum PCE and TCE concentrations observed were 4,800 µg/L in this well and 270 µg/L in one monitoring well, respectively. In addition, three of sixteen wells sampled during the November 2001 monitoring event were below the PADEP Act 2 Statewide health standard for PCE (5 µg/L) and five were below the TCE standard (5 µg/L). The system is currently being expanded into the source area for treatment of the residual chlorinated VOCs that remain in this area. The downgradient system is also expected to continue to be operated for an additional 12 months.
A-2.7 Chlorinated Solvent and Uranium Processing Facility, Eastern U.S.
ARCADIS was retained by a major uranium processing facility to evaluate, design, and implement an innovative remedy to remediate chlorinated solvent and uranium impacts in groundwater. The technology that was selected was in-situ bioremediation via enhanced reductive dechlorination and precipitation ERDP). A field-scale pilot was implemented in the fall of 2000 to determine the treatment efficacy of the in-situ bioremediation technology.

X X X X X X X
33
Figure A-8. Summary of Groundwater Analytical Data MW-4
Figure A-9. Summary of Groundwater Analytical Data MW-4
0
2,000
4,000
6,000
8,000
10,000
12,000
9/27/0 0 2/7 /01 4 /19/01 5 /22/0 1 8/22/0 1 11 /27/0 1 2 /12/02
Dat e
0
10 0,0 00
20 0,0 00
30 0,0 00
40 0,0 00
50 0,0 00
60 0,0 00
70 0,0 00
80 0,0 00
PCETCE
DCEVC
Ethene
Ethane
0.00
2.00
4.00
6.00
8.00
10.00
12.00
14.00
09/27/00 02/07/01 04/19/01 05/22/01 08/22/01 11/27/01 02/12/02
Date
DO
and
Fer
rous
Iron
Con
cent
ratio
n (m
g/L)
-160
-140
-120
-100
-80
-60
-40
-20
0
OR
P(m
V)
Ferrous IronDOORP

X X X X X X X
34
The pilot test used ERDP technology for remediation of chlorinated volatile organic compounds (CVOCs), uranium, and tributyl phosphate (TBP) for a six-month period at the active facility located in the Eastern United Sates. IRZ effectiveness was evaluated through field and laboratory biogeochemical, and end product analyses to determine the progress, degree, and dominant remedial processes of reductive dechlorination of CVOCs, and reductive precipitation and immobilization of the uranium in a transmissive saturated zone. Results of the ERDP pilot test showed an 80 percent reduction in CVOC concentrations and greater than 65 percent reduction in uranium concentrations in the pilot test area. The system was reinitiated as an interim action in June 2001. Design of a full-scale approach has recently been completed and the full-scale system is expected to be operational sometime during the summer of 2002. The following sections provide additional background information on the site, technical rationale on our approach and also the results from the field study.
Background
The Uranium Processing Facility has been operating since the late 1950’s. The facility covers approximately 64 acres in a mountainous region of East Tennessee. The site is located within an alluvial valley and is underlain by 0 to 30 feet of unconsolidated silt, clay, clayey sand and gravel and cobble alluvium. The alluvium coarsens with depth into cobbles and boulders. This cobble/boulder zone overlies weathered, fractured bedrock consisting of steeply dipping beds of shale or shale interbedded with dolomite and siltstone. Hydraulic conductivities for the deeper alluvium and shale bedrock are approximately 12 and 8 ft/day, respectively. Historical activities at the site resulted in the release of uranium and PCE to the groundwater. The size of the PCE plume that exceeds the National Drinking Water Maximum Contaminant Level (MCL = 0.005 mg/L) is approximately 19 acres (1200 by 700 feet). PCE concentrations in the plume range from approximately 0.005 to 14 mg/L. Associated PCE degradation products are also present in portions of the plume. The uranium groundwater plume which exceeds the USEPA proposed MCL (30 pCi/L) is about 0.7 acre (250 by 120 feet). Uranium concentrations range from approximately 30 to 1,100 pCi/L. The Uranium Processing Facility is both controlling and remediating groundwater contamination at its production facility in Eastern Tennessee. Multiple source removals and groundwater remediations are being performed in accordance with requirements of the Nuclear Regulatory Commission (NRC), the U.S. Environmental Protection Agency (USEPA), and the State of Tennessee Department of Environment and Conservation (TDEC). Pursuant to its EPA HSWA Permit issued in the early 1990s, the facility has completed the RCRA Facility Investigation (RFI) and Corrective Measures Study (CMS). A groundwater risk assessment indicated no further action was warranted on the basis of current exposure scenarios, however, the Facility plans to remediate groundwater to reduce the uranium and PCE concentrations, contain migration and ensure that any potential dose from groundwater is as low as reasonably achievable (ALARA).
Approach
As part of the CMS, the Facility conducted a remedial alternative analysis (RAA) to select an appropriate technology for controlling and/or remediating groundwater. The RAA identified ERDP as the selected technology. This technology has been used successfully to remediate PCE and chromium at other sites,

X X X X X X X
35
however, this is the first time the technology had been tested to remediate dissolved uranium. The technology involves the enhancement of in-situ biological degradation and precipitation of the metals of concern (MOC) by supplying an additional organic carbon source (molasses) as an energy substrate to the previously existing bacteria within the groundwater environment. The addition of organic carbon to the groundwater expedites oxygen depletion creating strongly reducing conditions conducive to the degradation of the PCE by reductive dechlorination and the immobilization of the dissolved uranium as a low solubility precipitate. Under established anaerobic conditions, it was anticipated that the induced anaerobic conditions would: 1) degrade CVOCs completely to ethane/ethene daughter products; and 2) precipitate the uranium through reduction by ferrous iron into an oxide, contact with hydrogen sulfide gas into a sulfide, and as a hydroxide. In addition to CVOCs and uranium, the ERDP pilot test will evaluate the anaerobic biological degradation of tributyl phosphate into 1-butanol and phosphoric acid. It is anticipated that the liberated 1-butanol will be utilized by bacteria as a biomass growth substrate, and the co-released phosphate within the phosphoric acid will be coupled with the uranium and immobilized as a hydrogen uranyl phosphate.
Pilot Study Results
With an expedited approval received from the regulatory agency, we conducted a six-month pilot test at a location within the facility to determine effectiveness of the selected technology on controlling/remediating PCE and uranium in groundwater. The injection of the diluted molasses began in August 2000 and continued through January 2001. Approximately 2,270 gallons of reagent were injected throughout the six-month pilot test. The injection system was re-initiated in June 2001. Field parameters were collected prior to each injection event using a portable, down-hole multi-parameter meter. The field parameters included water level, pH, conductivity, temperature, total dissolved solids, dissolved oxygen (DO), oxidation-reduction potential (ORP), alkalinity, and ferrous iron. During the six-month test, the test wells and nearby monitoring wells were sampled and analyzed for laboratory parameters four times. A lowering of the DO and ORP values, combined with an increase in the observed ferrous iron concentrations is a good indication that a strongly reducing environment was created in the groundwater. The samples were analyzed for five CVOCs (PCE, TCE, cis and trans 1,2 DCE and VC), tributyl phosphate, total and dissolved iron and manganese, phosphate, sulfate, nitrate/nitrite, total organic carbon (TOC), dissolved organic carbon (DOC), chloride, BOD, chemical oxygen demand (COD), ammonia, total and dissolved uranium, ethene, ethane, carbon dioxide and methane. An evaluation of the field test results shows that the approach was successful: overall PCE concentrations were reduced by 83% and the dissolved uranium concentrations were reduced by 60%. As expected, the associated PCE degradation products increased during the test period due to the reductive dechlorination process. The most significant reduction occurred approximately 40 feet downgradient from the injection point where the highest levels of PCE (12.4 mg/L) were reduced to 0.083 mg/L during the six-month test (a 99% reduction). Total and dissolved uranium concentrations have decreased significantly in the pilot test area wells, and the concentrations are approaching the remediation goal of 0.030 mg/L. The highest precipitation of the dissolved uranium occurred approximately 10 feet downgradient from the injection point with a decrease in dissolved uranium from 1.5 mg/L to 0.38 mg/L (a 75% reduction). The results from the pilot test wells also showed an increasing difference between total and dissolved uranium (higher concentrations of total uranium) in the later stages of the test. This indicates that an increasing percentage of the uranium that is present in the sample is in particulate form precipitated onto suspended solids and/or immobilized and not

X X X X X X X
36
dissolved in groundwater. Tributyl phosphate concentrations have decreased in one monitoring well (when compared with August 2001 sampling results) and remain down in the other monitoring wells compared to earlier pilot test results. The anaerobic degradation of PCE and the precipitation of uranium were achieved by creating a highly anaerobic and reducing environment. Ethene concentrations measured during the latter stages of the pilot test in two separate wells were 0.630 mg/L and 0.570 mg/L, respectively. Ethene was also detected in one well (0.350 mg/L). The degradation products (most notably VC) are being quickly degraded in the regional aerobic environment, which acts as a buffer zone surrounding the test area. The facility plans to begin implementing this technology full scale and has recently completed the planning and design phase for a full-scale implementation. Additional injection wells will be installed in the second quarter of 2002, and full-scale injection activities are anticipated by midyear 2002.
A-2.8 State Voluntary Cleanup of Hexavalent Chromium and TCE
This case study involves a manufacturing facility located on the West Coast. Facility operations involved metal plating and degreasing that led to the release of hexavalent chromium and TCE into the site groundwater. The site is slightly over two acres in size. The geology is primarily silts and clays to 24 feet below land surface (bls), overlying an impermeable clay layer that serves as an aquitard. Groundwater flows at a relatively slow rate (less than 100 feet per year). The former chromium waste storage area is located near MW-13 and the former TCE degreasing area is located near the center of the plant. Historic releases lead to groundwater impacts in the forms of chromium and CAHs. The hexavalent chromium plume extends over most of the site. Initial peak hexavalent chromium concentrations in groundwater were more than 900 mg/L. The primary CAH was TCE, although degradation daughter products were also in evidence at the site, including DCE and VC. The initial maximum TCE concentrations in groundwater were approximately 24,000 µg/L, while DCE and VC concentrations were less than 500 and 100 µg/L, respectively. A pilot study was completed in a small upgradient portion of the site in 1996 in order to demonstrate the efficacy of molasses injection for the creation of a suitable reactive zone. Due to the high concentrations of hexavalent chromium, there was concern that the natural microbial population might be too stressed to adequately address the needs of creating the reactive zone necessary for groundwater treatment. In order to supplement the natural population at this site, sludge from an anaerobic sludge digester was added to the molasses/water reagent mixture used. The full-scale system was implemented after the pilot test program demonstrated that the reactive zone technology was successful.
Full-Scale Implementation and Results
Ninety-one injection points were installed to 24 feet bls at the site. Each point was 1-inch diameter with a 10-foot long, 0.010-inch slot screen. Each injection point was installed rapidly and at a relatively low cost using a direct-push approach with a GeoprobeTM drilling technique. Existing monitoring wells were used to track the progress of the treatment process.

X X X X X X X
37
Each injection point received an injection of a mixture of molasses, water and anaerobic sludge. The injections for the full-scale reactive zone at the second site were more concentrated and less frequent than at a typical site. The first, single injection took place in May 1997, while the next injection occurred approximately one year later. The theoretical groundwater flow for the site is suspected to be artificially high. Due to the site’s proximity to the Bay margin and the very dense lithology, it was suspected that, in spite of the calculated low groundwater flow rate of 100 feet per year, the actual groundwater flow rate may actually be an order of magnitude less. Transport of the reagent throughout the subsurface in an acceptable time frame using dosed injections into fewer points/wells would probably not result in an acceptable rate of remediation. In fact, monitoring wells approximately 100 feet downgradient from the on-site remediation area do not yet indicate that remediated groundwater has reached the off site wells (three years after remediation commenced). In addition, it was determined that the periodic, site-wide injection events were more cost effective for this site – a key consideration for the client. The theoretical basis for selecting both the concentration and the volume of injection was based upon the above-referenced pilot study, in which dosage concentrations and volumes were changed over time until an effective remediation environment was established at monitoring wells near the pilot study injection areas. The spacing of the injection points was likewise established from the data acquired during the pilot study, which indicated, in this lithology, a maximum 17-foot radius of influence. Figure A-10 summarizes the average chromium concentrations collected from 8 wells across the chromium plume. Hexavalent chromium concentrations have been reduced at the site from initial concentrations in the range of 66 to 140 mg/L to concentrations of 0.14 mg/L to non-detect (<0.05 mg/L). Hexavalent chromium concentrations declined at a steady rate during the period between the first and second injections and are now non-detect across the site. As the data in Figure A-10 depicts, the majority of the chromium found in groundwater was hexavalent. In the reducing conditions created by the injection of the molasses/water/sludge mixture, the hexavalent chromium was reduced to tri-valent chromium and precipitated out of solution, most likely as chromium hydroxide. The precipitate was removed by the aquifer soils. In the source area, TCE concentrations were reduced from approximately 18 mg/L to 2 mg/L, while in the mid plume area, TCE concentrations were reduced from approximately 30 mg/L to non-detect. Figure A-11 provides a summary of the data collected from MW-4 before the pilot test was initiated through March 2000. Prior to initiation of the reactive zone pilot the ratio of source CAH (i.e. TCE) to degradation product (i.e. DCE and VC) was approximately 9:1. After the first injection the concentrations of TCE initially dropped, while the concentrations of DCE and VC remained relatively unchanged. As a result, the ratio of source to daughter product declined to approximately 3:1. Prior to the first full scale injection the TCE concentrations increased again. This most likely occurred as a result of the release of microbial surfactants within the reactive zone and/or transient increases in the groundwater elevation. (Bacteria will generate surfactants in order to increase the amount of available organic carbon dissolved in the groundwater. The organic carbon must be in solution for the bacteria to metabolize the carbon.). The surfactants are non-discriminating, and thus aid in the desorption and dissolution of sorbed TCE. The resultant “spike” in TCE can be expected in some reactive zone sites. Parallel to the TCE spike is an increase in daughter products, namely DCE and VC. As a result, the ratio of source to daughter products continues to decline (less than 2:1 shortly after the first full-scale injection).

X X X X X X X
38

X X X X X X X
39
Figure A-10. Average Chromium Concentrations Over Time
Figure A-11. Average CAH Concentrations Over Time.

X X X X X X X
40
Another important observation that can be made using the data in Figure A-11 is the lag between the peaks of the source and degradation products. The peak sequence follows the sequential dechlorination of the CAHs: the TCE peak is followed by the DCE peak; and the DCE peak is followed by the VC peak. It can also be concluded from the data that the reactive zone is reducing the concentrations of daughter products as well as the source product. Finally, the presence of daughter products of TCE also provides indication that the observed results are not a dilution phenomenon.
A-2.9 Carbon Tetrachloride, Chloroform, and Trichloroethene Clean-up in South Carolina
The site is located in an industrial area in Greenville, South Carolina. Historically, the site was used for industrial manufacturing of nylon and polyester fiber. The results of sampling conducted as part of the remedial investigation indicated the presence of carbon tetrachloride (CT), chloroform (CF), and trichloroethene in groundwater. The unconfined aquifer underlying the site consists of three layers: the upper overburden clay-rich soils, the weathered rock (transitional zone), and the underlying fractured bedrock. In early 1990, a groundwater extraction and treatment system was installed to intercept the plume. Although this system generally contained the plume, it has not resulted in plume reduction. To expedite the site cleanup, enhanced reductive dechlorination (ERD) of CAHs using molasses solution was proposed. A field-scale enhanced anaerobic bioremediation pilot test using molasses was conducted between February and November 1998. (Liles and Shetty, 1999). The pilot test conducted by ARCADIS consisted of three injection wells to inject the reagent solution into the transition zone approximately 25 to 35 feet below land surface (bls). The three monitoring wells were installed approximately 5 feet, 10 feet, and 15 feet immediately downgradient of the injection wells and screened in the same zone as the injection wells. The injection of reagent (molasses) solution began in March 1998. Each injection well received 50 gal/week of molasses solution throughout the pilot test. Within one month of reagent injection, the dissolved oxygen levels fell below 1 mg/L and oxidation-reduction potential dropped to range between -19 to -454 mV, indicating that a reactive zone was established in the subsurface. Dissolved organic carbon concentrations in the injection wells increased by three orders of magnitude whereas those in the monitoring well increased by two orders of magnitude due to reagent injection. The introduction of the reagent solution into the groundwater created an anaerobic (reducing) environment (reactive zone) to enhance the natural biodegradation of organic compounds, mainly carbon tetrachloride and chloroform. The groundwater samples from the injection and monitoring wells were collected periodically and analyzed for CAHs and dissolved gases. After 2 months of pilot operation, a 50 to 90 percent reduction in carbon tetrachloride concentrations was observed in injection and monitoringwells. After approximately 5 months of pilot operation, 85 to 99 percent reductions in CT concentrations were observed. The CF concentrations initially increased, which is most likely due to reduction of CT. However, the CF concentrations gradually decreased reduced as the test progressed. The production of a daughter product of CF and methylene chloride (MC) was also observed in some wells at low concentrations. In addition, dissolved gases such as carbon dioxide and methane were produced as byproducts of biodegradation. A full-scale implementation is anticipated in the near future to aggressively clean up the site.
A-2.10 Hanscom and Vandenberg AFBs
Ongoing ESTCP/AFCEE sponsored demonstrations at these sites are discussed the paper reprinted on the following pages.

X X X X X X X
41
Paper as submitted for publication in proceedings of “Remediation of Chlorinated and Recalcitrant Compounds: The Third International Conference, May 20-23, 2002, Monterey, California”
DEVELOPMENT OF AN AFCEE/ESTCP SUBSTRATE ENHANCED CAH BIOREMEDIATION PROTOCOL
C. Lutes ([email protected]) and V. D’Amato, (ARCADIS G&M, Durham,
North Carolina, USA) M. Hansen, J. Burdick, S. Suthersan, (ARCADIS G&M, Langhorne, Pennsylvania, USA) J. Hansen, (AFCEE, Brooks AFB, Texas, USA)
ABSTRACT: A detailed field demonstration of an enhanced bioremediation process for CAHs is in progress at Hanscom and Vandenberg Air Force Bases (AFB). The detailed dataset being collected and ARCADIS' experience at more than 80 other sites will be used to prepare a protocol document for this technology. This protocol will be modeled on the widely used AFCEE protocols for natural attenuation and bioventing. The protocol is expected to include guidance on the following:
• Site selection for these technologies • Selection of a suitable carbon substrate for a given set of site conditions • Delivery system design, including allowances for heterogeneity • Quantitative factors to consider in calculating the initial carbon substrate dose • Process monitoring feedback that can be used to optimize substrate delivery • System modifications to address site-specific pH, salinity, etc., issues
The system at Hanscom AFB has been operating since October 2000, and has already shown highly effective TCE removal in a source area that had a long history of fairly stable TCE concentrations before treatment. The system at Vandenberg AFB targets what had previously been a highly aerobic dissolved phase plume of TCE. This pilot, in operation since February 2001, is showing desirable biogeochemical changes in several wells and substantial TCE conversion to cis-1,2-DCE in one downgradient well. Introduction Chlorinated solvent contamination of groundwater is a widespread problem affecting many facilities where industrial chlorinated aliphatic hydrocarbons (CAHs) like trichloroethene (TCE) and tetrachloroethene (PCE) were used. As late as 1998, conventional remediation options for these sites were considered to be air stripping, granular activated carbon adsorption, and ultraviolet oxidation (Nyer 1998) applied as the treatment component of pump-and-treat systems. Because many contaminants partition preferentially to aquifer solids, pump-and-treat of groundwater is ineffective and in-situ groundwater remediation approaches, which can enhance the partitioning of these contaminants into groundwater offer distinct advantages, including significant reductions in the cost of remediation and the remedial time frame. Reductive Dechlorination of CAHs. In its simplest terms, reductive dechlorination describes the sequential replacement of chlorine atoms with hydrogen atoms. The chlorinated solvent may act as a primary electron acceptor via dehalorespiration, or be cometabolized under reducing conditions, including sulfate reduction and methanogenic environments (Bradley and Chappelle, 1996). For

X X X X X X X
42
reductive dechlorination to be thermodynamically favorable, the oxidation-reduction potential (ORP) must be sufficiently low, with neither dissolved oxygen (DO) nor nitrate available as terminal electron acceptors (Suthersan, 2002). In-situ Reactive Zones. In-situ Reactive Zone (IRZ) technology is based on the concept of enhancing natural processes in a groundwater system to drive the conditions to a state that is more conducive to degradation of CAHs. The IRZ demonstration discussed here involves the addition of a harmless solution of carbohydrates and sulfur (typically molasses), which serve as a supplemental energy source for microbiological processes in the subsurface and alter existing aerobic or mildly anoxic aquifers into highly anaerobic reactive zones, thus creating suitable conditions for the biodegradation of CAHs and/or the precipitation of selected metals. AFCEE/ESTCP Demonstration Project. A detailed pilot-scale field demonstration test program of the IRZ process for enhanced bioremediation of CAHs has been initiated at Hanscom AFB (Hanscom) near Bedford, MA, and at Vandenberg AFB (VAFB) near Lompoc, CA. Ultimately, the objectives of the demonstration at each facility are to demonstrate the ability to remediate contaminants in the subsurface over a relatively short time period (from one to five years in typical full-scale applications) and also to gather information that can be used to estimate long term treatment effectiveness, life span and costs. The primary goal of this technology demonstration is to use the results to develop a protocol for use of the IRZ technology for CAHs at DoD facilities. Specific quantitative goals of the technology demonstration are shown in Table 1. TABLE 1. Quantitative Technology Demonstration Goals
CAH CONCENTRATION AT SITE TARGET REDUCTION FOR ONE-YEAR OF TREATMENT
> 200 µg/L 80%
50 to 200 µg/L 75%
< 50 µg/L 50% Also important in this demonstration is that the degradation of CAHs does not “dead-end” at undesirable by- products such as cis-1,2-DCE and/or vinyl chloride (VC). Demonstration Site Description The demonstration area at Hanscom (Figure 1a) is downgradient of an area that had previously been used for research and training exercises which included the dumping of pyrokinetic drummed waste for burning. Residual CAHs remain beneath this area of the site in sorbed and dissolved phases and evidence also suggests the presence of emulsified or pooled DNAPL. The demonstration area is underlain by an unconfined upper aquifer and confined lower aquifer (the target zone for the demonstration), both consisting of glacial till overburden, and separated by a stiff, laminated layer composed of glaciolacustrine silt with clay. The lower aquifer rests directly on bedrock at a depth of about 50 feet. Other physical characteristics of the subsurface at this site are listed in Table 2. Before treatment, the TCE in the lower aquifer at the RAP1-6 well cluster was fairly constant over 15 years, averaging between 1,000-2,000 µg/L with elevated levels of both cis-1,2-DCE (2,000-5,000 µg/L range) and vinyl chloride (500-1,300 µg/L range). The site was moderately reducing (DO <1.5 mg/L, ORP typically 0 to -50 mv) with a pH in the 6.0 to 6.5 range prior to treatment.

X X X X X X X
43
Site 35 at VAFB (Figure 1b) is characterized by a historical TCE release from a missile silo that was used from 1962 to 1965. The geology is generally characterized by alluvial, marine sands (with gravel, silt and clay) of the Orcutt formation overlying siltstone of the Sisquoc formation. Other physical characteristics of the subsurface at this site are listed in Table 2. The target zone at VAFB is within the Orcutt sands, which contained TCE at 700-800 µg/L, and a low concentration of cis-1,2-DCE as the only degradation product found before treatment. The system had been fairly aerobic (DO >3 mg/L, ORP typically 150 mv) with a pH of between 6.3 and 6.6 prior to treatment.
Figure 1. Demonstration Site Layouts For Hanscom (a) and VAFB (b)
TABLE 2. Summary of Physical Site Characteristics
SITE DEPTH TO GW (m bls)
CONDUCTIVITY
(cm/d)
VELOCITY (cm/d)
GRADIENT (m/m) TREATMENT DEPTH (m bls)
Hanscom 1.2 - 2.4 ~790 24 0.006 15
VAFB 4.0 ~30 3.4 –14 0.041 9.4 – 12.5
Materials and Methods Methods – Well Installation. At Hanscom, new wells were installed in May 2000. Initially, hollow-stem auger (HSA) techniques were employed for well installation and soil sampling, but surging sands necessitated the use of an alternative drive-and-wash technique. Three-meter screened intervals were placed within the lower aquifer for each well. One injection well (IRZ-INJ) was installed upgradient of the existing RAP1-6 cluster along with four monitoring wells placed downgradient (Figure 1a). A fifth well (IRZ-5) was installed in May 2001 to better capture and characterize the treatment zone. Well B-239 is used to characterize upgradient conditions with respect to geochemistry. CAH concentrations are relatively low in this well. At VAFB, four wells were installed using conventional HSA drilling techniques in August 2000. These wells were used for initial aquifer testing and to obtain soil and groundwater samples for pretreatment analyses and lab-scale treatability studies. In September, seven additional wells and
(a (b

X X X X X X X
44
three piezometers were installed by the US Army Corps of Engineers (Kansas City, MO) using a Site Characterization and Analysis Penetrometer System (SCAPS) rig. In October, two additional injection wells were installed using conventional techniques to complete the demonstration zone well layout. A total of three injection wells and eleven monitoring wells (two upgradient, nine downgradient) are used for the demonstration project at VAFB (Figure 1b). Methods – Delivery System. The molasses delivery systems for VAFB and Hanscom are mobile, similar, and relatively simple, consisting generally of a mixing/feed tank, injection pump, pressure gauge, well head interface, and associated hoses. At both sites, a 5% molasses solution spiked with bromide as a tracer is injected at intervals based on feedback from the results of the process monitoring regimen. As of this writing, at Hanscom, 31 injections (3,100 liters of raw molasses, total) had been conducted beginning in October 2000, while 18 injections (1,120 liters of raw molasses, total) had been conducted at VAFB beginning in February 2001. A small amount of clean tap water is injected as needed to encourage the reagent to disperse downgradient away from the injection well and avoid extreme fermentation processes which could excessively depress pH near the injection well (this activity is termed a “water push”). Methods – Field and Laboratory Analyses. Both sites have been subjected to rigorous process and performance monitoring. Performance monitoring (to assess technology efficacy) is conducted using high quality assurance (QA), low-flow groundwater sampling techniques and analysis for most or all of the following parameters: temperature, ORP, DO, pH, conductance, alkalinity, nitrate, nitrite, sulfate, chloride, methane, ethane, ethene, carbon dioxide, chemical oxygen demand, biochemical oxygen demand, total organic carbon (TOC), dissolved total organic carbon, ammonia, sulfide, total iron, total manganese, dissolved iron, dissolved manganese, CAHs, hydrogen and bromide. Additionally, some groundwater samples at Hanscom are analyzed on-site for CAHs using the base’s gas chromatograph (GC). Furthermore, historical data collected from investigations and on-going monitoring at both sites has been reviewed and used to better characterize historical pre-treatment conditions. At Hanscom, a total of five performance-monitoring events have taken place including an initial baseline event in June 2000 while at VAFB, there have been a total of four performance-monitoring events including an initial baseline event in November 2000. A summary of the initial baseline geochemical characteristics of each site are provided as Table 3. TABLE 3. Summary of Initial, Background Biogeochemical Data (Min/Max) do orp ph nitrate sulfate sulfide co2 methane Site (mg/L) (mv) (s.u.) (mg/L) (mg/L) (mg/L) (mg/
L) (µg/L)
Hanscom 0.35 1.48
-57.5 200
5.73 7.10
ND 21.5 38.9
ND 0.1
9.4 86.2
15.0 138.8
VAFB 1.68 4.80
337 439
6.17 6.61
4.7 11.3
183 306
ND 44.2 92.1
ND 6.0
The results of routine process monitoring are used to modify injection protocols and make other process control decisions at both sites, in an effort to maintain reducing conditions while avoiding overly depressing pH. Process monitoring is conducted using portable field instrumentation (e.g., Horiba U-22) and varies from relatively low QA (e.g., using down-the-well sondes) to relatively

X X X X X X X
45
high QA (e.g., using flow-through cells) to measure DO, pH, ORP, conductivity, and temperature. In addition, field test kits are used to analyze for hydrogen sulfide and ferrous iron, and samples are periodically submitted for laboratory analysis of bromide and TOC. As of this writing, eleven process-monitoring events had been conducted at Hanscom and thirteen process-monitoring events had been conducted at VAFB. Results and Discussion Process Monitoring and Feedback. At Hanscom, monthly injections of molasses were successful in quickly achieving favorable reducing conditions in the lower aquifer, as evidenced by depressed DO and ORP measurements in nearly all downgradient wells after a short period of time (Figure 2). However, the delivery of reagent (as implied by elevated TOC and Bromide) to those wells was marginal after 2-3 months of such an injection regimen. As such, the injection frequency was increased to roughly a biweekly schedule and each molasses injection was followed by a water push. This revised dosing regime greatly improved the distribution of reagent, delivering TOC to monitoring wells RAP1-6T (installed in the lower aquifer) and IRZ-1 starting around April 2001. The size of the reactive zone continued to be monitored and beginning in September 2001, the reagent dosage was doubled for most events, while still keeping a bi-weekly injection frequency and water push, in order to expand the size of the reactive zone and in response to increased groundwater flow and slightly increased DO. A regular injection frequency has proven to be effective at this site given its relatively porous geology and rapid groundwater velocities, though seasonal variations in the direction and magnitude of the groundwater gradient appear to have changed the size and shape of the reactive zone.
Figure 2. DO (a) and ORP (b) Time Series Plots for Hanscom At VAFB, three injection wells have been employed. Injection experience at this site suggests that, despite having similar construction details and proximate locations, each injection well exhibits a unique behavior with respect to reagent delivery to the aquifer and, as such, each well must be considered separately with regards to dosing regimen. To illustrate this variation in injection well performance, the response of the three injection wells to reagent injections is shown in Figure 3. Injection well I-2 is most effective at delivering reagent, while injection wells I-1 and I-3 are slower to recover from injections, implying that they were installed in a zone of lower permeability. Given the relatively low and consistent groundwater velocities and direction at VAFB, the migration of both the reductive zone (as implied by DO and ORP) and reactive zone (as implied by TOC and bromide) has been easy to track, as shown in Figure 4.
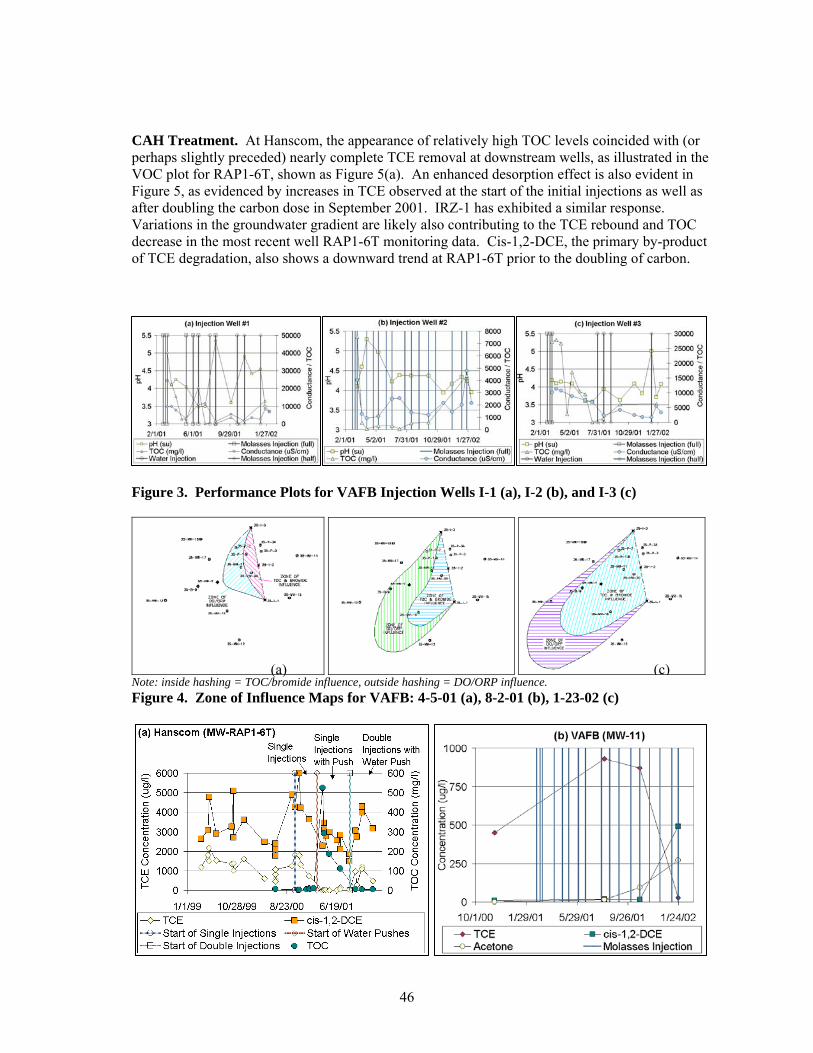
X X X X X X X
46
CAH Treatment. At Hanscom, the appearance of relatively high TOC levels coincided with (or perhaps slightly preceded) nearly complete TCE removal at downstream wells, as illustrated in the VOC plot for RAP1-6T, shown as Figure 5(a). An enhanced desorption effect is also evident in Figure 5, as evidenced by increases in TCE observed at the start of the initial injections as well as after doubling the carbon dose in September 2001. IRZ-1 has exhibited a similar response. Variations in the groundwater gradient are likely also contributing to the TCE rebound and TOC decrease in the most recent well RAP1-6T monitoring data. Cis-1,2-DCE, the primary by-product of TCE degradation, also shows a downward trend at RAP1-6T prior to the doubling of carbon.
Figure 3. Performance Plots for VAFB Injection Wells I-1 (a), I-2 (b), and I-3 (c)
Note: inside hashing = TOC/bromide influence, outside hashing = DO/ORP influence. Figure 4. Zone of Influence Maps for VAFB: 4-5-01 (a), 8-2-01 (b), 1-23-02 (c)
(a) (c)

X X X X X X X
47
Figure 5. VOC Profiles for RAP1-6T at Hanscom (a) and MW-11 at VAFB (b) At VAFB, the start of the reductive dechlorination process has been slower than observed at Hanscom presumably since the initial geochemical conditions were more favorable at Hanscom because of on-going natural attenuation at that site. Additionally, the size of the reducing zone at VAFB appears smaller and slower to expand than at Hanscom. However, the onset of dechlorination is now being seen in recent monitoring results for MW-11, which is located immediately downgradient of the injection zone. The VOC plot for MW-11 (Figure 5b) shows very high levels of TCE removal with a corresponding increase in the degradation byproducts cis-1,2-DCE and acetone. Conclusions – Protocol Preview IRZ has been shown to be effective for the remediation of CAH-contaminated sites with varied physical and geochemical characteristics at these and a total of eighty-eight pilot- and full-scale installation sites with which ARCADIS has been involved. Experience at many of these sites have been presented elsewhere (Suthersan, 2002). Lessons learned from this technology demonstration project and ARCADIS’ other public and commercial site experience will be used to develop a protocol for implementing and optimizing the technology at DoD sites. An outline of some of the topics and points to be covered is presented below: Protocol Preview: Site Selection for Enhanced Anaerobic Bioremediation of CAHs and/or MetalsSite must be at least moderately permeable (k > 10-4 cm/sec).
• Prefer sites that are reasonably well delineated geologically and with regard to contaminant concentration.
• pH should be 5-9. • DNAPL or sorbed source material is not a barrier to success, but must be carefully
considered in locating injection wells and against desired treatment time and goals. • DO recharge rate and presence of alternate electron acceptors (e.g., NO3, SO4) must be
factored into estimated treatment time. • Co-contaminants including various chlorinated species, metals, radionuclides, nitrate, and
perchlorate are also amenable to anaerobic treatment. Prefer aerobic or borderline aerobic/anaerobic starting conditions. Sites already showing breakdown products are ideal. Protocol Preview: Carbon Substrate Selection
• Substrate must be matched to hydrogeology and biogeochemistry. Key factors include size of the treatment area, desired treatment time, groundwater and chemical flux, oxygen recharge rate, and concentration of alternate electron acceptors.
• Substrates range from rapidly consumed to slowly released. • Substrate’s physical and biological characteristics influence injection system design.
ARCADIS has successfully applied molasses, whey and corn syrup. Protocol Preview: Delivery System Design
• Delivery systems can range from complex/automated to low cost/mobile. • Injection frequency can vary from weekly to semi-annual.

X X X X X X X
48
• In-depth hydrogeological understanding is critical: aquifer tests are useful and seasonal effects on hydrology must be considered.
• Multiple injection wells may be warranted to account for fluctuating site conditions (e.g., flow direction)
All systems require several months of monitoring and adjustment in the field. Protocol Preview: Process Monitoring Parameters and Goals.
• DO: DO must be consumed and kept absent so that utilization of alternate electron acceptors can take place.
• ORP: substantial drops in ORP indicate that the predominant electron acceptor has shifted. ORP will shift toward more oxidizing conditions as an artifact of low pH.
• TOC: cost-effective, general measure of substrate dosage – effective in monitoring both degraded and undegraded substrate.
• Conductance: also an indicator of substrate concentration but less sensitive. pH: goal is to maintain a near neutral pH to avoid extreme fermentation reactions. Protocol Preview: System Modifications to Deal with Special Site Conditions
CONDITION MODIFICATION Low pH or low buffering capacity Use of buffer
Use of water push Use of slower-release substrate.
Low permeability/velocity Physically closely spaced direct push injections made less frequently
Salinity Low sulfate donor (e.g., corn syrup) Larger TOC dose
Buildings above reactive zone Gas control systems Acknowledgements We gratefully acknowledge the hosting of these demonstrations by Amena Atta and Beatrice Kephart of VAFB and Tom Best of Hanscom AFB and the support of ESTCP (Cathy Vogel and Andrea Leeson) for this work. K. Older of the US Army COE SCAPS Team provided well installation and site delineation at VAFB. Numerous ARCADIS employees contributed to the work including T. Teeple, D. Springer, L. Hall, M. Flaugher, R. Ruhmke, B. Molnaa, A. Quinones, and B. Lu for VAFB, and K. Saravanan, S. Darrigrand, A. Norton, B. Therriault, D. Stake, and C. Castelluccio for Hanscom. References Bradley, P.M. and Chappelle, F.H. 1996. “Anaerobic Mineralization of Vinyl Chloride in Fe (III) Reducing Aquifer Sediments.” Environ. Sci. Technol., 30, 2084-2086, 1996. Nyer, E. 1998. Groundwater and Soil Remediation: Practical Methods and Strategies. Ann Arbor Press, Chelsea, MI.
Suthersan, S.S. 2002. Natural and Enhanced Remediation Systems. Lewis Publishers, Boca Raton, FL.

X X X X X X X
49

X X X X X X X
50
A-2.11 Liberty Superfund Site
In 1997, ARCADIS performed an IRZ pilot study at the Liberty Superfund Site located in Farmingdale, New York. Groundwater at the Liberty Site had been impacted by cadmium, chromimum and trace levels of CAHs as a result of metal plating operations performed historically at the Site. Total chromium and total cadmium concentrations of less that 400 µg/L and CAH concentrations (predominantly TCE and cis-1,2-DCE) of less than 350 µg/L were observed in the source area. Therefore, IRZ technology was considered by the client as a means to provide dissolved phase metals treatment in the source area as a portion of an overall non-time critical removal action proposed to also include groundwater circulation well technology to remove CAH impacts at the property boundary. A pilot study workplan was developed and submitted to USEPA Region II and approved for application. Geologic conditions at the Site were typical of that for the Upper Glacial deposits of Long Island. The impacted groundwater was present in a layer of medium to coarse sand with gravel that extended to approximately 90 feet below grade. Depth to water was typically encountered at 15 - 20 feet below grade in the pilot test area. The horizontal groundwater velocity at the Site was estimated at an average of 1.6 feet/day. In addition, due to the presence of an open stormwater recharge basin upgradient of the proposed pilot study area, ambient groundwater conditions were very aerobic with dissolved oxygen levels as high as 8 mg/L. Two injection wells are installed for the IRZ pilot study; one screened from 20 to 40 feet and the other from 40 to 90 feet. Two existing monitoring wells were augmented with four new observation wells to create the monitoring well network for the pilot study. Upon completion of the well installation work, the IRZ pilot test was initiated with the reagent injections. Given the highly aerobic environment and the high groundwater velocity, daily batch reagent injections were selected. The initial reagent injection included injection of approximately 50 gallons of reagent solution at a 10:1 (water:molasses) ratio. Preliminary monitoring conducted over the first eight weeks to the study suggested reducing conditions were not being created so the reagent injection was doubled. Ultimately, sufficient reducing conditions were not able to be generated (even with the increased reagent dosing) to mediate the desired metals precipitation reactions. Therefore, at the conclusion of the pilot study it was decided not to apply the IRZ technology for the removal action. The performance of the IRZ in treating CAHs was not evaluated as no CAH monitoring data was collected. However the conclusions of this effort are potentially applicable to CAHs in that it appears to show that their are situations with a high flux of aerobic water where it isn't practical to put in enough carbon to drive the system to a sufficiently reducing condition.
A.2.12 OH Industrial Site
A reactive zone was established in a porous, high-carbonate aquifer that was contaminated by PCE and TCE releases prior to 1980. Velocities were approximately 30 cm per day; the organic carbon fraction ranged from 0.001 to 0.006, while pre-treatment aqueous-phase PCE and TCE concentrations were 500 and 700 µg/L, respectively. ERD was induced through bi-weekly injections of 5 or 10 percent molasses solution over a six-month period. Chlorinated alkene concentrations were observed at a groundwater-monitoring well, located approximately 100 feet downgradient from the reactive zone. Molar concentrations shown in Figure

X X X X X X X
51
A-12 clearly display the stoichiometry of the degradation processes. As reductive dechlorination proceeded, a 6-fold increase in total dissolved alkenes was observed. The apparent degradation rate
Elapsed Time (days)0 100 200 300 400
Con
cent
ratio
n (u
mol
/L)
0
10
20
30
40
50
60
70PCETCEcis-1,2-DCEVinyl chlorideEtheneTotal aqueous-phase alkenes
Figure A-12. Changing Composition of Total Aqueous-Phase Alkenes in High-Carbonate Aquifer constants that can be estimated from the aqueous-phase data were 0.015 day -1 for PCE and 0.042 day -1 for TCE and cis-1,2-dichloroethene. Because the apparent degradation was the net of both desorption releases of contaminant and reductive dechlorination reactions, the actual rate constants for PCE and TCE must have been 0.05 day -1 or greater, corresponding to a half life of fewer than 14 days. Vinyl chloride did not accumulate during the study period. Pre-treatment vinyl chloride concentrations were 3 µg/L, and the peak observed after massive degradation of cis-1,2-dichloroethene was only 12 µg/L.
A.2.13 NC Industrial Facility
A field demonstration of ERD was performed at an active NC industrial facility with PCE concentrations of 5.2 - 11.0 mg/L and TCE concentrations of 87 - 180 mg/L. Initiated in October of 1999 and operated for eleven months, the ERD included use of a bromide tracer. The site was characterized by low groundwater velocity (approximately 50 feet per year) in a silty-clay textured aquifer. As demonstrated by the results in observation well POW-1, located 5 feet from the injection well, dramatic reductions of PCE and TCE concentrations were seen (89% and 94%, respectively; Figure A-13 on the following page). Daughter products, especially cis-1,2-dichloroethylene (DCE), had increased during the initial treatment period, and then decreased over time indicating effective biological activity. Vinyl chloride

X X X X X X X
52
concentrations did not increase dramatically during treatment. In this case study, little desorption was seen, but the ability of ERD to treat extremely high dissolved concentrations was demonstrated.
Figure A-13. Concentrations of CAHs in Observation Well POW-1
A.2.14 Former Landfill Site
The site was a closed sanitary landfill in the Northern United States. Contaminants of concern included benzene, PCE, TCE, chloroethane, dichlorodifluoromethane, cis-1,2-dichloroethene (cis-1,2-DCE), trans-1,2,-dichlorethene (trans-1,2-DCE), 1,2 dichlorethane (1,2-DCA) and VC. The client provided a test location near the site perimeter. The depth to the groundwater ranged from 7-50 ft in the upper zone and the groundwater velocity was approx. 0.5 ft/day. The test was inconclusive, because injected electron donor was not observed in the pilot monitoring wells. Further investigation indicated that groundwater flows had directed the injected carbon across the site perimeter, to a location that could not be monitored. The former landfill came under new ownership, and no additional testing was conducted.
A.2.15 Michigan site
1,1-DCE was lost to an inland (relict) dune and beach formation in western Michigan more than 24 years ago. The plume extended over more than 50 acres, to a depth greater than 100 feet below ground surface.
008/28/99 10/17/99 12/06/99 01/25/00 03/15/00 05/04/00 06/23/00 08/12/00 10/01/00
Date
TetrachloroetheneTricholoroethenecis 1,2 DichloroetheneVinyl Chloride
Note: For constituents detected belowquantitation limits, quantitation limits were used for preparing this graph.
008/28/99 10/17/99 12/06/99 01/25/00 03/15/00 05/04/00 06/23/00 08/12/00 10/01/00
Date
TetrachloroetheneTricholoroethenecis 1,2 DichloroetheneVinyl Chloride
Note: For constituents detected belowquantitation limits, quantitation limits were used for preparing this graph.
008/28/99 10/17/99 12/06/99 01/25/00 03/15/00 05/04/00 06/23/00 08/12/00 10/01/00
Date
TetrachloroetheneTricholoroethenecis 1,2 DichloroetheneVinyl Chloride
Note: For constituents detected belowquantitation limits, quantitation limits were used for preparing this graph.
0
20
40
60
80
100
120
140
160
08/28/99 10/17/99 12/06/99 01/25/00 03/15/00 05/04/00 06/23/00 08/12/00 10/01/00Date
Con
cent
ratio
n (m
g/L)
TetrachloroetheneTricholoroethenecis 1,2 DichloroetheneVinyl Chloride
Note: For constituents detected belowquantitation limits, quantitation limits were used for preparing this graph.
008/28/99 10/17/99 12/06/99 01/25/00 03/15/00 05/04/00 06/23/00 08/12/00 10/01/00
Date
TetrachloroetheneTricholoroethenecis 1,2 DichloroetheneVinyl Chloride
Note: For constituents detected belowquantitation limits, quantitation limits were used for preparing this graph.
008/28/99 10/17/99 12/06/99 01/25/00 03/15/00 05/04/00 06/23/00 08/12/00 10/01/00
Date
TetrachloroetheneTricholoroethenecis 1,2 DichloroetheneVinyl Chloride
Note: For constituents detected belowquantitation limits, quantitation limits were used for preparing this graph.
008/28/99 10/17/99 12/06/99 01/25/00 03/15/00 05/04/00 06/23/00 08/12/00 10/01/00
Date
TetrachloroetheneTricholoroethenecis 1,2 DichloroetheneVinyl Chloride
Note: For constituents detected belowquantitation limits, quantitation limits were used for preparing this graph.
0
20
40
60
80
100
120
140
160
08/28/99 10/17/99 12/06/99 01/25/00 03/15/00 05/04/00 06/23/00 08/12/00 10/01/00Date
Con
cent
ratio
n (m
g/L)
TetrachloroetheneTricholoroethenecis 1,2 DichloroetheneVinyl Chloride
Note: For constituents detected belowquantitation limits, quantitation limits were used for preparing this graph.

X X X X X X X
53
A pump and treat system operated at the site for a 20-year span, but failed to contain or eliminate groundwater contamination. Characterization data from the time of the initial release was very limited, and did not adequately represent the stratigraphic complexity associated with the relict Lake Michigan dune formation. Groundwater monitoring has shown partial degradation of the 1,1-DCE and as a result, enhanced reductive dechlorination was selected to replace the abandoned pump and treat effort. Initial pilot studies were stymied by complex geology of the site. Degradable carbon injected into the formation passed beneath monitoring wells that were thought to be positioned 30 to 100 days downgradient from the injections. The final monitoring well samples were collected 6 months after injections began. At that time, evidence of dissolved organic carbon transport and development of low-redox groundwater was first observed in monitoring wells positioned at a distance that corresponded to 180 days of travel from the injection location. From these results, it was determined that the injected carbon had bypassed the intended target zone. A comprehensive investigation was undertaken to determine the aquifer structure and contaminant distribution, using cone penetrometry with on-site laboratory support. This investigation confirmed the conclusion that injected carbon had bypassed the intended monitoring point due to stratigraphic separation. Full-scale design for enhanced reductive dechlorination is now underway.
A-3 Case studies (Non-ARCADIS)
Industrial Site, Southern United States Reference: Fam, S.A., Findlay, M., Fogel, S., Pirelli, T., Sullivan, T., 2000, Full-Scale Anaerobic Bioremediation Using Acetate and Lactate Electron Donors, in Wickramanayake, G., Gavashkar, A., Alleman, B., Magar, V., eds. Bioremediation and Phytoremediation of Chlorinated and Recalcitrant Compounds, Vol C2-4, Battelle Press, Columbus Ohio, p. 23-29. This summary presents data from a large full-scale anaerobic dechlorination system. Remedial measures involved extraction of impacted groundwater and injection of amendments from a network of 36 wells over a 3-acre area.
Background
The site is located in the southern U.S and is impacted with both halogenated and non-halogenated volatile organic compounds resulting from 30 years of past industrial use. VOC concentrations were typically in the 500 mg/L range, and consisted primarily of tetrachloroethene (PCE), trichloroethene (TCE), 1,1,1 trichloroethane(1,1,1 TCA), MC, acetone, and toluene. The overburden of the pilot test area generally consists of ten to twenty five feet of silty-clay with slightly more permeable fill/silty-sand seams within a historical drainage trough that runs through the site. Initial biogeochemical investigation showed that extensive biodegradation is occurring at the site, but that phosphate and electron donor deficiencies may be limiting degradation. A lab-scale treatability test was conducted to confirm that electron donor and phosphate addition would enhance biodegradation of the VOCs.

X X X X X X X
54
Description of Remedial System
The remedial system consisted of two portions, the first being a dual extraction system expected to address the vadose zone and the dewatered soil, the second a bioremediation component expected to address the portions of the saturated zone that are not dewatered. This summary focuses on the second portion of the remedial system. Addition of electron donors and minerals occurred periodically in 7 of the 36 on-site extraction wells. Each feeding consisted of approximately 300 pounds of acetate, 300 pounds of lactate, and 50 pounds of ammonium phosphate. Extraction wells to which amendments were added were shutdown for a period of one month after electron donor addition. Electron donor and nutrient additions were intended to enhance anaerobic dechlorination in the portion of the site not being dewatered. Additions were conducted on a monthly basis by mixing additives in an on-site 250-gallon tank, and turning on a batch addition pump for a period of two to three days. Additives flowed to the wells via the air bleed lines on the extraction wells. Following electron donor and inorganic nutrient addition, the air bleed lines were flushed using an on-site air compressor. Additives were distributed across the site by the pumping action of the operating wells.
Results
After a period of 21 months, total VOC concentrations decreased from 460 mg/L to approximately 41 mg/L in the most impacted well. Of the 41 mg/L of total VOCs in the well, approximately 25 mg/L were vinyl chloride and chloroethane (91.7% of total halogenated VOCs). Prior to initiating active remediation, vinyl chloride and chloroethane represented only 7% of the total halogenated VOCs. Concentrations of ethane and ethene in the observation wells increased by approximately 50 fold in the impacted zone since initiation of the bio-enhancement program. Ogallala Public Water Supply, Nebraska Reference: Murt, V., Huscher, T., Easley, D., 2000, A Reductive Dechlorination Treatability Study of a Shallow Alluvial Aquifer, in Wickramanayake, G., Gavashkar, A., Alleman, B., Magar, V., eds. Bioremediation and Phytoremediation of Chlorinated and Recalcitrant Compounds, Vol C2-4, Battelle Press, Columbus Ohio, p. 23-29 A field-scale treatability study was performed at the Ogallala Ground Water Contamination Site to determine if PCE could be degraded via reductive dechlorination in a shallow alluvial aquifer. A substrate solution consisting of 60% food grade sodium lactate was injected at intervals of 3 to 4 weeks to allow for adequate mixing and dispersion of the solution.
Background
Contamination of the Ogallala public water supply well was discovered during a 1989 quarterly sampling event conducted by the Nebraska Department of Health. Subsequent sampling indicated that five of the nine public water supply wells had chlorinated volatile organic compounds (VOCs) impacts. The Ogallala Ground Water Contaminated Site was placed on the National Priority List (NPL) in 1994. The City of Ogallala is underlain by a relatively thin layer of unconsolidated alluvial material that overlies the Ogallala Formation. Approximately 4 to 5 feet of topsoil and fill material is present. The alluvial material generally consists of a silt to silty clay layer to a depth of about ten feet, followed by sand of variable grain size with occasional interbedded layers of silt of grave to a depth of about 26 to 30 feet bgs.
X X X X X X X
55
The top of the Ogallala Formation is delineated by the Ash Hollow Member, which consists of a calcareous silty clay.
Description of Treatability Study
A semipassive extraction-injection system was designed for the site. The injection and extraction wells were aligned in a row perpendicular to the direction of groundwater flow, allowing for the formation of a recirculation cell. After substrate injections, the system was allowed to run for several hours during which the groundwater/substrate solution was recirculated. After equilibration had been achieved the system was turned off. The substrate solution was then transported away from the injection system under natural ground water gradient conditions. The treatment system consisted of one extraction well, two injection wells, and 6 sets of nested monitoring micro-wells. A pre-existing well located approximately 70 feet upgradient of the test area was used to collect upgradient geochemical and PCE data. Regular injections of the substrate solution, consisting of 60% food grade sodium lactate were conducted to supply the microorganisms with a fermentable organic food source. Initially 25 kg of sodium lactate solution was injected at a frequency of once a month. Due to concerns about carbon limitation, the amount and frequency were increased to 75 kg every three weeks. The injection and recirculation system were operated for 7 to 8 hours, then shut off following each injection event.
Results
Field chemistry measurement was collected during the study using various portable instruments. Temperature, pH, conductivity, dissolved oxygen (DO), and oxidation-reduction potential (ORP) were collected using a QED MicroPurge Flow Cell. Alkalinity was measured using a HACH Digital Titrator, and colorimetric kits were used to measure ferrous iron and nitrate/nitrite. Verification of the alkalinity and nitrate concentrations were performed in the laboratory. Baseline samples were collected prior to the start of the study. Weekly samples were collected for several months and analyzed for TOC. Baseline sampling of the upgradient well indicated PCE at a concentration of 20 µg/L. Subsequent samples collected from the same well indicated the concentration of PCE increased to 100 µg/L. Degradation products including TCE, DCE, and VC were not detected in any of the samples collected at the upgradient well. Data from the injection and downgradient wells indicated low concentrations of PCE in groundwater. Samples were collected for the analysis of methane, ethane and ethene to evaluate whether methanogenic conditions were present within the test cell and to determine if complete degradation of PCE had occurred. Samples were also analyzed for volatile organic acids including acetate, propionate and butyrate. Results indicated that the sum of the fermentation products accounted for over 50% of the COD.
Conclusions
Data suggested the indigenous microbes present in the aquifer acclimated slowly to the addition of the lactate during the first several months of operation. Development of reducing conditions was first observed with the reduction of nitrate and the formation of nitrite. The appearance of ferrous iron was first noted a month after nitrate reduction had occurred. Sulfate reducing conditions were slow to develop.

X X X X X X X
56
Data indicated that conditions within the cell became appropriate for reductive dechlorination. However, due to the low initial concentrations of PCE, it could not be confirmed that reductive dechlorination was occurring. This is a good example of the importance of correctly delineating the injection area, showing that project management can cause a failure, not the technology itself. Cape Canaveral Air Station, FL Reference: Reductive Anaerobic Biological In-Situ Treatment Technology (RABITT) Treatability Test Interim Report, 2001. p. 4-6. Field study results are presented here for the addition of lactate as an electron donor to stimulate reductive dechlorination. The field study included two communicating wells, a series of tri-level groundwater monitoring probes, and two monitoring wells. Trichloroethene (TCE) concentrations were historically detected as high as 342 mg/L in the field study area
Background.
Facility 1381 contains a shallow, 110 acre VOC plume consisting primarily of TCE, dichloroethene (DCE), and vinyl chloride (VC). Field data suggested that TCE was naturally being degraded to DCE and VC. The geology at the site is characterized by poorly sorted coarse to fine sands and shell material from ground surface to approximately 35 ft bgs. From approximately 35 to 50 feet bgs, a continuous clay unit appears to underlie the entire area. Groundwater is very shallow, generally ranging between 4 and 7 feet bgs.
Description of Field Study
The objective of the field system was to allow for effective delivery and distribution of nutrients and electron donors and to provide for extensive monitoring and hydraulic control, without pumping groundwater above ground. The system operated for six months. Two communicating wells, a series of 13 tri-level groundwater monitoring probes, and upgradient and downgradient monitoring wells were installed. The communicating wells contained two screens, one operating in an upflow mode, and the other in a downflow mode. Each well was screened within two distinct zones. The wells were placed close enough to affect each other with the effluent from one well feeding the other. This resulted in groundwater circulation that was used to mix and distribute the electron donor/nutrient formulation. Tri-level monitoring points were screened in three zones that covered similar depths and an intermediate zone. The monitoring probes were positioned around the treatment cell to provide three-dimensional data. Lactic acid was injected into the communicating well system to maintain an initial groundwater concentration of 3 mM lactate.
Results
Cape Canaveral field-testing showed rapid dechlorination of TCE and cis-DCE to VC, followed by slower subsequent dechlorination to ethene under the established sulfate reducing to methanogenic conditions. The treatment demonstrated reduction of TCE, cis-DCE, and VC by 88.7%, 90.6%, and

X X X X X X X
57
66.3%, respectively. The ethene concentration increased significantly to approximately 0.04 mM, but a good molar balance was not possible due to diffusion.

X X X X X X X
58
Naval Air Station, Alameda, CA Reference: Reductive Anaerobic Biological In-Situ Treatment Technology (RABITT) Treatability Test Interim Report, 2001. p. 7-9. A field study was performed with the addition of butyric acid and yeast extract as electron donors to stimulate reductive dechlorination. The field study included an upgradient injection well and downgradient extraction well with an aboveground recirculation. The constituents of concern in the field study area were trichloroethene (TCE), dichloroethene (DCE), and vinyl chloride (VC) between 5.5 and 15.5 feet bgs. These compounds were found in groundwater at concentrations of 24 mg/L, 8.6 mg/L, and 2.2 mg/L, respectively.
Background
Building 360 at Naval Air Station Alameda was selected for a field study. This building was used as an aircraft engine repair and testing facility and consisted of former machine shops and cleaning areas, as well as plating and welding shops and parts assembly areas. Depth to groundwater in the field study area ranges between 4.4. feet and 6.5 feet bgs. The estimated groundwater flow was very low (1.1 x 10⁻⁵ cm/sec), and appeared that groundwater flow was very nearly stagnant.
Description of Field Study
The field test involved an upgradient injection well and downgradient extraction well with aboveground recirculation. The injection well was supplemented with TCE contaminated groundwater from a separate supply well outside the influence of the 3-foot by 15-foot monitored plot. The injection, extraction, and nine monitoring wells were all screened between 24 and 27 feet bgs. The total pumping rate for the system was 236 gal/day. Butyric acid and yeast extract were added to maintain initial in-situ concentrations of 3 mM and 20 mg/L, respectively.
Results
Injected groundwater contained average TCE, cis-DCE, and VC concentrations of 81.7 uM, 7.0 uM, and 3.4 uM respectively. By the end of the demonstration, the average TCE concentration observed in the treatment zone had been reduced by 94% despite the continuing input of TCE. In addition, both cis-DCE and VC were on the decline; ethene levels were steadily increasing and accounted for approximately half of the total chloroethene concentration. On average, 87% of injected chloroethenes could be accounted for during sampling events. Anaerobic Biodegradation of Chlorinated Solvents at Pinellas Science, Technology, and Research (STAR), Largo, FL. Reference: Gindstaff, M., 1998. Bioremediation of Chlorinated Solvent contaminated Groundwater, Prepared for U.S. EPA Technology Innovation Office. p. 20-23. A pilot test was completed for a portion of the groundwater plume at the former Department of Energy’s (DOE) Pinellas Plant. The field study included three gravel filled surface infiltration trenches, and two 240-foot long horizontal wells. The constituents of concern in the field study area were trichloroethene

X X X X X X X
59
(TCE), dichloroethene (DCE), vinyl chloride (VC), and methylene chloride. Contaminant concentrations ranged from 10 to 400 mg/L in groundwater with one monitoring well exceeding 2900 mg/L.
Background
The pilot test area was impacted with chlorinated solvents as a result of past waste storage and disposal practices. The groundwater plume covered an area from three to four acres in size. The pilot test area is composed of a shallow sandy aquifer with a horizontal and vertical hydraulic conductivity ranging from 0.2 to 6.6 ft/day and 0.003 to 0.3 ft/day, respectively.
Pilot Test Setup
The pilot test included three 8-foot deep, 30-foot long, and 2-foot wide, gravel filled surface infiltration trenches, and two 240-foot long horizontal wells with 30-feet of screen placed in intervals. The gravel trenches were designed for efficient delivery of nutrients. The horizontal wells were installed through the center of the treatment zone. The extraction well was located 17 feet bgs and the infiltration well was placed directly under the extraction well at 26 feet bgs. Sixteen monitoring locations were within the treatment zone. Each location consisted of four sampling points completed to different depths below the ground suface; 8-10 feet bgs, 12-14 feet bgs, 18-20 feet bgs, and 22-24 feet bgs. Four monitoring wells were installed around the perimeter, one in each corner of the treatment area. Monitoring for substrate and contaminant concentrations were performed semimonthly, bromide tracer studies were conducted weekly. Sodium benzoate, sodium lactate, and methanol were added continuously to the system for approximately 4 ½ months. Concentrations of the sodium benzoate, sodium lactate, and methanol were 120 mg/L, 180 mg/L, and 60 mg/L, respectively.
Results
Biofouling caused clogging in the horizontal extraction well, and as a result the well had to be redeveloped eight times throughout the pilot test. The infiltration well had to be redeveloped only once. The initial concentrations of TCE, cis-DCE, methylene chloride and VC were 46.6 mg/L, 45.6 mg/L, 19.2 mg/L, and 9.5 mg/L, respectively. Most degradation occurred in the first 4 to eight weeks of the pilot test. TCE was reduced by 94%, the other compounds had a 55 to 60% reduction. By the end of the pilot test, 90 to 95% of all contaminants had been reduced through the groundwater recirculation in the treatment cell. In-situ Anaerobic Bioremediaton Pilot Study with Bioaugmentation, Dover Air Force Base, Delware Reference: Gindstaff, M., 1998. Bioremediation of Chlorinated Solvent contaminated Groundwater, Prepared for U.S. EPA Technology Innovation Office. p. 23-25. A pilot-scale in-situ enhanced anaerobic biodegradation study was completed at the Dover Air Force Base in Delaware. The pilot system consisted of three injection and three extraction wells. The constituents of concern in the pilot test area were tetrachloroethene (PCE) trichloroethene (TCE), cis-dichloroethene (cis-DCE), and vinyl chloride (VC). Initial contaminant concentrations were as follows: PCE 0.05 mg/L, TCE 5-10 mg/L, cis-DCE, 1-2 mg/L, and VC 0.02 mg/L.
X X X X X X X
60
Background
Chlorinated solvents contaminate the aquifer in Area 6 of the Dover Air Force Base. Historically, spent solvents were disposed of by burning them in a pit. Chlorinated solvents seeped through the subsurface into groundwater during the disposal process. The aquifer is composed of a relatively homogenous silty sand/soil down to a clay aquitard at about 50 feet bgs. The groundwater table is around 10 to 12 feet bgs. The existing hydraulic conductivity is 0.021 cm/s.
Pilot Test Setup
The pilot test system consisted of three injection and three extraction wells installed vertically, forming a contained treatment cell with the aquifer. Groundwater traveled 60 feet from injection to extraction with a residence time of 90 days. The wells were designed vertically to distribute the substrate to the point of interest within the aquifer, about 36 feet bgs, where the highest concentration of contaminants occurred. A 60% sodium lactate solution was used as the substrate for the pilot test. Nitrogen and phosphorus containing compounds were also injected as a nutrient feed at a concentration of 5 mg/L. Both substrate and nutrients were pulse injected in a continuous cycle.
Results
Clogging of the injection wells was a significant problem. Several different remedies for the clogging problem were tried, including redevelopment, weekly brush and pump treatment, peroxide cleaning, and changing the substrate from sodium lactate to lactic acid for a month. Each of the alternatives worked well for a while, but none prevented clogging for an extended period of time. Clogging of the wells was attributed to the high concentration of bacteria growing around the well screens. The treatment system had a 99% removal efficiency for PCE and TCE, reducing the concentration to below drinking water standards. However, the indigenous microbial flora were unable to further degrade DCE or VC. Bioaugmentation was implemented to further reduce the daughter products to ethene. Microorganism from the Pinellas STAR Center were cultured and then injected at a concentration of 108 cells per milliliter into the Dover aquifer. Following bioaugmentation, degradation of DCE and VC was observed to near 99% removal.
A-4 Comparison of Natural Attenuation Rates with rates of Enhanced Reductive Dechlorination
Information on rates has been presented in many of the previous case studies. In addition, a paper analyzing this issue using these case studies has been published (Horst 2000).
A-5 Case Study Cost Information
Based on the authors experience in application of the ERD technology we have prepared the following summary Table A-5 outlining costing information from select ongoing and completed projects performed by ARCADIS. Several of the Sites listed on Table A-5 are also included in the Case Study summary information presented previously. As outlined in Table A-5, application costs (i.e. capital) range from approximately $75,000 for a small-scale application and/or pilot study or demonstration-scale project to as high as $1,400,000 for a large
X X X X X X X
61
plume treatment with an fully-automated reagent injection system. The full-scale system for this Site included installation of over 100 reagent injection wells to provide an aggressive plume-wide treatment approach. Operating costs (including reagent injection, monitoring, and reporting) are generally on the order of $50,000 - $100,000 per year. It should be noted that in reviewing cost data from these sites, the percentage of the total costs associated with the reagent injections was typically greater that 50%. On the other hand, the actual cost of the reagent typically represented less than 10% of the operating cost budget. These budgetary figures are consistent with the discussion presented in Section 4 regarding the factors impacting the cost of ERD application. The cost data presented clearly illustrates the cost effective nature of the ERD technology in addressing CAH contamination in groundwater. For example, two of the sites presented above and in Sections 10.2.4 and 10.2.8 were able to be completed, including receipt of no further action from the regulatory agencies for less than $500,000 each.

X X X X X X X
62
Table A-5. Summary of Technology Application Costs Estimated Estimated Annual Actual or Predicted Site Capital Costs O&M Costs Costs to Closure Industrial Laundry/Dry Cleaning Facility, Eastern PA (Section 10.2.6) $ 75,000 $ 45,000 $ 250,000 Uranium Processing Facility, Eastern US (Section 10.2.7) $ 480,000 $ 65,000 $ 760,000 Former Metal Pating Site, Western US (Section 10.2.8)1 $ 100,000 $ 150,000 $ 250,000 Industrial Manufacturing Site, South Carolina (Section 10.2.9) $ 1,400,000 $ 75,000 $ 2,000,000 Industrial Site, Northeastern US (Section 10.2.2) $ 150,000 $ 80,000 $ 750,000 Former Dry Cleaner, Wisconsin (Section 10.2.4)2 $ 200,000 $ 100,000 $ 400,000 Former Automotive Manufacturing Site, Midwestern, US $ 75,000 $ 60,000 $ 375,000 AOC 50, Ft. Devens, Ayer, Massachusetts $ 150,000 $ 150,000 NA3 Note: All costs presented in current dollars. 1 - Site has received regulatory closure. 2 - Site has received regulatory closure. 3 - No Predicted Costs to Closure Available. Pilot study ongoing.

X X X X X X X
Appendix B
APPENDIX B. THEORY OF COMPETITION FOR MOLECULAR HYDROGEN AND WHY SOME SITES “STALL”

X X X X X X X
1
B-1 Theory of Competition for Molecular Hydrogen
Numerous studies have been performed on electron donors and their ability to support biological dechlorination. Various electron donors, including glucose, acetate, formate, methanol, sucrose, lactate, propionate, crotonate, butyrate, and ethanol have been successful in supporting the reductive dechlorination of PCE (DiStefano and Gossett, 1992; Fennell and Gossett, 1997). However, recent studies have indicated a prominent role for molecular hydrogen (H2) in the reductive dechlorination of chloroethenes (Wiedermeier et al., 1997; Wild et al., 1996; Schumacher and Holliger (1996). Known dechlorinating bacteria such as Dehalococcoides ethenogenes, Dehalospirillum multivorans, and Dehalobacter restrictus can use a hydrogen atom (H2) as an electron donor. In addition to dehalorespirers, a wide variety of bacteria such as denitrifiers, ferric iron [Fe (III)] reducers, sulfate reducers and methanogens can utilize hydrogen as an electron donor. Microorganisms that can use H2 as an electron donor are known as hydrogenotrophic bacteria. In environments where hydrogen is the most important electron donor for the dechlorination of chlorinated solvents, competition for the uptake of hydrogen between different types of microorganisms, such as methanogenic, homoacetogenic, sulfidogenic, and dechlorinating bacteria, becomes important. In several studies it has been shown that dechlorinating organisms have a higher affinity for molecular hydrogen than methanogens (Ballapragada 1997; Fennell 1997; Smatlak 1996). This indicates that the dechlorinating organisms are able to survive at lower hydrogen levels, but will possibly be out-competed by other microorganisms when elevated hydrogen levels are present. These studies suggested that a more effective dechlorination may be achieved by using an electron donor that generates low hydrogen concentrations during its fermentation, such as propionate or butyrate. The speculation was that this would then create more favorable conditions for dechlorinating bacteria than for hydrogen-consuming methanogens (Ballapragada 1997; Fennell et al., 1997) however, recent studies as discussed below, are changing this view (Suthersan 2002). Achtnich et al., (1995) studied the effects of H2 competition in soil depleted of available electron donors. The addition of an electron acceptor to anoxic soil generally inhibited the reduction of electron acceptors with a lower standard redox potential, but only if the concentration of electron donor was limiting in the soil. When the electron donor was depleted, the addition of nitrate (NO3
-) slightly inhibited reduction of ferric iron (Fe3+), and strongly inhibited sulfate (SO4
2-) reduction. When H2 was added as an electron donor, Fe3+ reduction continued as well as SO4
2- reduction. It is important to note that production of methane was inhibited by all of the other electron acceptors (NO3
-, Fe3+ and SO42-) when they were added
to methane-producing soil. Other investigators have seen this as well with Fe3+ reducing, (manganese in a plus four oxidation state) (Mn4+) reducing, NO3
- reducing, SO42- reducing, and methanogenic bacteria
(Achtnich et al., 1995; Lovley and Phillips, 1987). This is likely because organisms using the other electron acceptors maintained the H2 concentration below the threshold for methanogenesis. The H2 concentration thresholds, below which the various terminal electron-accepting reactions cannot occur, are shown in Table B-1. These H2 thresholds are primarily dependent upon the physiological characteristics of the H2-consuming microorganisms, with the yield from H2 oxidation affected by the electron acceptor used. Organisms using acceptors associated with greater energy production have lower H2 concentration thresholds than organisms using electron acceptors that yield less energy from H2 oxidation (Yang and McCarty, 1998). Smatlak et al. (1996) showed that the physiological H2 threshold for PCE dechlorinators in a mixed culture was less than 2 nM. Therefore, if methanogens are the main competitors for H2 in a dehalogenating culture, it should be possible to provide a competitive advantage to dehalogenators by maintaining H2 concentrations between 2 and 11 nM. However, maintaining low H2 concentrations in the

X X X X X X X
2
presence of active Fe3+ reducers, Mn4+ reducers, or NO3- reducers will not favor dehalorespirer growth, as
these other organisms also have very low H2 thresholds (see Table B-1). Reductive dechlorination of PCE requires the addition of two electrons for each chlorine removed, and for three of the seven recently identified dechlorinating organisms; H2 is one of the substrates (and in some cases, the only one) that can serve as the direct electron donor. Dehalobacter restrictus is a direct dechlorinator that uses only H2 as an electron donor, but dechlorinates PCE only to cis-1,2-dichloroethene (cis DCE). Dehalospirillum multivorans also dechlorinates PCE to cis-DCE using H2, but has a much more widely varied biochemical repertoire; it is additionally able to use various organic substrates such as pyruvate, lactate, ethanol, formate, and glycerol as electron donors (DeBruin et al., 1992; Maymo-Gatell et al., 1995; Miller et al, 1998). Other PCE-dechlorinating organisms have been isolated that do not use H2 (Wiedemeier et al., 1997 and Gossett 1987). It was later determined that the half-velocity constant with respect to H2 for this dechlorinator was one-tenth that of the methanogenic organisms in the culture. The threshold H2 level for dechlorination was also correspondingly lower than values typically reported for methanogens. Though confirmed thus far with only this one dechlorinator, there are thermodynamic reasons (i.e. the relatively high free energy available from dechlorination) to suspect that the threshold for H2 use by dechlorinators may generally be lower than that for hydrogenotrophic methanogens (McCarthy and Semprini, 1994; Ballapragada 1997) This suggests a strategy for selective enhancement of dechlorination – managing H2 delivery so as to impart a competitive advantage to dechlorinators. However, as discussed below, this strategy may not be optimal in an actual field implementation. Table B-1. H2 Concentration Thresholds
Reaction H2 concentrations nanomolar (nM) References
homoacetogens 400 Yang and McCarty (1998)
7-11 Yang and McCarty (1998)
7-10 Lovely et al. (1994)
7 Chapelle et al. (1996)
2 Yang and McCarty (1998)
< 2 Smatlak et al. (1996)
1-1.5 Lovely et al. (1994)
1-4 Chapelle et al. (1996)
0.2 Lovely et al. (1994)
0.1-0.8 Chapelle et al. (1996)
Mn(IV) reduction < 0.05 Lovely et al. (1994)
nitrate reduction < 0.05 Lovely et al. (1994)
dehalogenation
methanogenesis
sulfate reduction
Fe(III) reduction

X X X X X X X
3
Numerous microcosm and site studies have shown successful stimulation of dechlorination with substrates such as methanol, ethanol, lactate, butyrate, and benzoate (Parsone 1984; Guiot 1995; Maymo-Gatell 1997; Carr and Hughes, 1998; Fathepure and Vogel, 1991). Thus, understanding both the fate of the electron donors and the fate of H2 evolved from their degradation and the extent to which their reducing equivalents are channeled to desirable dechlorination or competing H2 sinks has important implications for determining how best to effectively stimulate latent dechlorinating activity for in-situ enhanced reductive dechlorination in an ERD system. A new school of thought, based on recent studies, is that the type of substrates and the rate of fermentation may not have an impact on reductive dechlorination. Yang and McCarty (1998) investigated competition for H2 and found that H2 competition between dehalorespirers and methanogens is important, with lower H2 partial pressures supporting dechlorination as opposed to methanogenesis. Conversely, Fennell and Gossett (1997) investigated dechlorination with four different H2 donors – butyric acid, propionic acid, ethanol, and lactic acid. Butyric acid and propionic acids can only be fermented when the H2 partial pressure is lower than 10-3.5 and 10-4.4 atmosphere, respectively. Ethanol and lactic acid are readily fermented at H2 partial pressures two to three orders of magnitude higher. Short-term intensive studies showed a marked difference in the reducing equivalents used for dechlorination versus alternative reduction reactions such as SO4
2- and carbon dioxide (CO2) reduction. However, the long-term studies showed no significant difference in the quantity of reducing equivalents eventually used for the degradation of PCE (Fennell and Gossett, 1997). Carr and Hughes (1998) studied the influence of the electron donor’s lactate, methanol, and H2 on dechlorination using a mixed anaerobic culture. This study used high partial pressures of H2 to determine long-term effects on dechlorination. Once again, long-term studies showed little difference in the ability of the different electron donors to support dechlorination (Carr and Hughes, 1998). When considering supplementing a contaminated aquifer with an electron donor to stimulate dechlorination, the issue of competition for electron donors is important, although questions still remain as to the importance of the H2 partial pressure in this competition. The fate of electron donors and their resulting reducing equivalents in an anaerobic environment has a significant role in determining how to stimulate dechlorinating activity. These results may indicate that either low H2 partial pressures were not required to maintain a competitive dechlorinating community or, that several isolated PCE respiring bacteria do not utilize H2 as an electron donor (Gerritse 1997 and Krumholtz 1997). H2 was not the source of PCE-reducing equivalents in all systems tested. Other laboratory and field studies have also suggested that the steady state concentration of hydrogen is controlled by the type of bacteria utilizing the hydrogen and is almost completely independent of the rate of hydrogen production (Suthersan 2002). Thus, in addition to methanogens, a wide variety of bacteria can utilize hydrogen as an electron donor: denitrifiers, Fe (III) reducers, sulfate reducers and halorespirators. As discussed earlier, for dechlorination to take place at the optimum rate, halorespirators must successfully compete against all these hydrogen utilizers. It was suggested that the competition is mainly controlled by Monod half-saturation constant (Ks) (H2). This is defined as the concentration at which a specific bacterial strain can utilize hydrogen at half the maximum utilization rate (Bouwer and McCarthy, 1983). The measured value of Ks (H2) for halorespirators was 100 nM and for methanogens, 1000 nM (Wiedemeier 1999). This was the reason that led to the suggestion that halorespirators would compete successfully for H2 only at low concentrations.

X X X X X X X
4
However, a more detailed analysis of halorespiration kinetics and competition for hydrogen based on the Monod kinetic model was performed recently (Wiedemeier 1999 and Ballapragada 1997). Using this model, the ability of hydrogen utilizing bacteria to compete for hydrogen can easily be predicted from substrate concentration and two properties of the bacteria, µmax (maximum specific growth rate), and Ks (half saturation coefficient; the substrate concentration at which half the maximum specific growth rate is obtained). Table B-2 lists these parameters for the various hydrogen-utilizing bacteria. (Suthersan, 2002.) From Table 1-3, it can be seen that from the µmax term halorespirators will outcomplete methanogens and sulfate reducers at any hydrogen concentration (at high substrate concentration growth rate m » mmax, and at low substrate concentration µ » (µmax.S)/Ks. However, denitrifiers will probably outcompete halorespirators under most conditions, as their maximum specific growth rate is approximately three times faster than halorespirators. Recently researchers have found that steady state H2 concentrations in the field are controlled by the type of bacteria utilizing the hydrogen. For example, under nitrate reducing concentrations, steady state H2 concentrations were less than 0.05, under Fe (III) reducing conditions were less than 0.2 to 0.8 nM, under sulfate reducing conditions they were 1 to 4 nM, and under methanogenic conditions they were 5 to 14 nM (Figure B-1). Thus, from several lines of evidence discussed above, it is clear to us that an increased rate of hydrogen production will result in increased halorespiration without affecting the competition between various bacteria for the available hydrogen. Attempting to stimulate halorespiration with poor fermentation substrates, as suggested in the past, may unnecessarily limit the amount of dechlorination taking place. Indeed, attempts to limit hydrogen concentration in practical heterotrophic field systems may result in significant portions of the targeted zone not reaching sufficiently reducing conditions for optimum treatment, which can result in sites “stalling” at cis-DCE and Vinyl chloride. Thus, during field scale ERD at contaminated sites, it is clear from the above discussion that the oxidative poise contributed by dissolved oxygen, nitrate, Fe (III), Mn (IV) and sulfate has to be depleted as quickly as possible to achieve efficient steady state reductive dechlorination reactions. Thus it will be prudent to use one of the cheapest fermentable substrate available (see Section 4, Table 4-3) to overcome the oxidative poise, if the other characteristics of that substrate are suitable for the desired engineering design (Suthersan, 2002).
B-2 The Issue of Competition for Hydrogen Viewed in the Perspective of Technology Migration From Laboratory to Field
Recent laboratory research on dehalogenating bacteria such as Dehalococcoides ethenogenes indicates that they have a high affinity for molecular hydrogen and are able to function at lower H2 partial pressures than any of the methanogens. The methanogens achieve higher rates of hydrogen consumption when the hydrogen levels exceed 11 nM. These differences have fueled a search for an ideal electron donor Table B-2. Maximum specific growth rate (µmax) and half saturation coefficient (Ks) for Various H2 utilizing bacteria (modified from Wiedemeier et al., 1999)
Bacterial Strain µmax (hr-1) Ks (mg/L) Halorespirator 0.019950 0.0002 Denitrifier 0.058080 − Sulfate Reducer 0.003936 − Methanogen 0.003792 0.0019

X X X X X X X
5
strategy to optimize the reductive dechlorination process. Three recent papers can be used to summarize results of the optimization investigations. Fennel et al. (1997) provided an evaluation of several electron donor compounds and focused on the issue of hydrogen propagation in the fermentation of these donors. Their objective was to identify electron donors that favor development of dehalogenating bacteria and competitively exclude methanogens. Donors such as ethanol yield a very high rate of hydrogen production which is thought to stimulate methanogenesis. Propionic and butyric acids were donors that the authors expected to yield lower hydrogen propagation rates, theoretically giving a competitive advantage to dehalogenators. Their long-term study results, however, were confounded by the addition of pre-fermented yeast extract and vitamin B12, which have direct reducing power independent of the dehalogenating bacteria. Their short-term studies achieved high rates of PCE reduction, but very little dechlorination of vinyl chloride was observed.
Figure B-1. Range of Hydrogen Concentrations for the Different Anaerobic metabolic Pathways (after Wiedemeier et al., 1999)

X X X X X X X
6
Ballapragada et al. (1997) provided an evaluation of the effects of molecular hydrogen on dechlorinating bacteria. They noted that there is a competition for hydrogen as an electron donor in highly anaerobic systems. Under typical anaerobic system hydrogen levels, the dechlorinators exhibit a higher affinity for hydrogen and they gain more energy from dechlorination reactions than methanogens gain in methanogenesis. The authors hypothesized that at very high hydrogen levels, methanogen biomass might reach formation-clogging levels, but they did not suggest that methanogens would overtake the dechlorinators. They stated
“Assuming that the yield coefficient for dechlorinators is approximately four times that for methanogens, the specific growth rate of dechlorinators is higher than that of methanogens up to approximately 100 ppm H2 partial pressure. Thus, dechlorinators can compete successfully with methanogens up to a H2 partial pressure of 100 ppm, and the competitive advantage is larger at lower H2 partial pressures. H2 seldom exceeds 100 ppm in methanogenic environments, so this analysis indicates that dechlorinators should normally have an advantage.”
It is important to note that the hydrogen partial pressures discussed by Bellapragada represent gaseous-phase measurements. In their experimental system, the 100 ppmv gas phase corresponds to approximately 74 nM H2 aqueous-phase concentration. Yang and McCarty (1998) presented research that continued the investigation of competition for hydrogen in microcosms that were acclimated to benzoate as an electron donor. They summarized the objective of their research as follows.
“Because of such competition, much more electron donor is generally needed to achieve complete dehalogenation than would be suggested by the stoichiometric requirement for dehalogenation alone. This is a potential hindrance to the economical application of anaerobic dehalogenation.”
That argument clearly summarizes the driving force behind the efforts to tease hydrogen threshold concentrations from microcosm studies, an issue that has dominated discussions in this field for many months. Yang and McCarty concluded that electron donor efficiency was maximized when hydrogen levels were held between 2 and 11 nM. As a result of the Fennel and Yang studies (and others, as well), those who use microcosm studies to design field applications of enhanced reductive dechlorination advocate restraint in the propagation of molecular hydrogen – propagate just enough to stimulate the D. ethenogenes but not so much as to stimulate the methanogens. There are two critical problems with this approach. Scale-up – The microcosm studies are conducted in small containers in which the microbial habitat can be closely controlled. The migration from laboratory to field requires more than a 1,000,000-fold scale-up for typical field applications. Scale-up exposes the field application to control problems that are not encountered in the laboratory. Among these are heterogeneities of microbial habitat, microbial populations and groundwater flux, as well as the recharge of electron acceptors.

X X X X X X X
7
Aquifer heterogeneities prevent uniform distribution of any additive to the formation. Regardless of the design intention, any injected fluid will be mixed with the formation fluid at a very wide range of dilutions. It is simply not possible to prescribe an organic carbon injection that can control molecular hydrogen concentrations to plus or minus 5 nM at meaningful distances from an injection point. Attempts to carefully control conditions in order to propogate specific injected organisms often in our view lead to impractical field scale systems. For example, Dybas (2002) and coworkers published results of a field scale demonstration system in which acetate enhanced in-situ remediation of carbon tetrachloride was conducted in a system in which 54,000 l of amended water per week (65% of the total groundwater flux!) was pumped for a year through a line of 15 injection wells spaced on 1 m centers. A specific microorganism was iintroduced but not observed at effective population densities more than three meters from the injection point. Although the system did successfully treat CT at 10-30 ppb we believe that the scale up costs of such a system would be enormous. Even if the carbon distribution problem could be settled, the recharge of electron acceptors prevents the propagation of hydrogen at constant rates across any treatment area. Rationale for exclusion of methanogens - Efficiency of electron donor consumption is the clearly-stated basis for exclusion of methanogens from the reductive dechlorination process. The emphasis currently placed on restraint of molecular hydrogen levels is misplaced in our view. The rate of dehalorespiration increases as the hydrogen level increases, at least up to 74 nM H2 (a level above the range reported by some commercial analytical laboratories!). Even though the stoichiometric efficiency may fall, the overall rate of dechlorination will increase. According to Ballapragada, et al. (1997), the dehalorespiration rate should increase until hydrogen levels exceed 74 nM. Over that broad range of hydrogen concentrations, dehalogenators persist and function at or near their full capacity. None of the authors has suggested a competitive inhibition of dechlorination by methanogens at hydrogen concentrations less than 74 nM. The total rate of dechlorination (dehalorespiration + methanogenic co-metabolism + dechlorination contributions of sulfate reducers and others) may be relatively independent of the contribution of dehalorespirers. Field evidence indicates PCE and TCE degradation proceeding under sulfate-reducing conditions. Full dechlorination, including direct, cis-DCE to ethene conversion is observed under methanogenic conditions. The focus on high-efficiency (near stoichiometric) utilization of electron donors incorrectly presumes that electron donor cost is a major factor in field application costs. In fact, injection well spacing, monitoring frequencies and overall project duration are much more significant contributors to project cost. If an ERD system designer seeks to minimize project costs, the goal will be achieved when chlorinated alkene concentrations are brought into compliance in the shortest possible time. This occurs when low-cost electron donor compounds are applied at rates that generate a succession of microbial consortia, leading to sulfate reducing, dehalorespiring and sometimes, methanogenic zones.
B-3 Why Sites “Stall” Explained in Terms of a “Zonation” Theory of Enhanced Bioremediation Microbiology
Bioremediation of CAHs can proceed at pilot- and full-scale via the formation of distinct subsurface zones characterized by a predominant terminal electron accepting process. Electron donor injected into the subsurface travels at a site specific rate downgradient while being utilized by differing bacterial communities which develop in response to the ever changing, microbiologically processed electron

X X X X X X X
8
donor(s) passing through them. Thus, starting with ERD implementation, what was likely a relatively uniform indigenous bacterial community diverges into “banded” zones characterized by differing dominant terminal electron acceptor processes. For example, near the line of injection wells, the bacterial community in an anoxic aquifer might be dominated by iron reducing or nitrate reducing bacteria that can utilize the sugars present in carbohydrate substrates immediately and are continually provided with an acceptable terminal electron acceptor by upgradient groundwater re-supply. Sulfate reducing and methanogenic and potentially dehalorespiring zones form further downgradient. Even further downgradient once all the substrate is consumed conditions gradually return to the ambient redox state. Assuming an excess of electron donor, the zones formed by these communities reliant on upgradient electron acceptor concentrations would be sized based on the concentration of the upgradient electron donor. Dojka et. al. documented this zonation concept on a vertical basis rather than a lateral basis at a site where a fuel hydrocarbon plume and a CAH plume commingled (Dojka et. al., 1998). As upgradient electron donors are depleted, downgradient zones are selected for and sized based on the presence of the next most energetically favorable electron acceptor available in the groundwater (the immediate area around the injection well itself is usually characterized by a very low redox condition). Downgradient zones can vary in their redox condition with the tendency being for increasingly negative redox values as distance from the injection well line increases. Even further downgradient (hopefully beyond the methanogenic zone) all of the substrate is consumed, and thus the redox potential begins to increase again with distance. Redox is known to influence the degradation of lesser chlorinated CAH daughter products whose accumulation would likely lead to a conclusion that the bioremediation effort is stalled at cis 1,2-DCE. One interpretation that can be drawn from the literature summary in Table 1-1 (2002 ITRC Training Session) is that PCE and TCE can be reductively dechlorinated at higher redox values than are required for the successful reductive dechlorination of cis 1,2-DCE and VC. Therefore, the addition of sufficient carbohydrate substrate to drive redox values into the methanogenic or sulfate reducing range in bacterial zones distant from the line of injection wells is required to prevent the stalling phenomenon. As the electron donor compounds move further from the injection well, a dehalorespiring bacterial community will dominate and form a zone of its own if the genetics for dehalorespiration exist within the bacterial gene pool at the site , and once the most energetically favorable electron acceptor becomes CAHs. Ideally, the dehalorespiration genetics present will be consistent with complete reductive dechlorination leading to shortened plume length due to the favorable kinetics of CAH treatment during dehalorespiration. If the reductive dechlorination stalls at cis 1,2-DCE, or if dehalorespiring genetics are absent from the gene pool at the site, we then rely on the formation of a cometabolic reductive dechlorination zone within the overall zonation scheme in order to achieve complete reductive dechlorination of the CAH contaminant. Site specific hydrogeologic factors, site microbiology, and the rate and concentration of carbohydrate substrate dosing can lead to the formation of a cometabolic reductive dechlorination zone that is some distance from the actual injection well. Methanogens and SRBs are the two metabolic groupings of bacteria that carry out cometabolic reductive dechlorination, which is a less rapid but often adequately fast type CAH treatment. During cometabollic reductive dechlorination, each dechlorination event is an individual chemical reaction and the bacteria responsible do not derive any energy from the event. Thus, rates of reductive dechlorination decrease along with the number of chlorine constituents present on the molecule. The net effect of this phenomenon is what has led many researchers to discredit the usefulness of cometabolic reductive dechlorination since treatment times increase with each sequentially removed chlorine constituent. Though ARCADIS recognizes the limitations associated with

X X X X X X X
9
cometabolic reductive dechlorination rates, we also believe that these rates can be adequate to meet site remediation goals cost effectively in many instances. When the dehalorespiration genetics are absent, and cometabolic reductive dechlorination is predominant, too low a substrate dosing will likely result in stalling after the formation of cis 1,2-DCE because of the inadequate size of the distant downgradient cometabolic reductive dechorination zone. Since any zone that is treating CAHs via cometabolic reductive dechlorination needs to be broad to compensate for the slower process kinetics, substrate requirements increase due to the consumption of substrate in the other bacterial zones between the injection well and the CAH treatment zone. Natural dispersion and dilution of the electron donor must also be overcome. Failure to support the distant downgradient CAH degrading zone with proper electron donors which result from upgradient bacterial processing of substrate will result in stalling. Empirically, ARCADIS observes at its commercial ERD sites that, as dissolved organic carbon becomes limiting, VC builds up in concentration. It should also be noted that the formation of bacterial zones makes the installation of a properly spaced network of monitoring wells critical. When understanding ERD applications using this zonation theory, one can see that if the monitoring wells are installed too close or too far from the injection point, a skewed understanding of system performance will likely result. References specific to this discussion:
Dojka, M. A., P. Hugenholtz, S. K. Haack, and N. R. Pace. 1998. Microbial Diversity in a Hydrocarbon-
and Chlorinated-Solvent-Contaminated Aquifer Undergoing Intrinsic Bioremediation. Applied and Environmental Microbiology. Vol. 64, No. 10. 3869-3877.
Flynn, S. J., F. E. Löffler, and J. M. Tiedje. 2000. Microbial Community Changes Associated with a Shift
from Reductive Dechlorination of PCE to Reductive Dechlorination of cis-DCE and VC. Environmental Science & Technology. Vol. 34, No. 6. 1056-1061.

X X X X X X X
10
Appendix C
APPENDIX C. DISSOLVED HYDROGEN SAMPLING AND ANALYSIS

X X X X X X X
1
APPENDIX C Dissolved Hydrogen Sampling and Analysis The measurement of dissolved hydrogen in groundwater is always two-step process: sampling and analysis. Both steps are critical and special care must be taken by the field crew during sampling to avoid potential contamination/interference of the sample. The most relevant sources of sample contamination/interference include:
• Contamination with atmospheric air
• Generation of hydrogen gas from well construction materials and techniques
• Generation of hydrogen gas resulting from choice of sampling pump employed Standard low-flow sampling techniques are used as the basis for sampling groundwater for dissolved hydrogen analysis as hydrogen is an extremely volatile gas that can easily be lost to the atmosphere if exposed to air. The use of a flow-through cell increases the protection of samples/measurements against atmospheric loss or contamination. As such, Chapelle et al. (1997) describe a gas stripping method (also known as the “bubble strip” method) for dissolved hydrogen sampling of groundwater monitoring wells which has become the accepted method given its relative simplicity and short sampling time. Simply stated, the gas stripping method involves creating equilibrium between the dissolved hydrogen in pumped groundwater (employing low-flow sampling techniques) and a small bubble of either air or nitrogen in a flow-through cell. Since hydrogen gas is extremely volatile, an equilibrium condition is reached fairly quickly. After equilibrium between the liquid and gas phases has been reached, a small amount of the gas phase is withdrawn and analyzed using a hydrogen detector (a typical gas chromatographic technique which in most cases will be conducted by an analytical laboratory). The concentration of hydrogen in the gas bubble after equilibrium is achieved is related to the concentration of hydrogen in the aqueous phase through Henry’s Law and the Ideal gas lab as discussed in the Chapelle paper on page 2875. The lengthy derivation and applicable equations will not be repeated here. Companies such as Microseeps and Vaportech have adopted this technique and have developed relatively straightforward sampling kits using the gas stripping sampling method. In addition to sampling technique, well construction is also critical. Wells with casings and/or screens constructed of iron-containing metals (e.g., cast iron, galvanized steel) have been shown to artificially generate dissolved hydrogen via the reduction of water by metallic iron under anoxic conditions (Chapelle et al., 1997). Wells constructed of PVC are recommended, although stainless steel and Teflon may also be acceptable (Microseeps, 2002; Bjerg, et al., 1997). In addition to well construction materials, the process of well installation itself has been shown to generate hydrogen gas, presumably from the disturbance of soil (Bjerg, 1997). For this reason, at least three months is recommended between well installation and the first hydrogen-monitoring event. Furthermore, the installation of wells or other site disturbances in the vicinity of a monitoring well may generate hydrogen from the soil, which can show up in the monitoring well. The radius of influence of such site disturbances as they relate to dissolved hydrogen measurements is most likely highly dependent on the specific characteristics of the site geology and is therefore difficult to generalize. However, noting nearby site disturbance activities is particularly salient if unusually/unexpectedly high hydrogen results are observed in an adjacent monitoring well.

X X X X X X X
2
The selection of sampling pump is also important and requires careful consideration of several factors including the pump operating characteristics (flow, head) and means of operation. Peristaltic pumps (which draw water under negative pressure) are generally preferred as they are low-flow, minimum turbulence/disturbance, and have been shown to enhance the gas-stripping process required during sampling (Chappelle 1997), though there may be times when conditions dictate that an alternative pump be used (e.g., the required head to be overcome may necessitate the use of a higher head pump). Positive pressure pumps such as piston or bladder pumps may be effectively used, although the surging operation of a bladder pump may cause the instantaneous flow rate to exceed those required to achieve liquid-gas hydrogen equilibrium during sampling. This limitation may be overcome by decreasing the duty-cycle of the bladder pump and/or by pumping into a surge tank with a peristaltic pump to feed the bubble strip sampling apparatus (Microseeps). Submersible pumps should be avoided as the electrical current passing through the monitoring well may produce hydrogen gas from water via electrolysis. References
Bjerg, P.L., Jakobsen, R., Bay, H., Rasmussen, M., Albrechtsen, H., and Christensen, T.H. (1997). Effects of sampling well construction on H2 measurements made for characterization of redox conditions in a contaminated aquifer. Environ. Sci. Tech., 31(10).
Chapelle, F.H., Vroblesky, D.A., Woodward, J.C., and Lovley, D.R. (1997). Practical considerations for measuring hydrogen concentrations in groundwater, Environ. Sci Technol., 31(10).
Microseeps. Marketing literature and sampling instructions. Pittsburgh, PA: www.microseeps.com.