Embed Size (px)
Citation preview

.AD
TECHNICAL REPORT 79
IIIIIIIII~ OCONUIS DEFOLIATION TEST PROGRAM
Rnbert A. DarrowGeorge B. Truchelut
Charles M. Bartlett
July 1966
[ ..e.E e e...
Sponsored by
Advanced Re~search Projects Agency
Project AgileARPA Order 423
,..lnbrt . D rro
UNITED STATES ARMY*BIOLOGICAL CENTER
FORT DETRICKooo6o0
;'o....:".. eog B T0ho0•::1:: :1: @0 Soo0
i::":::.'.. ,, Care M Brt 0

DDC AVAILABILITY NOTICE
Reproduction of this publication in whole or partis prohibited except with permission of the Direc-tor of Technical Information, Advanced ResearchProjects Agency, Washington, D.C., 20301. However,DDC is authorized to reproduce the publication forU.S. Government purposes.
DISTRIBIMON STATEEfIIT
This document is subject to special export controlsand each transmittal to foreign governments or for-sign nationals may be made only with prior approvalof the Director of Technical Information, AdvancedResearch Projects Agency, Washington, D.C., 20301.
DISPOSITION INSTRUCTIONS
Destroy this publication when it is no longerneeded. Do not return it to the originator.
The findings in this publication are not to beconstrued as an official Department of the Armyposition, unless so designated by other authorizeddocuments.
a..
U.S. ARMY BIOLOGICAL CENTERFort Detrick, Frederick, Maryland
TECHNICAL REPORT 79
OCONUS DEFOLIATION TEST PROGRAM
This research was supported by theAdvanced Research Projects AgencyProject Agile under ARPA Order 423
Robert A. DarrovGeorge B. TruchalutC.arles M. Bartlett
Crops DepartmentBIOLOGICAL SCUMCES LABORATORY
Project APA Order 423 July 1966
I:
* A
2
ACKNOWLEDMIS
The assistance and cooperation of many staff meobers of the MilitaryResearch and Development Center of Thailand and the affiliated AdvancedResearch Projects Agency, Research and Development Field Unit are grate-fully acknowledged. Major General Sinchai Menasuta, former Director ofthe Military Research and Development Center and Mr. Thomas V. Brundage,former Director of the Advanced Research Projects Agency, Research andDevelopment Field Unit of Thailand were extremely helpful in Lnitiatingthe program and in securing necessary authorization and approval fromThai military and government authorities. Colonel Niyom Surat-Bhibit ofthe Royal Thai Army, and Captain Sonchai Chanhiran of the Royal Thai Navy,project officers on the defoliation program of the Military Research andDevelopment Center, worked closely with project personnel from the U.S.Army Biological Center in the design and execution of the test programand in maintaining liaison with military personnel at the Royal Thai ArmyReplacement Training Center.
Lieutenant Colonel W.R. Scheible, Program Ma-Aagoz for EnvironmentalResearch for the Advanced Research Projects Agency, Reaicrl;h and Develop-ment Field Unit of Thailand, and Captain John W. Kelley, Jr., ProjectOfficer in Environmental Research, gave valuable support and assistancethroughout the entire program.
Acknowledgment is given to Major General Panom Chotipual and Bri.gadierGeneral Chao Swasdisongkram, comanding officers of the Royal Thai AcrTReplacement Training Center, for assistance and facilities provided atthe test location.
George A. Roth, Cowearcial Air Services, Honolulu, Hawaii, servedas consultant in the modification of the aerial-spray distributionsystem at the test location in April and May 1964 and in March 1965.
i

3
• i ABSTRACT
A test program VWs conducted in Thailand in 1964 and 1965 to determine* the effectiveness of aerial applications of Purple, Orange, and other candi-
date chemical agents in defoliation of upland jungle vegetation representa-tive of Southeast Asia on duplicate 10-acre plots. Aerial spray treatmentswere applied at rates of 0.5 to 3.0 gallons per acre on two test sitesrepresenting tropical dry evergreen forest and secondary forest and shrubvegetation. Applications were repeated in alternate 2- to 3-month periods
* to determine minimal effective rates and proper season of application.
Defoliation affectiveness was evaluated by (L) visual etcimates of over-all vegetation and individual species defoliation' (ii) measurements ofchanges in canopy obscuration by a vertical photography technique, and(iii) measurewnts of changes in horizontal visibility of a human-sizedtarget at various ranges.
Data provided by these techniques were used in comparative evaluationof defoliant chemicals in relation to rate, volume, season of application,canopy penetration, and vegetation response.
,MW

4
This report presents the results of a test program to determine theeffectiveness of Purple, Orange, and other candidate chemical agents indefoliation of upland forest or jungle vegetation representative of South-east Asia. The program was conducted in Southwest Thailand by personnelfrom the U.S. Army Biological Center in collaboration with the ARPA Researchand Development Field Unit in Thailarid and the Military Research and Develop-ment Center of Thailand.
Aerial spray treatments were applied on two test sites representing atropical dry evergreen forest, and secondary forest and shrub vegetationduring the period 2 April 1964 to 4 June 1965. Spray applications weremade with a Beechcraft Ten-Two (modified C-45) aircraft equipped with a180-gallon tank, air-driven pump, and underwing boom system with diaphragujet nozzle*. Spray deposit volumes, swath pattern, and droplet sizes wereobtained for each chemical mixture in the treatment series at a calibrationgrid near the test sites.
Applications of Purple, Orange, and Pink at rates of 0.5 to 3.0 gal/acrewere made in alternate 2- to 3-month periods to determine minimal effectiverates and proper season of application. Cacodylic acid and other desiccantsand herbicides were evaluated in dry season and rainy season applications.Treatments were made on duplicate 10-acre plots, approximately 300 by 1500feet.
Evaluations of defoliation response were made at weekly and monthlyintervals by: (i) visual estimates of over-all vegetation and individualspecies defoliation, (ii) measurements of changes in canopy obscurationby a vertical photography technique, and (iii) measeurement of changes inhorizontal visibility of a human-sized target at distances of 10, 15, and20 meters. Effective defoliation was considered to include ratings of 60%or nore as evaluated by the visual estimate and vertical photographictechniques. In the evaluation program emphasis was given to determinationof the periods of maximim and effective defoliation and the degree ofdefoliation response in reLation to chemicals and dosage rates applied.
Results of the teat program shoed that:
I) Purple, Orange, Pink, Dinotol,, ad Tordon were effective forlong-term defoliation.
2) Cacodylic acid and diquat wer.e effective desiccants for rapid,short-term defoliation. •sximum defoliation occurred 2 to 4 weeks aftertreatment.
3) Dicamba gave marginal but generally ineffective defoliation.Kerphes or Felex, ludothall, tributyl phosphate, butyne diol, and amitrolewere ineffective in defoliation.
* 4°

5
4) Purple and Orange were essentially equivalent in all respects.Pink was equal to Purple or Orange at slightly lower application rates.
* 5) Minimum effective rate of Purple and Orange it. derse forestvegetation with multiple canopy was 2.0 gal/acre (15 lb/acre acid equiva-lent) applied during the rainy or growing season. Applications made atthis rate were effective for 4 to 6 months after treatment.
6) Minimum effective defoliation with Purple and Orangi wasobtained with rainy season applications of 1.5 gal/acre in foreut endsecondary shrub vegetation of light to moderate iensity and with a singlecanopy.
7) More complete defoliation and a longer duration of effectivedefoliation response was obtained in all vegetation types with applicationsof Purple and Orange at higher rates of application (2.5 to 3.0 gal/acre).
8) Pink gave effective defoliatfon at slightly lower rates thanPurple or Orange. Minimum effective dosage of Pink appeared to be 1.0 to1.25 gal/acre (8 to 10 lb/acre acid equivalent) in rainy season applications.Applications at 2.0 gal/acre gave effective defoliation for 8 to 9 months.
9) Cacodylic acid or sodium cacodylate applied in water solutionsat rates of 5 to 6 lb/acre gave effective desiccation and defoliation ofundisturbed forest and secondary forest and shrub vegetation ii, both rainy-and dry-season applications.
10) Diquat was equivalent to cacodylic acid in defoliation responseat rates of 3 to 5 lb/acre. Diquat was effective only in growing-seasonapplications.
11) Limited tests indicated that Tordon applied singly or in mixtureswith 2,4-D, diquat, and Orange was highly effective on a per-pound basisbut gave generally slower defoliation response than Purple or Orange.
12) The defoliation responses to aerial applications of Purple,Orange and other similar chemicals were influenced more by rate than byvolume of spray solution applied. Applications of 1.0 to 1.5 gallons
per acre of Purple, Orange and Pink as pure chemical gave similar defolia-tion responses to applications of the same amount of chemical diluted with
one or more volumes of diesel fuel.
13) Minimm application volumes coensurate with good spray depositsproved to be about 1.5 gallons per acre for oil-soluble chemicals (Purple,Pink, Orange), and 2.5 to 3.0 gallons per acre for water-soluble compounds(cacodylic acid, diquat, Tordon).
14) Good penetration of sprays, and therefore, most effectivedefoliation responses were obtained more readily on shrubby secondaryforest than in a dense, undisturbed forest with multiple canopy.

6
15) Optimom droplet sizes for rapid fallout and best penetrationproved to be in the range of 275 to 350 microns *WD.
16) Responses to all systemic herbicides, such as Pink, Purple,Orange, Tordon, and Dinoxol vere much better during the rainy season withits generally favorable soil moisture and growing conditions than duringthe dry season.
17) Some combinations of herbicides were found to have very promis-ing prospects, but need more extensive evaluation in the future. The bestcombinations were 2.3 pounds of Tordon plus 5.3 pounds of 2,4-D and 1.2pounds of Tordon plus 2.5 pounds of diquat. These mixtures were effectiveat rates of 1 to 3 pounds of Tordon per acre with the associated compoundin proportion.
18) Maxims- defoliation responses of 85 to 95% were recorded, but* complete defoliation of all species was not obtained in any plot.
19) Visual estimates and measurements of canopy obacuratLon fromvertical photographs gave closely comparable evaluations of defoliationeffectiveness. Horizontal visibility measurements gave lower values fordefoliation than visual estimates or canopy obscuration measurements.Changes in horizontal visibility due to chemical treatment reflected defolia-tion sustained by the shrub understory.
On the basis of evaluations completed in August 1965, the followingS recommendations were made:
1) For fast, short-term defoliation in light to moderate vegetationcover 5 to 6 lb/acre of cacodylic acid (7.7 to 9.2 lb/acre of Blue containing65% active ingredient) should be applied in 2.5 to 3.0 gal/acre of spray.
In dense forest with multiple canopy, applications of cacodylicacid at 5 to 6 lb/acre my be repeated 2 to 4 weeks after initial treatmentJ to insure penetration to lower vegetation level and to extend the period ofdefeliation.
M.xiss= effect is obtained 2 to 4 weeks after application.
Treatment may be made during rainy and dry seasons.
2)' For effective defoliation and moderate duration of effect (3 to 4nths) Purple or Orange should be applied during the rainy or growing season
at the rate of 1.5 to 2.0 gal/acre in vegetation with light to moderate coverand single canopy and at 2.0 to 2.5 gal/acre in dense forest with multiplecanopy.
Maxismtm defoliation occurs 2 or 3 months after application.

7
In dense vegetation, repeat application 2 months followinginitial treatment may be needed for effective defoliation in understoryvegetation and for extended defoliation effect.
3) For maxi-mu defoliation and duration (6 months or more), Furpleor Orange should be applied during the growing season at rates of 2.5 to 3.0gal/acre, of undiluted chemical.
Heavier rates are required during the dry season for comparabledefoliation response.
I.
i'I

9
CONTENTS
Acknowledgments .................... . 2Abstract .................. ............................ ... 3Digest .-.................................... ........ 4
I. INTRODUCTION . ................................ ......... 13
II. OBJECTIVES AND GENERAL SCOPE .............................. 16
III. TEST LOCATION AND OPERATIONikL FACILITIES ....... . . . 18A. General Climate and Vegetation of Test Location ......... .. 18B. Physiography and Vegetation of the Test Sites ........... ... 18C. Operational Facilities ........... .................... .22
iV. TknoT SITE PREPARATION ................ ...................... 24A. Access Lanes ............................... 24B. Evaluation and Camera Station Trails ............ 26
V. AERIAL SPRAY EQUIPMENT ........... ..................... .. 27
VI. CALIBRATION OF SPRAY DISTRIBUTION SYSTEM ..... ............ .29A. Pretreatment Calibration. ................... . .29B. Calibration During Test Application Period ... ......... .. 30
VII. VEGETATION INVENTORY ........... ...................... 35
VIII. TREATMENT APPLICATION ........ ...................... 38A. Plot Selection ........................................ 38B. Marking of Plots for Aerial Spray Application . ....... 38C. Preparation and Loading of Chemical Spray Solutions . . . 40D. Aerial Application ....... .... ................. . 43E. Laboratory Analysis of Spray Deposit Rates and Volumes
from Grid Calibration ........... . . . . . . . 44
IX. EVALUATION TECHNIQUES .......... ...................... 46A. Rationale ................ .......................... ... 46B. Visual Estimates of Defoliation ..... ............... .. 47C. Vertical Photography . ................. 48D. Horizontal Visibility .. ............. ..... 51E. Aerial Photography ............. . . . . . 54
X. RESULTS ......... . . ................. 55A. Visual Estimates of Defoliation . ........ ... . 55B. Measurement of Upper Canopy Defoliation by Vertical
Photography ........... ............. 65C. Horizontal Visibility ..... . . .. .. . . . . . ... 73D. Aerial Photographs ..................... 78E. Evaluation of Chemicals . .......... o * * .. . .. .. 83

10
XT. DISCUSSION ............ . . . . . . . . . . 105A. General Responses to Defoliant Chemicals ... . ... . 105
B. Criteria for Evaluation ...... ................ . .. . 111C. Interpolation of Results . . . . . . ............... * . . 112
XII. CONCLUSIONS AND RECOMHENDATIONS .... .. . 114
Literature Cited................................. . . . .119Distribution List... . . . . . . . . . . . . . *. . 147
APPENDIXES
A. Chemicals Used in Test Program . . . . . ............ 121B. Specifications of Aerial Spray Distribution System . . . . ... 127C. Determination of Spray Deposit Volume, Swath Width, and
Droplet Size . . . . . . . . 131D. In-Flight Data Form 139E. Description and Operation of Obscurimeter Used in Vertical
Photography Evaluation ..................... 141F. Personnel ........................... . 145
1. Test Site I Showing Access Lanes, Plot Numbers, TreatmentNumbers, and Data* of Application . .. .o. .. o.. ... .. 19
2. Test Site II Showing Access Lanes, Plot Numbers, TreatmentNumbers, and Dates of Application .. . * . .. * . . . . . ... 20
3. Plot Detail Shoving Camara Stations and Treatment Pattern . . o . 254. Access Lane at Test Site I Showing Dense Forest Vegetation .'. . 265. Boom System and Air-Driven Pump under Fuselage . . . 286. Grid Crew Removing Deposit Plate@ from Collection Stations 'o .0 . 317. Telescoping Meteorological Tower at Grid Area for Obtaining Wind
Direction and Velocity Measurements at the Spray Altitude . . . . 328. Anemometer Console for Wind Direction and Velocity Readings . . . 339. Supplemental Weather Station at Test Site I ........... 34
10. Crew Raising Plot-Marking Flag into Position Above UpperCanopy .... 00.... .. .. .. .. .... .0*00ea96 39
11. Plot-Marking Flag in Position Above Righest Canopy Level . .e. . 4012. Preparation of Spray Mixture in 55-Gallon Drum Prior to
Aircraft Loading . . . . . . .. .. .. .. . . . .. .. ... 42
I

S~11
13. Laboratory Determination of Spray Deposit from GridCalibration . . . . . . . . . . . . . . . . * a * * * * * 45
14. Vertical Photography Technique . . . . . . . .. .*. . . . .. . 49
15. Diagramatic Drawing of Obscurimeter used in VerticalPhotography ................ .................... . . . 50
16. Target used in Horizontal Visibility Technique . . . . . . . . . 53
17. Trends in Maximum and Average Defoliation for Six MonthsFollowing Treatment by Purple in Relation to Dosage Rate . . . . 62
18. Seasonal Changes in Canopy Obscuration on Untreated ControlPlots ... .................... ........... . . . 70
19. Relation of Maximum Per Cent Decrease in Canopy0bscuration toDosage Rate of Purple . . . . . . . . . . . . .. . . . . . 71
20. Duration of Defoliation Response from Application of Purpleas Related to Dosage Rate . . . . . . . . . . . . . . . . ... 72
21. Defoliation Response of Dicamba, Cacodylic Acid, and Diquat inRelation to Rate of Application .. .. .. .. .. ....... * 74
22. Relation of Maxim=m Increase in Horizontal Visibility to DosageRate of Purple Applied . . . . . ..... . 77
23. Portion of Test Site I Showing Treated Plots between Lane 3 andLane 8 ... . . . . . . 79
24. Portion of Test Site Ii Shoving Treated Plots on*LanesG,,and N in Upper Left . . . . . . . . . . . . . . . ....... 80
25. Detail of Portion of Test Site I Showing Dense Forest Canopyand Plot Treatments between Upper Lanes 1 and 3 . . . ...... 81
26. Detail of Test Site II Showing Partially Cleared ShrubbyVegetation and Treatment Plots between Lanes Q, P, and 0 ..... 82
27. Defoliation Response from Purple Applied at 27 lb/acre at TestSite 11. . . . . . .. . . . . . . . 84
28. Defoliation Response from Orange Applied at 21 lb/acre on TestSite 11. . . . . . .. . . . . . . . 90
29. Defoliation Response from Cacodylic Acid Applied at 4.5 Ib/acre30 Seso oitiat Test Site 1 .i . .Untreate.... . 94
30. Seasonal Foliation Changes at Test Site ! in an Untreated ControlotPlot . . . . . . . . . . . . . . . . . . . . . .. .. . 106
31. Seasonal Foliation'Chan~ges at Test'Site iloin aUnreaecontrol Plot o.o.o.o.. o.o.o.. 0... 0.... 0..... 108

12
1. Herbicides, Defoliants, and Desiccants Included in the DefoliationTest Program .. e.a. . ..................... 17
.• 2. Per Cent Composition and Frequency of Principal Woody Species ini'i the Dominant, Intermediate, and Shrub Layers of Test Sites I
anrd 11 ......... . ... . . . . . ... 363. Visual Estimates of Vegetation Defoliation fr~om' Appilcation8,o
Purple, Pink, and Orange on Test Sites I and 11 from April 1964to June 1965 . . . . . . . . . . . 56
4. Visual Estimates of Defoliation by Selected Defoliants andDesiccant Treatments for a Six- to Nine-Month Period afteriTreatment .... 58
5. Visual Estimates of Defoliation by Selected Herbicide Treatmentsfor a Six- to Nine-Month Period after Treatment.......... 59
6. Effects of Purple, Orange, and Related Herbicides on Upper CanopyFoliage as Measured by Change in Vertical Obscuration . .. . . . . 66
7. Effects of Selected Desiccants and Herbicides on Upper CanopyFoliage as Measured by Change in Vertical Obscuration .... . 68
8. Effect of Tordon and Mixes Containing Tordon on Upper CanopyFoliage as Measured by Change in Vertical Obscuration . . .. .. . 69
9. Initial and Maximum Horizontal Visibility Resulting from1.Applications of Purple, Orange, Pink, and Dinoxol . . . . o . * 7510. Initial and Maximum Horizontal Visibility Resulting from
Applications of Selected Desiccants and Herbicides . # . . .. . 76l1. Defoliation Response with Purple Using Three Evaluation
+ Techniques • 8612. Mean Axinnm Defoliation Responses on Test Sites I and II from
Selected Treatments . o o . . ..o. . . . . . .. . ..0. . . .. . . 10913. Chart of Recomundatione ...................... 115
A
...I. i

13
1. IUTRODUMTON
The defoliation of native vegetation by application of chemical defoli-ant agents offers a valuable tool in military tactics, particularly incounterinsurgency operations. Defoliation with the interim agent Purplehas been successfully conducted on an operational basis in the Republicof Viet Ham (RVN) to reduce the incidence of ambush along principal routesof travel. Defoliation operations have been particularly effective in themangrove vegetation along canals and the drainage systems in the VN.'sOther applications have been made in upland forest vegetation or jungleat several locations.
This report presents the results of an extensive test program con-ducted in Thailand to determine the effectiveness of Purple and othercandidate chemical agents* in defoliation of upland forest or junglevegetation representative of Southeast Asia. The program was conductedby personnel from the U.S. Army Biological Laboratories*" at Fort Detrick,Maryland, at the request of the Advanced Research Projects Agency (ARPA)of the Department of Defense under Directive Order 423, 30 January 1963.
Military interest in the use of chemicals for defoliation of tropicaland temperate vegetation was expressed as early as 1945. Since thisperiod, a substantial body of information on chemical defoliation hasbeen assembled by the U.S. Army Biological Laboratories through green-house and exploratory field tests . The first extensive aerial applica-tions of chemicals for military defoliation of forest vegetation wereconducted at Camp Drum, New York in 1959.4 They demonstrated the effec-tiveness of a mixture of undiluted butyl esters of 2,4-D and 2,4.,5-Tapplied at approximately 0.75 gal/acre in the defoliation of a mixeddeciduous and conifer forest. These tests served as a basis for therecommendations of Purple for operational tests in the RIV sponsoredby ARPA.
In 1961 and 1962, Dr. James W. Brvow of Crops Division of the U.S.Army Biological Center conducted aerial and ground spray tests withPurple and several other chemicals in the RVN area under sponsorshipof ARPA.a'e' 7 Evaluations of the early operational tests of Purpleled to a preliminary recomended application rate considared to bemore than adequate to produce the destred results.2
The need for additional information on effective defoliation andthe limitations on an adequate test program Imposed by guerrilla warfareconditions in RVN led to the development of the present program in
Chemical names of Purple and other defoliants used in the program aregiven in Section 11.
** The name of these Laboratories was changed to U.S.- Ary BiologicalCanter early in 1966.
-i . 14I• .. •• .. • ÷

14
Thailand under a similar climate and with sim lar vegetation. Prior tothe development of a test plan, joint discussions were held by AiPA andU.S. Army Biological Center representatives with personnel from the CropsProtection Research Branch of the Agricultural Research Service of U.S.Department of Agriculture in the selection of suitable chemicals andcriteria for their Inclusion in the proposed program. A test plan andresearch project outline were developed in March ".963 outlining a two-year program to be conducted by personnel from U,.S. Army BiologicalLaboratories.8
The program was initiated in April 1963 in collaboration with theMilitary Research and Development Center of Thailand (MM•J), then knownas Combat Development and Test Center (CDTC), and its United States cam-ponent, the ARPA Research and Development Field Unit-Thailand (R&dFU-T).The defoliation test program has functioned in the AltA 3&DFU-T under theadministrative guidance of the Program Manager for Environnmetal Research,Lieutenant Colonel W.R. Scheible, and under the technical direction of theU.S. Army Biological Center project leader. Close cooperation and guidancein relations with Thai military and government officials in the initiationand execution of the project were given by the Commnding Generals of lDC,General Sinchai Nenasuta and Air Vice Marshal Manob Suriya; and by the ThaiProject Officers assigned to the defoliation test program, Colonel IiuYmSSurat-Bhtbit, Royal Thai Army, and Captain SonchaL Chenhiran,.Royal ThaiNavy.
After general discussions on the organization and requirements forthe project Vith officials of the MRDC and general reconnaissance ofpossible test locations, arrangements were made for the initial phasesof the test program to be conducted at the Replacement Training Centerof the Royal Thai Army near ]ranburi, southwest of Bangkok. Final approval
and authorisatien for the project by Thai governmental and military authori-ties was obtained in August 1963.
Test site #reparations Involving the survey and clearing of accesslanes were initiated in August 1963. in late December 1963, a twLn-engineBeechcraft airplane equipped with a spray distribution system was madeavailable to AMPA R&DFU-T for primary use in the defoliation teat prgrvamunder ARPA Order 483. Calibrations of the airplane spray equipment andtest site preparatLon. were continued until April 1964 when the testapplications were initiated. Field operation headquarters were locatedat Rua fin about 21 miles (35 in) from the test sites. An aircraftmaintenance shop and leading and storage facilities for choufcals wereprovided at the Nue Kin Airport. Technical supervision of the test pro-gram was given by military and civlian personnel on a temporary duty(TDY) basis from the U.S. Army Biological Center.*
Persennel participating in these trials are listed in Appendix F.
ic,4 j *

15
Under a revised test program an 1 November 1964, priary emphasis wassiven to determine minimal eoffective rates of Purple and its operationalreplacement, Orange. Secondary consideration yas given to the evaluationof other defoliants. Under this teat plan, treatments were limited to asingle test location.
This interim report ptasents the evaluation data and tentative recom-mendations based on assesi •nts made through September 1965 on teat apnpli-cations completed in June l965. An additional report will be published inSeptember 1966 to include fur•-er evaluations of the long-term effectsthrough June 1966.
iI
7 I
16
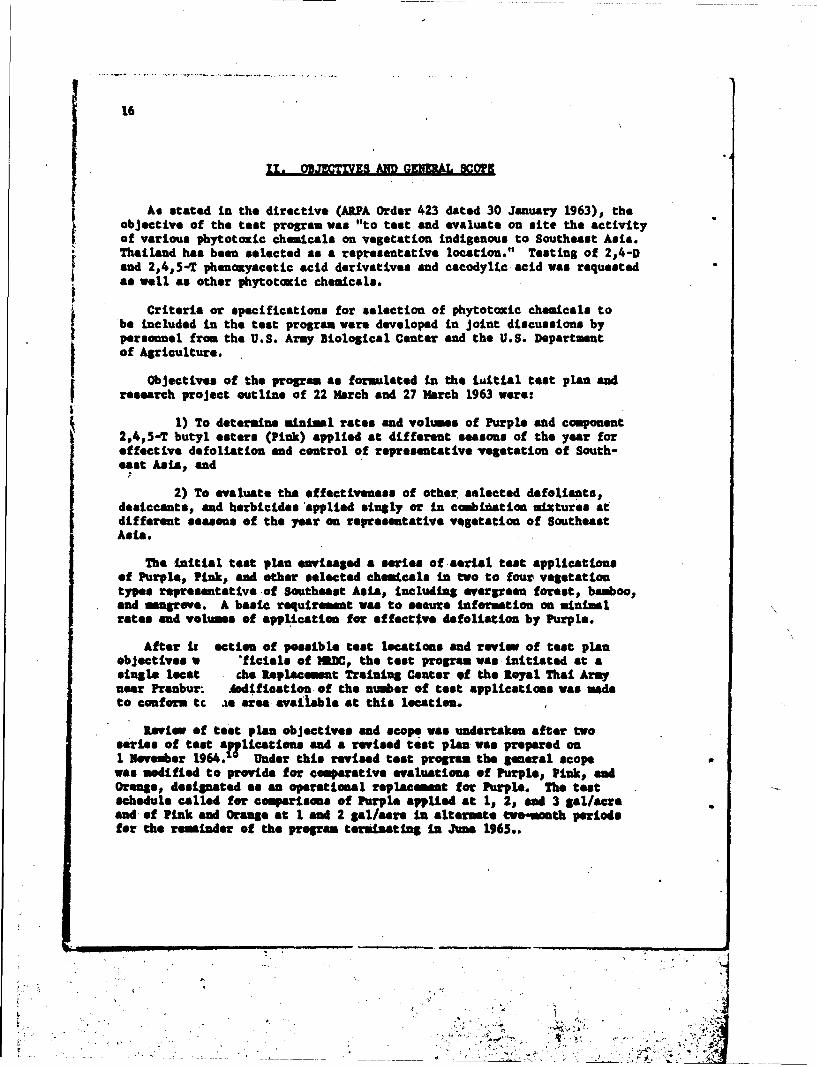
11, OBMTES AND GE1•EAL SCOPE
As stated in the directive (ARPA Order 423 dated 30 January 1963), theobjective of the test program was "to test and evaluate on site the activityof various phytotozic chemicals an vegetation indigenous to'Southeat Asia.Thailand has been selected as a representative location." Testing of 2p4-Dand 2,4,5-T phenaxyacetic acid derivatives and cacodylic acid was requestedas well as other phytotacKic chemicals.
Criteria or specifications for selection of phytotoxic chemicals tobe included in the test program were developed in joint discussions bypersonnel from the U.S. Army Biological Center and the U.S. Departmentof Agriculture.
Objectives of the program as formulated in the iuitial test plan andresearch project outline of 22 March and 27 March 1963 were:
1) To determine minal rates and volumes of Purple and component2,4,5-T butyl esters (Pink) applied at different seasons of the year foreffective defoliation and control of representative vegetation of South-"east Asia, and
2) To evaluate the effectiveness of other selected defoliants,desiccants, and herbicides applied singly or in combidation mixtures atdifferent seasons of the year on representative vegetation of SoutheastAsia.
The initial taot plan envisaged a series of aerial test applicationsof Purple, Pink, and other selected chemicals in two to four vegetationtypes representative of Southeast Asia, Including evergreen forest, bamboo.,
rnd s•ewe. A basic requirement was to scures Infotuation on minimalrates and volume of application for effective dafoliation by Purple.
After it action of possible toot locations and review of test plan
objectives w "ficall of MWC, the test program was initiated at asingle loc t che Replacmest Training Center of the loyal Thai Armynear Prenbur: Aedifioation of the number of test applications was madeto conform tc as area available at this location.
leview of toot plan objectives ad scope was underten after twosers of test a•lications and a revised test plan was prepared on1 November 1964 .1 Under this revised test program the general scopewas modified to provide for c€soarative evaluations of Purple, Pink, andOrange, designated as an operational replacement for Purple. The testschedule called for cemparisons of Purple applied at l1 2v and 3 gal/acreand of Pink and Orange at I and 2 gal/acre to alternate tw.omonth periodsfor the reminder of the program tesrmdating In Jume 1965..
I - -A
Y_,.

17
Tests of other chemicals yore to be conducted in alternate periods,utilizing supplies of chemicals on hand.
Common and chemical names of the herbicides, defoliants, anddesiccants used in the test program are shown in Table 1. Additionaldata on characteristics and cost of these chemicals are shown inAppendix A.
TABUK 1. RMJICIDESp DEFOLIANTS, AND DESICCANTS INCLUDED
IN THE DEFOLIATION TEST PROOMA
Code or
Purple Mature comailst La of501 a-biatyl esaer of 2,4-dichlotophosarymestle asid301 a-Wstyl aster of 2,4,5-tricbloropbeaosyseetic said201 is.-bst7l *sari of 2,4,5-tuiCbki - * 4. aeU6 "I
301 a-butyl *satr of 2:4-diehlaoubaoihmaseetis said
Ko3k Mature esosiat Lag ofWX a-butyl aster401 iso-batyl *star of 2,4,S-triahaehmnete acid
Dimaml Commarstal formlatims emaisat Lg of31.61 butary ethasel eater of 2,4-d1biehlrohmpeaeette said30.3n batmy ethamet estar of 2,4,3-triehloropbomamyeetie "Aci
Terde. COMrISTl fesmlatiOm eeaiatiue OfPslalre.am or a-,,4tih~rpe~i aci, as the
* Potassium salt
INuJAK AN DBU1C*II
Diquet Il'tym-2dpryi eatiesDuty". iol 2-satpme-l,4-dial
ýbrie ?r~hutyl sbeepbarotrithieitt
70t= ?ributyl Pwhyeregb trithieito
bidethell soid 3,4'mG bdepta± UsidA
leietball salt Kosaedii3,6 adnian hfertal as"i
ftibeatyl pbesibste Ttftftyl ybeephete
Gasmeyipi as"A 3imehyl antaia soidlmbedie ecepa) sedim salt me dineftl erelal. said
Dieaembhh3*dilrbee soid

18
,II. TEST LOCATION AND OPERATIONAL FACILITIES
The defoliation test program was conducted on lands of the ReplacementTraining Center of the Royal Thai Army (Khat Thanarat) southwest of Rua Kinin northern Prachuab Xhiri Khan Province on the Kra Peninsula. The twotest sites were located at a latitude of 12 degrees 20 minutes north, anda tongitude of 99 degrees 50 minutes east, approximately 21 miles (35 km)from Hua Hin.
A. GENERAL CLIMATE AND VEGETATION OF TEST LOCATION
The test location is characterized by a tropical monsoon climate and adry semi-evergreen forest similar to the climate and vegetation of much ofthe RVN and adjacent portions of Southeast Asia.
Climatic records from Hua Bin near the test location show the area tohave a marked seasonal contrast in precipitation.1 2 The rainy season startsin May and ends in December with maximtm precipitation occurring in September.The dry season extends from December until early May and includes both thecoolest month (December) and the hottest month (April). Temperatures inthe Kra Peninsula at the test location are relatively uniform throughoutthe year because of low b-Ititude and proximity to the Gulf of Siam. Meandaily maximum temperatures at Rua Kin range from 91 F in April to 85 F inDecember; minimum temperatures are from 75 to 70 F in April and December. 1 8
The relatively low annual precipitation at Rua Kin of about 40 inchesis caused, in part, by the interception of southwest monsoon moisture bythe Tennasserim Mountains to the west along the Thailand-Burma border.
The general vegetation at the test location is a dry evergreen forestcharacteristic of the foothills of the Tennasserim Range in the provincesof Ratburt, Petchburi, and Prachuab Shiri Khan. 1 This type of forestoccurs on the coastal peneplain and in the valleys of the foothill rangesin a precipitation sone of 40 to 80 inches. The forest cover is somewhatlower in stature and includes a greater proportion of Asciduous trees thanthe tropical evergreen forest that attains maxismm development on the EraPeninsula south of Prachuab Rhirt Rhan and in southeast Thailand.
3. PHYSIOGRAPi ANID VEGETATION OF THE TEST SITES
Two areas herein called Test Sites I and II were delineated by theComnding Officer of the Royal Thai Army Replacemant Training Canter foraerial applications of chemicals in the test program. Total treatmentareas of 1400 acre (3500 rai) and 2000 acres (5000 rat) were allocatedfor Test Sites I and II, respectively. Maps of the test sites showingindividual treatment plots are shown in Figures I and 2.

19
12 12
as
7
816
to ;p Is 0
Figure 1. Toes $ite I showing Accebs Lamee PltVN&rmTr.atimn~t Uw~ers, and Dates of Applicetim.

20
4U
Figure 2. Test Site 11 Shwing Access Lease, Plot N3sbellpTreatment Numbers, and Datee of Applitatiom.

21
1. Test Site I
Test Site I was located west of the Pranburi River in a valleybordered on the west and partially on the east by low mountainous ridgesthat varied from 300 to 1500 feet in height. The test area was more thanone mile wide near the southern end and narrowed at the north end wherethe two ridges are closer together. The area was approximately 3 mileslong, north to south.
The forest cover of this site war intermediate between evergreenrainforest and deciduous monsoon forest and many species characteristicof each type were found in the test area. The dominant species, however,were mostly the deciduous types of the monsoon forest, and the site hasbeen classified as dry, semi-evergreen forest by Professor Ter Smitinand,Cuorator of the Forest Herbarium, Forest Products Research Division, ThaiRoyal Forest Department. 1 '
The forest in this area was divided roughly into three layers orstrata. The overstory or dominant canopy consists of rather scatteredvery large deciduous trees. Species in this upper level included:Mansonia saxei. Diospyros coaetanae Lagerstroemia floribunda L. loudoniiMillettia leu'antha. Spondias mangifera and Manilkara hexandra.
The intermediate layer, mostly of broad-leaved evergreen species,ranged from 30 to perhaps 75 or 80 feet in height. Species includeprincipally Streblus zeylanica Cleistanthus dasyphyl1as. Celtis collinsaeAtalanta svinosa. Diospyros cauliflora. Euphorbia triaona and Memecylonovatum.
The understory of small trees and shrubs included Grewia sp.,Mitrephore sp. and MitraMva sp., along with smaller specimens of thornyStreblus xeylanice that form dense thickets in places.
2. Test Site IT
Test Site 1I was located east of the Pranburi River and off theaccess road from the headquarters of the Replacement Training Center tothe artillery ranges. The terrain at this site waa mostly level with afew scattered hills.
Most of the area consisted of secondary growth of shrubby uplandforest with a few remacats of the original forest of broad-leaved ever-
"* *green and deciduous trees. Principal trees in the dominant or uppercanopy included: Lagerstroemia floribunda. Dialium indum and Diospyroscoaetanae. Bamboo, mbuea arundinacea, was dominant in a portion ofthe secondary forest, together with Memecylon vatum. Streblus zeylanicaHydnocaruus ilicifolius, and Vitex quinata.

22
Approtimately 220 plant species have been identified from the twotest sites.
That the vegetation in the test areas was similar to that of theRVN is shown by the following partial list of trees and plants found inboth places.iS
TREES
Manilkara hexandra Ficus callosaDiospyros mollis Ficus EeniculataMemecylon floribundum Bomnbax insineStreblus esper Tamarindus indicaFicus hispida Atbizzia nrtiophylumFicus altissima Caoparis micrantha,
LARGE GRASSES
Bambusa arundinacea + other bamboosSaccharum spoutaneum
SHRUBS AND VINES
Passiflora foetidaEupatorium odoratum
A partial list of genera of trees and shrubs cou to the myand the test location includes:
Dialium Hydnocaru GrewiaLagerstroemia Niebuhria MitrephoraHillettia Sindora AtalantiaSpondias Streblus BauhiniaDiosyvros Vitex CaeealyiniaEuphorbia
C. OPERATIOWAL FACILITIES
Field operation headquarters were established in Rua Kin, about 21 miles(35 km) from the test sites. Rua gin is 132 miles (212 1cm) southwest ofBangkok and accessible by paved road, railroad, and airplane. A residencecompound was leased for office and laboratory facilities as well as lodgingaccommodationc for resident technical personnel.
Leased vehicles and drivers were provided for travel to the teat slteseairport, and for other operational requirements.
IJ

23
Aircraft operation and maintenance facilities Vere made available atthe Hue Hin Airport located four miles (6 ki) n6rth of Hue Bin. Use ofthe airport and facilities for storage, aixing, and loading of chemicalswere provided through the cooperation of the Thai Civil Aviation Depart-ment, the Ministry of Comnications. A senll warehouse for equipmentstorage was shared jointly vith the International Civil Air TrainingOrganization of the Thai Ministry of Communications that operated a flyingschool at the airport. An additional shed for storage of chemicals andloading equipment was provided by the Thai Border Police. Air America,Inc., contractors for the leased spray plane, constructed a storage build-ing for aircraft maintenance, tools, and parts.
Airport authorities allotted a gravelled parking area for the sprayplane and adjoining space for storage of drums of chemical, diesel fuel,aviation gasoline, and aircraft engine oil. Project personnel constructeda wooden platform near the tool shed and parking ramp for mixing operationsand chemical storage.
Facilities at the airport included two gravel runays sad a controltower with a two-way radio comnication during daylight hours. Thenorth-south runway was available to and operable by the spray planethroughout the antire period of calibration and test aiplications.
J,
.1

24
Nv. TEST SIT! PREPARATION
After approval of the test program and test site locations by Thaimilitary authorities in August 1963, surveys and preparations were madefor delineation of treatment plots. A basic treatment plot size of 300by 1500 feet was selected for application of three 100-ft swaths on a10-acre area. Treatment plots were separated by buffer sones 100 by1500 ft as shown in Figure 3.
A. ACCESS LANES
Parallel access lanes were cleared at 1500-ft intervals delL ",atiagthe ends of contiguous treatment plots and buffer zones. Lanes werecleared by groups of Thai laborers using machete-type wood azes ('meads").The first three lanes on Test Site I were cleared to a width of 20 feet(Figure 4), requiring removal of trees up to 40 or 60 feet in height.Subsequent lanes were narrowed to a width alloing easy paseage of per-sonnel and equipment and minimal trail maintenance. Distance markerswere provided at 400-ft intervals for each 300-ft-wide treatment plotand 100-ft buffer sons.
Test Site 1, appr•aimately one mile wide and three miles long, wasdelineated into treatment plots by 12 parallel access lanes.oriented inan east-west direction. Lanes were designated by numbers 1 to 12. Lanes1 to 7 were cleared during the period mid-August through November 1963.Lanes 8 to 12 included some previously cleared lanes, and the remainderof the test site was delineated in March 1964 into 120 possible treatmentplots as shnn in Flaws 1.
survey and lane clearing of Test Site II were initiated in February1964 and continued through October 1964. An additional series of 22 plots
* for retreatment was established in December 1964 and January 1965. Laessin Test Site It eore designated by letters A to 1. NMre than 150 treatmentplots were made available, including several 5-acre plots 300 by 600 ft forcbhmicals in short supply and for evaluation of localized areas dominatedby bamboo (figure 2). Access lanes in Test Site I1 were oriented in severaldirections to provide minimal distances from the graded road marking thewest boundary of the teat site.
In the two test sites combined, more them 35 miles of major accesslanes were cleared and maintained during the teat program. Test sitepreparation also included the clearing and maintemnace of an additiomal52 miles of evaluation and camera station trails within the treated plateas described in the folloming paragraph. Clearing of regrth bad trailmaintenance on this total 87 miles of lames and trails was requiredthroughout the test and evaluation period.
A

25
(3 100-ft. swaths)
I * I- - - -- - - .~I -. 1.. 1 - Lane
Plot
Boundaries tItIII
6- 0 f--- I 1*I lo
5. 3. *Po D
2" " """f, .I "'/s
S ,
!i..
SI I
!.... II .... =. .
--- 300 ftt -. -Plcga
figueo 3. lPleS Derail inta Cmarer Rat (me med ?rrln Itmt s..
k
9

26~
F~~~~~gure ~ ~ ~ ~ ~ lvý 4.;,77 77. aea etSt W~gDn.Frs eeain
pah nFigure 3. Auffers Laontest 100 ft ide Dere poroiedt beetwetrat-on
eTalationt wast therfre resricted 30to thde ente 1500 ft oplotg alewngtadfor cethral 1contigofs plot swidthe to0 minimizepassibioverlppn and boedegh
pathn evaluatio 3.d camfera znstio tril100 ft lone ware establised bewe tet
Atheug central zoeswath dlnatdateed of each plot. Staeasain o etclvsboreiitthevaluatinweesi permanentlynizred tat 1ver-ftpintevl wit spayrappStationsI
atiaditne of50ftro the access lanes atThe endio of eahteteth plot. seetdforoCaeralStation was thefoe retrailtea ofstfom the center lie00 degofrees lefgthnfors acditralc of100 ft ond 20o wdegrees right forsithe ovrlapping 300 ftrdto
provievsamlinusations an amerostathen cetrail 100-ft sogwath. tbisedi
the ental wat of achplo. Sx caerastaion forverica viibiity
evaluation___ weepraetymre t10f itraswt aes tto

.1 27t 1T. ASUAL SRAY NOUIITM
Leae" zarregments were med. in August 1963 by the ARA 3IDI-T withAir America, Inc., for services of a twin-engine Seecheraft Tom-Two(modified C-4.5) equipped with a spray distribution system for use in thedefoliation test program. Spray equipml was installed Is the contractpleans atBakerafield, California, by French Aviation Coeay baed" onspecifications muatually agreed upon by U.S. Army Biological Center andAir Amrica, Inc. A brief flight test of the equipment was moad an16 O.tober 1963 in the presence of personnel from U.S. Army BiologicalCenter. Mino mdificationse were suggested to Improve the efficiencyof the distribution system for research applications.
The pilant sand equipmet were then ferried HCOJS for edditionalmodificetion prior to delivery In Bangkok,, Thailand,, on 17 Dwecber 1963.The plane wag made available to the defoliation progra is late Dec~merfor flight tests and calibration.
The spray distribution system, consisted essentially of deirwiag bosfitted with t-inch diaphragm- jet sousles at 6-inch specing, em air-drivenpup and a 180-gallon stainless steel teank. The distribution system wasdesigned for operation at pressures of 10 or 15 to 60 psi with deliveryrates of 20 to 200 gallons per minute. Deposition rates of 0.5 to 6.0S allons per acre were possible at flight speeds of 100 bats, (Prigure 3).
Details sad specifications of the equipmnt are giveni Is Appendix B.
The spray aircraft was statisod at the ama aft Airp'ort Aaring theentire period of calit-ration and test application. The Air America pilot,,John D. flerpeg,, worked closely with project persomel from U.S. AMyBiological Center during the entire calibration sad test applicationperiod. Two Air Amorica~ aircraft dochanics were assigned to the projectfor the same period and provided, excellent support sad ceoperetion Inthe test operations,, particularly in supervision of the preperation andlonding of chemical spray solutions.

28
I wa
Figure S. lom Uatem eMO Air-Drive. Poo under Yaw&"*g.A. Froat vtm oting pmV n mstrat emetl
of brn m-sa fumwlag.I. $Iii vim of wins and mntral fsUmeag mouteim
of bess obsbqn smanle plaeomt.

29
V1. CALUMTTON OF MPAY DISTRIUsmoN YtD
A. PZRA)1. Static Flow Tests
wate and diel ful lwrtswre obandby mstathaousofspray delivered ower specified time periods for variou, groupings of
in 1: 1 at Is.2 dilutions with diesel fuel or with the pure chemcal.Flow rates were also determined on water solutions of butyme dial as arepresentative of the water-soluble chemicals.
Flow-rate Information obtained in these teats was used to selectaosset spacings and pressures for desired deposit rates with variouschemcal solutions and mixtures.
2. Flight Calibrations
Preliminary f lght 'tests with diesel fuel were calibrated in earl7February at the Rue Rin Airport. Iinuiud flights were made at heights of50 to 75 feet ever the north-south rumay. Spray deposit patterns weresecured an oil-sensitive dye cards placed at 10-ft intervala ow a 540-ftline croosing the rzumay7.
A calibration grid was later developed at the sae lecation topermit Imvind flights in any direction. This grid consisted of foursamling lines 540 ft long with a comon midpoint. Flight tests wrmade with diesel fuel containing red dye,, and spray deposit patternswere colortmatrically determined with a Bausch and La& Spectromic, 20spectrepophetmeter.
These preliminary tests of boom configuration sbmvd that neinsleaequally spaced for full boom length produced a bimodal deposit patternin a math approimately 150 ft wide.
Subsequent modifications In which nomaes leawres restricted to* inLb"a" peeitiema behind the engine nacellas gave apprtomiee 100-ft
smoth widths but retained the bimodal pattern. Flight tests In which10- to IS-degree flaps were used during spray applicatica gave a suitableuniform deposition pattern with a math width of 100 to 120 feet.

30
B. CALIBRATION DUWn TEST APPLICATION PERIOD
In March 1964 calibration operations were moved to a new grid adjacentto the test sites. The grid was operated throughout the test applicationperiod to provide information on spray deposit rates for the boom and nozzleconfigurations and spray mixtures used in each treatment. From two to fiveflights were calibrated concurrently with each treatment. Additional cali-brations were occasionally required prior to treatment with new chemicalsor solutions for which data were lacking on flow-rate characteristics.
The grid was located on a rifle range on the Replacement TrainingCenter in a cleared area 1000 by 2500 feet. Four grid lines, each 600 ftlong and with a cm-n midpoint, were delineated by 3-foot-high stakes nt10-foot intervals. Each stake was capped by a metal-rubber clip to permitattachment of a pair of 6- by 6-inch aluminum or stainless steel platesfor collection of spray deposit.
During calibration flights, spray deposit patterns were obtained on theselected grid line on two series of plates (Figure 6). White Iromecotecards were mounted on one set of plates for a visual check of spray depositpattern and for determination of uses median disaster of spray droplets.
S The other series of plataes was used to determine spray deposit rates by
the acetone wank and colorinmeric technique, as described in Appendix C.
A meteorological station at the grid included a hygrothermograph, athree-elemnt thermistor for securing temperature readings at ground
wlel and flight altitude, and a Model L Uelfort anmometer with direc-alon and velocity transmitter mounted on a 50-ft tower (Figure 7). Theanemeter was equipped with a supplemental velocity indicator calibratedto read wind velocities up to 10 stles per hour to the nearest 0.1 mile(Figure 8). Data wers recorded at the tsine of each calibration flightan (1) wind direction and velocity at flight altitude (50 or 35 feet).,(Wi) air temperature at ground leel and at flight altitude, and (iii)relative hmidity.
Supplematal observations were mede of wind direction and velocity attree tol height at one or two locations in the test sites (Figure 9).Readings were taken at 5-minute intervals by an observer stationed atthe test site location during the time of plot treatment and calibration.Concurtent readings taken at the calibration gid pemittedl camporl as
of grid and test site conditions.
Calbration operations and subsequent laboratory determinan@ ofspray depoeit rates w carried out by a ew of three to five Thaiworre =nWkw the direction of a s f U.S. Auy BiologicalCenter military perosmet.
bi

31
i'Wý4
Fiue1 *dCMRmoitDV6tP~G fmC14tmS~is

32
'141
Figure 7. Telescoping 10steorological Towr at Grid Area
I for Obtaining Wind irection and Velocity Neasure-mate at the Spray Altitude.

Figure S. Anemometer Console for Wind Direction and Velocity leadings..Nilliaseter at top registers wind velocity up to 10 utph tothe niar~et 0.1 ",,h.

34
Pigu. ~.Supplguwitsl tveather statism at Test Site t.Answoter monuted above troocm.i

35
VII. VEMMON •EN=U DWK
Frior to test application, a vegetation inventory vys taken on eachtreatment plot to provide information on vegetational composition andstructure. The inventories were taken by Thai foresters of the Environ-mental research group of the AIPA i&DrU-T under the direction of LieutenantColonel W.1. Scheible. Personnel conducting the inventories were trainedto identify and recognise native treos and shrub& of the test location.
The inventory on each treatment plot consisted of: (i) a list ofspecies in the dominant canopy and intermediate tree, shrub, and ground-cover layers for individual lOw-ft g•.eunto of the central 500-ft transect;(ii) tallies of the numbers of individual plants of each tree or shrubtagged or marked for future recognition along the 500-ft belt transect;and (iLL) a chart map of the individual trees and shrubs located withina 20- to 30-ft radius of each of the six camera stations.
A code nmber wes asigned to each species for convenience in merkingindividuals for future recognition in evaluation of treatment responseend in tabulations of vegetation inventory. Identification end markingof individual trees or shrubs along the evaluation trail by the inventoryteam thus facilitated later evaluations of species response by personemlfrom U.S. Army Diological Center, regardlass of their lack of familiaritywith Thailand vegetation or plant identification.
No.t then 220 plant species were recorded from the test site area ofwhich 35 to 50 were frequently encountered on the tallies.
Data an species coempoition were compiled for each treatment plot andfor the two test sites. Coempoition was mpreased as abundemm en thebasis of numers of tallied individuals of each species In esch plot cam-bined with the numbers of individuals charted on the cemira-otation dia-g . Peremntage composition data were based on the proportion ofLadividulas ef a species to the total nosIer of individuals tallied Ineach plot or in the total test site. Frequency parcensge wero calculatedeor each species em the basis of proportion of plots Is each test aite in
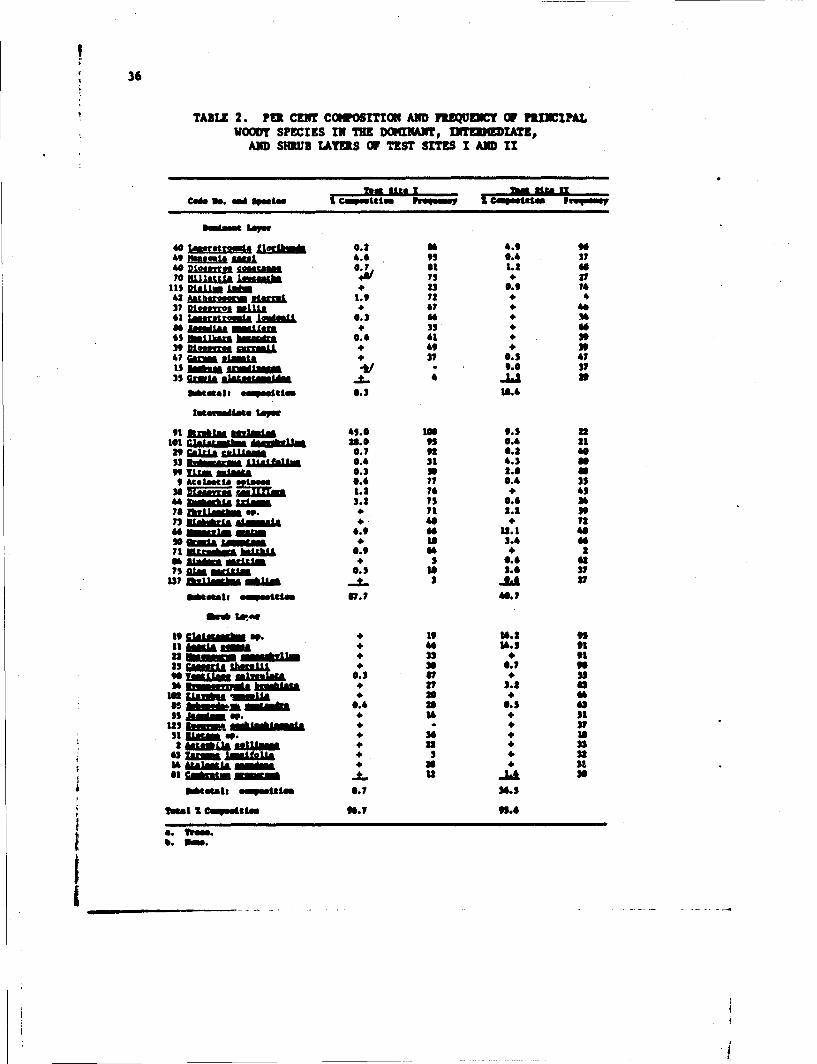
which the species occurred. Data on opeies composition -od frequeney(30% or more only) for the two test sites are shon La Table 2. Speciesare se-regated ean the basis of occurrence In the domlamt, Iatetmadiate,and shrub layers. A complete tabulation of species will be presented ina later reePrt.
i _____
36
TABLE 2. PER CEMr COMPOITON AND F33WUDY OF PEIIEPALvwOOy SPECIES iN TuE DGIINANI, w11RDIM~,
AND SUUU LAYERS OF TEST SITE I ARID 11
Caft me. Mi spuias I co.sttWm Fraqum
4 mgsBak4.6 99 *.4 3"4 klum~rn smims 0.7 at 1.24
115 3UJjM ARM 23 0.9 7442 Asheasmb MIMML 1.9 72+
61 1Matuliminlads"mL 0.2 +0 36"* iMaIL OWLL21A +25 +065 OLM bik me~m 0.6 61 29
4 7 gums *LU 2? 0.5 47is Alft AMAM 9.0 325 ME"nl RhAMUiNK~ ..t 4 _u 2
91 ftllmNZMI 45.0 we6 9.5 22l01 GQAL asMO J 26jk~k .0 950.4 21" a"29.9aa LL1 0.? 9 0.2 4053 JJWAMAsLUASN" 0.4 21 4.3 of"99ILMM~AM 0.2 39 2.8 a9 Atalmatts stuuem 0.9 7 0.4 25
3825a -NE 1.2 70 45M4MM&bd Orl- 2.2 75 0.6 26
yllSkzJJm o. 4 i1 2.2 5
" m~mmzmmm 6.9 6612.1 4So zm 4to 18OL +2.4 6it K&Ul" hak 0.9 40 2
06 5~M ~" 0.6 627S aim ndl&M 0.5 to 2.6 2?
137 naussb mbm 4 2 JLA 2
~.sa: ~0.7 40.7
t 195i*1sa to 191.2 9It IAm ~ IN" 46 16.5 9122 5j 6 3 22+ 91.23GUMLU n 29.7
-M 0.2 W7 + 3236 ftamWE MIaMa 27 2.2 a2
m U on mm 0.4 26 0.2 655 Ainm p. % . 51
2 AIlsmap n 26 1
14 MIla 4 29 4 2
T~e I 61 6.7 99.0
lanstomoef

37
Inventory data shmn rather trked differences in the species compoei-timen ad frequency an the two test sites, although met species vere foumden both sites. Ns .jL and Anthroa PLmrsL were two of the sixprincipal doinnts on Test Site 1. Bambuf e arundinaces (baboo) andarstro flormnad were mset abundant as dominants on Test Site 11.
ua Test Site I Stroblus ey~jatc& and CeLajg nthus ieTjhyllue comprised73% of the cemposition of the intermediate strata. On Test Site It severalother species were important components of the intermediate layer, includ-ingi: mcylon ovatu. 12.11; RFdocatz m ilicLfolr.1 , 4.3%; Qresytoegtops. 3.41; and 9L" mEaritim 3.6%. The shrub layer in Test Site Ihad ns predominating species but on Test Site 11 C sp. andAcacia n cemprised snre than 30% of this layer.
Specimns of all woody species encmtered were collected at the testsites and identified principally by Dr. Tem Smitinand, Forest botanist ofthe "Is• Yerestry Depertmnt, with the collaboration of other botanistsof asetesart and Chulalagskorn Universities. Certain plant specimenswere verified and identified at the Singapore UotanLcal Garden lUrbartnand at Koa Gatdens herbarui in London, bgland.
I#

38
V11!, TRZATEWY APPLICATION
A. PUT SiL[•OII
Treatments were made on duplicate plots generally selected from thetwo test sites. Within the test site adjacent alternate plots vereselected for rate or volume comparisons of the saoe chemical. Small-area plot tests and treatments on bamboo-dominated vegetation vere limitedto Test Site 11; replicate plots of these treatments were selected fromdifferent portions of the site.
i. NuRm OF PLaTS 1a AUXAL SPRAT APPLICATIT
The relative eise and close proxmlity of test plots required a precisemethod for aerial location of the plots selected for treatment and fordelineation of flight paths for the pilot in making spray applicationsat flying heights of 35 to 50 feat above the forest canopy. A flag orpanel marking system was developed that satisfied these requirements(Figure 10).
Flags were erected in the tops of the tallest trees nearest the fourmtremities of the outer swaths to be treated. The pilot was thus ableto line up flight paths on the pairs of flags marking the ends of the1500-ft smaths and to fly midway between the pairs of end flags for theremaining central math (Figure 3).
wArker trees were selected so that flags would be clearly visible tothe pilot from either direction on the flight path when approaching atspraying height. Distances were measured froe the selected flag treesto the correct positions marking the flight paths (200 ft apart)'. A mapof corrected flight paths in relation to the flag positions was providedfor pilot guidance at the time of test application.
Flags consisted of tsets of three triangular cloth panels mounted atthe ends of 18-foot steel tubing (Figure 11). The panels were supportedby collapsible arms or braces for convemIence in raising and loweringthe flag through the tree canopy. Mhen empanded, the vertically orientedpanels presented a dismand-ahaped surface, 6 by 6 ft, visible to the pilotfrom any direction.
flags were erected by erpert tree climbers from the That lme-clearincrew@ who schibited considerable detterity In positioning the flap N'a thetope of trees r•mging in height from 30 or 40 to ofrt then 100 ft.

~39
Figore 10. Cr:wReaiungPloe-Hhrktng Flag into Postton

40
ligure 11. Plot-ftrkins TUS is PositionAbove Etghest Canop Level.
Beginning in December 1964, the positions of three of the six camrestatiLons were marked by yellow flags prior to treatment In addition tomarking the treatment-plot corners. This procedure permitted an aeriallocation check to insura that the camera station and evaluation trailwore entirely within the area to be treated and would receive full spraycoverage. Iromocoto cards were exposed at each camera station for avisual check on spray penetration of the forest canopy following treatmet.
C. PREPARATION AND LOADIIS OF ChMDUCAL SPRAY SOLUTIONS
Prior to application, a chemical loading sheet was prepared with thecalculated volume and composition of the spray solution for the specifiedtreatment.

41
Total volum requirements for a specified test application werebased em:
1) Volan needed for plot application2) Adjustmet for estimated dep.)@Iý recovery3) Volume needed for grid peasses4) Tank reserve, 30 &a'5) Boom allowance, 5 gal
For example, a specified treatmat with 100% Purple was applied toabtain a dopo.~t volum of. 2.0 gal/acre. A recovery of 801 necessitated2.5 gal/acre released from aircraft. The following tank voluamerrequired for the entire flight:
55 gal for 22 acres coverage30 gel for grid proses30 gel for tankreee_I gal for bees allowance
120 gal - total volum requiremnt
The mwunt of chemical required for a test application wee calculatedon the basis of desired deposit rate of active ingredir.&La or acid equiva-lent of the material to be sprayed. Calculations took into accout thepurity or concentration of active ingredient In the formulated productas well as the percentage recovery volums.
For example,, cacodylic acid containing C".5% active ingredient wassprayed at a deposit rate of 2.5 lb/acre and a depoeit voln of 2.0gal/acre at an estimated s.covery rute of 701. amount of caoedylicacid product required was 2.5 lb divided by 0.07 or 3.85 lb for each2.0 gal of prepared spray mixture. To obtain a deposit volume of 2.0gal/acre at 701 recovery, a spray delivery rate of 2.0 divided by 0.70or 2.8 gal/acre ma required. Total volvme sd chemcal requiremetswere calculated as in the previous exempl*.
In addition to calculation of total "lam sad cbiale- requirents,the proper nozzle configuration and tank preasore requ~red to deliverthe specified spray volume was determined from n wasi~. calibratione.Thus, at 100 knots I flying speed and with a math width of 100 feet# theaircraft covered 23 acres per minute. noe total nozzle flow rate require.In the ctample with cacoilylia acid was 2.8 gal/acre z 23 acres per minuteor 65 gal per minute.
This information was then uaed by the airport cron, supervised by atechnician from the U.S. Army Biological Center to meaaaure the variouscomponents of the spray mixture and prepare them for loadting Into theaircraft tank.

42
Specified amounts of dye, usually DuPont oil-soluble red ort rtodauineblue, were added to the spray mixture to determine spray deposit in gridcalibrations as discussed in Appendix C.
wihSpray-mixture components were mixed in open-topped 55-gallon drumswihhand peddles (Figure 12). The spray solution was usually prepared
on the afternoon preceding the application date and loaded vith a gasoline-driven centrifugal pump and oil-resistant hoses in the predawn hours justbefore take-off.
Cloves and face masks were used as needed to avoid skin irritationarising from prolonged contact with certain of the test materials. AThal aircraft mechanic indoctrinated in appropriate safety precautionssupervised the ground crew.
IAb'
y*
Figure 12. Preporettole of Spray Nisture La 55-Callon DromMror to Aircraft Loading.
ow

43
D. ARRIAL APPLICATION
Tree tmat application involved the coordinated efforts of the flightcrew consisting of pilot and spray technician, the calibration grid crew,and the airport crew. Radio contact was maintained during the applicationperiod between the pilot and the calibration grid supervisor who providedmeteorological data from the grid and scheduled the calibration and plotapplication flights. The grid supervisor was responsible for possiblecancellation of test applications because of unfavorable winds or otheradverse test conditions. Radio comu-nication with the airport crew wasalso available to the pilot.
The typical sequence of in-flight procedures during treatment applica-tion included:
1) Initial priming of spr•y systom and regulation to desiredpressure
2) Calibration grid flight3) Plot application4) Calibration grid flight5) Plot application6) Calibration grid flight
Sprays in calibration flights aid on test plots were applied at a standardairspeed of 100 knots at a height of 35 to 50 feet above the forest canopyor grid surface.
The follewing data were recorded by the spray technician for calcula-tion of flew rate and spray volume delivered (Appendiz D):
I) Time of spray run2) Air speed in knots3) Tank pressure at spray delivery4) Duration of spray run (seconds)5) Tank gauge reading (gallons)6) Flight path azimuth or direction
Flow rate and gallons per acre released were calculated in flight afterthe first spray run to corroborate or .... .e pressure value settings ifnecessary.
On completion of spray application, data from all spray runs werecomposited to calculate flew rate (gpm) and spray volume delivered inaccordance with the following equations:
Flow rate in M - Delivered volume z 60 secondsNMumer of seconds iii spray tu
Gallons per acre released - Flew rate in - m23 acres per minmte

44
The factor, 23 acres per minute, represented the area covered in a 100-ftswath in one minute at the standard 100-knot airspeed.
Ismediately upon return of the aircraft from a slray application, theresidue of chemical mix was drained from the tank, pump, and boom. Two20-ml saaples were taken from the drainings to be used for colorimetrLcstandards in laboratory analy*si of the grid deposit data.
The aircraft and boom system were subjected to a rigid schedule offlushing and washing after each spray flight. The aircraft was firstscrubbed with water containing soap or detergent and 1% aumonLa, thenwashed with a dilute solution of acetic acid and given a final rinsewith water. Spray booms and nozsles were thoroughly flushed with water.Nozsle@ were checked at least once a week for deterioration of thediaphragms and gaskets.
3. L SAKI TORY ANALYSIS OF SPRAY DEPOSIT RATES AND VOLUMS FRIC GRIDCALIBRATION
Spray deposit rates and volumes for each treatment application wereobtained by a colorimetric technique that is discussed in detail inAppendix C. Figure IMA illustrates the removal of the spray depositfrom the exposed plate and its matching cover plate by rinsing withacetone or other appropriate solvent. Colorimetric determination ofthe spray material in these rinse solutions was made with a Bausch andLamb spectropbotomster as shown in Figure 133. Data were converted tospray deposit values expressed in gallons per acre based on standardsprepared from the samples of original spray solution obtained followingtreatment application.
A profile of spray deposit values was graphed for each grid flight.Average deposit rates were calculated in pounds per acre of active ingredi-ent, and maxina mean, and minioum deposit volumes per plot. Depob..recovery values were obtained by comparing deposit volume obtained fromgrid deposits with delivered volums obtained from flight records(Appendix C). Mass median diameter of spray droplets was determinedfrom the Iromacote cards ezposed during crosswind flights.
L

45
19L
Figure 13. Laboratory Determnat Lon, of Spray Deposit from Grid Calibreation.A. Spray deposit from grid plates to dissolved in ace 141
and made to volume in volumetric flask.
determined with a spectrophotometer..

46
IX, EVALUATION TZE1IIUES
A. RATIOINALE
The objectives of the defoliation test program were to determineminimal effective dosage treatments with Purple and related herbicidesand to evaluate the effectiveness of other chemical agents. Evaluationtechniques were therefore needed that would accurately appraise the totaldegree of defoliation or foliage removal by a wide array of chemicaltreatments. The test program also provided an excellent opportunity tosecure quantitative data of importance in military operations on changesin vertical and horLsontal visibility in the Jungle environment as affectedby defoliation.
Three evaluation techniques were developed in the early stages of theproject to .meet these requirements: (i) visual evaluations, (i) verticalcanopy photography, and (Iii) "dot-count" horinontal visibility measure-ments. The three types of evaluation were conducted at the followingscheduled intervals to provide information on rapidity of action ofchemicals and the duration and trends in defoliation responses:
1 week 2 months 6 months2 weeks 3 months 8 to 9 months3 weeks 4 months 12 months4 weeks 5 months
Visual .estimates of defoliation were used to appraise the defoliationresponse of the total vegetational cover to chemical treatment. Ratingsobtained by this technique were directed primarily toward an evaluationof effectiveness of chemical treatments as related to rates, volumes,season of application, and type of chemical.
A second technique employing vertical photography gave quantitativemeasurements of ground-air visibility as related to defoliation response.Repeat photographs at permanent locations in each treatment plot provideda continuing record of canopy obscuration, as determined quantitativelyby a compositing light meter or obscurimeter.
From the military point of view, air-to-ground vertical visibility isprobably more important than ground-to-air visibility. However, thedifficulties in evaluating changes In air-ground visibility by means ofaerial observations or photography with the timing, precision, and totalnumber of observations required for an adequate volume of data were almostinsurmiuntable. Further, this technique would have required the placementof some type of reflective markers or targets, on or near the ground, inover 250 plots, and maintenance of these targets throughout the testperiod. By contrast, if it can be assumed that there is a direct rela-tionship between air-to-ground visibility and ground-to-air visibility,
i .0

'7
the latter my be measured quickly, easily, end accuracely by the carefuladaptation of standard photographic techniques. The method adoptedrequired only a very mall investment in equipment and skilled laborcompared to the mtremely Large emxpnses involved in aircraft operations.No targets were required and laboratory evaluation of the photographswas simple, fast, and reliable.
Horizontal-visibility masurements were obtained by the third techniquethat dealt with the portion of the jungle or forest envirmment withinwhich the foot soldier operates. The technique involved observation ofa humen-sLsed target on eight asimeths over a range of specified distances.Horisontal-visibilLty data furnished a measure of effectiveness of defolia-tion in the shrub and ground-cover layer of the forest in contrast to theupper canopy effects measured by the vertical photography technique.
Supplemental use was made of oblique aerial photographs taken inRodachrom, Ektachronm, and Infrared Kodachrome of individual plot treat-ments In recording changes in defoliation response and in determininguniformity of spray coverage. Evaluation of response was based primarilyon dominaL # nopy.
B. VISUAL ESTIMATES OF DEFOLIATION
Visual estimates of defoliation of vegetation and individual specieswere used as a p Loery rating systen of effectiveness of chenical spraytreatments. Rat .ngs were made at scheduled intervals of percentagedefoliation of over-all vegetation and of the component dominant, inter-mediate, shrub, and ground-cover layers. Concurrent ratings on a 0 to 10scale were made on defoliation, or regrowth, or both of individuallymarked trees and shrubs.
In making the appraisal on a treatment plot, the observer traversedthe centrally located 500 feet of evaluation trail, recording first thedefoliation of individually marked plants. Over-all estimates were thenmade after inspection of the entire central portion of the plot. Theobserver mentally composited or averaged responnes of the entire vegeta-tion profile to obtain the over-all rating.
Immediately after treatment application, notes were taken of thegeneral spray deposit pattern, relative penetration of spray to groundlevel, and any irregularities in spray coverage in relation to plotboundaries and the permanent camsra stations.
Periodic observations furnished information on:
1) Amount and duration of foliage removal in the over-all vegeta-tion eover and in the various structural components of the profile includ-ing dominant canopy, intermediate tree layer, shrub layer, and ground cover.

48
2) Characteristics of plant response classified as (1) herbicidalactiLtn-systemic and growth-regulating effects resulting in defoliationand subsequent death, (LL) desiccant or contact action-nonaystemic effectscharacterized by rapid death of foliage without injury or death of plants-foliage removal follomed by regrowth, and (iII) defoliant action-stimlationof leaf fall or abscission without sustained injury or death of the plant-often characterized by a rapid shedding of green leaves following applicationof chemical defoliants.
3) Rapidity of defoliation, herbicidal action, and other plant
responses.
4) Duration of maxim or effective defoliation response.
:. Characteristics of regrowth or recovery of vegetation followingdefoliat" S,1.
In gener*l, the data are considered to be a fairly reliable index oftreatment effectiveness. One or two observer tam tobers conductedeach evaluation.
Replacement personnel worked with experienced observers to secureuniformity over the test period. During the dry season som difficultywas encountered in distinguishing the effects of chemicals and that ofnatural defoliation, particularly in Test Site 11.
Treatments yielding over-all defoliation in excess of 60 to 65% wereconsidered to be effective from the military standpoint.
C. VEmRICAL PWOTOGRAPHY
Briefly, the method my be described as follows. Very high contrastphotographs of the forest canopy were made with the sky as a background.These photographs were taken at six marked locations In each plot. beforeand at 12 intervals after treatment, according to the schedule given inSection IX, A. Each series of repeat photographs was carefully taken atexactly the same marked spot, with the camera adjusted on a tripod sothe lens axis was in a precisely vertical position.
The negatives obtained were high contrast silhouettes of the uppercanopy, in which the white and black areas represented obscuration andvisibility, respectively. The proportion of canopy obscuration in eachnegative was evaluated by a compositing densitometer called an obscurimeter(Figures 14 and 15), (Appendix E).

'9
� I �
- I !I :
,�4 .4?�½� I �
a Iii.'
-
�
;ILq
i. .'
4
I
.E *
9

SSO

51
The camera used was a Mikan, single lens reflex 35 n, with a"waistlevel" finder. This camera was chosen because of its precisionconstruction and rugged durability, although any camera of similar designcould have been used. The 28-om lens was chosen partly because of readyavailability and as a compromise in the choice of the angle of acceptancethat determanes the area in the field of view (60 degrees).
The tripod has a specially made top plate toJ hold the camera vertical,with necessary leveling indicators. A compass was used to enable properorientation of the camera axis consistently in the sam direction through-out the series of photos.
Exposures were chosen so that the sky, as a background, was rendereddense black in the negative; the forest cover was very drastically under-exposed, thus producing a black and white silhouette of the foliage andupper branch framework.
Field procedure consisted of beginning the film strip with a phoLographof a sign containing the film roll number, date, and plot nmber. Anexposure was made of open sky, with shutter speed and aperture set asdetermined by the exposure mater (Weston Master 1,1) to give a normallydense sky image. The same shutter and diaphragm settings were used forduplicate negatives exposed at the six camera sites in each plot. Anunexposed negative and an open-sky exposure were included for obscurimetercalibration of each roll. The period in which photographs could be takenwas limited by the elevation angle of the sun from 0800 to 1100 and 1400to 1600 hours.
Negative development was carefully standardized to secure uniformhigh contrast.
Film were then processed with the obscuriueter or compositing,densitometer to obtain transmittance values for each negative whichwere then transposed to obscuration values. Instrument adjustmentswere made on each roll of film to give 100% transmittance by the blankframe and 0 for the fully exposed sky frame. The frames containingthe canopy silhouettes were processed in succession without changing theinstrument adjustment.
ObscuratLon values for the individual camera station in each plotwere graphed to facilitate compilation of percentage and duration ofresponse data.
D. HORIZONTAL VISIBILITY
"Horisontal visibility was measured in each treatment plot at scheduledintervals by the technique developed by the U.S. Army Engineer WaterwaysExperiment Station, Vicksburg, Mississippi, in a research project for

52
ARPA.26 The technique consisted of observations of the proportion of ahuman-sized target visible at specified distances from a gives point.Comparisons of target visibility prior to and following treatment gavea quantitative measure of changes in horizontal visibility due to defolia-tion. Untreated control plots provided data on seasonal changes invisibility,
The target consisted of a set of three 10-inch discs mounted at 0.5-,1.2-, and 1.9-meter heights on an aluminum pole (Figure 16). The whitediscs each had 25 randomly.spaced red dots 1 ca (0.4 inch) in diameter.Visibility was determined in each treatment plot on a series of eightazimuth lines radiating from a central observation station. CameraStation 2 was used as the observation station because of its centrallocation and accessibility.
Target visibility expressed as numbers of dots visible on each targetat a given range was determined by an observer with the aid of 7 x 35binoculars mounted on a tripod. The crew consisted of the observer,recorder, and one or two mnm who positioned the targets at specifieddistances.
in the early phase of the test program, targets were positioned at5, 10, 15, 20, 25, and 30 meters from the observer on each of eightequally spaced azimuth lines, as suggested by Waterways ExperimentStation. Visibility was determined at subsequent intervals at thesame azimuth positions as determined by tape and compass. In the testsites examined in Thailand almost 100% of the target dots could becounted at five meters. Conversely, at distances of 25 meters or more,the target was seldom visible and standard errors of 100 to 300Z wereobtained at ranges in excess of 25 meters. For this reason, the 5-,25-, and 30-meter ranges were dropped, and efforts concentrated on the10-, 15-, and 20-meter ranges.
An additional modification of the horizontal-visibility techniquewas made following statistical tests of method error in comparisons ofmarked and unmarked target locations used for successive readings in thesame plot. In the original system of unmarked target sites at 10, 15,and 20 meters from the center on each azimuth and azimuths located bycompass and tape for each successive reading in the same plot, the con-fidence interval of the difference between two successive readings inthe same plot was 25.5% of the total dot count at the 0.95 probabilitylevel. When target locations were permanently marked assuring thatazimuths and target locations were identical for successive readingson the same plot, a confidence interval of 10.4% was obtained, indicatinga much reduced variability. The technique was modified in February 1965to incorporate marked locations of all targets for the continuing seriesof observations. The method using fixed target sites resulted in asignificant reduction in field time required for visibility determinations.
I

1 53
Figure 16. Target used in Horzsontal VLiLbilLtyTechnLque.
Horizontal visibility determinations were initiated in July 1964 andwere carried out by a crew of trained Thai workers under the supervisionof ARPA R&DFU-T personnel or U.S. Army Biological Center personnel stationedat the field headquarters.
Data were expressed as average number of target dots visible perazimuth for each distance range. The ratio of combined target dotsvisible for the three ranges at any period of observation to the before-treatment reading gave an index of improvement in horizontal visibility.

54
E. AEIAL PHUT• MNPUT
OblLque aerial photographs of individual treatment plots were takenfrom an altitude of apprc~imately 1,000 ft with a 35-mm single-lensreflax camera on Kodachrome or Ektachrome film. These photographs weretaken by project personnel from the Beechcraft plane during late morningor early afternoon hours. Photo flights were made at 1- or 2-weetk inter-vals during the period from October 1964 to March 1965.
Attempts were made to secure a weekly photographic record of theearly response stages to treatments for the first montS and subsequentmonthly photos during the period of effective defoliation.
The photographic record of early stages of vegetation response wasevaluated to provide information on spray distribution in relation toplot boundaries and uniformity of coverage. The percentage of canopyreduction or defoliation was estimated from properly exposed photographsby visual estimates and comparison with adjacent untreated vegetation.The photographs were used principally to supplement visual estimationfrom ground observations.
Aerial photographic coverage with panchromatic film was taken of theentire loyal Thai Army Replacement Training Center on 1 January 1964 bythe U.S. Air Force photo-intelligence group at Korat, Thailand. Contactprints of four photo flights including the two test sites on a scale1:15,000 were furnished to personnel of the OCROMUS defoliation testprogram. These photographs provided a pretrea-mnt record of the testsites.
Post-treatment aerial photographic coverage in panchromatic and blackand white infrared film was furnished for the two sites by AIPA R&MDFU-Tfrom photo flights made under the supervision of the U.S. Army ColdRegions Research and Engineering Laboratories. Panchromatic film cfver-age on a scale of 1:15,000 was furnished from flights made in February1965. Contact infrared prints, scale 1:5,000 were provided from photo-graphs made on 15 May 1965.
* Color infrared aerial photographs .on 70-m Kodak Ektachrome Aero filmwere taken at intervals throughout the test program. This film reproduceslive and dead vegetation in sharply contrasting colors-bright red forliving plants and blue for dead vegetation.
Additional post-treatment aerial photo coverage with panchromatic[ film has been scheduled for early 1966.
ii
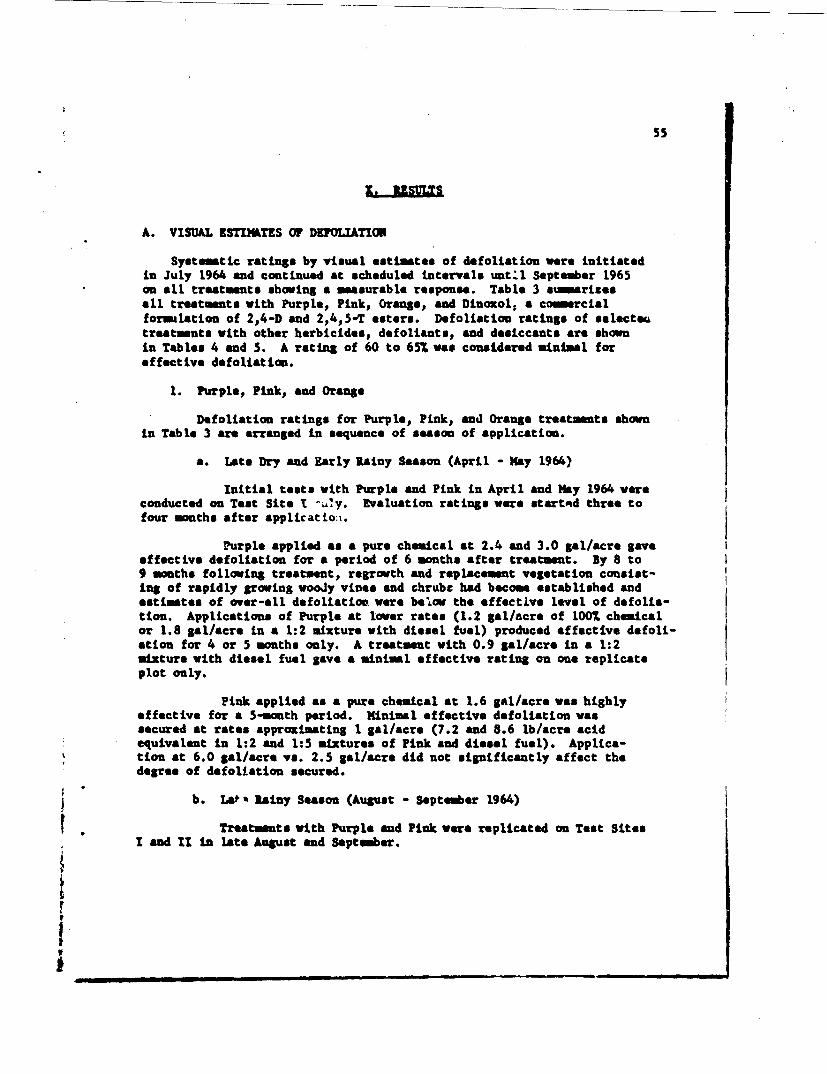
55
A. VISUAL ESTI.TES OF DErOLIATIOC
Systmttic ratings by visual estimates of defoliation were initiatedin July 1964 and continued at scheduled intervals unt:l September 1965on all treatments showing a measurable response. Table 3 siumarisesall treatments with Purple, Pink, Orange, and Dinoxol, a cosmercialformulation of 2,4-D and 2,4,5-T esters. Defoliation ratings of selectectreatments with other herbicides, defoliants, and desiccants are shownin Tables 4 and 5. A rating of 60 to 65% was considered minimal foreffective defoliation.
1. Purple, Pink, and Orange
Defoliation ratings for Purple, Pink, and Orange treatments shownin Table 3 are arranged in sequence of season of application.
a. Late Dry and Early Rainy Season (April - May 1964)
Initial tests with Purple and Pink in April and May 1964 wereconducted on Test Site T y Evaluation ratings were started three tofour months after applicatiol.
Purple applied as a pure chemical at 2.4 and 3.0 gal/acre gaveeffective defoliation for a period of 6 months after treatment. By 8 to9 months following treatment, regrowth and replacement vegetation consist-ing of rapidly growing wooJy vines and chrube had become established andestimates of over-all defoliation were below the effective level of defolia-tion. Applications of Purple at lower rates (1.2 gal/acre of 100 chemicalor 1.8 gal/acre in a 1:2 mixture with diesel fuel) produced effective defoli-ation for 4 or 5 months only. A treatment with 0.9 gal/acre in a 1:2mixture with diesel fuel gave a minimal effective rating on one replicateplot only.
Pink applied as a pure chemical at 1.6 gal/acre was highlyeffective for a 5-month period. Minimal effective defoliation wassecured at rates approximating I gal/acre (7.2 and 8.6 lb/acre acidequivalent in 1:2 and 1:5 mixtures of Pink and diesel fuel). Applica-tion at 6.0 gal/acre vs. 2.5 gal/acre did not significantly affect thedegree of defoliation secured.
b. Lats Rainy Season (August - September 1964)
r •Treatments with Purple and Pink were replicated on Test SitesI and 11 in late August and September.
I__ _ _ _ _ _ _ _
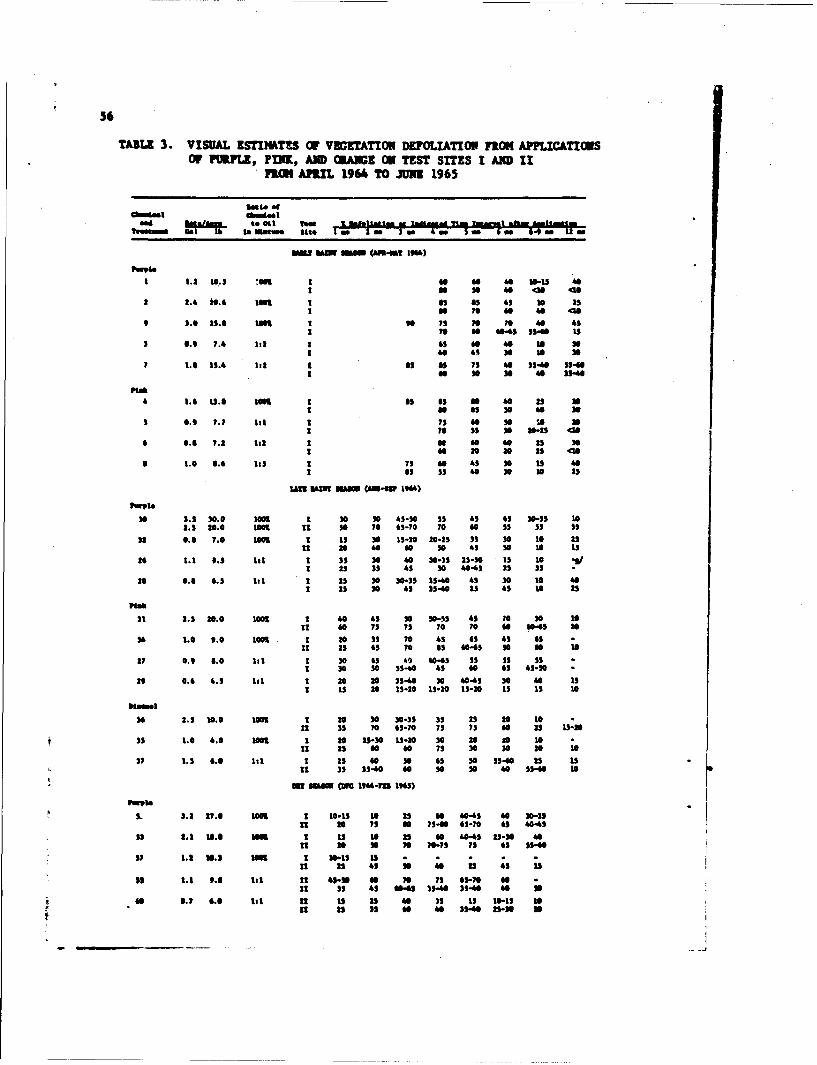
5'
TABLE 3. VISUAL EsTIMATZS or VEcETATIOw DEFoLIATIop nom AppLIC-ATIONSOF PURPLE, PUhK, AND CRAME 0I TEST SITES I A1WD It
F3&4 APRIL 1964 TO JUNE 1965
Sale a#
ases St.. I LI1s I- "P
11Ml oh Osa(n-mv 11066)
1 1.2 10.3 :on1 I SO 40 40 IS-U 4
2 2.4 20.6 ton I INS 43 is 2s
9 3.0 25.6 tm I is76 7 70 40 41
1 70 GO 40.43 W411 IS3 6.0 7.4 Its 1 63 a0 40w0
1 4 44 30 1* m
7 1.0 13.4 W: 85 as is73 4 3S.40 $5.4191G SO330 4 33-40
960 .1 708 ton 3 -40 s aa
s 0.90 M. lot 1 73 GO SO w A
* 0.6 7.2 lot I SO G0O 4 23 2
a 1.0 0.61 113 2 73 GO 43 so 13 401 63 SS 40 30 10 23
30 3.302.0 101M 1 26 s0 45-30 33 43 i3 10-35 102.3 230.0 100 at 30 70 43-70 70 40 33 33 33
32 0.0 7.0 100 1 13 30 15-20 20-23 33 20 10 23It 20 40 4 30 43 s0 10 13
26 1.1 6.3 111 1 33 26 40 30-33 23-30 Is 10o~1 2 33 43 30 4043 23 33
26 6.6 6.3 111 1 23 30 3033 3540 43 26 10 4I 23 26 43 33-40 23 43 10 23
31 2.3 20.0 1001 1 40 43 90 20-33 43 ?0 20 16KR 4 73 73 70 70 GO 40.43 u
34 1.0 9.0 1001 1 to 33 70 43 63 43 63it 23 43 70 I3 40435 s0o 0 1
27 0.9 6.0 lot 1 20 63 40 40-43 33 33 331 30 26 33-40 43 40 63 43-30
29 0.4 4.3 111 1 20 20 33-40 26 40-43 30 is 11 13 20 13-20 13-20 13-20 13 13 10
36 2.3 10.6 100 1 20 26 30-33 33 23 20 16oat 33 70 43-70 i3 73 GO 23 13-29
33 1.0 4.0 100 I 20 253-2613-20 so 20 20 110n3 23 Go GO 73 26 30 20 1
31 1.3 6.6 111 1 23 40 so 6 so 533601 23 is11 35 33-40 40 so so 40 3-69 10
offsIum cm 1944-m 143) -LI 3.2 27.0 100 t 10-13 10 a3 4 40-43 40 30-33
at 20 73 N 73-60 43-70 43 404
Is 2.1 10.6 onl I IS is as 40 40-45323-26 40at n SO 76 W0-7 is i3 33-40
37 1.2 30.3 10K I IS-1S 13ISn1 23 43 so 10 3 4;s 1
33 21 9.6 111 at 45-3 If 7 73 63-70 SO
it 35 4 4043 33-40 35-619 4 30
40 .7 4.0 tit n 13 23 40 33 13 10-1 10It 23 33 4 40 3S.-40 53-0 SO

57
Ratio ofchoistal cbefticaI
&ý"w o Oil 'Post I Defliation at Ifdic&We Tim Isterval after Aa-'estloIreoatmot cat to to Ml~t~.ra sit* I 1A 2 m 3 no 4 aw S w -m - -wlm 12 -m
MT ZASO (DOC 1944-M 1965)
SA 2.0 27.2 100% 1 Iecorreet AppitcattemIt 30 40 60 00 65-70 30-3S 33
58 0.4 3.2 to0t I is t0o-
IT 13-20 35 63-70 45 70 ;0 40
14 1.3 11.2 11 it 30-33 40 90 90-95 05 43-70 70Iit 30 so 70 so 435-0 40 40
so 0.7 4.0 1-1 it 20 33 70 40 so 33-40 23-30it 35 40 43 43 43 40 40
41 2.3 21.0 1001 1 23 a3 ?0 73 35-60 13-20
it 30 Flat Partially I .e
43 1.3 12.0 1001 1 43 40 33 40 33-40 -
1.0 S.A 1001 it 43 33 43 43 45-30 30-33Go 1.2 10.0 1:1 It 30 7s 43 35 40 13-20
64 0.7 3.3 111 It 40-63 23-30 43 10 10 33it 53-70 60 .10 40 35-44
4 "'7 3.4 111 1 23 40 23 40 30 20-23It 65-70 63-70 40 43-50 33 is
EARLY RAWN SUBM0 (VAy-JUlIW 1943)
"toti90 2.4 22.0 1001 1 40 43 40 40
it 43-70 73 65-70 35
6? 1.7 WG. 1009. 1 20 so 33U1 90 85-90 43
1.1I 10.0 1001 1 10 10-13 - -
it 73-00 43-70 40-43
OR 0.9 7.0 111 1 73 40-43 35-40 13-20&I PO0 0-03 43 33
09 0.4 3.4 111 1 43 23 25-30 10It 73 0043 13-20 15-20
ptisk
91 2.2 17.4 1001 1 43 40 43 53-60it so 00 40-3 75
91 1.0 w4.a 1001 1 33 so 25-30 isU1 23 35-60 40 45-50
92 1.1 0.0 111 1 40 so 33-40 40it 33 43-50 25-30 33
04 0.7 4.2 111 1 43 43 43-30 30U1 90 03-901 43
94 1.0 13.2 1001 1 2s 40 70 -
91 1.3 11.4 1001 1 30-35 30 3! 25-10it 43 45-70 ?$-00
91 0.7 4.4 111 1 30 33-40 33-60it 40 so 40
09 0.2 .1 11 2 43 1,:" 9P;Va 0. lb IT 40 4s-so )3r-3STwdm
a. "Cdaa. palvaoiii t"W.ased.

58
TABLE 4. VISUAL ESTIMATES OF DEFOLIATION BY SELECTED DEFOLIANTSAND DESICCANT TREATMENTS FOR A SIX- TO NINE-MONTH PERIOD
AF¶IER "MEATMENT 7-.
Chamiotiand late, Ties t DefoliLoe at frdietted Tim Intervalaftetr Annilcai
Treo at Dc Oate lb/acts Site k p.v 3 Zak 1100 Zee 3 so 4w 3m v 6 mo 9 us
Ceeedyiie Acid ,
13 30 my 44 7.0 1 25 10 -2/ '1 30 15 10 -
14 3 Jiun 3.0 1 30 30 10-13O- - "
l 50 40 10-13 - "
42 17 Ot6 6.0 1 30 s0 60-65 65 45-50 35340 20 23 20-23it 30 60 60 65 35-40 20 30 30 30
71 4NOR r65 3.4 t 10 25 45 33 13-30 2s 10-15 <10 <10 -
11 20 60 65 70 43-50 15-20 30 20, 20
S€edim R
70 Hme6r '1.8 1 20 25 30-33 33-40 35-40 10-13 10-13 - .
U 10 10 33 U3-20 33-40 1013 13 -i
iI 22 my 64 2.7 t <10 <10 -I <10 <10 .
13 $ J1m 4 4.0 1 35 10-15 <10 * -
1 50 10-13 10 .o
43 19 out G6 3.0 1 30 so 43 40 30 30 30 25-30 20 -II 40 83 So Is 3S 20 25 23 23-30 30 -
44 oat 64 2.8 1 30 45-50 45 35-40 35-40 13-30 35 23 30-35 20-23 -
n 43 60 60 40-45 30 20 23 23 25-30 35
72 a8 n 63 2.2 1 1i 30 20-23 33 30-35 15 20 <10 -tx 1i 43 30 40 33-40 t0 20 10 10 ;
75 10 ise i5 3.8 1 20 2s 23 30 40 10-20 10 20 --I1 20 40 40 40 33 1U-20 20-13 10-13 13 .
74 1. as 65 4.0 1 0 I0 20 2 0-23 U-30 20-23 2s 10 101 "II 7.2 it 10 i3 23 s0 30 20 20 13 -'::'•
20 It jut 3.0 10 40 40 - -0S 20 13 41 - . .
2t 22 Jal 84 3.3 1 laadie void besm e 1f drtttK 10 1.5 <0 - - - -
48 14 OR 5.3 it <10 13-20 23 2-23 -5-30 30 30 30 20 20 "16 No 44 3.4 11 -do 1-20 4 15-201 <10 -- ,
hde-ball bidd 'a-wto
49 IS3am 3.3 22 23-36 3340110-130-u13 -13 so-is 10 is 10-13In 10 10 2-23 25-30 GO 20 33 30-3 0 35-
79 17 010, 4 4.3 1 w* 1 IS5 2 20 Gdo <10 - - - -
U 35 40 33 45.30 43 30 45-5033-451-1 WA
a. Sa dta. bab ti eendeted. -l
-9'
* -.,.17~

59 -
C4-
V% W,
9 ~0 5t0 ,IMb
4N b00NI
f W% vco 0
en-
.~~W9 in i 9~%1 L iVvi on 641.0 W% 4
ino I- Ri
NO~ v% 0 .D
~SIW% 000 -'S
14 14M 4 .
to.DAD SS .65 M M NN M MN
6.5 N . N M 41!M
5.50
C4 .* a.# in
m' a vdo
- ...........

60
Only one of four treatments with Purple gave effective defolia-tion. Treatment 30 of 1007, Purple applied on Test Site II at 2.5 gal/acrewas effective for a 5-month period. During the application of this treat-ment, leakage developed in one boom prior to spraying the second replicateon Test Site I, resulting in a higher spray deposit rate estimated to be3.5 gal/acre. Uneven distribution of spray deposit was evident from lateraerial observations. Ratings on thia replicate were below minimal effec-tLveness in spite of the higher application rate. Applications of 0.8 to1.1 gal/acre of 100% Purple and 1:1 mixtures with diesel fuel were noteffective.
Pink applied as pure chemical at 1.0 and 2.5 gal/acre gaveeffective defoliation from 2 to 9 month-s on Test Site II. Replicatesat these rates on Test Site I gave effective defoliation ratings for ashorter interval. A 1:1 mixture of Pink and diesel fuel applied on TestSite I at approximately 1 gal/acre gave minimal effective defoliation forone or two observations within the evaluation period.
Supplemental tests were conducted with Dinoxol, a butoxyethanol eater formulation containing 2 lb of 2,4-D and 2 lb of 2,4,5-Tacid equivalent per gallon. Applications were made at 1 and 2.5 gal/acreof the 4 lb/gal formulation and at 1.5 gal/acre of a 1:1 mixture withdiesel fuel. The higher rate of Dinoxol (10 lb/acre) produced effectivedefoliation on Test Site II from 2 to 6 months after treatment. A minimum /level of effective defoliation was attained for brief periods followingtreatment at either 4.0 or 6.0 lb/acre.
C. Dry Season (December 1964 - February 1965)
Purple applied in December and early January at approximately2 and 3 gal/acre gave effective defoliation on the secondary vegetationof Test Site II but replicate tests were ineffective on Test Site I. A1:1 mixture of Purple and diesel fuel at 1.1 gal/acre (9.8 lb/acre acidequivalent) caused effective defoliation on one replicate containing large ;amounts of bamboo in Test Site II. Ratings on this and other plots domi-nated by bamboo are based on vegetation exclusive of bamboo. Bamboo didnot defoliate readily from applications of Purple at 1 and 2 gal/acre.Over-all ratings including bamboo did not reach minimal effective defoliation.
Pink was evaluated at four rates, principally on Test Site II.Effective defoliation was obtained on this site with pure chemical at 2.0gal/acre and 2.6 gal/acre of a 1:1 mixture with diesel fuel (equivalent to11.2 lb/acre acid equivalent). Data for a replicate test at 2.0 gal/acreon Test Site I are not available because of incorrect application. Treat-ment 58 of Pink at 0.6 gal/acre was ineffective on Site I and showedminimal effective defoliation on Test Site 1I.

61
Initial tests with Orange were made in February 1965. Applica-tion of 2.5 gal/acre of pure chemical gave effective defoliation ou TestSite I for a 4-month period. The replicate plot on Site 11 was destroyedby fire about 2 months after treatment presumably associated with effective-ness of the chemical. Orange applied as a pure chemical at the rate of 1.5gal/acre was judged ineffective by visual estimates on both test sites.Mixtures of Orange and diesel fuel applied at rates of 5.5 and 10.0 lb/acreon Test Site IT were not effective during the dry season according to Visualestimate data.
d. Rainy Season (May - June 1965)
Preliminary evaluations are shown in Table 3 for the first 3 or4 months following applications of Purple, Pink, and Orange in the earlyrainy season of 1965. Replicate plots of each treatment were located onTest Sites I and II.
Purple gave effective defoliation on both test sites fromapplications at 2.6 gal/acre and on Test Site II at rates of 1.1 and 1.7gal/acre. When Purple was applied in 1:1 dilutions in diesel fuel at1.3 to 1.8 gal/acre, effective defoliation occurred during the first 2months at Test Site II only.
Pink was highly effective for 4 months when applied as a purechemical at 2.2 gal/acre on Test Site 1I but only minimal ratings wereobtained on Test Site I at the third month after treatment. Somewhatvariable results were obtained with lower rates of Pink; effectivedefoliation occurred only on Test Site I1 from treatment 94 with 0.7gal/acre in a 1:1 mixture.
Orange applied as a pure chemical at 1.3 and 1.8 gal/acre gaveeffective defoliation for 3 months on Test Site I1 but was ineffective onTest Site I. Dilutions with diesel fuel containing 1 gal/acre or less ofchemical were effective only at 2 months on Test Site It. A combinationtreatment containing Orange in a 1:1 mixture at 9.1 lb/acre and 0.5 lb/acreof Tordon produced effective defoliation ratings for 3 months on Test Site Ibut was ineffective on Test Site 1I.
e. Cenaral Summary
Purple caused effective defoliation for a period of 2 to 6or more months from applications of 2 gal/acre or more (15 lb/acre acidequivalent as shown in Figure 17) in which average and mximnm rates ofdefoliation are plotted against application rates. Both percentage ofdefoliation at maximum and duration of effective defoliation increasedwith the rate of Purple applied. The period of effective defoliationdid not exceed 6 to 8 or 9 months.
4/-

62
I Max.defoliation
so Avg. defol.• I-6 mo.
a 60-
40-
205 40 -25U
5 10 15 20 25 30 ..
Pounds per Acre
Figure 17. Trends in Maximum and Average Defoliation for Six Mont.bhFolloving Treatment by Purple in Relation to Dosage Rate.Data based on vimual eatimetes.
Pink caused effective defoliation at lower rates than Purple,based on data for average defoliation for the period 1 to 6 months afterapplication. Pink applied at 1.5 to 2.5 gal/acre gave effective defolia-tion for periods of 6 to 9 months.
Evaluation of Orange was conducted over a shorter test periodthan Purple or Pink. Available data indicate that Orange is closelycomparable in effectiveness to Purple.
2. Selected Defoliants, DestLccants, and Herbicides
Treatments with several commercially available defoliants, desic-cants, and herbicides were applied in three 2-month periods alternatingwith tests involving Purple, Pink, and Orange. Evaluation data on selecteddefoliants and desiccants are shown in Table 4; data on other herbicidesand herbicide mixtures are shown in Table 5.
_ - -
.. - _
jil!,-'A . .

63
a. Defoliants and Desiccants
(I) Cacodylic Acid and Sodium Cacodylate
Cacodylic acid was initially treated at 5.0 and 7.0 lb/acrein Test Site I. Systematic evaluations are not available for tlhe first fewweeks but moderate to extreme defoliation was noted about one month aftertreatment. Treatments made in October 1964 and March 1965 at rates of 3.4to 6.0 lb/acre caused effective defoliation 2 to 4 weeks after application.The sodium cacodylate treatment at 1.8 lb/acre was relatively ineffectiveon both test sites.
Regrowth of woody vegetation occurred 2 months followingapplication of cacodylic acid but visible effects of treatment continuedfor 4 to 6 months.
(2) Diquat
Initial tests with diquat at 2.7 and 4.0 lb/acre gavemoderate to extreme defoliation in the first month after application,but effectiveness diminished rapidly in 3 to 4 months because of regrowth.Applications at 2.8 and 5.0 lb/acre near the end of the rainy season(October) gave effective defoliation for a period of 2 to 4 weeks onsecondsry vegetation on Test Site I1. Rates of 3 to 5 lb/acre areapparently required for effective treatment.
Treatments during the dry season (March) were ineffectiveat rates of 2 to 4 lb/acre. An additional treatment of diquat with amitroleadded as an active translocating herbicide failed to give effectivedefoliation. --
A mixture of diquat and Tordon is discussed in Section X,
A, 2,b(2).
(3) Endothall
Endothall was tested in a salt formulation in water solu-tion and in acid formulation in a dimethyl formamide-vater emulsion atrates up to 5.5 lb/acre. The salt formulation gave slight defoliationfor 1 to 3 months. Endotnall acid produced slight to moderate defoliationfro.s the November and March applications, but results were generallyunsatisfactory.
(4) Marphos - Folex
Tributyl phosphorotrithioite, which is formulated both asMerphos, an oil-soluble concentrate, and Folex, an emulsifiable concentrate,was applied in oil and water solutions at rates of 6.0 to 28.0 lb/acre inearly- and late-rainy-season applications. Evaluation data are not tabu-lated as the treatments were ineffective. Maximua defoliation readings of10 to 15% were obtained at the rate of 28 lb/acre.
- jr

64
(5) Butyne Dial
Butyne dial was applied in three treatments at rates of4.5, 6.0, and 11.0 lb/acre in May and November. The chemical was ineffec-tive and resulted in only slight defoliation ratings in 3 to 4 weeks.Regrovth took place rapidly following initial desiccant action.
(6) Tributyl Phosphate L
Tributyl phosphate, an active desiccant and defoliant,was tested at 10, 12, and 24.0 lb/acre during the early- and late-rainyseason, The chemical was rated ineffective under the test conditions, Ias only slight defoliation occurred 2 to 4 weeks after treatment. Effectswere noted principally in the dominant canopy.
b. Herbicides
Selective herbicides that were evaluated included dicamba(amine and acid formulations), amitrole, and Tordon applied single andin combination with diquat or 2,4-D. Only limited amounts of Tordonwere available and tests iere limited to single rates on replicate 5-acre plots.
(1) Dicamba
Dicambd amine was applied in water solutions at rates of6.0 to 15.0 lb/acre dicamba acid equivalent. These rainy-season applica-tions gave a moderate degree of defoliation. At the 15.0-lb/acre rate,defoliation approached the effective percentage during the fourth monthbut., in general, treatments were less effective than corresponding ratesof Purple, Pink, or Orange.
Dicamba acid at 10.8 lb/acre in a 1:3 butanol-wateremulsion gave effective defoliation ratings for 2 to 5 months on TestSites I and II from applications during the dry season (March 1965).A lower rate (3.9 lb/acre) of dicamba acid was not effective.
(2) Tordon
"Tordon was applied singly as a potassium salt and in mixtureswith 2,4-D, diquat, or Orange.
Effective defoliation.Vas obtained over a 2- to 6-monthperiod with the diquat-Tordon mixture (2.5 and 1.2 lb/acre, respectively)applied during the rainy season en Test Site 11. Ratings declined belowthe effective level at the 8- to 9-uonth reading,
______________.

65
Tordon in combination with 2,4-D amine at 2.3 and 5.3lb/acre, respectively, gave effective defoliation 4 to 6 months aftertreatment during the late rainy season.
Tordon was applied alone at a single rate (2.8 lb/acre)during the dry season. Somewhat variable but generally ineffectiveresults were obtained through the 5-month evaluation period. Increasedeffectivenesas was noted at the last rating.
An additional combination treatment of Tordon and Orangeis discussed under Section X,Ald.
(3) Amitrole
Amitrole applied at a rate of 6.3 lb/acre in water solu-tion with surfactant barely gave an indication of treatment in the monthsfollowing application. Slight chlorosis or yellowing of foliage in thedominant canopy and in some of the more susceptible shrub species wasthe main evidence of treatment.
B. MEASUREHEN OF UPPER CANOPY DEFOLIATION BY VERTICAL PHOTOGRAPHY
Photographic records of defoliation as measured by canopy obscurationwere obtained for the entire series of test applications including 14untreated control plots on each test site. Data in Tables 6 to 8 showthe maximum decrease in percentage obscuration due to treatment accordingto the equation:
%. obac. prior to treatment - %. oboc. at max. effect x 100% obsc. prior to treatment
Additional data include a aaary of the number of months to maximumeffect, duration of the maximum effect, and the number of months to 50%.recovery of the original pretreatment condition.
Seasonal trends in obscuration based on data from untreated controlplots for the two test sites are shown in Figure 18. Obscuration valuesdecreased markedly during the dry season from January to April as affectedby the deciduous character of the vegetation. Test Site I1 showed agreater seasonal change than Site I because of the prevalence of deciduousshrubs and lack of overstory dominants.
g . Purple, Orange, Pink, and Dinoxol
Mean treatment data for the two test sites are shown in Table 6for applications of Purple, Orange, #ink, and Dinoxol arranged by dosagerate groups, without regard to season of application.
I- .•
I ____
• l -' " "' I
4 ?,
' '• / i ""
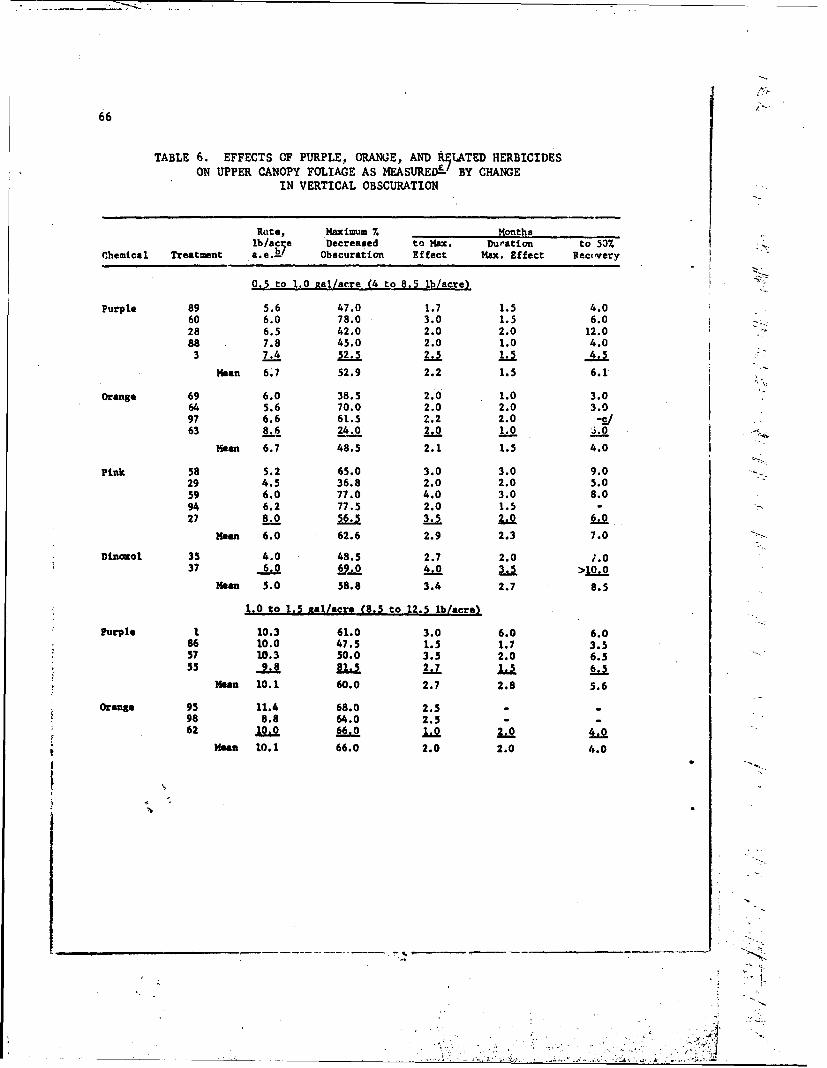
66
TABLE 6. EFFECTS OF PURPLE, ORANGE, AND RMLATED HERBICIDESON UPPER CANOPY FOLIAGE AS MEASUREDW BY CHANGE
IN VERTICAL OBSCURATION
Rate, Maximum % Monthslb/ace Decreased to Max. Duration to 507.
Chemical Treatment a.e.b Obscuration Effect Max. Effect Fectvery
0.5 to 1.0 aal/acre (4 to 8.5 lb/acre)
Purple 89 5.6 47.0 1.7 1.5 4.060 6.0 78.0 3.0 1.5 6.028 6.5 42.0 2.0 2.0 12.088 7.8 45.0 2.0 1.0 4.03 7.4 52.5 2. 4.5
Mean 6.7 52.9 2.2 1.5 6.1,
Orange 69 6.0 38.5 2.0 1.0 3.064 5.6 70.0 2.0 2.0 3.097 6.6 61.5 2.2 2.0 -c/63 8.6 24.0 2.0 1.0 ý..
Mean 6.7 48.5 2.1 1.5 4.0
Pink 58 5.2 65.0 3.0 3.0 9.029 4.5 36.8 2.0 2.0 5.059 6.0 77.0 4.0 3.0 8.094 6.2 77.5 2.0 1.5 .27 8.0 2L,5 3.5 2.0 6.0
Mean 6.0 62.6 2.9 2.3 7.0Dinozol 35 4.0 48.5 2.7 2.0 /.0
37 6.0 0.0 4.0 Ll >10.0
Mean 5.0 58.8 3.4 2.7 8.5
1.0 to 1.5 nal/acre (8.5 to 12.5 lb/acre)
Purple 1 10.3 61.0 3.0 6.0 6.086 10.0 47.5 1.5 1.7 3.557 10.3 50.0 3.5 2.0 6.555 9.8 81.5z L. 6.
Mean 10.1 60.0 2.7 2.8 5.6
Orange 93 11.4 68.0 2.5 -
98 8.8 64.0 2.5 --62 10.0 66.0 L.o L.o 4.0
Mean 10.1 66.0 2.0 2.0 4.0
A
1i~

6,
Rate, Maximum % Moathslb/ac~e Decreased to Max. Duration to 50F
Chemical Treatment a.Ue Obscuration Effect Max. Effect Recovery
Pink 92 8.8 42.5 2.5 2.0 -56 11.2 81.5 3.2 :.5 6.5
Mean 10.0 62.0 2.9 2.25 6.5
Dinoxol 36 10.0 65.5 3.75 3.5 12.0
1.5 to 2.0 "al/aure (12.5 to 17.5 Ib/acre)
Purple 87 14.6 52.5 1.5 1.0 4.07 15.4 75.0 1.0 3.0 5.0
Mean 15.0 63.75 1.2 2.0 4.5
Orange 96 15.2 72.-1 1.7 -
Pink 93 14.8 62.0 2.0 1.5 >3.04 13.6 61.5 3.0 2.5 5.0
54 17.2 69.0 4.0 1.5 5.091 17.6 65.5 2.5 7..0 >3.5
Mean 15.8 64.5 2.9 1.9 >4.0
2.0 to 2.5 gal/acre (17.5 to 22.5 lb/acre)
Purple 33 18.0 85.0 6.0 3.0 9.590 22.4 63.0 3.0 1.5 >4.0
Mean 20.2 79.0 4.5 2.25 >6.75
Orange 61 21.5 95.0 4.0 4.0 >8.0
Pink 31 20.0 84.0 1.5 4.5 12.0
3.0 gal/acre (25 to 27 lb/acre)
Purple 30 25.0 71.5 3.0 6.0 >12.09 25.8 83.0 4.0 2.0 7.0
52 27.0 70.0 4.. 3.0 10.5
Mean 25.9 74.8 3.8 3.7 9.8
a. Data represent means of individual treatments and rate groups.b. Acid equivalent.c. No data. Readings incomplete at time of publication.
1" - ..
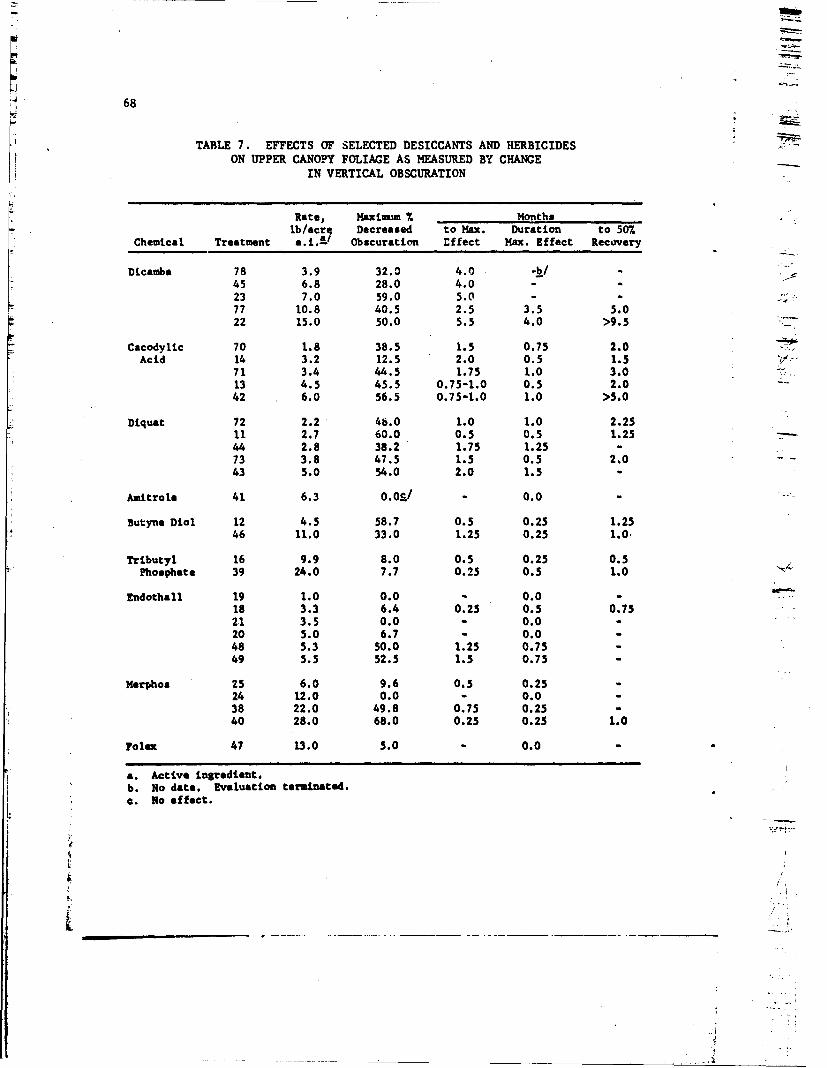
68
TABLE 7. EFFECTS OF SELECTED DESICCANTS AND HERBICIDESON UPPER CANOPY FOLIAGE AS MEASURED BY CHANGE
IN VERTICAL OBSCURATION
Rate, Maximum 7. Monthslb/acr, Decreased to Max. Duration to 50%
Chemical Treatment a.i.- Obscuration Effect Max. Effect Recovery
Dicamba 78 3.9 32.0 4.0 -
45 6.8 28.0 4.0 -23 7.0 59.0 5.0 -
77 10.8 40.5 2.5 3.5 5.022 15.0 50.0 5.5 4.0 >9.5
Cacodylic 70 1.8 38.5 1.5 0.75 2.0Acid 14 3.2 12.5 2.0 0.5 1.5
71 3.4 44.5 1.75 1.0 3.013 4.5 45.5 0.75-1.0 0.5 2.042 6.0 56.5 0.75-1.0 1.0 >5.0
Diquat 72 2.2 4b.0 1.0 1.0 2.2511 2.7 60.0 0.5 0.5 1.2544 2.8 38.2 1.75 1.25 -73 3.8 47.5 1.5 0.5 2.0 -43 5.0 54.0 2.0 1.5 -
Amitrole 41 6.3 0.01/ - 0.0
Butyne Diol 12 4.5 58.7 0.5 0.25 1.2546 11.0 33.0 1.25 0.25 1.0.
Tributyl 16 9.9 8.0 0.5 0.25 0.5Phosphate 39 24.0 7.7 0.25 0.5 1.0 N'P
Endothall 19 1.0 0.0 - 0.0 .18 3.3 6.4 0.25 0.5 0.7521 3.5 0.0 - 0.0 -
20 5.0 6.7 - 0.0 -
48 5.3 50.0 1.25 0.75 -49 5.5 52.5 1.5 0.75 -
Merphos 25 6.0 9.6 0.5 0.25 -24 12.0 0.0 - 0.0 -
38 22.0 49.8 0.75 0.25 -40 28.0 68.0 0.25 0.25 1.0
Folex 47 13.0 5.0 - 0.0
a. Active ingredient.b. No data. Evaluation terminated.c. No effect.
L!
'1*~
£ _____.....___

69
TABLE 8. EFFECT OF TORDON AND MIMES CONTAINING TOMDON ON UPPER -CANOPY FOLIAGE AS MEASURED BY CHANCE IN VERTICAL OBSCURATION
Rate, Maxiwim Months *..
Treat- lb/acre Decreased to Max. Duration to 50%Chemical ment a.e. Obscuration Effect Max. Effect Recovery
Tordon 75 2.8 54.5 2.0 3.0 5.0/
Tordon + 51 2.3+5.3 78.0 5.5 >2.0 >9.02,4-D
Tordon + 99 0.5+9.1 74.2 1.25 >1.0Orange
Tordon + 50 1.2+2.5 79.0 4.0 3.5 >6.-ODiquat
a. Greater than last observation.b. No data. Did not recover to 50%.
Defoliation response from Purple treatments expressed as maximumdecrease in obscuration increased with dosage rate from a value of 53%for applications of 6.7 lb/acre to 75% for treatments at 25.9 lb/acre(3 gal/acre of total esters).
Maximm decrease in obscuration from Purple occurred generally2 to 4 months after treatment and maxiwn effect persisted from 1.5 to3.7 months as indicated by group mean data (Table 6). Treatment effects r,as measured by the period to 50% recovery lasted from 4.5 to 10 months atthe highest rate of application.
Figure 19 shows the trend in maximum percentage of decrease inobscuration as related to the rate of application of Purple. Durationof defoliation as the period of maximum effect, and number of monthsrequired for 50. recovery of the maximum effect increases at higherdosage rates (Figure 20).
Orange showed defoliation responses similar to those of Purple.Values for maximum decrease in obscuration wore slightly higher at dosagerates of 15 and 20 lb/acre.
Pink treatments gave closely similar data to those of Purple in
degree and duration of defoliation at comparable rates. Dincmol appliedat minimal dosage rates was slightly more effective than Purple or Orange;at 6.0 lb/acre Dinsxol gave 69% defoliation response compared with responsesof 50 to 60% from Purple or orange.
/J
, .1

70
:70.
so.
4- xx S
0xwN
20- x
JeFeb M.r Apr May JnJlAg pOs * .4 - ry lssonem04 twet soe*, m-
90
N
A S40-
30
X X
BX
4- dry we..e-* -wet oesemt
Figure 18. $easomal Changes In Canopy Obeouratlan on Untreated Control Plote..Data represent individual plot values of per cost of rnmaimobacuration.A. Teat Site 1.3. Test Site It.

71.
90
:70
2X""60 X
X $©
u 40,
t30",0
• 20
10
510 iS 20 25Pounds per Acre
figure 19. Relation of Maximus Per Cent Decrease in Canop" Obscuratiom
to Doaage Rate of Purple. Data represent aamea frooTest Site@ I and 11.

72
4-
A4
2.
0 51 10 120253
Pounds Pat LAm
1x
Ila
1K x x
I II
10 15 20 A52
Pounds per Awe
Pigure 20. Duration Of Defoliation Respons, from Application of Purplea8 Rolated to Dosage ltate.ýA. Duration of ssmzima. peg Cent decrease Ia obscuration.- -
Data represent suma treatumut values.S. *uober of moths until 50% recovery from miinm reeponee.
Data tep.esent Individual plot values.

r -
73
2. Selected Defoliants, Desiccants, and Other HerbicidesData for most of the other chemicals tested are shown in Tables
7 and 8.
Dicamba gave defoliation responses of 28 to 59% for treatmentsranging from 3.9 to 15.0 lb/acre. Maxim=m values for decrease in obscura-tion for dicamba were considerably lower than those of Purple, Orange, orPink; also for cacodylic acid and diquat (Figure 21).
Cacodylic acid and diquat as desiccants gave a rapid defoliationresponse (2 to 6 weeks for maximum effect). Diquat gave slightly greaterdefoliation response than cacodylic acid at equivalent dosage rates(Figure 21). Both chemicals gave apprcximately 50% reduction in obscure-tion at a rate of 5 lb/acre.
Of the other chemicals tested only Merphos, butyne diol, andRadothall showed appreciable defoliation response. Merphos and Rkdothall
* caused minimal defoliation at their highest dosage rates. Variable results* were obtained with butyne diol.
Obscuration data (Table 8) for Tordon and mixtures of Tordon with2,4-D, Orange, and diquat show maximum responses similar to those obtainedat the higher rates of Purple and Orange. Two of the four treatmentsrequired 4 to 5.5 months to attain maximum response. Approximately 80 %-decrease in obscuration was obtained with treatments of Tordon + 2,4-Dand Tordon + diquat during the late rainy season.
C. HORIZONTAL VISIBILITY
The effects of defoliation treatments on horizontal visibility weremeasured on the basis of percentage of a target visible at distances of10, 15, and 20 meters. Comparisons between initial and maxisua percentageof target visibility provide an index of defoliation effectiveness ofvarious treatments at or near the ground level.
Interception of spray by upper canopy vegetation influenced thedefoliation response in the shrub and ground cover in which horizontalvisibility measurements were taken. The ratio of maxlmim to initialhorizontal visibility was consistently greater on Test Site 11 than onTest Site 1. On Site It only a remnant of the dominant canopy remainedand sprays were able to penetrate the single layer of large shrubs oriall trees forming the main vegetation cover. --.-
Initial and mexisnmi horizontal visibility data are shown in Table 9for applications of Purple, Orange, Pink, and Dinoxol made from-August .....1964 to June 1965. Similar data on selected desiccants and herbicidesare shown in Table 10. Mean values are given for target visibility -..
* .

74
9x
ax
40--0 x
0 0 i0b
20- 0 casedylie acdd
510 i5 20 25Pounds Pa cr
T
Figure 21. Defoliation Respoinse of DLecma, Cacodylic Acid, nd Diquatto Relation to Rate of Application. Data represent plotvalues of smiinin per cent decrease In obscuration.
¼*.

75
TABLE 9. INITIAL AND MAXMLUM HORIZONTAL VISIBILITY RESULTINGFROM APPLICATIONS OF PURPLE, MRANGE, PINK, AND DINOXOL
Chenical Mean Per Conti/ Ratioand Rate, Target Visibility Naximms/lIttal i4amths to
Treatment lb/acre Initial Maximma Visibility Neimism Visibility
Purpl,
89 5.6 27 48 1.7-2.4 2-360 6.0 14 43 2.5-3.4 4-528 6.5 30 37 1.2-1.3 2-432 7.0 26 35 1.2-1.2 Z-388 7.8 36 42 1.2-1.2 226 9.5 29 52 I.d 255 9.8 21 41 2.3-2.5 5-686 10.0 25 40 1.3-1.9 357 10.3 20 41 1.3-4.9 2-387 14.6 21 37 1.8-2.5 3-453 18.0 23 61 2.3-2.8 3-530 20.0 27 47 1.9 290 22.0 29 45 1.3-2.2 1-252 27.0 22 48 1.7-2.9 2-430 30.0 40 65 1.6 3
Orange
64 5.5 18 36 1.8-2.1 3-497 6.6 23 41 1.3-1.7 385 8.2 25 46 1.8 263 8.6 27 40 1.5 198 8.8 13 36 2.6-2.7 1-262 10.0 11 30 3.0-4.0 1-3 .-
95 11.4 19 49 2.3-3.0 1-263 12.8 27 49 1.8 396 15.2 34 48 1.2-1.7 1-261 21.0 19 43 2.0-2.5 2-3
Ptik
81 4.0 18 35 1.9-2.1 229 4.5 37 52 1.3-1.5 2-358 5.2 20 45 2.1-2.1 259 6.0 13 33 2.9-4.4 2-494 6.2 28 55 1.9-2.0 127 8.0 25 51 1.7 392 8.8 20 38 1.6-3.0 1-234 9.0 19 42 1.7-3.2 1-456 11.2 21 48 1.6-2.5 2-393 14.8 35 63 1.8-1.9 154 17.2 13 43 3.3 3 ..91 17.6 30 48 1.6-1.6 1-331 20.5 21 58 1.9-3.7 2-3
Diumet
35 4.0 27 43 1.2-2.5 3 -37 6.0 21 32 1.4-1.8 1-336 10.0 27 54 1.6-2.8 1-2
a. Data based as percentage of target visible at distawas of 10, 15, end 120 eiters.
.. ',
I>''..

76
before treatment and at the period of maxim= visibility. Replicate plotdata are included on the ratio of maxi-m to initial visibility and on themonthly intervals at which maximum improvement in visibility occurred.
TABLE 10. INITIAL AND MAXIMUM HORIZONTAL VISIBILITY RESULTING FROMAPPLICATIONS OF SELECTED DESICCANTS AND HERBICIDES
p
Chemical Mean Per Centa-/ Ratioand Rate, Taraet Visibility Maxicmm/Initial Months to
Treatment lb/acre Initial Maximm Visibility Maximsm Visibility
Cacodylic Acid
70 1.8 32 60 1.5-3.0 271 3.4 21 60 2.5-3.4 2-442 6.0 29 55 1.3-3.6 0.7-1
Diquat
72 2.2 30 53 1.7-2.0 244 2.8 22 41 1.5-2.8 0.5-0.773 3.8 36 55 1.5-1.6 1-243 5.0 18 42 2.2-2.7 0.5-3
Dicamba
78 3.9 17 29 1.2-1.8 2-345 6.8 22 32 2.2 523 7.0 31 45 1.3-1.5 2-377 10.8 20 43 2.1-2.2 2-322 15.0 47 63 1.4-1.8 4 1
Tod. /
75 2.8 36 45 1.2-1.4 3
Toedoa + Dituat
50 1.2+2.5 28 54 1.7-2.5 5-6
Tordon + 2,4-D
51 2.3+5.3 10 58 5.1-7.9 6
Tordon + Orange99 0.5.9. 1 40 48 1.0-1.6 2-3
a. Data based on percentage of target visible at distances of 10, 15, and20 seters.
. ',
"i
~-*

77
The series of Purple treatments averaging 13.6 lb/acre acid equivalent(Table 9) resulted in a mean maxim-m visibility of 45% (range 35 to 65%)
as compared with a mean initial visibility of 26% (range 14 to 40%).Slightly higher visibilities were obtained with increase in rate (Figure22). Maximum increase in visibility occurred at approximately 3 months.
As measured by the horizontal visibility technique, applications ofOrange at 5.5 to 21.0 lb/acre resulted in a maximum mean visibility increase vof 42% (range 30 to 49%) as compared with an initial mean visibility of 22%(range It to 34%) (Table 9). Canopy ef fects from Orange applications madeduring the dry season and in the early rainy period showed little differ-ence in horizontal visibility with rate of chemical applied.
II
5 105i 20 25 30
Vigue 2. Rtatin o HuinueInceas InNorlsontal Visibility toDoaelate of"oApplied. Dt etes ramn
sense~~~~~~ ~ ~ ~ ~ ~ ofterto fps-t petotet iiiiy
7~~~

78
Applications of Pink gave mean values for initial and mxummum visibilitysimilar to those of Purple and Orange. Maximum visibility was obtained 2months after application. No significant trends were noted with increasedrates. Dinoxol gave comparable increases in visibility to the otherherbicides.
Data for cacedylic acid and diquat (Table 10) show increases in hori-zontal visibility equivalent to or greater than those of Purple and Orange.Cacodylic acid produced maxinkum visibility in 3 to 4 weeks after treatmentat 6.0 lb/acre. Maximum visibility of 55 to 607. from cacodylic acid wasequivalent to that obtained with 15 to 25 lb/acre (2 to 3 gal/acre) ofPurple. Diquat gave slightly less improvement in horizontal visibilitythan cacodylic acid. Treatment 44 at 2.8 lb/acre gave maximum visibility
,in 2 to 3 weeks.
Dicamba applied as acid or amine at rates of 3.9 to 15.0 lb/acre wasless effective than Purple or Orange. One replicate applied at 15.0lb/acre gave a maximum visibility of 63% but n=t improvement over theinitial reading was only 16%.
Tordon applied singly or in combination with other chemicals caused* variable increases in horizontal visibility. Late rainy-season creatments"* of Tordon in mixture with diquat or 2,4-D were more effective than a dry-
season application of Tordon alone. Treatment 51, consisting of Tordonand 2,4-D, gave the highest percentage increase in horizontal visibilityof the entire test program but initial visibility was also the minimtmof all treatments. in generalp Tordon treatments attained maximum visibility3 to 6 months after application.
D. AU.IAL PHOTOGRAMHS
Aerial panchromatic photographs of portions of Test Sites I and 1"are shown in Figures 23 and 24, respectively. In Test Site I effectivetreatments are clearly evident in the unbroken forest canopy. A sugarcaneplantation adjoins the eastern border of this site. Scattered largedeciduous trees of the dominant canopy are visible throughout the area.
Figure 24 shavs the calibration grid of Test Site 11 in the upper leftportion. Secondary forest and shrub aspect of the vegeLation are evidentas well as previously cultivated clearings.
Figures 25 and 26 show portions of Test Sites I and I1 photographedwith infrared film. Treatment plots with dead or dying vegetationphotograph black in contrast to the lighter shades of untreated vegetation.
i i--
41'

79
jj-
Z
Figuire 23. Portion of Test Site I Showing Treated Plotsbetween Lane 3 (at the Bottom) and Lane 8(Near the Top). Panchromnatic film, scale1:15,000. February 1965.
A - 7

80
dipi
Figure 24. Portion of Test Site I1 Showting Treated Plot*on Lanes 0, R, and N in Upper Left. Calibrationgrid in lower left. Lane Q is roughly parallelto the road In lower right. Panchromatic film,scale 1:15,000. February 1965.

81
4-V.
"V,1

82
:7:
.4 '
F Ligure 26. Detail of Test Site UI Sbowing Partially ClearedShrubby Vegetaton amnd Treatmust Plots betweenLanes Q, P, end 0. Treated areas photographblack on infrared Uilu, ecale 1:5,000. Ma7 1965.
-7
, ,. ,.,* .1
S+ , - +, .,-+. .,4 ...
'+ ++ + :• ' 1 = +• ' " =# ++ '+• +

83
E. EVALUATION Cl CHMaICALS
Evaluations of chemicals are presented in outline form with tentative
recomuadations based on the conditions of the test program.
1. Purple
* a. Chemical Name
* 50% n-butyl ester of 2,4-D; 30% 1-butyl ester of 2,4,5-T,and 20. iso-butyl ester of 2,405-T
b. Test Record
Nunber of treatments: 20Rates: 5.6 to 30.0 lb/acre acid equivalent (0.65 to 3.5
gal/acre total ester)Volumes: 0.65 to 5.4 gal/acreSeasons: early rainy, late rainy, dry, early rAiny
c. Type of Chemical
Rerbicide, causing defoliation in I or 2 months and partialor complete top kill
d. Treatment Effects
(I) Rate
The degree of defoliation as expressed by percentagememimin response and the duration of an effective level of defoliationincreased with the rate of Purple applied (Table 11). An effective levelof defoliation, 60' to 65% or more as Judged by visual estimates and verti-cal obscuration technique, was obtained with applications of Purple at1.5 gal/acre (10 lb/acre) or more. The effective level of defoliationwas reached at all rates within 2 months of the date of applications madeduring the growing season. Applications of 15 lb/acre or 2 gal/acre oftotal esters gave an average nimim effect of 70%. and effactive durationlasted for 2.2 months or until 4 to 6 months after the chemical was applied.Applications of 25 lb/acre or 3 gal/acre of total ester caused an averagemaximam defoliation of 751 as measured by both visual earimates and verti-cal photography. The period of effective defoliation at this rate lastedfor 3.4 months beyond the 2-month interval at which the defoliation levelbecame effective (Figure 27).
For effectivi increase in air-to-ground visibility and someioprovemnt in lateral visibility at eye level in the range of vegetationconditions represented by the two test sites, a sinizam effective rate of15 lb/acre acid equivalent or 2.0 gal/acre of total ester is recoimanded.

84
ý-5
"e ctz

II 85
'1p4.~ A..
si;9

86
TABLE 11. DEFOLIATION RESPONSE WITH PURPLEUSING THREE EVALUATION TECHNIQUES
Mean Rate. lb/acreDefoliacion Response 10 15 20 25
% MAximum Effect
Visual Estimate 54 70 73 75Vertical Obscuration 60 64 79 75Horizontal Visibility 42 49 51 53
Months to Maximum Effect
Visual Estimate 3.1 2.7 3.3 3.8Vertical Obscuration 2.7 1.2 4.5 3.8Horizontal Visibility 3.1 3.7 2.5 3.0
Duration of Effective Defoliation,, months
Visual Estimate 1.3 2.2 3.2 3.4
(2) Volume
Effectiveness of Purple treatments was influenced more byrate than by volume. Applications of I to 1.5 gal/acre of Purple as purechandtcal or diluted with equal volumes of diesel fuel produced similardefoliation response.
vegeatio wasSatisfactory spray coverage end penetration of junglevegtaton asobtained with applications of 1.5 to 2.0 gal/acre with a
droplet size of 275 to 350 microns NW.
.(3) Season
Applications of Purple were loes effective In the dryseason than in the rainy or growing season. Purple Is a systemc growth-r"igulatinot herbicide and the-principal responses of the plant to thectemic*1l are made during active growth. The herbicidal and defoliationrespcuse may~ be delayed until active growth starts,, as for trea to~tmade in April at the end of the dry season. Treatumets 1 thru 7 (Table 3V. 56) were applied during April 1964 and defoliation response wee delayeduntil after the -rainy season began in Nay.

87
Effective defoliation values were obtained during thedry season at the higher rates of application, especially on Teat Site 'L.The pronounced natural defoliation occurring from February to April onthis site (Figure 18B) obviously contributed to the total defoliationestimates. The true effectiveness of chemical treatments applied duringthis period is therefore difficult to establish.
(4) Site
, Defoliation response was greater in the secondary forest* and shrub vegetation of Toet Site 11 than in undisturbed forest of Test
Site Iv as measured by all evaluation techniques. This difference is due,in part, to better opportunity for spray penetration in the secondaryvegetation and to the substantial numbers of species that responded --
readily to treatment with Purple.
a . Remeako
The deciduous trees of the dominant layer or upper canopyshowed a greater defoliation and herbicidal response than evergreentrees and shrubs. Som species of the intermediate tree and shrub layershowed regrowth Initiating 4 to 6 months after treatment.
f. Recommndations
A minimua rate of 15 lb/acre acid equivalent or 2.0 gal/acreof Purple is recomended for effective defoliation in vegetation typesrepresented in the test location. Applications should be limited tothe rainy or growing season.
Application rate of 10 lb/acre or apprcimeately 1.5 Sal/acremay be used in secondary forest or shrub vegetation of low stature anddensity.
A sinima application volume of 1.5 gel/acre is desirable.
2. Orange
a. Chemical Name
50Z l-butyl ester of 2,4-D and 50% 1-butyl ester of 2,4,5-T
b. Test Record
Nuhmber of treatments: 10Rate: 5.4 to 21.0 lb/acre acid equivalent0.7 to 2.5 gal/acre of total astersVolumes: 1.0 to 2.5 gal/acreSeasons: dry, early rainy

88
c. Type of Chemical
Herbicide, similar to Purple in defoliation and herbicidalresponses
d. Treatment Effects
(1) Rate
Increase in defoliation response with increase in ratesimilar to Purple. As measured by vertical obscuration values, maximumdefoliation response increased from 55% with applications of 6.7 lb/acreto 95% at 21.0 lb/acre (Figure 28).
Effective defoliation occurred on both test sites withapplications of 10 to 12 lb/acre.
(2) VolumVolume requirements are similar to Purple. Addition of
diesel fuel to chemical mixtures did not increase effectiveness.
(3) Season
Early rainy-season treatments gave effective defoliation,particularly on Test Site I1.
Dry-season treatments at 2.5 gal/acre (21.0 lb/Acre) gaveeffective defoliation on Test Site I but lover rates were ineffective.
(4) Site
Differences in response on Test Sites I and 11 weresimilar to Purple.
e. Revirka
On the basis of short-term evaluations of dry-season and early-groving-season treatments, Orange was equal in effectiveness to Purple.Orange appeared to produce a more rapid defoliation response than Purple;smximum horizontal visibility was attained I to 2 months after treatmentwith Orange as compared with that of 2 to 4 months for Purple.
f. Recoosndations
Orange is equivalent to Purple in defoliation effectivenesson the basis of short-term evaluations.
The eanm rate that was recomended for Purple (15 lb/acreor 2.0 Sal/acre) can be used for Orange.
• • '- ;' / • .•
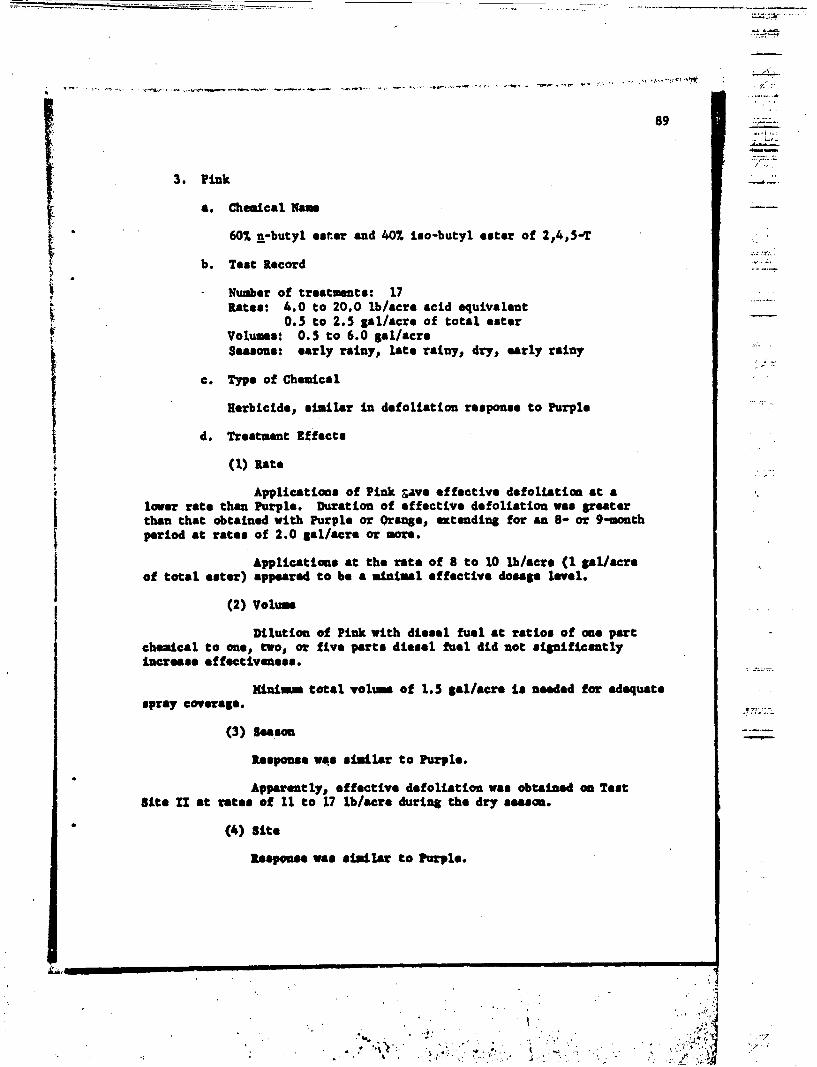
89
3. Pink -,-
a. Chemical Name
60% n-butyl aster and 407 iso-butyl aster of 2,4,5-T
b. Test Record
Number of treatments: 17Rates: 4.0 to 20.0 lb/acre acid equivalent
0.5 to 2.5 gal/acre of total esterVolumes: 0.5 to 6.0 gal/acreSeasons: early rainy, late rainy, dry, early rainy
c. Type of Chemical
Herbicide, similar in defoliation response to Purple
d. Treatment Effects
(1) Rate
Applications of Pink &avo effective defoliation at alower rate than Purple. Duration of effective defoliation was greaterthan that obtained with Purple or Orange, extending for an 8- or 9-monthperiod at rates of 2.0 gal/acre or more.
Applications at the rate of 8 to 10 lb/acre (1 gal/acre
of total easter) appeared to be a minimal effective dosage level.
(2) Volume
Dilution of Pink with diesel fuel at ratios of one partchemical to one, two, or five parts diesel fuel did not significantlyincrease effectiveness.
Miniinm total volume of 1.5 gal/acre to needed for adequate
spray coverage.
(3) Season
Response was similar to Purple.
Apparently, effective defoliation was obtained on TestSite 11 at rates of 11 to 17 lb/acre during the dry season.
(4) Site
Response was similar to Purple.
.,, . ... , . .2...

-V.
90
I..
t
I
*
I4
II
* �

91
/ Aw"A
C41
461
4bM
0. .~
C40s
I4

92
a. Rematks
Pink was generally superior to Purple in percentage of defolia-tion and in duration of effective defoliation based on visual estimates,vertical photography, and horizontal visibility techniques.
Detailed comparative analysis of effects of the two herbicideswill be published in a subsequent report.
f. Recommendations
Pink can be applied for effective defoliation during the grow-ing season at 1.5 gal/acre or 15 lb/acre acid equivalent.
4. Dinoxol
a. Chemical Name
50% butoxy ethanol ester of 2,4-D and 50% butoxy ethanolester of 2,4,5-T
b. Test Record
Number of treatments: 3Rates: 4.0 to 10.0 lb/acreVolumes: 1.0 to 3.0 gal/acreSeason: late rainy season
c. Type of Chemical
Herbicide, similar to Purple
ComercLal formulation, containing 4 lb/gal acid equivalent.
d. Treatment Effects
(1) Rate
Effective defoliation obtained on Test Site 1I at 10 lb/acre.
Slightly superior to Purple at lower rates tested.
(2) Volume
No direct comparisons made.
Volume of 3 gal/acre was superior to 1 Sal/acre at respe"-tire rates of 6 and 4 lb/acre.
A4___________________________________________________________________
-J1

93
(3) Season
No comparisons made.
(4) Site
Two of three treatments were waerof efective on Test Site 11.
a. Remarks
in the limited tests with this chemical, defoliation responsewas slightly superior to.-that of Purple. This formuilation contains anoil base that may have enhanced absorption and penetration of the herbicide.
f. Recommedation
Additional testing desirable. Apparently equivalent in effec-.tiveness to Purple or Orange.
5. Cacodylic Acid (Including sodium cacodylate - code nsm Blue)
a. ChmmicaL Name
Dimethyl arsinic acid
Bodium salt of dimethyl areinic acid
b. Test Record
Number of treatments: 5Rates: 1.8 to 6.0 lb/acreVolumes: 0.9 to 2.6 gal/acreBeasons: early rainy,, late rainy,, and dry
c. Type of Cheical
Desiccant,, causing rapid defoliation.
4. Trestmt Iffects
(1) Rate
Defoliation ef fective for a period of 2 to 4 weeks aftertreatment was obtained by applications of 3.5 to 6.0 lb/acre during bothdry and rainy seasons. The higher rate of application was needed foreffective defoliation an Test $ite I (Figure 29).
Sodium cacodylate was tested only at the ~mismm rate butappeared to be comarable In effect to cacodylic acid.

94
TT.~-U
77.1

r 95
Figure 29. Defoliation Response from Cacodylic Mcid Applied at 4.5 lb/acreat Test Site 1.A. Pretreat~met, May 1964.I. Three weeks after treatment at smaimm effect.C.* Throe InImtbu - ehaing regroth.

96
t/
(2) Volume
Spray volumes-of 2 to 2.5 gal/acre are needed for adequate
(3) Seasons
Applications of 3.5 to 6.0 lb/acre were effective in
either a dry or rainy season.
Regrowth occurred rapidly following rainy-season applica-tions. Defoliation ratings of effective treatments were less than 5013 months after application.
(4) Site
Comparable results were obtained on the two test sitesaccording to visual estimates. Improvement in horizontal visibilitywas greater on Test Site I,.
a. Remarks
Both cacodylic acid and diquat were effective defoliants forshort periods. A high percentage of leaf fall occurred in l or- 2 weeksbut vegetation recovered rapidly, particularly under favorable moistureconditions.
Cacodyl ic acid was effective in both dry- and rainy-seasonapplications; diquat was effective in the growing season only.
Cacodylic acid produced slightly loes defoliation of theupper canopy than diquat as evaluated by visual estimates and verticalphotography. Cacodylic acid at 6.0 lb/acre gave defoliation responseequivalent to Purple or Oranje at 15 lb/acre.
Improvement in horizontal visibility obtained with cacodylicacid at rates of 1.8 to 6.0 lb/acre was equivalent to that of Purple orOrange applied at 2 to 3 gal/acre.
f. Recoinndat ions
Cacodylic acid is recommended for rapid defoliation duringthe growing season or dry season. Applications of 5 to 6 lb/acre ofcacodylic acid or sodium cacodylate in a volume of 2.5 to 3.0 gal/acregive effective defoliation.

97
6. Diquat
a. Chemical Name
j I~: l'Ethylene-2:2'dipyridyl~ium dibronide
b. Toot Record
Number of treatments: 6 with diquat alone; I in mizture withanitrole; I in mixture with Tordon
Rates: 2.2-to 5.0 lb/acrsVolume: 1.1 to 3.0 gal/acreSeasons: early rainy., late rainy., and dry
c. Type of Chemical
Desiccant,, causing rapid defoliation
d. Treatment Iffects
(1) Rate
Rates of 3 to 5 lb/acre were required for effectivedefoliation. Nazisns offecc occurred 2 to 4 weeks following treatmet
Treatments In undisturbed forest vegetation of Tea -Site I were marginal in effectiveness at the maimm rate..
(2) Volume
Spray applications of 2.0 to 3.0 gal/acre gavi adequatecoverage in forest and secondary growth vegetation. Water was used asa diluent.
(3) Season
Diquat was effective during the growing season only.Dry-seasson trea-tmet were ineffective at a 4 lb/acre rate.
A dry-season application of diquat at 4.8 lb/acre Inmlixture with 7.2 lb/acre of anitrola was ineffective.
(4) Site'
Diquat was marginal in effectiveness on Test Site I butgave as miuch as 85% defollation on Test Site II, frou late rain*-ýsoasontapplications at 5.0 lb/acre.

98
Diquat caused rapid defoliation similar to that of cacodylicacid. Maximum effect was noted in 2 to 4 weeks but regrowth occurredI rapidly.
j Diquat gave slightly less lnprovent In horizontal visibilitythan cacodylic acid. As evaluated by vertical photography and visualestimates, the two chemicals gave equivalent response.
A mixture of diquat with Tordon at rates of 2.5 lb/acre and1.2 lb/acre, respectively, was effective 3 to 5 months after treatmet.
f. Recommendat ions
Diquat is an effective rapid-acting desiccant. Applicationsof 3 to 5 lb/acre give effective defoliation for a period of 2 to 4 weeksafter treatment'.
Diquat is comparable In effect and rate of action to cacodylicacid. The latter is preferred for use as a rapid defoliant.
Miztures of Tordon and diquat should be given additionaltesting under similar site conditions.
7. Dic~ams
a. Chemical Nama
2-msthomy-3,6-dichlorobenzoic acid (Available as acid andI mine salt)b. Test RecordI Number of treatments: 5
Rates: 3.9 to 15.0 lb/acre-Volums: 1.3 to 3.4 gal/acreSeassons: early rainy, late rainy,, dry
c. Type of Chemical
Herbicide
4. Treatment Mfects
(1) Rate
Dicama acid ap~ilied In the dry w~easo at It lb/acre inbutanol-qvater mwlsiom gave apparent effective visual ratings for 5months. Data indicated treatment we marginal wr ineffective.

99
Dicamba amine applied at 15 lb/acre during early rainyseason gave barely effective defoliation 4 to 5 months after treatment.
(2) Volume
Volume comparisons not available.
Three gallons per acre of water or emulsion sprays adequatefor coverage.
(3) Season
Marginal response in rainy season; marginal to Lneffective - -
during the dry season.
(4) Site
Variable response; two of three treatments superior onTest Site 11.
e. Remarks
Dicemba Save marginal defoliation response; inferior to Purple,Orange, or Pink.
Dicamba amine was reatily applied in water.
Acid formulation ts not soluble in water or oil and requiredbutanol-rater emulsion as solvent.
Not suitable for operational use.
f. lecomundations
Minimal in effectiveness at 15 lb/acre.
inferior to Purple or Orange.
Amine formulation of possible use In additional tests inmiztures with cacodylic acid or other water-soluble chemicals. :
8. Tordon
a. Chemical N
4-emtno-3,5,6-trichloropicolinic acid, available as potassiumealt...
I-1

100
b. Toot Record
Nusber of treatments: 4Rates% 2.8 lb/acreI1.2 lb/acre with 2.5 lb/acre diquat
2.3 lb/acre with 5.3 lb/acre 2,4-D amineI0.5 lb/acre with 9.1 lb/acre OrangeVolumes: 1.5 to 3.2 gal/acreSeasons: Late rainy, dry, early rainy
c. Type of Chemical
Herbicide
td. Treatment Effects
(1) Rate
Tordon applied singly'during dry season at 2.8 lb/acre gavemarginally effective defoliation for 4 months; increased response was
observed in the 5th month.in combinat ion with diquat,, late rainy-season applications
were effective from 3 to 5 months after treatment.I With 2,4-D, Tordon at 2.3 lb/acre was effective from 4 to6months after treatment; visual estimates of 80 to 901 defoliation voez~
recorded at 5 months; maximum effect (78 to 791) was observed by thejphotographic method at 2 to 5 months. The combination of 2,4-0 and Tordongave the greatest increase in horizontal visibility in the entire testprogram.
Tordon at 0.5 lb/acre with Orange (9.1 blbacre) shovedno significant difference In defoliation from Orange treatments lackingTordon. Kaxisam effect was reached In I month.
(2) Volume
No significant comparisons -can be made.
Volume of 3 gal/acre appears to be satisfactory.
(3) Season
Tordon applied during the dry season was marginally effec-tive but showed an inctaseIn effect at the ad of 5Smoths.
Rainy-season applications of Tordon with 214-o sand diquatwere effective at rates used.
------... A ý;
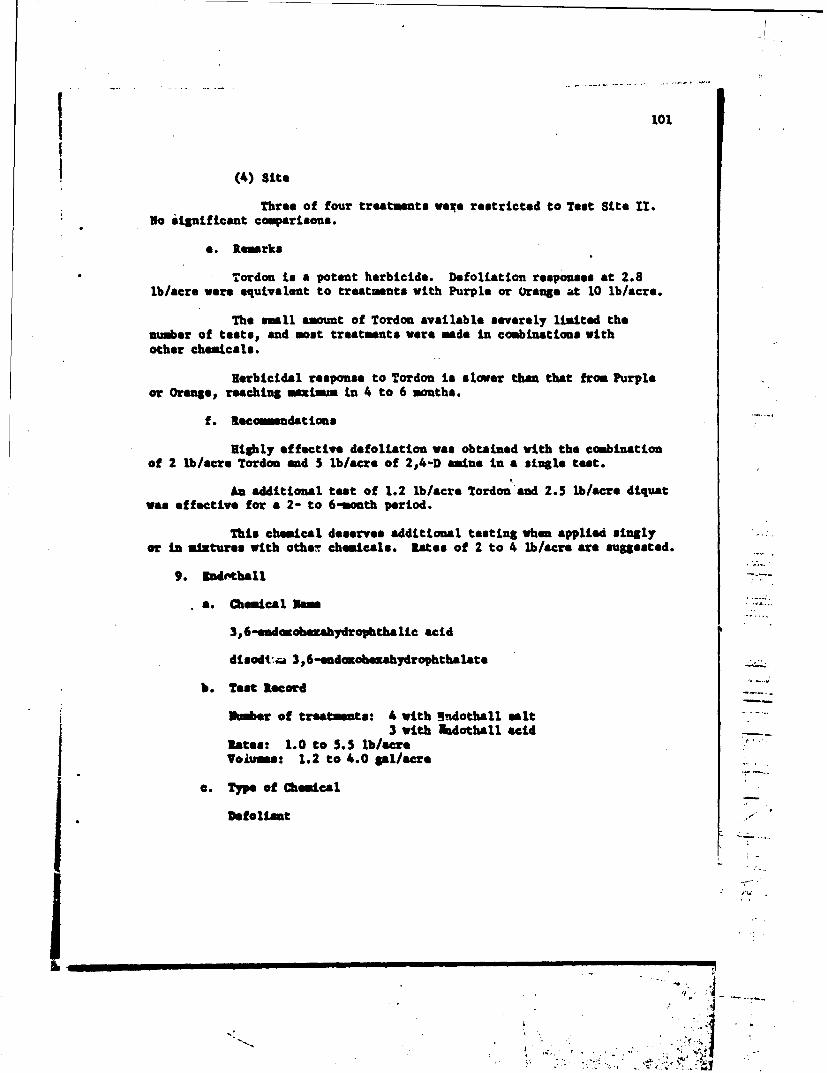
101
(4) Site
Three of four treatments we;* restricted to Test Site T1.No significant comarisons.
a. Remarks
Tordon is a potent herbicide. Defoliation responses at 2.8lb/acre were equivalent to treatments with Purple or orange ast 10 lb/acre.
The small amount of Tordon available severely limited thenumber of tests, and moat treatments wore made in combinations withother chemicals.
Herbicidal response to Tordon is alower than that from Purpleor Orange,, reaching maximum in 4 to 6 months.
f. Recommndations
Highly effective defoliation was obtained with the combinationof 2 lb/acre Tordon and 5 lb/acre of 2,4-D amine In a single test.
An additional test of 1.2 lb/acre. Tordon and 2.5 lb/acre diquatwas effective for a 2- to 6-month period.
This chemical deserves additional testing when applied singlyor in mixtures with otheir chemicals. Rates of 2 to 4 lb/acre are suggested.
9. ndr'thall 77
a. Chemical 3sme
3, 6-eudcomoezahydrophthalic acid
disodt,.a 3, 6-endonobeinahydrophthalate
b. Test Record
Ymmber of treatments: 4 with Indotball salt3 with 16dothall acid
Rates: 1.0 to 5.5 lb/acreVolumes: 1.2 to 4.0 gal/acre
a. Type of Chemical
Defoliant

102
d. Treatment Effect*
(1) Rate
Maximum defoliation ratings obtained by visual estimatesand vertical photography techniques were 30 to 507. at rates of 5 to 5.5lb/acre.
initial defoliation of 10 to 30%. was recorded in thefirst 2 weeks after treatment. Maximal effect occurred 1 to 1.5 monthsafter treatment.
(2) Volume
No comparisons of volume were made but 2.5 to 4.0 gal/acregave satisfactory spray coverage.
(3) Season
No valid comparisons. Graving-season treatments gavemsximnm defoliation.
(4) site
No valid comparisons.
a. Remarks
Treatments with bdothall were ineffective at rates up to5.5 lb/acre.
Some species showed defoliation response within one weekafter treatment.,
f. Rccaoinmdation
lot suitable asx a defoliant under test site conditions.
10. Ineffective Chemicals
a. Anitrole
(1) Chadcal Name
3-swino-1,204-triazole

103
(2) Test Record
Single treatment at 6.3 lb/acre
Additional treatment at 7.2 lb/acre in amxture with diquatat 4.8 lb/acre
(3) Type of Chemical
Herbicide, effective in control of certain woody plants.
(4) Remarks
Amitrole gave no recordable defoliation in applications at6 lb/acre in late rainy season or in mixture with diquat in a dry-seasonapplicat ion.
Slight chlorosis of the upper canopy foliage was apparentin aerial observations.
(5) Recommndation
Not effective.
b. Butyne diol
(1) Chemical Name
2-Butyne-l,4-diol
(2) Test Record
Three treatments at rates of 4.5 to 11.0 lb/acre during : -.the early- and late-rainy seasoss.
(3) Type of Chemical
Defoliant and desiccant.
(4) Remarks
Butyne diol was ineffective and resulted in only slight .,defoliation ratings at 3 to 4 weeks.
(5) Recomiendation
Not effective.
/j

104
c. Folex; Merphos
(1) Chemical Nam
Tributyl phosphorotrithioite
Formulated as Merphos, an oil-soluble concentrate, andFolex, an emulsifiable concentrate.
(2) Test Record
Five treatments at rates of 6 to 28 lb/acre during theearly- and late-rainy seasons.
(3) Type of Chemical
Defoliant
(4) Remarks
High rates of Merphos (22 and 28 lb/acre applied in dieselfuel) gave approximately 50 to 6C0 defoliation at 1 to 3 weeks as measuredby the vertical obscuration techniqueas. Ratings by visual estimates didnot exceed 15%. defoliation.
Major effect was in the upper canopy layer.
(5) Recomesendation
Not effective.
d. Tributyl Phosphate
(1) Chemical Nam
Tributyl phosphate
(2) Test Record
Three treatments at rates of 10 to 24 lb/acre during theearly- and late-rainy season.
(3) Type of Chemical
Desiccant.
(4) Remarks
Tributyl phosphate gave negligible defoliation'within thefirst 2 weeks after treatment.
(5) Iecnsandation
Not effective.

r 105
X1. DISCUSSIQI
A. GENERAL RESPONSES TO DEFOLIANT CEKEITCALS
General similarities wore noted for the entire group of chemicals inthe test program in response to several variables and conditions of the
*test.
1. Season of Application
The season of application and the related climatic and soil moistureconditions were important variables affecting the responses of vegetationto chemical treatments.* The monsoon rainy season that extends from Way toNovember in the test area is normally a period of active growth of the dryevergreen forest (Figure 30).
Purple, Pink, Orange and other growth-regulator herbicides Savemore effective defoliation response from applications mude during therainy or growing season than in the dry season under conditions of defi-cient soil moisture for plant growth. This seasonal effect on defoliationwas noted particularly an Test Site I on which dry-season applications ofPurple were ineffective at rates up to 3.0 gal/acre. by contrast, applies-tions of Purple at 1 gal/acre during the growing season gave effectivedefoliation at this site.
Natural defoliation of woody species was more evident on TestSite 11 during the dry season. Sow of the relatively high defoliationratings from the visual estimate technique obtained on this site In thedry season include the effects of both natural and chemcally-induceddefoliation (Figure 31).
The two desiccants, cacodylic acid and diquat, differed in theireffectiveness in dry-season applications. Cacodylic said was effectivein both rainy- and dry-season treatments. Diquat appeared to be moreeffective when applied during the rainy sasson. Diquat has been domon-strated to exhibit limited translocation following foliar absomption,,thus enhancing its action during period, of plant growth. Cocodylic acid,,on the other hand,, produced prisarily a contact effect ad was notappreciably influenced by the growth conditions of the plants..
The natural responses of vegetation cover to the cycle@ of dryandl rainy seaaensaon the two teat sites are shown In Figures I2# 30, and31,, as observed on untreated controls by the vertical pbotopaupby tech-niques. Greater amplitude of seasonal variation In carnapy demaity is notedat Test Site It than in Test Site 1. The vegetation !a the latter siteconsisted r* undisturbed forest with a ae or lea. continuous Intermediatetree layer .a& evergreen specie. under a scattered canepy of mixed evergreeand d&cidueuo trees. On Test Site ZZ the major species compoes wserdeciduous, resulting in marked seasonal changes In foliage density betweenthe wet and dry seasons.

106
�, � h� 4 4
��
A A.'-..ki f-tA. 4
i� >�4 � f.�
� - � rAAf�f Af
'I' � A
-� - f�-f', f�.
J __

107
Vteare 30. Irneamul WellatLm Causqp at bat Sits I ta m vat.t adceutol Plot.A. 0d-talay *seem, lope 1944.a. Waly dry smm, Ja 1943.3. rLat dray smm, April 1963.C. aty eidny "own, Apil 1943.

108
4h
AMWe
a777M
-- 777,,77
W3-
0;4

109
2. Site Differences
Fairly consistent differences were found between Test Sites I andI1 in the defoliation responses to most chemicals. Representative dataillustrating these differences are shown in Table 12 for Purple, Pink,and dacodylic acid treatments. In 75 to 80% of the instances in whichthe same treatment was applied to plots on the two test sites, theresponse on Test Site II was greater.
TABLE 12. HEAN MAXINM DEFOLIATION RESPONSES O0TEST SITES I AND 1I FROM SELECTED TREATMTS
Test % Maximum Defoliation Horizontal Visibility
Site Visual Estimate Vertical Obscuration Increase Ratio
Purple: Five Treatments, mean rate 16.9 lb/acre
I 40 43 1.5II 74 70 2.7
rtnk: Five Treatments. mean rate 10.4 lb/acre
I 54 54 1.8II 75 77 1.8
Cacodylic Acid: Three Treatments, mean rate 3.7 lb/acre
1 49 42 1.8II 57 51 3.3
This difference in response was related to differences in thegeneral structure, density, and species composition of the vegetation onthe two sites and the relation of these characteristics to spray coverageand penetration. Test Site I consisted of forest with 2 or 3 layers orstrata of trees and shrubs in the vegetation profile. A typical sectionor profile included the dominant canopy of broadly spreading tree crownsat varying heights and spacing, an intermediate tree layer of evergreenspecies such as Sttblus seylauLei that showed resistance to treatmentwith most chemical., and a dense shrub layer with many vines and woodyclimbers. Test Site It consisted of secondary forest or shrub vegetationin which the major tree cover had been removed by clearing and cutting.The major cover consisted of mall trees and shrubs. usually more open

110
and subject to greater penetration of spray during treatment applicationthan the dense multilayered forest of Test Site 1. As noted in the discus-sion on season of application, Test Site 11 contained a higher proportionof seasonally deciduous species that showed a greater response to chemicaltreatment than the predominant evergreen composition of Test Site 1.
3. Species Response to Treatment
•arked differences in species defoliation response were notedin the diverse and complex plant population of the test sites. Speciessuch as Acacia Como_ Phyllanthus sp. and Cleistanthus dasyphyllusdefoliated readily from most chemical treatments. Trees includingStreblus zeylanica, Hydnocarpus ilicifolius, and several species ofDiospyros were relatively resistant to defoliation with the chemicalstested. A detailed analysis of species response will be published in asubsequent report.
In the more complex vegetation of Test Site 1, differences werenoted in the relative response of dominant canopy and of the Phrub andground cover layers, attributable in part to variations in amoumt ofchemical spray deposited in the upper canopy vs. the forest floor andto possible differences in susceptibility of the species components tochemical treatment.
4. Rates and Volumes of Application
Chemicals such as Purple, Pink, Orange, and cacodylic acid thatwere tested at several rates generally showed an increase in defoliationeffectiveness at the higher rates of application. Ineffective chemicalsincluding Endothall and tributyl phosphorotrithioite (Folex and Nerphos)exhibited partial defoliation response only at the higher rates tested.
MHautm defoliation responses of 85 to 90% were recorded butcomplete defoliation of all species was not obtained on any treatmentplot.
Rate of chemical applied had a greater influence en effectivedefoliation than volume of spray solution applied. Evaluation of treat-ments with Purple, Orange, and Pink in which I gal/acre of pure chemicalwas compared with 2 gal/acre of a 1:1 mixture of chemical and diesel fuelshowed no significant differences in defoliation response.
Application or delivery volumes of 1.5 to 3.0 gal/acre appearedto be adequate for Purple and other oil-soluble chemicals. Water-solublechemicals such as cacodylic acid required a higher delivery volume toachieve desired levels of spray deposit because of droplet evaporation.Minimum delivery volumes of 2.5 to 3.0 gal/acre of these chemicals wereneeded to give satisfactory coverage end penetration of the canopy.
_____ _ j >

B. CRXTRUA FOR NAMMA?1(Evaluatiotr of effectiveness of defoliation treatmets in relation to
type Of chemical, rate, volume, and s*ason of application was basedprincipally on visual estimates and measuremets of cauopy obscurationby vertical photography. The photographic technique furnishes a marprecise and quantitative mesure than visual estimates.
In the visual estimate method, an over-all percentage of defoliationis obtained In which proportionate differences in defoliation In theseveral layers of the vetpetation profile are combined by the obsreinto one value. In the vertical photography technique,, the photographicsample of the vegetation profile assume the form of an inverted cansewith its tip at camera, level. The 60-degree angle of the cone apez whenprojected upward encloses a circular area 50 feet in diamter at a heightof apprmmimately 45 feet. Thus, the samp7,e size an the proportion ofarea sampled are greater in the domniant canopy 4'han In the shrub layer.fowever,, so tonpensation for the reduced sample size In the shrub layeris offered by the larger negative image of this profile component becauseof its prcsimity to the camra.
A v "mainary comparison of mazimuin-effect data from the photographicand via *~ to techniques shomwa fairly high correlation between thetwo sets a obtained. Mesan values for 70 treatmets were 69.3%for visus, too vs. 63.1% for vertical obscuration values. Thephotograph: Aique gives lower values than the visual-esttimate methodbecause of tk -,ariable obscuration component contributed by the residualbranches adtree trunks. ~ifivos values of e5 to 951 hav beem observedfor both techniques,, and the two methods may be considere" fairly comparablein rating effectiveness of traatmnt.
Hsasurmts of target visibility obtained by the horizontal visibilitytechnique reflect variations in combined foliar density and obscuration tovision offered by the matrix of stons and branches. rn the jungle-typevegetation of the test loastion,, the reduction in horlsontal visibilitydue to obscuration by stem and branches places a variable ~maxs limiton visibility at the distances used in the evaluation technique. Thisobscuration compoent is considerably greater In magnitude them thatencountered In the vetical-obscuration techntique and results in anarrower range of values from measurents before and after defoliationtretatnt * In the data anal~sed,, the rntrý limits of horizontal visi-bility at a distance of 10 to 20 meters ower 101 before treatment to 631under wIinm defoliation. Mo p~etreat~t visibility for 60 treatentson the two test sites was 24.61.
2hus, Improvement In visibility from defoliation treet~t falls withina awes restricted range of absolute values than in spressed by the ofthermeo techniques. Assumig an Initial visibility of 231 an an upper lunit

112
of 751, an observed target visibility rating of 60% would represent a netimprovement of 35 1 50 or 701. Treatments rated effective by the visual-estimate ,wethod (60 to 65% or more) had horizontal visibility ratings of45 to 50% at mzimi effect (Table 12).
Visual estimates of 60 to 651 or more over-all defoliation are con-sidered effective in improvemnt of air-ground visibility. General observe-tions of vegetation response to treat t throughout the forest profile ofTest Site I revealed that the upper or dominant canopy defoliated morereadi t; than the intermediate tree and shrub or ground cover layers.This gradation in response from the uppermost layer to the forest floorwas due to several factors Including reduced spray deposit under heavycanopies and to differential response of species to chemical treatment.Assuming that the forest profile consisted of three strata, with one-thirdof the foliage density contributed by the dominant canopy, an over-allestimate of 651 defoliation generally represented en upper canopy defolia-tion of 80 to 851. This degree of defoliation would greatly improve air-ground visibility.
C. UnTRPOLATIf1 OW z5IflS
The information and eaperience gained in this teat program should beof value in application to other t~opical areas such as those in theRepublic of Viet Srm. The Seneral correspondence in the two areas invegetation type, climate, soils, and terrain indicates that similardefoliation response should be obtained in the two locations. Both areasare cheracterised by a tropical everern forest with a monsoon climateresulting in a pronounced seaoal separation into a rainy season and adry season. Close similarities in vegetational composition have beennoted with may identical species end a large mmber of Identical generaoccurring in both locations.
The two test sites are representative of the range of vegetationalconditions In large portions of Southeast Asia. Vast areas of relativelyundisturbed jungle or tropical evergreen forest with its multi-layeredstruct ire are mempLfied by Test Site 1. The secondary forest and denseshrub growth of Test Site 11 are characteristic of the vegetational trendscmmee throughout tropical areas following partial clearing and shiftingcultivation.
Although the selection of the test location in ne of the drier por-tions of the tropical forest area of Thailand wa governed largely by itsavailability for the test program, it is believed that the choice was afortunate ae in premnting the more difficult vegetation situations inwhich defoliation might be utilized. Because of the octromely pronouncedseasoeal trends of the teot locations, wimom defoliation responses wereconsistently obtained during the favorable soil-•isture conditions of
IAI _________________________ __________________________
I%
-J

V 113
the rainy season. Interpolatton of the results of these tests to otherareas with a mor favorable moisture regime would indicate that chemicaldefoliation treatment should be equally or more effective than at thetest location. It is believed that many of the drought-resistant speciesof the dry mixed-evergreen forest such as bamboo and Streblus are relativelyresistant to defoliation treatnents. Thus, the extreme conditions of thetest location would lead to recommnded treatments that should provide anample safety factor when applied to other more favorable areas.
The spray-distribution equipment and the restricted applicationconditions of the test program differ slightly from the procedures usedin an operational program. The refinements of the research test programwith relatively mall test plots required careful control of spray driftto permit valid comparisons of adjacent test plots. Applications weremade at a relatively low flying height above the forest canopy to secureuniform spray deposition on a relatively narrow math width. It isbelieved that these differences in operational procedure are not suffi-cient to influence the projection of the test progrs results for large-scale requirement s.
V"

r 114
1[. CONCLUSI•NS AND RECO DTI0NS
The following general conclusions are dram froa the results of the testprogram on the basis of evaluationa completed through August 1965. Minimimeffective defoliation is considered to be 60 to 65% baaed on viaual eatimatesand vertical obscuratioz technique. A synopsis of use recomendations frcothis information is shown in Table 13.
1) Purple, Orange, Pink, Dinoxol, and Tordon were effective herbi-cides for long-term defoliation. Dicamba gave marginal but generallyineffective defoliation.
2) Cacodylic acid and diquat were effective desiccants for fast,short -term defoliation.
3) VIrphoa or Pole-, Endothall, tributyl phosphate, butyne diol, andemitrole were ineffective as defoliants.
4) Orange was equivalent to Purple in defoliation effectiveness.Rates specified for Purple are applicable to Orange on the basis of short-tern observations.
5) Minium effective rate of Purple and Orangt -is 2.0 gal/acre oftotal esters (15 lb/acre acid equivalent) applied du't, • .'i rainy or growingseason. Applications at this rate were effective in both dense forest withuwltiple canopies and secondary forest and shrub with a single canopy.Defoliation was effective for 4 to 6 months after treatment.
6) Applications of Purple and Orange at 1.5 gal/acre (10 lb/acreacid equivalent) were effective during the rainy season in secondary forestand shrub with light to moderate cover.
7) Applications of Purple and Orange at 2.5 to 3.0 gal/acre gaveixmzm defoliation in vegetation types ranging from ligit to dense cover.
S At 3.0 gel/acre effective defoliation was obtaiced for 6 to 9 or more monthsa ftr r treatmant.
8) Applications of Purple, Orange, and other growth-regulator herbi-cides were less effective during the dry season than when made during thegrowing season. Applications of these chemicals should generally be restricted
to the rainy season when soil moisture is available for growth and to themath Limediately preceding the rainy sa*son.
9) Pink gave effective defoliation at slightly lower rates thanPurple or Orange. Applications of Pink at 2.0 gal/acre during the rainyseason gave effective defoliation for 8 to 9 months.
N'I __ ___ ___ ___ ____ ___ ___ ___ ____ __ ___ ___ ____ ___ ___ ___
.7
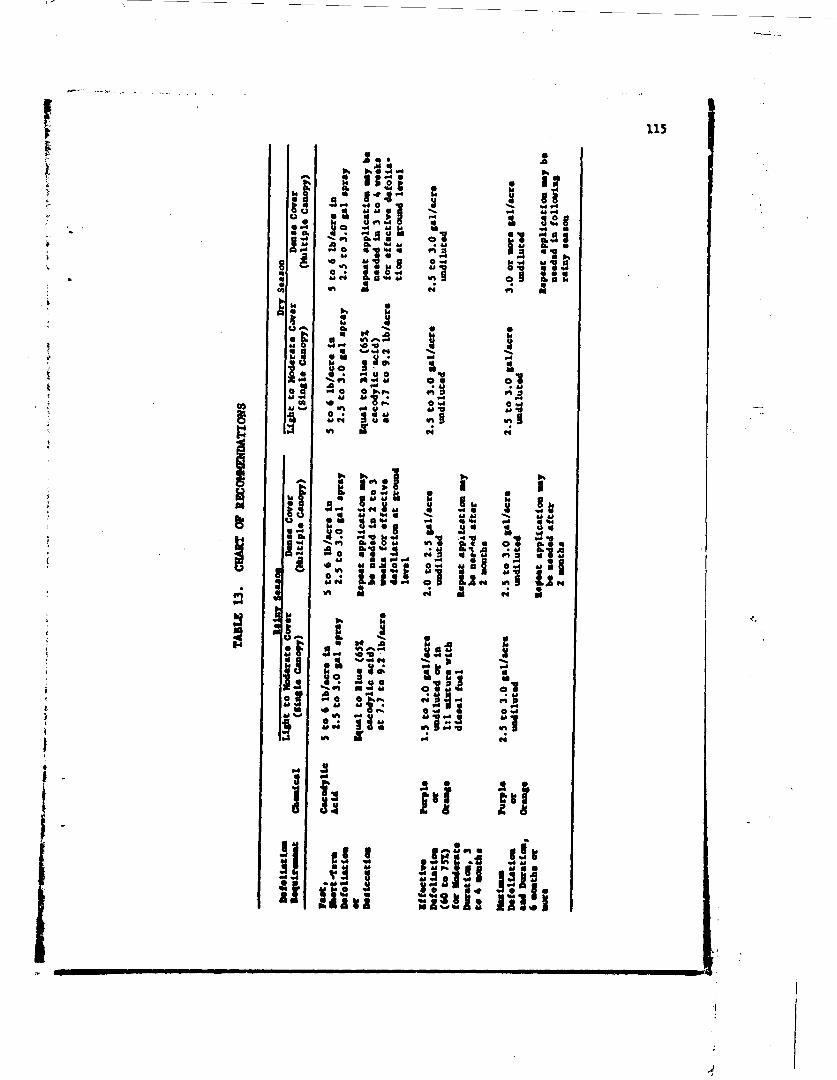
115
v0 44 a %.
.d 0 U0
ccd .0 :
I." 0
0
a~ tit jo

116
10) •iniwsa effective dosage of Pink appeared to be 1.0 to 1.25gnl/acre (8 to 10 lb/acre).
11) Diozxol, a commercial formulation containing low-volatile estersof 2,4-D and 2,4,5-T, gave slightly superior defoliation response thanPurple in limited trials. Additional comparative tests with Orange orPurple are needed to substantiate these results.
12) Cacodylic acid or sodium cacodylate applied in water solutionsat rates of 5 to 6 lb/acre gave effective desiccation and defoliation ofundisturbed forest and secondary forest and shrub vegetation. Maximu= defolia-tion occurred 2 to 4 weeks after application. Treatments were equally effec-tive during rainy and dry seasons.
13) Cacodylic acid applied at 6.0 lb/acre gave defoliation responseequivalent to Purple or Orange at 15 lb/acre acid equivalent.
14) Diquat was equivalent in defoliation response to cacodylic acidor sodium cacodylate but was effective only during the growing season. Ratesof 3 to 5 lb/acre were required for effective defoliation.
15) Dicamba gave minimal effective defoliation when applied at ratesup to 15 lb/acre. The chemical was inferior to Purple, Orange, and Pink forlong-term defoliation.
16) Limited tests showed that Tordon applied singly or in mixtureswith 2,4-D, diquat, and Orange was highly effective on a per-pound basisbut generally slower than Purple or Orange in defoliation response. Effec-tive defoliation was obtained with Tordon in mixtures at rates of 1 to 3lb/acre. Additional tests are needed to confirm these results.
17) Dry-season application of Tordon was marginally effective butshowed an increase in effect at the end of 5 months.
18) All effective desiccants and herbicides gave a higher degree anda longer duration of defoliation with increased rate of application.
19) Defoliation responses from Purple, Orange, and Pink were 4nflu-enced r re by rate of application than by the volume of spray solutionapplied. Comparative treatments of these chemicals at I gal/acre of purechemical with 2 gal/acre of a 1:1 mixture with diesel fuel showed no signifi-cant difference in defoliation response at the higher volume. The sameamount of Pink applied in 2 gal/acre vs. b gal/acre of spray solution gaveno difference in defoliation response.
20) Minimal volume of 1.5 gal/a&.re is recommanded for applicationsof Purple, Orange, and other oil-soluble herbicides to secure effectivespray coverage and penetration.
117
21) Va sr-soluble chemicals such as cacodylic acid or diquat requirea miniubz volums of 2.5 to 3.f' Sal/acre to achieve desired lowels of spraydeposit for effective coverage and penetration.
22) Optimum droplet sizes for rapid fallout and '-st penetration ofvegetation canopy were in the range of 275 to 350 microns WS for aerialspray application of Purple, Orange, and other defoliation chemicals.
23) Dry-season applications of Purple, Orange, and Pink at relativelyhigh rates (2.5 to 3.0 gal/acre) gave apparently effective defoliation inlight to moderate vegetation cover of secondary forest ar-' ihrub. Naturaldefoliation during the dry season contributed in varying ree to the highevaluation ratings obtained. Dry-seson applications were nerally noteffective in the dense forest type characterized by a mall -sount ofnatural seasonal defoliation.
24) Consistent differences in defoliation effectiveness were obtainedon the two test sites characterized by (i) denue, seml-evergreen fcrest witha wmltiple canopy, and (ii) secondary forest and shrub with a single canopy.The more effective ratings obtained on the secondary forest type wereattributed to the greater ease of spray penetration and to a higher propor-tion of plant species susceptible to chemdcal defoliation.
25) In dense forest vegetation with multiple canopy, the highestdegree of defoliation from effective chemicals occurred in the upper ordominant canopy. Ground cover and shrub layers shoved the least defoliation.
26) Complete defoliation of all vegetation components was notobtained with any of the chemicals tested in single applications. Maximumdefoliation was assessed at 85 to 90.
27) Marked differences in defoliation response to any chemicaltreatment occurred within the species composition of any layer of theforest vegetation. Some species defoliated completely; others shovedlittle or no effect.
28) The duration of muimum defoliation effectiveness was governedby several factors, chief of which were: (i) amount and rate of regrovthof treated vegetation following defoliation, and (ii) amount and growthrate of weedy plants, vines, and other replacement vegetation followingdefoliation.
29) To prolong the duration of effective defoliation and to securemore effective spray penetration and defoliation of dense forest type withmultiple canopy, repeat applications of Purple, Orange.-cacodylic acid orother effective chemicals way be used. Results of limited tests of repeatapplications in the current program will be evaluated in the final report.Suggested minimal intervals for repeat applications for increased effec-
•civeness and duration are: (i) 2 to 4 weeks after initial application of
t -
118
cacedyLic acid; sad (it) 2 moths after initial application of Purple,Orange, and ether gritb-regaulater herbicLdes.
30) Visual estimates of defoliation were closely comparable toquantitative measurements obtained by the canopy obocuratLon technique=playing vertical pbotographs.
31) Horizontal visibility measurements Save lower defoliationvalues than visual estimates or the vertical obscuration technique.Changes in horizontal visibility due to chemical treatment were dependentprimarily on the degree of defoliation sustained by the shrub vegetationlayer.
32) The results of the defoliation test program are generallyapplicable to the Republic of Viet Ham and adjoining areas of SoutheastAsia.
It is recoiended that additional field tests and studies on chemicaldefoliation be conducted in Thailand or similar tropical areas to et thefollowing objectives and requirenmnts:
1) Evaluation of Orange and cacodylic acid or sodium cacodylate inseveral vegetation types including tropical evergreen rain forest, hillevergreen forest, secondary forest and shrub with high densities of tropi-cal grasses such as elephant grass, cogon grass, and bamboo-dominated areas.
2) Evaluation of Pink, 7?ordon, and other herbicides in comparisonwith Orange and cacodylic acid in several vegetation types.
3) Evaluation of chemical mixtures including Orange and Tordonand other chemicals to secure enhancement of defoliation response and abroader spectrum of species subject to defoliation and topkill.
4) Evaluation of repeat treatments with Orange, cacodylic acid,and other chemicals to secure prolonged defoliation in vegetation typesor under conditions in which regromth occurs from single applications.
5) Evaluation of soil sterilants, herbicides, and desiccants forcomplete vegetation control of woody and grass vegetation in proximityto military encampments, boundary zones, transportation routes, etc.
6) Improvement of evaluation techniques including the developmentof a simpler system of horisontal visibility measurement than the "dot-count" method and in the refinement and simplification of the verticalphotography technique.
Such programs should be conducted in areas such as Thailand wherelogistic support and interdisciplinary scLentific cooperation my beobtained.

119
L1TUtAnUUR
1. Delamre, Fred J.; Hinarik, C.L. October 1962. Ca Hat Peninsuladefoliation operations September-October 1962 in Republic of SouthVietnam (U), (Sumary Report). U.S. Military Assistance Comand,Viet Nas. E3RET (62-FDS-2028).
2. Delmore, Fred J.; Shmw, W.C.; Kinarik, C.I.; Burcha., L.T.; Whittam, D.1962. Revien and evaluation of ALPA/OSD "defoliatioen" prosgrm inSouth Vietnam (U). U.S. Army CUK Agency, Idgsrood Arseal, Maryland.52 p. C0UFIDo7AL.
3. Preston, V.I.; Downing, C.I.; Bess, C.g. 1959. Defoliation -nd
desiccation, (Technical Report 16). Crops Division, U.S. ArmyChemical Corps Biological Laboratories, Frederick, "hyland.
4. Brain, J.V. 1959. Vegetation control, Camp Drum, (Suomi, Report).Crops Division, U.S. Army Biological Laboratories, Frederick, Maryland.10 p.
5. Brown, J.V. March 1962. Preliminary report of vegetational spraytests. Crops Division, U.S. Army Biological Laboratories, Frederick,Maryland.
6. Brown, Jos W. 1962. Vegetation spray information. Section Mt.p. 109-132. U Brown, Jams V. Vegetational spray tests in SouthVietnam, Supplement (U). Crops Division, U.S. Army BiblegicalLaboratories, Frederick, Maryland. SERET (62-FDS-834).
7. Brown, Jams W. 1962. Vegetational spray tests in South Vietnam.Crops Division, U.S. Army Biological Laboratories, Frederick,Maryland. 119 p.
8. Derrow, L.A. 1963. Test plan for first-year program of defoliantresearch 0CONUS. Crops Division, U.S. Army Biological Laboratories,Frederick, Maryland. 14 p.
9. Darrow, l.A. 1963. Research program on chemical defoliants andherbicides OCONUS (U). Crops Division, U.S. Army BiologicalLaboratories, Frederick, Maryland. 13 p. CONDEDTrAL.
10. Darrow, R.A. 1964. Revised test plan. OCONUS defoliant research
test program (U). Crops Division, U.S. Army Biological Laboratories,Frederick, Maryland. 12 p. CONFIDENTI.
11, quartermaster Research and Engineering Center, Nattick, Massachusetts.
1962. Notes on aom eavironental conditions affecting militarylogistics in Thailand, (Special Report 8-1). 41 p.

120
12. Amaricn tunatituto of Crop geology, Vahbingtou, D.C. 1957. Thephysical eavironmet, natural vegetation, farm crops, and fieldpractices of Thailand. 256 p.
13. loyal Forest Dopert t, M inLetry of Agriculture, Bangkok, Thailand. ,.1962. Types of forest of Thailand, (Report 44).
14. Forest Ierbaritum, Forest Products Research Division, Royal ForestDepertment, Bangkok, Thailand. 1965. Vegetation and ground coversof Thailand. Final report. (Contract DA-92-272-FEC-92) ProcurementOffice, IMC-Thailand, Bangkok, Thailand. 23 p.
15. Phas-Uoeng Ho and Uguyen-Van-Dulo-'ng. 1960. Cay-Co Mien Nan Viet-Nam.go Quoc-GLa Giao-Duc Xuat-lan, Mha Sach 1hai-Tri 62, Le-lq'k, Saigon.811 p.
16. U.S. Army Engineer Vaterways Enperiment Station, Corps of Engineers,Vicksburg, Mississippi. 1964. Envirosmental data collection manual.Part VIII. Visibility characteristics of vegetation. 27 p.
/

121
AIUDU A
CRDUHCALS USED IN TEST PRO1MA
A. HERBICIDES
1. Purple
a. Chemical Name
Mixture consisting of
501 _-bi :yl easter of 2,4-dichlorophenawyacetic acid30% 1-butyl ester of 2,4,5-trichlorophsancyacetic acid201 iso-butyl ester of 2,4,5-trichlorophanoyacstic acid.
b. Physical and Chemical Properties
Liquid, soluble in diesel fuel.
c. Active Ingredient Content
98 to 100% active ingredient as total ester.8.6 lb/gal acid equivalent.
d. Total Amount and Cost of Chemical
,6000 gal; $6.50/gal; $39,000 total cost.
2. Orange
a. Chemical Nam
Mixture consisting of
501 a-butyl ester of 2,4-dichlorophenazyacetic acid501 n-butyl ester of 2,p,5-trichlorophenayactic acid.
b. Physical and Chemical Properties
Liquid, soluble in diesel fuel.
c. Active Ingredient Content
981 to 1001 active ingredient as total ester.8.6 lb/gal acid equivalent.
/t
&
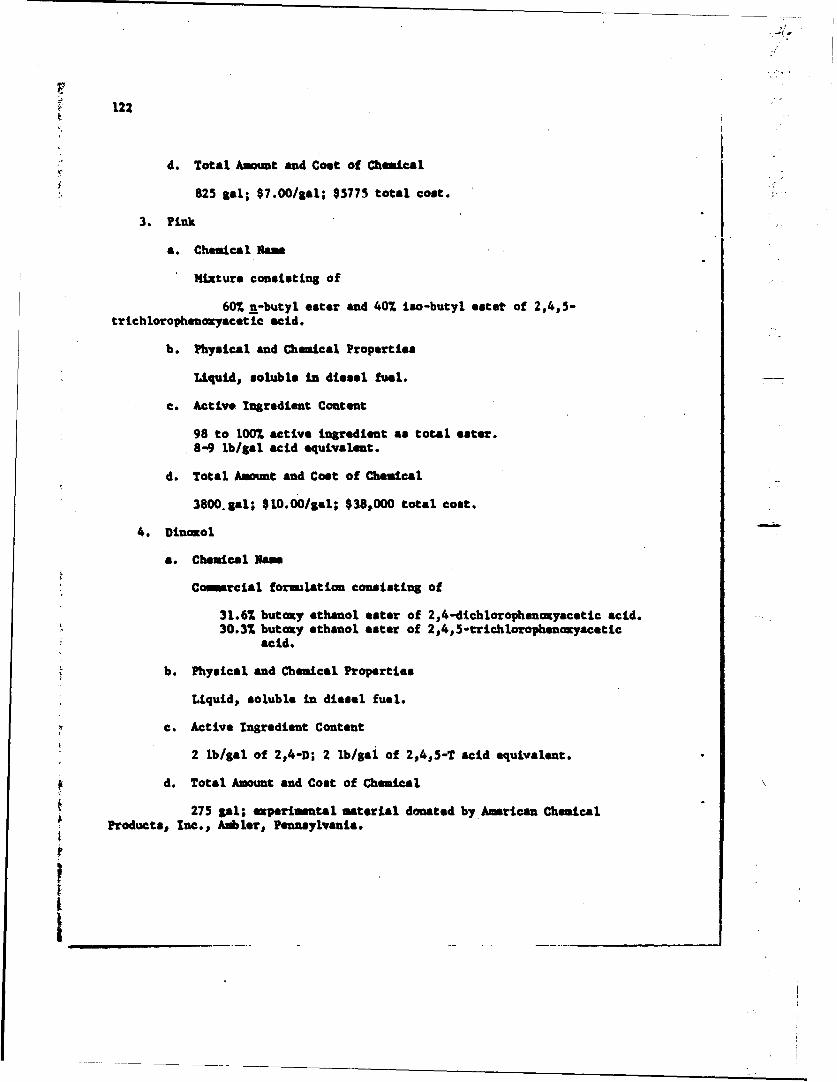
-1 -
122
d. Total Amount and Cost of Chemical
825 gal; $7.00/gal; $5775 total cost.
3. Pink
a. Chemical Hams
Mixture consisting of
60% a-butyl ester and 40% iso-butyl estet of 2,4,5-trichloropheonayacetic acid.
b. Physical and Chemical Properties
Liquid, soluble in diesel fuel.
c. Active Ingredient Content
98 to 100l active ingredient as total ester.8-9 lb/gal acid equivalent.
d. Total Amount and Cost of Chemical
3800.gal; $10.00/$al; $38,000 total cost.
4. Dinonol
a. Chemical Name
Comrcial formulation consisting of
31.61 butoty ethanol ester of 2,4-dichlorophenoxyacetic acid.30.3% butcy ethanol ester of 2p4,5-trichlorophencayacetic
acid.
b. Physical and Chemical Properties
Liquid, soluble in diesel fuel.
c. Active Ingredient Content
2 lb/gal of 2,4-D; 2 lb/gai of 2,4,5-T acid equivalent.
d. Total Amount and Cost of Chemical
275 gal; experimental material donated by American ChemicalProducts, Inc., Ambler, Pennsylvania.I ____________________________

123
3. icaba
a. Chemical IUNs
2-methazy-3,6-dichlorobrasoic acid (avaliable as pure acid anddimethylamsne salt).
b. Physical and Chemical Properties
Acid is a solid, soluble in butanol.Amine formulated as a liquid, soluble in water.
c. Active Ingredient Content
Acid--95 to 100% active ingredient.
Amine-6 lb/gal active ingredient.
d. Total Amout and Cost of Chemical
AcLd-2000 lb; $4.50/lb; $9000 total costAmine-240 gal; $27.50/gal; $6000 total cost
6. Tordon
a. Chemical Name
4-amino-3 5,6-trich loropicoliuic acid; pic loramFormulated as potassium salt and amine (experimental).
b. Physical and Chemical Properties
Potassium slt and amine formulated in liquid, miscible withwater.
c. Active IngredL'nt Content
2.0 lb/Sal as potassium salt (Tordon 22K).3.0 lb/gal in experimental amine forualation.
d. Total Amount and Cost of Chemical
Auine-40 gal; experimental material donated by Dow ChemicalCo., Midland, Michigan.
Potassium salt-55 Sal; experimental material donated by DowChemical Co., Midland, Michigan.
I,
I
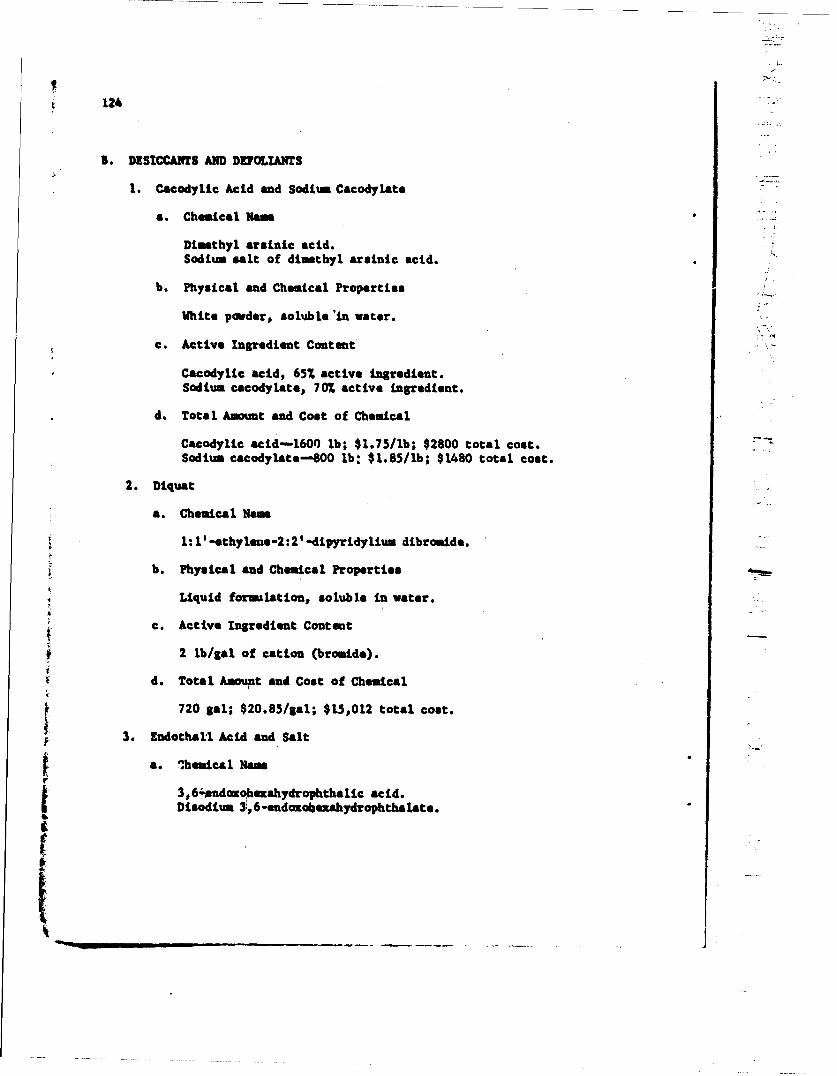
124
B. DESICCAMTS AND DEFOLLAMTS
1. Cacodylic Acid and Sodium Cacodylate
a. Chemical Nam
Dimethyl arsinic acid.Sodium salt of dimsthyl arsinic acid.
b. Physical and Chemical Properties
White powder, soluble 'in water.
c. Active Ingredient Content
Cacodylic acid, 65% active Ingredient.Sodium cacodylate, 70% active ingredient.
d. Total Amount and Cost of Chemical
Cacodylic acid-1600 lb; $1.75/lb; $2800 total cost.Sodium cacodylate-800 lb. $1.85/lb; $1480 total cost.
2. Diquat
a. Chemical Hame
1:1' -ethylene-2:2' -dipyridylium dibromide.
b. Physical and Chemical Properties
Liquid forulation, soluble in water.
c. Active Ingredient Content
2 lb/gal of cation (bromide).
d. Total Amount and Cost of Chemical
720 gal; $20.85/gal; $15,012 total cost.
3. Endothal'l Acid and Salt
a. '.hemical Nam
3,6'4andomohezahydrophthalic acid.Disodium 3 , 6-eudaolaexahydrophthalate.
__ _ _ _ _ _ _

125
b. Physical and Chemical Properties
Acid-solid, soluble in diaethylforeanide--vater emulsion.Salt-liquid, soluble in water.
c. Active Ingredient Content
Acid--100 active ingredient.Salt-1.8 lb/gal active ingredient.
d. Total Amount and Cost of Chemical
Acid-1123 lb; $3.60/Ib; $4050 total cost.Salt-300 Sal; $5.70/gal; $1710 total cost.
4. Marphos and Folex
a. Chemical Name
Tributyl phosphorotrithioita
b. Physical and Chemical Properties
Msrphos-liquid, oil-soluble formulation.Polex-liquid, miscible with water or diesel fuel.
c. Active Ingredient Content
Nerphos-7.2 lb/Sal active ingredient.Pole--6.0 lb/gal active ingredient.
4. Total Anount and Cost of Chemical
VIerpho--1375 Sal; $7.60/gal; $10,450 total cost.Pole--330 gal; $5.32/gal; $1920 total cost.
5. Amitrole
a. Chemical Nam
3-sino-l,2,4-triasole
b. Physical and Chacal Properties
Crystalline solid, soluble in water.
c. Active lagsediest Contest
80% active Ingredient.
I

126
d. Total Amount and Cost of Chemical
1200 lb; $2.65/lb; $3180 total cost.
6. Butyne Diol
a. Chemical Nam
2-butyne-l,4-diol
b. Physical and Chemical Properties
Solid, soluble in water.
c. Active Ingredient Content
95% active ingredient. -
d. Total Amount and Cost of Chemical
2760 lb; $0.60/lb; $1656 total cost.
7. TriLutyl Phosphate
a. Chemical Name
Tributyl phosphate.
b. Physical and Chemical Properties
Liquid, soluble in diesel fuel.
c. Active Ingredient Content C
8 lb/gal of active ingredient.
d. Total Amount and Cost of Chemical
4000 lb; $0.60/lb; $2400 total cost.
i
4 Im
_________

127
APPEND B
SPECICATICOS OF AEIAL SPRAY DISTREIBLTI SYSTEM
46. TAMK
A capacity of 180 gallons, box-shaped with rectangular sides, stainlesssteel; with internal baffle plates, lk-inch inlet at base of tank connectedthroýugh a line filter to quick-connect coupling on external fuselage, addi-tio•al 3-inch tank inlet at top of tank, and Vs-inch air vent and overflowtube with outlet at bottom of fuselage. Equipped with external sight gaugecalibrated in 5-gallon increments mounted on tank and liquidometer withgauge for indicating level in pilot compartment.
S. irAw
Air-driven, AGAVEZMO Model 6100 9 5, with five-bladed propeller,variable pitch blades, 2k-inch suction intake and 2-inch outlet connec-tions. Equipped with brake operated from pilot compartment for controlduring flight.
C. BOOM AND NXZZLZ ASSEMLY
Two 20-foot, aluminum, streamlined, Sorenson lk-inch booms mountedbelow wings forward of flaps. Tapped on trailing edge and bottom at 6-inch spacings for h-inch noszles. Rose connections Teflon-lined od2-inch pipes to tank, pump. and bypass.
D. NOZZLES
One-quarter-inch, brass, diaphragm jet (TUJET No. 4664), with disc-type orifice and core, fitted with 50- or 100-mesh strainers.
Z. CNTROLS
Control lever for boom system siunted at pilot compartment bulkhead.S Positive taree-way cutoff valve with suction pressure on boom L-2 off
position to prevent nosale drio. Pressure regulation by gate valve online from pump to boom, pressure gauge mounted on cockpit instrument panel.
i

128
F. BOOM AND NOZZLE CONFIGURATIONS USED IN TEST PROGRAM
1. 2 April to 12 May 1964
a. Boom
Twenty feet long, under wings only, mounted 10 to 16 inchesbelow lover wing surface, taps for nozzles on lover surface.
b. Nozzle Placement, Number, Spacing, Direction, and Orifice
Inboard, 16 to 20 at 6-inch spacing, 90 degrees, D7 and/orDio orifice.
2. 12 May to 15 June 1964
a. Boom
Wing booms connected into single boom, 32 feet long, withnozzle positions under fuselage, m.unted 23 inches below bottom of fuselageand lover wing surfaces, noele tap openings on upper surface to eliminatesediment accuoulation.
b. Nozzle Placement, Number, Spacing, Direction, and Orifice
(From center of fuselage to wing tip)
Under fuselage, five at 3-inch spacing, 45 degrees, D16 orifice.
Lateral to fuselage, four at 4-inch spacing, 45 degrees,D14 orifice.
Inboard, 12 or 13 at 6-inch spacing, 90 degrees. DIO orifice.
Outboard, two at 18-inch spacing, 90 degrees, D8 orifice.
Boom tip, one, 45 degrees, D6 orifice.
3. 15 June 1964 to 18 March 1965
a. loon
Same as 2, a.
b. Nosale Placement, Nuder, Spacing, Direction, and Orifice(From center of fuselage to wing tip)
Under fuselage, five at 3-inch spaCtings, 45 degrees, k-lnchorifice.
_____ i

129
,Lateral to fuselage, four at 4-inch spacing, 45 degrees,k-inch orifice.
Inboard, six at 6-inch spacing)90 degrees, k-inch orifice.
Outboard, one D1 0 crifice, two D8 orifice, one D6 orifice atsix-inch spacing, 90 degrees.
Boom tip, one, 45 degrees, D6 orifice.
4. 18 March to 4 June 1965
a. Boom
Same as 2, a.
b. Nousle Placement, Nuber, Spacing, Direction, and Orifice(From center of fuselage to win1 tip)
Under fuselage, three or four, at 3-inch spacing, 45 degrees,D16 orifice.
Lateral to fuselage, three or four at 4-inch spacing, 45degrees, D14 orifice.
Inboard, six at 12-inch spacing, 90 degrees, D10 orifice.
Outboard, three at 18-inch spacing, 90 degrees, Do orifice.
Outboard, one at 24-inch spacing, 90 degree, D6 orifice.
Boom tip, one, 45 degrees, D6 orifice.

131
APPENDIX C
DETERMINATION OF SPRAY DEPOSIT VOLUME, SWATH WIDTH, AND DROPLET SIZE
Characteristics of spray deposition including mass deposit, swath width,and percentage recovery of delivered spray volumes were obtained from gridcalibration flights accompanying each treatment. The wet-plate method wasused in calibrations; mass deposit values were obtained by colorimetricanalysis based on a dye added to the spray solution. Droplet size as massmedian diameter was obtained from Kromecote cards in matching series withthe wet-plate samples.
DuPont Oil Red dye was used in spray mixes with Purple and other oil-soluble chemicals. Rhodamine Blue and Acid Orange dyes were used in watersolutions of chemicals. Dye concentration was 0.1% by weight in the spraymixtures or 4 grams per gallon. DuPont Oil Red gave an absorbance peak of515 uillimicrons on the spactrophotomter.*
A. MASS DEPOSIT
Measurement of mess deposit at each sampling station on a grid lineinvolved the use of the wet-plate tachnique with 6- by 6-inch sampleplates of aluminum or stainless steel. Matching Kromecote card sampleswere mamined to determine the limits of swath deposit. The wet-platecolorimetric analysis was performed only on this series of stationsamples plus an etra one at each end.
Each wet plate and its protection cover plate were placed on a rackdesigned to permit simultaneous washing of the two plates and the collec-tion of washings in a single 25-ml volumetric flask. The solvents usedwere acetone for oil-soluble chemicals and water for water-soluble chemicals.The rinsings were brought up to uniform volume with additional solvent.
A calibration curve was prepared from duplicate samples of theoriginal spray mixture taken after the day's flight. The dilutionscheme for the calibration samples is shom in the diagram:
B eyer, L.W.; Brown,, J.W. 1964. Calibration of spray systems C-123/.-1,R-34/MAT., A-IH/FrDAL, (Technical Report 46). (Sponsored by AdvancedResearch Projects Agency, Project Agila, ARPA Order 256). CropsDivision, U.S. Army Biological Laboratories, Fort Detrick, Naryland.
S'4

132
ttnk sample, 1 tank sample, 25.0-ml. 5.0-mlaliquot aliquot
10.0 ml
2.5-mi aliquot + solvent
50.0-mlin volumetric flask
0.5 Ml 1.0 ml 1.5 ml 2.0 al
+ solvent + solvent + sotvent + solventI I I I25.0-al 25.0-ul 25.0-ml 25.0-ml
vol. flask vol. flask vol. flask vol. flask
A cuvette of the colorimeter was then filled from each of the four flasksand Uhe respective traismittances were measured. The readings viare plottedon a graph of percentage transmittance against gallons of spray volume peracre.
The standardisation of the Bausch and Lomb Model 20 spectrophotmeterused in these determinations was checked at intervals as a precautionagainst electrical drift due to surges in line voltage.
Following calibration of the colorimeter to the day's spray mix, thesamples from the grid deposit plates were transferred directly from thevolumetric flasks to cuvettes and tested twice for transmittance. Thedata for each series of samples were recorded on SHUFD Form 546 (Temp)(9 Apr 63). Each datum was then converted from percentage transmittanceto ostim-zed deposit in gallons per acre from the calibration curve andrecorded on SM1UFD Form 547 (Temp) (9 April 1963).
The wass deposit data were then plotted graphically on 9637D Form 634(Test) (Dec 63) and the points connected to form a contour curve depictingthe deposit pattern.
lI
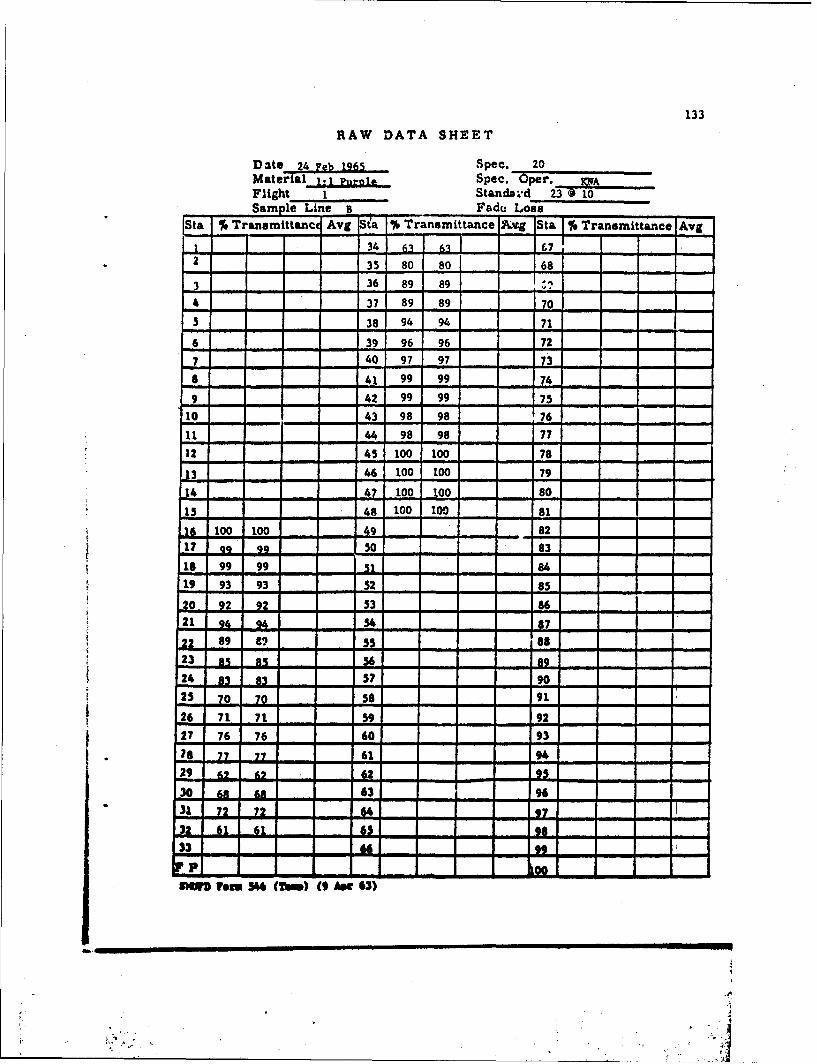
133
RAW DATA SHEET
Date 24 Feb 1965 Spec. 20Material It.rnip Spec. Oper.. IAFlight 1 Standar'd 23 0 10Sample Line B Fade Lose
ISta %Transmittance Avg %Sa- Transmittance &vig Sta f#V Transmittance Avg
- 34_ 64 3 __i 672 35 80 80 68 - -
3 36 89 89 ,___- l
4 37 89 89 70
5 38 94 94 71
6 39 96 96 72
7 40 97 97 73 - - -
8 41 99 99 74
9 42 99 99 75
10 43 98 98 76
11 44 98 98 77
12 45 100 100 78
46 100 100 79
* 14 47 100 100 80
15 48 100 100 81
1 to1100 0 49 82
17 ao 99 50 83
18 99 99 i1 8419 93 93 -2 8-
20 92 92 53 86
21 94, - aa 87
22 89 8' 55 68
23 a _ -)6 a a ... a
24 gL3 . a57 90
25 70 70 58 91
26 71 71 59 9227 76 76 60 93
_8 77 77 61 9429 62 A2 .62. aa
.) L .. .63 96
• 3• 72 72 96 , 7JL .L a .t - - - a.a 9a
33 '6 0*
p81WD vam 5M (2=7) (90 Ap 63)
r Al

134
MASS DEPOSIT
Material 1:1 Pur.le Airspeed lO KnotsDate 24 Feb 1965 Altitude 30 ft
Flight__i Swath WidthSample Line . Aircraft Course 120Time of Release 0643 Wind Vector O.0/SEDuration 7.0 Spec. 20Flow Rate 6R6 Pi iR g PT Spec. Oper. Kha
St GPA St GPA St GPA St GPA
I vter__k1 26 2.30 51 762 27 1.85 _2 _ , 77 ....3 28 2.20 53 78
4 29 1.75 54 79
is ...... 30 3.20 5 , 80s-6 3.1 2.60 56 .... I-7 32 2.20 57 828 33 3.30 58 ___ -3
9 34 3.20 59 84
10 35 1.50 _085 _ _
11 36 0.80 61 8612_ 37 0.80 62" 87
13 ,,,_ 38 0.42 63
-1 39 0.30 64 s _
15 . zo 63 90
16 0.00 41 0.08 66 .L17 0.08 42 0.08 67
is.... 0.08 43 0.15 68 93
19 0..50 44 0.1'5 69 9420 0.55 45 0.00 70 o_21 0.42 46 0.0 71 96
22 0.80 47 72 97
2 l2.10 48 - 1 7-2.4 1. 25 49 74 ,9
25 2.40 50 75
Total Deposits 25.26
Pornt Reoverwy 25.26 x 2.•3 85.4%68
8MUVD F OM "4? (Teap)(I Apr11 iNs)

135
0.0
1w)
In;
In Inii
... .. ...oed..
mt o

136
B. SWATH WIDTH
Swath width was determivro./ most accurately from direct inwind releacesunder inversion conditions with the aircraft cruising the grid samplingline at right angles. In the initial phases of the test program in whichseparate wing booms were employed, the deposit patterns were expressed asa bimodal curve. After modification of the boom system to provide under-fuselage nozzles, triangular or trapezoidal deposit patterns were obtained.Spray applications from a height of 35 feet resulted in a swath width ofapproximately 100 feat.
The graphs of mass deposit (SMUFD Form 634-Dec 63) were used to deter-mine swath width at any desired deposit level.
C. PERCENTAGE RECOVERY
Percentage recovery represents the relationship between the amount ofspray material released from the aircraft and the amount actually depositedon the ground at the sample line less the amount 1set due to drift andevaporation.
The following information was required for determination of percentagerecovery:
a) Total deposit in gallons per acre on all sampling stationsb) Interval or distance in feet between sampling stationsc) Air speed in statute miles per hourd) Flow rate in gallons per minutea) Constant, 0.202, representing the portion of an acre covered in
1 minute at 1 mph for a swath width of 1 ft.
Percentage recovery was calculated by the following equation:
Percentage recovery - (0.202) (Total deposit) (Interval) (Speed)(Flow rate)
For each treatment a summtion report was prepared based on all gridflights for a given treatment. This report included calculations of thefollowing:
a) Average percentage recovery of all grid flightsb) Gallons per acre delivered from the plane systemc) Gallons per acre deposited on a 300-ft swath based on delivered
volume x average percentage recoveryd) Gallons per acre deposited on a 300-ft swath based on average mass
deposit volumes of a 150-ft swath less the average depositvolumes of the swath etremities (tails) outside the 300-ft swath

137
e) Percentage recovery of the 300-ft swath widthf) Percentage lose outside of the 300-ft swathg) Total percentage recoveryh) Pounds per acre of acid equivalent or active ingredient.
SUMMATION REPORT
DATEMATERTALTREATMENT NO.PLOT 1PLOT 2
Calculati:ons
SUBJECT1. Average % Recovery
Sum of Total % RecoveriesNo. of Recoveries
2. CPA Delivered from PlaneFlow Rate in CPA23 Acres/Minute
3. Calculated CPA for 300-ft SwathCPA from Plane x Average % Recovery
4. CPA Calculated from 300-ft Swath3(Averime Total Deposit of 150-ft Swath) - Sum of Averame Two Tails
30
5. % Racovery Calculated from 300-ft SwathCPA of Swath Path
Calculated CPA of Plane
6. % Lost outeile 300-ft SwathSum of Average Two Tails + Sum of Average SwathSum of Average Two Tails
7. Total Recovery% Lost outside Swath + Recovery from 300-ft Swath
"* 8. Acid Equivalent Per AcreGPA x Acid Equiv. AZQPA
Ai -________________

138
D. MASS MEDIAN DIAMETER OF SPRAY DROPLETS
The droplet characteristics of the chemical mixtures u~sed in the testprogram were determined by the maximum diameter (D-max.) nethod developedby Maksymiuk of the U.S. Forest Service Forest Insect Latoratory atBeltsville.* This method provides rapid and fairly accurate estimationof mass median diameter (NMD) from measurements of the largest drops inthe complete droplet spectrum. Droplet diameters to the nearest 100microns were made of the largest droplets impinged on the Kromecote cardsused in the 3rid calibration flights. Diameter of the largest droplet ina series of -0 to 15 observations was used as spot D-max.
The spherical drop D-,ax. was obtaiied by dividing the spot D-max.by a calculated spread factor. The spread factor is a constant thatrelates the final spot size on the Kromecote card with the size of theoriginal droplet:
Spherical Drop D-max. - Spot D-max.Spread Factor
Spread Factor - Final Spot DiameterSpherical Drop Diameter
The spread factors for the oil-soluble materials ranged from 5.608 to6.441, and for water-soluble chemicals from 1.70 to 3.00.**,***
.Estimated mass median diameters were obtained from spherical dropD-max. using a conversion factor derived empirically by Maksymiuk basedon the aircraft speed. The conversion factor varies from 2.2 for slowspeeds (80 mph or more) to 2.5 for high-speed delivery systems (150 to180 mph). The following formulas were used to determine mass mediandiameter:
Estimated MM - Spherical Drop D-max.Conversion Factor
Estimted M0 = Spot D-max.-IEstimated Conversion Factor
* Brown, J.W.; Whittam, D. July 1962. Modification and calibration ofdefoliation equipment (C-123 First Modification) (A joint report bypersonnel of U.S. Department of Agriculture, U.S. Air Force, and U.S.Army Chemical Corps of work performed under OSD/ARPA Order 256, Amend-ment 4) Crops Division, U.S. Army Biological Laboratories, Fort Detrick,Maryland.
*, Wolf, W.R. 1962. Report to Crops Division on spread factor calibrationstudies of Eglin A.F.B. test agent samples and OCONUS agent samples.Physical Sciences Division, U.S. Army Biological Laboratories, Frederick,Maryland.
*** Wolf, W.R. 1964. Spread factor calibration study of oil-solubledefoliants, fuel oil and water-soluble defoliants on Kromecote cards,(Unpublished Report). Physical Sciences Division, U.S. Army Biological
$ Laboratories, Fort Detrick, Maryland. 154 p.

139
"APPEINDX D
DI-7LWhT DATA FC73
Treatment No. VU Date /Tlr,
Naze Volme (G&a/Acre)
Plot Num'bers 0t~~~' (S,_ ____-__6
Tankc Readings (in gallons)
Initial gal. in tank /gO Final In-flight reading .Initial ground readin Fir n
Initial in-flight, reading MAfter pressuwe regulationjA_ AM nt ramoved from teak
Plot Application Diaow
na o u No. , Plot No.
; IA I I I 4
: t3 lt IZ!I : I :I : I
end Plot Application Data
,,,m 06,/162C otas IO&R- c't9 06.31 o 0
Speed (knots) /00 iVO V*o /o0 / et W /0i WI
PSI $2s~ it .. ... L.U. L L
Duration (me.) -o. . 71 8.s ILI f.s 74
Gause reading 1$90 7.1Z RIP
--- - -W S-.
Rtenarkas

141
APPI•MIX E
DESCRIPTION AND OPERATION OF OBSCURIMT USEDIN VERTICAL PHOTOGRAPHY EVALUATION
An obscurtmeter or compositing densitometer vas designed by Dr. G.B.Truchelut of the U.S. Army Biological Laboratories for quantitativemeasurements of canopy obscuration on negatives obtained in the verticalphotography technique. The instrument is shown in Figure 1.
Ft~we 1. The Obomeinatef as PoettLamed feorUyelusetuS 35 smWesatiwes Of Vertical lbetogralhs of the UPP.w come"7.
0!
S.

142
A. BASIC PRINCIPLE
Fundamentally, the instrument consists of a light source with reflector,condensing lenses, and heat-absorbing glass such that a uniform beam ofparallel light rays approximately one inch in diameter is produced. Thisbeam to passed through the photographic image of the plot canopy beingmeasured; the transmitted light then impinges on a selenium photocell toproduce a current that is proportional to the ratio of light and dark areason the film. The current is measured by a milliameter.
B. DESCRIPTION
The light source consists of a 100-watt 115-volt projection lamp wiredin series with a cylindrical wire-wound rheostat that can be adjusted toregulate the light output. This adjustment is used in compensating forvariations in light absorption of the film base and emulsion due to storageor processing. The light beam is collimated by means of a spherical reflec-tor behind the lamp in conjunction with condenser lenses between the lampand the film. A glass heat (Izfrared) absorber is placed between the twohalves of the condenser system to protect the film from damage by thesewavelengths.
The film carrier or guide consists of a two-piece metal plate containinga carefully machined slot to hold the film strip in correct alignment withthe light beam and the photocell, and with a small clearance between emul-sion side of the film and the plate so that the image is not scratched ordamaged. Near one end of the plate a plastic film support is mounted onthe lamp housing. At the other end of the film guide is a sprocket-drivewheal that ames the film the required distance for the examination ofsuccessive frams, and this is followed by a second plastic film support.
The light-measuring device, a selenium photocell, is mounted in thefilm guide plate Imediately behind the film. Extraneous light not passingthrough the desired film area is controlled by means of two diaphram plateseach containing a circular aperture qf 22-rn diameter, which is equal tothe diameter of the circular area to be measured on each photograph.
The photocell is mounted on a sliding panel arrangement so that it canbe pulled out of the light path for visual inspection of the film framebeing measured.
Final link in the measurement chain is the milliaineter that measuresthe current output of the photocell. This is calibrated from 0 to 100 inintervals of two. It is read as percentage trensmittance.

143
One additional electrical circuit was installed as a modification.This produces a "bucking" current, or dark current, *which permits adjust-ing the meter to read zero when a zero-tranmittance reference frame isplaced in position. This circuit consists of a second photocell placednear the light source and through a rheostat connected in reverse to themilliarneter. This circuit is needed because all zero tranmLittanceframs (open sky) cannot be made black enough to provide actual zerotransmittance without running into film overexposure troubles. There-fore, the dark current circuit provides a means of zeroing the instrumenton the black sky frame, and at the same time compensating for small varia-tions in sky image density from one film strip to another.
A power supply voltage regulator is used in conjunction with theobscurimeter to eliminate variations in light output due to line voltagefluctuations.
C. CALIBRATION
Prior to its use in experimental evaluations, the instrument wascalibrated against a film strip made from a series of charts. Thesecharts consisted of segamnted circles corresponding to the circularfield used in each canopy photograph. The circle areas were dividedradially into various ratios of black and white sagments in 101 incrementsfrom 01 black (all white) to 1001 black. In addition, some charts weremade with the sam area ratios but with different patterns. Followingmasurements of transmittance of the film strip ,of the circular charts,a calibration curve was drawn and used in the evaluation of all plotfilm strips.
D. OPEATION
The procedure in using the instrument to measure obscuration is fairlysimple. The film strip is inserted in the fils-carrier slot from the leftend with the emulsion side toward the operator and moved through farenough for the perforations of the film to engage the film-drive sprockets.The film-drive sprocket wheel is then adjusted so that the first from tobe measured is exactly centered in the aperture, which can be done vis~llywith the photocell moved out of the way.
After adjustment of the drive sprocket, the film is turned to theblank from and the l circuit rheostat is adjusted so that the meterreads 1001 transmittance. The film is then moved to the adjacent black-sky frame and the "dark current" is adjusted with potamti -ter so thatthe meter reads zero. The frames containing the canopy silhouettes areread in succession without changing the adjustmet settings. The valuesof transmittance are recorded.
* . *- 1* *

145
APPMIDIX 7
PURSOUNE
U.S. Army Biological Center, Fort Detrick, Maryland
Dr. Robert A. Darrow, Project LeaderDr. George B. Truchelut, Assistant Project LeaderDr. Edward L. RobinsonDr. Steve S. SzaboRobert 1. King
1/Lt Charles N. Bartlettl/Lt Robert NcK. Birdl/Lt Charles 1. Quibelll/Lt Loyd J. Waxl/Lt Terry 3. Weymouth
Sp-5 James S. MorrisonSp-4 Paul T. BertrandSp- 4 Walter 3. HartSp-4 Frank S. rerdySp-4 Glenn 3. TrumblePIC Robert I. DeckerPFC Arnold C. IungerfordPFC Wesley D. Pippen
Physical Defense Branch
17C Errol K. Browns
Mathegatics & Comnuter Deart
Sp-5 Robert T. Mcenight
Physical Science Desartlsnt
Mr. George W. Traut, Jr.Sp-4 Richard-A. Demyan
Technical Inmineering Division
Sp-4 Richard V. Riffel
Technical Information Desaotoc. oruhic Arts Section
IW. Paul V. Riley

146
AtPA R&D Field Unit - Thailand
Enviro nmenta I Research
Lt. Colonel V.R. Scheible, USAF, Program bMsnagerCaptain John U. Kelley, Jr.# USA, Project OfficerMr. Amnuay Kaosingha, ForesterMr. Chamlong Pengklai, Research Assistant Royal Forestry Department
Air America. Inc.
Mr. John D. Hetoes, Pilot
-Vt

secnt cassfiato" DOCUMENT CONTROL DATA - R&D(ft-mye twoo.ffleshion of wele. boot of .bstm.f 4.d mdoftdeag -- I~~ton- most b. onte.,d eadva = *--of.dt o t omte ,Ms..*t.d)
I ORIGfINATING ACTIVITY (tCane..t. mthor) 20 *"POOS 99CURITY C LACS~rICAION4
U.S. Army Biological. Center UcasfeFort Detrick, Frederick, Maryland, 21701
OCONUS Defoliation Teat Program
4. 06SCRIPTIVe No~ts (7ppM .9 rope"t OW dflChae.1 daes.)
S AUTNORMS (Loot MIM. NMI noena. IRMtOt)
Darrow, Robert A. Bartlett, Charles M.Truchelut, George B.
6. REPORT DATE I& TOTAL NO. OFPA06911 76. Ies ofu, Rp
July 1966 149 19III. CONTRACT *ON enaN? NO. So, OPHOINATOWS RE1POPT MuUseNwsj
4, omajee me. ARPA Order 423 Technical Report 79
6. IT" T~Pont Ne(S) (Ardenmo "aempbooooffde
14s. A VA IL AGILITY /LIMTA roos no~icas Repoductio of this publication in whole or part isprohibited except with permission of the Director of Technical Information, AdvancedResearch Projects Agency, Washington, D.C., 20301. However, DUO is authorized toreproduce the publication for U.S. Government purposes.1-1. SUPPI.EMENTARY NOTES SPONSORING MILITARY ACTIVITY
Advanced Research Projects Agency
U. AmRACTWashington, D.C., 20301
A test program was conducted in Thailand in 1964 and 1965 to determine theeffectiveness of aerial application. of Purple, orange, and other candidate chemicalagents In defoliation of uplaed jungle vegetation representative of Southeast Asiaan duplicate 10-acre plots. Aerial spray treatments were applied at rates of 0.5to 3.0 gallons per acre on two test sites representing tropical dry evergreenforest and secondary forest and shrub vegetation. Applications were repeated inalternate 2- to 3-month periods to determine minimal effective rates and properseason of application.
Defoliation effectiveness was evaluated by (i) visual estimates of over-,ali vegetation and individual species defoliation, (ii) measuresients of changesin canopy obscuration by a vertical photography technique, and (111) waeurenUtsof changes in horizontal visibility of a human-sized target at various ranges.
Data provided by these techniques were used In comparative evaluation ofdefoliant chemicals in relation to rate, volume, season of application, canopypenetration, and vegetation response.
DD IPA"ffd 1473 Uncassfied5ueudt Closefficeodo


![Copia de TESIS CREATIVIDADCORREGIDAff iiiiiiiii[1].doc](https://img.pdfslide.net/doc/110x75/5695d33b1a28ab9b029d3c25/copia-de-tesis-creatividadcorregidaff-iiiiiiiii1doc.jpg)