Embed Size (px)
Citation preview
Client Date
Nordic Oron Ore AB 2014-01-25
Project GeoVista Nr
Blötberget - Mineral resource estimate GVR14002
Author Client ID
Thomas Lindholm, M.Sc., FAusIMM
Emma Bäckström, Michael Setter (Nordic Iron Ore AB)
GeoVista AB - - GVR14002
Technical report:
Blötberget - Mineral resource estimate
January 2014

- GeoVista AB -- GVR14002 -
- GeoVista AB -- GVR14002 -
Table of contents 1 Summary ..................................................................................................................... 1
1.1 Property description ......................................................................................................... 1 1.2 Location ............................................................................................................................ 1 1.3 Ownership ........................................................................................................................ 1 1.4 Geology and Mineralization ............................................................................................. 1 1.5 Exploration and Data Compilation ................................................................................... 1 1.6 Mineral Resource Estimate .............................................................................................. 2 1.7 Exploration potential ........................................................................................................ 2 1.8 Conclusions and Recommendations ................................................................................ 2
2 Introduction ................................................................................................................ 2 2.1 Terms of reference ........................................................................................................... 3 2.2 Purpose of the report ....................................................................................................... 3
3 Source of information and reliance on other experts .................................................... 3 3.1 Data gathering and site visit ............................................................................................. 3 3.2 Disclaimer ......................................................................................................................... 4
4 Property description and location ................................................................................ 4
5 Accessibility, climate, local resources, infrastructure and physiography ........................ 6 5.1 Accessibility ...................................................................................................................... 6 5.2 Climate.............................................................................................................................. 7 5.3 Local resources ................................................................................................................. 7 5.4 Infrastructure ................................................................................................................... 7 5.5 Physiography .................................................................................................................... 7
6 History ........................................................................................................................ 7 6.1 Previous mapping ............................................................................................................. 8 6.2 Previous geophysical surveys ........................................................................................... 8
6.2.1 Airborne geophysical surveys .................................................................................. 8 6.2.2 Ground geophysical surveys .................................................................................... 8
6.3 Previous diamond drilling ................................................................................................. 8 6.3.1 Historical deviation measurements ......................................................................... 9
6.4 Previous metallurgical work ............................................................................................. 9 6.5 Historical resource estimates (non JORC compliant) ....................................................... 9
7 Geological setting and mineralization ........................................................................... 9
8 Exploration ................................................................................................................ 18 8.1 Historical exploration ..................................................................................................... 18 8.2 Exploration ..................................................................................................................... 19
9 Sample handling, analyses and security ...................................................................... 19 9.1 Core handling ................................................................................................................. 19 9.2 Sampling and analysis .................................................................................................... 20 9.3 Quality Assurance and Quality Control Procedure......................................................... 21 9.4 Bulk Density Determination ........................................................................................... 24 9.5 Magnetic Susceptibility and Satmagan Measurements ................................................. 25
9.5.1 Magnetic Susceptibility .......................................................................................... 25 9.5.2 Satmagan ............................................................................................................... 25
10 Database ................................................................................................................... 26
- GeoVista AB -- GVR14002 -
10.1 Exploration database ...................................................................................................... 26
11 Mineral resource estimate ......................................................................................... 27 11.1 Basic statistics ................................................................................................................. 27 11.2 Raw assay intervals......................................................................................................... 28 11.3 Top cutting ..................................................................................................................... 28 11.4 Compositing .................................................................................................................... 29 11.5 Grade interpolation method .......................................................................................... 29 11.6 Estimation parameters and search distances ................................................................ 30 11.7 Block model .................................................................................................................... 30 11.8 Block model validation ................................................................................................... 31 11.9 Mineral resource classification....................................................................................... 34
11.9.1 Measured Mineral Resources ................................................................................ 34 11.9.2 Indicated Mineral Resources ................................................................................. 34 11.9.3 Inferred Mineral Resources ................................................................................... 34
11.10 Mineral resource estimate .................................................................................... 37 11.11 Mineral resource discussion .................................................................................. 37
12 Mineral reserve estimates ......................................................................................... 38
13 Adjacent properties ................................................................................................... 38
14 Other relevant data and information ......................................................................... 38
15 Conclusions ............................................................................................................... 38
16 Recommendations ..................................................................................................... 39
17 References ................................................................................................................ 39
18 Certificate of qualified person .................................................................................... 40
List of figures Figure 1: Property location showing exploitation concessions in red. ......................................... 5 Figure 2: Property location showing exploration permits (green) and exploitation concessions (orange) (Source: SGU January 2014). .......................................................................................... 6 Figure 3: Geological map of part of Western Bergslagen with the apatite iron ore districts marked with blue dots. The frame shows location of the geological map of the Grängesberg Mining District. From Stephens et al (2007). .............................................................................. 10 Figure 4: Overview of Blötberget area, interpreted mineralisations as colour shadings under topographic map. ........................................................................................................................ 11 Figure 5: Vertical cross section, Hugget and Sandell. ................................................................. 12 Figure 6: Vertical cross section, Flygruvan and Kalvgruvan. ....................................................... 13 Figure 7: Example of mineralised (magnetite) drill core from Blötberget (BB12008). ............... 14 Figure 8: Local geological Map 1:50 000 (Source: SGU January, 2014). ..................................... 15 Figure 9: Regional bedrock geology Map 1:250 000 (Source: SGU January, 2014). ................... 16 Figure 10: Geological long-section of the Blötberget deposit, showing Flygruvan, Kalgruvan and Hugget as one continuous unit (Source: NIO 2013). ................................................................... 17 Figure 11: Total magnetic field. ................................................................................................... 18 Figure 12: Core storage facility, Grängesberg. ............................................................................ 20 Figure 13: QAQC Duplicate analyses for 2012-2013 drilling. ...................................................... 22 Figure 14: QAQC Blank analyses for 2012-2013 drilling. ............................................................. 23 Figure 15: QAQC Standard GIOP-94 analyses for 2012-2013 drilling. ........................................ 23
- GeoVista AB -- GVR14002 -
Figure 16: QAQC Standard GIOP-120 analyses for 2012-2013 drilling. ...................................... 24 Figure 17: QAQC Standard GIOP-48 analyses for 2012-2013 drilling. ........................................ 24 Figure 18: Density versus Fe [%] for Blötberget. ......................................................................... 25 Figure 19; FeTotal versus FeMag as determined with Satmagan for Blötberget. ............................ 26 Figure 20: Histograms for raw assays compared to composites for Fe, Hugget......................... 29 Figure 21: Variogram for Hugget. ................................................................................................ 30 Figure 22: SWATH plot for Hugget, comparing the average Fe grades for composites and blocks respectively in 50m bands towards depth. ................................................................................. 31 Figure 23: SWATH plot for Hugget, comparing the average Fe grades for composites and blocks respectively in 50m bands towards the east. ............................................................................. 32 Figure 24: SWATH plot for Hugget, comparing the average Fe grades for composites and blocks respectively in 50m bands towards the north. ........................................................................... 33 Figure 25: Decile plot comparing Fe in composites versus blocks for Hugget. ........................... 33 Figure 26: Blötberget block model classification. ....................................................................... 34
List of tables Table 1: Contents of exploration database. ................................................................................ 27 Table 2: Raw assay statistics for Blötberget. ............................................................................... 27 Table 3: Search parameters for block model interpolation. ....................................................... 30 Table 4: Basic assumptions for cut-off calculations. ................................................................... 37 Table 5: Mineral resources for Blötberget, effective on January 25, 2014. ................................ 37
- GeoVista AB - - GVR 14002-
1
1 Summary At the request of Nordic Iron Ore AB (NIO), Sweden, GeoVista AB has carried out a JORC compliant resource estimation for the Blötberget iron-ore deposit in the municipality of Ludvika, central Sweden.
The scope of work includes a review of the geology, mineralization model and exploration programs. Drillhole data compilation and quality assurance/quality control (QA/QC) protocols which form the foundation for the resource estimate were also reviewed in detail.
1.1 Property description The iron ore deposits of Blötberget; Hugget, Flygruvan, Kalvgruvan and Sandell, lies within an area of approximately 1 by 1 km in size, all within an exploration license held directly by NIO. The company has lodged an application for a mining concession, presently being duly processed by the authorities.
1.2 Location The Blötberget village is located south of Ludvika, in the Bergslagen region of Central Sweden.
1.3 Ownership The Blötberget deposits are fully located within NIO’s granted exploitation concession (mining consession) Blötberget K nr 1, covering an area of 126.43 ha. The concession was granted on August 30, 2011, and is valid for a period of 25 years. The immediate area surrounding the concession is protected by the Exploration permits Blötberget Nr 1, 2 & 3, covering a total of 1020 ha.
1.4 Geology and Mineralization The deposits are hosted by the Svecofennian, 1.91–1.89 Ga felsic metavolcanic rocks and generally form lens-shaped bodies.
The majority of the mineralisations of Ludvika are classified as magnetite lava flows. The flows are occasionally of pure magnetite, with additional detrital magnetite units assumed to be volcaniclastic sediments. The volcanic units are unconformably deposited on older quartzitic greywacke units. The greywacke units show contact metamorphism in the form of silimanite and cordierite porphyroblasts. The mineralised units are overlain by quartz-feldspar sandstone with intercalations of volcaniclastic and argillaceous sediments. The whole package is unconformably overlain by a granitic unit.
1.5 Exploration and Data Compilation Mine maps and historical drilling data was collected from various sources and digitised where possible. Drill core from historical exploration drilling has been recovered at the core storage facility at the Geological Society of Sweden (SGU) in Malå, along with additional core found in buildings on the former mine sites. In total, 13 drillholes from Blötberget found in Malå were re-logged, and a selection re-sampled and re-assayed prior to use in the mineral resource estimates. All historical holes digitised either have locations and surveys in mine maps, or in supplementary documentation. Historical holes longer than 150 - 200 m were surveyed down-hole on a regular
- GeoVista AB - - GVR 14002-
2
basis, some of these records have been located and entered into the databases, and some have been reconstructed from trace plots of the respective holes, whilst others are absent entirely.
The drilling completed by NIO to date includes twinned drilling to confirm historical results as well as infill and step out at Blötberget. To date NIO have completed 15 holes (+one extension) for 7,430 m at Blötberget.
1.6 Mineral Resource Estimate The mineral resource model has been prepared to a high industry standard. The mineralization was modelled in three dimensions and statistical analysis was carried out. The resource has been categorised following the definitions and guidelines of the JORC code.
The mineral resources for the four mineralized iron ore lenses at Blötberget are summarized to 10.7 Mton with 34.3% Fe in the Measured category and 27.4 Mton with 44.8% Fe in the Indicated category. In addition, there are 21.7 Mton with 33% Fe in the Inferred category. The resources are current on January 25, 2014.
1.7 Exploration potential The general exploration potential in the Blötberget area is considered to be good, in particular by following the deposits downdip and by exploring the area in between the Flygruvan and Hugget deposits, where indications are that they are connected.
Further potential lies in the evaluation of other deposits along strike towards the northeast.
1.8 Conclusions and Recommendations To support the target of the Feasibility Study, further drilling is needed to increase the mineral resources in the measured and indicated categories. The exploration potential in the area between the two mines, as well as the possibilities of converting the inferred resources located in the intermediate depth of Hugget is considered to be such that a relatively limited drilling program, for a total of approximately 6000m, will be sufficient to reach that amount.
The deposits are still considered to be open at depth. There are no barren holes in the downdip direction that would indicate their ending. It is, however, not recommended to spend funds in investigating these deeper parts in the current phase of project development, since mining of any tonnage there is not likely to be done in the short time span. However, the wedge shaped area in between the Flygruvan/Kalvgruvan and Hugget/Betsta mines is considered likely to be mineralized based on geological interpretation. A drill program to investigate that part of Blötberget is therefore recommended. Additional tonnage, if confirmed in this part, would be very likely to improve the project economy due to more efficient mining, in addition to being accessible for mining earlier on in the mine plan.
2 Introduction At the request of Nordic Iron Ore, NIO, GeoVista AB has carried out a JORC compliant resource estimation for NIO’s iron-ore deposits in Blötberget in the municipality of Ludvika in the Central Sweden Bergslagen district.
- GeoVista AB - - GVR 14002-
3
2.1 Terms of reference The authors’ scope of work involved a detailed technical review of the resource estimate for compliance with the JORC code, and includes a review of the geology, mineralization model and exploration programs, including data compilation and quality assurance/quality control (QA/QC) protocols, which form the basis for the resource estimate.
2.2 Purpose of the report The purpose of this report is to present an independent and compliant estimate of the mineral resources for the Blötberget iron-ore deposits and to advance the feasibility of the project. The report also includes a review of the reliability and quality of sampling data upon which the estimate is based, as well as recommendations for further development of the project.
The authors’ report serves as an independent report prepared by a Competent Person as defined in the JORC code, 2012 edition.
The definitions of the measured, indicated and inferred resources, as used by the author, conform to the definitions and guidelines of the JORC code.
By reason of his education, past relevant experience and affiliation as a Fellow of the Australasian Institute of Mining and Metallurgy (AusIMM), Mr. Thomas Lindholm, fulfills the requirements of a Competent Person for conducting this work.
3 Source of information and reliance on other experts The principal source of information used to prepare this report has been historical, filed reports, maps and assays from the archive of Stora Kopparbergs Bergslags AB.
Additionally, a considerable amount of historical drill core, found in the the National Core Repository of the Geological Survey as well as in the Mill building at the Håksberg mine, have been re-logged and re-assayed by NIO.
Lastly, a series of 15 modern drill holes have been sunk by NIO in order to confirm as well at to expand the known mineralisations.
3.1 Data gathering and site visit This Technical Report is based on information collected by the author during a number of visits to the NIO office in Ludvika as well as to the site, between 2011 and 2013, the latest during November 20th - 22nd, 2013.
The site visits have been conducted together with NIO staff. During these the site of Blötberget has been visited severeal times.
No independent samples were taken during the site visit.
In summary, the author had the required level of access to NIO’s staff to undertake further clarification, inquiry or analysis, as required, of the technical information and data provided for this review.

- GeoVista AB - - GVR 14002-
4
3.2 Disclaimer This report, entitled Technical Report, Blötberget - Mineral Resource Estimate, January 25, 2014 was prepared by the author GeoVista AB, on behalf of Nordic Iron Ore AB (NIO).
The opinions and conclusions presented in this report are based largely on information and technical reports provided to the Author prior to the site visit and data electronically transferred to the Author by NIO. Some of the data used in this report were not within the control of the Author or NIO. It is believed by the Author that the information and resource estimates contained herein are reliable under the conditions and subject to the qualifications set forth in this report. The Author confirms that standard engineering practices have been used by NIO in conducting the exploration programs. The Author has reviewed the data provided by NIO, and finds that it conforms to professional engineering standards and is therefore acceptable for use in generating the resource estimates shown in this report; however, no expressed or implied warranties regarding the accuracy of the data used in this report supplied to the Author is made. A legal due diligence review of ownership or property boundaries is beyond the scope of this review.
The type of work conducted and presented in this report, is by nature strictly an estimate. Thus, any decision made based on this information is solely on the client’s responsibility. It is incumbent upon the client to check and approve the data and results delivered, and as soon as possible notify GeoVista AB of any complaints or remarks.
4 Property description and location Ludvika is located in Dalarnas Län (County) in central Sweden, within the historic and still-active Bergslagen mining district. Blötberget was all mined historically up until 1979 using open pit and underground methods. This area has been explored significantly with historic drilling campaigns. The final production capacities achieved in 1979 at Blötberget was 400 Ktpa (thousand tonnes per annum).
NIO began exploration in 2011, with magnetic anomaly surveys and diamond drilling. To date, 15 holes of 6,900 m have been drilled at Blötberget.
The Blötberget Project is located close to the town of Ludvika, 220 km west-northwest of Stockholm, which is well connected to all major towns and cities in Sweden by road, rail and air. The property location is shown in Figure 1.
- GeoVista AB - - GVR 14002-
5
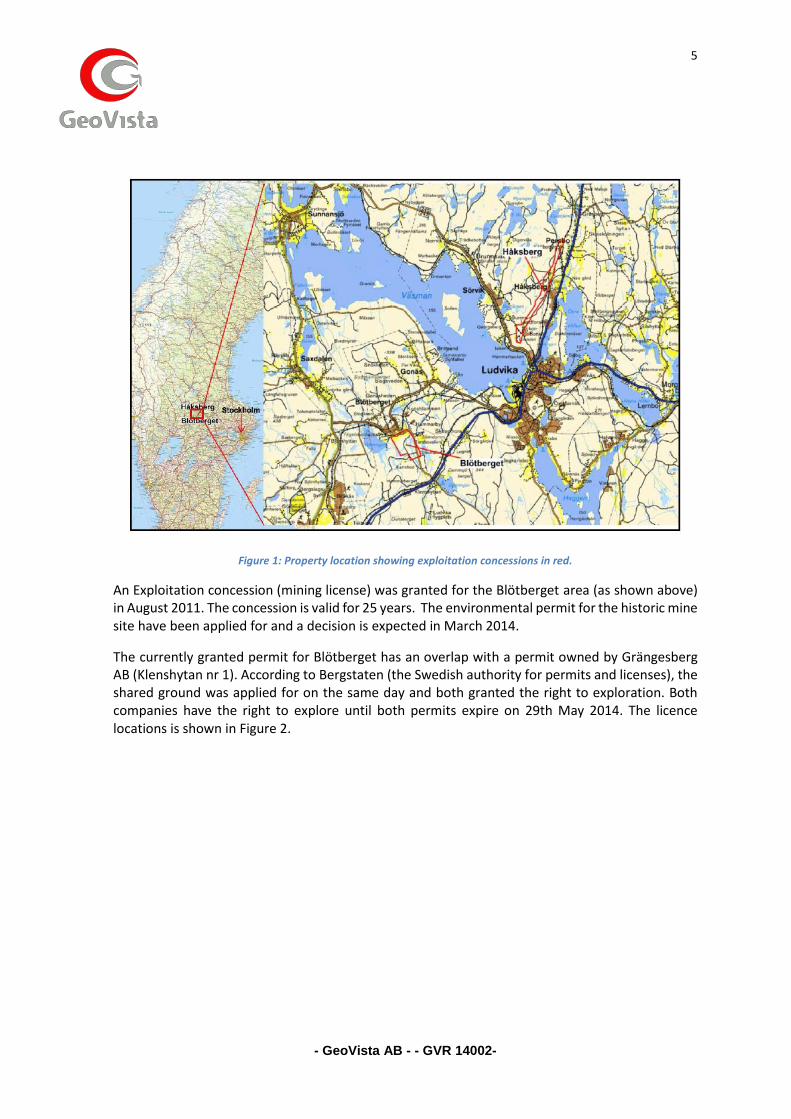
Figure 1: Property location showing exploitation concessions in red.
An Exploitation concession (mining license) was granted for the Blötberget area (as shown above) in August 2011. The concession is valid for 25 years. The environmental permit for the historic mine site have been applied for and a decision is expected in March 2014.
The currently granted permit for Blötberget has an overlap with a permit owned by Grängesberg AB (Klenshytan nr 1). According to Bergstaten (the Swedish authority for permits and licenses), the shared ground was applied for on the same day and both granted the right to exploration. Both companies have the right to explore until both permits expire on 29th May 2014. The licence locations is shown in Figure 2.
- GeoVista AB - - GVR 14002-
6
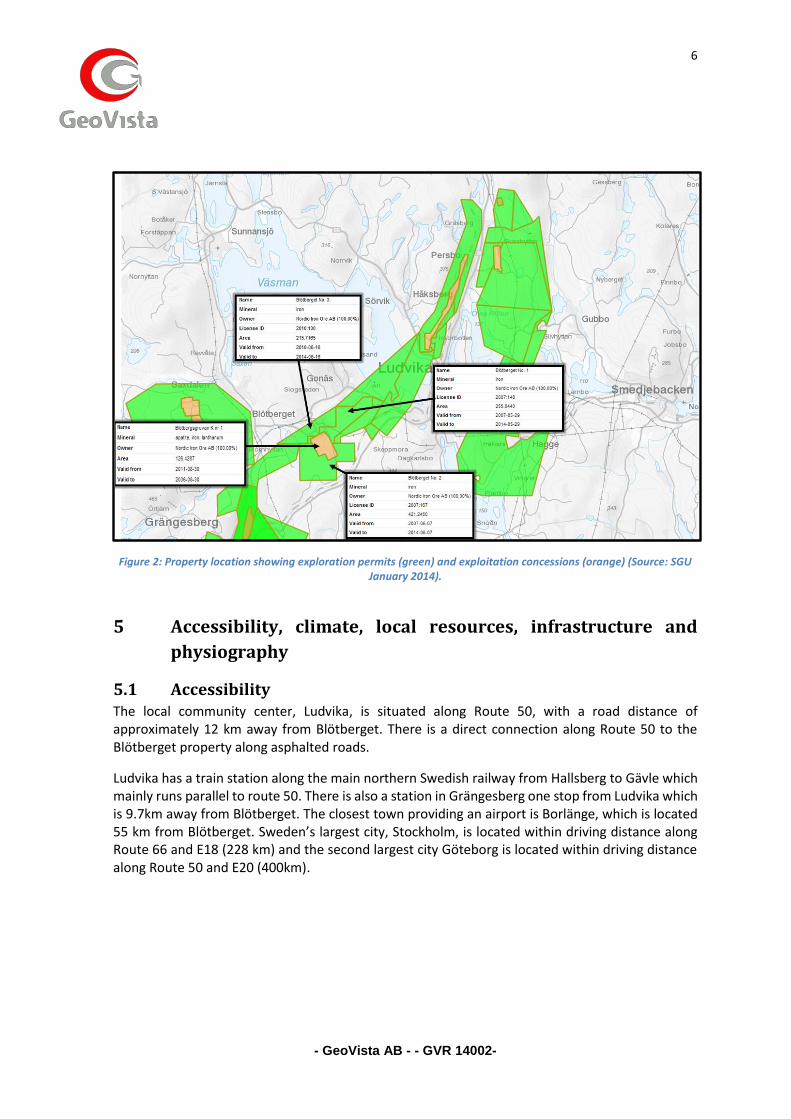
Figure 2: Property location showing exploration permits (green) and exploitation concessions (orange) (Source: SGU January 2014).
5 Accessibility, climate, local resources, infrastructure and
physiography
5.1 Accessibility The local community center, Ludvika, is situated along Route 50, with a road distance of approximately 12 km away from Blötberget. There is a direct connection along Route 50 to the Blötberget property along asphalted roads.
Ludvika has a train station along the main northern Swedish railway from Hallsberg to Gävle which mainly runs parallel to route 50. There is also a station in Grängesberg one stop from Ludvika which is 9.7km away from Blötberget. The closest town providing an airport is Borlänge, which is located 55 km from Blötberget. Sweden’s largest city, Stockholm, is located within driving distance along Route 66 and E18 (228 km) and the second largest city Göteborg is located within driving distance along Route 50 and E20 (400km).
- GeoVista AB - - GVR 14002-
7
5.2 Climate In Ludvika, the climate is cold and temperate. There is significant rainfall throughout the year in Ludvika. Even the driest month still has a lot of rainfall. The Köppen-Geiger climate classification is Dfb. The average annual temperature in Ludvika is 4.9 °C. The average annual rainfall is 689 mm. The driest month is March with 34 mm. Most precipitation falls in August, with an average of 85 mm. The warmest month of the year is July with an average temperature of 16.3 °C. In February, the average temperature is -5.2 °C. It is the lowest average temperature of the whole year. The difference in precipitation between the driest month and the wettest month is 51 mm. The average temperatures vary during the year by 21.5 °C.
5.3 Local resources The local community has an average unemployment rate. There appears to be a wide interest in the establishment of a large mining employer (as there was in the past) and thus the potential of acquiring motivated and potentially well experienced senior staff.
5.4 Infrastructure The electrical power needed for mining and milling operations can be provided from the main power line about 1 km away from Blötberget. Furthermore there is a small hydropower plant at the river in Ludvika. Also the water supply is easily accessible from several nearby lakes.
5.5 Physiography The exploration permit is located in an arboreal forest landscape with a relatively flat and boggy morphology. The elevation in the property area varies between 150 and 250m above sea level.
6 History Mining and exploration in the Ludvika area has been carried out in different periods since the 1600’s. The majority of mining was focused on iron. In the 1800’s and early 1900’s comparably lower quantities of ore were produced.
After the Second World War the mine regained Swedish ownership and continued production with several different companies, until mine closure in 1979. Blötberget operated as two mines with separate shafts were in operation simultaneously between 1950 and 1966: the Vulcanus “original” mine and the Blötberget “new” mine, which started operation in 1944 by sinking the new shaft to 300 m level and building the new central plant.
Since the mine closed in 1979, the deposit has been controlled by a few companies through exploration permits until NIO formed in 2008.
• 1900 Mining Co Vulcanus started large-scale mining.
• 1944 Stora Kopparberg Bergslags AB started mining in an adjacent claim and sunk a new shaft (BS-shaft) together with complete new surface structures, head frame, concentrator, storage /loading facilities.
• 1949 Stora Kopparberg bought Vulcanus.
- GeoVista AB - - GVR 14002-
8
• 1950 to 1966 both mining areas were mined simultaneously, under the ownership of one company, Stora Kopparbergs, using both shafts. The production rate was ca 400 kt / year of ore and 220 kt of product.
• 1968 to 1975 the BS-shaft was further sunk to 570 m depth. The hoisting facility was modernized and upgraded to 600 kt/year production capacity. The new plant commenced operation in December 1975.
• 1978 Swedish Steel (SSAB) was founded and the mines (Blötberget and Håksberg) were sold to SSAB the same year.
• The operation ceased in June 1979. A total of 19 Mt of material, averaging 37% Fe Total, 0.55 – 0.8% P and <0.01% S, was reportedly extracted.
6.1 Previous mapping Regional geological maps over the area have been published by the Geological Survey of Sweden, SGU. Publications include a colour version of map sheet Ludvika AF158, 1:50 000 (1986), a more detailed map in scale 1:50 000 (2005).
6.2 Previous geophysical surveys
6.2.1 Airborne geophysical surveys
SGU has performed regional airborne geophysical surveys over the area. In the 1960’s an airborne magnetometry and gamma spectrometry survey was done. This was carried out with 250 m line spacing at a height of 30 to 60 meters, and the map shows measured variations in the magnetic total field after the Earth's magnetic reference field (DGRF 1965.0) subtracted. Magnetic field size specified in the device nanotesla (nT). The map provides information on lithological variations and structures in the bedrock at the surface and at depth. Shifts in anomaly pattern can detect faults and their relative movements. The information is used for geological mapping and prospecting, and is particularly useful in areas where large parts of the bedrock is covered by soft soils and water, as in Sweden. The information is stored in the SGU database and can be ordered from them.
6.2.2 Ground geophysical surveys
Kopparberg Mineral AB carried out a more detailed magnetometry survey over a limited part of the area during 2009, as part of the preparations for setting up NIO. The results are reported by Linda Olsson.
Most of the deeper drillholes, made in the late 1960’s and early 1970’s, to investigate the depth extension of the ore zone, were logged with a magnetometer as well as deviation surveyed by Terratest AB.
6.3 Previous diamond drilling During the time of production, the ore bodies were continuously investigated by diamond drilling. In areas were mining was on-going or planned, regular drill fans, spaced 30m apart were carried out from underground positions in drifts. Deeper parts of the deposits were investigated with less dense drilling. Most of the drillholes are collared underground, with only the deeper holes located at the surface.
- GeoVista AB - - GVR 14002-
9
Most often, the historical core is 22mm, occasionally 32mm. The deeper holes, made in the late 1960’s and early 1970’s, start with 52mm core and change over to 32mm core in their deeper parts. Drilling has been carried out by contractors as well as by the mine’s own crews.
6.3.1 Historical deviation measurements
Only holes longer than 150-200m were deviation surveyed on a regular basis, most of these records has been located and entered into the databases, some has been possible to re-construct from trace plots of the respective holes, yet others are lost or remains to be found. The lack of deviation survey information for holes shorter than 100m is not considered a problem, since generally they do not tend to deviate significantly.
6.4 Previous metallurgical work At the time of production, the mine had a process plant with crushing, milling, magnetic and gravity separataion to handle the ore feed, with a variable mix of Hematite and Magnetite.
6.5 Historical resource estimates (non JORC compliant) The mining company, Stora Kopparbergs Bergslags AB submitted a closure report to the Inspector of Mines at the seizure of mining activities in 1979. The reserves (non compliant) were estimated to approximately 25 Mton with approximately 43% Fe.
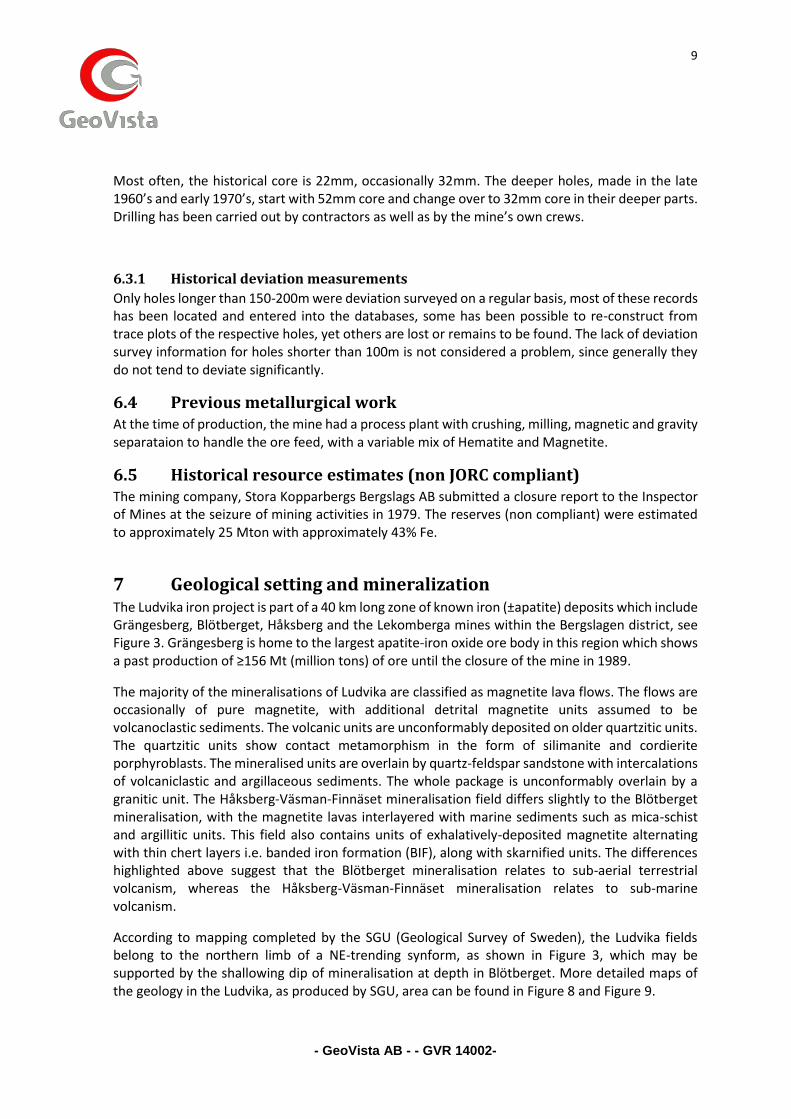
7 Geological setting and mineralization The Ludvika iron project is part of a 40 km long zone of known iron (±apatite) deposits which include Grängesberg, Blötberget, Håksberg and the Lekomberga mines within the Bergslagen district, see Figure 3. Grängesberg is home to the largest apatite-iron oxide ore body in this region which shows a past production of ≥156 Mt (million tons) of ore until the closure of the mine in 1989.
The majority of the mineralisations of Ludvika are classified as magnetite lava flows. The flows are occasionally of pure magnetite, with additional detrital magnetite units assumed to be volcanoclastic sediments. The volcanic units are unconformably deposited on older quartzitic units. The quartzitic units show contact metamorphism in the form of silimanite and cordierite porphyroblasts. The mineralised units are overlain by quartz-feldspar sandstone with intercalations of volcaniclastic and argillaceous sediments. The whole package is unconformably overlain by a granitic unit. The Håksberg-Väsman-Finnäset mineralisation field differs slightly to the Blötberget mineralisation, with the magnetite lavas interlayered with marine sediments such as mica-schist and argillitic units. This field also contains units of exhalatively-deposited magnetite alternating with thin chert layers i.e. banded iron formation (BIF), along with skarnified units. The differences highlighted above suggest that the Blötberget mineralisation relates to sub-aerial terrestrial volcanism, whereas the Håksberg-Väsman-Finnäset mineralisation relates to sub-marine volcanism.
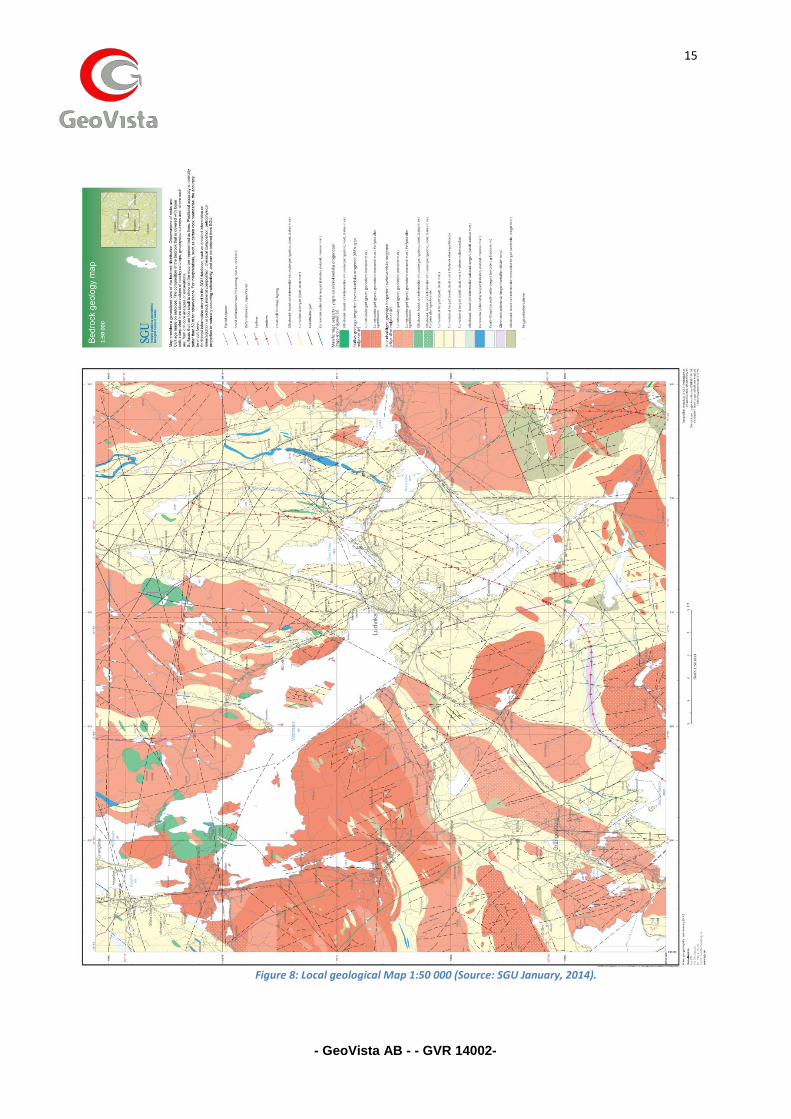
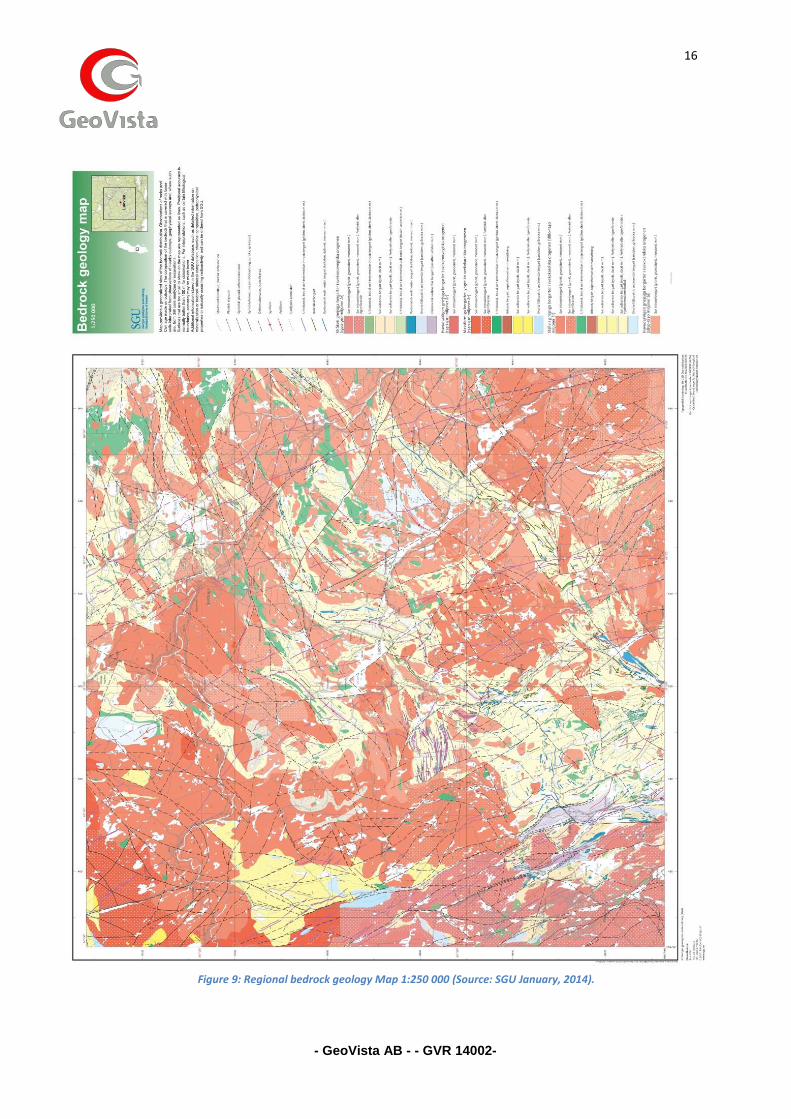
According to mapping completed by the SGU (Geological Survey of Sweden), the Ludvika fields belong to the northern limb of a NE-trending synform, as shown in Figure 3, which may be supported by the shallowing dip of mineralisation at depth in Blötberget. More detailed maps of the geology in the Ludvika, as produced by SGU, area can be found in Figure 8 and Figure 9.
- GeoVista AB - - GVR 14002-
10
Oxidation of the primary magnetite mineralisation has produced large areas of martite (haematite formed after replacement of magnetite) mineralisation. This is more pronounced in the Blötberget field. The cause of the oxidation is debatable, but one theory (put forward by consulting geologist Mats Larsson) suggests that at Blötberget early lava flows were sub-aerial and were oxidised by surface weathering processes. Whereas the later flows possibly did not breach the surface, and were prevented from reaching the surface due to the cap formed by the earlier flows. In which case, these flows were possibly in the form of dykes and sills. In the Håksberg-Väsman-Finnäset field, a sub-marine environment for erupting lava has been suggested, with limited oxidation and interlayering of marine sediments. Subsequent deformation, alteration and metamorphism may have contributed to additional oxidation due to fluid interaction.
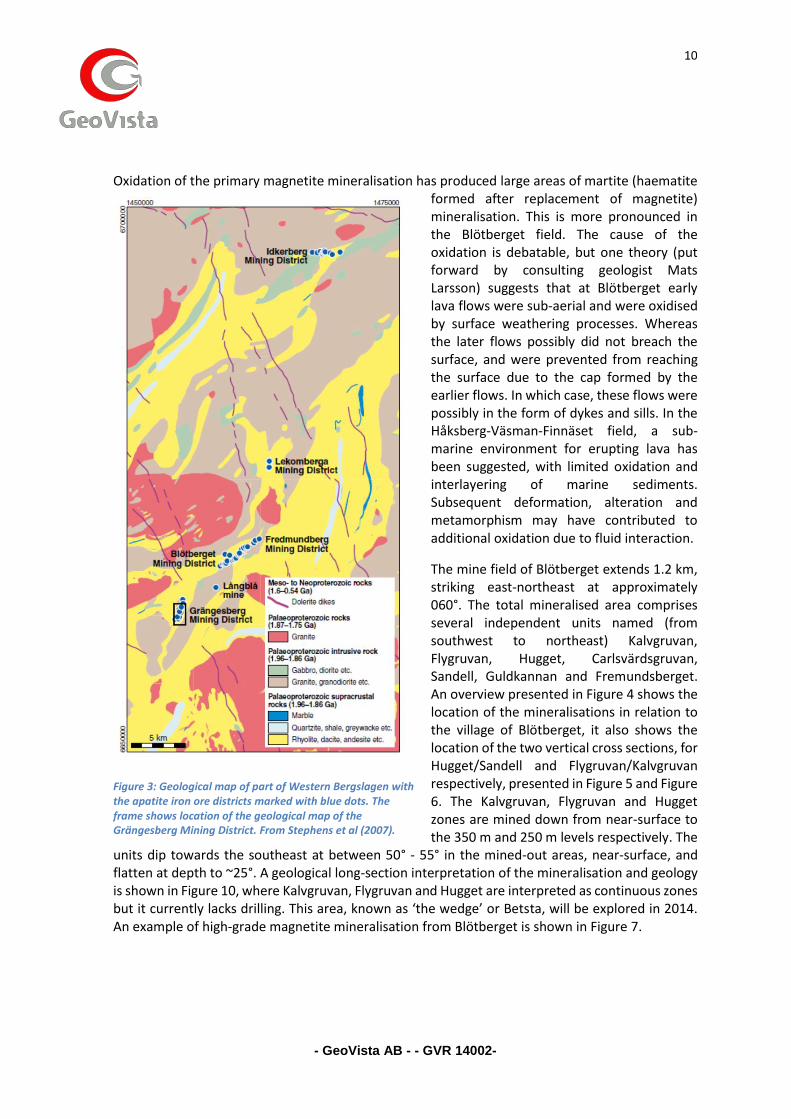
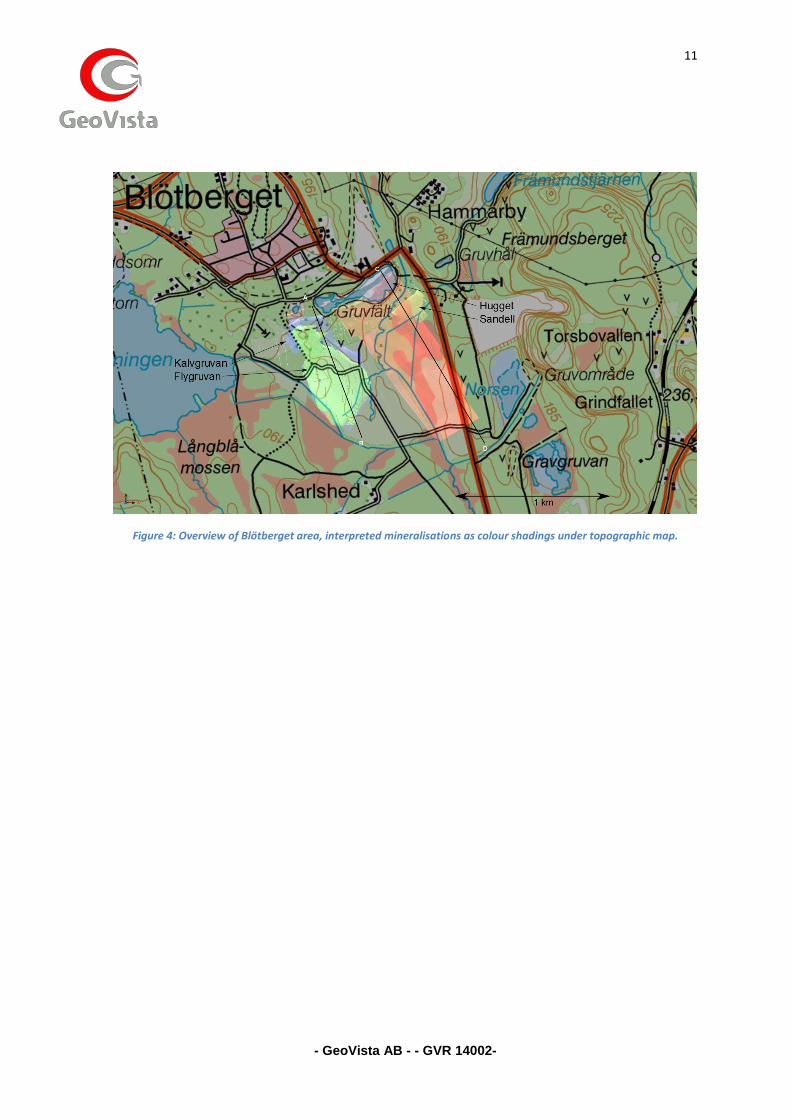
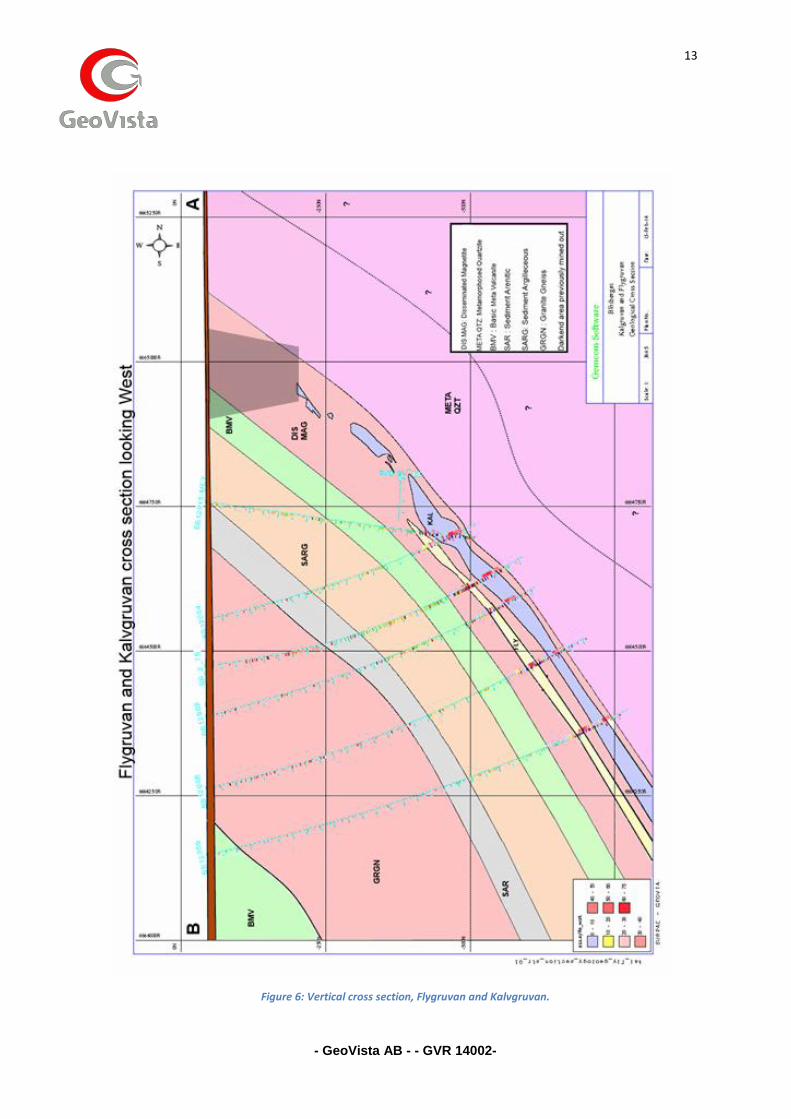
The mine field of Blötberget extends 1.2 km, striking east-northeast at approximately 060°. The total mineralised area comprises several independent units named (from southwest to northeast) Kalvgruvan, Flygruvan, Hugget, Carlsvärdsgruvan, Sandell, Guldkannan and Fremundsberget. An overview presented in Figure 4 shows the location of the mineralisations in relation to the village of Blötberget, it also shows the location of the two vertical cross sections, for Hugget/Sandell and Flygruvan/Kalvgruvan respectively, presented in Figure 5 and Figure 6. The Kalvgruvan, Flygruvan and Hugget zones are mined down from near-surface to the 350 m and 250 m levels respectively. The
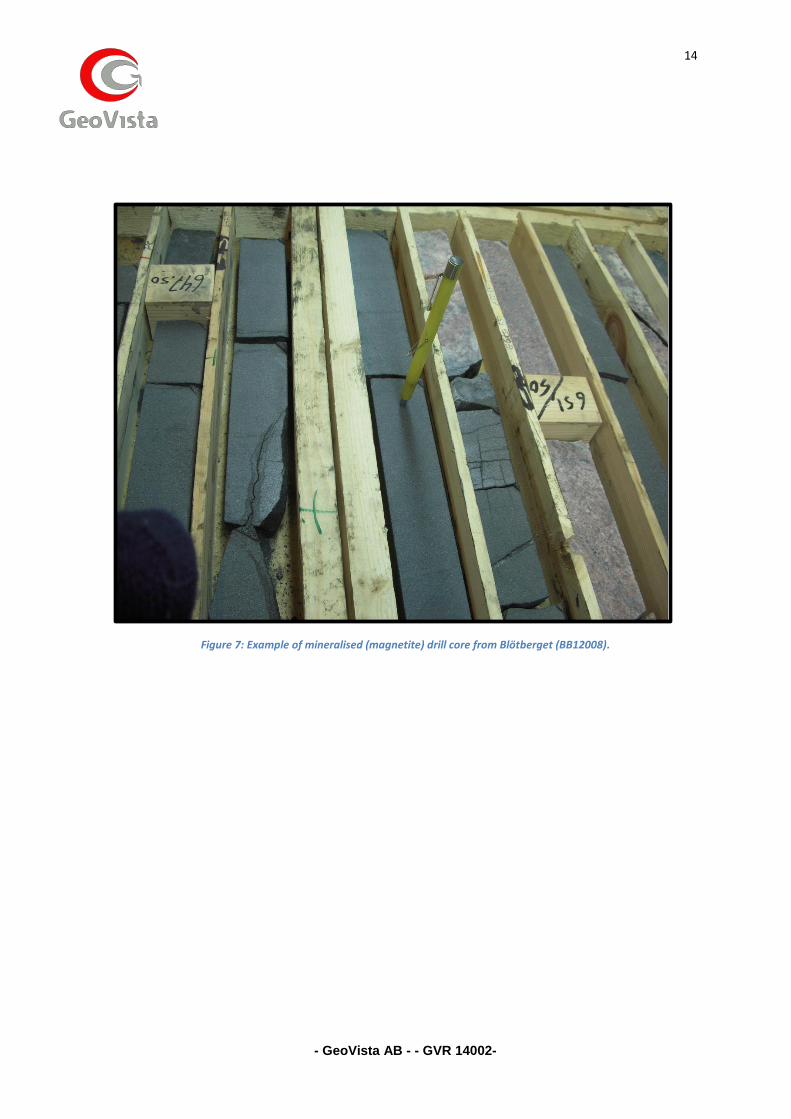
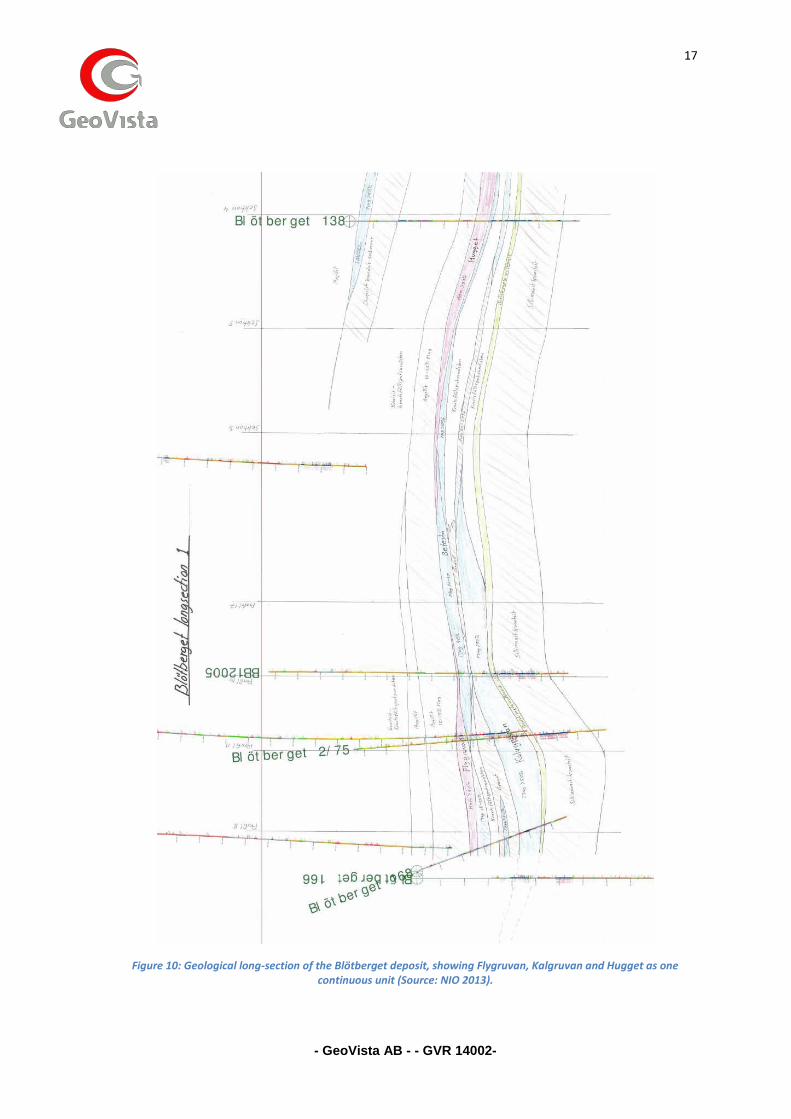
units dip towards the southeast at between 50° - 55° in the mined-out areas, near-surface, and flatten at depth to ~25°. A geological long-section interpretation of the mineralisation and geology is shown in Figure 10, where Kalvgruvan, Flygruvan and Hugget are interpreted as continuous zones but it currently lacks drilling. This area, known as ‘the wedge’ or Betsta, will be explored in 2014. An example of high-grade magnetite mineralisation from Blötberget is shown in Figure 7.
Figure 3: Geological map of part of Western Bergslagen with the apatite iron ore districts marked with blue dots. The frame shows location of the geological map of the Grängesberg Mining District. From Stephens et al (2007).
- GeoVista AB - - GVR 14002-
11
Figure 4: Overview of Blötberget area, interpreted mineralisations as colour shadings under topographic map.
- GeoVista AB - - GVR 14002-
12
Figure 5: Vertical cross section, Hugget and Sandell.
- GeoVista AB - - GVR 14002-
13
Figure 6: Vertical cross section, Flygruvan and Kalvgruvan.
- GeoVista AB - - GVR 14002-
14
Figure 7: Example of mineralised (magnetite) drill core from Blötberget (BB12008).
- GeoVista AB - - GVR 14002-
15
Figure 8: Local geological Map 1:50 000 (Source: SGU January, 2014).
- GeoVista AB - - GVR 14002-
16
Figure 9: Regional bedrock geology Map 1:250 000 (Source: SGU January, 2014).
- GeoVista AB - - GVR 14002-
17
Figure 10: Geological long-section of the Blötberget deposit, showing Flygruvan, Kalgruvan and Hugget as one continuous unit (Source: NIO 2013).
- GeoVista AB - - GVR 14002-
18
8 Exploration
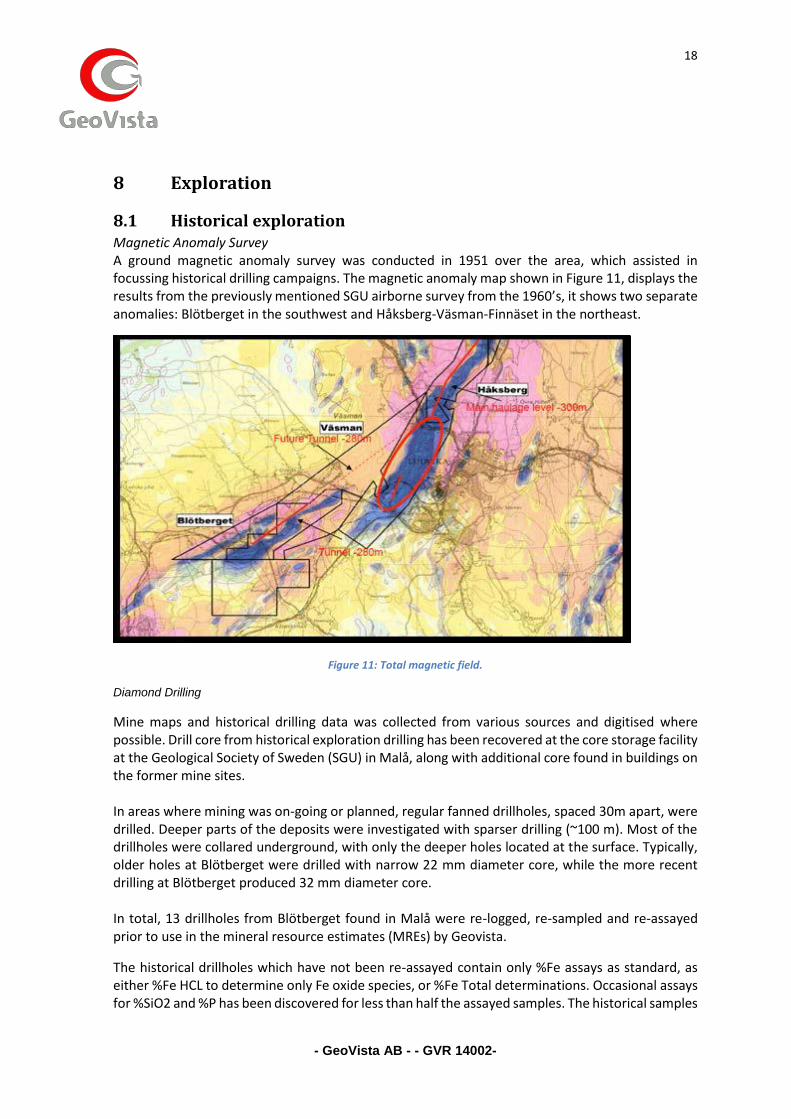
8.1 Historical exploration Magnetic Anomaly Survey A ground magnetic anomaly survey was conducted in 1951 over the area, which assisted in focussing historical drilling campaigns. The magnetic anomaly map shown in Figure 11, displays the results from the previously mentioned SGU airborne survey from the 1960’s, it shows two separate anomalies: Blötberget in the southwest and Håksberg-Väsman-Finnäset in the northeast.
Figure 11: Total magnetic field.
Diamond Drilling
Mine maps and historical drilling data was collected from various sources and digitised where possible. Drill core from historical exploration drilling has been recovered at the core storage facility at the Geological Society of Sweden (SGU) in Malå, along with additional core found in buildings on the former mine sites. In areas where mining was on-going or planned, regular fanned drillholes, spaced 30m apart, were drilled. Deeper parts of the deposits were investigated with sparser drilling (~100 m). Most of the drillholes were collared underground, with only the deeper holes located at the surface. Typically, older holes at Blötberget were drilled with narrow 22 mm diameter core, while the more recent drilling at Blötberget produced 32 mm diameter core. In total, 13 drillholes from Blötberget found in Malå were re-logged, re-sampled and re-assayed prior to use in the mineral resource estimates (MREs) by Geovista.
The historical drillholes which have not been re-assayed contain only %Fe assays as standard, as either %Fe HCL to determine only Fe oxide species, or %Fe Total determinations. Occasional assays for %SiO2 and %P has been discovered for less than half the assayed samples. The historical samples
- GeoVista AB - - GVR 14002-
19
were collected using a visual cut-off grade of 30% Fe, due to the lower iron ore price material below 30% Fe not being considered economic. This has resulted in data gaps in mineralised material with lower Fe grades which may now be deemed economic.
All historical holes digitised either have locations and surveys in mine maps, or in supplementary documentation. Where possible, collars have been located in the field and verified. Historical holes longer than 150 - 200 m were surveyed down-hole on a regular basis, some of these records have been located and entered into the databases, and some have been reconstructed from trace plots of the respective holes, whilst others are absent entirely.
8.2 Exploration Diamond Drilling
The drilling completed by NIO to date includes twinned drilling to confirm historical drilling at Blötberget as well as infill and step out at Blötberget. To date NIO have completed 15 holes (+one extension) for 7,430 m at Blötberget, In addition, a second programme of mainly infill drilling for approximately 6500m has been planned at Blötberget. The aim of this programme is to investigate the area in between Flygruvan/Kalgruvan and Hugget/Betsta, and to infill the intermediate depth portion of Hugget to convert Inferred resources to Indicated.
The NIO drilling is carried out by the Swedish contractor Drillcon Core AB, or by their Finnish subsidiary Suomen Malmi Oy, using wireline 56 methodology, recovering 39 mm drill core. One hole has been drilled for metallurgical sampling, using HQ dimension to recover 63.5 mm core. To date, 1 hole has been drilled with oriented core to provide accurate structural information. Three of the holes have been subject to test pumping to provide information on the potential for water bearing fracture zones.
9 Sample handling, analyses and security The core from the recent drill program was collected in the field by NIO’s technicians or geologists and transported directly to the NIO core logging and sample preparation facilities in Grängesberg.
A detailed description of the protocols followed in everything that relates to core handling, sampling and analysis, QA/QC-procedures etc. can be found in NIO’s Quality Manual.
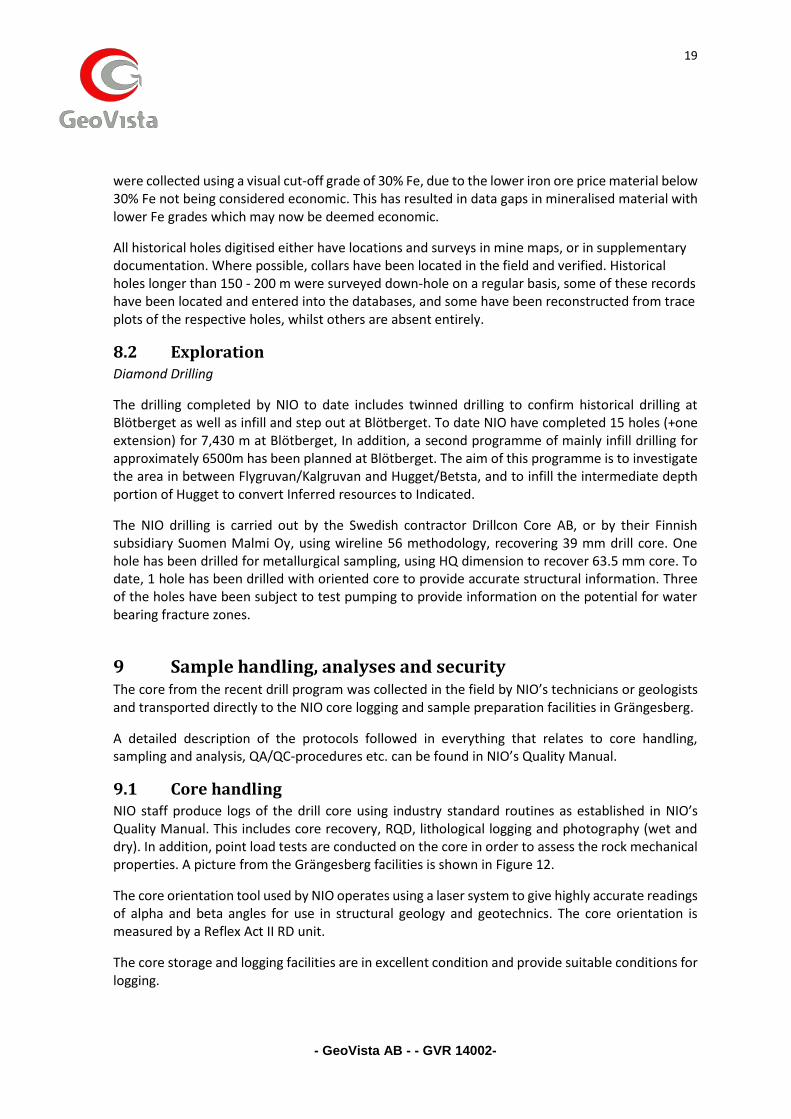
9.1 Core handling NIO staff produce logs of the drill core using industry standard routines as established in NIO’s Quality Manual. This includes core recovery, RQD, lithological logging and photography (wet and dry). In addition, point load tests are conducted on the core in order to assess the rock mechanical properties. A picture from the Grängesberg facilities is shown in Figure 12.
The core orientation tool used by NIO operates using a laser system to give highly accurate readings of alpha and beta angles for use in structural geology and geotechnics. The core orientation is measured by a Reflex Act II RD unit.
The core storage and logging facilities are in excellent condition and provide suitable conditions for logging.
- GeoVista AB - - GVR 14002-
20
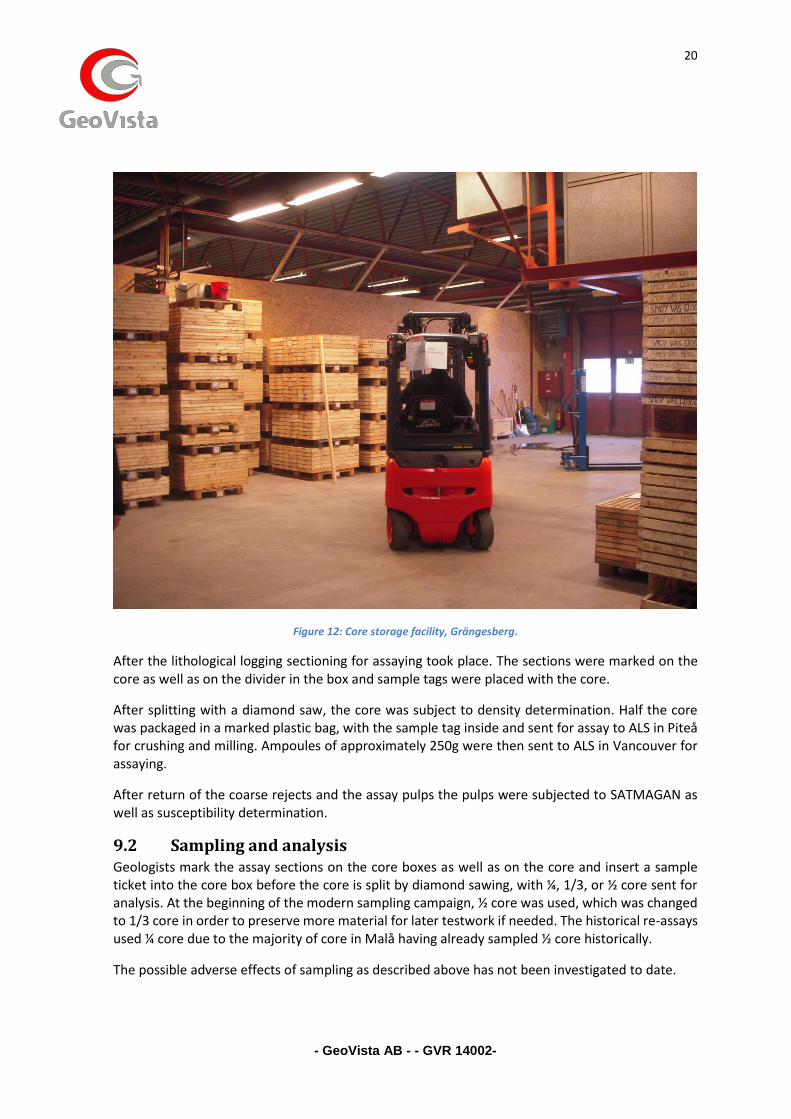
Figure 12: Core storage facility, Grängesberg.
After the lithological logging sectioning for assaying took place. The sections were marked on the core as well as on the divider in the box and sample tags were placed with the core.
After splitting with a diamond saw, the core was subject to density determination. Half the core was packaged in a marked plastic bag, with the sample tag inside and sent for assay to ALS in Piteå for crushing and milling. Ampoules of approximately 250g were then sent to ALS in Vancouver for assaying.
After return of the coarse rejects and the assay pulps the pulps were subjected to SATMAGAN as well as susceptibility determination.
9.2 Sampling and analysis Geologists mark the assay sections on the core boxes as well as on the core and insert a sample ticket into the core box before the core is split by diamond sawing, with ¼, 1/3, or ½ core sent for analysis. At the beginning of the modern sampling campaign, ½ core was used, which was changed to 1/3 core in order to preserve more material for later testwork if needed. The historical re-assays used ¼ core due to the majority of core in Malå having already sampled ½ core historically.
The possible adverse effects of sampling as described above has not been investigated to date.
- GeoVista AB - - GVR 14002-
21
Split core is dried and put in plastic bags together with the sample ticket. The bag is marked with the sample ID and sealed with staples. Samples are transported by Bussgods to ALS facility in Piteå for crushing and milling. Ampoules of approximately 250 g of ground sample pulp are then forwarded for assaying.
The assays are carried out by ALS Global in Vancouver, using either of ME-XRF11b, ME-XRF15b or ME-XRF21n, depending on assaying period (XRF21n and XRF11b are the same) and whether they were suspected of containing larger amounts of sulphide minerals or not (XRF15b is more reliable for sulphide-rich samples). All three methods are considered appropriate for iron ore projects. All of ALS Chemex’ laboratories are accredited to ISO/IEC 17025:2005 standard.
9.3 Quality Assurance and Quality Control Procedure There are no records describing the quality assurance/quality control procedures in the historical times. The core was logged following the industry standard of the epoch, sections were marked were grades were visually assessed to be “mineable” and assayed at the mine laboratory. The fact that historical assays compare well with recent re-assays show that, at least, the assay quality was good.
Samples for quality assurance and quality control have been inserted, on average, one every 20 samples (5% insertion rate). Check samples have consisted of certified standards, blanks and duplicates of previously assayed samples. No QAQC samples were analysed for the re-assayed historic core at Blötberget.
There are two blanks in the NIO database; the NIO blank material is a quartz-rich sand from a nearby quarry, and the ALS Chemex blank material is a quartzite.
The standards represent an appropriate spread of %Fe Total grades, as shown below:
• GIOP-120 – certified mean of 2.83% Fe Total
• GIOP-98 – certified mean of 23.97% Fe Total
• GIOP-48 – certified mean of 45.93% Fe Total
QAQC Analysis
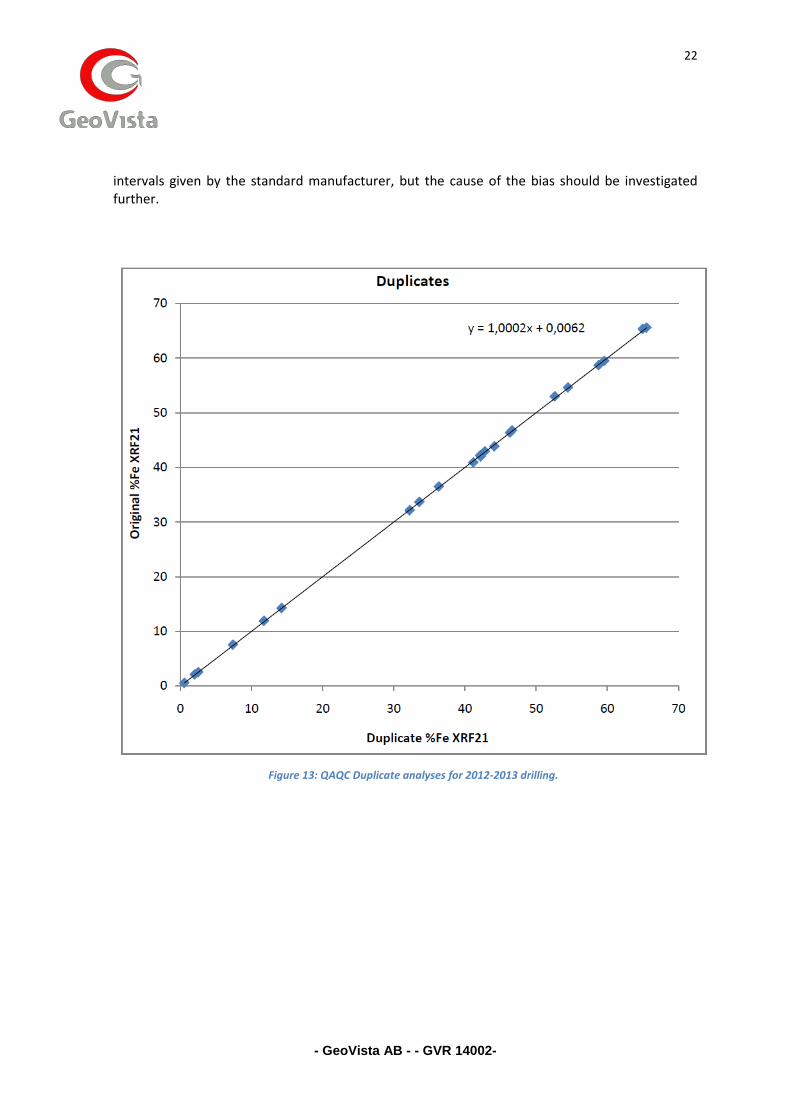
QAQC samples are inserted at a rate of 6%, comparing favourably to the documented protocol. In total, 23 duplicates, 26 blanks, 8 GIOP-94, 4 GIOP-120 and 5 GIO-48 standards were analysed. The results of the analyses are plotted in Figure 13 to Figure 17.
The duplicate analyses show an excellent correlation between original and duplicate %Fe Total assays.
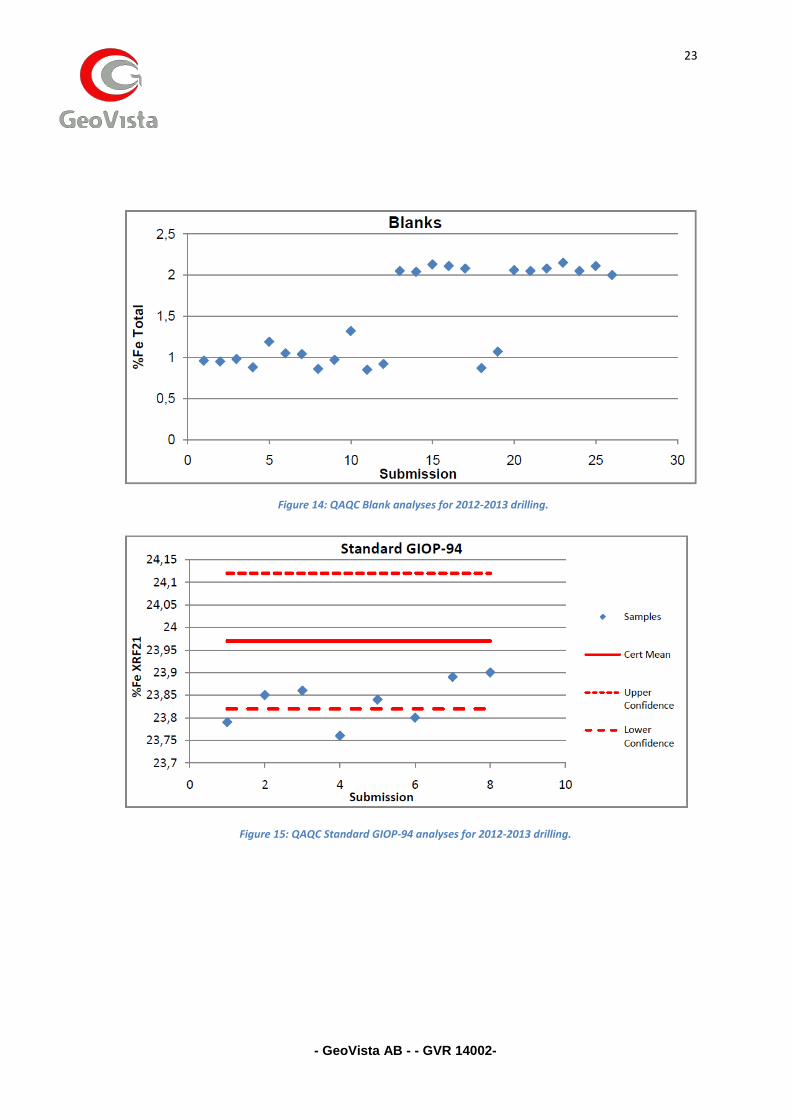
The blank analyses show two separate trends, with one trend grading ~1% Fe Total, and another trend grading ~2% Fe Total. This is the result of the two blank materials used (NIO and ALS). The results are too few to comment on contamination issues at present.
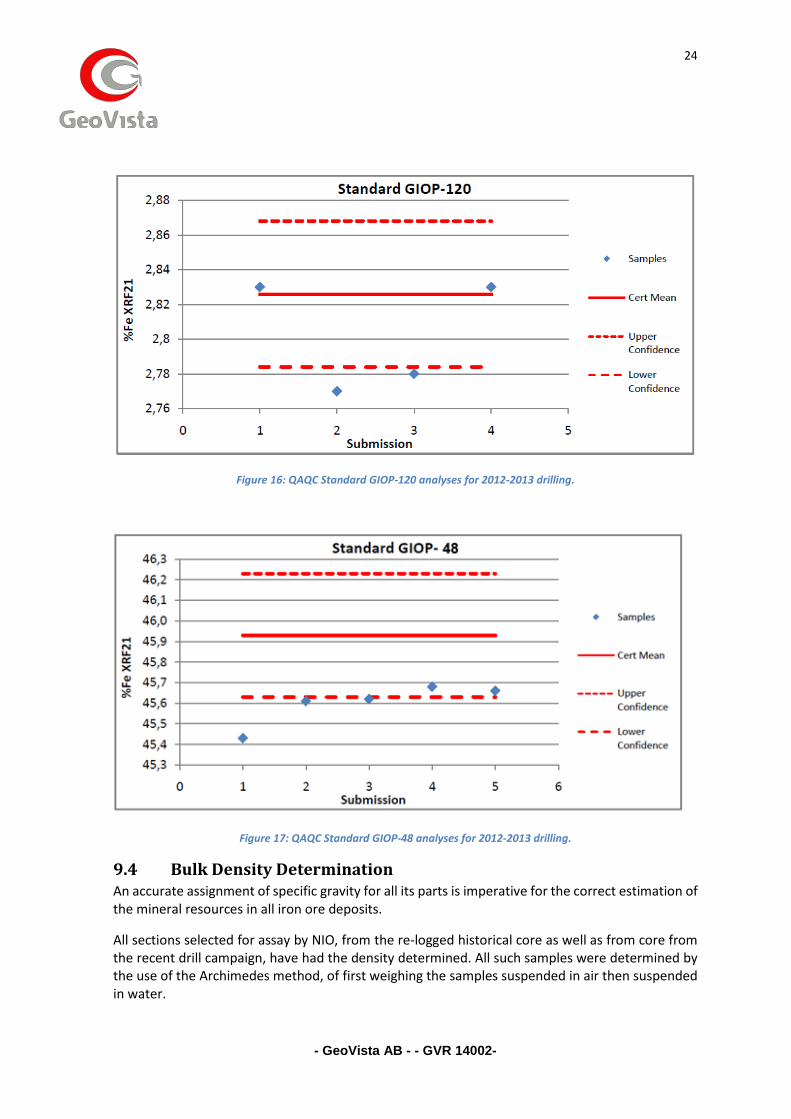
The three standards utilised all show a negative bias to the data compared to the certified mean, with consistent underestimation of grade. The majority of the data fall within the confidence
- GeoVista AB - - GVR 14002-
22
intervals given by the standard manufacturer, but the cause of the bias should be investigated further.
Figure 13: QAQC Duplicate analyses for 2012-2013 drilling.
- GeoVista AB - - GVR 14002-
23
Figure 15: QAQC Standard GIOP-94 analyses for 2012-2013 drilling.
Figure 14: QAQC Blank analyses for 2012-2013 drilling.
- GeoVista AB - - GVR 14002-
24
Figure 16: QAQC Standard GIOP-120 analyses for 2012-2013 drilling.
Figure 17: QAQC Standard GIOP-48 analyses for 2012-2013 drilling.
9.4 Bulk Density Determination An accurate assignment of specific gravity for all its parts is imperative for the correct estimation of the mineral resources in all iron ore deposits.
All sections selected for assay by NIO, from the re-logged historical core as well as from core from the recent drill campaign, have had the density determined. All such samples were determined by the use of the Archimedes method, of first weighing the samples suspended in air then suspended in water.
- GeoVista AB - - GVR 14002-
25
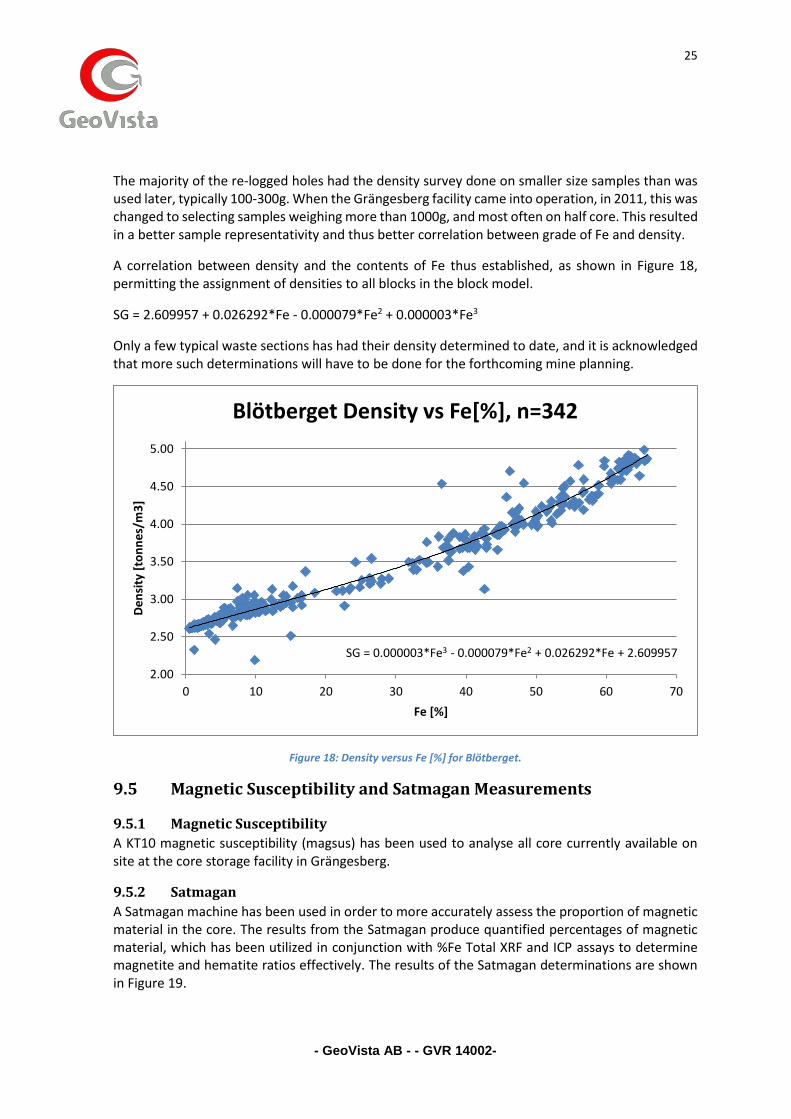
The majority of the re-logged holes had the density survey done on smaller size samples than was used later, typically 100-300g. When the Grängesberg facility came into operation, in 2011, this was changed to selecting samples weighing more than 1000g, and most often on half core. This resulted in a better sample representativity and thus better correlation between grade of Fe and density.
A correlation between density and the contents of Fe thus established, as shown in Figure 18, permitting the assignment of densities to all blocks in the block model.
SG = 2.609957 + 0.026292*Fe - 0.000079*Fe2 + 0.000003*Fe3
Only a few typical waste sections has had their density determined to date, and it is acknowledged that more such determinations will have to be done for the forthcoming mine planning.
Figure 18: Density versus Fe [%] for Blötberget.
9.5 Magnetic Susceptibility and Satmagan Measurements
9.5.1 Magnetic Susceptibility
A KT10 magnetic susceptibility (magsus) has been used to analyse all core currently available on site at the core storage facility in Grängesberg.
9.5.2 Satmagan
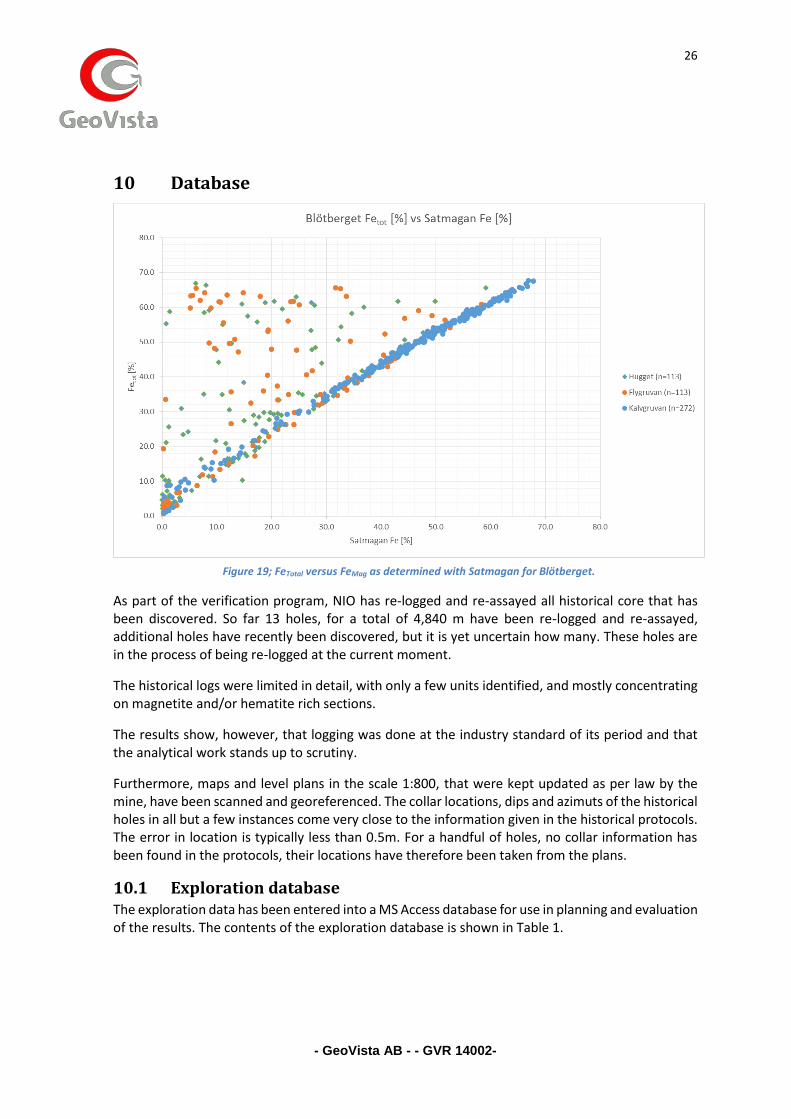
A Satmagan machine has been used in order to more accurately assess the proportion of magnetic material in the core. The results from the Satmagan produce quantified percentages of magnetic material, which has been utilized in conjunction with %Fe Total XRF and ICP assays to determine magnetite and hematite ratios effectively. The results of the Satmagan determinations are shown in Figure 19.
SG = 0.000003*Fe3 - 0.000079*Fe2 + 0.026292*Fe + 2.609957
2.00
2.50
3.00
3.50
4.00
4.50
5.00
0 10 20 30 40 50 60 70
De
nsi
ty [
ton
ne
s/m
3]
Fe [%]
Blötberget Density vs Fe[%], n=342
- GeoVista AB - - GVR 14002-
26
10 Database
As part of the verification program, NIO has re-logged and re-assayed all historical core that has been discovered. So far 13 holes, for a total of 4,840 m have been re-logged and re-assayed, additional holes have recently been discovered, but it is yet uncertain how many. These holes are in the process of being re-logged at the current moment.
The historical logs were limited in detail, with only a few units identified, and mostly concentrating on magnetite and/or hematite rich sections.
The results show, however, that logging was done at the industry standard of its period and that the analytical work stands up to scrutiny.
Furthermore, maps and level plans in the scale 1:800, that were kept updated as per law by the mine, have been scanned and georeferenced. The collar locations, dips and azimuts of the historical holes in all but a few instances come very close to the information given in the historical protocols. The error in location is typically less than 0.5m. For a handful of holes, no collar information has been found in the protocols, their locations have therefore been taken from the plans.
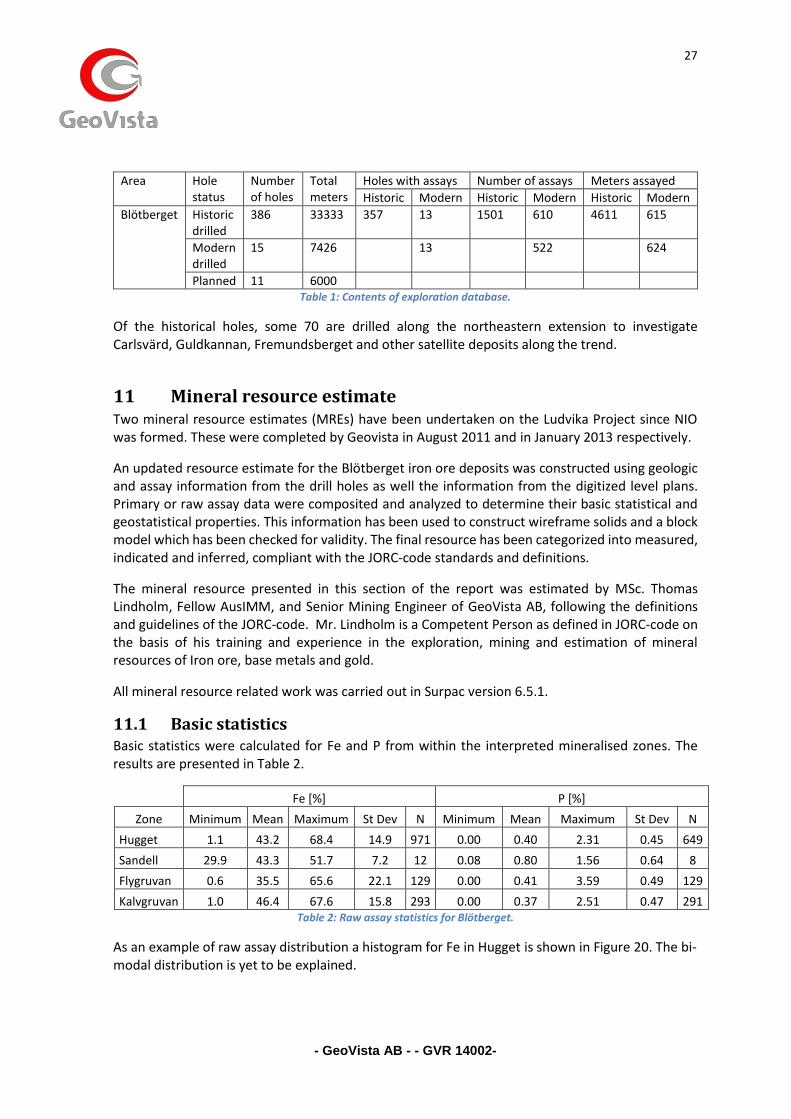
10.1 Exploration database The exploration data has been entered into a MS Access database for use in planning and evaluation of the results. The contents of the exploration database is shown in Table 1.
Figure 19; FeTotal versus FeMag as determined with Satmagan for Blötberget.
- GeoVista AB - - GVR 14002-
27
Area Hole status
Number of holes
Total meters
Holes with assays Number of assays Meters assayed
Historic Modern Historic Modern Historic Modern
Blötberget Historic drilled
386 33333 357 13 1501 610 4611 615
Modern drilled
15 7426 13 522 624
Planned 11 6000 Table 1: Contents of exploration database.
Of the historical holes, some 70 are drilled along the northeastern extension to investigate Carlsvärd, Guldkannan, Fremundsberget and other satellite deposits along the trend.
11 Mineral resource estimate Two mineral resource estimates (MREs) have been undertaken on the Ludvika Project since NIO was formed. These were completed by Geovista in August 2011 and in January 2013 respectively.
An updated resource estimate for the Blötberget iron ore deposits was constructed using geologic and assay information from the drill holes as well the information from the digitized level plans. Primary or raw assay data were composited and analyzed to determine their basic statistical and geostatistical properties. This information has been used to construct wireframe solids and a block model which has been checked for validity. The final resource has been categorized into measured, indicated and inferred, compliant with the JORC-code standards and definitions.
The mineral resource presented in this section of the report was estimated by MSc. Thomas Lindholm, Fellow AusIMM, and Senior Mining Engineer of GeoVista AB, following the definitions and guidelines of the JORC-code. Mr. Lindholm is a Competent Person as defined in JORC-code on the basis of his training and experience in the exploration, mining and estimation of mineral resources of Iron ore, base metals and gold.
All mineral resource related work was carried out in Surpac version 6.5.1.
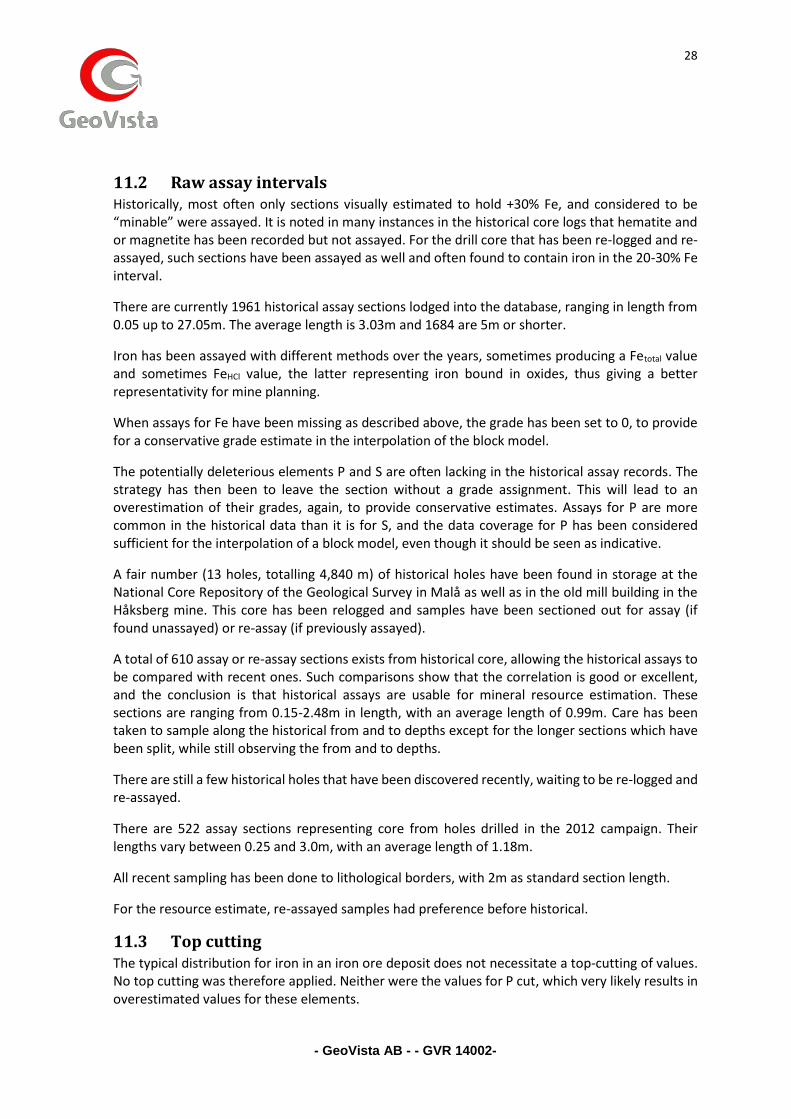
11.1 Basic statistics Basic statistics were calculated for Fe and P from within the interpreted mineralised zones. The results are presented in Table 2.
Fe [%] P [%]
Zone Minimum Mean Maximum St Dev N Minimum Mean Maximum St Dev N
Hugget 1.1 43.2 68.4 14.9 971 0.00 0.40 2.31 0.45 649
Sandell 29.9 43.3 51.7 7.2 12 0.08 0.80 1.56 0.64 8
Flygruvan 0.6 35.5 65.6 22.1 129 0.00 0.41 3.59 0.49 129
Kalvgruvan 1.0 46.4 67.6 15.8 293 0.00 0.37 2.51 0.47 291 Table 2: Raw assay statistics for Blötberget.
As an example of raw assay distribution a histogram for Fe in Hugget is shown in Figure 20. The bi-modal distribution is yet to be explained.
- GeoVista AB - - GVR 14002-
28
11.2 Raw assay intervals Historically, most often only sections visually estimated to hold +30% Fe, and considered to be “minable” were assayed. It is noted in many instances in the historical core logs that hematite and or magnetite has been recorded but not assayed. For the drill core that has been re-logged and re-assayed, such sections have been assayed as well and often found to contain iron in the 20-30% Fe interval.
There are currently 1961 historical assay sections lodged into the database, ranging in length from 0.05 up to 27.05m. The average length is 3.03m and 1684 are 5m or shorter.
Iron has been assayed with different methods over the years, sometimes producing a Fetotal value and sometimes FeHCl value, the latter representing iron bound in oxides, thus giving a better representativity for mine planning.
When assays for Fe have been missing as described above, the grade has been set to 0, to provide for a conservative grade estimate in the interpolation of the block model.
The potentially deleterious elements P and S are often lacking in the historical assay records. The strategy has then been to leave the section without a grade assignment. This will lead to an overestimation of their grades, again, to provide conservative estimates. Assays for P are more common in the historical data than it is for S, and the data coverage for P has been considered sufficient for the interpolation of a block model, even though it should be seen as indicative.
A fair number (13 holes, totalling 4,840 m) of historical holes have been found in storage at the National Core Repository of the Geological Survey in Malå as well as in the old mill building in the Håksberg mine. This core has been relogged and samples have been sectioned out for assay (if found unassayed) or re-assay (if previously assayed).
A total of 610 assay or re-assay sections exists from historical core, allowing the historical assays to be compared with recent ones. Such comparisons show that the correlation is good or excellent, and the conclusion is that historical assays are usable for mineral resource estimation. These sections are ranging from 0.15-2.48m in length, with an average length of 0.99m. Care has been taken to sample along the historical from and to depths except for the longer sections which have been split, while still observing the from and to depths.
There are still a few historical holes that have been discovered recently, waiting to be re-logged and re-assayed.
There are 522 assay sections representing core from holes drilled in the 2012 campaign. Their lengths vary between 0.25 and 3.0m, with an average length of 1.18m.
All recent sampling has been done to lithological borders, with 2m as standard section length.
For the resource estimate, re-assayed samples had preference before historical.
11.3 Top cutting The typical distribution for iron in an iron ore deposit does not necessitate a top-cutting of values. No top cutting was therefore applied. Neither were the values for P cut, which very likely results in overestimated values for these elements.
- GeoVista AB - - GVR 14002-
29
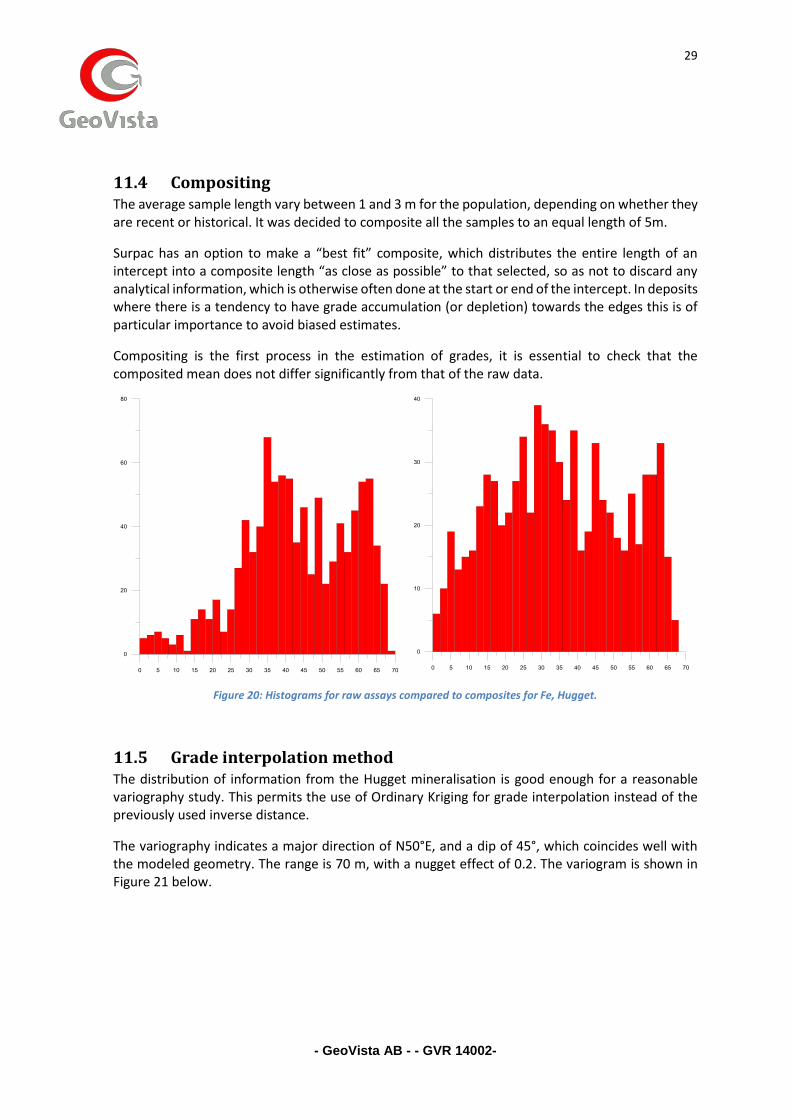
11.4 Compositing The average sample length vary between 1 and 3 m for the population, depending on whether they are recent or historical. It was decided to composite all the samples to an equal length of 5m.
Surpac has an option to make a “best fit” composite, which distributes the entire length of an intercept into a composite length “as close as possible” to that selected, so as not to discard any analytical information, which is otherwise often done at the start or end of the intercept. In deposits where there is a tendency to have grade accumulation (or depletion) towards the edges this is of particular importance to avoid biased estimates.
Compositing is the first process in the estimation of grades, it is essential to check that the composited mean does not differ significantly from that of the raw data.
Figure 20: Histograms for raw assays compared to composites for Fe, Hugget.
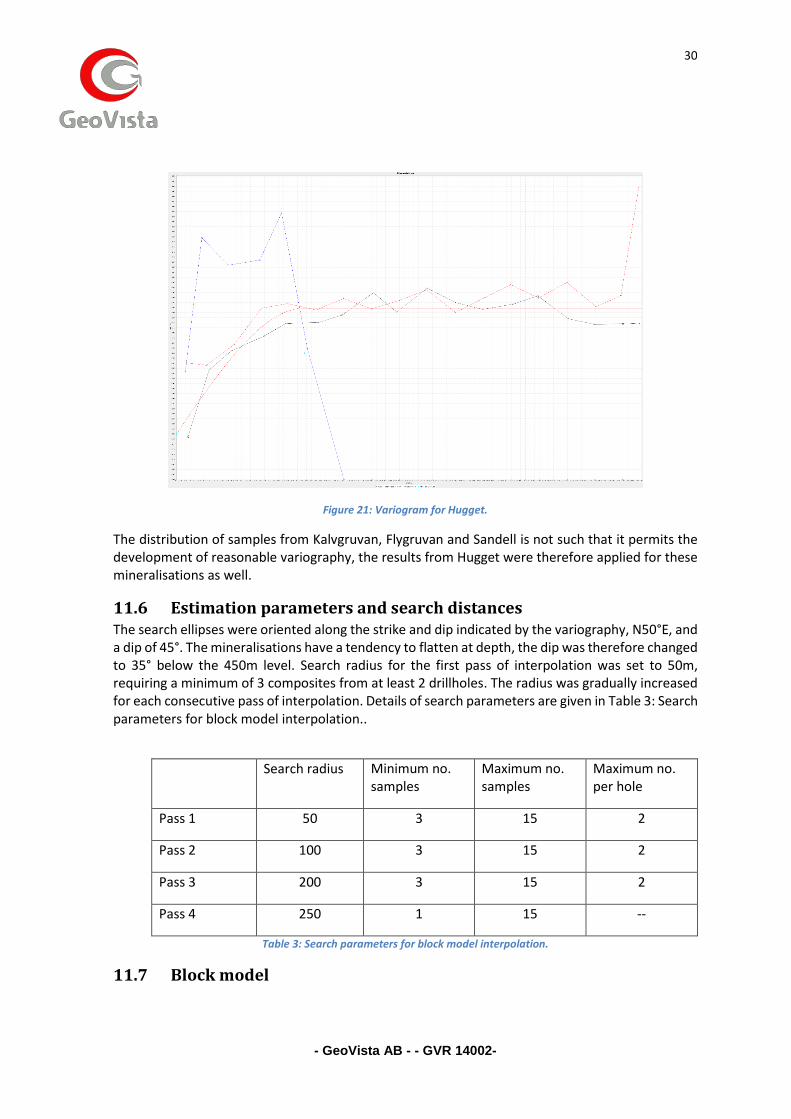
11.5 Grade interpolation method The distribution of information from the Hugget mineralisation is good enough for a reasonable variography study. This permits the use of Ordinary Kriging for grade interpolation instead of the previously used inverse distance.
The variography indicates a major direction of N50°E, and a dip of 45°, which coincides well with the modeled geometry. The range is 70 m, with a nugget effect of 0.2. The variogram is shown in Figure 21 below.
- GeoVista AB - - GVR 14002-
30
Figure 21: Variogram for Hugget.
The distribution of samples from Kalvgruvan, Flygruvan and Sandell is not such that it permits the development of reasonable variography, the results from Hugget were therefore applied for these mineralisations as well.
11.6 Estimation parameters and search distances The search ellipses were oriented along the strike and dip indicated by the variography, N50°E, and a dip of 45°. The mineralisations have a tendency to flatten at depth, the dip was therefore changed to 35° below the 450m level. Search radius for the first pass of interpolation was set to 50m, requiring a minimum of 3 composites from at least 2 drillholes. The radius was gradually increased for each consecutive pass of interpolation. Details of search parameters are given in Table 3: Search parameters for block model interpolation..
Search radius Minimum no. samples
Maximum no. samples
Maximum no. per hole
Pass 1 50 3 15 2
Pass 2 100 3 15 2
Pass 3 200 3 15 2
Pass 4 250 1 15 --
Table 3: Search parameters for block model interpolation.
11.7 Block model
- GeoVista AB - - GVR 14002-
31
The block model for Blötberget uses regularly shaped block measuring 20 * 5 * 20 m (length * width * height), sub-blocking down to ¼ side length has been used. These block dimensions are considered to be the most appropriate, considering the morphology of the mineralization and the density of information from diamond drilling, in particular in the upper parts. It is recognized that the density of information in the deeper parts of the deposits is lower, which probably would justify a larger block size at depth. The block model is rotated to the same strike as the mineralization, N50°E.
Block grades were interpolated for the parent block and carried over to sub-blocks.
Grades were interpolated for Fe and P. The specific gravity, SG, was assigned to each block with the help of a regression formula based on the interpolated grade of Fe.
The block model has been depleted for historical mining activities.
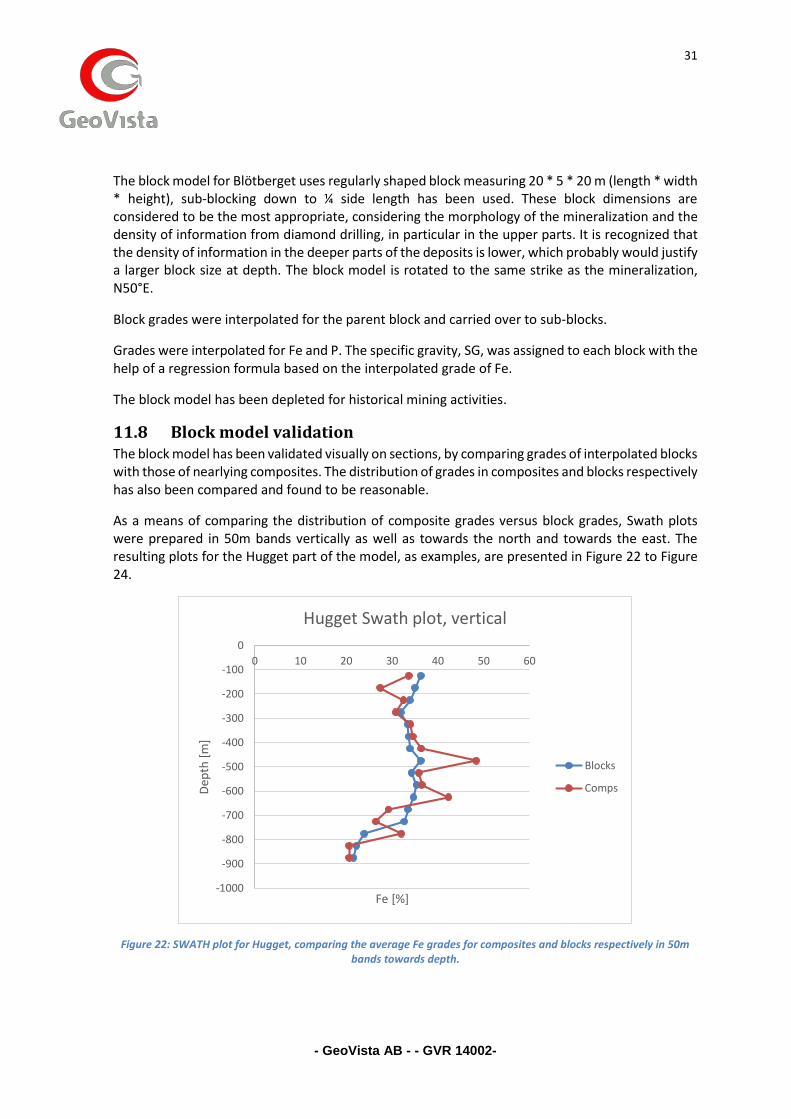
11.8 Block model validation The block model has been validated visually on sections, by comparing grades of interpolated blocks with those of nearlying composites. The distribution of grades in composites and blocks respectively has also been compared and found to be reasonable.
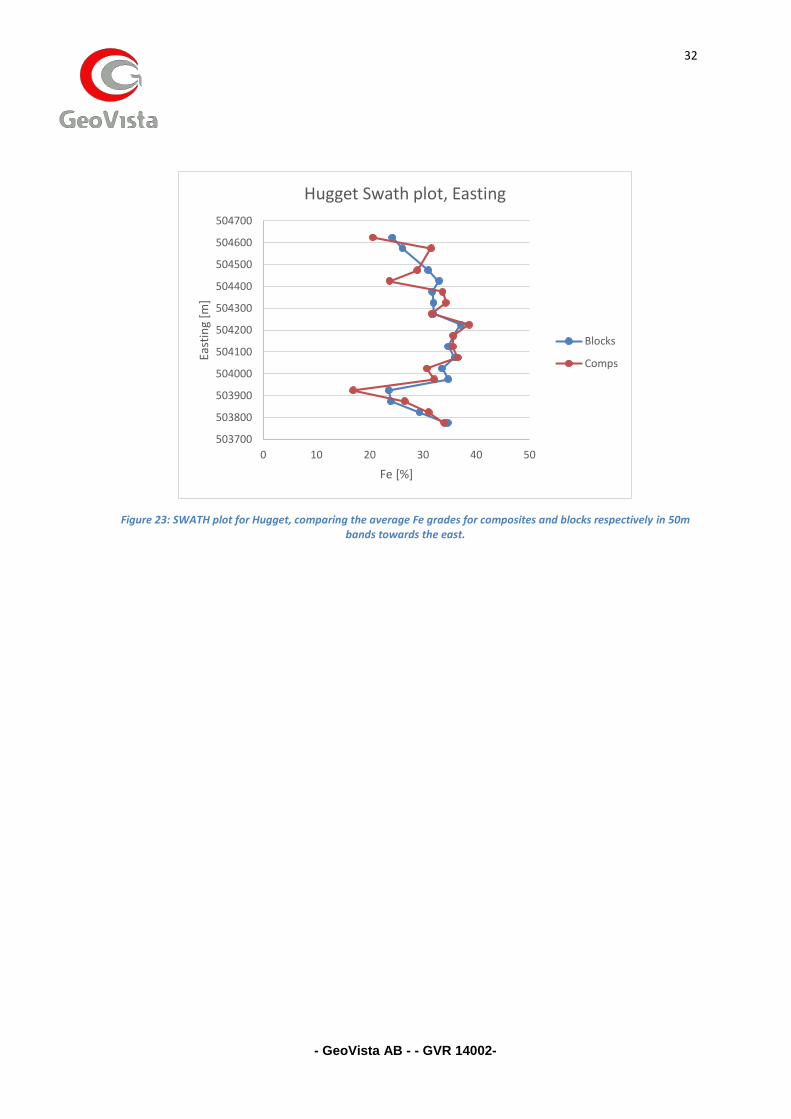
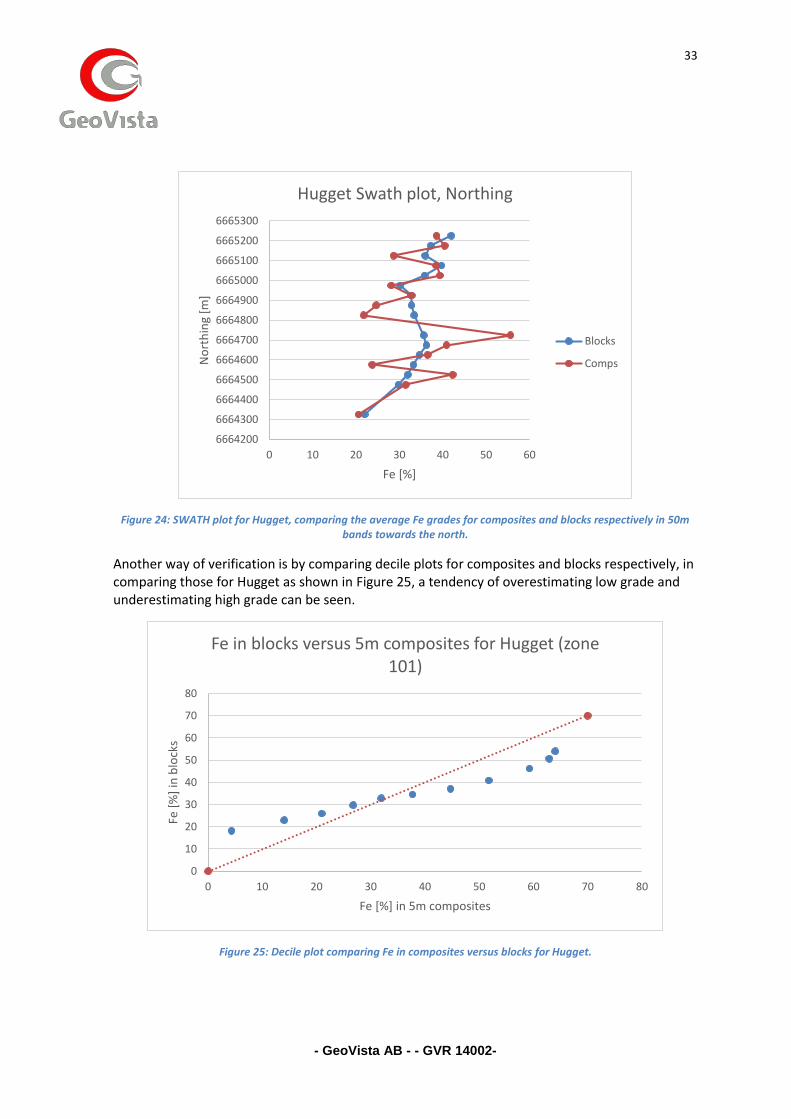
As a means of comparing the distribution of composite grades versus block grades, Swath plots were prepared in 50m bands vertically as well as towards the north and towards the east. The resulting plots for the Hugget part of the model, as examples, are presented in Figure 22 to Figure 24.
Figure 22: SWATH plot for Hugget, comparing the average Fe grades for composites and blocks respectively in 50m bands towards depth.
-1000
-900
-800
-700
-600
-500
-400
-300
-200
-100
0
0 10 20 30 40 50 60
Dep
th [
m]
Fe [%]
Hugget Swath plot, vertical
Blocks
Comps
- GeoVista AB - - GVR 14002-
32
Figure 23: SWATH plot for Hugget, comparing the average Fe grades for composites and blocks respectively in 50m bands towards the east.
503700
503800
503900
504000
504100
504200
504300
504400
504500
504600
504700
0 10 20 30 40 50
East
ing
[m]
Fe [%]
Hugget Swath plot, Easting
Blocks
Comps
- GeoVista AB - - GVR 14002-
33
Figure 24: SWATH plot for Hugget, comparing the average Fe grades for composites and blocks respectively in 50m bands towards the north.
Another way of verification is by comparing decile plots for composites and blocks respectively, in comparing those for Hugget as shown in Figure 25, a tendency of overestimating low grade and underestimating high grade can be seen.
Figure 25: Decile plot comparing Fe in composites versus blocks for Hugget.
6664200
6664300
6664400
6664500
6664600
6664700
6664800
6664900
6665000
6665100
6665200
6665300
0 10 20 30 40 50 60
No
rth
ing
[m]
Fe [%]
Hugget Swath plot, Northing
Blocks
Comps
0
10
20
30
40
50
60
70
80
0 10 20 30 40 50 60 70 80
Fe [
%]
in b
lock
s
Fe [%] in 5m composites
Fe in blocks versus 5m composites for Hugget (zone 101)
- GeoVista AB - - GVR 14002-
34
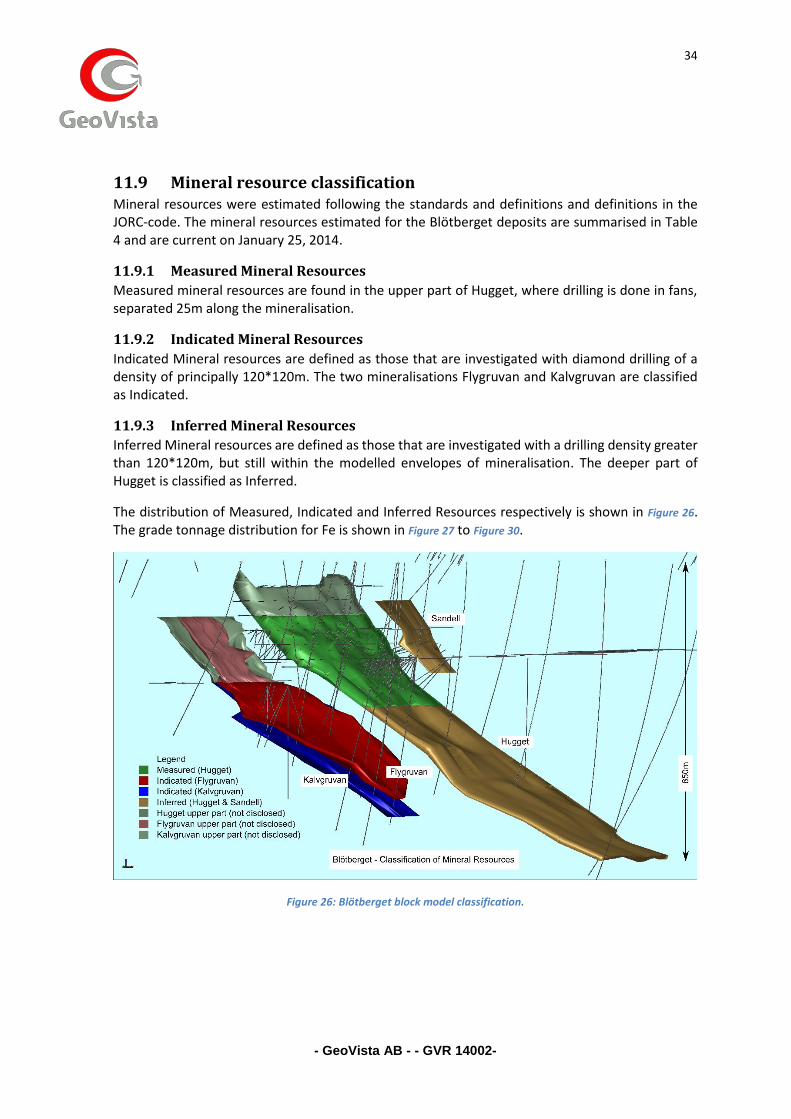
11.9 Mineral resource classification Mineral resources were estimated following the standards and definitions and definitions in the JORC-code. The mineral resources estimated for the Blötberget deposits are summarised in Table 4 and are current on January 25, 2014.
11.9.1 Measured Mineral Resources
Measured mineral resources are found in the upper part of Hugget, where drilling is done in fans, separated 25m along the mineralisation.
11.9.2 Indicated Mineral Resources
Indicated Mineral resources are defined as those that are investigated with diamond drilling of a density of principally 120*120m. The two mineralisations Flygruvan and Kalvgruvan are classified as Indicated.
11.9.3 Inferred Mineral Resources
Inferred Mineral resources are defined as those that are investigated with a drilling density greater than 120*120m, but still within the modelled envelopes of mineralisation. The deeper part of Hugget is classified as Inferred.
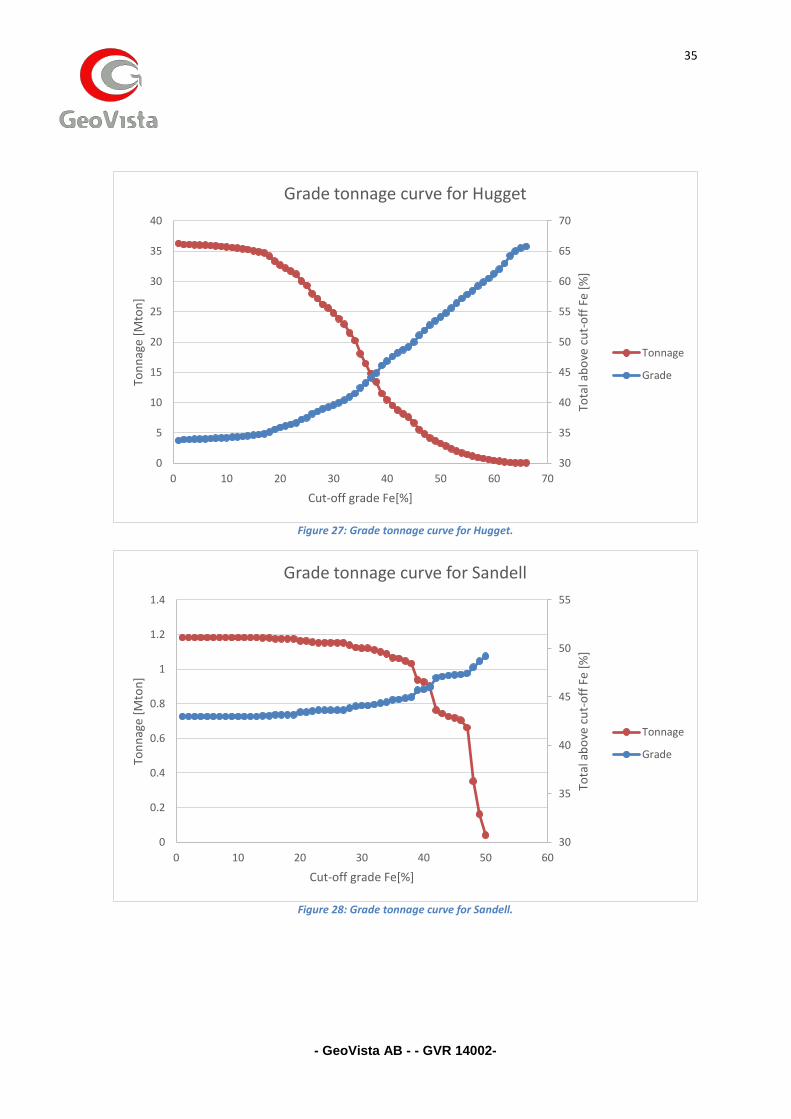
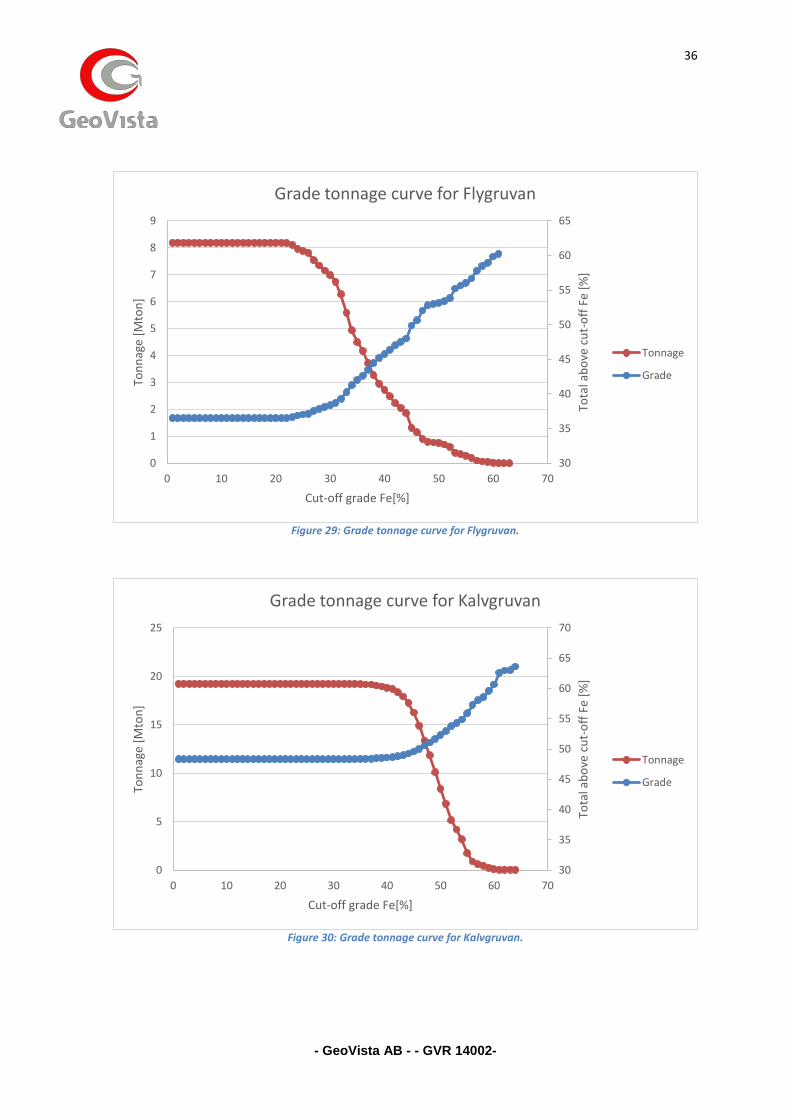
The distribution of Measured, Indicated and Inferred Resources respectively is shown in Figure 26. The grade tonnage distribution for Fe is shown in Figure 27 to Figure 30.
Figure 26: Blötberget block model classification.
- GeoVista AB - - GVR 14002-
35
Figure 27: Grade tonnage curve for Hugget.
Figure 28: Grade tonnage curve for Sandell.
30
35
40
45
50
55
60
65
70
0
5
10
15
20
25
30
35
40
0 10 20 30 40 50 60 70
Tota
l ab
ove
cu
t-o
ff F
e [%
]
Ton
nag
e [M
ton
]
Cut-off grade Fe[%]
Grade tonnage curve for Hugget
Tonnage
Grade
30
35
40
45
50
55
0
0.2
0.4
0.6
0.8
1
1.2
1.4
0 10 20 30 40 50 60
Tota
l ab
ove
cu
t-o
ff F
e [%
]
Ton
nag
e [M
ton
]
Cut-off grade Fe[%]
Grade tonnage curve for Sandell
Tonnage
Grade
- GeoVista AB - - GVR 14002-
36
Figure 29: Grade tonnage curve for Flygruvan.
Figure 30: Grade tonnage curve for Kalvgruvan.
30
35
40
45
50
55
60
65
0
1
2
3
4
5
6
7
8
9
0 10 20 30 40 50 60 70
Tota
l ab
ove
cu
t-o
ff F
e [%
]
Ton
nag
e [M
ton
]
Cut-off grade Fe[%]
Grade tonnage curve for Flygruvan
Tonnage
Grade
30
35
40
45
50
55
60
65
70
0
5
10
15
20
25
0 10 20 30 40 50 60 70
Tota
l ab
ove
cu
t-o
ff F
e [%
]
Ton
nag
e [M
ton
]
Cut-off grade Fe[%]
Grade tonnage curve for Kalvgruvan
Tonnage
Grade

- GeoVista AB - - GVR 14002-
37
11.10 Mineral resource estimate The mineral resources are current on January 25th, 2014.
GeoVista has considered the technical and economic criteria used to establish a reasonable cut-off for reporting, in order to comply with requirement of having reasonable prospects for economic extraction.
A cut-off grade as well as a marginal cut-off grade have been developed based on the data presented in table 4.
Item Cost/revenue
Mining including development 22.9 USD/ton conc
Of which direct mining costs are 14.3 USD/ton conc
Crushing, hauling and hoisting 2.0 USD/ton conc
Milling 10.0 USD/ton conc
Transport 9.9 USD/ton conc
Product price
(Based on 67% Fe content) 120.0 USD/ton conc
=1.79 USD/ton and % Fe Table 4: Basic assumptions for cut-off calculations.
The mineral resources at Blötberget thus total 10.7 Mtonnes with 34.3% Fe in the Measured category and 27.4 Mton with 44.8% Fe in the Indicated category resulting in a global resource of 38.1 Mton with 41.9% Fe. In addition there are 21.7 Mton with 33.0% Fe in the Inferred category. Details are presented in Table 5.
The wedge shaped area in between Flygruvan and Hugget is considered to be an Exploration target, currently estimated to contain some 9-10.5 Mton with 39-43% Fe.
Hugget Sandell Flygruvan Kalvgruvan Global
Mton Fe [%]
P [%]
Mton Fe [%]
P [%]
Mton Fe [%]
P [%]
Mton Fe [%]
P [%]
Mton Fe [%]
P [%]
Measured 10.7 34.3 0.3 10.7 34.3 0.3
Indicated 8.2 36.5 0.4 19.2 48.3 0.5 27.4 44.8 0.5
Meas+Ind 38.1 41.9 0.4
Inferred 20.8 32.55 0.38 0.9 43.14 0.81 21.7 33.0 0.4
Table 5: Mineral resources for Blötberget, effective on January 25, 2014.
11.11 Mineral resource discussion It is clear that the interpolated grades of Fe and P in the block model are affected by the sometimes lacking assays in the historical material. Substitution of lacking Fe with 0 grade will lead to an underestimated grade, while the the non-substitution of lacking P grades will lead to an overestimated grade. This is expected to improve as more historical core is recovered and re-assayed.
- GeoVista AB - - GVR 14002-
38
12 Mineral reserve estimates Since no pre-feasibility or feasibility study has been completed to date on the Blötberget deposits, no conversion of Resources to Reserves can be done at this stage.
The conversion of resources to reserves will be considered during the final stages of the Feasibility Study in preparation.
13 Adjacent properties In the vicinities of Ludvika there are several historical, abandoned iron ore mines besides Blötberget and Håksberg, Grängesberg, Idkerberget Tuna-Hästberg and Lekomberga being the most important, see section 7 in this report. All of these have remaining unmined resources that can be investigated and eventually developed.
14 Other relevant data and information Mining in the general area of Blötberget has been on-going from at least the early 17th century up until 1979, restarting these activities is not considered likely to meet much opposition, the local support is good.
15 Conclusions A lot of effort has been put into the verification of historical data. This has been done, in part, by re-logging and re-assaying historical core with excellent results. The historical mine maps have also been digitized and show an excellent correlation with the information from the drill holes.
Additional core from yet some 55 historical holes has been discovered recently, totaling some 3500m, they are currently being processed. Already several significant and previously unassayed sections of mineralized material have been noted. It is expected that the results from these holes will strengthen the interpretation of the Blötberget iron ore field further.
Hugget is well investigated by drilling down to the -450m level and the mineral resource is classified as measured, below this it is inferred down to the -875m level. The possibilities to convert these resources to indicated are considered to be good.
The wedgeshaped area in between Flygruvan/Kalvgruvan on side and Hugget on the other is not explored with drilling. However, information from drifting, found on the mine maps, indicates that Flygruvan and Hugget are connected and actually belong to one and the same mineralization, and that the Kalvgruvan mineralization also exists in the footwall of Hugget.
The exploration potential in the area between the two mines, as well as the possibilities of converting the inferred resources located in the intermediate depth of Hugget is considered to be such that a relatively small drilling program, for a total of approximately 6000m, will add significantly to the mineral resources.
- GeoVista AB - - GVR 14002-
39
16 Recommendations The deposits are still considered to be open at depth. There are no barren holes in the downdip direction that would indicate their ending. It is, however, not recommended to spend funds in investigating these deeper parts in the current phase of project development, since mining of any tonnage there is not likely to be done in the short time span. However, the wedge shaped area in between the Flygruvan/Kalvgruvan and Hugget/Betsta mines is considered likely to be mineralized based on geological interpretation. A drill program to investigate that part of Blötberget is therefore recommended. Additional tonnage, if confirmed in this part, would be very likely to improve the project economy due to more efficient mining, in addition to being accessible for mining earlier on in the mine plan.
The Hugget mineralization, below the part currently well investigated by drilling, is classified as inferred. A series of drillholes, aiming at conversion of these inferred resources to indicated or better is recommended.
A program comprising 12 holes, for a total of some 6,000 m has been planned to investigate the wedge and Hugget below the 450m level, to convert the inferred resources to indicated.
The proposed drill program is presented in detail, showing the expected yield of each hole, in a separate document in the form of a PowerPoint presentation.
17 References
Lindstrand O., et al, 2011. Ludvika Mines preliminary economic asessmet. Ramböll Sverige AB, Project no 613Q1144656000.
Lindholm T., Blötberget and Håksberg mineral resource verification. GeoVista AB GVR11046.
Lindholm T., Ludvika Mines – Mineral resource update. GeoVista AB GVPM13001.
Lindholm T., NIO Quality manual 2013-02-08. GeoVista AB GVR12043. Lindholm T., Blötberget – proposed infill drill program, spring 2014. GeoVista AB, March 2014. Olsson L., Magnetometermätningar Blötberget November 2009. Kopparberg Mineral AB, 2010.
- GeoVista AB - - GVR 14002-
40
18 Certificate of qualified person I, Thomas Lindholm, M.Sc., as the principal author of this report entitled “Technical Report: Blötberget - Mineral Resource estimate” prepared for Nordic Iron Ore AB and dated January 25, 2014, do hereby certify that:
1. I am a Senior Mining Engineer, employed byGeoVista AB, Luleå, Sweden. 2. I am a graduate of Luleå University of Technology, Luleå Sweden, 1982, with a Master of
Science degree in Exploration and Mining Engineering. 3. I am a Fellow of the Australasian Institure of Mining and Metallurgy, AusIMM (# 230476). I
have worked as an engineer in mineral exploration and mining for 31 years since my graduation.
4. My relevant experience for the purpose of this Technical Report is Mineral Resource estimation work and reporting on numerous mining and exploration projects. I have sufficient experience of the style of mineralization and type of deposit under consideration and to the activity being undertaken to qualify as a Competent Person as defined in the 2012 edition of the “Australasian Code for Reporting of Exploration Results, Mineral Resources and Ore Reserves”.
5. I have read the definition of "qualified person" set out in the JORC code, and certify that by reason of my education, affiliation with a recognized professional association (Fellow AusIMM) and past relevant work experience, I fulfill the requirements to be a "competent person" for the purposes of reporting on mineral resources.
6. I have visited the Blötberget mine camp on several instances, the latest during November 20th - 22nd, 2013.
7. I am responsible for the preparation of all items related to the mineral resource estimate of the Technical Report, the other sections related to background information have been prepared under my supervision.
8. I am independent of the Issuer, the sole remuneration for this report is based on a consultancy hourly fee.
9. As of the effective date of this Technical Report, to the best of my knowledge, information, and belief, the Technical Report contains all scientific and technical information that is required to be disclosed to make the technical report not misleading.
Dated this 25th day of January, 2014
Thomas Lindholm, M.Sc., FAusIMM