Embed Size (px)
Citation preview
IOCCP-JAMSTEC 2018 Inter calibration exercise
ISBN 978-4-901833-37-0
IOCCP-JAMSTEC 2018 Inter-laboratory Calibration Exercise of a Certified Reference Material for Nutrients in
Seawater Michio Aoyama, Mara Abad, Ana Aguilar-Islas, Muhamed Ashraf P, Kumiko Azetsu-Scott, Adil Bakir, Susan Becker, Alice Benoit-Cattin-Breton, Elisa Berdalet, Karin Björkman, Marguerite Blum, Elisabete de Santis Braga, Florian Caradec, Thierry Cariou, Vitor Gonsalez Chiozzini, Karine Collin, Laurent Coppola, Mike Crump, Minhan Dai, Anne Daniel, Clare Davis, Miriam E. Solis, Karen Edelvang, David Faber, Robinson Fidel, Linda Lunde Fonnes, Jerry Frank, Pauline Frew, Carolina Funkey, Roberto Gallia, Michele Giani, Thanos Gkritzalis, Annika Grage, Blair Greenan, Kjell Gundersen, Fuminori Hashihama, Victor F. Camacho Ibar, Jinyoung Jung, Sung Ho Kang, David Karl, Hiromi Kasai, Liz A. Kerrigan, Yoko Kiyomoto, Marc Knockaert, Taketoshi Kodama, Jun-Ho Koo, Martina Kralj, Rita Kramer, Nurit Kress, Silvie Lainela, Jesus Ledesma, Jolanta Lewandowska, Maria del Carmen Ávila López, Patricia López García, Kai-Uwe Ludwichowski, Claire Mahaffey, Frank Malien, Francesca Margiotta, Aristide Márquez, Edward W. Mawji, Trevor McCormack, Triona McGrath, Yoann Le Merrer, Jane Strømstad Møgster , Naoki Nagai, Hema Naik, Claire Normandeau, Hiroshi Ogawa, Sólveig Rósa Ólafsdóttir, Jan van Ooijen, Rodolfo Paranhos, Mi-OK Park, Koen Parmentier, Augusto Passarelli, Chris Payne, Olivier Pierre-Duplessix, Vasiliy Povazhnyi, Sarah-Ann Quesnel, Patrick Raimbault, Christine Rees, Robert Rember, Tae Keun Rho, Marc Ringuette, Emilie Diamond Riquier, Ana Rodriguez, Raymond Edward Roman, Casanova Rosero, E. Malcolm S. Woodward, Shu Saito, Daniel Schuller, Yael Segal, Jacob Silverman, Durita Sørensen, Colin A. Stedmon, Mark Stinchcombe, Jun Sun, Peter Thamer, Lidia Urbini, Doug Wallace, Pamela Walsham, Lifang Wang, Joanna Waniek, Hideki Yamamoto, Takeshi Yoshimura, Jia-Zhong Zhang
Japan Agency for Marine-Earth Science and Technology (JAMSTEC)
IOCCP Report Number 1/2018
August 2018
IOCCP-JAMSTEC 2018 Inter calibration exercise
Publisher
Japan Agency for Marine-Earth Science and Technology Yokosuka, 237-0061 Japan
August 2018
International Standard Book Number -13:
978-4-901833-37-0
IOCCP Report Number 1/2018

IOCCP-JAMSTEC 2018 Inter calibration exercise
IOCCP-JAMSTEC 2018 Inter calibration exercise
IOCCP-JAMSTEC 2018 Inter-laboratory Calibration Exercise of a Certified Reference Material for Nutrients in
Seawater
Michio Aoyama*1, Mara Abad2, Ana Aguilar-Islas3, Muhamed Ashraf P4, Kumiko Azetsu-Scott5, Adil Bakir6, Susan Becker7, Alice Benoit-Cattin-Breton8, Elisa Berdalet2, Karin Björkman9, Marguerite Blum10, Elisabete de Santis Braga11, Florian Caradec12, Thierry Cariou13, Vitor Gonsalez Chiozzini11, Karine Collin14, Laurent Coppola15, Mike Crump16, Minhan Dai17, Anne Daniel12, Clare Davis18, Miriam E. Solis19, Karen Edelvang20, David Faber21, Robinson Fidel22, Linda Lunde Fonnes23, Jerry Frank24, Pauline Frew25, Carolina Funkey9, Roberto Gallia26, Michele Giani27, Thanos Gkritzalis28, Annika Grage29, Blair Greenan5, Kjell Gundersen23, Fuminori Hashihama30, Victor F. Camacho Ibar31, Jinyoung Jung32, Sung Ho Kang32, David Karl9, Hiromi Kasai33, Liz A. Kerrigan34, Yoko Kiyomoto35, Marc Knockaert36, Taketoshi Kodama37, Jun-Ho Koo38, Martina Kralj27, Rita Kramer29, Nurit Kress39, Silvie Lainela40, Jesus Ledesma41, Jolanta Lewandowska42, Maria del Carmen Ávila López31, Patricia López García43, Kai-Uwe Ludwichowski44, Claire Mahaffey18, Frank Malien45, Francesca Margiotta26, Aristide Márquez46, Edward W. Mawji47, Trevor McCormack25, Triona McGrath48, Yoann Le Merrer14, Jane Strømstad Møgster 23, Naoki Nagai49, Hema Naik50, Claire Normandeau34, Hiroshi Ogawa51, Sólveig Rósa Ólafsdóttir8, Jan van Ooijen52, Rodolfo Paranhos53, Mi-OK Park54, Koen Parmentier36, Augusto Passarelli26, Chris Payne55, Olivier Pierre-Duplessix14, Vasiliy Povazhnyi56, Sarah-Ann Quesnel57, Patrick Raimbault58, Christine Rees59, Robert Rember3, Tae Keun Rho60, Marc Ringuette5, Emilie Diamond Riquier15, Ana Rodriguez61, Raymond Edward Roman62, Casanova Rosero22, E. Malcolm S. Woodward63, Shu Saito49, Daniel Schuller21, Yael Segal39, Jacob Silverman39, Durita Sørensen64, Colin A. Stedmon20, Mark Stinchcombe47, Jun Sun65, Peter Thamer5, Lidia Urbini27, Doug Wallace34, Pamela Walsham66, Lifang Wang17, Joanna Waniek67, Hideki Yamamoto68, Takeshi Yoshimura69, Jia-Zhong Zhang70
1 RCGC,JAMSTEC/IOCCP SSG/Co-chair of the SCOR WG#147/IER, Fukushima University, Japan
2 Institut de Ciències del Mar (ICM-CSIC), Barcelona, Spain
3 University of Alaska, Fairbanks, USA
4 ICAR-Central Institute of Fisheries Technology, Fishing Technology Division,India
5 Bedford Institute of Oceanography, Canada
6 Environmental Chemistry Analysis Laboratory (ECAL), University of Portsmouth,UK
7 Scripps Institution of Oceanography, USA
IOCCP-JAMSTEC 2018 Inter calibration exercise
8 Marine Research Institute, Iceland
9 University of Hawaii at Manoa, Dept. of Oceanography, USA
10 Monterey Bay Aquarium Research Institute, USA
11 Oceanographic Institute of the University of São Paulo, Brazil
12 Ifremer, DYNECO/PELAGOS, Plouzané, France
13 Station Biologique de Roscoff, Centre national de la recherche scientifique(CNRS) / Université Pierre et Marie Curie, France
14 IFREMER LERMPL, Nantes, FRANCE, France
15 Observatoire oceanologique de Villefranche-sur-Mer (CNRS-UPMC), France
16 National Institute of Water and Atmospheric Research (NIWA), New Zealand
17 Laboratory of Marine Environmental Science, Xiamen University, China
18 Department of Earth, Ocean and Ecological Sciences, SOES, University ofLiverpool, UK
19 LOQyCA – Centro para el estudio de los sistemas marinos (CONICET), Argentina
20 Technical University of Denmark, National Institute for Aquatic Resources(AQUA) , Denmark
21 Scripps Institution of Oceanography, CalCOFI Group, UC San Diego, USA
22 CENTRO DE INVESTIGACIONES OCEANOGRÁFICAS EHIDROGRÁFICAS DEL PACÍFICO (CCCP), Colombia
23 Institute of Marine Research, Norway
24 University of Maryland Center for Environmental Science, Chesapeake BiologicalLaboratory, Nutrient Analytical Services Laboratory, USA
25 Scottish Environment Protection Agency, UK
26 Stazione Zoologica Anton Dohrn, Italia
27 Istituto Nazionale di Oceanografia e Geofisica Sperimentale (OGS), Italy
28 Flanders Marine Institute, Belgium
29 Bundesamt für Seeschifffahrt und Hydrographie (BSH), Laboratorium Sülldorf,Germany
30 Tokyo University of Marine Science and Technology, Japan
31 Instituto de Investigaciones Oceanológicas, Universidad Autónoma de BajaCalifornia, USA
32 Korea Polar Research Institute, Republic of Korea
IOCCP-JAMSTEC 2018 Inter calibration exercise
33 Hokkaido National Fisheries Research Institute, Japan Fisheries Research andEducation Agency, Japan
34 Dalhousie University in Halifax, Canada
35 Seikai National Fisheries Research Institute, Japan Fisheries Research andEducation Agency, Japan
36 OD NATURE – ECOCHEM, Belgium
37 Japan Sea National Fisheries Research Institute, Japan Fisheries Research andEducation Agency, Japan
38 National Institute of Fisheries Science (NIFS), Republic of Korea
39 Israel Oceanographic & Limnological Res., National Institute of Oceanography,Israel
40 Estonian Marine Institute of Tartu University, Estonia
41 Instituto del Mar del Perú, Peru
42 Institute of Oceanology Polish Academy of Sciences, Marine Chemistry andBiochemistry Department, Poland
43 Plataforma Oceánica de Canarias (PLOCAN) - Oceanic Platform of the CanaryIslands, Spain
44 Alfred-Wegener-Institute Bremerhaven, Germany
45 GEOMAR Helmholtz Center for Ocean Research, Kiel, Germany
46 Oriente University, Oceanographic Institute of Venezuela, Departament ofOceanography. Laboratory of nutritious elements, Venezuela
47 National Oceanography Centre, Southampton, UK
48 The Marine Institute, Ireland
49 Marine Division, Global Environment and Marine Department, JapanMeteorological Agency, Japan
50 National Institute of Oceanography, India
51 Atmosphere and ocean research institute, the University of Tokyo, Japan
52 Royal NIOZ, Netherlands
53 Institute of Biology, Rio de Janeiro Federal University (UFRJ), Brazil
54 Marine Environment Analysis CenterKorea Marine Environment management Corporation (KOEM), Republic of Korea
55 University of British Columbia, Department of Earth, Ocean & AtmosphericSciences, Canada
56 Arctic and Antarctic Research Institute, Russia
57 Institute of Ocean Sciences, Fisheries and Oceans Canada, Canada
IOCCP-JAMSTEC 2018 Inter calibration exercise
58 The National Center for Scientific Research (CNRS), Mediterranean Institute ofOceanology (MIO), France
59 CSIRO, Oceans and Atmosphere, Australia
60 KIOST (Korea Institute of Ocean Science & Technology), Republic of Korea
61 INSTITUTO OCEANOGRÁFICO DE LA ARMADA (INOCAR), Ecuador
62 University of Cape town, Dept. of Oceanography, South Africa
63 Plymouth Marine Laboratory, UK
64 Faroe Marine Research Institute, Faroe Islands
65 College of Marine and Environmental Sciences, Tianjin University of Science andTechnology, China
66 Marine Scotland - Science, UK
67 Leibniz Institut für Ostseeforschung Warnemünde, Germany
68 Research Promotion Group, Mutsu Institute for Oceanography, JAMSTEC, Japan
69 Graduate School of Environmental Science, Hokkaido University, Japan
70 NOAA Atlantic Oceanographic and Meteorological Laboratory (AOML), Miami,Florida, USA
*The coordinator

IOCCP-JAMSTEC 2018 Inter calibration exercise
IOCCP-JAMSTEC 2018 Inter-calibration exercise
Preface
Inorganic nutrient concentrations in seawater are a fundamental component of marine ecosystems, and have been identified collectively as one of the Essential Ocean Variables. The ability to measure the concentrations of nitrate, nitrite, phosphate, silicic acid, and ammonium with a high degree of certainty is vital when addressing global questions such as “How are eutrophication and pollution impacting ocean productivity and water quality?”, and “How are changing global conditions affecting the bio-availability of macronutrients”, as well as local questions, such as “How is agricultural run-off affecting this particular bay?” However, the usability of the nutrient concentrations has suffered from the lack of comparability of data collected in different locations and times by the same or different analysts.
It is important therefore that the ability of the international science community to conduct the analyses used to answer such questions is rigorously assessed, and recommendations made where required for improved performance, methodology, and standardisation.
We therefore congratulate Prof. Michio Aoyama and the team for leading the IOCCP—JAMSTEC 2017-2018 Inter-laboratory Comparison Exercise, and the 71 laboratories that participated in this 6th Intercomparison Exercise. It is heartening to see that most of these laboratories are able to analyse nutrient concentrations within the certified uncertainty of the unknowns provided. The recommendations included in this report provide guidance for increasing the ability of the global community to answer questions about the changing marine macronutrient environment.
Kim Currie, Co-Chair of IOCCP National Institute of Water and Atmospheric Research,University of Otago Research Centre for OceanographyUnion Place West,Dunedin 9054, New Zealand
i
Masao Ishii, Co-Chair of IOCCP Oceanography and Geochemistry Research Department,Meteorological Research Institute,Japan Meteorological AgencyNagamine 1-1, Tsukuba,305-0052, Japan

IOCCP-JAMSTEC 2018 Inter-calibration exercise
IOCCP-JAMSTEC 2018 Inter-calibration exercise
Abstract
In 2017, the International Ocean Carbon Coordination Project (IOCCP) and the Japan Agency for Marine-Earth Science and Technology (JAMSTEC) decided to conduct the 6th International Inter-Calibration Exercise, the “2017/18 inter-laboratory comparison exercise of Certified Reference Materials of Nutrients in Seawater, CRM”. As was the case with the previous four inter-comparison (IC) studies organized by MRI-JMA and the previous IOCCCP-JAMSTEC IC exercise in 2015, the aim of this IC exercise was to improve the level of comparability by exchanging knowledge among participating laboratories. The scale of the study was expanded. One hundred seven laboratories in 33 countries across five continents received a letter of invitation to the IC exercise, and 71 laboratories in 30 counties agreed to participate in this IC exercise. Results were returned from 69 laboratories in 30 countries. The data were statistically analyzed, and the results are described in this report.
The agreement between consensus median/mean and certified values was within uncertainty for all five samples used in this IC exercise. Only small discrepancies existed among core laboratories that reported close-to-consensus values and certified values.
Normalized cumulative distributions for nitrate and phosphate obtained in 2018 were better (i.e., flatter) than the normalized cumulative distributions obtained from previous IC exercises conducted in 2008, 2012, and 2015. The indication is that comparability of nitrate and phosphate analysis among the laboratories has gradually improved from 2008 to 2018. In contrast with the nitrate and phosphate results, the normalized cumulative distribution for silicate obtained in 2018 was similar to the distributions in previous years. The indication is that comparability of silicate analysis among the laboratories has not changed during these years.
The results of this IC exercise also showed that nonlinearity of the calibration curves for the nutrient analyses in each laboratory is still a significant source of reduced comparability of nutrient data. Analysis of ranked scatter plots led to this conclusion. The implication is that we need to use a set of nutrient CRMs, the concentrations of which cover the whole range of nutrient concentrations in the world’s oceans to maintain comparability of results.
Thirty-eight laboratories among 69 laboratories used a CRM/RM. The remaining 31 laboratories did not use a CRM/RM or did not reply to the questionnaire. It is obvious that the number of the laboratories that use CRMs has been increasing since 2008. In general, the reported results from laboratories that used CRMs were located in the central part of the ranked plots and showed good Z-scores, as expected. The results of this IC exercise imply that the majority of the participating laboratories are very capable of measuring nutrient concentrations in seawater, and using CRMs will further increase the comparability of results. The results may be SI traceable in the near future.
iii

IOCCP-JAMSTEC 2018 Inter calibration exercise
IOCCP-JAMSTEC 2018 Inter-calibration exercise
Contents
1. Introduction ................................................................................................................... 12. Preparation and samples sent to the participants ........................................................... 33. Participants and response............................................................................................... 54. Statistical analyses ......................................................................................................... 7
4.1 Raw mean, median, and standard deviation .......................................................... 7
4.2 Robust statistics ..................................................................................................... 7
4.3 Consensus mean, median, and standard deviation ................................................. 7
4.4 Calculation of Z-scores .......................................................................................... 7
5. Results 115.1 Ranked scatter-plots of the results ....................................................................... 11
5.2 Consensus means, medians, and standard deviations .......................................... 17
5.3 Summary of analytical precision of participating laboratories and consensus standard deviations ............................................................................................. 18
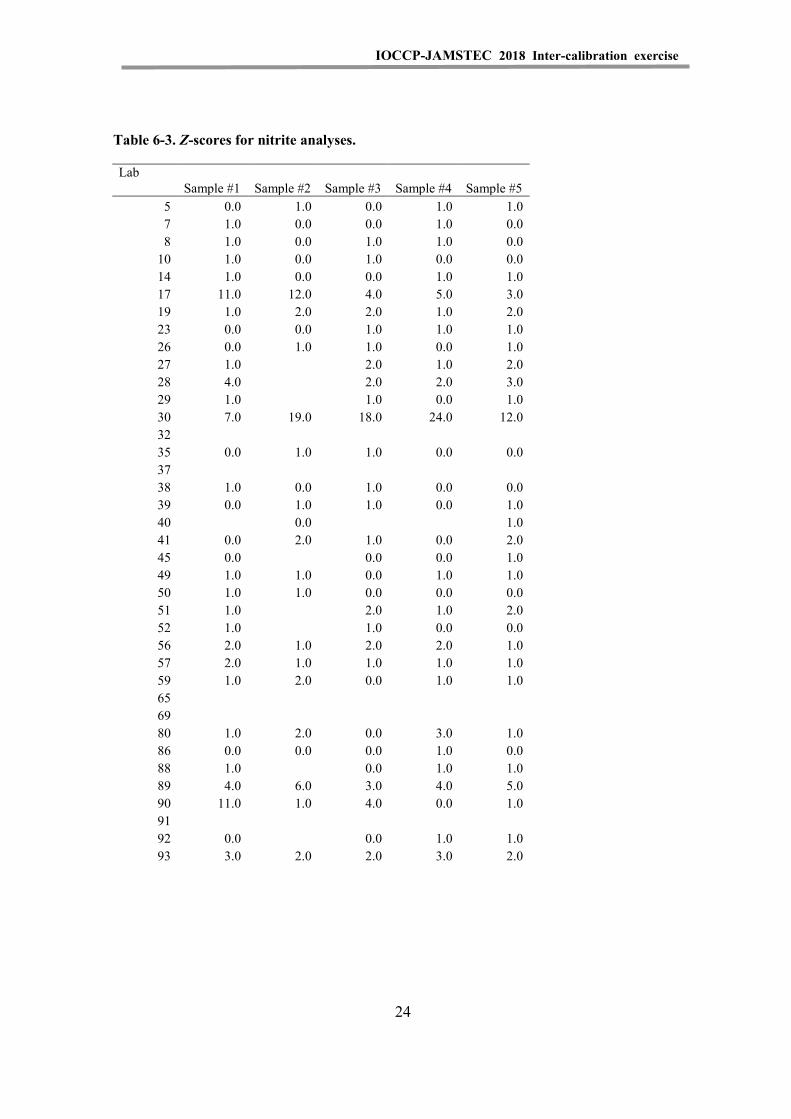
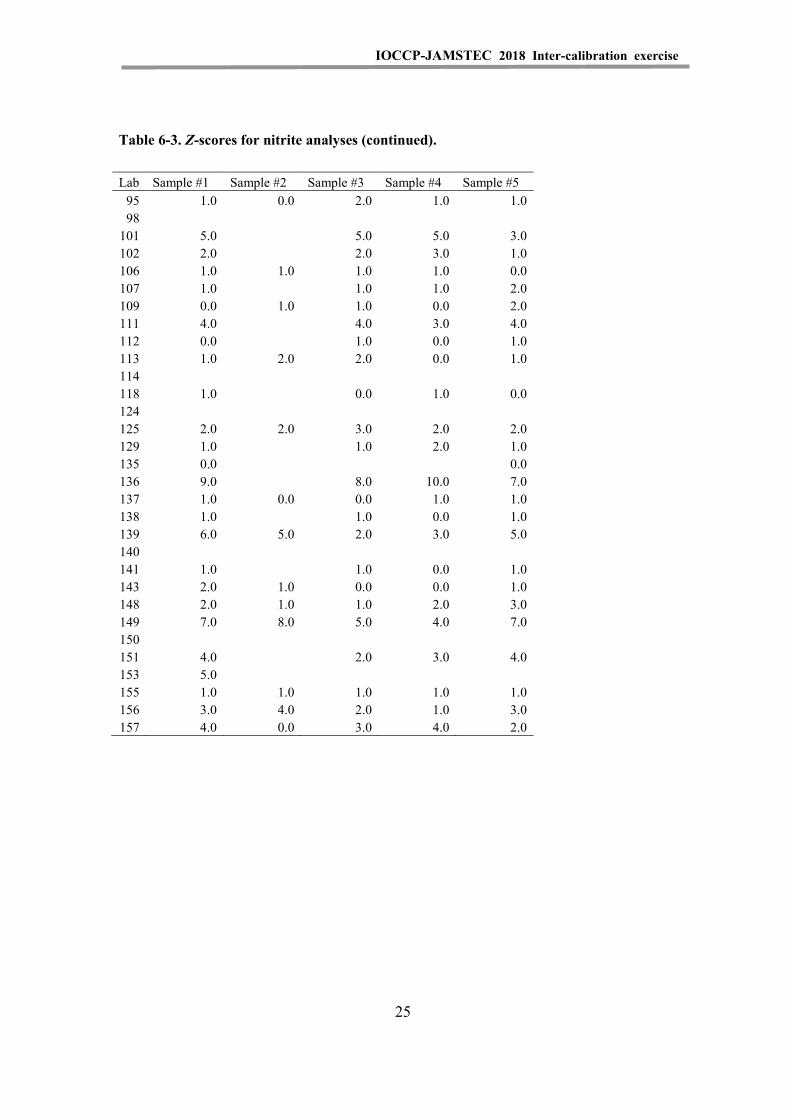
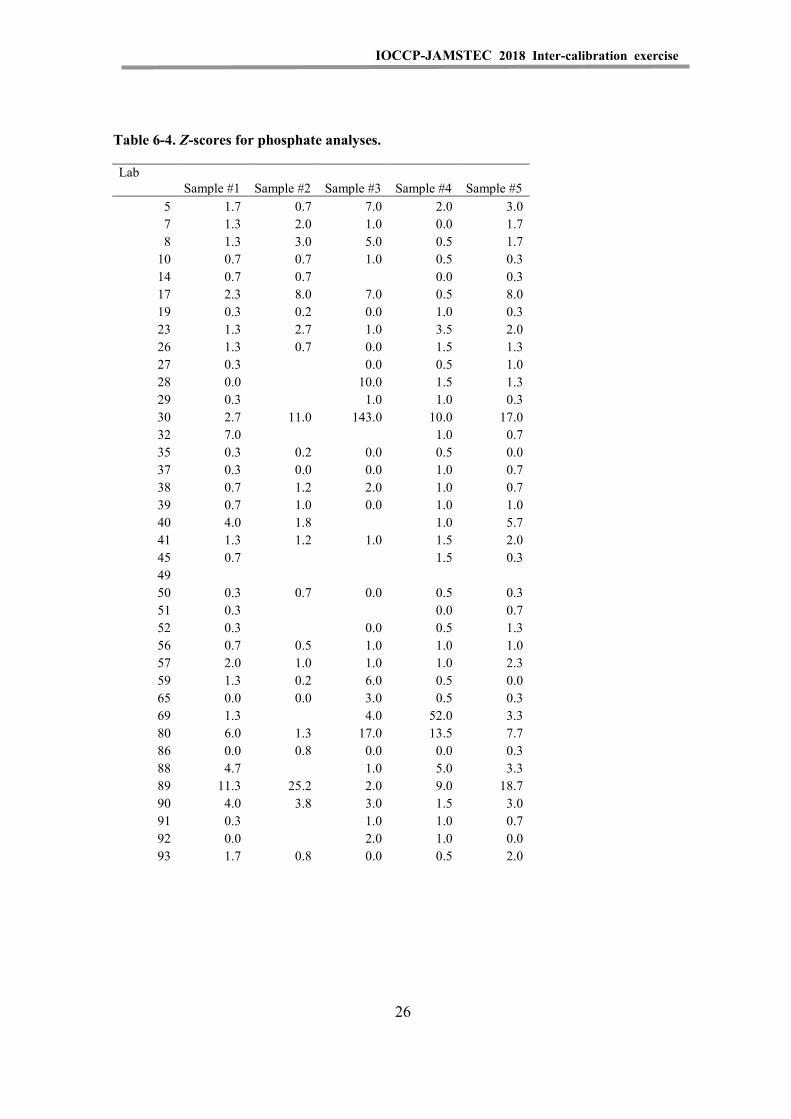
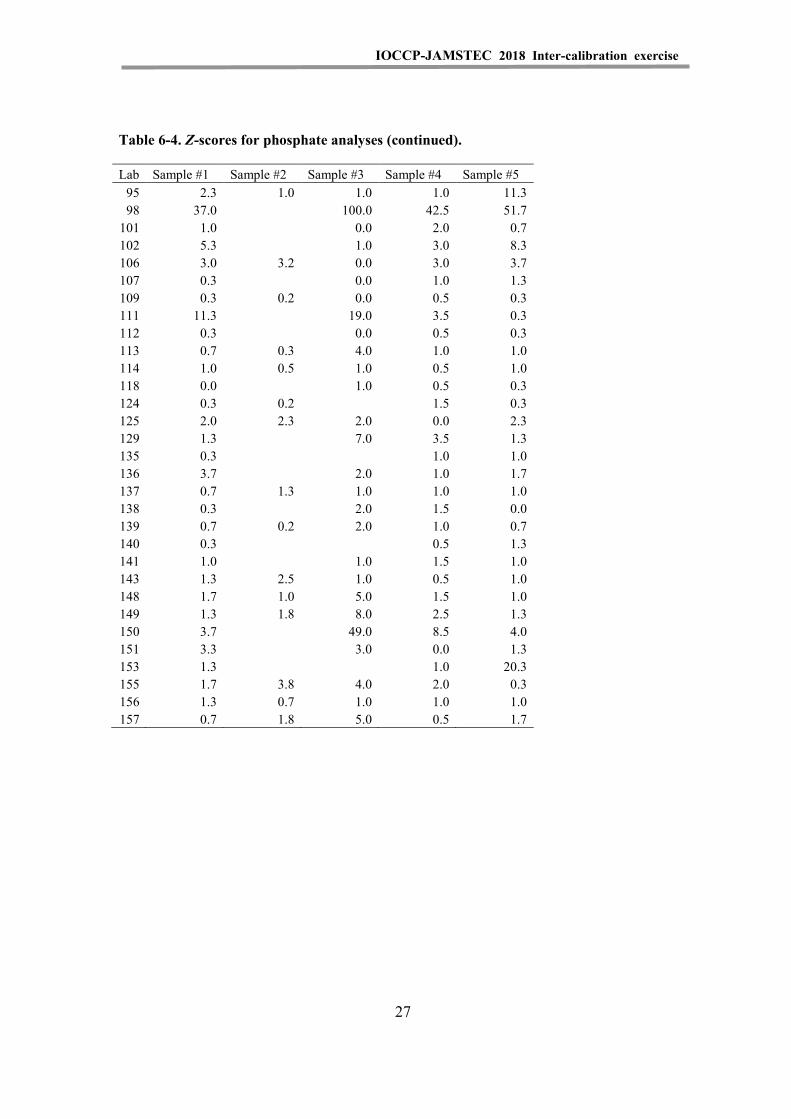
5.4 Z-scores ................................................................................................................ 19
5.5 Normalized cumulative distributions of reported nitrate, phosphate, and silicate concentrations in the 2008, 2012, 2015, and 2018 I/C studies ............... 34
6. Comparison with certified values and current status of CRM use .............................. 387. Discussion and conclusions ......................................................................................... 38Acknowledgements ......................................................................................................... 39 References ....................................................................................................................... 40 Abstract 45
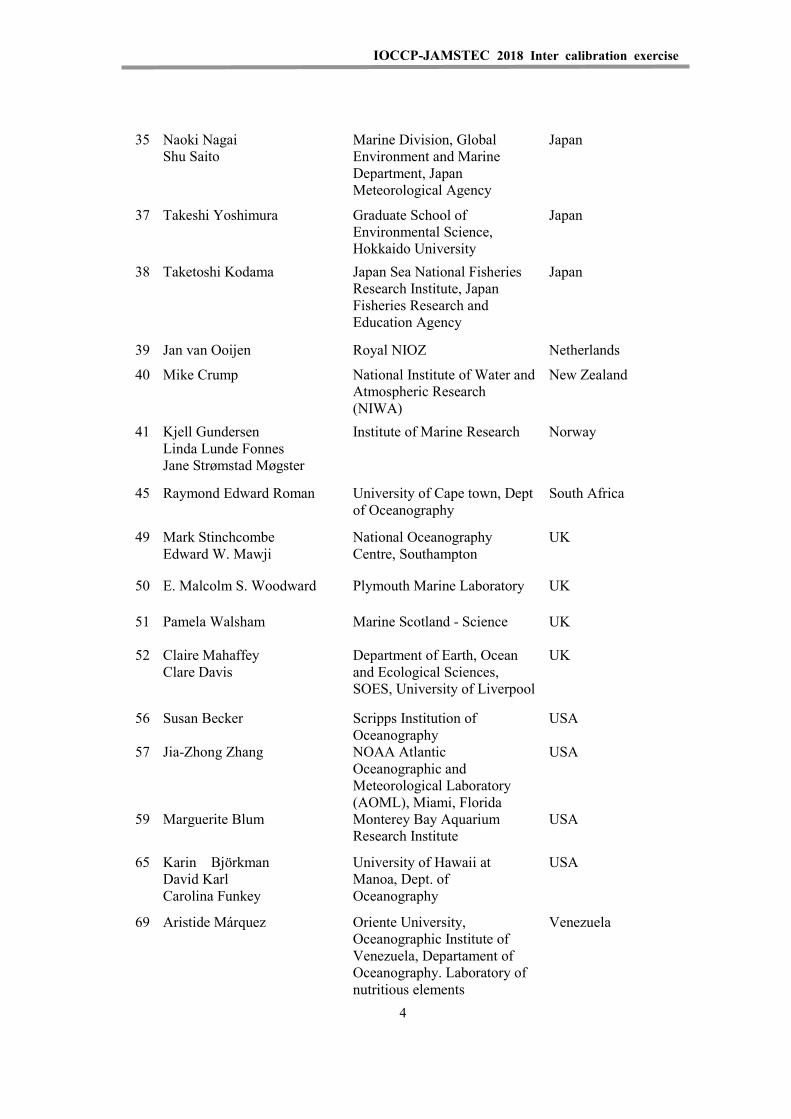
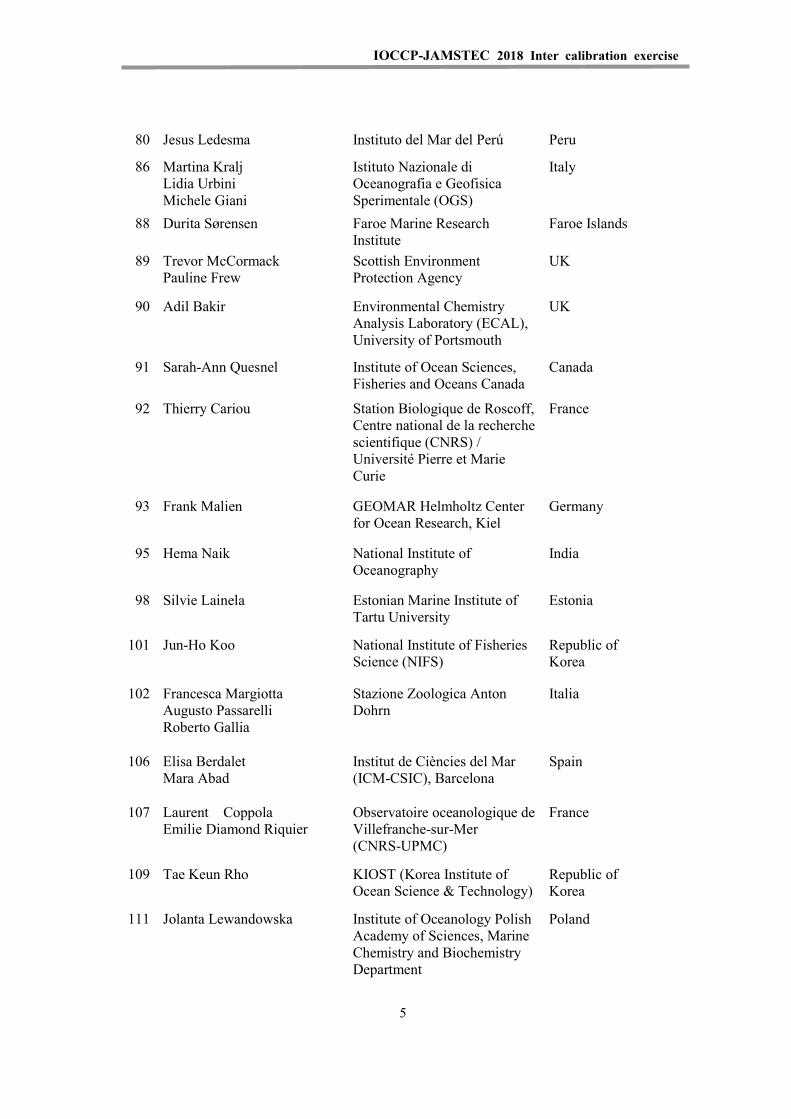
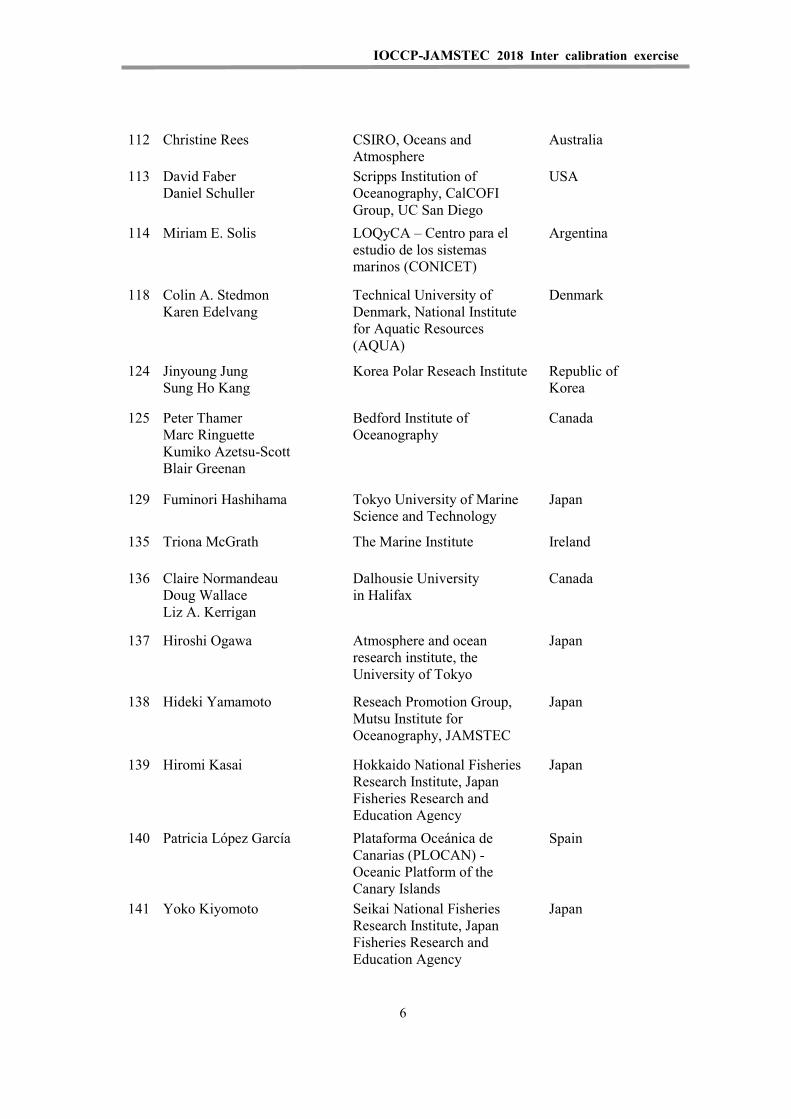
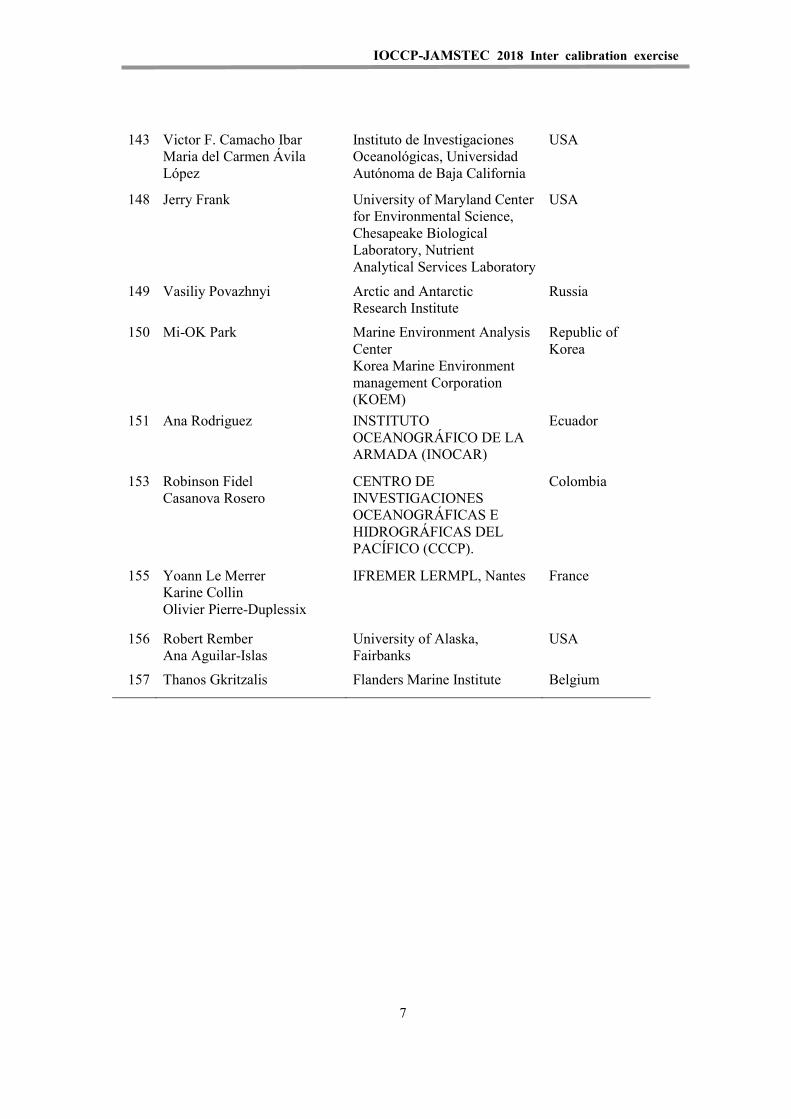
Appendix I List of participants
Appendix II Results reported from participants
Appendix III Cross-referenced table of ranked order and lab number
Appendix IV Invitation letter to 2015 I/C exercise
Appendix V Results of KIOST RMs
Appendix VI History of the inter-comparison studies
v
IOCCP-JAMSTEC 2018 Inter-calibration exercise
List of Tables and Figures
Tables
Table 1. Certified values of the five samples of CRM used in this IC exercise. ............... 4 Table 2. Summary of responses from participants. ........................................................... 5 Table 2. Summary of responses from participants (continued). ........................................ 6 Table 3. Raw and robust* statistics for nutrient concentrations calculated using
all reported values. ............................................................................................. 9
Table 4. Consensus means, medians, and standard deviations, and certified values and uncertainties of five samples. ........................................................ 17
Table 5. Median and range of analytical precision of participating laboratories, and consensus coefficient of variation for nutrient analyses of all samples. ........................................................................................................... 18
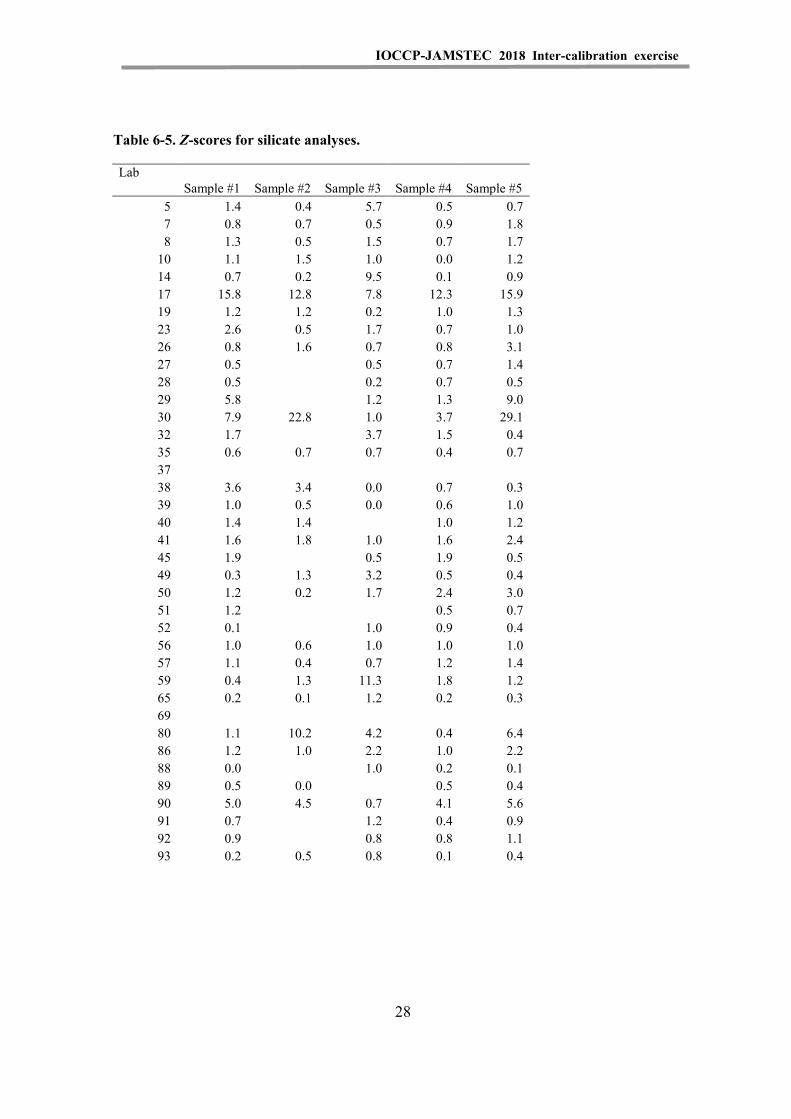
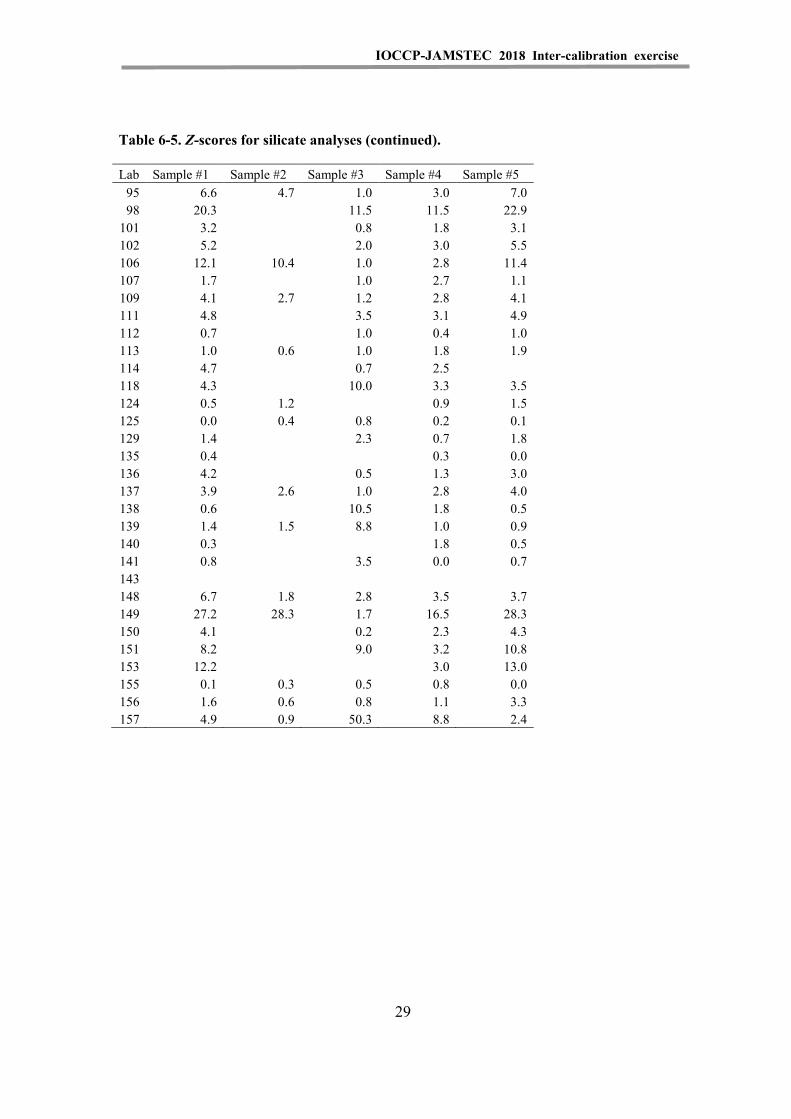
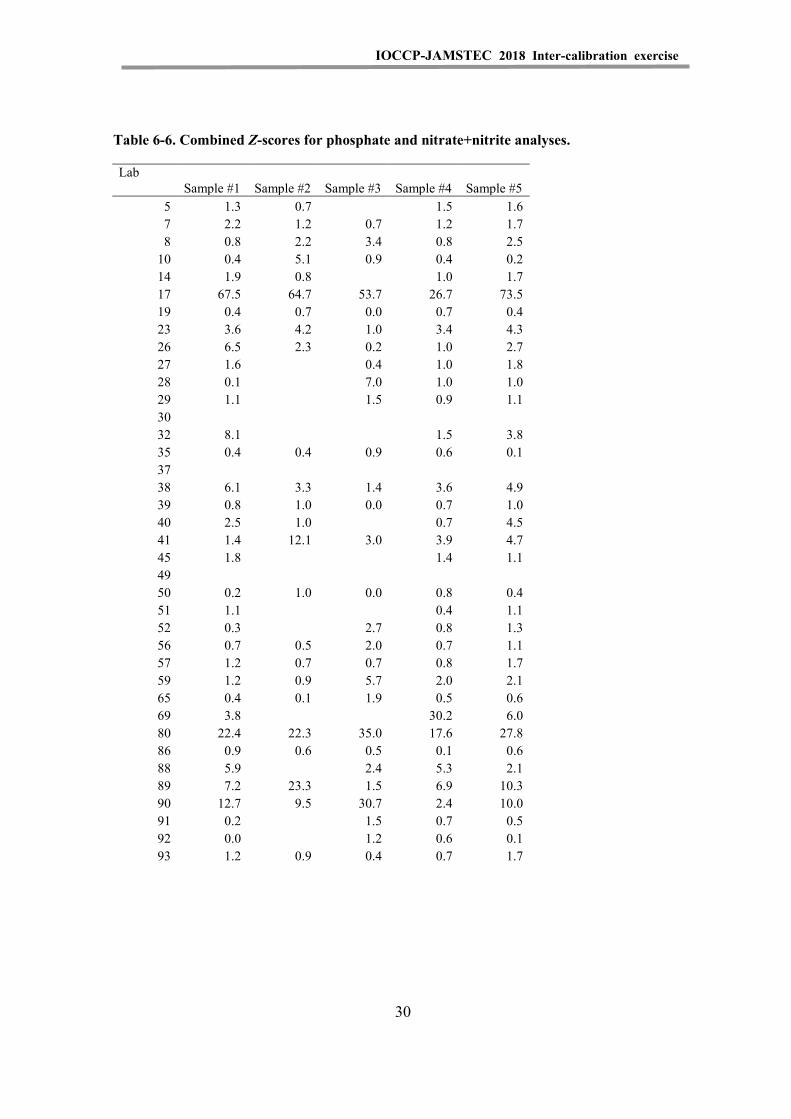
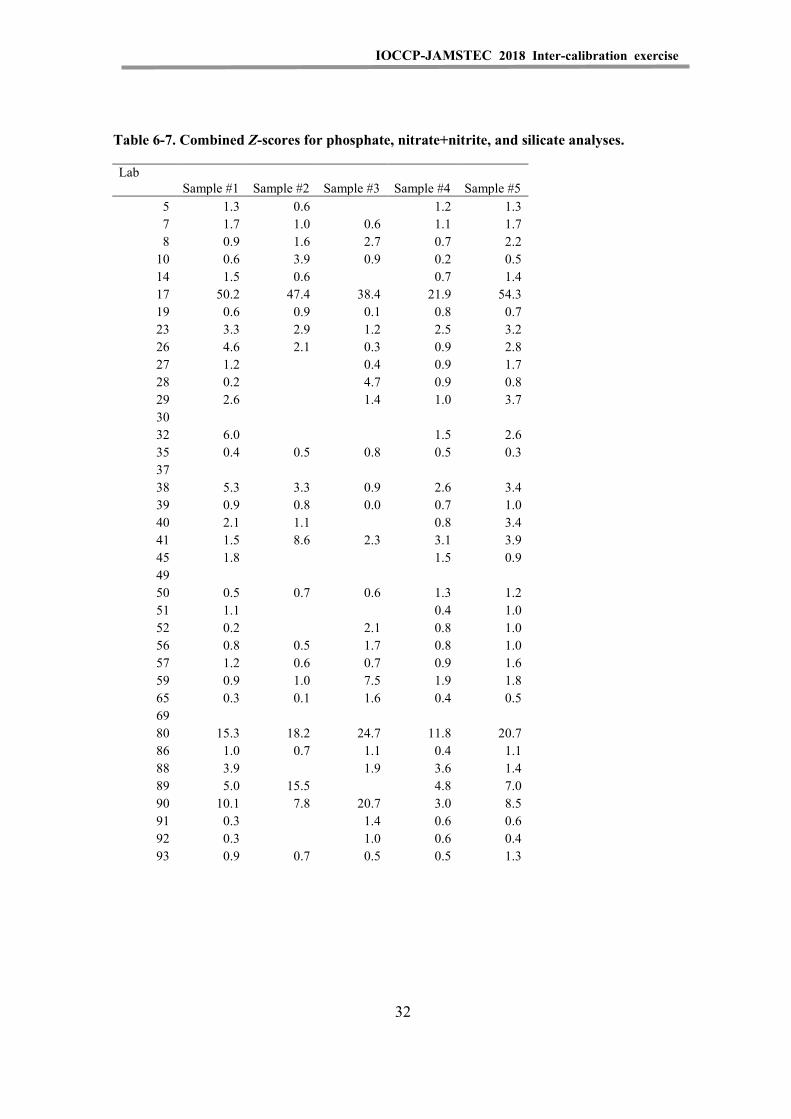
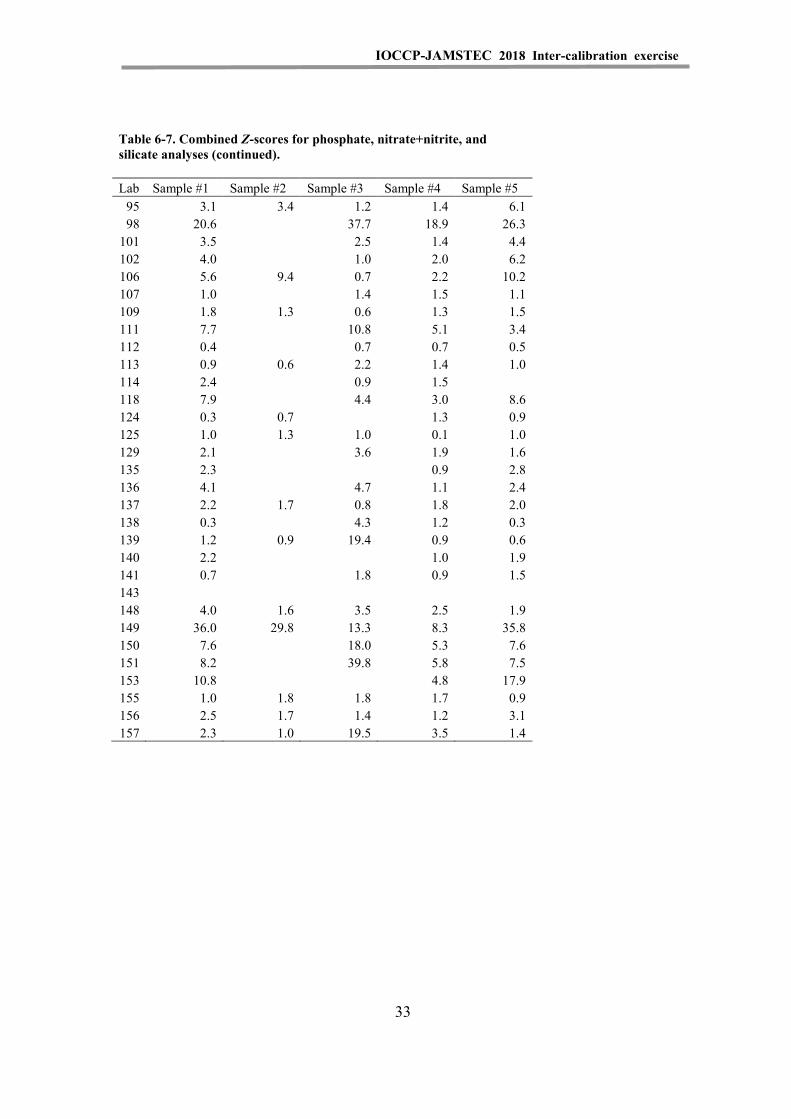
Table 6-1. Z-scores for nitrate+nitrite analyses. .............................................................. 20 Table 6-2. Z-scores for nitrate analyses. .......................................................................... 22 Table 6-3. Z-scores for nitrite analyses. .......................................................................... 24 Table 6-4. Z-scores for phosphate analyses. .................................................................... 26 Table 6-5. Z-scores for silicate analyses. ......................................................................... 28 Table 6-6. Combined Z-scores for phosphate and nitrate+nitrite analyses. .................... 30 Table 6-7. Combined Z-scores for phosphate, nitrate+nitrite, and silicate
analyses. ........................................................................................................... 32
vi
IOCCP-JAMSTEC 2018 Inter-calibration exercise
Figures
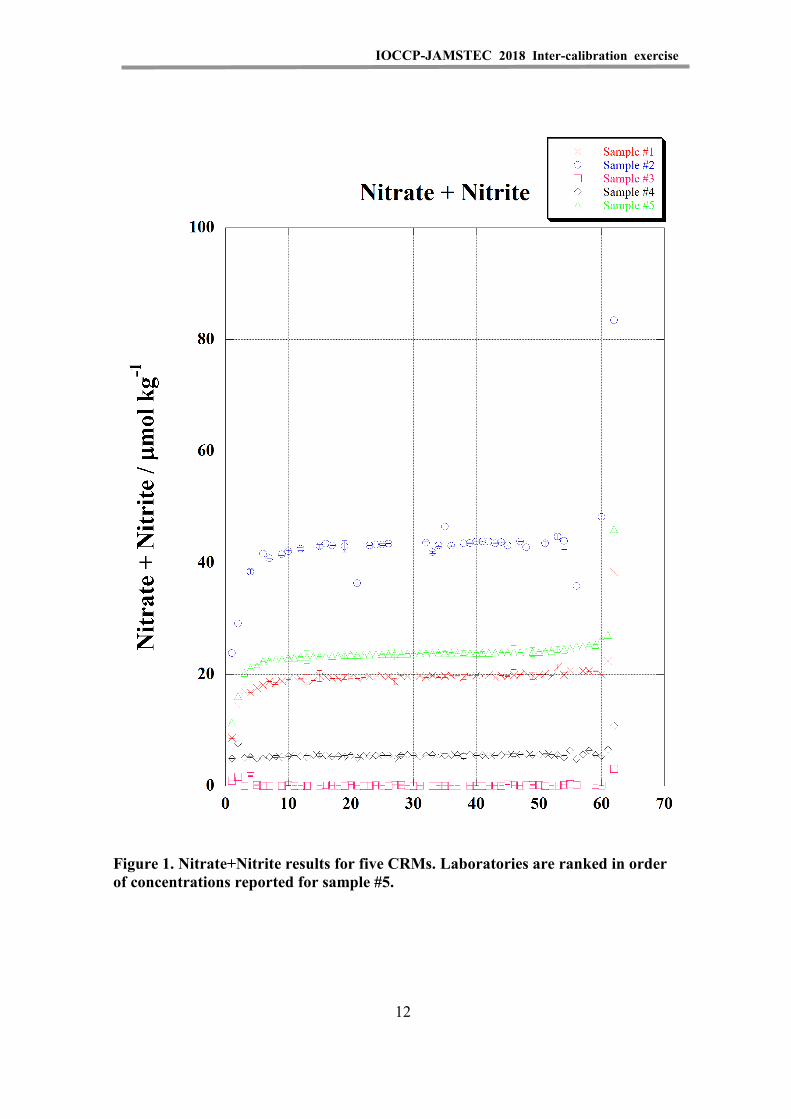
Figure 1. Nitrate+Nitrite results for five CRMs. Laboratories are ranked in order of concentrations reported for sample #5. ....................................................... 12
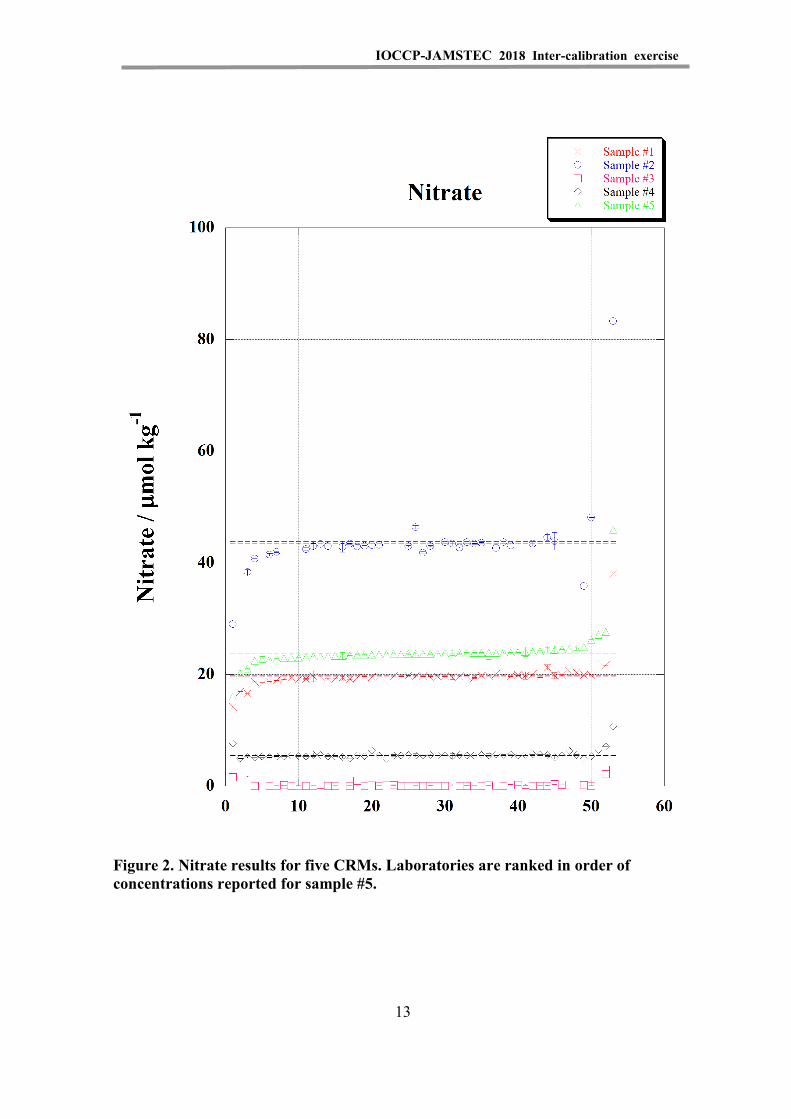
Figure 2. Nitrate results for five CRMs. Laboratories are ranked in order of concentrations reported for sample #5. ........................................................... 13
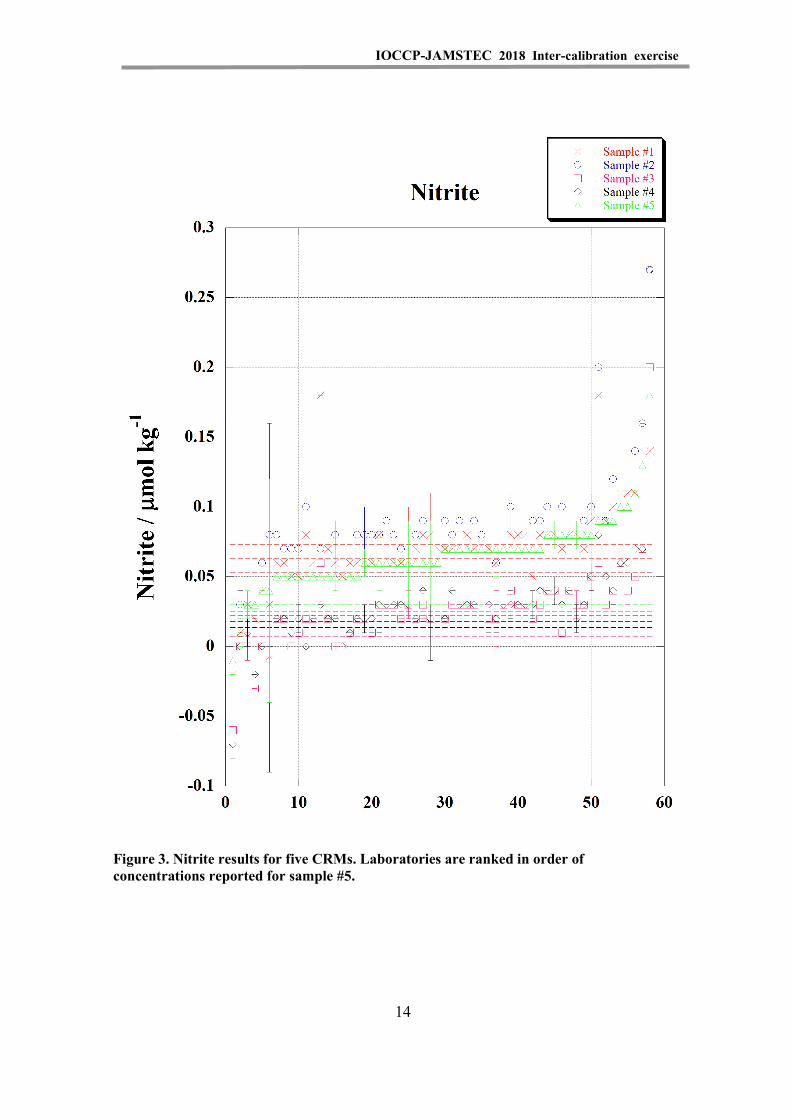
Figure 3. Nitrite results for five CRMs. Laboratories are ranked in order of concentrations reported for sample #5. ........................................................... 14
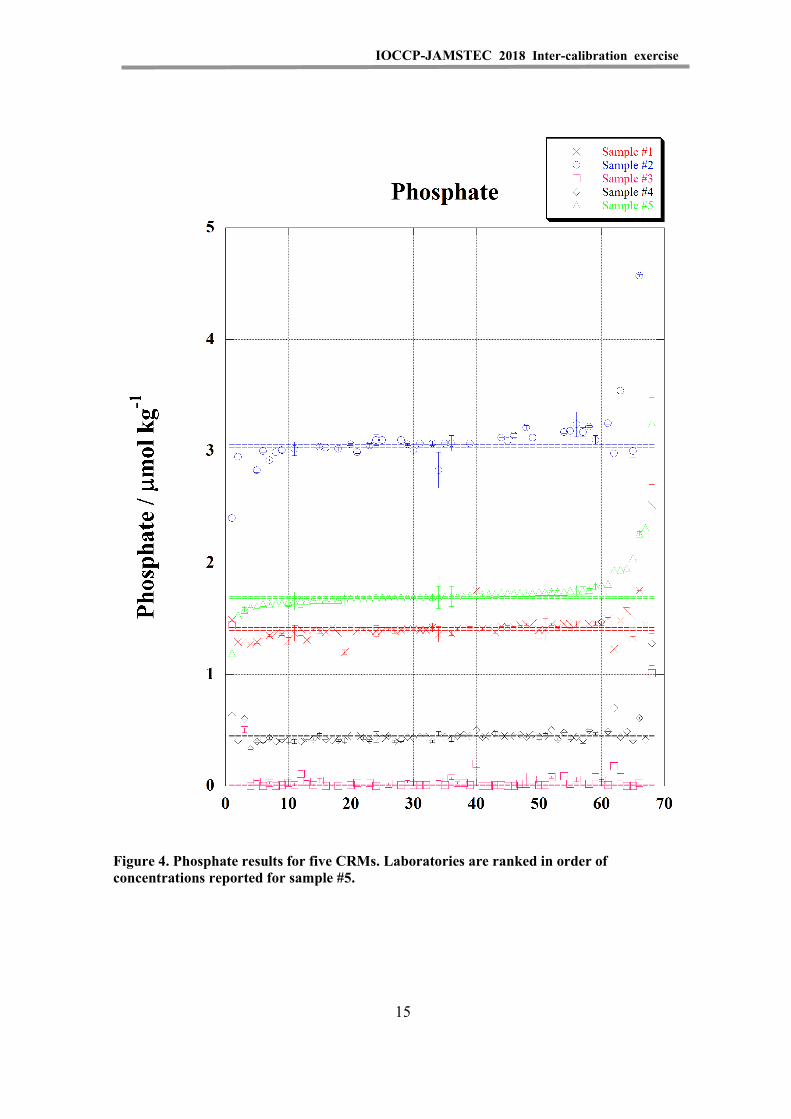
Figure 4. Phosphate results for five CRMs. Laboratories are ranked in order of concentrations reported for sample #5. ........................................................... 15
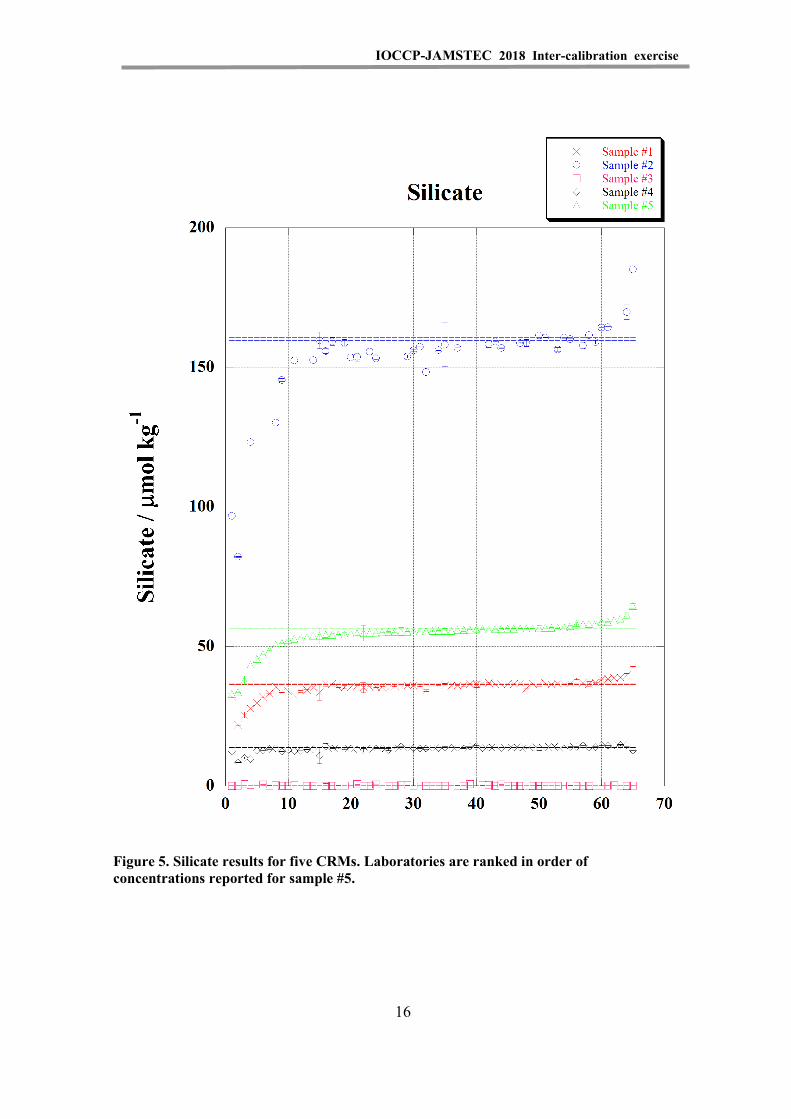
Figure 5. Silicate results for five CRMs. Laboratories are ranked in order of concentrations reported for sample #5. ........................................................... 16
Figure 6. Cumulative distribution of reported nitrate concentrations in the 2008, 2012, 2015 and 2018 I/C studies. .................................................................... 35
Figure 7. Cumulative distribution of reported phosphate concentrations in the 2008, 2012, 2015 and 2018 I/C studies. .......................................................... 36
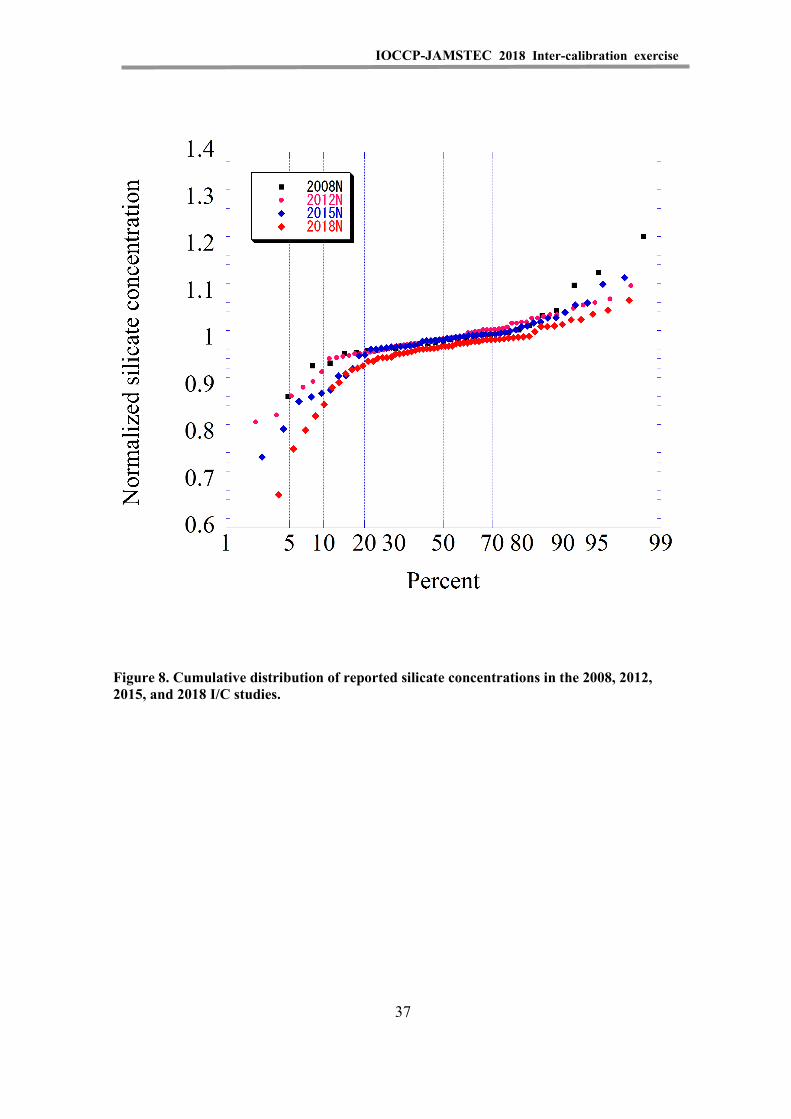
Figure 8. Cumulative distribution of reported silicate concentrations in the 2008, 2012, 2015 and 2018 I/C studies. .................................................................... 37
vii

IOCCP-JAMSTEC 2018 Inter calibration exercise
IOCCP-JAMSTEC 2018 Inter-calibration exercise
1. Introduction
The objective of this inter-laboratory calibration exercise was to evaluate and improve the comparability of global nutrient data for the world’s oceans.
In 2003, 2006, 2008, and 2012, inter-laboratory comparison studies of Reference Material of Nutrients in Seawater (RMNS) were conducted by M. Aoyama at the Meteorological Research Institute (MRI), Japan and collaborators worldwide (Aoyama, 2006, Aoyama et al., 2007, 2008, 2016). Samples were prepared with nutrient concentrations that covered the concentration range of nutrients in the Pacific Ocean, which has the highest nutrient concentrations among the open oceans of the world. The samples were prepared in a natural seawater matrix in a single bottle so that four determinants (nitrate, nitrite, phosphate, and silicate) could be simultaneously analyzed.
In 2014/2015, the International Ocean Carbon Coordination Project (IOCCP) and the Japan Agency for Marine-Earth Science and Technology (JAMSTEC) decided to conduct the International Inter-Calibration Exercise, the “2014 inter-laboratory comparison study of Certified Reference Material of Nutrients in Seawater and Reference Material of Nutrients in Seawater (CRM & RMNS)”. We thank Scientific Committee on Oceanic Research (SCOR) Working Group 147 “Towards comparability of global oceanic nutrient data (COMPONUT)”, co-chaired by Michio Aoyama (Japan) and Malcolm Woodward (UK), for their support of the IOCCP-JAMSTEC inter-laboratory calibration exercise.
In the 2014/2015 inter-laboratory calibration (I/C) exercise, we used four lots of recently certified reference material (CRM) produced by KANSO CO., LTD. Former RMNS produced by KANSO had already shown an excellent homogeneity of 0.2 %, and the concentrations of nitrate, phosphate, and silicate did not change more than 1.0 % during 6.4 years. By the criterion of International Organization for Standardization (ISO) Guide 35:2006, there was no instability of the RM nutrient concentrations (Aoyama et al., 2012). We also used three CRMs provided by the National Metrology Institute of Japan, which were certified in March 2014. The Korean Institute of Ocean Science and Technology (KIOST) also offered to provide their recently developed RMs to this I/C exercise. The Royal Netherlands Institute for Sea Research, NIOZ, also offered to provide silicate stock solution to contribute to the overall assessment of results from this I/C exercise.
The report of the previous IOCCP-JAMSTEC 2014/2015 inter-laboratory comparison study of Certified Reference Material of Nutrients in Seawater and Reference Material of Nutrients in Seawater (CRM & RMNS) have already been published with an ISBN as a printed version and web version (Aoyama et al., 2015).
Results obtained in several previous inter-laboratory comparison studies have indicated that variability of in-house standards of the participating laboratories and handling of nonlinearity of the instruments of the participating laboratories are the primary sources of inter-laboratory discrepancies. It is therefore obvious that the use of a certified reference material for nutrients in seawater, CRM, and use of the same
1
IOCCP-JAMSTEC 2018 Inter-calibration exercise
methodology for measuring nutrient concentrations are essential for improving the accuracy and establishing global comparability and traceability of nutrient data for the world’s oceans.
In 2017, the International Ocean Carbon Coordination Project (IOCCP) and the Japan Agency for Marine-Earth Science and Technology (JAMSTEC) decided to conduct the 6th International Inter-Calibration Exercise, the “2017/18 inter-laboratory comparison exercise of Certified Reference Material of Nutrients in Seawater, CRM”. As with the previous four inter-comparison studies organized by MRI and the previous IOCCCP-JAMSTEC I/C exercise in 2015, the aim of this I/C exercise was to improve the level of comparability by exchange of knowledge among participating laboratories. Compared with the previous studies, the scale of the study has been expanded, and 107 laboratories in 30 countries across five continents received an invitation letter to participate in the I/C exercise. Finally, 71 laboratories agreed to participate in the I/C exercise and 69 laboratories reported their results. We are now publishing this report with the names of the participants and an organizer.
2
IOCCP-JAMSTEC 2018 Inter-calibration exercise
2. Preparation and samples sent to the participants
In 2017, IOCCP and JAMSTEC co-organized an inter-laboratory calibration exercise of nutrients in seawater in collaboration with SCOR WG147. A list of candidates was prepared based on the previous participants, and some laboratories were newly added based on the information from SCOR WG147, IOCCP Scientific Steering Committee (SSG) members, and the Synoptic Arctic Survey group. The invitation letter (Appendix IV) was sent to 107 laboratories.
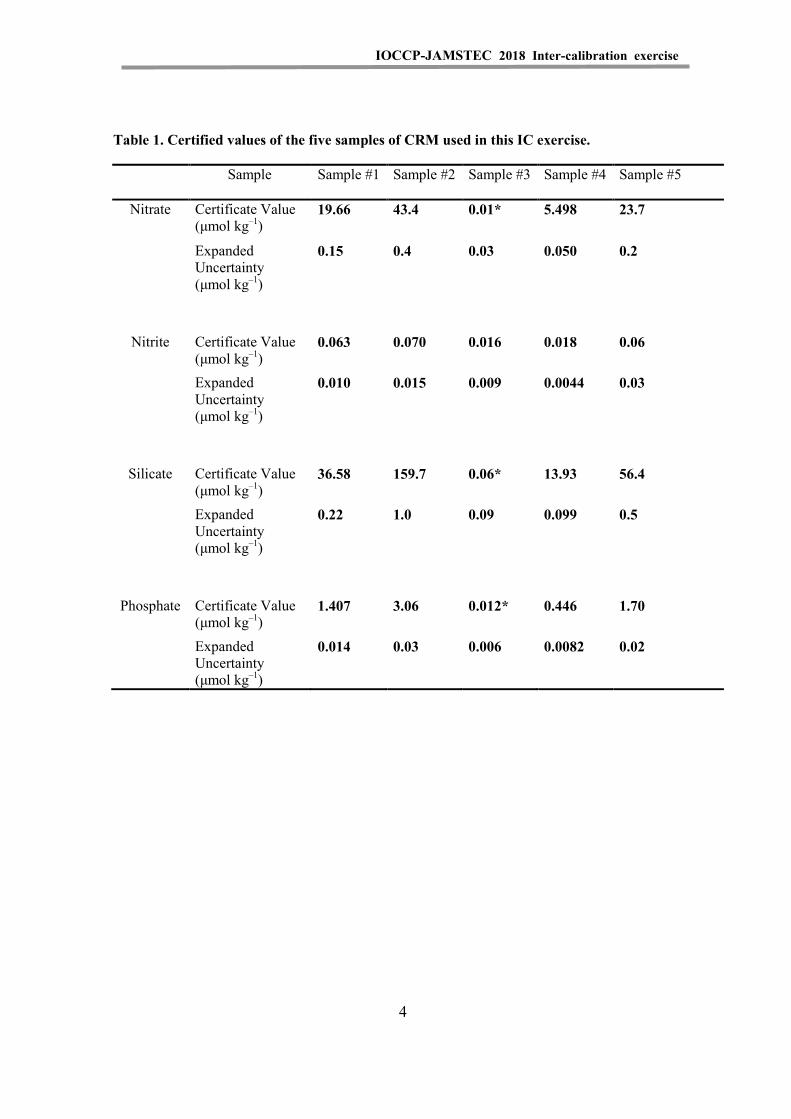
The certified values of the four or five CRMs used as samples in this inter-laboratory calibration exercise are shown in Table 1.
The Korean Institute of Ocean Science and Technology, KIOST, offered to provide their recently developed RMs to this I/C exercise.
A set of four or five samples of CRMs was distributed to all 71 participating laboratories around the globe (33 countries/regions) at no charge. In this I/C exercise, the sample with the highest silicate concentration was not distributed to laboratories that were not familiar with such a high silicate concentration. Korean RMs were also distributed to the same laboratories.
In addition, three sets of samples used in the IOCCCP-JAMSTEC 2014/15 IC exercise were sent to three laboratories to check the stability and comparability of the previous samples used in the IC exercise. Four sets of five CRMs used in this IC exercise were also sent to four laboratories in the United States, India, Netherlands, and South Africa to check the stability during transportation. Those samples were returned intact and analyzed at JAMSTEC.
3
IOCCP-JAMSTEC 2018 Inter-calibration exercise
Table 1. Certified values of the five samples of CRM used in this IC exercise.
Sample Sample #1 Sample #2 Sample #3 Sample #4 Sample #5
Nitrate Certificate Value (μmol kg–1)
19.66 43.4 0.01* 5.498 23.7
Expanded Uncertainty (μmol kg–1)
0.15 0.4 0.03 0.050 0.2
Nitrite Certificate Value (μmol kg–1)
0.063 0.070 0.016 0.018 0.06
Expanded Uncertainty (μmol kg–1)
0.010 0.015 0.009 0.0044 0.03
Silicate Certificate Value (μmol kg–1)
36.58 159.7 0.06* 13.93 56.4
Expanded Uncertainty (μmol kg–1)
0.22 1.0 0.09 0.099 0.5
Phosphate Certificate Value (μmol kg–1)
1.407 3.06 0.012* 0.446 1.70
Expanded Uncertainty (μmol kg–1)
0.014 0.03 0.006 0.0082 0.02
4
IOCCP-JAMSTEC 2018 Inter-calibration exercise
3. Participants and response
Seventy-one laboratories in 33 countries replied to the call for participants. The participating laboratories are listed in Table A1 in Appendix I and are cross-referenced by laboratory number to the laboratories participating in the previous I/C studies in Table A2.
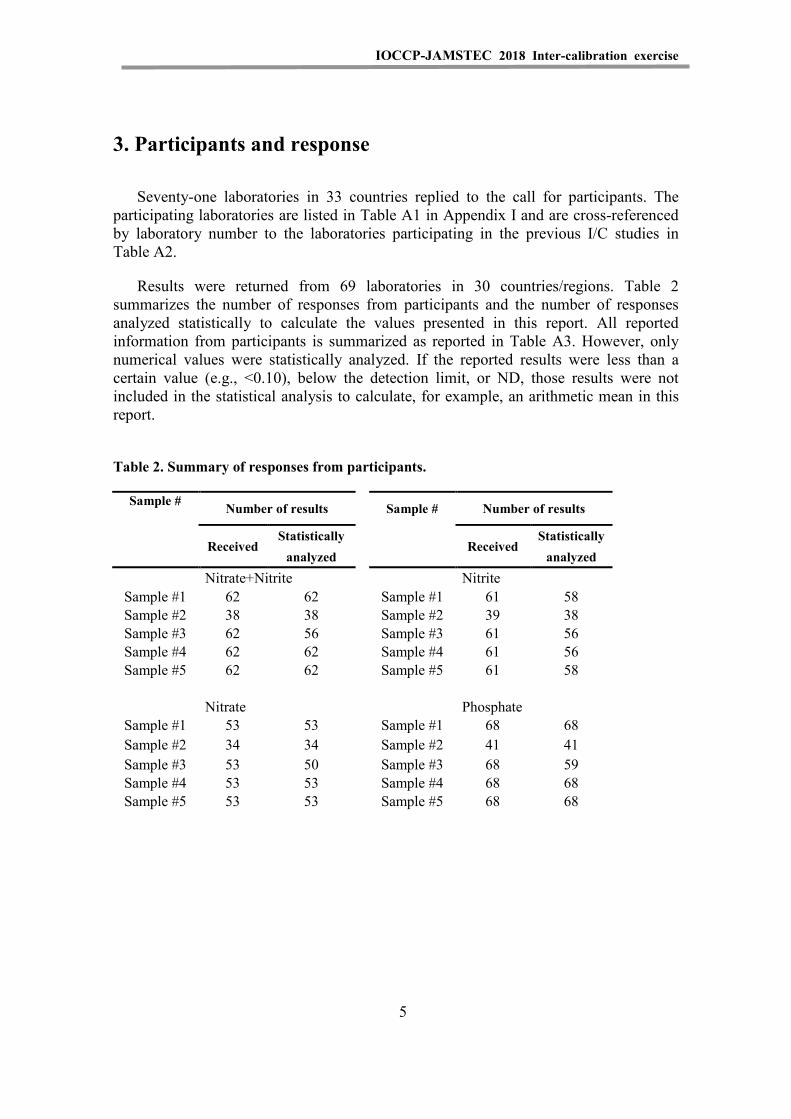
Results were returned from 69 laboratories in 30 countries/regions. Table 2 summarizes the number of responses from participants and the number of responses analyzed statistically to calculate the values presented in this report. All reported information from participants is summarized as reported in Table A3. However, only numerical values were statistically analyzed. If the reported results were less than a certain value (e.g., <0.10), below the detection limit, or ND, those results were not included in the statistical analysis to calculate, for example, an arithmetic mean in this report.
Table 2. Summary of responses from participants.
Sample # Number of results Sample # Number of results
Received Statistically
Received Statistically
analyzed analyzed Nitrate+Nitrite Nitrite
Sample #1 62 62 Sample #1 61 58 Sample #2 38 38 Sample #2 39 38 Sample #3 62 56 Sample #3 61 56 Sample #4 62 62 Sample #4 61 56 Sample #5 62 62 Sample #5 61 58
Nitrate Phosphate Sample #1 53 53 Sample #1 68 68 Sample #2 34 34 Sample #2 41 41 Sample #3 53 50 Sample #3 68 59 Sample #4 53 53 Sample #4 68 68 Sample #5 53 53 Sample #5 68 68
5
IOCCP-JAMSTEC 2018 Inter-calibration exercise
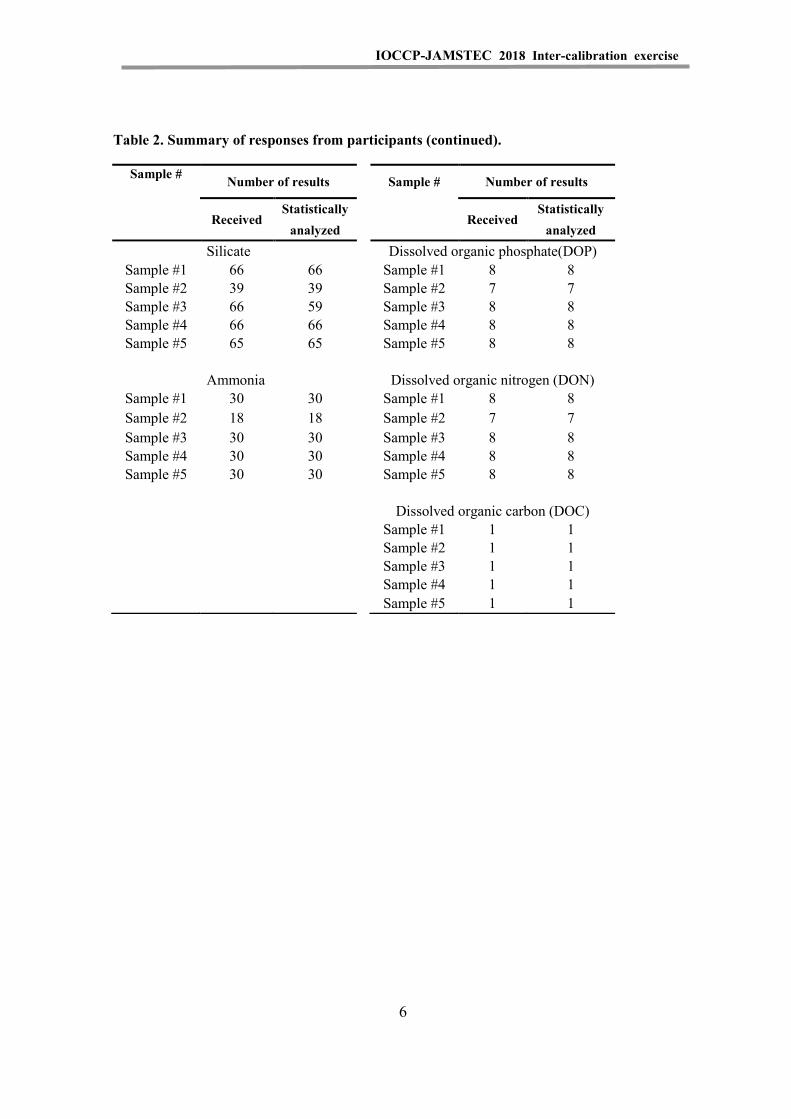
Table 2. Summary of responses from participants (continued).
Sample # Number of results Sample # Number of results
Received Statistically
Received Statistically
analyzed analyzed Silicate Dissolved organic phosphate(DOP)
Sample #1 66 66 Sample #1 8 8 Sample #2 39 39 Sample #2 7 7 Sample #3 66 59 Sample #3 8 8 Sample #4 66 66 Sample #4 8 8 Sample #5 65 65 Sample #5 8 8
Ammonia Dissolved organic nitrogen (DON) Sample #1 30 30 Sample #1 8 8 Sample #2 18 18 Sample #2 7 7 Sample #3 30 30 Sample #3 8 8 Sample #4 30 30 Sample #4 8 8 Sample #5 30 30 Sample #5 8 8
Dissolved organic carbon (DOC) Sample #1 1 1 Sample #2 1 1 Sample #3 1 1 Sample #4 1 1 Sample #5 1 1
6
IOCCP-JAMSTEC 2018 Inter-calibration exercise
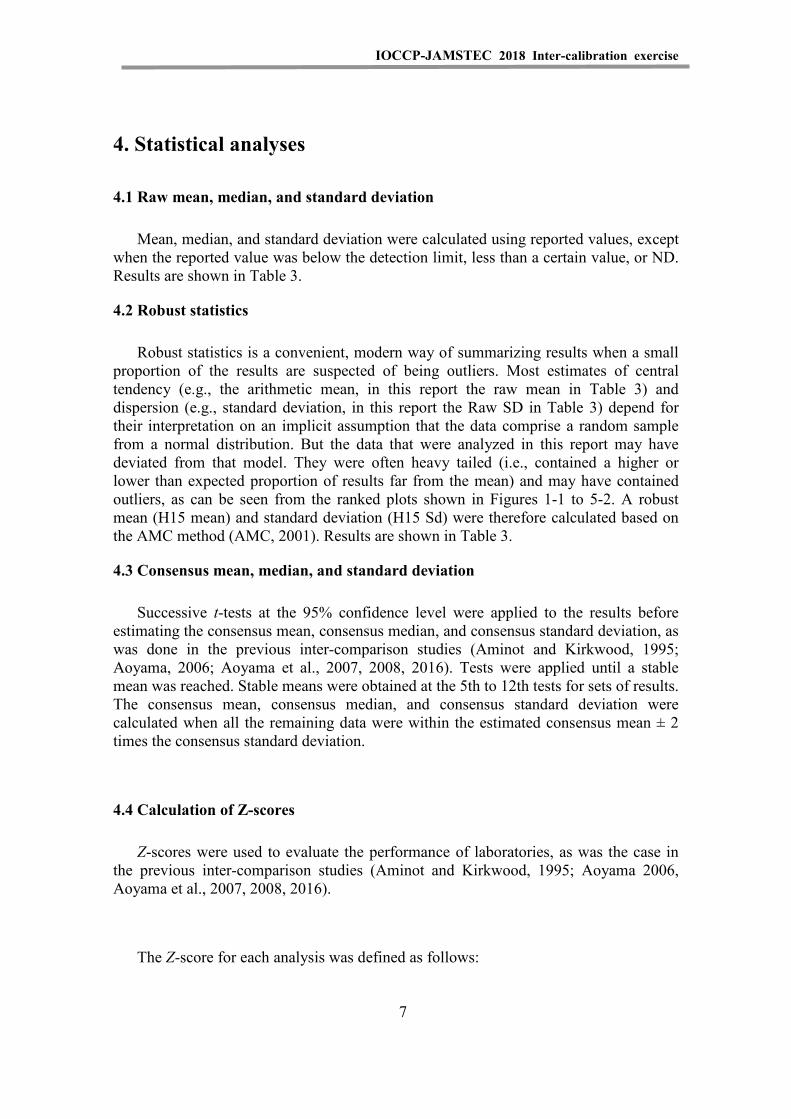
4. Statistical analyses
4.1 Raw mean, median, and standard deviation
Mean, median, and standard deviation were calculated using reported values, except when the reported value was below the detection limit, less than a certain value, or ND. Results are shown in Table 3.
4.2 Robust statistics
Robust statistics is a convenient, modern way of summarizing results when a small proportion of the results are suspected of being outliers. Most estimates of central tendency (e.g., the arithmetic mean, in this report the raw mean in Table 3) and dispersion (e.g., standard deviation, in this report the Raw SD in Table 3) depend for their interpretation on an implicit assumption that the data comprise a random sample from a normal distribution. But the data that were analyzed in this report may have deviated from that model. They were often heavy tailed (i.e., contained a higher or lower than expected proportion of results far from the mean) and may have contained outliers, as can be seen from the ranked plots shown in Figures 1-1 to 5-2. A robust mean (H15 mean) and standard deviation (H15 Sd) were therefore calculated based on the AMC method (AMC, 2001). Results are shown in Table 3.
4.3 Consensus mean, median, and standard deviation
Successive t-tests at the 95% confidence level were applied to the results before estimating the consensus mean, consensus median, and consensus standard deviation, as was done in the previous inter-comparison studies (Aminot and Kirkwood, 1995; Aoyama, 2006; Aoyama et al., 2007, 2008, 2016). Tests were applied until a stable mean was reached. Stable means were obtained at the 5th to 12th tests for sets of results. The consensus mean, consensus median, and consensus standard deviation were calculated when all the remaining data were within the estimated consensus mean ± 2 times the consensus standard deviation.
4.4 Calculation of Z-scores
Z-scores were used to evaluate the performance of laboratories, as was the case in the previous inter-comparison studies (Aminot and Kirkwood, 1995; Aoyama 2006, Aoyama et al., 2007, 2008, 2016).
The Z-score for each analysis was defined as follows:
7
IOCCP-JAMSTEC 2018 Inter-calibration exercise
Zpar = ABS((Cpar – Cconsensus)/Ppar) (1)
where Zpar is the Z-score for an analysis; Cpar is the concentration of an RMNS sample measured by a laboratory for the parameter of interest (nitrate, phosphate, or silicate); Cconsensus is the consensus sample concentration for the parameter of interest, described in section 4.1; and Ppar is the standard deviation of the sample concentration for the parameter of interest.
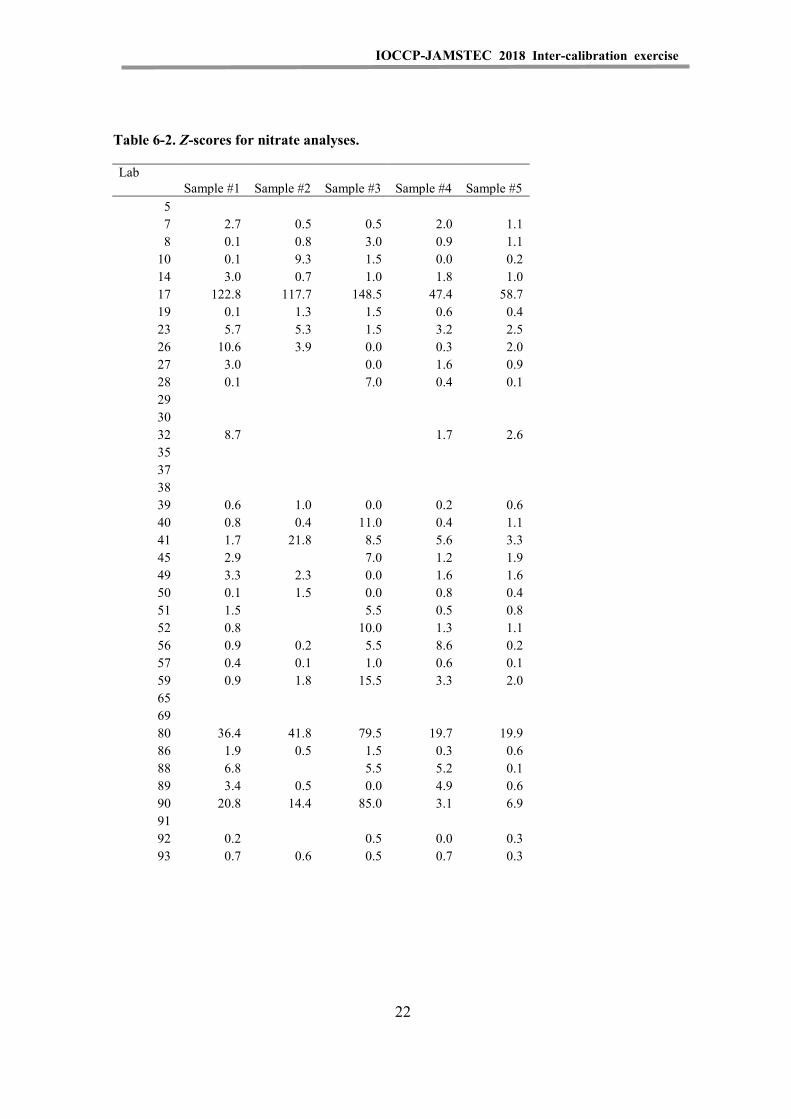
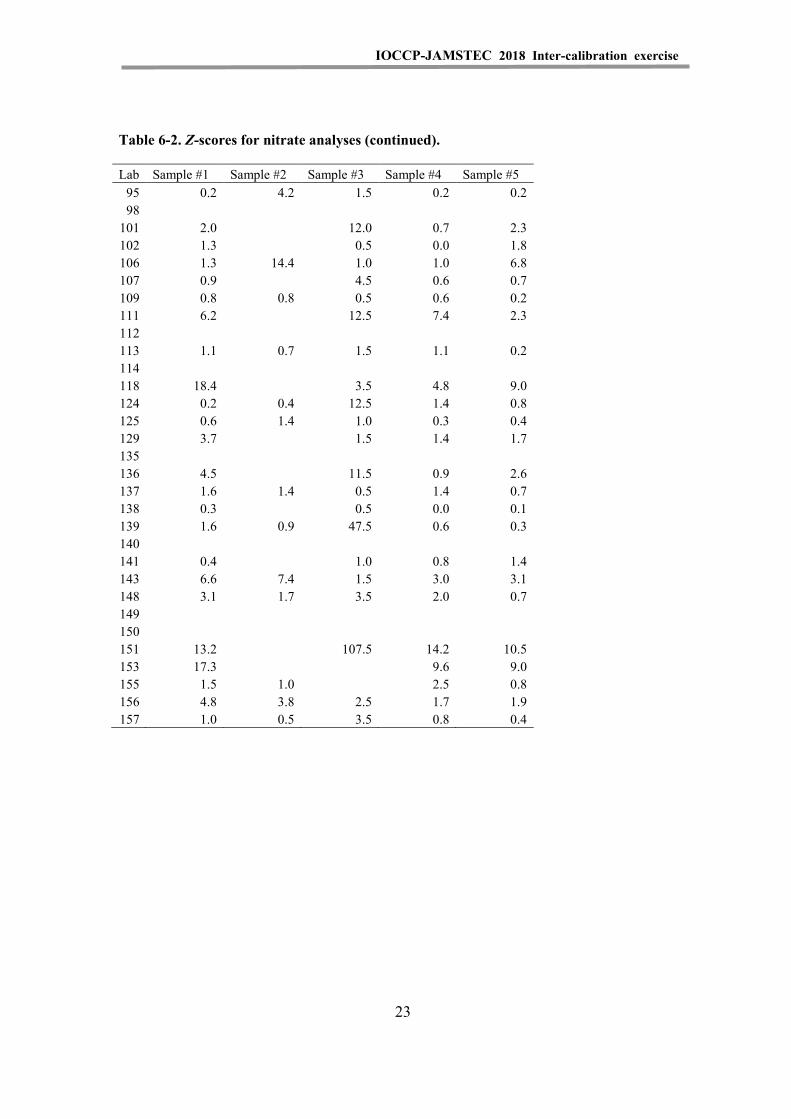
The Z-score for all determinants, nitrate+nitrite, nitrate, nitrite, phosphate, and silicate, were calculated and are shown in Tables 6-1 to 6-5. We calculated combined Z-scores for phosphate and nitrate+nitrite to evaluate performance in the estimation of an important biogeochemical parameter, the N/P ratio; results are shown in Table 6-6. We also calculated combined Z-scores for phosphate, nitrate+nitrite, and silicate (Table 6-7) to assess the overall performance of the nutrient measurements made in each laboratory.
8
IOCCP-JAMSTEC 2018 Inter-calibration exercise
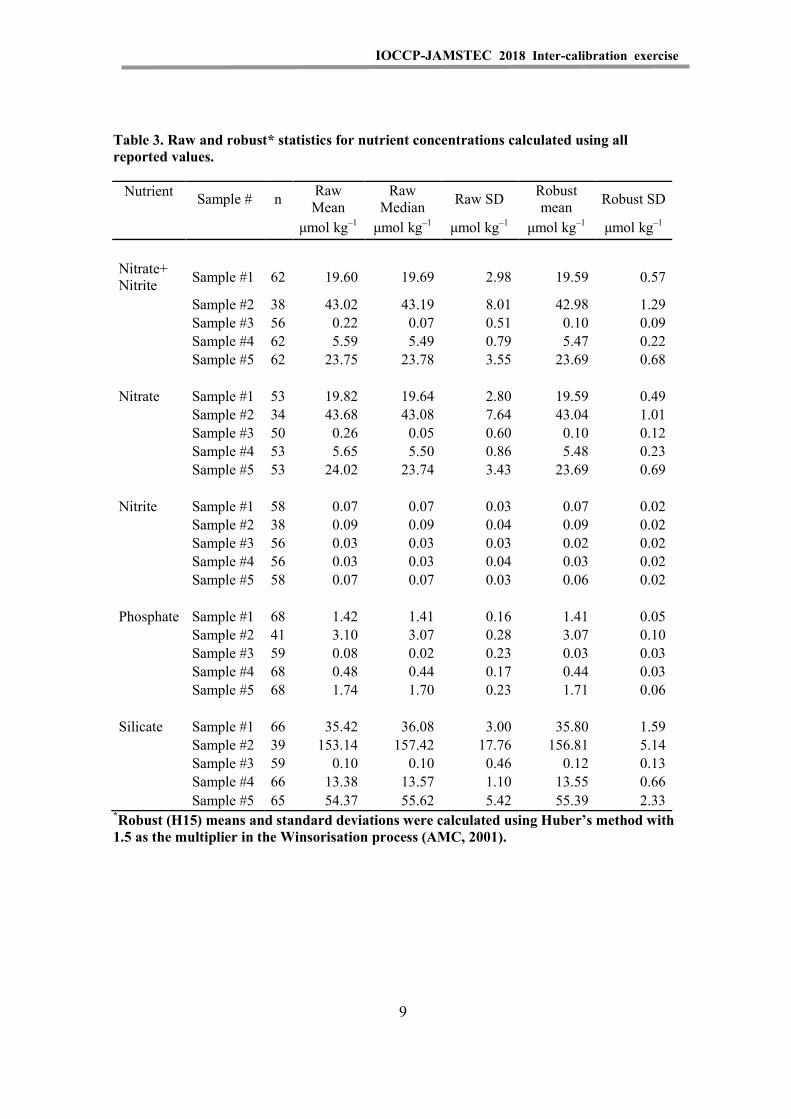
Table 3. Raw and robust* statistics for nutrient concentrations calculated using all reported values.
Nutrient Sample # n Raw Mean
Raw Median Raw SD Robust
mean Robust SD
μmol kg–1 μmol kg–1 μmol kg–1 μmol kg–1 μmol kg–1
Nitrate+ Nitrite Sample #1 62 19.60 19.69 2.98 19.59 0.57
Sample #2 38 43.02 43.19 8.01 42.98 1.29
Sample #3 56 0.22 0.07 0.51 0.10 0.09
Sample #4 62 5.59 5.49 0.79 5.47 0.22
Sample #5 62 23.75 23.78 3.55 23.69 0.68
Nitrate Sample #1 53 19.82 19.64 2.80 19.59 0.49
Sample #2 34 43.68 43.08 7.64 43.04 1.01
Sample #3 50 0.26 0.05 0.60 0.10 0.12
Sample #4 53 5.65 5.50 0.86 5.48 0.23
Sample #5 53 24.02 23.74 3.43 23.69 0.69
Nitrite Sample #1 58 0.07 0.07 0.03 0.07 0.02
Sample #2 38 0.09 0.09 0.04 0.09 0.02
Sample #3 56 0.03 0.03 0.03 0.02 0.02
Sample #4 56 0.03 0.03 0.04 0.03 0.02
Sample #5 58 0.07 0.07 0.03 0.06 0.02
Phosphate Sample #1 68 1.42 1.41 0.16 1.41 0.05
Sample #2 41 3.10 3.07 0.28 3.07 0.10
Sample #3 59 0.08 0.02 0.23 0.03 0.03
Sample #4 68 0.48 0.44 0.17 0.44 0.03
Sample #5 68 1.74 1.70 0.23 1.71 0.06
Silicate Sample #1 66 35.42 36.08 3.00 35.80 1.59
Sample #2 39 153.14 157.42 17.76 156.81 5.14
Sample #3 59 0.10 0.10 0.46 0.12 0.13
Sample #4 66 13.38 13.57 1.10 13.55 0.66 Sample #5 65 54.37 55.62 5.42 55.39 2.33
*Robust (H15) means and standard deviations were calculated using Huber’s method with 1.5 as the multiplier in the Winsorisation process (AMC, 2001).
9
IOCCP-JAMSTEC 2018 Inter-calibration exercise
This page is intentionally left blank
10
IOCCP-JAMSTEC 2018 Inter-calibration exercise
5. Results
The database includes results from 69 of 71 laboratories. In this report, the main text presents a summary of five CRMs, and Appendix V presents a summary of three KIOST RMs.
5.1 Ranked scatter-plots of the results
Figures 1 to 5 are ranked scatter-plots for nitrate+nitrite, nitrate, nitrite, phosphate, and silicate, respectively. For nitrate+nitrite, nitrate, nitrite, phosphate, and silicate, the laboratory results were sorted in order of the concentrations reported for sample #5, because sample #5 contained the mid nitrate, phosphate, and silicate concentrations of the samples and all participants received and analyzed sample #5.
Cross-referenced tables to find the lab number corresponding to the order of ranked results are shown as Tables A8-1 to A8-5 in Appendix III for Figures 1 to 5.
In each of Figures 1 to 5, the ranked concentration plots for a particular nutrient would be proportional and roughly parallel to each other for samples with different nutrient concentrations if each laboratory appropriately compensated for the nonlinearity of the calibration curves. However, as is evident in the figures, there were non-proportional results from some laboratories for all of the determinants. This was also the case in the previous I/C studies.
These results indicate that nonlinearity of the calibration curves for nutrient analysis is one of the significant causes of diminished comparability of nutrient data. The implication is that we need to use a set of CRMs that include nutrient concentrations that cover the whole range of measured nutrient concentrations in the world’s oceans to ensure comparability of results.
Figures 2 to 5 present the certified values and associated uncertainties reported by the providers of the CRMs.
11
IOCCP-JAMSTEC 2018 Inter-calibration exercise
Figure 1. Nitrate+Nitrite results for five CRMs. Laboratories are ranked in order of concentrations reported for sample #5.
12
IOCCP-JAMSTEC 2018 Inter-calibration exercise
Figure 2. Nitrate results for five CRMs. Laboratories are ranked in order of concentrations reported for sample #5.
13
IOCCP-JAMSTEC 2018 Inter-calibration exercise
Figure 3. Nitrite results for five CRMs. Laboratories are ranked in order of concentrations reported for sample #5.
14
IOCCP-JAMSTEC 2018 Inter-calibration exercise
Figure 4. Phosphate results for five CRMs. Laboratories are ranked in order of concentrations reported for sample #5.
15
IOCCP-JAMSTEC 2018 Inter-calibration exercise
Figure 5. Silicate results for five CRMs. Laboratories are ranked in order of concentrations reported for sample #5.
16
IOCCP-JAMSTEC 2018 Inter-calibration exercise
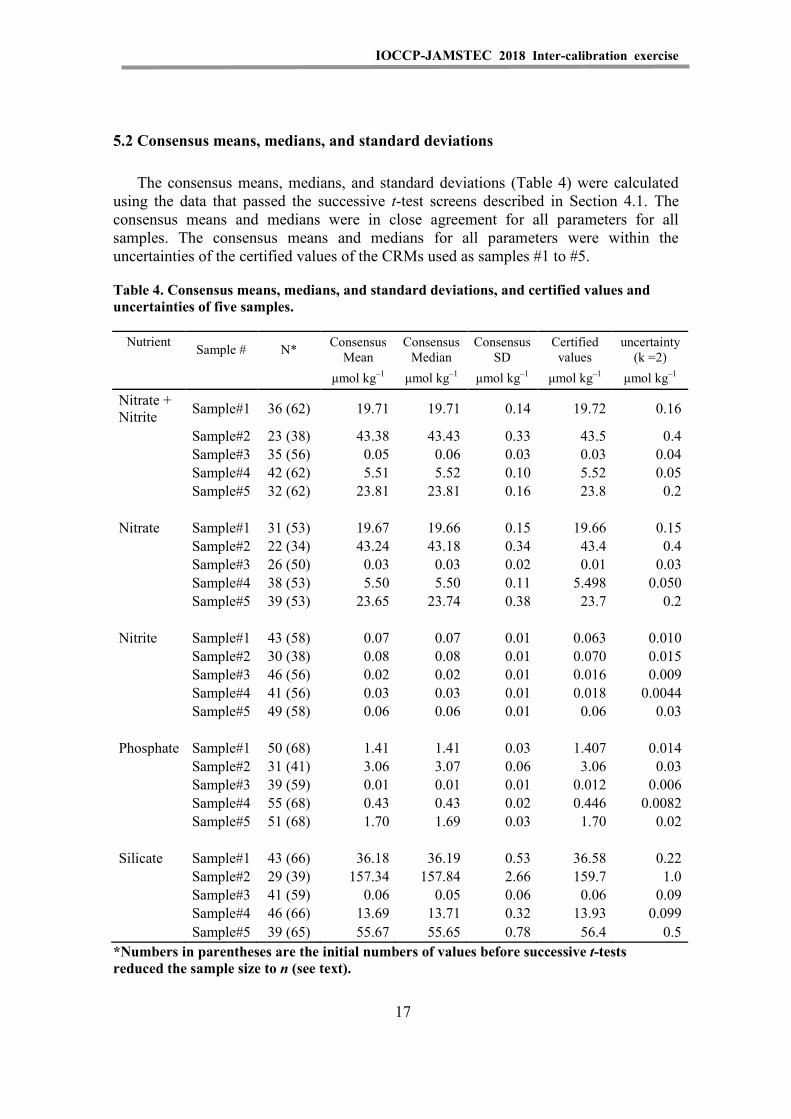
5.2 Consensus means, medians, and standard deviations
The consensus means, medians, and standard deviations (Table 4) were calculated using the data that passed the successive t-test screens described in Section 4.1. The consensus means and medians were in close agreement for all parameters for all samples. The consensus means and medians for all parameters were within the uncertainties of the certified values of the CRMs used as samples #1 to #5.
Table 4. Consensus means, medians, and standard deviations, and certified values and uncertainties of five samples.
Nutrient Sample # N* Consensus Mean
Consensus Median
Consensus SD
Certified values
uncertainty (k =2)
μmol kg–1 μmol kg–1 μmol kg–1 μmol kg–1 μmol kg–1
Nitrate + Nitrite Sample#1 36 (62) 19.71 19.71 0.14 19.72 0.16
Sample#2 23 (38) 43.38 43.43 0.33 43.5 0.4 Sample#3 35 (56) 0.05 0.06 0.03 0.03 0.04 Sample#4 42 (62) 5.51 5.52 0.10 5.52 0.05 Sample#5 32 (62) 23.81 23.81 0.16 23.8 0.2
Nitrate Sample#1 31 (53) 19.67 19.66 0.15 19.66 0.15 Sample#2 22 (34) 43.24 43.18 0.34 43.4 0.4 Sample#3 26 (50) 0.03 0.03 0.02 0.01 0.03 Sample#4 38 (53) 5.50 5.50 0.11 5.498 0.050 Sample#5 39 (53) 23.65 23.74 0.38 23.7 0.2
Nitrite Sample#1 43 (58) 0.07 0.07 0.01 0.063 0.010 Sample#2 30 (38) 0.08 0.08 0.01 0.070 0.015 Sample#3 46 (56) 0.02 0.02 0.01 0.016 0.009 Sample#4 41 (56) 0.03 0.03 0.01 0.018 0.0044 Sample#5 49 (58) 0.06 0.06 0.01 0.06 0.03
Phosphate Sample#1 50 (68) 1.41 1.41 0.03 1.407 0.014 Sample#2 31 (41) 3.06 3.07 0.06 3.06 0.03 Sample#3 39 (59) 0.01 0.01 0.01 0.012 0.006 Sample#4 55 (68) 0.43 0.43 0.02 0.446 0.0082 Sample#5 51 (68) 1.70 1.69 0.03 1.70 0.02
Silicate Sample#1 43 (66) 36.18 36.19 0.53 36.58 0.22 Sample#2 29 (39) 157.34 157.84 2.66 159.7 1.0 Sample#3 41 (59) 0.06 0.05 0.06 0.06 0.09 Sample#4 46 (66) 13.69 13.71 0.32 13.93 0.099 Sample#5 39 (65) 55.67 55.65 0.78 56.4 0.5
*Numbers in parentheses are the initial numbers of values before successive t-testsreduced the sample size to n (see text).
17
IOCCP-JAMSTEC 2018 Inter-calibration exercise
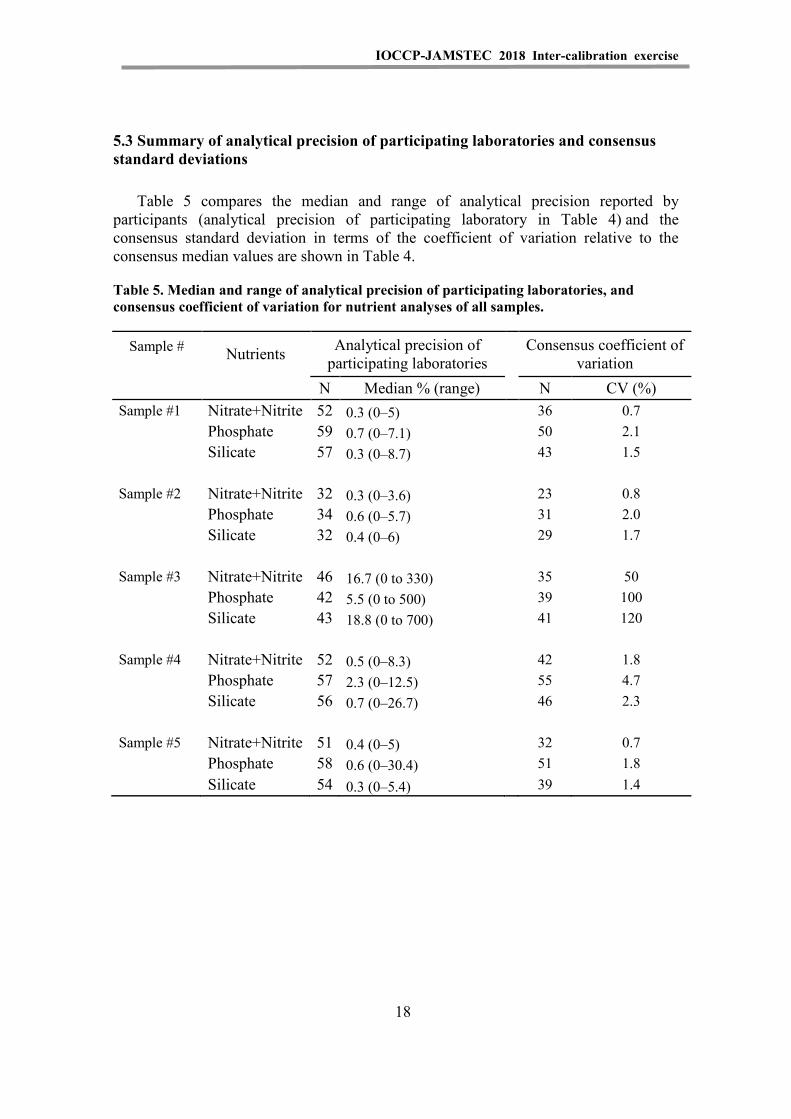
5.3 Summary of analytical precision of participating laboratories and consensus standard deviations
Table 5 compares the median and range of analytical precision reported by participants (analytical precision of participating laboratory in Table 4) and the consensus standard deviation in terms of the coefficient of variation relative to the consensus median values are shown in Table 4.
Table 5. Median and range of analytical precision of participating laboratories, and consensus coefficient of variation for nutrient analyses of all samples.
Sample # Nutrients Analytical precision of participating laboratories
Consensus coefficient of variation
N Median % (range) N CV (%) Sample #1 Nitrate+Nitrite 52 0.3 (0–5) 36 0.7
Phosphate 59 0.7 (0–7.1) 50 2.1 Silicate 57 0.3 (0–8.7) 43 1.5
Sample #2 Nitrate+Nitrite 32 0.3 (0–3.6) 23 0.8 Phosphate 34 0.6 (0–5.7) 31 2.0 Silicate 32 0.4 (0–6) 29 1.7
Sample #3 Nitrate+Nitrite 46 16.7 (0 to 330) 35 50 Phosphate 42 5.5 (0 to 500) 39 100 Silicate 43 18.8 (0 to 700) 41 120
Sample #4 Nitrate+Nitrite 52 0.5 (0–8.3) 42 1.8 Phosphate 57 2.3 (0–12.5) 55 4.7 Silicate 56 0.7 (0–26.7) 46 2.3
Sample #5 Nitrate+Nitrite 51 0.4 (0–5) 32 0.7 Phosphate 58 0.6 (0–30.4) 51 1.8 Silicate 54 0.3 (0–5.4) 39 1.4
18
IOCCP-JAMSTEC 2018 Inter-calibration exercise
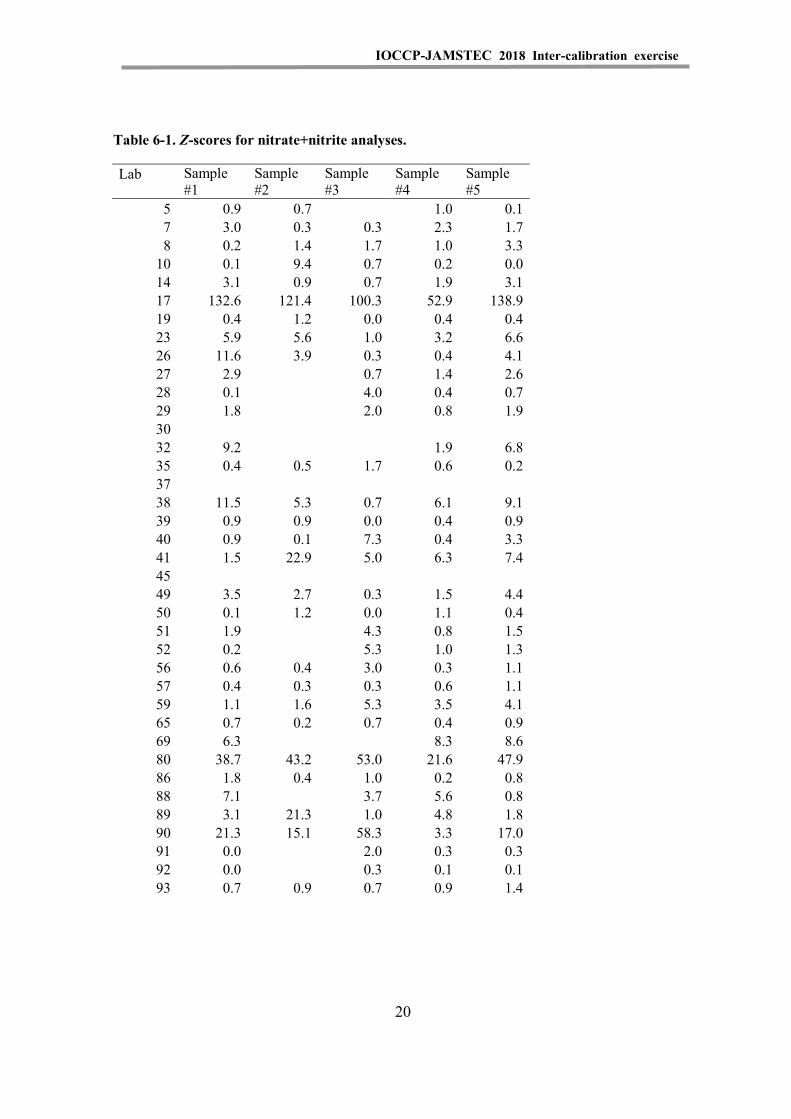
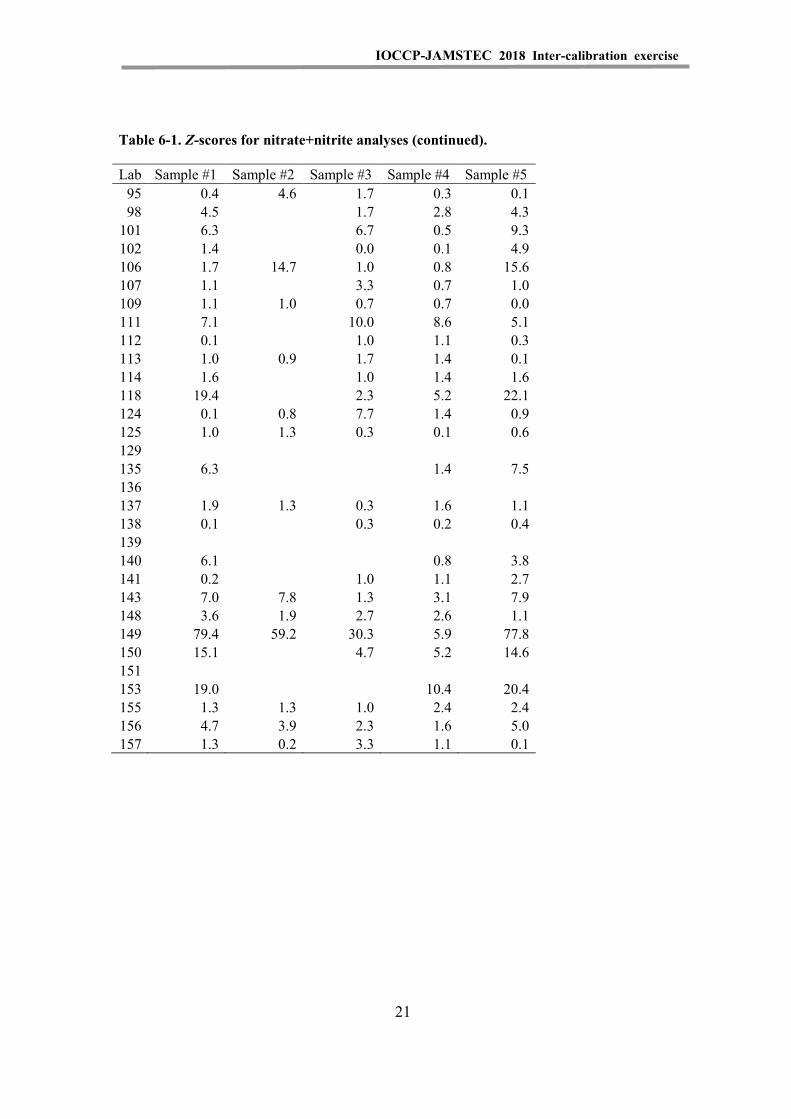
5.4 Z-scores
Tables 6-1 to 6-7 present Z-scores for participating laboratories computed as described in section 4.4. Z-scores indicate how the measurement of a particular determinant in a sample by an individual laboratory compared to the consensus value for that determinant in that sample as determined by all participating laboratories. Z-values are proportional to the consensus standard deviation, with a Z-value less than 1.0 indicating a measurement within ±1 SD of the consensus median value.
19
IOCCP-JAMSTEC 2018 Inter-calibration exercise
Table 6-1. Z-scores for nitrate+nitrite analyses.
Lab Sample #1
Sample #2
Sample #3
Sample #4
Sample #5
5 0.9 0.7
1.0 0.1 7 3.0 0.3 0.3 2.3 1.7 8 0.2 1.4 1.7 1.0 3.3
10 0.1 9.4 0.7 0.2 0.0 14 3.1 0.9 0.7 1.9 3.1 17 132.6 121.4 100.3 52.9 138.9 19 0.4 1.2 0.0 0.4 0.4 23 5.9 5.6 1.0 3.2 6.6 26 11.6 3.9 0.3 0.4 4.1 27 2.9
0.7 1.4 2.6
28 0.1
4.0 0.4 0.7 29 1.8
2.0 0.8 1.9
30 32 9.2
1.9 6.8
35 0.4 0.5 1.7 0.6 0.2 37
38 11.5 5.3 0.7 6.1 9.1 39 0.9 0.9 0.0 0.4 0.9 40 0.9 0.1 7.3 0.4 3.3 41 1.5 22.9 5.0 6.3 7.4 45
49 3.5 2.7 0.3 1.5 4.4 50 0.1 1.2 0.0 1.1 0.4 51 1.9
4.3 0.8 1.5
52 0.2
5.3 1.0 1.3 56 0.6 0.4 3.0 0.3 1.1 57 0.4 0.3 0.3 0.6 1.1 59 1.1 1.6 5.3 3.5 4.1 65 0.7 0.2 0.7 0.4 0.9 69 6.3
8.3 8.6
80 38.7 43.2 53.0 21.6 47.9 86 1.8 0.4 1.0 0.2 0.8 88 7.1
3.7 5.6 0.8
89 3.1 21.3 1.0 4.8 1.8 90 21.3 15.1 58.3 3.3 17.0 91 0.0
2.0 0.3 0.3
92 0.0
0.3 0.1 0.1 93 0.7 0.9 0.7 0.9 1.4
20
IOCCP-JAMSTEC 2018 Inter-calibration exercise
Table 6-1. Z-scores for nitrate+nitrite analyses (continued).
Lab Sample #1 Sample #2 Sample #3 Sample #4 Sample #5 95 0.4 4.6 1.7 0.3 0.1 98 4.5 1.7 2.8 4.3
101 6.3 6.7 0.5 9.3 102 1.4 0.0 0.1 4.9 106 1.7 14.7 1.0 0.8 15.6 107 1.1 3.3 0.7 1.0 109 1.1 1.0 0.7 0.7 0.0 111 7.1 10.0 8.6 5.1 112 0.1 1.0 1.1 0.3 113 1.0 0.9 1.7 1.4 0.1 114 1.6 1.0 1.4 1.6 118 19.4 2.3 5.2 22.1 124 0.1 0.8 7.7 1.4 0.9 125 1.0 1.3 0.3 0.1 0.6 129 135 6.3 1.4 7.5 136 137 1.9 1.3 0.3 1.6 1.1 138 0.1 0.3 0.2 0.4 139 140 6.1 0.8 3.8 141 0.2 1.0 1.1 2.7 143 7.0 7.8 1.3 3.1 7.9 148 3.6 1.9 2.7 2.6 1.1 149 79.4 59.2 30.3 5.9 77.8 150 15.1 4.7 5.2 14.6 151 153 19.0 10.4 20.4 155 1.3 1.3 1.0 2.4 2.4 156 4.7 3.9 2.3 1.6 5.0 157 1.3 0.2 3.3 1.1 0.1
21
IOCCP-JAMSTEC 2018 Inter-calibration exercise
Table 6-2. Z-scores for nitrate analyses.
Lab Sample #1 Sample #2 Sample #3 Sample #4 Sample #5
5 7 2.7 0.5 0.5 2.0 1.1
8 0.1 0.8 3.0 0.9 1.1 10 0.1 9.3 1.5 0.0 0.2 14 3.0 0.7 1.0 1.8 1.0 17 122.8 117.7 148.5 47.4 58.7 19 0.1 1.3 1.5 0.6 0.4 23 5.7 5.3 1.5 3.2 2.5 26 10.6 3.9 0.0 0.3 2.0 27 3.0
0.0 1.6 0.9
28 0.1
7.0 0.4 0.1 29
30 32 8.7
1.7 2.6
35 37 38 39 0.6 1.0 0.0 0.2 0.6
40 0.8 0.4 11.0 0.4 1.1 41 1.7 21.8 8.5 5.6 3.3 45 2.9
7.0 1.2 1.9
49 3.3 2.3 0.0 1.6 1.6 50 0.1 1.5 0.0 0.8 0.4 51 1.5
5.5 0.5 0.8
52 0.8
10.0 1.3 1.1 56 0.9 0.2 5.5 8.6 0.2 57 0.4 0.1 1.0 0.6 0.1 59 0.9 1.8 15.5 3.3 2.0 65
69 80 36.4 41.8 79.5 19.7 19.9
86 1.9 0.5 1.5 0.3 0.6 88 6.8
5.5 5.2 0.1
89 3.4 0.5 0.0 4.9 0.6 90 20.8 14.4 85.0 3.1 6.9 91
92 0.2
0.5 0.0 0.3 93 0.7 0.6 0.5 0.7 0.3
22
IOCCP-JAMSTEC 2018 Inter-calibration exercise
Table 6-2. Z-scores for nitrate analyses (continued).
Lab Sample #1 Sample #2 Sample #3 Sample #4 Sample #5 95 0.2 4.2 1.5 0.2 0.2 98
101 2.0 12.0 0.7 2.3 102 1.3 0.5 0.0 1.8 106 1.3 14.4 1.0 1.0 6.8 107 0.9 4.5 0.6 0.7 109 0.8 0.8 0.5 0.6 0.2 111 6.2 12.5 7.4 2.3 112 113 1.1 0.7 1.5 1.1 0.2 114 118 18.4 3.5 4.8 9.0 124 0.2 0.4 12.5 1.4 0.8 125 0.6 1.4 1.0 0.3 0.4 129 3.7 1.5 1.4 1.7 135 136 4.5 11.5 0.9 2.6 137 1.6 1.4 0.5 1.4 0.7 138 0.3 0.5 0.0 0.1 139 1.6 0.9 47.5 0.6 0.3 140 141 0.4 1.0 0.8 1.4 143 6.6 7.4 1.5 3.0 3.1 148 3.1 1.7 3.5 2.0 0.7 149 150 151 13.2 107.5 14.2 10.5 153 17.3 9.6 9.0 155 1.5 1.0 2.5 0.8 156 4.8 3.8 2.5 1.7 1.9 157 1.0 0.5 3.5 0.8 0.4
23
IOCCP-JAMSTEC 2018 Inter-calibration exercise
Table 6-3. Z-scores for nitrite analyses.
Lab Sample #1 Sample #2 Sample #3 Sample #4 Sample #5
5 0.0 1.0 0.0 1.0 1.0 7 1.0 0.0 0.0 1.0 0.0 8 1.0 0.0 1.0 1.0 0.0
10 1.0 0.0 1.0 0.0 0.0 14 1.0 0.0 0.0 1.0 1.0 17 11.0 12.0 4.0 5.0 3.0 19 1.0 2.0 2.0 1.0 2.0 23 0.0 0.0 1.0 1.0 1.0 26 0.0 1.0 1.0 0.0 1.0 27 1.0
2.0 1.0 2.0
28 4.0
2.0 2.0 3.0 29 1.0
1.0 0.0 1.0
30 7.0 19.0 18.0 24.0 12.0 32
35 0.0 1.0 1.0 0.0 0.0 37
38 1.0 0.0 1.0 0.0 0.0 39 0.0 1.0 1.0 0.0 1.0 40
0.0
1.0
41 0.0 2.0 1.0 0.0 2.0 45 0.0
0.0 0.0 1.0
49 1.0 1.0 0.0 1.0 1.0 50 1.0 1.0 0.0 0.0 0.0 51 1.0
2.0 1.0 2.0
52 1.0
1.0 0.0 0.0 56 2.0 1.0 2.0 2.0 1.0 57 2.0 1.0 1.0 1.0 1.0 59 1.0 2.0 0.0 1.0 1.0 65
69 80 1.0 2.0 0.0 3.0 1.0
86 0.0 0.0 0.0 1.0 0.0 88 1.0
0.0 1.0 1.0
89 4.0 6.0 3.0 4.0 5.0 90 11.0 1.0 4.0 0.0 1.0 91
92 0.0
0.0 1.0 1.0 93 3.0 2.0 2.0 3.0 2.0
24
IOCCP-JAMSTEC 2018 Inter-calibration exercise
Table 6-3. Z-scores for nitrite analyses (continued).
Lab Sample #1 Sample #2 Sample #3 Sample #4 Sample #5 95 1.0 0.0 2.0 1.0 1.0 98
101 5.0 5.0 5.0 3.0 102 2.0 2.0 3.0 1.0 106 1.0 1.0 1.0 1.0 0.0 107 1.0 1.0 1.0 2.0 109 0.0 1.0 1.0 0.0 2.0 111 4.0 4.0 3.0 4.0 112 0.0 1.0 0.0 1.0 113 1.0 2.0 2.0 0.0 1.0 114 118 1.0 0.0 1.0 0.0 124 125 2.0 2.0 3.0 2.0 2.0 129 1.0 1.0 2.0 1.0 135 0.0 0.0 136 9.0 8.0 10.0 7.0 137 1.0 0.0 0.0 1.0 1.0 138 1.0 1.0 0.0 1.0 139 6.0 5.0 2.0 3.0 5.0 140 141 1.0 1.0 0.0 1.0 143 2.0 1.0 0.0 0.0 1.0 148 2.0 1.0 1.0 2.0 3.0 149 7.0 8.0 5.0 4.0 7.0 150 151 4.0 2.0 3.0 4.0 153 5.0 155 1.0 1.0 1.0 1.0 1.0 156 3.0 4.0 2.0 1.0 3.0 157 4.0 0.0 3.0 4.0 2.0
25
IOCCP-JAMSTEC 2018 Inter-calibration exercise
Table 6-4. Z-scores for phosphate analyses.
Lab Sample #1 Sample #2 Sample #3 Sample #4 Sample #5
5 1.7 0.7 7.0 2.0 3.0 7 1.3 2.0 1.0 0.0 1.7 8 1.3 3.0 5.0 0.5 1.7
10 0.7 0.7 1.0 0.5 0.3 14 0.7 0.7 0.0 0.3 17 2.3 8.0 7.0 0.5 8.0 19 0.3 0.2 0.0 1.0 0.3 23 1.3 2.7 1.0 3.5 2.0 26 1.3 0.7 0.0 1.5 1.3 27 0.3 0.0 0.5 1.0 28 0.0 10.0 1.5 1.3 29 0.3 1.0 1.0 0.3 30 2.7 11.0 143.0 10.0 17.0 32 7.0 1.0 0.7 35 0.3 0.2 0.0 0.5 0.0 37 0.3 0.0 0.0 1.0 0.7 38 0.7 1.2 2.0 1.0 0.7 39 0.7 1.0 0.0 1.0 1.0 40 4.0 1.8 1.0 5.7 41 1.3 1.2 1.0 1.5 2.0 45 0.7 1.5 0.3 49 50 0.3 0.7 0.0 0.5 0.3 51 0.3 0.0 0.7 52 0.3 0.0 0.5 1.3 56 0.7 0.5 1.0 1.0 1.0 57 2.0 1.0 1.0 1.0 2.3 59 1.3 0.2 6.0 0.5 0.0 65 0.0 0.0 3.0 0.5 0.3 69 1.3 4.0 52.0 3.3 80 6.0 1.3 17.0 13.5 7.7 86 0.0 0.8 0.0 0.0 0.3 88 4.7 1.0 5.0 3.3 89 11.3 25.2 2.0 9.0 18.7 90 4.0 3.8 3.0 1.5 3.0 91 0.3 1.0 1.0 0.7 92 0.0 2.0 1.0 0.0 93 1.7 0.8 0.0 0.5 2.0
26
IOCCP-JAMSTEC 2018 Inter-calibration exercise
Table 6-4. Z-scores for phosphate analyses (continued).
Lab Sample #1 Sample #2 Sample #3 Sample #4 Sample #5 95 2.3 1.0 1.0 1.0 11.3 98 37.0
100.0 42.5 51.7
101 1.0
0.0 2.0 0.7 102 5.3
1.0 3.0 8.3
106 3.0 3.2 0.0 3.0 3.7 107 0.3
0.0 1.0 1.3
109 0.3 0.2 0.0 0.5 0.3 111 11.3
19.0 3.5 0.3
112 0.3
0.0 0.5 0.3 113 0.7 0.3 4.0 1.0 1.0 114 1.0 0.5 1.0 0.5 1.0 118 0.0
1.0 0.5 0.3
124 0.3 0.2
1.5 0.3 125 2.0 2.3 2.0 0.0 2.3 129 1.3
7.0 3.5 1.3
135 0.3
1.0 1.0 136 3.7
2.0 1.0 1.7
137 0.7 1.3 1.0 1.0 1.0 138 0.3
2.0 1.5 0.0
139 0.7 0.2 2.0 1.0 0.7 140 0.3
0.5 1.3
141 1.0
1.0 1.5 1.0 143 1.3 2.5 1.0 0.5 1.0 148 1.7 1.0 5.0 1.5 1.0 149 1.3 1.8 8.0 2.5 1.3 150 3.7
49.0 8.5 4.0
151 3.3
3.0 0.0 1.3 153 1.3
1.0 20.3
155 1.7 3.8 4.0 2.0 0.3 156 1.3 0.7 1.0 1.0 1.0 157 0.7 1.8 5.0 0.5 1.7
27
IOCCP-JAMSTEC 2018 Inter-calibration exercise
Table 6-5. Z-scores for silicate analyses.
Lab Sample #1 Sample #2 Sample #3 Sample #4 Sample #5
5 1.4 0.4 5.7 0.5 0.7 7 0.8 0.7 0.5 0.9 1.8 8 1.3 0.5 1.5 0.7 1.7
10 1.1 1.5 1.0 0.0 1.2 14 0.7 0.2 9.5 0.1 0.9 17 15.8 12.8 7.8 12.3 15.9 19 1.2 1.2 0.2 1.0 1.3 23 2.6 0.5 1.7 0.7 1.0 26 0.8 1.6 0.7 0.8 3.1 27 0.5 0.5 0.7 1.4 28 0.5 0.2 0.7 0.5 29 5.8 1.2 1.3 9.0 30 7.9 22.8 1.0 3.7 29.1 32 1.7 3.7 1.5 0.4 35 0.6 0.7 0.7 0.4 0.7 37 38 3.6 3.4 0.0 0.7 0.3 39 1.0 0.5 0.0 0.6 1.0 40 1.4 1.4 1.0 1.2 41 1.6 1.8 1.0 1.6 2.4 45 1.9 0.5 1.9 0.5 49 0.3 1.3 3.2 0.5 0.4 50 1.2 0.2 1.7 2.4 3.0 51 1.2 0.5 0.7 52 0.1 1.0 0.9 0.4 56 1.0 0.6 1.0 1.0 1.0 57 1.1 0.4 0.7 1.2 1.4 59 0.4 1.3 11.3 1.8 1.2 65 0.2 0.1 1.2 0.2 0.3 69 80 1.1 10.2 4.2 0.4 6.4 86 1.2 1.0 2.2 1.0 2.2 88 0.0 1.0 0.2 0.1 89 0.5 0.0 0.5 0.4 90 5.0 4.5 0.7 4.1 5.6 91 0.7 1.2 0.4 0.9 92 0.9 0.8 0.8 1.1 93 0.2 0.5 0.8 0.1 0.4
28
IOCCP-JAMSTEC 2018 Inter-calibration exercise
Table 6-5. Z-scores for silicate analyses (continued).
Lab Sample #1 Sample #2 Sample #3 Sample #4 Sample #5 95 6.6 4.7 1.0 3.0 7.0 98 20.3 11.5 11.5 22.9
101 3.2 0.8 1.8 3.1 102 5.2 2.0 3.0 5.5 106 12.1 10.4 1.0 2.8 11.4 107 1.7 1.0 2.7 1.1 109 4.1 2.7 1.2 2.8 4.1 111 4.8 3.5 3.1 4.9 112 0.7 1.0 0.4 1.0 113 1.0 0.6 1.0 1.8 1.9 114 4.7 0.7 2.5 118 4.3 10.0 3.3 3.5 124 0.5 1.2 0.9 1.5 125 0.0 0.4 0.8 0.2 0.1 129 1.4 2.3 0.7 1.8 135 0.4 0.3 0.0 136 4.2 0.5 1.3 3.0 137 3.9 2.6 1.0 2.8 4.0 138 0.6 10.5 1.8 0.5 139 1.4 1.5 8.8 1.0 0.9 140 0.3 1.8 0.5 141 0.8 3.5 0.0 0.7 143 148 6.7 1.8 2.8 3.5 3.7 149 27.2 28.3 1.7 16.5 28.3 150 4.1 0.2 2.3 4.3 151 8.2 9.0 3.2 10.8 153 12.2 3.0 13.0 155 0.1 0.3 0.5 0.8 0.0 156 1.6 0.6 0.8 1.1 3.3 157 4.9 0.9 50.3 8.8 2.4
29
IOCCP-JAMSTEC 2018 Inter-calibration exercise
Table 6-6. Combined Z-scores for phosphate and nitrate+nitrite analyses.
Lab Sample #1 Sample #2 Sample #3 Sample #4 Sample #5
5 1.3 0.7 1.5 1.6 7 2.2 1.2 0.7 1.2 1.7 8 0.8 2.2 3.4 0.8 2.5
10 0.4 5.1 0.9 0.4 0.2 14 1.9 0.8 1.0 1.7 17 67.5 64.7 53.7 26.7 73.5 19 0.4 0.7 0.0 0.7 0.4 23 3.6 4.2 1.0 3.4 4.3 26 6.5 2.3 0.2 1.0 2.7 27 1.6 0.4 1.0 1.8 28 0.1 7.0 1.0 1.0 29 1.1 1.5 0.9 1.1 30 32 8.1 1.5 3.8 35 0.4 0.4 0.9 0.6 0.1 37 38 6.1 3.3 1.4 3.6 4.9 39 0.8 1.0 0.0 0.7 1.0 40 2.5 1.0 0.7 4.5 41 1.4 12.1 3.0 3.9 4.7 45 1.8 1.4 1.1 49 50 0.2 1.0 0.0 0.8 0.4 51 1.1 0.4 1.1 52 0.3 2.7 0.8 1.3 56 0.7 0.5 2.0 0.7 1.1 57 1.2 0.7 0.7 0.8 1.7 59 1.2 0.9 5.7 2.0 2.1 65 0.4 0.1 1.9 0.5 0.6 69 3.8 30.2 6.0 80 22.4 22.3 35.0 17.6 27.8 86 0.9 0.6 0.5 0.1 0.6 88 5.9 2.4 5.3 2.1 89 7.2 23.3 1.5 6.9 10.3 90 12.7 9.5 30.7 2.4 10.0 91 0.2 1.5 0.7 0.5 92 0.0 1.2 0.6 0.1 93 1.2 0.9 0.4 0.7 1.7
30

IOCCP-JAMSTEC 2018 Inter-calibration exercise
Table 6-6. Combined Z-scores for phosphate and nitrate+nitrite analyses (continued).
Lab Sample #1 Sample #2 Sample #3 Sample #4 Sample #5 95 1.4 2.8 1.4 0.7 5.7 98 20.8 50.9 22.7 28.0
101 3.7 3.4 1.3 5.0 102 3.4 0.5 1.6 6.6 106 2.4 9.0 0.5 1.9 9.7 107 0.7 1.7 0.9 1.2 109 0.7 0.6 0.4 0.6 0.2 111 9.2 14.5 6.1 2.7 112 0.2 0.5 0.8 0.3 113 0.9 0.6 2.9 1.2 0.6 114 1.3 1.0 1.0 1.3 118 9.7 1.7 2.9 11.2 124 0.2 0.5 1.5 0.6 125 1.5 1.8 1.2 0.1 1.5 129 2.5 4.3 2.5 1.5 135 3.3 1.2 4.3 136 4.1 6.8 1.0 2.2 137 1.3 1.3 0.7 1.3 1.1 138 0.2 1.2 0.9 0.2 139 1.2 0.6 24.8 0.8 0.5 140 3.2 0.7 2.6 141 0.6 1.0 1.3 1.9 143 4.2 5.2 1.2 1.8 4.5 148 2.7 1.5 3.9 2.1 1.1 149 40.4 30.5 19.2 4.2 39.6 150 9.4 26.9 6.9 9.3 151 8.3 55.3 7.1 5.9 153 10.2 5.7 20.4 155 1.5 2.6 2.5 2.2 1.4 156 3.0 2.3 1.7 1.3 3.0 157 1.0 1.0 4.2 0.8 0.9
31
IOCCP-JAMSTEC 2018 Inter-calibration exercise
Table 6-7. Combined Z-scores for phosphate, nitrate+nitrite, and silicate analyses.
Lab Sample #1 Sample #2 Sample #3 Sample #4 Sample #5
5 1.3 0.6 1.2 1.3 7 1.7 1.0 0.6 1.1 1.7 8 0.9 1.6 2.7 0.7 2.2
10 0.6 3.9 0.9 0.2 0.5 14 1.5 0.6 0.7 1.4 17 50.2 47.4 38.4 21.9 54.3 19 0.6 0.9 0.1 0.8 0.7 23 3.3 2.9 1.2 2.5 3.2 26 4.6 2.1 0.3 0.9 2.8 27 1.2 0.4 0.9 1.7 28 0.2 4.7 0.9 0.8 29 2.6 1.4 1.0 3.7 30 32 6.0 1.5 2.6 35 0.4 0.5 0.8 0.5 0.3 37 38 5.3 3.3 0.9 2.6 3.4 39 0.9 0.8 0.0 0.7 1.0 40 2.1 1.1 0.8 3.4 41 1.5 8.6 2.3 3.1 3.9 45 1.8 1.5 0.9 49 50 0.5 0.7 0.6 1.3 1.2 51 1.1 0.4 1.0 52 0.2 2.1 0.8 1.0 56 0.8 0.5 1.7 0.8 1.0 57 1.2 0.6 0.7 0.9 1.6 59 0.9 1.0 7.5 1.9 1.8 65 0.3 0.1 1.6 0.4 0.5 69 80 15.3 18.2 24.7 11.8 20.7 86 1.0 0.7 1.1 0.4 1.1 88 3.9 1.9 3.6 1.4 89 5.0 15.5 4.8 7.0 90 10.1 7.8 20.7 3.0 8.5 91 0.3 1.4 0.6 0.6 92 0.3 1.0 0.6 0.4 93 0.9 0.7 0.5 0.5 1.3
32
IOCCP-JAMSTEC 2018 Inter-calibration exercise
Table 6-7. Combined Z-scores for phosphate, nitrate+nitrite, and silicate analyses (continued).
Lab Sample #1 Sample #2 Sample #3 Sample #4 Sample #5 95 3.1 3.4 1.2 1.4 6.1 98 20.6 37.7 18.9 26.3
101 3.5 2.5 1.4 4.4 102 4.0 1.0 2.0 6.2 106 5.6 9.4 0.7 2.2 10.2 107 1.0 1.4 1.5 1.1 109 1.8 1.3 0.6 1.3 1.5 111 7.7 10.8 5.1 3.4 112 0.4 0.7 0.7 0.5 113 0.9 0.6 2.2 1.4 1.0 114 2.4 0.9 1.5 118 7.9 4.4 3.0 8.6 124 0.3 0.7 1.3 0.9 125 1.0 1.3 1.0 0.1 1.0 129 2.1 3.6 1.9 1.6 135 2.3 0.9 2.8 136 4.1 4.7 1.1 2.4 137 2.2 1.7 0.8 1.8 2.0 138 0.3 4.3 1.2 0.3 139 1.2 0.9 19.4 0.9 0.6 140 2.2 1.0 1.9 141 0.7 1.8 0.9 1.5 143 148 4.0 1.6 3.5 2.5 1.9 149 36.0 29.8 13.3 8.3 35.8 150 7.6 18.0 5.3 7.6 151 8.2 39.8 5.8 7.5 153 10.8 4.8 17.9 155 1.0 1.8 1.8 1.7 0.9 156 2.5 1.7 1.4 1.2 3.1 157 2.3 1.0 19.5 3.5 1.4
33
IOCCP-JAMSTEC 2018 Inter-calibration exercise
5.5 Normalized cumulative distributions of reported nitrate, phosphate, and silicate concentrations in the 2008, 2012, 2015, and 2018 I/C studies
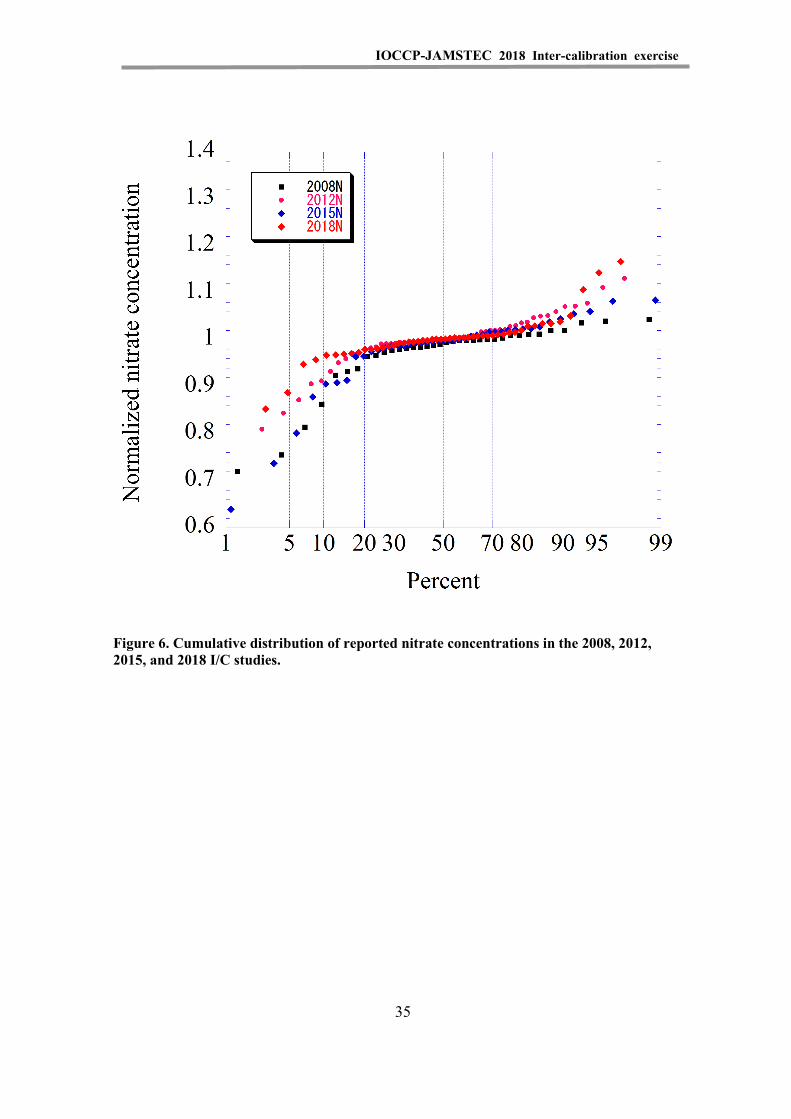
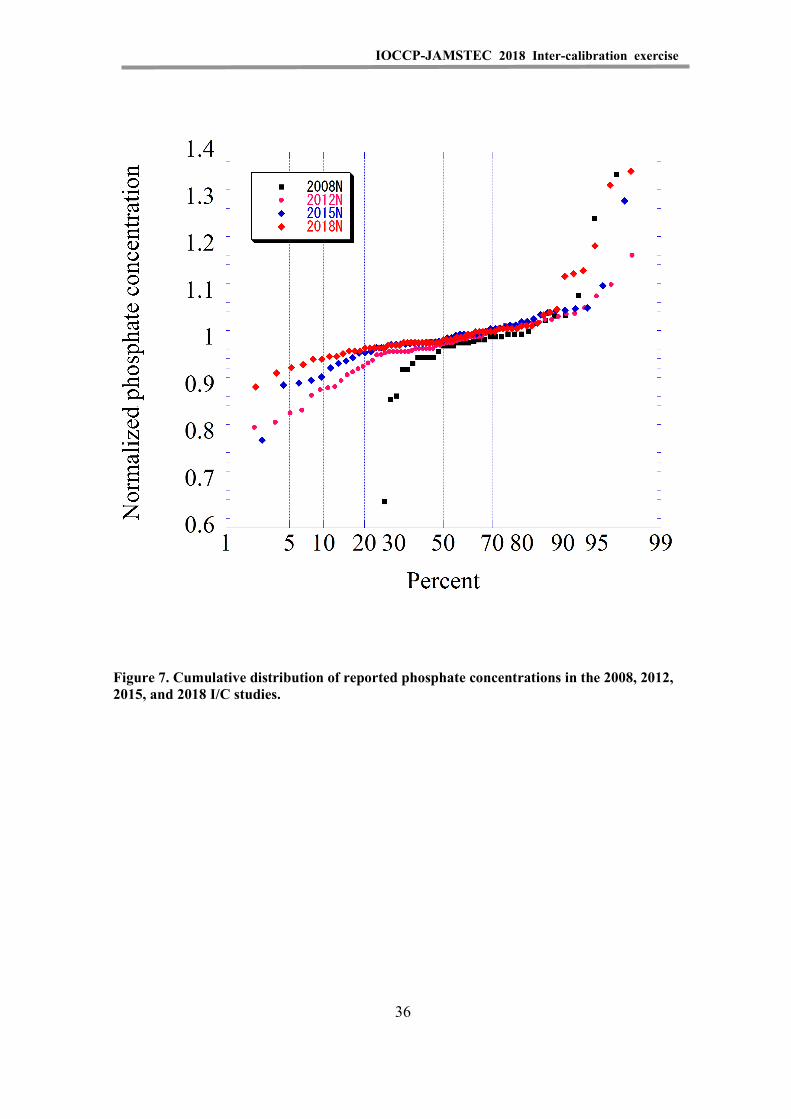
Normalized cumulative distributions of reported nitrate, phosphate, and silicate concentrations in the 2008, 2012, 2015, and 2018 I/C studies are shown in Figures 6–8.
Each reported concentration from a participating laboratory was divided by the consensus median (2008 I/C and 2012 I/C) or certified value (2015 I/C and 2018 I/C) of each comparison study to compare comparability among the laboratories in each I/C exercise in 2008, 2012, 2015, and 2018. Y-axis in Figure 6, 7 and 8 show concentration ratio to consensus median (2008 I/C and 2012 I/C) or certified value (2015 I/C and 2018 I/C) while X-axis show rank of each laboratory in terms of percent in each I/C. Phosphate concentrations were around 1.5 μmol kg–1 in four I/C exercises, Nitrate concentrations ranged from 24 to 35 μmol kg–1in four I/C exercises. Silicate concentrations were around 55-66 μmol kg–1 in 2008, 2012 and 2018 I/C exercises and 101 μmol kg–1 in 2015 I/C exercise due to availability of data.
The normalized cumulative distributions for nitrate and phosphate in 2018 were improved (i.e., flatter) compared with the normalized cumulative distributions of previous IC exercises. This improvement might indicate that comparability of nitrate and phosphate analyses among the laboratories became gradually better from 2008 to 2018. In contrast to the nitrate and phosphate results, the normalized cumulative distributions for silicate were similar in 2018 and in previous years. The comparability of silicate analyses among the laboratories apparently did not change from 2008 to 2018.
34
IOCCP-JAMSTEC 2018 Inter-calibration exercise
Figure 6. Cumulative distribution of reported nitrate concentrations in the 2008, 2012, 2015, and 2018 I/C studies.
35
IOCCP-JAMSTEC 2018 Inter-calibration exercise
Figure 7. Cumulative distribution of reported phosphate concentrations in the 2008, 2012, 2015, and 2018 I/C studies.
36
IOCCP-JAMSTEC 2018 Inter-calibration exercise
Figure 8. Cumulative distribution of reported silicate concentrations in the 2008, 2012, 2015, and 2018 I/C studies.
37
IOCCP-JAMSTEC 2018 Inter-calibration exercise
6. Comparison with certified values and current status ofCRM use
We see excellent agreement between consensus median/mean and certified values within uncertainty as shown in Table 4. However, small discrepancies exist among core laboratories that reported close-to-consensus values and between those laboratories and certified values, as shown in Figures 1 to 5.
In this IC exercise, participants were asked about their methodology and about the instruments they used to measure nutrient concentrations in the CRM/RM. For the main four determinants (nitrate+nitrite, nitrate, nitrite, phosphate, and silicate), 28 laboratories among the 69 laboratories stated that they used the following:
CRMs: KANSO 25 laboratories SCOR-JAMSTEC 2 laboratories NMIJ 1 laboratory
RMs: MOOS-3 1 laboratory VKI-Eurofin 2 laboratories Quasimeme 2 laboratories EstoniaRM 1 laboratory OSIL 2 laboratories WAKO 1 laboratory Reagecon RM 1 laboratory
Thirty-eight laboratories among the 69 laboratories used a CRM/RM; the remaining 31 laboratories did not use a CRM/RM or did not reply to the questionnaire. It is obvious that the number of laboratories that use CRMs has been increasing since 2008, especially after the GO-SHIP nutrients manual was published in 2010 (Hyde et al., 2010). In general, the results reported by laboratories that used CRMs are located in the central part of the ranked plots, and their Z-scores were good in general, as expected.
The results of this IC exercise imply that the majority of the participating laboratories are very capable of measuring nutrient concentrations in seawater. Use of CRMs will further enhance the comparability of their assay results. The results could be SI traceable in the near future.
7. Discussion and conclusions
In each of Figures 1 to 5, the ranked concentration plots for a particular nutrient would be proportional and roughly parallel to each other for samples with different
38
IOCCP-JAMSTEC 2018 Inter-calibration exercise
nutrient concentrations if each laboratory compensated appropriately for the nonlinearity of the calibration curves. However, as is evident in Figures 1 to 5, there were non-proportional results from some laboratories for all of the determinants. This was also the case in the previous I/C studies.
These results indicate that nonlinearity of the calibration curves for nutrient analysis is a significant cause of lower comparability of the nutrient data. The implication is that we need to use a set of nutrient CRMs that includes the whole range of nutrient concentrations in the world’s oceans in order to maintain comparability of results throughout that range of nutrient concentrations.
The normalized cumulative distributions of nitrate and phosphate were better in 2018 than in previous years. The curves were flatter compared with the normalized cumulative distributions in previous IC exercises. The indication is that comparability of nitrate and phosphate analyses among the laboratories gradually improved from 2008 to 2018. In contrast with the nitrate and phosphate results, the normalized cumulative distribution for silicate in 2018 was similar to the distributions from previous years. The indication is that comparability of silicate analyses among the laboratories did not change during the same time period.
Acknowledgements
As the organizer of this I/C exercise, Michio Aoyama expresses appreciation to KIOST and to all participating laboratories for their contribution to this 2017/2018 I/C exercise. The authors also thank the support team of Marine Works Japan for this I/C study. We especially thank Tomomi SONE and Yasuhiro ARII for their help in creating the database of the results of this I/C exercise and for preparing the tables and figures for this report.
39
IOCCP-JAMSTEC 2018 Inter-calibration exercise
References
[AMC] Analytical Methods Committee, 2001: Robust Statistics: a method of coping with outliers. Technical Brief No.6 April 2001
Aminot, A. and R. Kerouel, 1991: Autoclaved seawater as a reference material for the determination of nitrate and phosphate in seawater. Anal. Chim. Acta, 248, 277–283.
Aminot, A. and R. Kerouel, 1995: Reference material for nutrients in seawater: stability of nitrate, nitrite, ammonia and phosphate in autoclaved samples. Mar. Chem., 49, 221–232.
Aminot, A. and D. S. Kirkwood, 1995: Report on the results of the fifth ICES Inter-comparison study for Nutrients in Seawater, ICES Cooperative Research Report No. 213, 79 pp.
Aoyama, M., 2006: 2003 Intercomparison Exercise for Reference Material for Nutrients in Seawater in a Seawater Matrix, Technical Reports of the Meteorological Research Institute, No.50, 91 pp, Tsukuba, Japan.DOI:10.11483/mritechrepo.50
Aoyama, M., S. Becker, M. Dai, H. Daimon, L. I. Gordon, H. Kasai, R. Kerouel, N. Kress, D. Masten, A. Murata, N. Nagai, H. Ogawa, H. Ota, H. Saito, K. Saito, T. Shimizu, H. Takano, A. Tsuda, K. Yokouchi, A. Youenou, Analytical Science, 2007, Recent comparability of Oceanographic Nutrients Data: Results of a 2003 Intercomparison Exercise using Reference Materials, Analytical Science, 23, 1151–1154.
Aoyama, M., J. Barwell-Clarke, S. Becker, M. Blum, Braga E. S., S. C. Coverly,E. Czobik, I. Dahllof, M. H. Dai, G. O. Donnell, C. Engelke, G. C. Gong, Gi-Hoon Hong, D. J. Hydes, M. M. Jin, H. Kasai, R. Kerouel, Y. Kiyomono, M. Knockaert, N. Kress, K. A. Krogslund, M. Kumagai, S. Leterme, Yarong Li, S. Masuda, T. Miyao, T. Moutin, A. Murata, N. Nagai, G.Nausch, M. K. Ngirchechol, A. Nybakk, H. Ogawa, J. van Ooijen, H. Ota, J. M. Pan, C. Payne, O. Pierre-Duplessix, M. Pujo-Pay, T. Raabe, K. Saito, K. Sato, C. Schmidt, M. Schuett, T. M. Shammon, J. Sun, T. Tanhua, L. White, E.M.S. Woodward, P. Worsfold, P. Yeats, T. Yoshimura, A.Youenou, J. Z. Zhang, 2008: 2006 Inter-laboratory Comparison Study for Reference Material for Nutrients in Seawater, Technical Reports of the Meteorological Research Institute, No. 58, 104 pp, Tsukuba, Japan.DOI:10.11483/mritechrepo.58
Aoyama, Michio, Carol Anstey, Janet Barwell-Clarke, François Baurand, Susan Becker, Marguerite Blum, Stephen C. Coverly , Edward Czobik, Florence D’amico, Ingela Dahllöf, Minhan Dai, Judy Dobson, Magali Duval, Clemens Engelke, Gwo-Ching Gong, Olivier Grosso, Atsushi Hirayama, Hiroyuki Inoue, Yuzo Ishida, David J. Hydes, Hiromi Kasai, Roger Kerouel, Marc Knockaert, Nurit Kress, Katherine A. Krogslund, Masamitsu Kumagai, Sophie C. Leterme, Claire Mahaffey, Hitoshi Mitsuda, Pascal Morin, Thierry Moutin, Dominique Munaron, Akihiko Murata, Günther Nausch, Hiroshi Ogawa, Jan van Ooijen, Jianming Pan, Georges Paradis, Chris Payne, Olivier Pierre-Duplessix40, Gary Prove41, Patrick Raimbault42, Malcolm Rose43, Kazuhiro Saito, Hiroaki Saito, Kenichiro Sato, Cristopher Schmidt, Monika Schütt, Theresa M. Shammon, Solveig Olafsdottir0, Jun Sun, Toste Tanhua, Sieglinde Weigelt-Krenz, Linda White, E. Malcolm S. Woodward,
40
IOCCP-JAMSTEC 2018 Inter-calibration exercise
Paul Worsfold, Takeshi Yoshimura, Agnès Youénou, Jia-Zhong Zhang, 2010, 2008 Inter-laboratory Comparison Study for Reference Material for Nutrients in Seawater, Technical Reports of the Meteorological Research Institute, No. 60, 134 pp, Tsukuba, Japan. DOI:10.11483/mritechrepo.60
Aoyama, Michio, Mara Abad, Carol Anstey, Muhamed Ashraf P, Adil Bakir, Susan Becker, Steven Bell, Marguerite Blum, Rebecca Briggs, Florian Caradec, Thierry Cariou, Matt Church, Laurent Coppola, Mike Crump, Susan Curless, Minhan Dai, Anne Daniel, Elisabete de Santis Braga, Miriam E. Solis, David Faber, Tamara Fraser, Kjell Gundersen, Sólvá Jacobsen, Marc Knockaert, Taketoshi Kodama, Martina Kralj, Nurit Kress, Silvie Lainela, Jesús Ledesma, Xinxin Li, Jae-Hyun Lim, Martina Lohmann, Christian Lonborg, Kai-Uwe Ludwichowski, Frank Malien, Francesca Margiotta, Trevor McCormack, Iban Murillo, Hema Naik, Günther Nausch, Sólveig Rósa Ólafsdóttir, Jan van Ooijen, Rodolfo Paranhos, Chris Payne, Olivier Pierre-Duplessix, Gary Prove, Emilie Rabiller, Patrick Raimbault, Laura Reed, Christine Rees, TaeKeun Rho, Jun Sun, Beata Szymczycha, Sukeyoshi Takatani, Alison Taylor, Peter Thamer, Sinhué Torres-Valdés, Katherine Trahanovsky, Howard Waldron, Pamela Walsham, Lifang Wang, Tao Wang, Sieglinde Weigelt-Krenz, Linda White, Malcolm Woodward, Takeshi Yoshimura, Jia-Zhong Zhang, 2016, IOCCP-JAMSTEC 2015 Inter-laboratory Calibration Exercise of a Certified Reference Material for Nutrients in Seawater, IOCCP Report Number 1/2016, ISBN 978-4-901833-23-3
Clancy, V. and S. Willie, 2003: NOAA/NRC Inter-comparison for Nutrients in Seawater, NOAA Technical Memorandum NOS NCCOS CCMA 158, 32 pp.
Clancy, V. and S. Willie, 2004: Preparation and certification of a reference material for the determination of nutrients in seawater. Anal. Bioanal. Chem., 378 (5), 1239–1242.
[ICES] International Council for the Exploration of the Sea, 1967: Report on the analysis of phosphate at the ICES intercalibration trials of chemical methods held at Copenhagen, 1966. ICES CM 1967/C:20.
[ICES] International Council for the Exploration of the Sea, 1977: The International Intercalibration Exercise for Nutrient Methods, ICES Cooperative Research Report No. 67. 44 pp.
D.J. Hydes, M. Aoyama, A. Aminot, K. Bakker, S. Becker, S. Coverly, A. Daniel, A.G. Dickson, O. Grosso, R. Kerouel, J. van Ooijen, K. Sato, T. Tanhua, E.M.S. Woodward, and J. Z. Zhang, DETERMINATION OF DISSOLVED NUTRIENTS (N, P, SI) IN SEAWATER WITH HIGH PRECISION AND INTER-COMPARABILITY USING GAS-SEGMENTED CONTINUOUS FLOW ANALYSERS, GO-SHIP Repeat Hydrography Manual: A Collection of Expert Reports and Guidelines IOCCP Report No. 14, ICPO Publication Series No. 134, Version 1, 2010
Kirkwood, D. S., A. Aminot, and M. Perttila, 1991: Report on the results of the fourth ICES Inter-comparison study for Nutrients in Seawater, ICES Cooperative Research Report No. 174, 83 pp.
[UNESCO] United Nations Educational, Scientific and Cultural Organization, 1965: Report on the intercalibration measurements in Copenhagen, 9–13 June 1965, UNESCO Technical Papers in Marine Science, No. 3. 14 pp.
41
IOCCP-JAMSTEC 2018 Inter-calibration exercise
[UNESCO] United Nations Educational, Scientific and Cultural Organization, 1967: Report on intercalibration measurements, Leningrad, 24–28 May 1966, Copenhagen, September 1966, UNESCO Technical Papers in Marine Science, No. 9. 114 pp.
[UNESCO] United Nations Educational, Scientific and Cultural Organization, 1991: IOC-IAEA-UNEP Group of Experts on Standards and Reference Materials (GESREM), 2nd session, 12 pp.
[UNESCO] United Nations Educational, Scientific and Cultural Organization, 1992: IOC-IAEA-UNEP Group of Experts on Standards and Reference Materials (GESREM), 3rd session, 16 pp.
Willie, S. and V. Clancy, 2000: NOAA/NRC Inter-comparison for Nutrients in Seawater, NOAA Technical Memorandum NOS NCCOS CCMA 143, 176 pp
42
IOCCP-JAMSTEC 2018 Inter calibration exercise
Appendix I
Table A1 List of participants
Table A2 Cross reference for Lab numbers in 2018, 2015, 2012, 2008, 2006 and 2003 I/C studies
1

IOCCP-JAMSTEC 2018 Inter calibration exercise
2
IOCCP-JAMSTEC 2018 Inter calibration exercise
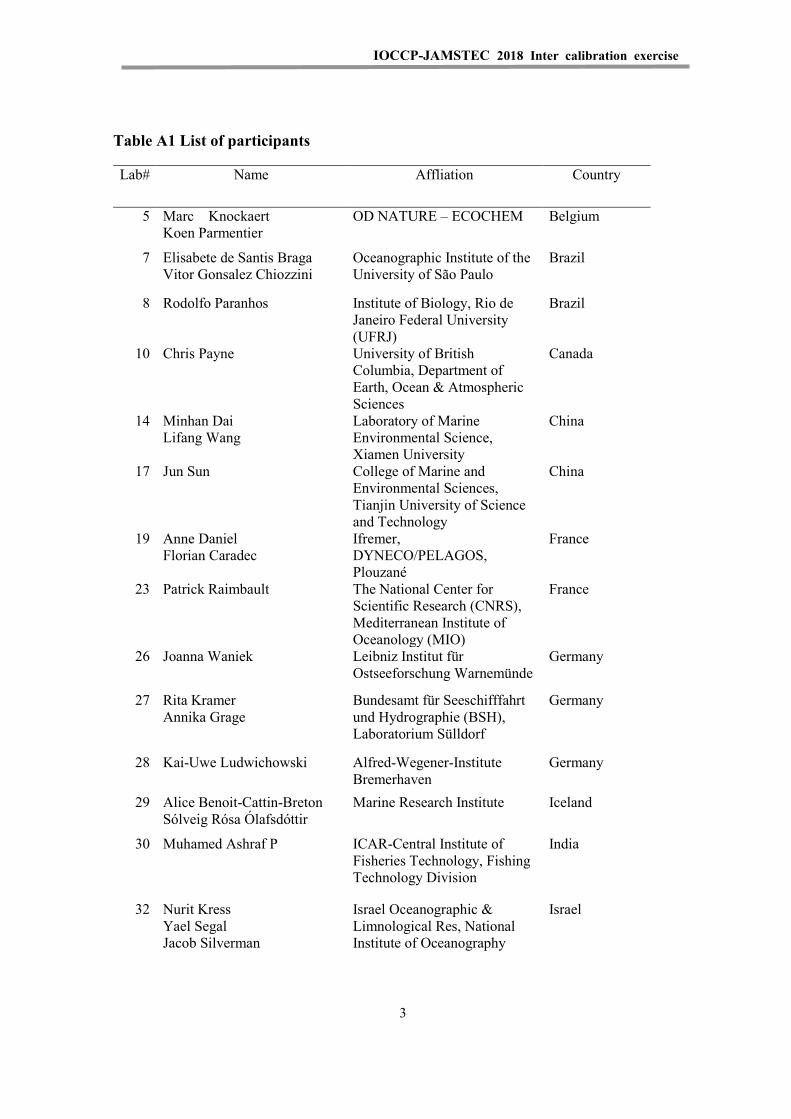
Table A1 List of participants
Lab# Name Affliation Country
5 Marc Knockaert Koen Parmentier
OD NATURE – ECOCHEM Belgium
7 Elisabete de Santis Braga Vitor Gonsalez Chiozzini
Oceanographic Institute of the University of São Paulo
Brazil
8 Rodolfo Paranhos Institute of Biology, Rio de Janeiro Federal University (UFRJ)
Brazil
10 Chris Payne University of British Columbia, Department of Earth, Ocean & Atmospheric Sciences
Canada
14 Minhan Dai Lifang Wang
Laboratory of Marine Environmental Science, Xiamen University
China
17 Jun Sun College of Marine and Environmental Sciences, Tianjin University of Science and Technology
China
19 Anne Daniel Florian Caradec
Ifremer, DYNECO/PELAGOS, Plouzané
France
23 Patrick Raimbault The National Center for Scientific Research (CNRS), Mediterranean Institute of Oceanology (MIO)
France
26 Joanna Waniek Leibniz Institut für Ostseeforschung Warnemünde
Germany
27 Rita Kramer Annika Grage
Bundesamt für Seeschifffahrt und Hydrographie (BSH), Laboratorium Sülldorf
Germany
28 Kai-Uwe Ludwichowski Alfred-Wegener-Institute Bremerhaven
Germany
29 Alice Benoit-Cattin-Breton Sólveig Rósa Ólafsdóttir
Marine Research Institute Iceland
30 Muhamed Ashraf P ICAR-Central Institute of Fisheries Technology, Fishing Technology Division
India
32 Nurit Kress Yael Segal Jacob Silverman
Israel Oceanographic & Limnological Res, National Institute of Oceanography
Israel
3
IOCCP-JAMSTEC 2018 Inter calibration exercise
35 Naoki Nagai Shu Saito
Marine Division, Global Environment and Marine Department, Japan Meteorological Agency
Japan
37 Takeshi Yoshimura Graduate School of Environmental Science, Hokkaido University
Japan
38 Taketoshi Kodama Japan Sea National Fisheries Research Institute, Japan Fisheries Research and Education Agency
Japan
39 Jan van Ooijen Royal NIOZ Netherlands
40 Mike Crump National Institute of Water and Atmospheric Research (NIWA)
New Zealand
41 Kjell Gundersen Linda Lunde Fonnes Jane Strømstad Møgster
Institute of Marine Research Norway
45 Raymond Edward Roman University of Cape town, Dept of Oceanography
South Africa
49 Mark Stinchcombe Edward W. Mawji
National Oceanography Centre, Southampton
UK
50 E. Malcolm S. Woodward Plymouth Marine Laboratory UK
51 Pamela Walsham Marine Scotland - Science UK
52 Claire Mahaffey Clare Davis
Department of Earth, Ocean and Ecological Sciences, SOES, University of Liverpool
UK
56 Susan Becker Scripps Institution of Oceanography
USA
57 Jia-Zhong Zhang NOAA Atlantic Oceanographic and Meteorological Laboratory (AOML), Miami, Florida
USA
59 Marguerite Blum Monterey Bay Aquarium Research Institute
USA
65 Karin Björkman David Karl Carolina Funkey
University of Hawaii at Manoa, Dept. of Oceanography
USA
69 Aristide Márquez Oriente University, Oceanographic Institute of Venezuela, Departament of Oceanography. Laboratory of nutritious elements
Venezuela
4
IOCCP-JAMSTEC 2018 Inter calibration exercise
80 Jesus Ledesma Instituto del Mar del Perú Peru
86 Martina Kralj Lidia Urbini Michele Giani
Istituto Nazionale di Oceanografia e Geofisica Sperimentale (OGS)
Italy
88 Durita Sørensen Faroe Marine Research Institute
Faroe Islands
89 Trevor McCormack Pauline Frew
Scottish Environment Protection Agency
UK
90 Adil Bakir Environmental Chemistry Analysis Laboratory (ECAL), University of Portsmouth
UK
91 Sarah-Ann Quesnel Institute of Ocean Sciences, Fisheries and Oceans Canada
Canada
92 Thierry Cariou Station Biologique de Roscoff, Centre national de la recherche scientifique (CNRS) / Université Pierre et Marie Curie
France
93 Frank Malien GEOMAR Helmholtz Center for Ocean Research, Kiel
Germany
95 Hema Naik National Institute of Oceanography
India
98 Silvie Lainela Estonian Marine Institute of Tartu University
Estonia
101 Jun-Ho Koo National Institute of Fisheries Science (NIFS)
Republic of Korea
102 Francesca Margiotta Augusto Passarelli Roberto Gallia
Stazione Zoologica Anton Dohrn
Italia
106 Elisa Berdalet Mara Abad
Institut de Ciències del Mar (ICM-CSIC), Barcelona
Spain
107 Laurent Coppola Emilie Diamond Riquier
Observatoire oceanologique de Villefranche-sur-Mer (CNRS-UPMC)
France
109 Tae Keun Rho KIOST (Korea Institute of Ocean Science & Technology)
Republic of Korea
111 Jolanta Lewandowska Institute of Oceanology Polish Academy of Sciences, Marine Chemistry and Biochemistry Department
Poland
5
IOCCP-JAMSTEC 2018 Inter calibration exercise
112 Christine Rees CSIRO, Oceans and Atmosphere
Australia
113 David Faber Daniel Schuller
Scripps Institution of Oceanography, CalCOFI Group, UC San Diego
USA
114 Miriam E. Solis LOQyCA – Centro para el estudio de los sistemas marinos (CONICET)
Argentina
118 Colin A. Stedmon Karen Edelvang
Technical University of Denmark, National Institute for Aquatic Resources (AQUA)
Denmark
124 Jinyoung Jung Sung Ho Kang
Korea Polar Reseach Institute Republic of Korea
125 Peter Thamer Marc Ringuette Kumiko Azetsu-Scott Blair Greenan
Bedford Institute of Oceanography
Canada
129 Fuminori Hashihama Tokyo University of Marine Science and Technology
Japan
135 Triona McGrath The Marine Institute Ireland
136 Claire Normandeau Doug Wallace Liz A. Kerrigan
Dalhousie University in Halifax
Canada
137 Hiroshi Ogawa Atmosphere and ocean research institute, the University of Tokyo
Japan
138 Hideki Yamamoto Reseach Promotion Group, Mutsu Institute for Oceanography, JAMSTEC
Japan
139 Hiromi Kasai Hokkaido National Fisheries Research Institute, Japan Fisheries Research and Education Agency
Japan
140 Patricia López García Plataforma Oceánica de Canarias (PLOCAN) - Oceanic Platform of the Canary Islands
Spain
141 Yoko Kiyomoto Seikai National Fisheries Research Institute, Japan Fisheries Research and Education Agency
Japan
6
IOCCP-JAMSTEC 2018 Inter calibration exercise
143 Victor F. Camacho Ibar Maria del Carmen Ávila López
Instituto de Investigaciones Oceanológicas, Universidad Autónoma de Baja California
USA
148 Jerry Frank University of Maryland Center for Environmental Science, Chesapeake Biological Laboratory, Nutrient Analytical Services Laboratory
USA
149 Vasiliy Povazhnyi Arctic and Antarctic Research Institute
Russia
150 Mi-OK Park Marine Environment Analysis Center Korea Marine Environment management Corporation (KOEM)
Republic of Korea
151 Ana Rodriguez INSTITUTO OCEANOGRÁFICO DE LA ARMADA (INOCAR)
Ecuador
153 Robinson Fidel Casanova Rosero
CENTRO DE INVESTIGACIONES OCEANOGRÁFICAS E HIDROGRÁFICAS DEL PACÍFICO (CCCP).
Colombia
155 Yoann Le Merrer Karine Collin Olivier Pierre-Duplessix
IFREMER LERMPL, Nantes France
156 Robert Rember Ana Aguilar-Islas
University of Alaska, Fairbanks
USA
157 Thanos Gkritzalis Flanders Marine Institute Belgium
7
IOCCP-JAMSTEC 2018 Inter calibration exercise
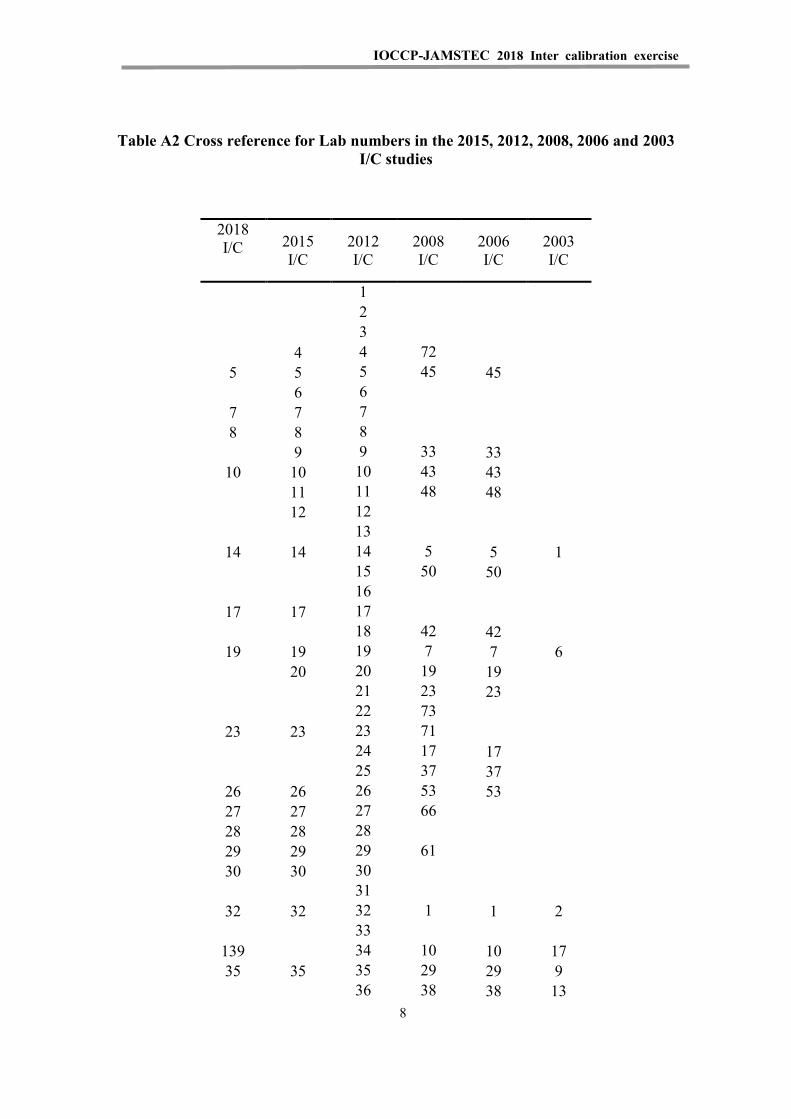
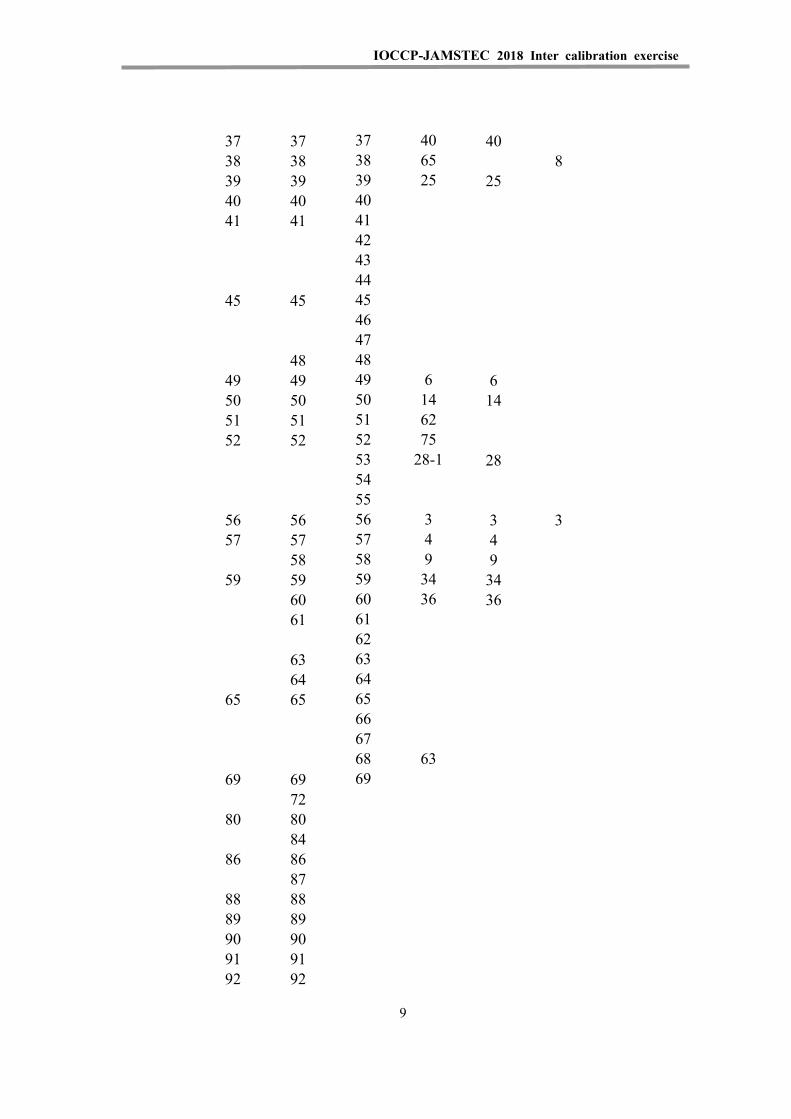
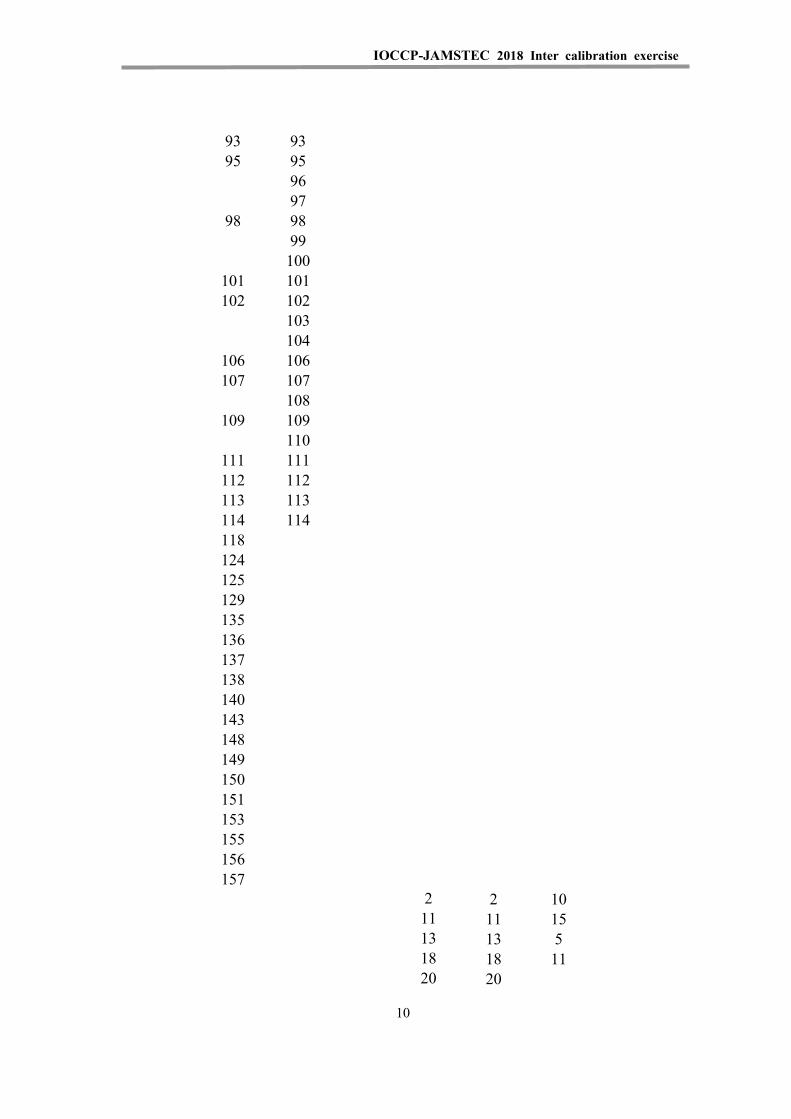
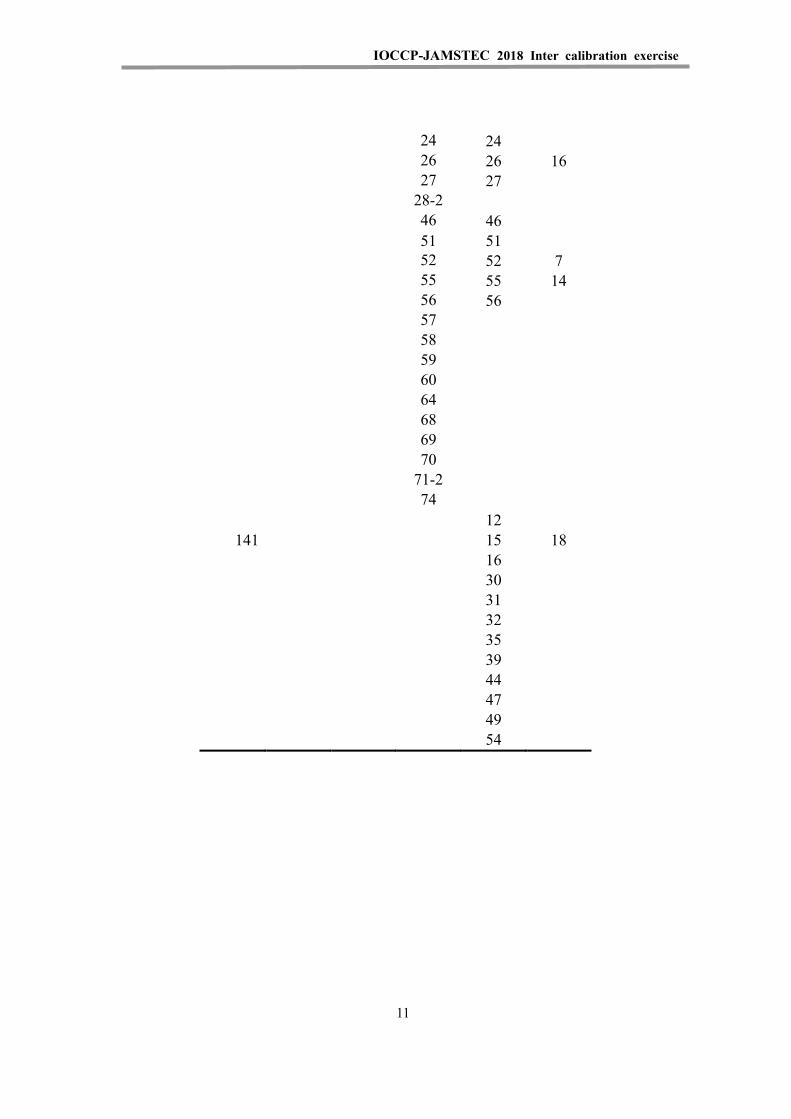
Table A2 Cross reference for Lab numbers in the 2015, 2012, 2008, 2006 and 2003 I/C studies
2018 I/C 2015
I/C 2012 I/C
2008 I/C
2006 I/C
2003 I/C
1 2 3
4 4 72 5 5 5 45 45
6 6 7 7 7 8 8 8
9 9 33 33 10 10 10 43 43
11 11 48 48 12 12
13 14 14 14 5 5 1
15 50 50 16
17 17 17 18 42 42 19 19 19 7 7 6
20 20 19 19 21 23 23 22 73
23 23 23 71 24 17 17 25 37 37
26 26 26 53 53 27 27 27 66 28 28 28 29 29 29 61 30 30 30
31 32 32 32 1 1 2
33 139 34 10 10 17 35 35 35 29 29 9
36 38 38 13 8
IOCCP-JAMSTEC 2018 Inter calibration exercise
37 37 37 40 40 38 38 38 65 8 39 39 39 25 25 40 40 40 41 41 41 42 43 44
45 45 45 46 47 48 48
49 49 49 6 6 50 50 50 14 14 51 51 51 62 52 52 52 75 53 28-1 28 54 55
56 56 56 3 3 3 57 57 57 4 4 58 58 9 9
59 59 59 34 34 60 60 36 36 61 61 62 63 63 64 64
65 65 65 66 67 68 63
69 69 69 72
80 80 84
86 86 87
88 88 89 89 90 90 91 91 92 92
9
IOCCP-JAMSTEC 2018 Inter calibration exercise
93 93 95 95 96 97
98 98 99 100
101 101 102 102
103 104
106 106 107 107
108 109 109
110 111 111 112 112 113 113 114 114 118 124 125 129 135 136 137 138 140 143 148 149 150 151 153 155 156 157
2 2 10
11 11 15
13 13 5
18 18 11
20 20 10
IOCCP-JAMSTEC 2018 Inter calibration exercise
24 24 26 26 16
27 27 28-2 46 46 51 51 52 52 7
55 55 14
56 56 57 58 59 60 64 68 69 70 71-2 74 12
141 15 18
16 30 31 32 35 39 44 47 49
54
11

IOCCP-JAMSTEC 2018 Inter calibration exercise
IOCCP-JAMSTEC 2018 Inter calibration exercise
Appendix II
Results reported by participants
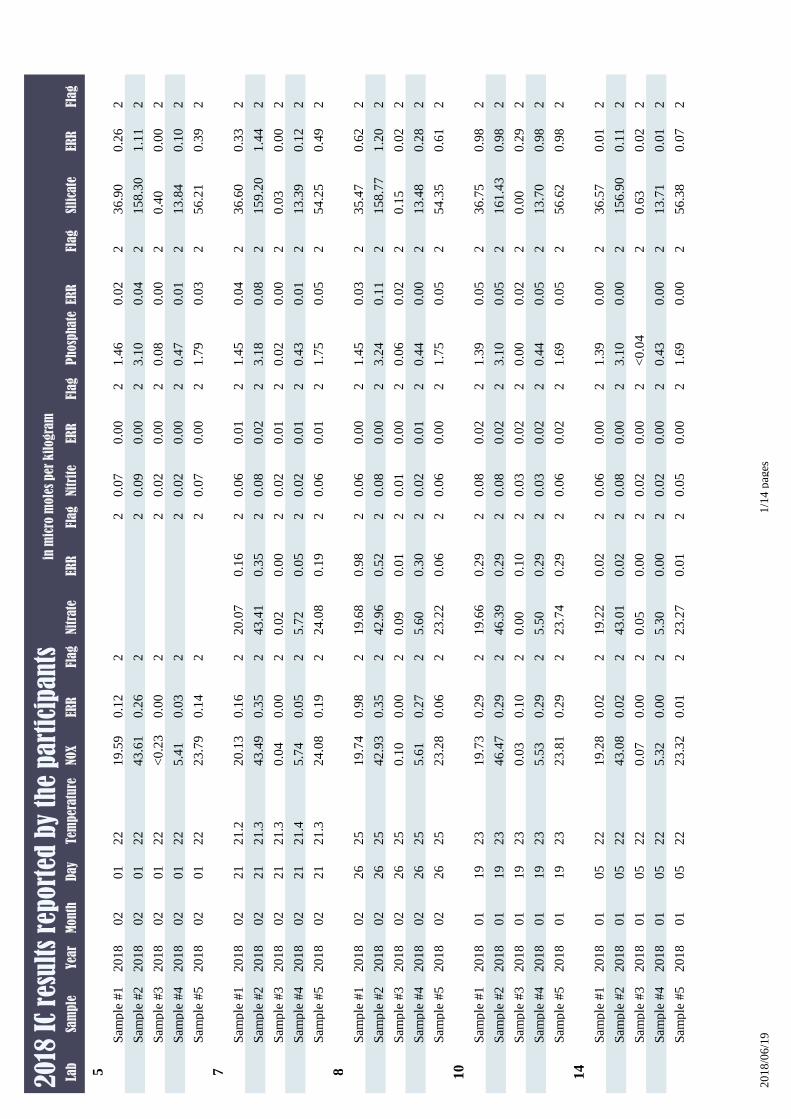
Table A3 Nutirient results reported by the participants
Table A4 Ammonia results reported by the participants
Table A5 DOP results reported by the participants
Table A6 DON results reported by the participants
Table A7 DOC results reported by the participants
(Concentrations in Talbes A3-A7 are in units of µmol kg-1 )
IOCCP-JAMSTEC 2018 Inter calibration exercise
Lab
Sam
ple
Yea
rM
onth
Day
Tem
per
atu
reP
hosp
hate
ERR
Flag
Nitr
ite
ERR
Flag
Nitr
ate
ERR
Flag
NOX
ERR
Flag
Sili
cate
ERR
Flag
20
18 I
C re
sult
s re
port
ed b
y th
e p
art
icip
an
tsin
mic
ro m
ole
s per
kil
ogra
m
5
Sam
ple
#1
20
18
02
01
22
1.4
60
.02
20
.07
0.0
02
21
9.5
90
.12
23
6.9
00
.26
2
Sam
ple
#2
20
18
02
01
22
3.1
00
.04
20
.09
0.0
02
24
3.6
10
.26
21
58
.30
1.1
12
Sam
ple
#3
20
18
02
01
22
0.0
80
.00
20
.02
0.0
02
2<
0.2
30
.00
20
.40
0.0
02
Sam
ple
#4
20
18
02
01
22
0.4
70
.01
20
.02
0.0
02
25
.41
0.0
32
13
.84
0.1
02
Sam
ple
#5
20
18
02
01
22
1.7
90
.03
20
.07
0.0
02
22
3.7
90
.14
25
6.2
10
.39
2
7
Sam
ple
#1
20
18
02
21
21
.21
.45
0.0
42
0.0
60
.01
22
0.0
70
.16
22
0.1
30
.16
23
6.6
00
.33
2
Sam
ple
#2
20
18
02
21
21
.33
.18
0.0
82
0.0
80
.02
24
3.4
10
.35
24
3.4
90
.35
21
59
.20
1.4
42
Sam
ple
#3
20
18
02
21
21
.30
.02
0.0
02
0.0
20
.01
20
.02
0.0
02
0.0
40
.00
20
.03
0.0
02
Sam
ple
#4
20
18
02
21
21
.40
.43
0.0
12
0.0
20
.01
25
.72
0.0
52
5.7
40
.05
21
3.3
90
.12
2
Sam
ple
#5
20
18
02
21
21
.31
.75
0.0
52
0.0
60
.01
22
4.0
80
.19
22
4.0
80
.19
25
4.2
50
.49
2
8
Sam
ple
#1
20
18
02
26
25
1.4
50
.03
20
.06
0.0
02
19
.68
0.9
82
19
.74
0.9
82
35
.47
0.6
22
Sam
ple
#2
20
18
02
26
25
3.2
40
.11
20
.08
0.0
02
42
.96
0.5
22
42
.93
0.3
52
15
8.7
71
.20
2
Sam
ple
#3
20
18
02
26
25
0.0
60
.02
20
.01
0.0
02
0.0
90
.01
20
.10
0.0
02
0.1
50
.02
2
Sam
ple
#4
20
18
02
26
25
0.4
40
.00
20
.02
0.0
12
5.6
00
.30
25
.61
0.2
72
13
.48
0.2
82
Sam
ple
#5
20
18
02
26
25
1.7
50
.05
20
.06
0.0
02
23
.22
0.0
62
23
.28
0.0
62
54
.35
0.6
12
10
Sam
ple
#1
20
18
01
19
23
1.3
90
.05
20
.08
0.0
22
19
.66
0.2
92
19
.73
0.2
92
36
.75
0.9
82
Sam
ple
#2
20
18
01
19
23
3.1
00
.05
20
.08
0.0
22
46
.39
0.2
92
46
.47
0.2
92
16
1.4
30
.98
2
Sam
ple
#3
20
18
01
19
23
0.0
00
.02
20
.03
0.0
22
0.0
00
.10
20
.03
0.1
02
0.0
00
.29
2
Sam
ple
#4
20
18
01
19
23
0.4
40
.05
20
.03
0.0
22
5.5
00
.29
25
.53
0.2
92
13
.70
0.9
82
Sam
ple
#5
20
18
01
19
23
1.6
90
.05
20
.06
0.0
22
23
.74
0.2
92
23
.81
0.2
92
56
.62
0.9
82
14
Sam
ple
#1
20
18
01
05
22
1.3
90
.00
20
.06
0.0
02
19
.22
0.0
22
19
.28
0.0
22
36
.57
0.0
12
Sam
ple
#2
20
18
01
05
22
3.1
00
.00
20
.08
0.0
02
43
.01
0.0
22
43
.08
0.0
22
15
6.9
00
.11
2
Sam
ple
#3
20
18
01
05
22
<0
.04
20
.02
0.0
02
0.0
50
.00
20
.07
0.0
02
0.6
30
.02
2
Sam
ple
#4
20
18
01
05
22
0.4
30
.00
20
.02
0.0
02
5.3
00
.00
25
.32
0.0
02
13
.71
0.0
12
Sam
ple
#5
20
18
01
05
22
1.6
90
.00
20
.05
0.0
02
23
.27
0.0
12
23
.32
0.0
12
56
.38
0.0
72
20
18
/06
/19
1/1
4 p
ages
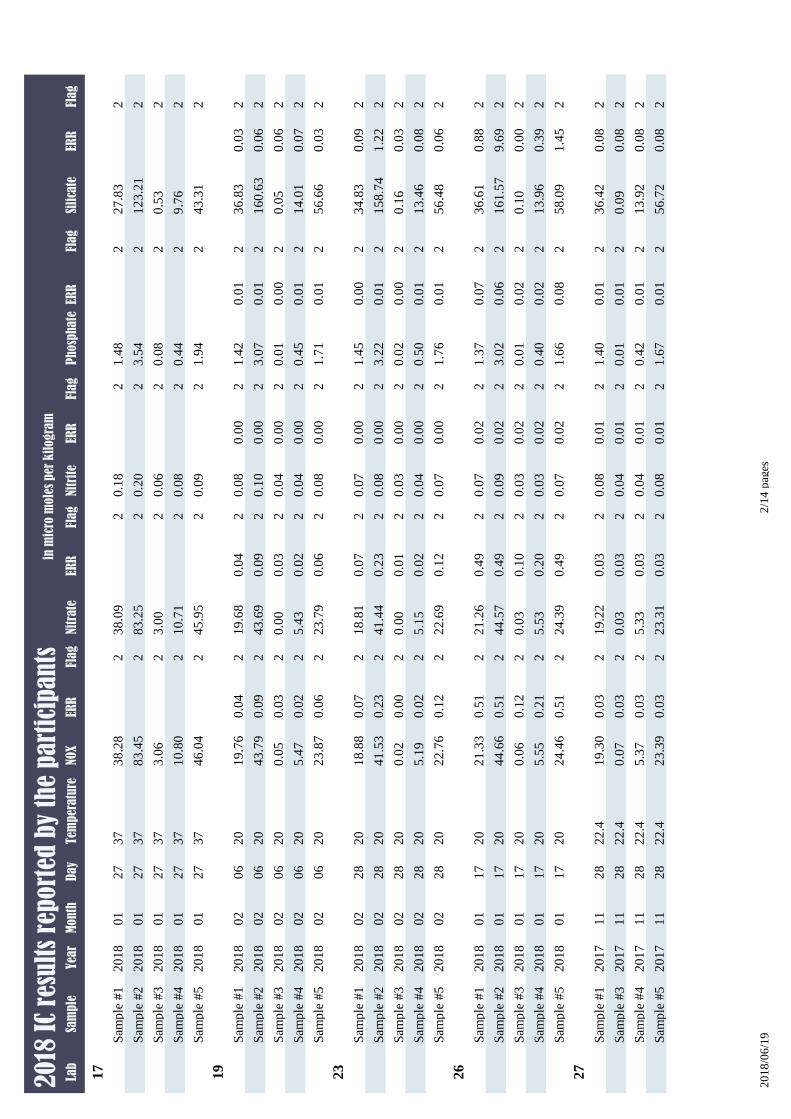
Lab
Sam
ple
Yea
rM
onth
Day
Tem
per
atu
reP
hosp
hate
ERR
Flag
Nitr
ite
ERR
Flag
Nitr
ate
ERR
Flag
NOX
ERR
Flag
Sili
cate
ERR
Flag
20
18 I
C re
sult
s re
port
ed b
y th
e p
art
icip
an
tsin
mic
ro m
ole
s per
kil
ogra
m
17
Sam
ple
#1
20
18
01
27
37
1.4
82
0.1
82
38
.09
23
8.2
82
27
.83
2
Sam
ple
#2
20
18
01
27
37
3.5
42
0.2
02
83
.25
28
3.4
52
12
3.2
12
Sam
ple
#3
20
18
01
27
37
0.0
82
0.0
62
3.0
02
3.0
62
0.5
32
Sam
ple
#4
20
18
01
27
37
0.4
42
0.0
82
10
.71
21
0.8
02
9.7
62
Sam
ple
#5
20
18
01
27
37
1.9
42
0.0
92
45
.95
24
6.0
42
43
.31
2
19
Sam
ple
#1
20
18
02
06
20
1.4
20
.01
20
.08
0.0
02
19
.68
0.0
42
19
.76
0.0
42
36
.83
0.0
32
Sam
ple
#2
20
18
02
06
20
3.0
70
.01
20
.10
0.0
02
43
.69
0.0
92
43
.79
0.0
92
16
0.6
30
.06
2
Sam
ple
#3
20
18
02
06
20
0.0
10
.00
20
.04
0.0
02
0.0
00
.03
20
.05
0.0
32
0.0
50
.06
2
Sam
ple
#4
20
18
02
06
20
0.4
50
.01
20
.04
0.0
02
5.4
30
.02
25
.47
0.0
22
14
.01
0.0
72
Sam
ple
#5
20
18
02
06
20
1.7
10
.01
20
.08
0.0
02
23
.79
0.0
62
23
.87
0.0
62
56
.66
0.0
32
23
Sam
ple
#1
20
18
02
28
20
1.4
50
.00
20
.07
0.0
02
18
.81
0.0
72
18
.88
0.0
72
34
.83
0.0
92
Sam
ple
#2
20
18
02
28
20
3.2
20
.01
20
.08
0.0
02
41
.44
0.2
32
41
.53
0.2
32
15
8.7
41
.22
2
Sam
ple
#3
20
18
02
28
20
0.0
20
.00
20
.03
0.0
02
0.0
00
.01
20
.02
0.0
02
0.1
60
.03
2
Sam
ple
#4
20
18
02
28
20
0.5
00
.01
20
.04
0.0
02
5.1
50
.02
25
.19
0.0
22
13
.46
0.0
82
Sam
ple
#5
20
18
02
28
20
1.7
60
.01
20
.07
0.0
02
22
.69
0.1
22
22
.76
0.1
22
56
.48
0.0
62
26
Sam
ple
#1
20
18
01
17
20
1.3
70
.07
20
.07
0.0
22
21
.26
0.4
92
21
.33
0.5
12
36
.61
0.8
82
Sam
ple
#2
20
18
01
17
20
3.0
20
.06
20
.09
0.0
22
44
.57
0.4
92
44
.66
0.5
12
16
1.5
79
.69
2
Sam
ple
#3
20
18
01
17
20
0.0
10
.02
20
.03
0.0
22
0.0
30
.10
20
.06
0.1
22
0.1
00
.00
2
Sam
ple
#4
20
18
01
17
20
0.4
00
.02
20
.03
0.0
22
5.5
30
.20
25
.55
0.2
12
13
.96
0.3
92
Sam
ple
#5
20
18
01
17
20
1.6
60
.08
20
.07
0.0
22
24
.39
0.4
92
24
.46
0.5
12
58
.09
1.4
52
27
Sam
ple
#1
20
17
11
28
22
.41
.40
0.0
12
0.0
80
.01
21
9.2
20
.03
21
9.3
00
.03
23
6.4
20
.08
2
Sam
ple
#3
20
17
11
28
22
.40
.01
0.0
12
0.0
40
.01
20
.03
0.0
32
0.0
70
.03
20
.09
0.0
82
Sam
ple
#4
20
17
11
28
22
.40
.42
0.0
12
0.0
40
.01
25
.33
0.0
32
5.3
70
.03
21
3.9
20
.08
2
Sam
ple
#5
20
17
11
28
22
.41
.67
0.0
12
0.0
80
.01
22
3.3
10
.03
22
3.3
90
.03
25
6.7
20
.08
2
20
18
/06
/19
2/1
4 p
ages
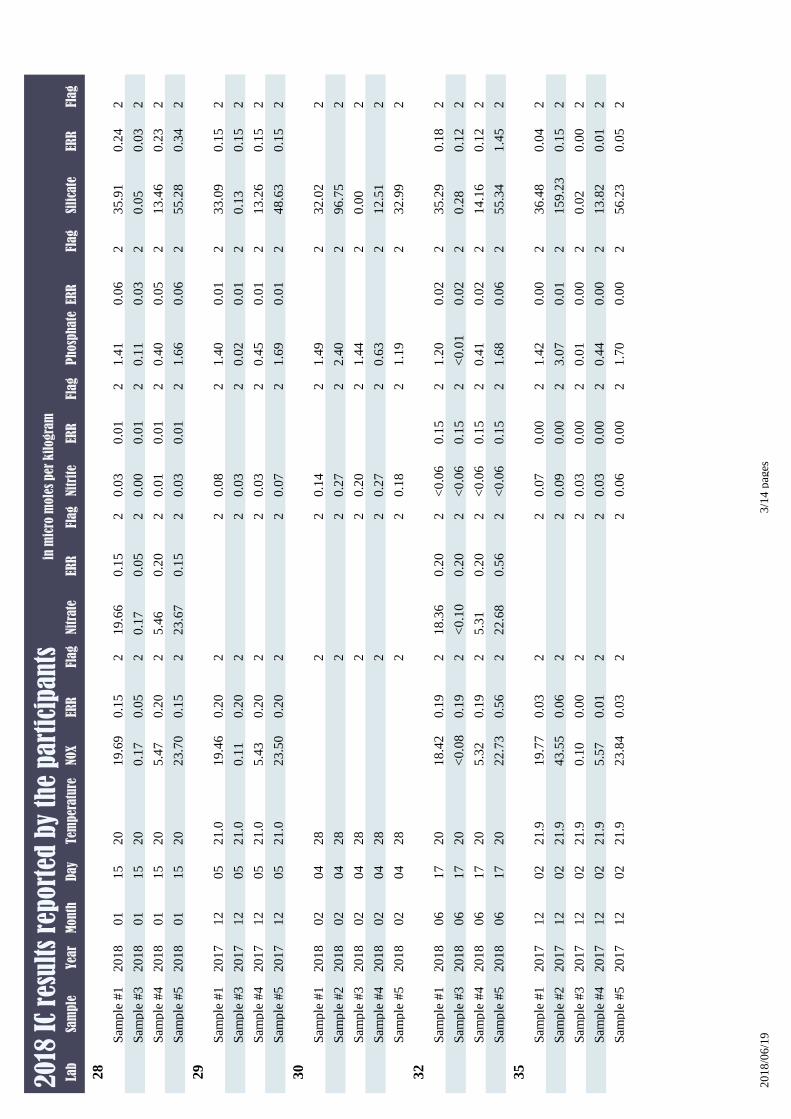
Lab
Sam
ple
Yea
rM
onth
Day
Tem
per
atu
reP
hosp
hate
ERR
Flag
Nitr
ite
ERR
Flag
Nitr
ate
ERR
Flag
NOX
ERR
Flag
Sili
cate
ERR
Flag
20
18 I
C re
sult
s re
port
ed b
y th
e p
art
icip
an
tsin
mic
ro m
ole
s per
kil
ogra
m
28
Sam
ple
#1
20
18
01
15
20
1.4
10
.06
20
.03
0.0
12
19
.66
0.1
52
19
.69
0.1
52
35
.91
0.2
42
Sam
ple
#3
20
18
01
15
20
0.1
10
.03
20
.00
0.0
12
0.1
70
.05
20
.17
0.0
52
0.0
50
.03
2
Sam
ple
#4
20
18
01
15
20
0.4
00
.05
20
.01
0.0
12
5.4
60
.20
25
.47
0.2
02
13
.46
0.2
32
Sam
ple
#5
20
18
01
15
20
1.6
60
.06
20
.03
0.0
12
23
.67
0.1
52
23
.70
0.1
52
55
.28
0.3
42
29
Sam
ple
#1
20
17
12
05
21
.01
.40
0.0
12
0.0
82
21
9.4
60
.20
23
3.0
90
.15
2
Sam
ple
#3
20
17
12
05
21
.00
.02
0.0
12
0.0
32
20
.11
0.2
02
0.1
30
.15
2
Sam
ple
#4
20
17
12
05
21
.00
.45
0.0
12
0.0
32
25
.43
0.2
02
13
.26
0.1
52
Sam
ple
#5
20
17
12
05
21
.01
.69
0.0
12
0.0
72
22
3.5
00
.20
24
8.6
30
.15
2
30
Sam
ple
#1
20
18
02
04
28
1.4
92
0.1
42
22
32
.02
2
Sam
ple
#2
20
18
02
04
28
2.4
02
0.2
72
22
96
.75
2
Sam
ple
#3
20
18
02
04
28
1.4
42
0.2
02
22
0.0
02
Sam
ple
#4
20
18
02
04
28
0.6
32
0.2
72
22
12
.51
2
Sam
ple
#5
20
18
02
04
28
1.1
92
0.1
82
22
32
.99
2
32
Sam
ple
#1
20
18
06
17
20
1.2
00
.02
2<
0.0
60
.15
21
8.3
60
.20
21
8.4
20
.19
23
5.2
90
.18
2
Sam
ple
#3
20
18
06
17
20
<0
.01
0.0
22
<0
.06
0.1
52
<0
.10
0.2
02
<0
.08
0.1
92
0.2
80
.12
2
Sam
ple
#4
20
18
06
17
20
0.4
10
.02
2<
0.0
60
.15
25
.31
0.2
02
5.3
20
.19
21
4.1
60
.12
2
Sam
ple
#5
20
18
06
17
20
1.6
80
.06
2<
0.0
60
.15
22
2.6
80
.56
22
2.7
30
.56
25
5.3
41
.45
2
35
Sam
ple
#1
20
17
12
02
21
.91
.42
0.0
02
0.0
70
.00
22
19
.77
0.0
32
36
.48
0.0
42
Sam
ple
#2
20
17
12
02
21
.93
.07
0.0
12
0.0
90
.00
22
43
.55
0.0
62
15
9.2
30
.15
2
Sam
ple
#3
20
17
12
02
21
.90
.01
0.0
02
0.0
30
.00
22
0.1
00
.00
20
.02
0.0
02
Sam
ple
#4
20
17
12
02
21
.90
.44
0.0
02
0.0
30
.00
22
5.5
70
.01
21
3.8
20
.01
2
Sam
ple
#5
20
17
12
02
21
.91
.70
0.0
02
0.0
60
.00
22
23
.84
0.0
32
56
.23
0.0
52
20
18
/06
/19
3/1
4 p
ages
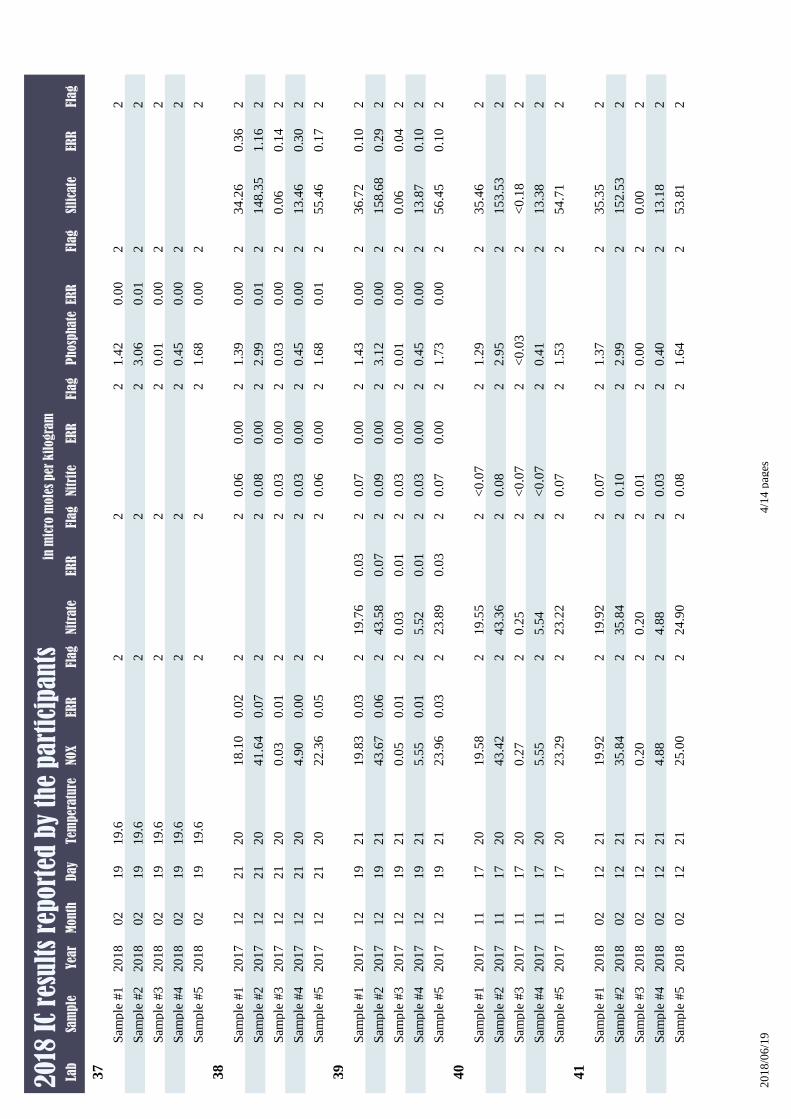
Lab
Sam
ple
Yea
rM
onth
Day
Tem
per
atu
reP
hosp
hate
ERR
Flag
Nitr
ite
ERR
Flag
Nitr
ate
ERR
Flag
NOX
ERR
Flag
Sili
cate
ERR
Flag
20
18 I
C re
sult
s re
port
ed b
y th
e p
art
icip
an
tsin
mic
ro m
ole
s per
kil
ogra
m
37
Sam
ple
#1
20
18
02
19
19
.61
.42
0.0
02
22
22
Sam
ple
#2
20
18
02
19
19
.63
.06
0.0
12
22
22
Sam
ple
#3
20
18
02
19
19
.60
.01
0.0
02
22
22
Sam
ple
#4
20
18
02
19
19
.60
.45
0.0
02
22
22
Sam
ple
#5
20
18
02
19
19
.61
.68
0.0
02
22
22
38
Sam
ple
#1
20
17
12
21
20
1.3
90
.00
20
.06
0.0
02
21
8.1
00
.02
23
4.2
60
.36
2
Sam
ple
#2
20
17
12
21
20
2.9
90
.01
20
.08
0.0
02
24
1.6
40
.07
21
48
.35
1.1
62
Sam
ple
#3
20
17
12
21
20
0.0
30
.00
20
.03
0.0
02
20
.03
0.0
12
0.0
60
.14
2
Sam
ple
#4
20
17
12
21
20
0.4
50
.00
20
.03
0.0
02
24
.90
0.0
02
13
.46
0.3
02
Sam
ple
#5
20
17
12
21
20
1.6
80
.01
20
.06
0.0
02
22
2.3
60
.05
25
5.4
60
.17
2
39
Sam
ple
#1
20
17
12
19
21
1.4
30
.00
20
.07
0.0
02
19
.76
0.0
32
19
.83
0.0
32
36
.72
0.1
02
Sam
ple
#2
20
17
12
19
21
3.1
20
.00
20
.09
0.0
02
43
.58
0.0
72
43
.67
0.0
62
15
8.6
80
.29
2
Sam
ple
#3
20
17
12
19
21
0.0
10
.00
20
.03
0.0
02
0.0
30
.01
20
.05
0.0
12
0.0
60
.04
2
Sam
ple
#4
20
17
12
19
21
0.4
50
.00
20
.03
0.0
02
5.5
20
.01
25
.55
0.0
12
13
.87
0.1
02
Sam
ple
#5
20
17
12
19
21
1.7
30
.00
20
.07
0.0
02
23
.89
0.0
32
23
.96
0.0
32
56
.45
0.1
02
40
Sam
ple
#1
20
17
11
17
20
1.2
92
<0
.07
21
9.5
52
19
.58
23
5.4
62
Sam
ple
#2
20
17
11
17
20
2.9
52
0.0
82
43
.36
24
3.4
22
15
3.5
32
Sam
ple
#3
20
17
11
17
20
<0
.03
2<
0.0
72
0.2
52
0.2
72
<0
.18
2
Sam
ple
#4
20
17
11
17
20
0.4
12
<0
.07
25
.54
25
.55
21
3.3
82
Sam
ple
#5
20
17
11
17
20
1.5
32
0.0
72
23
.22
22
3.2
92
54
.71
2
41
Sam
ple
#1
20
18
02
12
21
1.3
72
0.0
72
19
.92
21
9.9
22
35
.35
2
Sam
ple
#2
20
18
02
12
21
2.9
92
0.1
02
35
.84
23
5.8
42
15
2.5
32
Sam
ple
#3
20
18
02
12
21
0.0
02
0.0
12
0.2
02
0.2
02
0.0
02
Sam
ple
#4
20
18
02
12
21
0.4
02
0.0
32
4.8
82
4.8
82
13
.18
2
Sam
ple
#5
20
18
02
12
21
1.6
42
0.0
82
24
.90
22
5.0
02
53
.81
2
20
18
/06
/19
4/1
4 p
ages
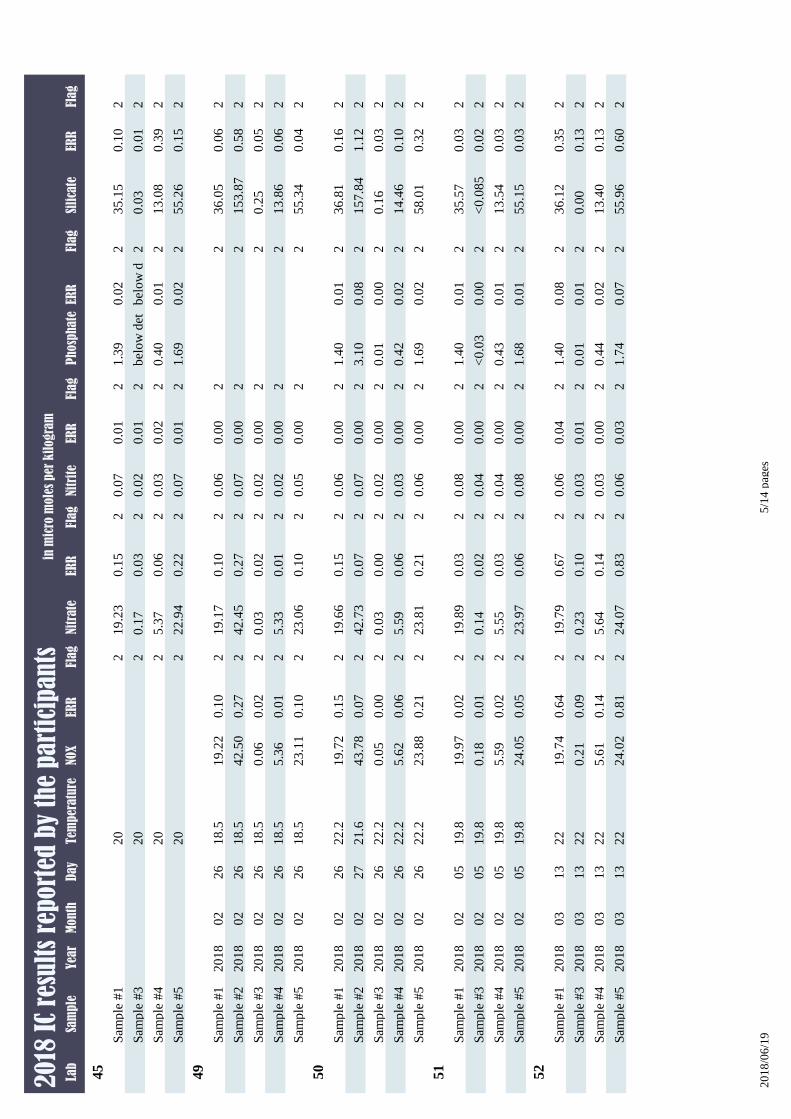
Lab
Sam
ple
Yea
rM
onth
Day
Tem
per
atu
reP
hosp
hate
ERR
Flag
Nitr
ite
ERR
Flag
Nitr
ate
ERR
Flag
NOX
ERR
Flag
Sili
cate
ERR
Flag
20
18 I
C re
sult
s re
port
ed b
y th
e p
art
icip
an
tsin
mic
ro m
ole
s per
kil
ogra
m
45
Sam
ple
#1
20
1.3
90
.02
20
.07
0.0
12
19
.23
0.1
52
23
5.1
50
.10
2
Sam
ple
#3
20
bel
ow
det
bel
ow
d2
0.0
20
.01
20
.17
0.0
32
20
.03
0.0
12
Sam
ple
#4
20
0.4
00
.01
20
.03
0.0
22
5.3
70
.06
22
13
.08
0.3
92
Sam
ple
#5
20
1.6
90
.02
20
.07
0.0
12
22
.94
0.2
22
25
5.2
60
.15
2
49
Sam
ple
#1
20
18
02
26
18
.52
0.0
60
.00
21
9.1
70
.10
21
9.2
20
.10
23
6.0
50
.06
2
Sam
ple
#2
20
18
02
26
18
.52
0.0
70
.00
24
2.4
50
.27
24
2.5
00
.27
21
53
.87
0.5
82
Sam
ple
#3
20
18
02
26
18
.52
0.0
20
.00
20
.03
0.0
22
0.0
60
.02
20
.25
0.0
52
Sam
ple
#4
20
18
02
26
18
.52
0.0
20
.00
25
.33
0.0
12
5.3
60
.01
21
3.8
60
.06
2
Sam
ple
#5
20
18
02
26
18
.52
0.0
50
.00
22
3.0
60
.10
22
3.1
10
.10
25
5.3
40
.04
2
50
Sam
ple
#1
20
18
02
26
22
.21
.40
0.0
12
0.0
60
.00
21
9.6
60
.15
21
9.7
20
.15
23
6.8
10
.16
2
Sam
ple
#2
20
18
02
27
21
.63
.10
0.0
82
0.0
70
.00
24
2.7
30
.07
24
3.7
80
.07
21
57
.84
1.1
22
Sam
ple
#3
20
18
02
26
22
.20
.01
0.0
02
0.0
20
.00
20
.03
0.0
02
0.0
50
.00
20
.16
0.0
32
Sam
ple
#4
20
18
02
26
22
.20
.42
0.0
22
0.0
30
.00
25
.59
0.0
62
5.6
20
.06
21
4.4
60
.10
2
Sam
ple
#5
20
18
02
26
22
.21
.69
0.0
22
0.0
60
.00
22
3.8
10
.21
22
3.8
80
.21
25
8.0
10
.32
2
51
Sam
ple
#1
20
18
02
05
19
.81
.40
0.0
12
0.0
80
.00
21
9.8
90
.03
21
9.9
70
.02
23
5.5
70
.03
2
Sam
ple
#3
20
18
02
05
19
.8<
0.0
30
.00
20
.04
0.0
02
0.1
40
.02
20
.18
0.0
12
<0
.08
50
.02
2
Sam
ple
#4
20
18
02
05
19
.80
.43
0.0
12
0.0
40
.00
25
.55
0.0
32
5.5
90
.02
21
3.5
40
.03
2
Sam
ple
#5
20
18
02
05
19
.81
.68
0.0
12
0.0
80
.00
22
3.9
70
.06
22
4.0
50
.05
25
5.1
50
.03
2
52
Sam
ple
#1
20
18
03
13
22
1.4
00
.08
20
.06
0.0
42
19
.79
0.6
72
19
.74
0.6
42
36
.12
0.3
52
Sam
ple
#3
20
18
03
13
22
0.0
10
.01
20
.03
0.0
12
0.2
30
.10
20
.21
0.0
92
0.0
00
.13
2
Sam
ple
#4
20
18
03
13
22
0.4
40
.02
20
.03
0.0
02
5.6
40
.14
25
.61
0.1
42
13
.40
0.1
32
Sam
ple
#5
20
18
03
13
22
1.7
40
.07
20
.06
0.0
32
24
.07
0.8
32
24
.02
0.8
12
55
.96
0.6
02
20
18
/06
/19
5/1
4 p
ages
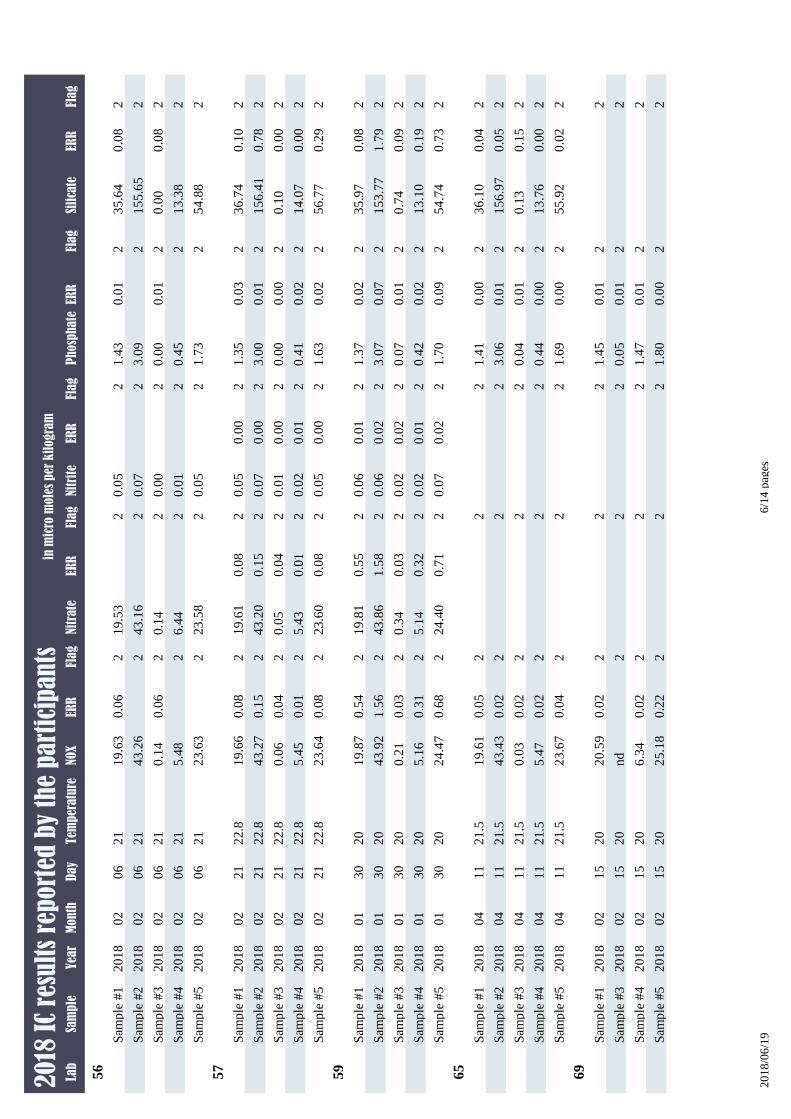
Lab
Sam
ple
Yea
rM
onth
Day
Tem
per
atu
reP
hosp
hate
ERR
Flag
Nitr
ite
ERR
Flag
Nitr
ate
ERR
Flag
NOX
ERR
Flag
Sili
cate
ERR
Flag
20
18 I
C re
sult
s re
port
ed b
y th
e p
art
icip
an
tsin
mic
ro m
ole
s per
kil
ogra
m
56
Sam
ple
#1
20
18
02
06
21
1.4
30
.01
20
.05
21
9.5
32
19
.63
0.0
62
35
.64
0.0
82
Sam
ple
#2
20
18
02
06
21
3.0
92
0.0
72
43
.16
24
3.2
62
15
5.6
52
Sam
ple
#3
20
18
02
06
21
0.0
00
.01
20
.00
20
.14
20
.14
0.0
62
0.0
00
.08
2
Sam
ple
#4
20
18
02
06
21
0.4
52
0.0
12
6.4
42
5.4
82
13
.38
2
Sam
ple
#5
20
18
02
06
21
1.7
32
0.0
52
23
.58
22
3.6
32
54
.88
2
57
Sam
ple
#1
20
18
02
21
22
.81
.35
0.0
32
0.0
50
.00
21
9.6
10
.08
21
9.6
60
.08
23
6.7
40
.10
2
Sam
ple
#2
20
18
02
21
22
.83
.00
0.0
12
0.0
70
.00
24
3.2
00
.15
24
3.2
70
.15
21
56
.41
0.7
82
Sam
ple
#3
20
18
02
21
22
.80
.00
0.0
02
0.0
10
.00
20
.05
0.0
42
0.0
60
.04
20
.10
0.0
02
Sam
ple
#4
20
18
02
21
22
.80
.41
0.0
22
0.0
20
.01
25
.43
0.0
12
5.4
50
.01
21
4.0
70
.00
2
Sam
ple
#5
20
18
02
21
22
.81
.63
0.0
22
0.0
50
.00
22
3.6
00
.08
22
3.6
40
.08
25
6.7
70
.29
2
59
Sam
ple
#1
20
18
01
30
20
1.3
70
.02
20
.06
0.0
12
19
.81
0.5
52
19
.87
0.5
42
35
.97
0.0
82
Sam
ple
#2
20
18
01
30
20
3.0
70
.07
20
.06
0.0
22
43
.86
1.5
82
43
.92
1.5
62
15
3.7
71
.79
2
Sam
ple
#3
20
18
01
30
20
0.0
70
.01
20
.02
0.0
22
0.3
40
.03
20
.21
0.0
32
0.7
40
.09
2
Sam
ple
#4
20
18
01
30
20
0.4
20
.02
20
.02
0.0
12
5.1
40
.32
25
.16
0.3
12
13
.10
0.1
92
Sam
ple
#5
20
18
01
30
20
1.7
00
.09
20
.07
0.0
22
24
.40
0.7
12
24
.47
0.6
82
54
.74
0.7
32
65
Sam
ple
#1
20
18
04
11
21
.51
.41
0.0
02
22
19
.61
0.0
52
36
.10
0.0
42
Sam
ple
#2
20
18
04
11
21
.53
.06
0.0
12
22
43
.43
0.0
22
15
6.9
70
.05
2
Sam
ple
#3
20
18
04
11
21
.50
.04
0.0
12
22
0.0
30
.02
20
.13
0.1
52
Sam
ple
#4
20
18
04
11
21
.50
.44
0.0
02
22
5.4
70
.02
21
3.7
60
.00
2
Sam
ple
#5
20
18
04
11
21
.51
.69
0.0
02
22
23
.67
0.0
42
55
.92
0.0
22
69
Sam
ple
#1
20
18
02
15
20
1.4
50
.01
22
22
0.5
90
.02
22
Sam
ple
#3
20
18
02
15
20
0.0
50
.01
22
2nd
22
Sam
ple
#4
20
18
02
15
20
1.4
70
.01
22
26
.34
0.0
22
2
Sam
ple
#5
20
18
02
15
20
1.8
00
.00
22
22
5.1
80
.22
22
20
18
/06
/19
6/1
4 p
ages
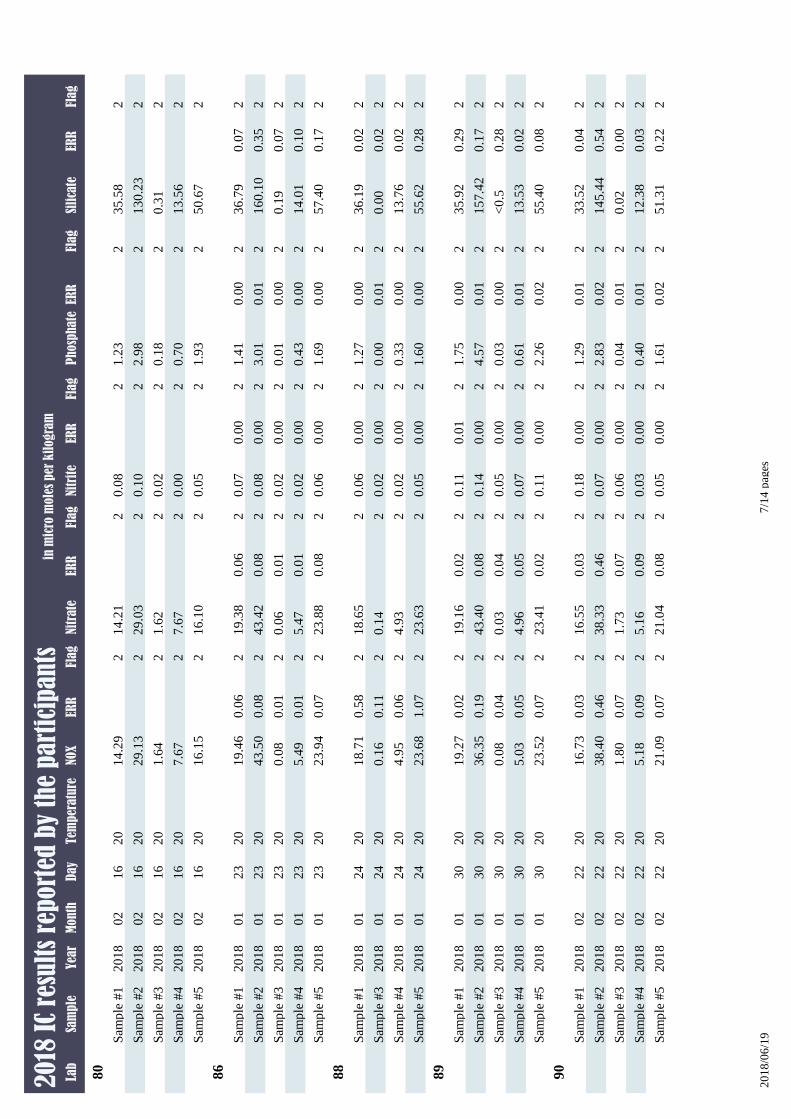
Lab
Sam
ple
Yea
rM
onth
Day
Tem
per
atu
reP
hosp
hate
ERR
Flag
Nitr
ite
ERR
Flag
Nitr
ate
ERR
Flag
NOX
ERR
Flag
Sili
cate
ERR
Flag
20
18 I
C re
sult
s re
port
ed b
y th
e p
art
icip
an
tsin
mic
ro m
ole
s per
kil
ogra
m
80
Sam
ple
#1
20
18
02
16
20
1.2
32
0.0
82
14
.21
21
4.2
92
35
.58
2
Sam
ple
#2
20
18
02
16
20
2.9
82
0.1
02
29
.03
22
9.1
32
13
0.2
32
Sam
ple
#3
20
18
02
16
20
0.1
82
0.0
22
1.6
22
1.6
42
0.3
12
Sam
ple
#4
20
18
02
16
20
0.7
02
0.0
02
7.6
72
7.6
72
13
.56
2
Sam
ple
#5
20
18
02
16
20
1.9
32
0.0
52
16
.10
21
6.1
52
50
.67
2
86
Sam
ple
#1
20
18
01
23
20
1.4
10
.00
20
.07
0.0
02
19
.38
0.0
62
19
.46
0.0
62
36
.79
0.0
72
Sam
ple
#2
20
18
01
23
20
3.0
10
.01
20
.08
0.0
02
43
.42
0.0
82
43
.50
0.0
82
16
0.1
00
.35
2
Sam
ple
#3
20
18
01
23
20
0.0
10
.00
20
.02
0.0
02
0.0
60
.01
20
.08
0.0
12
0.1
90
.07
2
Sam
ple
#4
20
18
01
23
20
0.4
30
.00
20
.02
0.0
02
5.4
70
.01
25
.49
0.0
12
14
.01
0.1
02
Sam
ple
#5
20
18
01
23
20
1.6
90
.00
20
.06
0.0
02
23
.88
0.0
82
23
.94
0.0
72
57
.40
0.1
72
88
Sam
ple
#1
20
18
01
24
20
1.2
70
.00
20
.06
0.0
02
18
.65
21
8.7
10
.58
23
6.1
90
.02
2
Sam
ple
#3
20
18
01
24
20
0.0
00
.01
20
.02
0.0
02
0.1
42
0.1
60
.11
20
.00
0.0
22
Sam
ple
#4
20
18
01
24
20
0.3
30
.00
20
.02
0.0
02
4.9
32
4.9
50
.06
21
3.7
60
.02
2
Sam
ple
#5
20
18
01
24
20
1.6
00
.00
20
.05
0.0
02
23
.63
22
3.6
81
.07
25
5.6
20
.28
2
89
Sam
ple
#1
20
18
01
30
20
1.7
50
.00
20
.11
0.0
12
19
.16
0.0
22
19
.27
0.0
22
35
.92
0.2
92
Sam
ple
#2
20
18
01
30
20
4.5
70
.01
20
.14
0.0
02
43
.40
0.0
82
36
.35
0.1
92
15
7.4
20
.17
2
Sam
ple
#3
20
18
01
30
20
0.0
30
.00
20
.05
0.0
02
0.0
30
.04
20
.08
0.0
42
<0
.50
.28
2
Sam
ple
#4
20
18
01
30
20
0.6
10
.01
20
.07
0.0
02
4.9
60
.05
25
.03
0.0
52
13
.53
0.0
22
Sam
ple
#5
20
18
01
30
20
2.2
60
.02
20
.11
0.0
02
23
.41
0.0
22
23
.52
0.0
72
55
.40
0.0
82
90
Sam
ple
#1
20
18
02
22
20
1.2
90
.01
20
.18
0.0
02
16
.55
0.0
32
16
.73
0.0
32
33
.52
0.0
42
Sam
ple
#2
20
18
02
22
20
2.8
30
.02
20
.07
0.0
02
38
.33
0.4
62
38
.40
0.4
62
14
5.4
40
.54
2
Sam
ple
#3
20
18
02
22
20
0.0
40
.01
20
.06
0.0
02
1.7
30
.07
21
.80
0.0
72
0.0
20
.00
2
Sam
ple
#4
20
18
02
22
20
0.4
00
.01
20
.03
0.0
02
5.1
60
.09
25
.18
0.0
92
12
.38
0.0
32
Sam
ple
#5
20
18
02
22
20
1.6
10
.02
20
.05
0.0
02
21
.04
0.0
82
21
.09
0.0
72
51
.31
0.2
22
20
18
/06
/19
7/1
4 p
ages
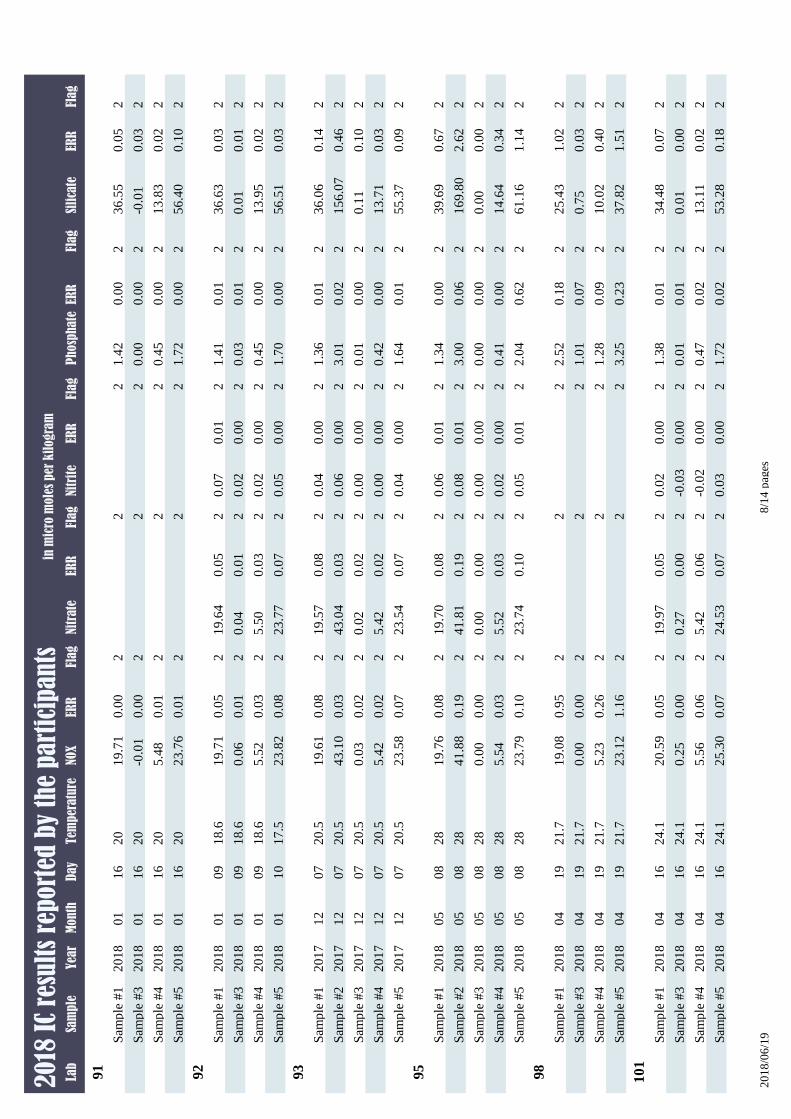
Lab
Sam
ple
Yea
rM
onth
Day
Tem
per
atu
reP
hosp
hate
ERR
Flag
Nitr
ite
ERR
Flag
Nitr
ate
ERR
Flag
NOX
ERR
Flag
Sili
cate
ERR
Flag
20
18 I
C re
sult
s re
port
ed b
y th
e p
art
icip
an
tsin
mic
ro m
ole
s per
kil
ogra
m
91
Sam
ple
#1
20
18
01
16
20
1.4
20
.00
22
21
9.7
10
.00
23
6.5
50
.05
2
Sam
ple
#3
20
18
01
16
20
0.0
00
.00
22
2-0
.01
0.0
02
-0.0
10
.03
2
Sam
ple
#4
20
18
01
16
20
0.4
50
.00
22
25
.48
0.0
12
13
.83
0.0
22
Sam
ple
#5
20
18
01
16
20
1.7
20
.00
22
22
3.7
60
.01
25
6.4
00
.10
2
92
Sam
ple
#1
20
18
01
09
18
.61
.41
0.0
12
0.0
70
.01
21
9.6
40
.05
21
9.7
10
.05
23
6.6
30
.03
2
Sam
ple
#3
20
18
01
09
18
.60
.03
0.0
12
0.0
20
.00
20
.04
0.0
12
0.0
60
.01
20
.01
0.0
12
Sam
ple
#4
20
18
01
09
18
.60
.45
0.0
02
0.0
20
.00
25
.50
0.0
32
5.5
20
.03
21
3.9
50
.02
2
Sam
ple
#5
20
18
01
10
17
.51
.70
0.0
02
0.0
50
.00
22
3.7
70
.07
22
3.8
20
.08
25
6.5
10
.03
2
93
Sam
ple
#1
20
17
12
07
20
.51
.36
0.0
12
0.0
40
.00
21
9.5
70
.08
21
9.6
10
.08
23
6.0
60
.14
2
Sam
ple
#2
20
17
12
07
20
.53
.01
0.0
22
0.0
60
.00
24
3.0
40
.03
24
3.1
00
.03
21
56
.07
0.4
62
Sam
ple
#3
20
17
12
07
20
.50
.01
0.0
02
0.0
00
.00
20
.02
0.0
22
0.0
30
.02
20
.11
0.1
02
Sam
ple
#4
20
17
12
07
20
.50
.42
0.0
02
0.0
00
.00
25
.42
0.0
22
5.4
20
.02
21
3.7
10
.03
2
Sam
ple
#5
20
17
12
07
20
.51
.64
0.0
12
0.0
40
.00
22
3.5
40
.07
22
3.5
80
.07
25
5.3
70
.09
2
95
Sam
ple
#1
20
18
05
08
28
1.3
40
.00
20
.06
0.0
12
19
.70
0.0
82
19
.76
0.0
82
39
.69
0.6
72
Sam
ple
#2
20
18
05
08
28
3.0
00
.06
20
.08
0.0
12
41
.81
0.1
92
41
.88
0.1
92
16
9.8
02
.62
2
Sam
ple
#3
20
18
05
08
28
0.0
00
.00
20
.00
0.0
02
0.0
00
.00
20
.00
0.0
02
0.0
00
.00
2
Sam
ple
#4
20
18
05
08
28
0.4
10
.00
20
.02
0.0
02
5.5
20
.03
25
.54
0.0
32
14
.64
0.3
42
Sam
ple
#5
20
18
05
08
28
2.0
40
.62
20
.05
0.0
12
23
.74
0.1
02
23
.79
0.1
02
61
.16
1.1
42
98
Sam
ple
#1
20
18
04
19
21
.72
.52
0.1
82
22
19
.08
0.9
52
25
.43
1.0
22
Sam
ple
#3
20
18
04
19
21
.71
.01
0.0
72
22
0.0
00
.00
20
.75
0.0
32
Sam
ple
#4
20
18
04
19
21
.71
.28
0.0
92
22
5.2
30
.26
21
0.0
20
.40
2
Sam
ple
#5
20
18
04
19
21
.73
.25
0.2
32
22
23
.12
1.1
62
37
.82
1.5
12
101
Sam
ple
#1
20
18
04
16
24
.11
.38
0.0
12
0.0
20
.00
21
9.9
70
.05
22
0.5
90
.05
23
4.4
80
.07
2
Sam
ple
#3
20
18
04
16
24
.10
.01
0.0
12
-0.0
30
.00
20
.27
0.0
02
0.2
50
.00
20
.01
0.0
02
Sam
ple
#4
20
18
04
16
24
.10
.47
0.0
22
-0.0
20
.00
25
.42
0.0
62
5.5
60
.06
21
3.1
10
.02
2
Sam
ple
#5
20
18
04
16
24
.11
.72
0.0
22
0.0
30
.00
22
4.5
30
.07
22
5.3
00
.07
25
3.2
80
.18
2
20
18
/06
/19
8/1
4 p
ages
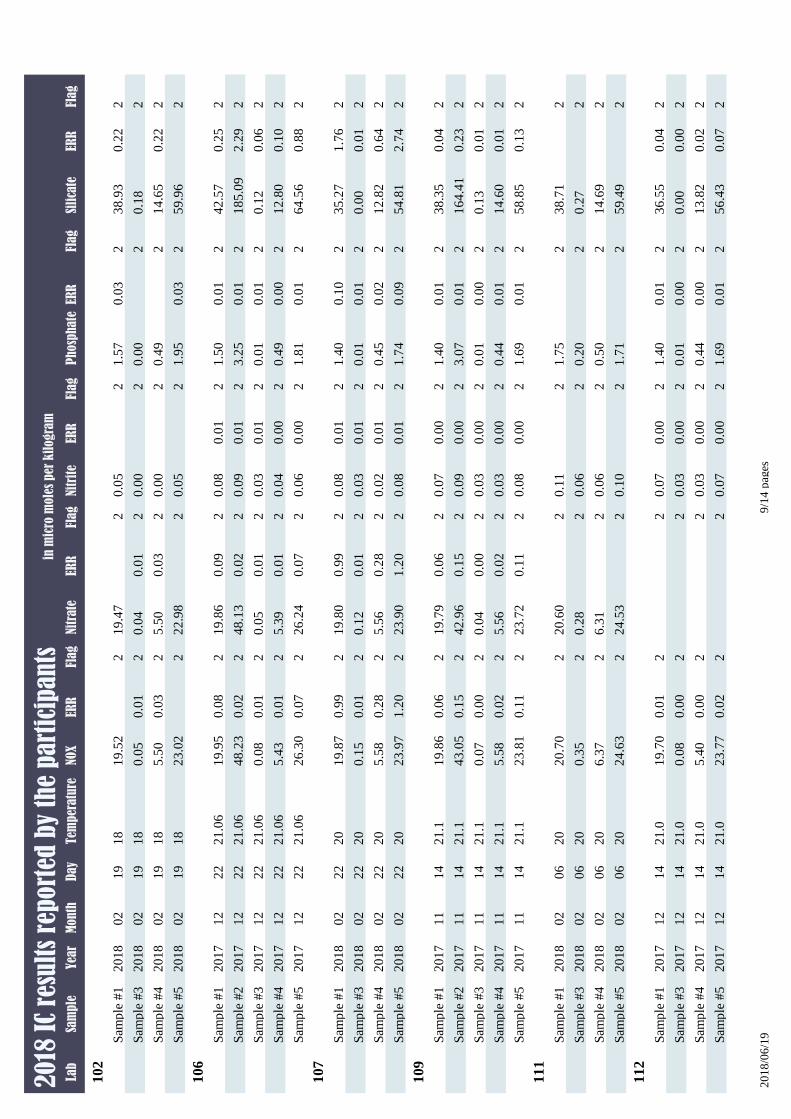
Lab
Sam
ple
Yea
rM
onth
Day
Tem
per
atu
reP
hosp
hate
ERR
Flag
Nitr
ite
ERR
Flag
Nitr
ate
ERR
Flag
NOX
ERR
Flag
Sili
cate
ERR
Flag
20
18 I
C re
sult
s re
port
ed b
y th
e p
art
icip
an
tsin
mic
ro m
ole
s per
kil
ogra
m
102
Sam
ple
#1
20
18
02
19
18
1.5
70
.03
20
.05
21
9.4
72
19
.52
23
8.9
30
.22
2
Sam
ple
#3
20
18
02
19
18
0.0
02
0.0
02
0.0
40
.01
20
.05
0.0
12
0.1
82
Sam
ple
#4
20
18
02
19
18
0.4
92
0.0
02
5.5
00
.03
25
.50
0.0
32
14
.65
0.2
22
Sam
ple
#5
20
18
02
19
18
1.9
50
.03
20
.05
22
2.9
82
23
.02
25
9.9
62
106
Sam
ple
#1
20
17
12
22
21
.06
1.5
00
.01
20
.08
0.0
12
19
.86
0.0
92
19
.95
0.0
82
42
.57
0.2
52
Sam
ple
#2
20
17
12
22
21
.06
3.2
50
.01
20
.09
0.0
12
48
.13
0.0
22
48
.23
0.0
22
18
5.0
92
.29
2
Sam
ple
#3
20
17
12
22
21
.06
0.0
10
.01
20
.03
0.0
12
0.0
50
.01
20
.08
0.0
12
0.1
20
.06
2
Sam
ple
#4
20
17
12
22
21
.06
0.4
90
.00
20
.04
0.0
02
5.3
90
.01
25
.43
0.0
12
12
.80
0.1
02
Sam
ple
#5
20
17
12
22
21
.06
1.8
10
.01
20
.06
0.0
02
26
.24
0.0
72
26
.30
0.0
72
64
.56
0.8
82
107
Sam
ple
#1
20
18
02
22
20
1.4
00
.10
20
.08
0.0
12
19
.80
0.9
92
19
.87
0.9
92
35
.27
1.7
62
Sam
ple
#3
20
18
02
22
20
0.0
10
.01
20
.03
0.0
12
0.1
20
.01
20
.15
0.0
12
0.0
00
.01
2
Sam
ple
#4
20
18
02
22
20
0.4
50
.02
20
.02
0.0
12
5.5
60
.28
25
.58
0.2
82
12
.82
0.6
42
Sam
ple
#5
20
18
02
22
20
1.7
40
.09
20
.08
0.0
12
23
.90
1.2
02
23
.97
1.2
02
54
.81
2.7
42
109
Sam
ple
#1
20
17
11
14
21
.11
.40
0.0
12
0.0
70
.00
21
9.7
90
.06
21
9.8
60
.06
23
8.3
50
.04
2
Sam
ple
#2
20
17
11
14
21
.13
.07
0.0
12
0.0
90
.00
24
2.9
60
.15
24
3.0
50
.15
21
64
.41
0.2
32
Sam
ple
#3
20
17
11
14
21
.10
.01
0.0
02
0.0
30
.00
20
.04
0.0
02
0.0
70
.00
20
.13
0.0
12
Sam
ple
#4
20
17
11
14
21
.10
.44
0.0
12
0.0
30
.00
25
.56
0.0
22
5.5
80
.02
21
4.6
00
.01
2
Sam
ple
#5
20
17
11
14
21
.11
.69
0.0
12
0.0
80
.00
22
3.7
20
.11
22
3.8
10
.11
25
8.8
50
.13
2
111
Sam
ple
#1
20
18
02
06
20
1.7
52
0.1
12
20
.60
22
0.7
02
38
.71
2
Sam
ple
#3
20
18
02
06
20
0.2
02
0.0
62
0.2
82
0.3
52
0.2
72
Sam
ple
#4
20
18
02
06
20
0.5
02
0.0
62
6.3
12
6.3
72
14
.69
2
Sam
ple
#5
20
18
02
06
20
1.7
12
0.1
02
24
.53
22
4.6
32
59
.49
2
112
Sam
ple
#1
20
17
12
14
21
.01
.40
0.0
12
0.0
70
.00
22
19
.70
0.0
12
36
.55
0.0
42
Sam
ple
#3
20
17
12
14
21
.00
.01
0.0
02
0.0
30
.00
22
0.0
80
.00
20
.00
0.0
02
Sam
ple
#4
20
17
12
14
21
.00
.44
0.0
02
0.0
30
.00
22
5.4
00
.00
21
3.8
20
.02
2
Sam
ple
#5
20
17
12
14
21
.01
.69
0.0
12
0.0
70
.00
22
23
.77
0.0
22
56
.43
0.0
72
20
18
/06
/19
9/1
4 p
ages
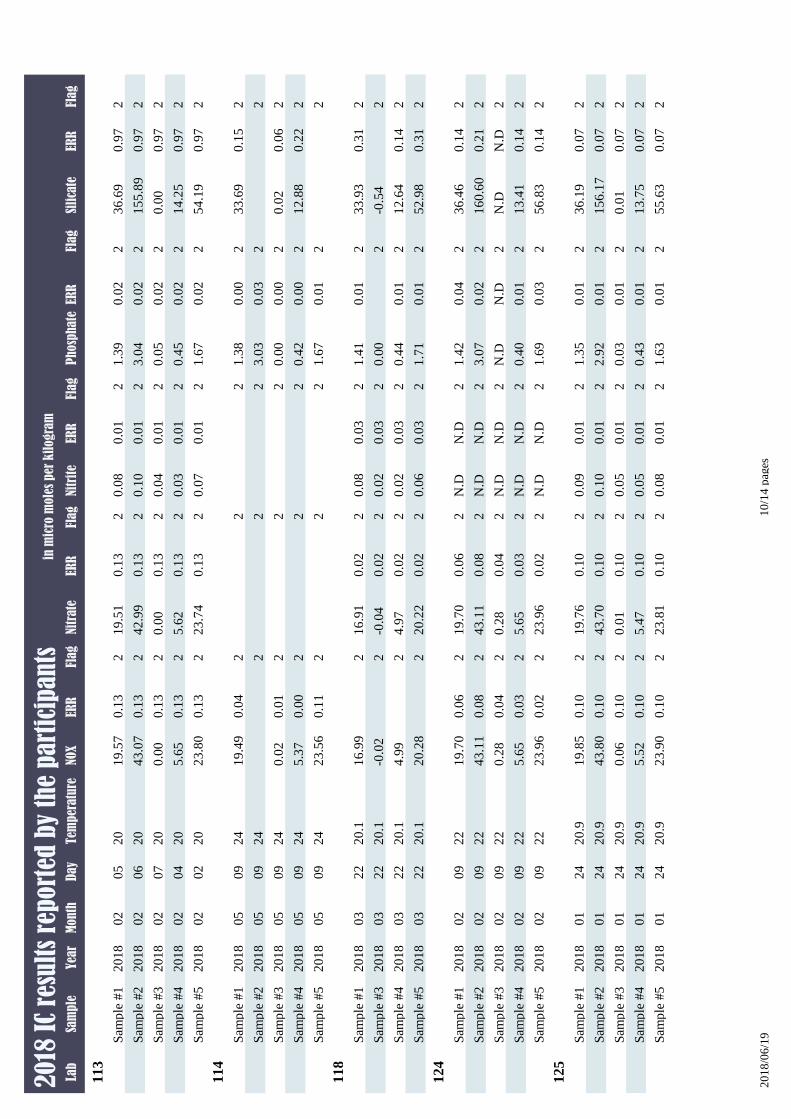
Lab
Sam
ple
Yea
rM
onth
Day
Tem
per
atu
reP
hosp
hate
ERR
Flag
Nitr
ite
ERR
Flag
Nitr
ate
ERR
Flag
NOX
ERR
Flag
Sili
cate
ERR
Flag
20
18 I
C re
sult
s re
port
ed b
y th
e p
art
icip
an
tsin
mic
ro m
ole
s per
kil
ogra
m
113
Sam
ple
#1
20
18
02
05
20
1.3
90
.02
20
.08
0.0
12
19
.51
0.1
32
19
.57
0.1
32
36
.69
0.9
72
Sam
ple
#2
20
18
02
06
20
3.0
40
.02
20
.10
0.0
12
42
.99
0.1
32
43
.07
0.1
32
15
5.8
90
.97
2
Sam
ple
#3
20
18
02
07
20
0.0
50
.02
20
.04
0.0
12
0.0
00
.13
20
.00
0.1
32
0.0
00
.97
2
Sam
ple
#4
20
18
02
04
20
0.4
50
.02
20
.03
0.0
12
5.6
20
.13
25
.65
0.1
32
14
.25
0.9
72
Sam
ple
#5
20
18
02
02
20
1.6
70
.02
20
.07
0.0
12
23
.74
0.1
32
23
.80
0.1
32
54
.19
0.9
72
114
Sam
ple
#1
20
18
05
09
24
1.3
80
.00
22
21
9.4
90
.04
23
3.6
90
.15
2
Sam
ple
#2
20
18
05
09
24
3.0
30
.03
22
22
2
Sam
ple
#3
20
18
05
09
24
0.0
00
.00
22
20
.02
0.0
12
0.0
20
.06
2
Sam
ple
#4
20
18
05
09
24
0.4
20
.00
22
25
.37
0.0
02
12
.88
0.2
22
Sam
ple
#5
20
18
05
09
24
1.6
70
.01
22
22
3.5
60
.11
22
118
Sam
ple
#1
20
18
03
22
20
.11
.41
0.0
12
0.0
80
.03
21
6.9
10
.02
21
6.9
92
33
.93
0.3
12
Sam
ple
#3
20
18
03
22
20
.10
.00
20
.02
0.0
32
-0.0
40
.02
2-0
.02
2-0
.54
2
Sam
ple
#4
20
18
03
22
20
.10
.44
0.0
12
0.0
20
.03
24
.97
0.0
22
4.9
92
12
.64
0.1
42
Sam
ple
#5
20
18
03
22
20
.11
.71
0.0
12
0.0
60
.03
22
0.2
20
.02
22
0.2
82
52
.98
0.3
12
124
Sam
ple
#1
20
18
02
09
22
1.4
20
.04
2N
.DN
.D2
19
.70
0.0
62
19
.70
0.0
62
36
.46
0.1
42
Sam
ple
#2
20
18
02
09
22
3.0
70
.02
2N
.DN
.D2
43
.11
0.0
82
43
.11
0.0
82
16
0.6
00
.21
2
Sam
ple
#3
20
18
02
09
22
N.D
N.D
2N
.DN
.D2
0.2
80
.04
20
.28
0.0
42
N.D
N.D
2
Sam
ple
#4
20
18
02
09
22
0.4
00
.01
2N
.DN
.D2
5.6
50
.03
25
.65
0.0
32
13
.41
0.1
42
Sam
ple
#5
20
18
02
09
22
1.6
90
.03
2N
.DN
.D2
23
.96
0.0
22
23
.96
0.0
22
56
.83
0.1
42
125
Sam
ple
#1
20
18
01
24
20
.91
.35
0.0
12
0.0
90
.01
21
9.7
60
.10
21
9.8
50
.10
23
6.1
90
.07
2
Sam
ple
#2
20
18
01
24
20
.92
.92
0.0
12
0.1
00
.01
24
3.7
00
.10
24
3.8
00
.10
21
56
.17
0.0
72
Sam
ple
#3
20
18
01
24
20
.90
.03
0.0
12
0.0
50
.01
20
.01
0.1
02
0.0
60
.10
20
.01
0.0
72
Sam
ple
#4
20
18
01
24
20
.90
.43
0.0
12
0.0
50
.01
25
.47
0.1
02
5.5
20
.10
21
3.7
50
.07
2
Sam
ple
#5
20
18
01
24
20
.91
.63
0.0
12
0.0
80
.01
22
3.8
10
.10
22
3.9
00
.10
25
5.6
30
.07
2
20
18
/06
/19
10
/14
pag
es
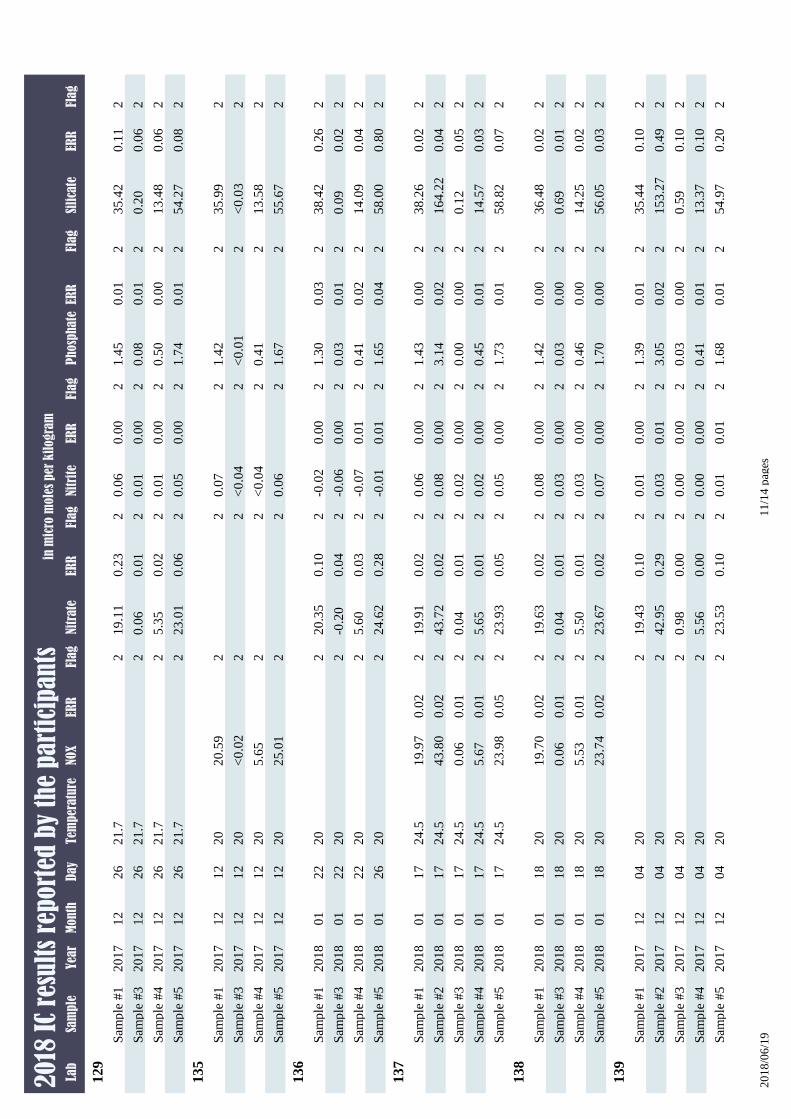
Lab
Sam
ple
Yea
rM
onth
Day
Tem
per
atu
reP
hosp
hate
ERR
Flag
Nitr
ite
ERR
Flag
Nitr
ate
ERR
Flag
NOX
ERR
Flag
Sili
cate
ERR
Flag
20
18 I
C re
sult
s re
port
ed b
y th
e p
art
icip
an
tsin
mic
ro m
ole
s per
kil
ogra
m
129
Sam
ple
#1
20
17
12
26
21
.71
.45
0.0
12
0.0
60
.00
21
9.1
10
.23
22
35
.42
0.1
12
Sam
ple
#3
20
17
12
26
21
.70
.08
0.0
12
0.0
10
.00
20
.06
0.0
12
20
.20
0.0
62
Sam
ple
#4
20
17
12
26
21
.70
.50
0.0
02
0.0
10
.00
25
.35
0.0
22
21
3.4
80
.06
2
Sam
ple
#5
20
17
12
26
21
.71
.74
0.0
12
0.0
50
.00
22
3.0
10
.06
22
54
.27
0.0
82
135
Sam
ple
#1
20
17
12
12
20
1.4
22
0.0
72
22
0.5
92
35
.99
2
Sam
ple
#3
20
17
12
12
20
<0
.01
2<
0.0
42
2<
0.0
22
<0
.03
2
Sam
ple
#4
20
17
12
12
20
0.4
12
<0
.04
22
5.6
52
13
.58
2
Sam
ple
#5
20
17
12
12
20
1.6
72
0.0
62
22
5.0
12
55
.67
2
136
Sam
ple
#1
20
18
01
22
20
1.3
00
.03
2-0
.02
0.0
02
20
.35
0.1
02
23
8.4
20
.26
2
Sam
ple
#3
20
18
01
22
20
0.0
30
.01
2-0
.06
0.0
02
-0.2
00
.04
22
0.0
90
.02
2
Sam
ple
#4
20
18
01
22
20
0.4
10
.02
2-0
.07
0.0
12
5.6
00
.03
22
14
.09
0.0
42
Sam
ple
#5
20
18
01
26
20
1.6
50
.04
2-0
.01
0.0
12
24
.62
0.2
82
25
8.0
00
.80
2
137
Sam
ple
#1
20
18
01
17
24
.51
.43
0.0
02
0.0
60
.00
21
9.9
10
.02
21
9.9
70
.02
23
8.2
60
.02
2
Sam
ple
#2
20
18
01
17
24
.53
.14
0.0
22
0.0
80
.00
24
3.7
20
.02
24
3.8
00
.02
21
64
.22
0.0
42
Sam
ple
#3
20
18
01
17
24
.50
.00
0.0
02
0.0
20
.00
20
.04
0.0
12
0.0
60
.01
20
.12
0.0
52
Sam
ple
#4
20
18
01
17
24
.50
.45
0.0
12
0.0
20
.00
25
.65
0.0
12
5.6
70
.01
21
4.5
70
.03
2
Sam
ple
#5
20
18
01
17
24
.51
.73
0.0
12
0.0
50
.00
22
3.9
30
.05
22
3.9
80
.05
25
8.8
20
.07
2
138
Sam
ple
#1
20
18
01
18
20
1.4
20
.00
20
.08
0.0
02
19
.63
0.0
22
19
.70
0.0
22
36
.48
0.0
22
Sam
ple
#3
20
18
01
18
20
0.0
30
.00
20
.03
0.0
02
0.0
40
.01
20
.06
0.0
12
0.6
90
.01
2
Sam
ple
#4
20
18
01
18
20
0.4
60
.00
20
.03
0.0
02
5.5
00
.01
25
.53
0.0
12
14
.25
0.0
22
Sam
ple
#5
20
18
01
18
20
1.7
00
.00
20
.07
0.0
02
23
.67
0.0
22
23
.74
0.0
22
56
.05
0.0
32
139
Sam
ple
#1
20
17
12
04
20
1.3
90
.01
20
.01
0.0
02
19
.43
0.1
02
23
5.4
40
.10
2
Sam
ple
#2
20
17
12
04
20
3.0
50
.02
20
.03
0.0
12
42
.95
0.2
92
21
53
.27
0.4
92
Sam
ple
#3
20
17
12
04
20
0.0
30
.00
20
.00
0.0
02
0.9
80
.00
22
0.5
90
.10
2
Sam
ple
#4
20
17
12
04
20
0.4
10
.01
20
.00
0.0
02
5.5
60
.00
22
13
.37
0.1
02
Sam
ple
#5
20
17
12
04
20
1.6
80
.01
20
.01
0.0
12
23
.53
0.1
02
25
4.9
70
.20
2
20
18
/06
/19
11
/14
pag
es
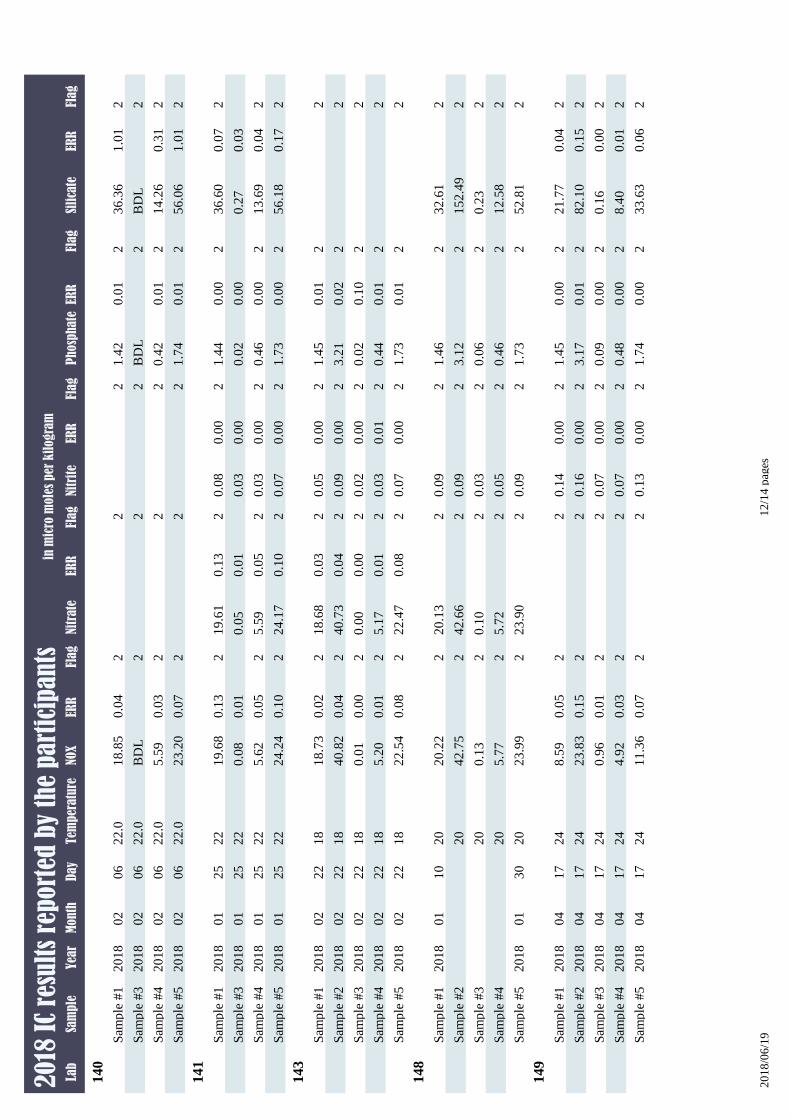
Lab
Sam
ple
Yea
rM
onth
Day
Tem
per
atu
reP
hosp
hate
ERR
Flag
Nitr
ite
ERR
Flag
Nitr
ate
ERR
Flag
NOX
ERR
Flag
Sili
cate
ERR
Flag
20
18 I
C re
sult
s re
port
ed b
y th
e p
art
icip
an
tsin
mic
ro m
ole
s per
kil
ogra
m
140
Sam
ple
#1
20
18
02
06
22
.01
.42
0.0
12
22
18
.85
0.0
42
36
.36
1.0
12
Sam
ple
#3
20
18
02
06
22
.0B
DL
22
2B
DL
2B
DL
2
Sam
ple
#4
20
18
02
06
22
.00
.42
0.0
12
22
5.5
90
.03
21
4.2
60
.31
2
Sam
ple
#5
20
18
02
06
22
.01
.74
0.0
12
22
23
.20
0.0
72
56
.06
1.0
12
141
Sam
ple
#1
20
18
01
25
22
1.4
40
.00
20
.08
0.0
02
19
.61
0.1
32
19
.68
0.1
32
36
.60
0.0
72
Sam
ple
#3
20
18
01
25
22
0.0
20
.00
0.0
30
.00
0.0
50
.01
0.0
80
.01
0.2
70
.03
Sam
ple
#4
20
18
01
25
22
0.4
60
.00
20
.03
0.0
02
5.5
90
.05
25
.62
0.0
52
13
.69
0.0
42
Sam
ple
#5
20
18
01
25
22
1.7
30
.00
20
.07
0.0
02
24
.17
0.1
02
24
.24
0.1
02
56
.18
0.1
72
143
Sam
ple
#1
20
18
02
22
18
1.4
50
.01
20
.05
0.0
02
18
.68
0.0
32
18
.73
0.0
22
2
Sam
ple
#2
20
18
02
22
18
3.2
10
.02
20
.09
0.0
02
40
.73
0.0
42
40
.82
0.0
42
2
Sam
ple
#3
20
18
02
22
18
0.0
20
.10
20
.02
0.0
02
0.0
00
.00
20
.01
0.0
02
2
Sam
ple
#4
20
18
02
22
18
0.4
40
.01
20
.03
0.0
12
5.1
70
.01
25
.20
0.0
12
2
Sam
ple
#5
20
18
02
22
18
1.7
30
.01
20
.07
0.0
02
22
.47
0.0
82
22
.54
0.0
82
2
148
Sam
ple
#1
20
18
01
10
20
1.4
62
0.0
92
20
.13
22
0.2
22
32
.61
2
Sam
ple
#2
20
3.1
22
0.0
92
42
.66
24
2.7
52
15
2.4
92
Sam
ple
#3
20
0.0
62
0.0
32
0.1
02
0.1
32
0.2
32
Sam
ple
#4
20
0.4
62
0.0
52
5.7
22
5.7
72
12
.58
2
Sam
ple
#5
20
18
01
30
20
1.7
32
0.0
92
23
.90
22
3.9
92
52
.81
2
149
Sam
ple
#1
20
18
04
17
24
1.4
50
.00
20
.14
0.0
02
28
.59
0.0
52
21
.77
0.0
42
Sam
ple
#2
20
18
04
17
24
3.1
70
.01
20
.16
0.0
02
22
3.8
30
.15
28
2.1
00
.15
2
Sam
ple
#3
20
18
04
17
24
0.0
90
.00
20
.07
0.0
02
20
.96
0.0
12
0.1
60
.00
2
Sam
ple
#4
20
18
04
17
24
0.4
80
.00
20
.07
0.0
02
24
.92
0.0
32
8.4
00
.01
2
Sam
ple
#5
20
18
04
17
24
1.7
40
.00
20
.13
0.0
02
21
1.3
60
.07
23
3.6
30
.06
2
20
18
/06
/19
12
/14
pag
es
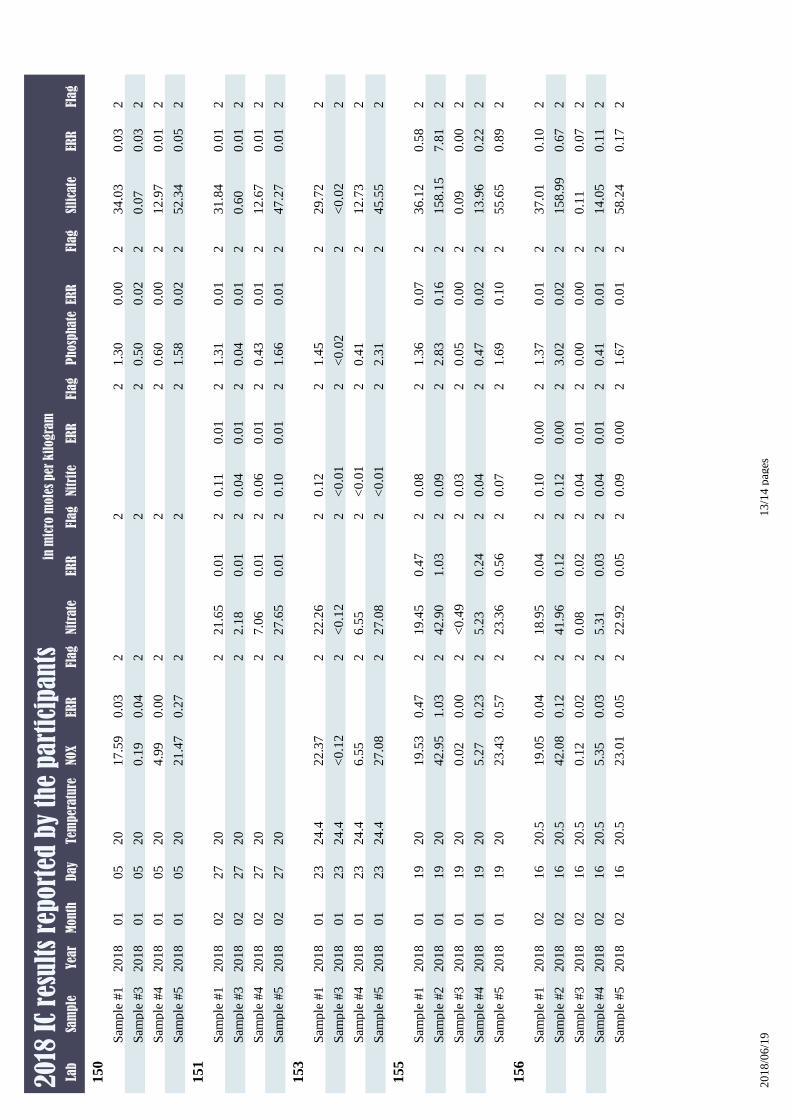
Lab
Sam
ple
Yea
rM
onth
Day
Tem
per
atu
reP
hosp
hate
ERR
Flag
Nitr
ite
ERR
Flag
Nitr
ate
ERR
Flag
NOX
ERR
Flag
Sili
cate
ERR
Flag
20
18 I
C re
sult
s re
port
ed b
y th
e p
art
icip
an
tsin
mic
ro m
ole
s per
kil
ogra
m
150
Sam
ple
#1
20
18
01
05
20
1.3
00
.00
22
21
7.5
90
.03
23
4.0
30
.03
2
Sam
ple
#3
20
18
01
05
20
0.5
00
.02
22
20
.19
0.0
42
0.0
70
.03
2
Sam
ple
#4
20
18
01
05
20
0.6
00
.00
22
24
.99
0.0
02
12
.97
0.0
12
Sam
ple
#5
20
18
01
05
20
1.5
80
.02
22
22
1.4
70
.27
25
2.3
40
.05
2
151
Sam
ple
#1
20
18
02
27
20
1.3
10
.01
20
.11
0.0
12
21
.65
0.0
12
23
1.8
40
.01
2
Sam
ple
#3
20
18
02
27
20
0.0
40
.01
20
.04
0.0
12
2.1
80
.01
22
0.6
00
.01
2
Sam
ple
#4
20
18
02
27
20
0.4
30
.01
20
.06
0.0
12
7.0
60
.01
22
12
.67
0.0
12
Sam
ple
#5
20
18
02
27
20
1.6
60
.01
20
.10
0.0
12
27
.65
0.0
12
24
7.2
70
.01
2
153
Sam
ple
#1
20
18
01
23
24
.41
.45
20
.12
22
2.2
62
22
.37
22
9.7
22
Sam
ple
#3
20
18
01
23
24
.4<
0.0
22
<0
.01
2<
0.1
22
<0
.12
2<
0.0
22
Sam
ple
#4
20
18
01
23
24
.40
.41
2<
0.0
12
6.5
52
6.5
52
12
.73
2
Sam
ple
#5
20
18
01
23
24
.42
.31
2<
0.0
12
27
.08
22
7.0
82
45
.55
2
155
Sam
ple
#1
20
18
01
19
20
1.3
60
.07
20
.08
21
9.4
50
.47
21
9.5
30
.47
23
6.1
20
.58
2
Sam
ple
#2
20
18
01
19
20
2.8
30
.16
20
.09
24
2.9
01
.03
24
2.9
51
.03
21
58
.15
7.8
12
Sam
ple
#3
20
18
01
19
20
0.0
50
.00
20
.03
2<
0.4
92
0.0
20
.00
20
.09
0.0
02
Sam
ple
#4
20
18
01
19
20
0.4
70
.02
20
.04
25
.23
0.2
42
5.2
70
.23
21
3.9
60
.22
2
Sam
ple
#5
20
18
01
19
20
1.6
90
.10
20
.07
22
3.3
60
.56
22
3.4
30
.57
25
5.6
50
.89
2
156
Sam
ple
#1
20
18
02
16
20
.51
.37
0.0
12
0.1
00
.00
21
8.9
50
.04
21
9.0
50
.04
23
7.0
10
.10
2
Sam
ple
#2
20
18
02
16
20
.53
.02
0.0
22
0.1
20
.00
24
1.9
60
.12
24
2.0
80
.12
21
58
.99
0.6
72
Sam
ple
#3
20
18
02
16
20
.50
.00
0.0
02
0.0
40
.01
20
.08
0.0
22
0.1
20
.02
20
.11
0.0
72
Sam
ple
#4
20
18
02
16
20
.50
.41
0.0
12
0.0
40
.01
25
.31
0.0
32
5.3
50
.03
21
4.0
50
.11
2
Sam
ple
#5
20
18
02
16
20
.51
.67
0.0
12
0.0
90
.00
22
2.9
20
.05
22
3.0
10
.05
25
8.2
40
.17
2
20
18
/06
/19
13
/14
pag
es
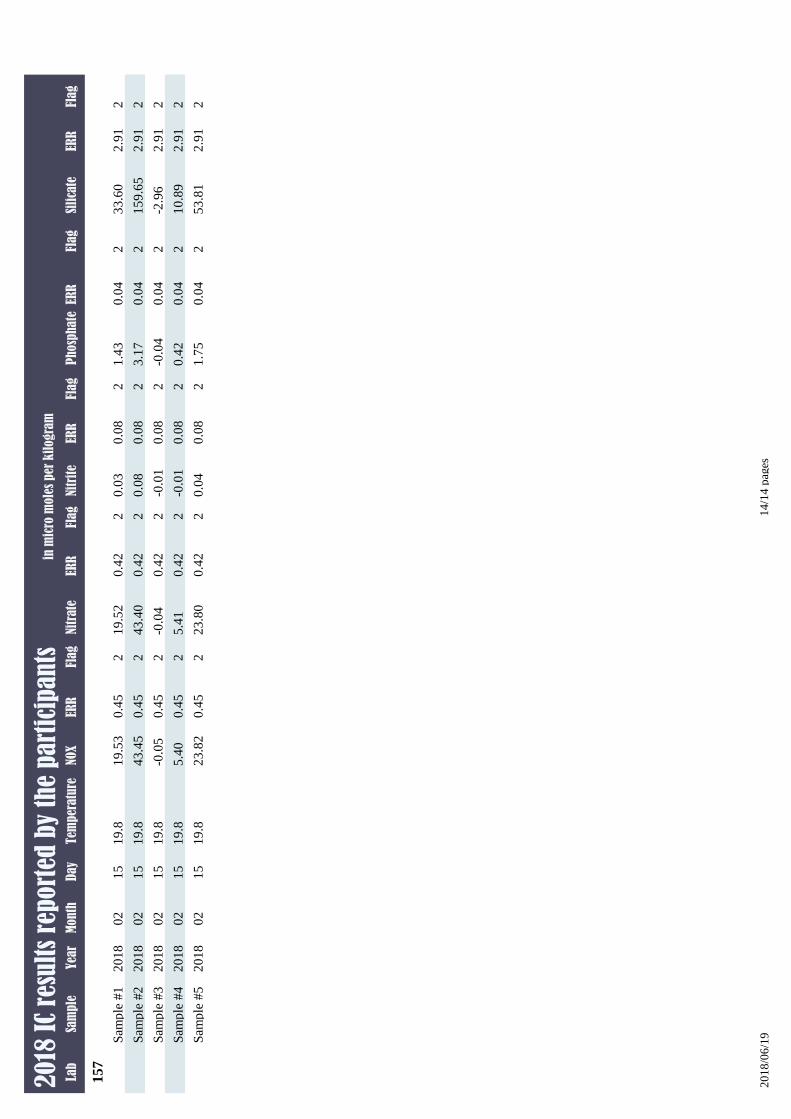
Lab
Sam
ple
Yea
rM
onth
Day
Tem
per
atu
reP
hosp
hate
ERR
Flag
Nitr
ite
ERR
Flag
Nitr
ate
ERR
Flag
NOX
ERR
Flag
Sili
cate
ERR
Flag
20
18 I
C re
sult
s re
port
ed b
y th
e p
art
icip
an
tsin
mic
ro m
ole
s per
kil
ogra
m
157
Sam
ple
#1
20
18
02
15
19
.81
.43
0.0
42
0.0
30
.08
21
9.5
20
.42
21
9.5
30
.45
23
3.6
02
.91
2
Sam
ple
#2
20
18
02
15
19
.83
.17
0.0
42
0.0
80
.08
24
3.4
00
.42
24
3.4
50
.45
21
59
.65
2.9
12
Sam
ple
#3
20
18
02
15
19
.8-0
.04
0.0
42
-0.0
10
.08
2-0
.04
0.4
22
-0.0
50
.45
2-2
.96
2.9
12
Sam
ple
#4
20
18
02
15
19
.80
.42
0.0
42
-0.0
10
.08
25
.41
0.4
22
5.4
00
.45
21
0.8
92
.91
2
Sam
ple
#5
20
18
02
15
19
.81
.75
0.0
42
0.0
40
.08
22
3.8
00
.42
22
3.8
20
.45
25
3.8
12
.91
2
20
18
/06
/19
14
/14
pag
es
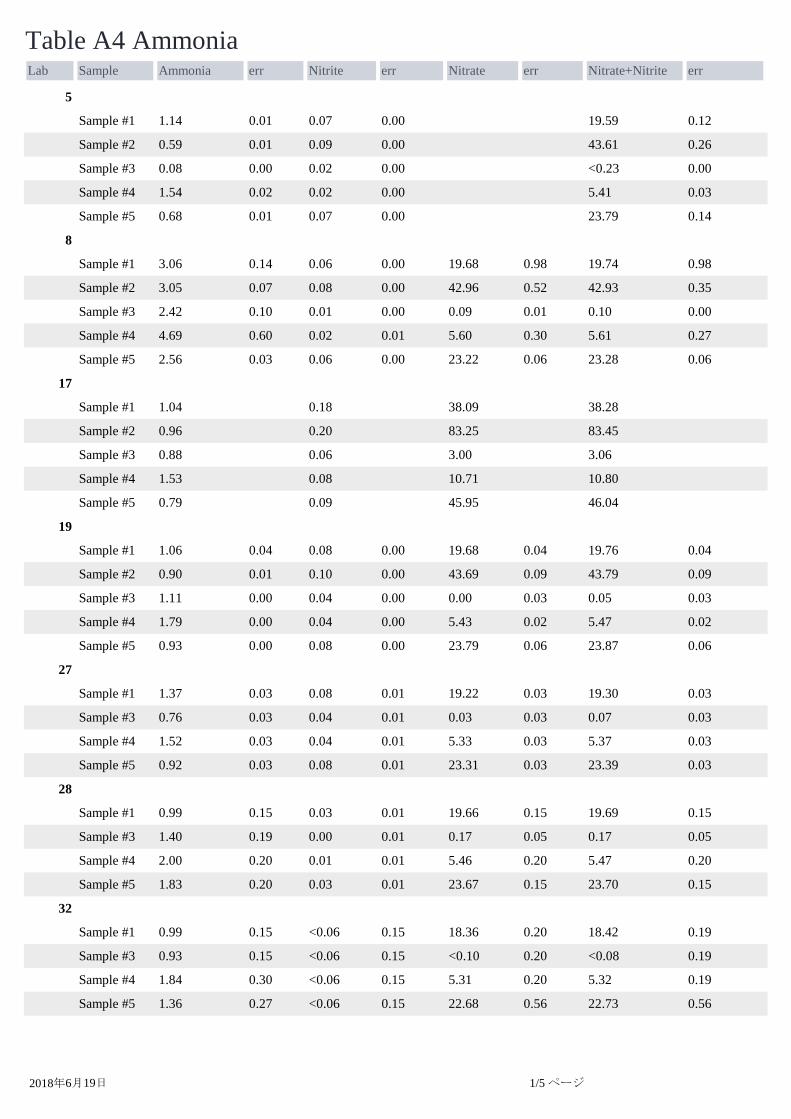
Lab Sample Ammonia err Nitrite err Nitrate err Nitrate+Nitrite err
Table A4 Ammonia
5
Sample #1 1.14 0.01 0.07 0.00 19.59 0.12
Sample #2 0.59 0.01 0.09 0.00 43.61 0.26
Sample #3 0.08 0.00 0.02 0.00 <0.23 0.00
Sample #4 1.54 0.02 0.02 0.00 5.41 0.03
Sample #5 0.68 0.01 0.07 0.00 23.79 0.14
8
Sample #1 3.06 0.14 0.06 0.00 19.68 0.98 19.74 0.98
Sample #2 3.05 0.07 0.08 0.00 42.96 0.52 42.93 0.35
Sample #3 2.42 0.10 0.01 0.00 0.09 0.01 0.10 0.00
Sample #4 4.69 0.60 0.02 0.01 5.60 0.30 5.61 0.27
Sample #5 2.56 0.03 0.06 0.00 23.22 0.06 23.28 0.06
17
Sample #1 1.04 0.18 38.09 38.28
Sample #2 0.96 0.20 83.25 83.45
Sample #3 0.88 0.06 3.00 3.06
Sample #4 1.53 0.08 10.71 10.80
Sample #5 0.79 0.09 45.95 46.04
19
Sample #1 1.06 0.04 0.08 0.00 19.68 0.04 19.76 0.04
Sample #2 0.90 0.01 0.10 0.00 43.69 0.09 43.79 0.09
Sample #3 1.11 0.00 0.04 0.00 0.00 0.03 0.05 0.03
Sample #4 1.79 0.00 0.04 0.00 5.43 0.02 5.47 0.02
Sample #5 0.93 0.00 0.08 0.00 23.79 0.06 23.87 0.06
27
Sample #1 1.37 0.03 0.08 0.01 19.22 0.03 19.30 0.03
Sample #3 0.76 0.03 0.04 0.01 0.03 0.03 0.07 0.03
Sample #4 1.52 0.03 0.04 0.01 5.33 0.03 5.37 0.03
Sample #5 0.92 0.03 0.08 0.01 23.31 0.03 23.39 0.03
28
Sample #1 0.99 0.15 0.03 0.01 19.66 0.15 19.69 0.15
Sample #3 1.40 0.19 0.00 0.01 0.17 0.05 0.17 0.05
Sample #4 2.00 0.20 0.01 0.01 5.46 0.20 5.47 0.20
Sample #5 1.83 0.20 0.03 0.01 23.67 0.15 23.70 0.15
32
Sample #1 0.99 0.15 <0.06 0.15 18.36 0.20 18.42 0.19
Sample #3 0.93 0.15 <0.06 0.15 <0.10 0.20 <0.08 0.19
Sample #4 1.84 0.30 <0.06 0.15 5.31 0.20 5.32 0.19
Sample #5 1.36 0.27 <0.06 0.15 22.68 0.56 22.73 0.56
2018年6月19日 1/5 ページ
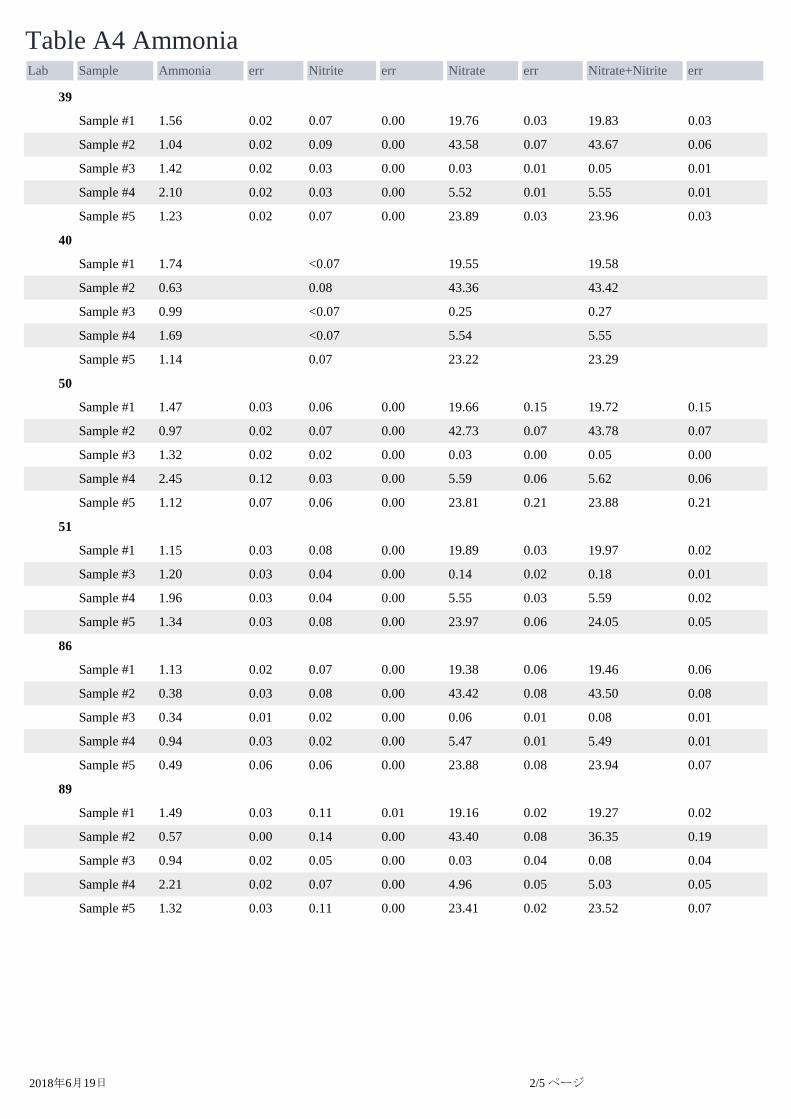
Lab Sample Ammonia err Nitrite err Nitrate err Nitrate+Nitrite err
Table A4 Ammonia
39
Sample #1 1.56 0.02 0.07 0.00 19.76 0.03 19.83 0.03
Sample #2 1.04 0.02 0.09 0.00 43.58 0.07 43.67 0.06
Sample #3 1.42 0.02 0.03 0.00 0.03 0.01 0.05 0.01
Sample #4 2.10 0.02 0.03 0.00 5.52 0.01 5.55 0.01
Sample #5 1.23 0.02 0.07 0.00 23.89 0.03 23.96 0.03
40
Sample #1 1.74 <0.07 19.55 19.58
Sample #2 0.63 0.08 43.36 43.42
Sample #3 0.99 <0.07 0.25 0.27
Sample #4 1.69 <0.07 5.54 5.55
Sample #5 1.14 0.07 23.22 23.29
50
Sample #1 1.47 0.03 0.06 0.00 19.66 0.15 19.72 0.15
Sample #2 0.97 0.02 0.07 0.00 42.73 0.07 43.78 0.07
Sample #3 1.32 0.02 0.02 0.00 0.03 0.00 0.05 0.00
Sample #4 2.45 0.12 0.03 0.00 5.59 0.06 5.62 0.06
Sample #5 1.12 0.07 0.06 0.00 23.81 0.21 23.88 0.21
51
Sample #1 1.15 0.03 0.08 0.00 19.89 0.03 19.97 0.02
Sample #3 1.20 0.03 0.04 0.00 0.14 0.02 0.18 0.01
Sample #4 1.96 0.03 0.04 0.00 5.55 0.03 5.59 0.02
Sample #5 1.34 0.03 0.08 0.00 23.97 0.06 24.05 0.05
86
Sample #1 1.13 0.02 0.07 0.00 19.38 0.06 19.46 0.06
Sample #2 0.38 0.03 0.08 0.00 43.42 0.08 43.50 0.08
Sample #3 0.34 0.01 0.02 0.00 0.06 0.01 0.08 0.01
Sample #4 0.94 0.03 0.02 0.00 5.47 0.01 5.49 0.01
Sample #5 0.49 0.06 0.06 0.00 23.88 0.08 23.94 0.07
89
Sample #1 1.49 0.03 0.11 0.01 19.16 0.02 19.27 0.02
Sample #2 0.57 0.00 0.14 0.00 43.40 0.08 36.35 0.19
Sample #3 0.94 0.02 0.05 0.00 0.03 0.04 0.08 0.04
Sample #4 2.21 0.02 0.07 0.00 4.96 0.05 5.03 0.05
Sample #5 1.32 0.03 0.11 0.00 23.41 0.02 23.52 0.07
2018年6月19日 2/5 ページ
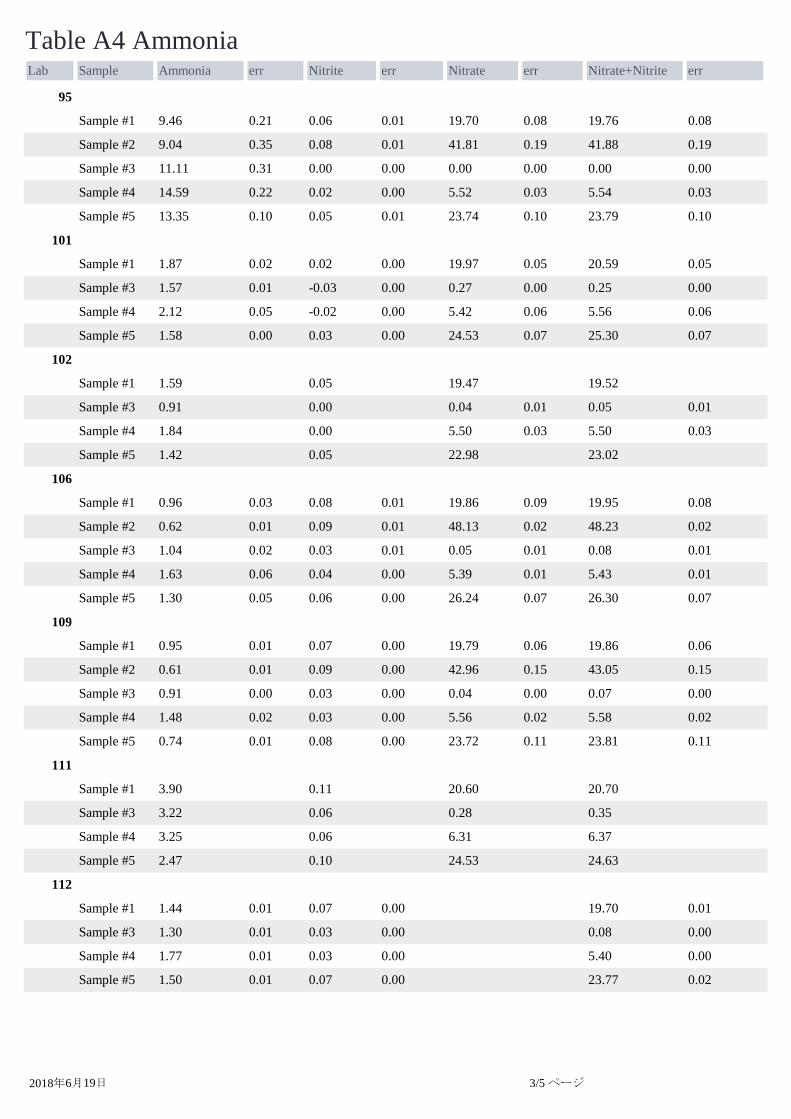
Lab Sample Ammonia err Nitrite err Nitrate err Nitrate+Nitrite err
Table A4 Ammonia
95
Sample #1 9.46 0.21 0.06 0.01 19.70 0.08 19.76 0.08
Sample #2 9.04 0.35 0.08 0.01 41.81 0.19 41.88 0.19
Sample #3 11.11 0.31 0.00 0.00 0.00 0.00 0.00 0.00
Sample #4 14.59 0.22 0.02 0.00 5.52 0.03 5.54 0.03
Sample #5 13.35 0.10 0.05 0.01 23.74 0.10 23.79 0.10
101
Sample #1 1.87 0.02 0.02 0.00 19.97 0.05 20.59 0.05
Sample #3 1.57 0.01 -0.03 0.00 0.27 0.00 0.25 0.00
Sample #4 2.12 0.05 -0.02 0.00 5.42 0.06 5.56 0.06
Sample #5 1.58 0.00 0.03 0.00 24.53 0.07 25.30 0.07
102
Sample #1 1.59 0.05 19.47 19.52
Sample #3 0.91 0.00 0.04 0.01 0.05 0.01
Sample #4 1.84 0.00 5.50 0.03 5.50 0.03
Sample #5 1.42 0.05 22.98 23.02
106
Sample #1 0.96 0.03 0.08 0.01 19.86 0.09 19.95 0.08
Sample #2 0.62 0.01 0.09 0.01 48.13 0.02 48.23 0.02
Sample #3 1.04 0.02 0.03 0.01 0.05 0.01 0.08 0.01
Sample #4 1.63 0.06 0.04 0.00 5.39 0.01 5.43 0.01
Sample #5 1.30 0.05 0.06 0.00 26.24 0.07 26.30 0.07
109
Sample #1 0.95 0.01 0.07 0.00 19.79 0.06 19.86 0.06
Sample #2 0.61 0.01 0.09 0.00 42.96 0.15 43.05 0.15
Sample #3 0.91 0.00 0.03 0.00 0.04 0.00 0.07 0.00
Sample #4 1.48 0.02 0.03 0.00 5.56 0.02 5.58 0.02
Sample #5 0.74 0.01 0.08 0.00 23.72 0.11 23.81 0.11
111
Sample #1 3.90 0.11 20.60 20.70
Sample #3 3.22 0.06 0.28 0.35
Sample #4 3.25 0.06 6.31 6.37
Sample #5 2.47 0.10 24.53 24.63
112
Sample #1 1.44 0.01 0.07 0.00 19.70 0.01
Sample #3 1.30 0.01 0.03 0.00 0.08 0.00
Sample #4 1.77 0.01 0.03 0.00 5.40 0.00
Sample #5 1.50 0.01 0.07 0.00 23.77 0.02
2018年6月19日 3/5 ページ
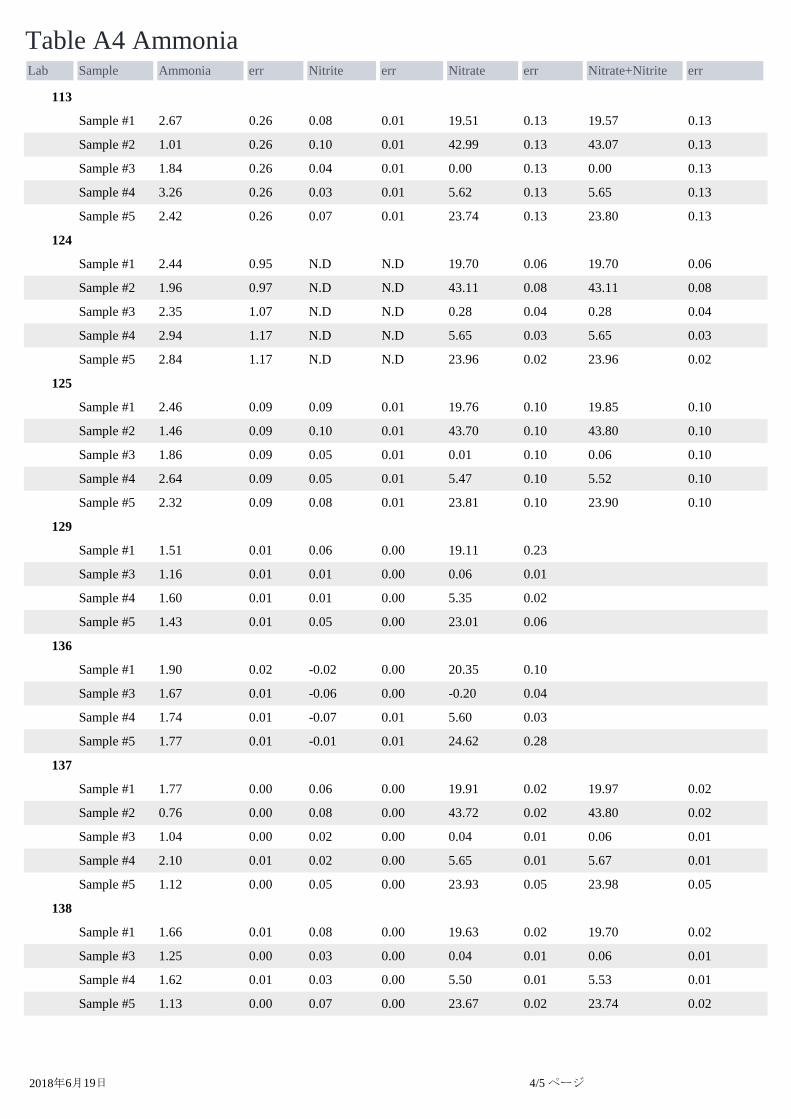
Lab Sample Ammonia err Nitrite err Nitrate err Nitrate+Nitrite err
Table A4 Ammonia
113
Sample #1 2.67 0.26 0.08 0.01 19.51 0.13 19.57 0.13
Sample #2 1.01 0.26 0.10 0.01 42.99 0.13 43.07 0.13
Sample #3 1.84 0.26 0.04 0.01 0.00 0.13 0.00 0.13
Sample #4 3.26 0.26 0.03 0.01 5.62 0.13 5.65 0.13
Sample #5 2.42 0.26 0.07 0.01 23.74 0.13 23.80 0.13
124
Sample #1 2.44 0.95 N.D N.D 19.70 0.06 19.70 0.06
Sample #2 1.96 0.97 N.D N.D 43.11 0.08 43.11 0.08
Sample #3 2.35 1.07 N.D N.D 0.28 0.04 0.28 0.04
Sample #4 2.94 1.17 N.D N.D 5.65 0.03 5.65 0.03
Sample #5 2.84 1.17 N.D N.D 23.96 0.02 23.96 0.02
125
Sample #1 2.46 0.09 0.09 0.01 19.76 0.10 19.85 0.10
Sample #2 1.46 0.09 0.10 0.01 43.70 0.10 43.80 0.10
Sample #3 1.86 0.09 0.05 0.01 0.01 0.10 0.06 0.10
Sample #4 2.64 0.09 0.05 0.01 5.47 0.10 5.52 0.10
Sample #5 2.32 0.09 0.08 0.01 23.81 0.10 23.90 0.10
129
Sample #1 1.51 0.01 0.06 0.00 19.11 0.23
Sample #3 1.16 0.01 0.01 0.00 0.06 0.01
Sample #4 1.60 0.01 0.01 0.00 5.35 0.02
Sample #5 1.43 0.01 0.05 0.00 23.01 0.06
136
Sample #1 1.90 0.02 -0.02 0.00 20.35 0.10
Sample #3 1.67 0.01 -0.06 0.00 -0.20 0.04
Sample #4 1.74 0.01 -0.07 0.01 5.60 0.03
Sample #5 1.77 0.01 -0.01 0.01 24.62 0.28
137
Sample #1 1.77 0.00 0.06 0.00 19.91 0.02 19.97 0.02
Sample #2 0.76 0.00 0.08 0.00 43.72 0.02 43.80 0.02
Sample #3 1.04 0.00 0.02 0.00 0.04 0.01 0.06 0.01
Sample #4 2.10 0.01 0.02 0.00 5.65 0.01 5.67 0.01
Sample #5 1.12 0.00 0.05 0.00 23.93 0.05 23.98 0.05
138
Sample #1 1.66 0.01 0.08 0.00 19.63 0.02 19.70 0.02
Sample #3 1.25 0.00 0.03 0.00 0.04 0.01 0.06 0.01
Sample #4 1.62 0.01 0.03 0.00 5.50 0.01 5.53 0.01
Sample #5 1.13 0.00 0.07 0.00 23.67 0.02 23.74 0.02
2018年6月19日 4/5 ページ
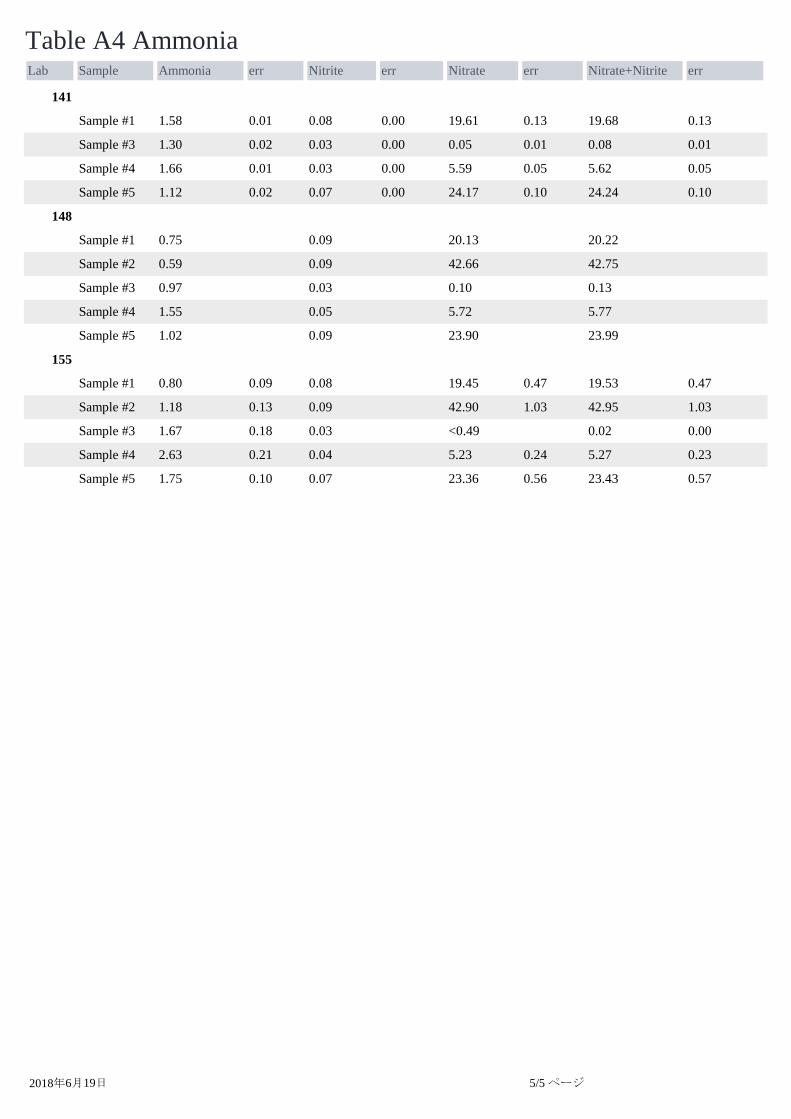
Lab Sample Ammonia err Nitrite err Nitrate err Nitrate+Nitrite err
Table A4 Ammonia
141
Sample #1 1.58 0.01 0.08 0.00 19.61 0.13 19.68 0.13
Sample #3 1.30 0.02 0.03 0.00 0.05 0.01 0.08 0.01
Sample #4 1.66 0.01 0.03 0.00 5.59 0.05 5.62 0.05
Sample #5 1.12 0.02 0.07 0.00 24.17 0.10 24.24 0.10
148
Sample #1 0.75 0.09 20.13 20.22
Sample #2 0.59 0.09 42.66 42.75
Sample #3 0.97 0.03 0.10 0.13
Sample #4 1.55 0.05 5.72 5.77
Sample #5 1.02 0.09 23.90 23.99
155
Sample #1 0.80 0.09 0.08 19.45 0.47 19.53 0.47
Sample #2 1.18 0.13 0.09 42.90 1.03 42.95 1.03
Sample #3 1.67 0.18 0.03 <0.49 0.02 0.00
Sample #4 2.63 0.21 0.04 5.23 0.24 5.27 0.23
Sample #5 1.75 0.10 0.07 23.36 0.56 23.43 0.57
2018年6月19日 5/5 ページ

IOCCP-JAMSTEC 2018 Inter calibration exercise
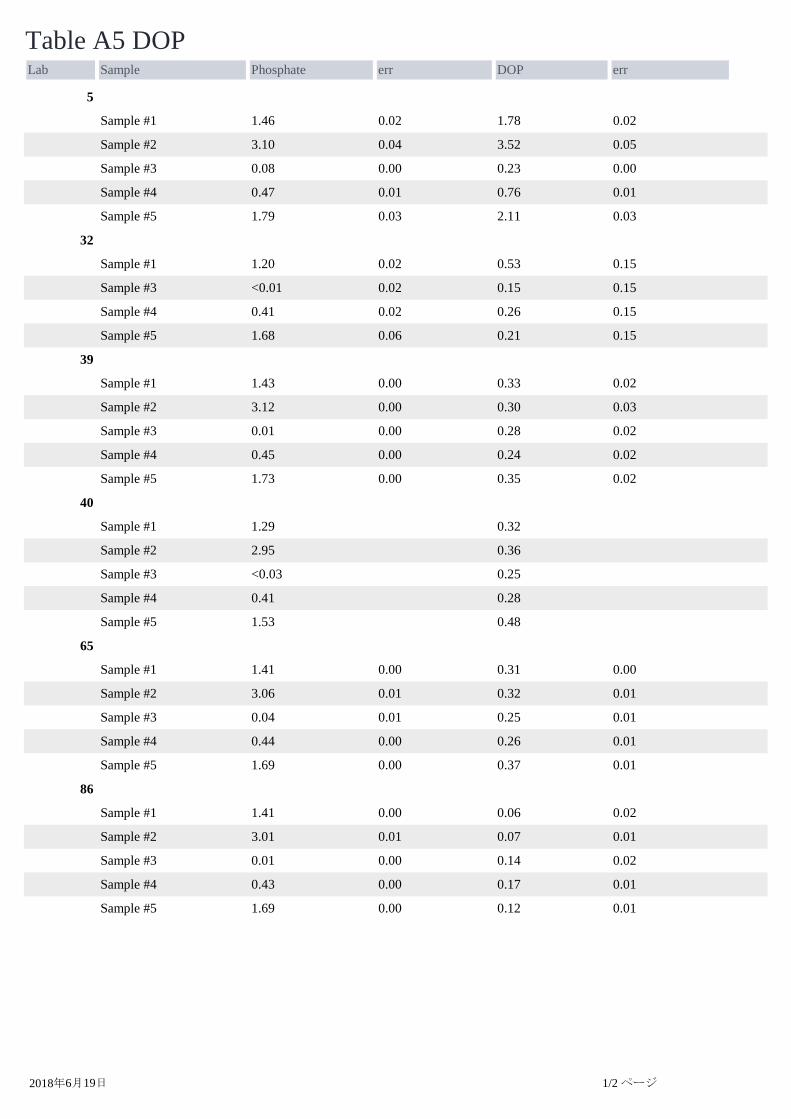
Lab Sample Phosphate err DOP err
Table A5 DOP
5
Sample #1 1.46 0.02 1.78 0.02
Sample #2 3.10 0.04 3.52 0.05
Sample #3 0.08 0.00 0.23 0.00
Sample #4 0.47 0.01 0.76 0.01
Sample #5 1.79 0.03 2.11 0.03
32
Sample #1 1.20 0.02 0.53 0.15
Sample #3 <0.01 0.02 0.15 0.15
Sample #4 0.41 0.02 0.26 0.15
Sample #5 1.68 0.06 0.21 0.15
39
Sample #1 1.43 0.00 0.33 0.02
Sample #2 3.12 0.00 0.30 0.03
Sample #3 0.01 0.00 0.28 0.02
Sample #4 0.45 0.00 0.24 0.02
Sample #5 1.73 0.00 0.35 0.02
40
Sample #1 1.29 0.32
Sample #2 2.95 0.36
Sample #3 <0.03 0.25
Sample #4 0.41 0.28
Sample #5 1.53 0.48
65
Sample #1 1.41 0.00 0.31 0.00
Sample #2 3.06 0.01 0.32 0.01
Sample #3 0.04 0.01 0.25 0.01
Sample #4 0.44 0.00 0.26 0.01
Sample #5 1.69 0.00 0.37 0.01
86
Sample #1 1.41 0.00 0.06 0.02
Sample #2 3.01 0.01 0.07 0.01
Sample #3 0.01 0.00 0.14 0.02
Sample #4 0.43 0.00 0.17 0.01
Sample #5 1.69 0.00 0.12 0.01
2018年6月19日 1/2 ページ
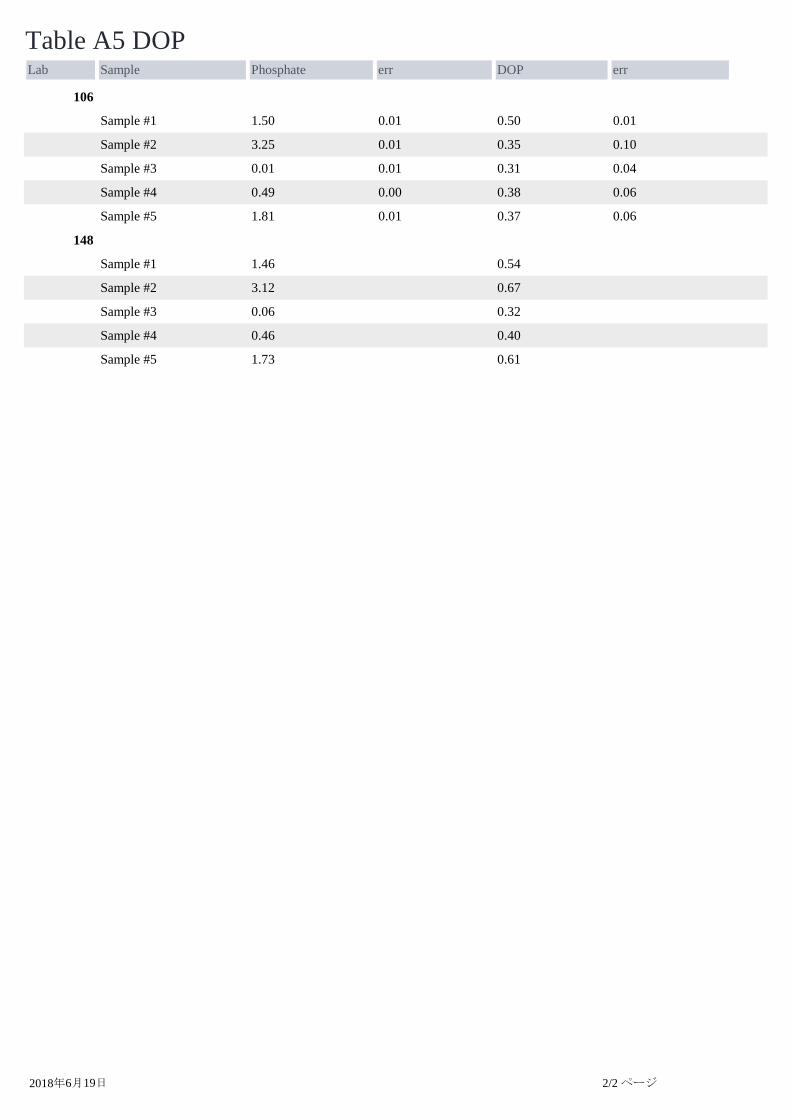
Lab Sample Phosphate err DOP err
Table A5 DOP
106
Sample #1 1.50 0.01 0.50 0.01
Sample #2 3.25 0.01 0.35 0.10
Sample #3 0.01 0.01 0.31 0.04
Sample #4 0.49 0.00 0.38 0.06
Sample #5 1.81 0.01 0.37 0.06
148
Sample #1 1.46 0.54
Sample #2 3.12 0.67
Sample #3 0.06 0.32
Sample #4 0.46 0.40
Sample #5 1.73 0.61
2018年6月19日 2/2 ページ
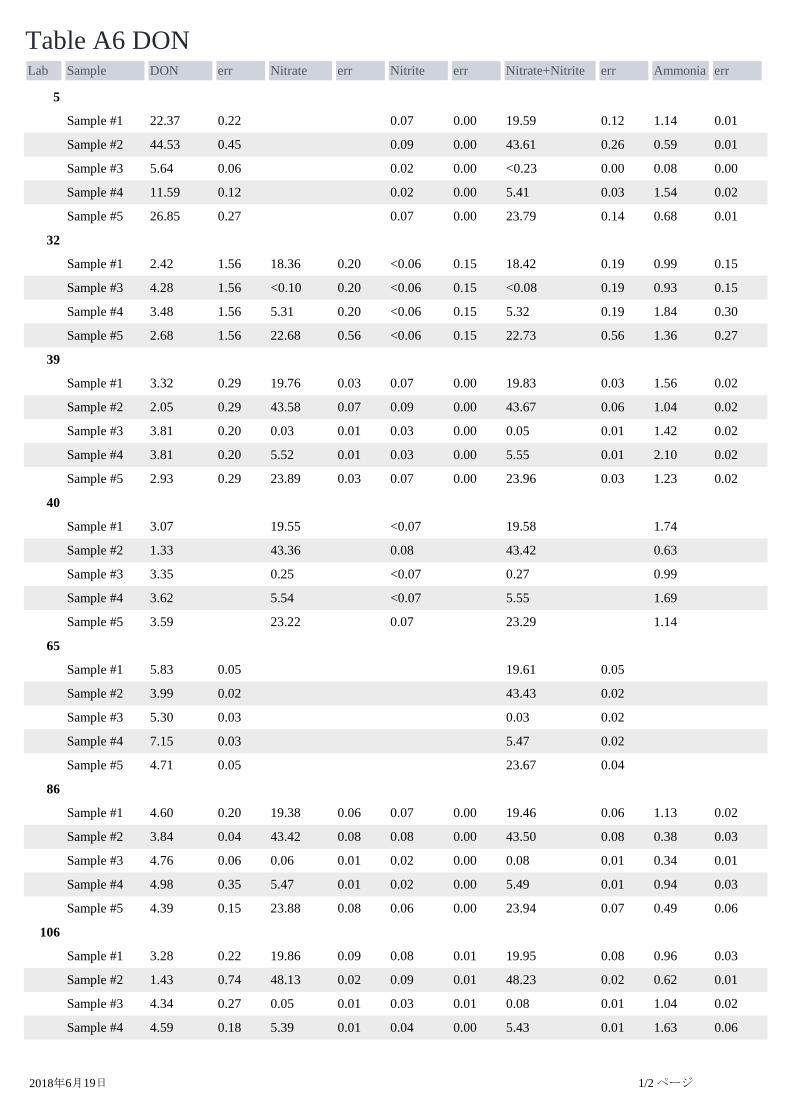
Lab Sample DON err Nitrate err Nitrite err Nitrate+Nitrite err Ammonia err
Table A6 DON
5
Sample #1 22.37 0.22 0.07 0.00 19.59 0.12 1.14 0.01
Sample #2 44.53 0.45 0.09 0.00 43.61 0.26 0.59 0.01
Sample #3 5.64 0.06 0.02 0.00 <0.23 0.00 0.08 0.00
Sample #4 11.59 0.12 0.02 0.00 5.41 0.03 1.54 0.02
Sample #5 26.85 0.27 0.07 0.00 23.79 0.14 0.68 0.01
32
Sample #1 2.42 1.56 18.36 0.20 <0.06 0.15 18.42 0.19 0.99 0.15
Sample #3 4.28 1.56 <0.10 0.20 <0.06 0.15 <0.08 0.19 0.93 0.15
Sample #4 3.48 1.56 5.31 0.20 <0.06 0.15 5.32 0.19 1.84 0.30
Sample #5 2.68 1.56 22.68 0.56 <0.06 0.15 22.73 0.56 1.36 0.27
39
Sample #1 3.32 0.29 19.76 0.03 0.07 0.00 19.83 0.03 1.56 0.02
Sample #2 2.05 0.29 43.58 0.07 0.09 0.00 43.67 0.06 1.04 0.02
Sample #3 3.81 0.20 0.03 0.01 0.03 0.00 0.05 0.01 1.42 0.02
Sample #4 3.81 0.20 5.52 0.01 0.03 0.00 5.55 0.01 2.10 0.02
Sample #5 2.93 0.29 23.89 0.03 0.07 0.00 23.96 0.03 1.23 0.02
40
Sample #1 3.07 19.55 <0.07 19.58 1.74
Sample #2 1.33 43.36 0.08 43.42 0.63
Sample #3 3.35 0.25 <0.07 0.27 0.99
Sample #4 3.62 5.54 <0.07 5.55 1.69
Sample #5 3.59 23.22 0.07 23.29 1.14
65
Sample #1 5.83 0.05 19.61 0.05
Sample #2 3.99 0.02 43.43 0.02
Sample #3 5.30 0.03 0.03 0.02
Sample #4 7.15 0.03 5.47 0.02
Sample #5 4.71 0.05 23.67 0.04
86
Sample #1 4.60 0.20 19.38 0.06 0.07 0.00 19.46 0.06 1.13 0.02
Sample #2 3.84 0.04 43.42 0.08 0.08 0.00 43.50 0.08 0.38 0.03
Sample #3 4.76 0.06 0.06 0.01 0.02 0.00 0.08 0.01 0.34 0.01
Sample #4 4.98 0.35 5.47 0.01 0.02 0.00 5.49 0.01 0.94 0.03
Sample #5 4.39 0.15 23.88 0.08 0.06 0.00 23.94 0.07 0.49 0.06
106
Sample #1 3.28 0.22 19.86 0.09 0.08 0.01 19.95 0.08 0.96 0.03
Sample #2 1.43 0.74 48.13 0.02 0.09 0.01 48.23 0.02 0.62 0.01
Sample #3 4.34 0.27 0.05 0.01 0.03 0.01 0.08 0.01 1.04 0.02
Sample #4 4.59 0.18 5.39 0.01 0.04 0.00 5.43 0.01 1.63 0.06
2018年6月19日 1/2 ページ
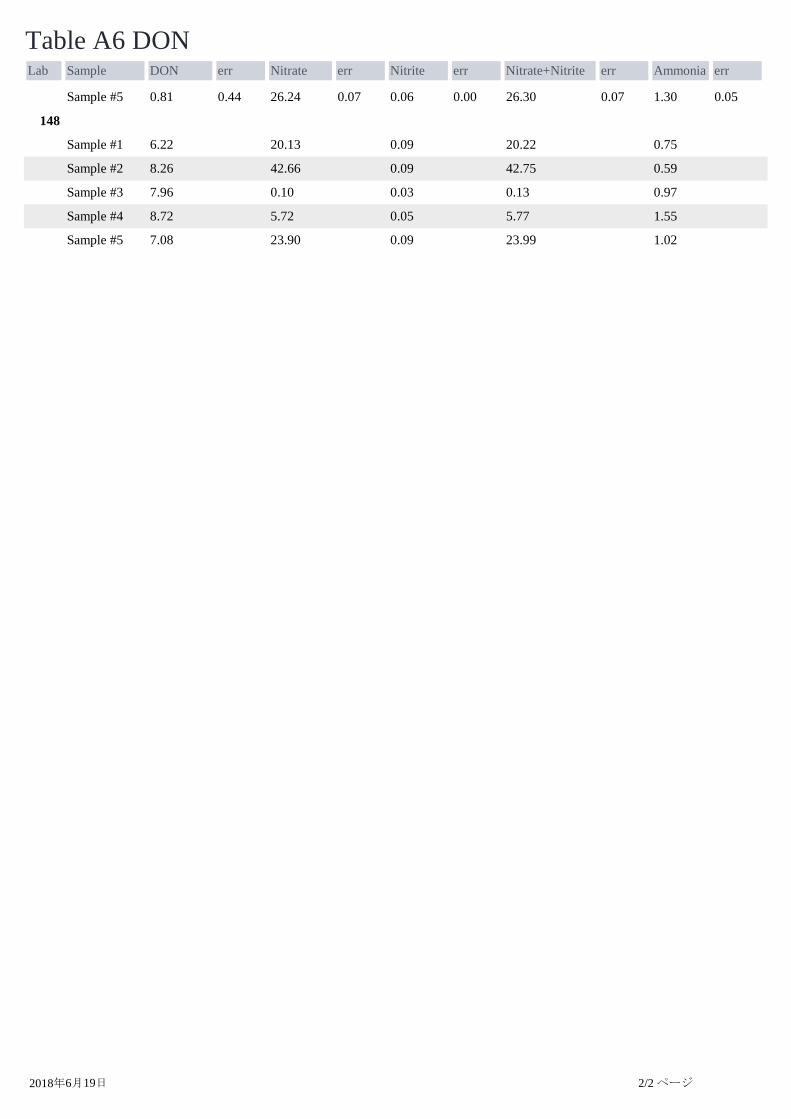
Lab Sample DON err Nitrate err Nitrite err Nitrate+Nitrite err Ammonia err
Table A6 DON
Sample #5 0.81 0.44 26.24 0.07 0.06 0.00 26.30 0.07 1.30 0.05
148
Sample #1 6.22 20.13 0.09 20.22 0.75
Sample #2 8.26 42.66 0.09 42.75 0.59
Sample #3 7.96 0.10 0.03 0.13 0.97
Sample #4 8.72 5.72 0.05 5.77 1.55
Sample #5 7.08 23.90 0.09 23.99 1.02
2018年6月19日 2/2 ページ
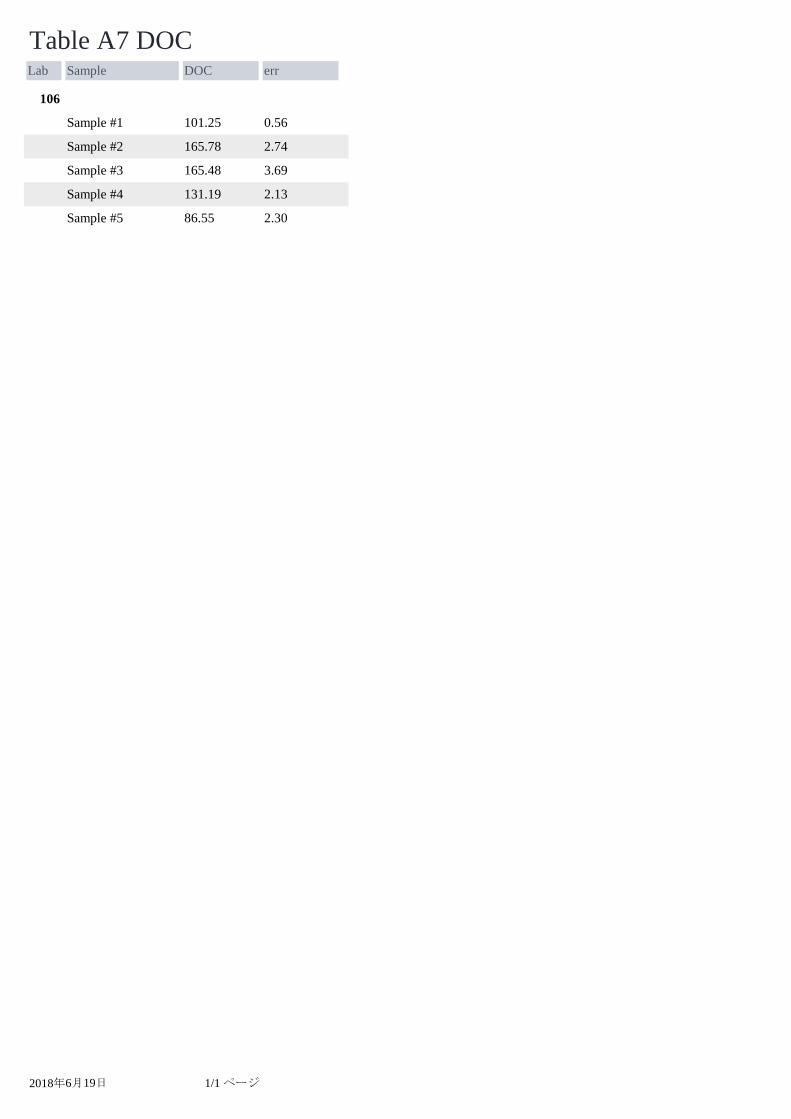
Lab Sample DOC err
Table A7 DOC
106
Sample #1 101.25 0.56
Sample #2 165.78 2.74
Sample #3 165.48 3.69
Sample #4 131.19 2.13
Sample #5 86.55 2.30
2018年6月19日 1/1 ページ

IOCCP-JAMSTEC 2018 Inter calibration exercise
IOCCP-JAMSTEC 2018 Inter calibration exercise
Appendix III
Table A8-1 Cross reference table of ranked order and Lab # for Figure 1
Table A8-2 Cross reference table of ranked order and Lab # for Figure 2
Table A8-3 Cross reference table of ranked order and Lab # for Figure 3
Table A8-4 Cross reference table of ranked order and Lab # for Figure 4
Table A8-5 Cross reference table of ranked order and Lab # for Figure 5
1

IOCCP-JAMSTEC 2018 Inter calibration exercise
2
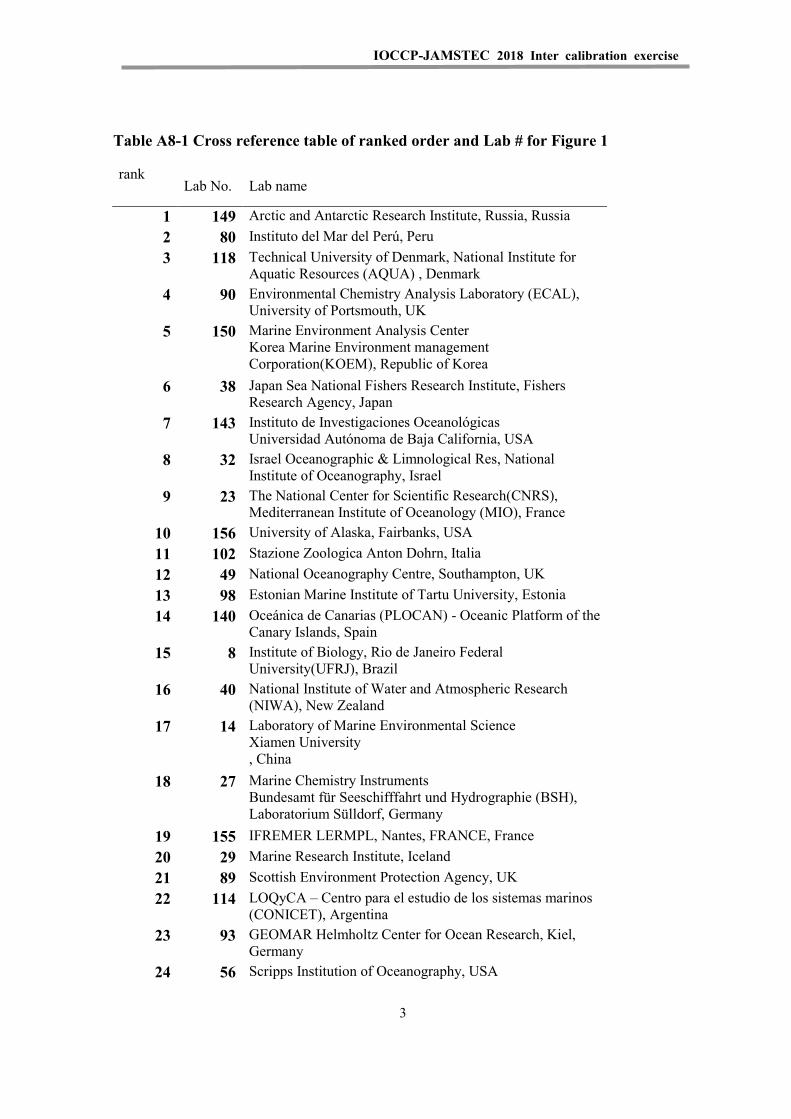
IOCCP-JAMSTEC 2018 Inter calibration exercise
Table A8-1 Cross reference table of ranked order and Lab # for Figure 1
rank Lab No. Lab name
1 149 Arctic and Antarctic Research Institute, Russia, Russia 2 80 Instituto del Mar del Perú, Peru 3 118 Technical University of Denmark, National Institute for
Aquatic Resources (AQUA) , Denmark 4 90 Environmental Chemistry Analysis Laboratory (ECAL),
University of Portsmouth, UK 5 150 Marine Environment Analysis Center
Korea Marine Environment management Corporation(KOEM), Republic of Korea
6 38 Japan Sea National Fishers Research Institute, Fishers Research Agency, Japan
7 143 Instituto de Investigaciones Oceanológicas Universidad Autónoma de Baja California, USA
8 32 Israel Oceanographic & Limnological Res, National Institute of Oceanography, Israel
9 23 The National Center for Scientific Research(CNRS), Mediterranean Institute of Oceanology (MIO), France
10 156 University of Alaska, Fairbanks, USA 11 102 Stazione Zoologica Anton Dohrn, Italia 12 49 National Oceanography Centre, Southampton, UK 13 98 Estonian Marine Institute of Tartu University, Estonia 14 140 Oceánica de Canarias (PLOCAN) - Oceanic Platform of the
Canary Islands, Spain 15 8 Institute of Biology, Rio de Janeiro Federal
University(UFRJ), Brazil 16 40 National Institute of Water and Atmospheric Research
(NIWA), New Zealand 17 14 Laboratory of Marine Environmental Science
Xiamen University , China
18 27 Marine Chemistry Instruments Bundesamt für Seeschifffahrt und Hydrographie (BSH), Laboratorium Sülldorf, Germany
19 155 IFREMER LERMPL, Nantes, FRANCE, France 20 29 Marine Research Institute, Iceland 21 89 Scottish Environment Protection Agency, UK 22 114 LOQyCA – Centro para el estudio de los sistemas marinos
(CONICET), Argentina 23 93 GEOMAR Helmholtz Center for Ocean Research, Kiel,
Germany 24 56 Scripps Institution of Oceanography, USA
3
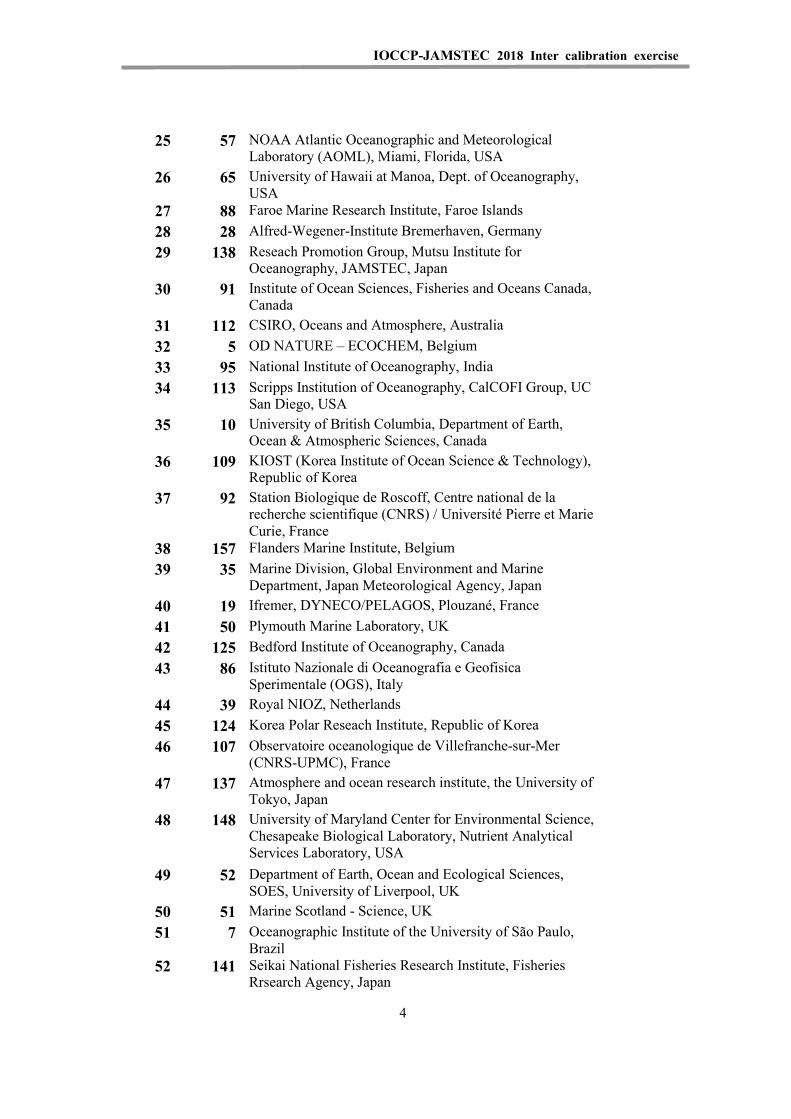
IOCCP-JAMSTEC 2018 Inter calibration exercise
25 57 NOAA Atlantic Oceanographic and Meteorological Laboratory (AOML), Miami, Florida, USA
26 65 University of Hawaii at Manoa, Dept. of Oceanography, USA
27 88 Faroe Marine Research Institute, Faroe Islands 28 28 Alfred-Wegener-Institute Bremerhaven, Germany 29 138 Reseach Promotion Group, Mutsu Institute for
Oceanography, JAMSTEC, Japan 30 91 Institute of Ocean Sciences, Fisheries and Oceans Canada,
Canada 31 112 CSIRO, Oceans and Atmosphere, Australia 32 5 OD NATURE – ECOCHEM, Belgium 33 95 National Institute of Oceanography, India 34 113 Scripps Institution of Oceanography, CalCOFI Group, UC
San Diego, USA 35 10 University of British Columbia, Department of Earth,
Ocean & Atmospheric Sciences, Canada 36 109 KIOST (Korea Institute of Ocean Science & Technology),
Republic of Korea 37 92 Station Biologique de Roscoff, Centre national de la
recherche scientifique (CNRS) / Université Pierre et Marie Curie, France
38 157 Flanders Marine Institute, Belgium 39 35 Marine Division, Global Environment and Marine
Department, Japan Meteorological Agency, Japan 40 19 Ifremer, DYNECO/PELAGOS, Plouzané, France 41 50 Plymouth Marine Laboratory, UK 42 125 Bedford Institute of Oceanography, Canada 43 86 Istituto Nazionale di Oceanografia e Geofisica
Sperimentale (OGS), Italy 44 39 Royal NIOZ, Netherlands 45 124 Korea Polar Reseach Institute, Republic of Korea 46 107 Observatoire oceanologique de Villefranche-sur-Mer
(CNRS-UPMC), France 47 137 Atmosphere and ocean research institute, the University of
Tokyo, Japan 48 148 University of Maryland Center for Environmental Science,
Chesapeake Biological Laboratory, Nutrient Analytical Services Laboratory, USA
49 52 Department of Earth, Ocean and Ecological Sciences, SOES, University of Liverpool, UK
50 51 Marine Scotland - Science, UK 51 7 Oceanographic Institute of the University of São Paulo,
Brazil 52 141 Seikai National Fisheries Research Institute, Fisheries
Rrsearch Agency, Japan
4
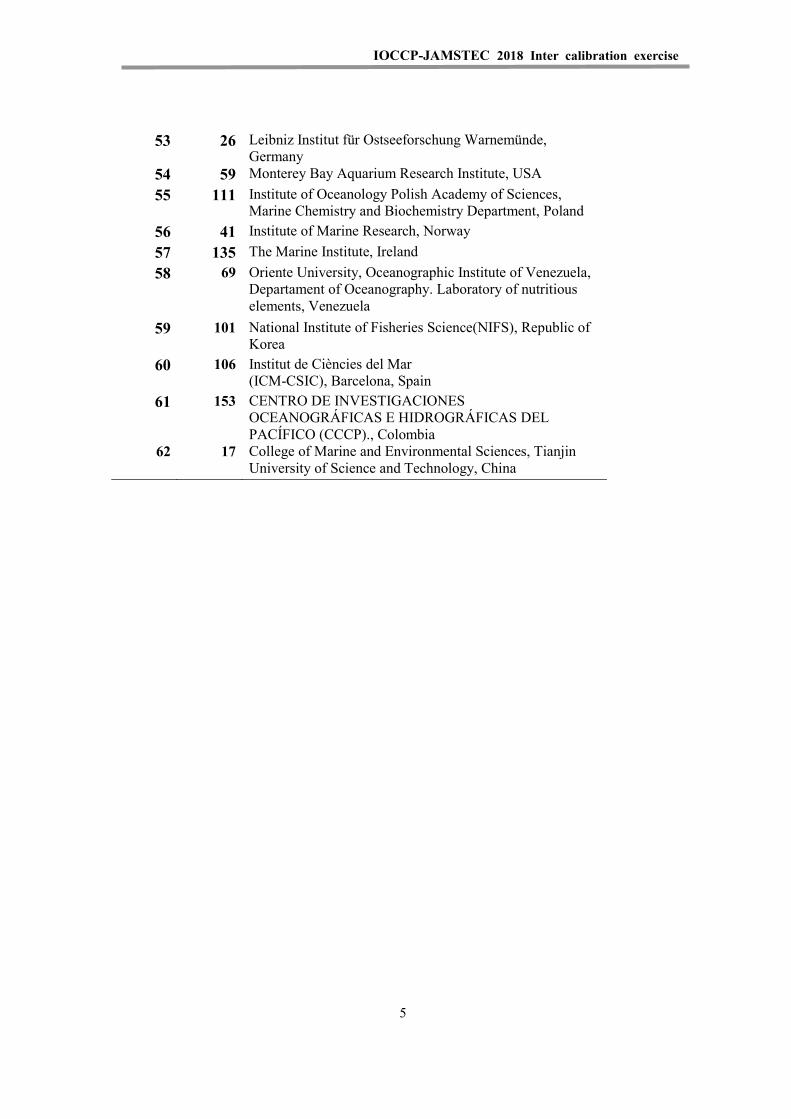
IOCCP-JAMSTEC 2018 Inter calibration exercise
53 26 Leibniz Institut für Ostseeforschung Warnemünde, Germany
54 59 Monterey Bay Aquarium Research Institute, USA 55 111 Institute of Oceanology Polish Academy of Sciences,
Marine Chemistry and Biochemistry Department, Poland 56 41 Institute of Marine Research, Norway 57 135 The Marine Institute, Ireland 58 69 Oriente University, Oceanographic Institute of Venezuela,
Departament of Oceanography. Laboratory of nutritious elements, Venezuela
59 101 National Institute of Fisheries Science(NIFS), Republic of Korea
60 106 Institut de Ciències del Mar (ICM-CSIC), Barcelona, Spain
61 153 CENTRO DE INVESTIGACIONES OCEANOGRÁFICAS E HIDROGRÁFICAS DEL PACÍFICO (CCCP)., Colombia
62 17 College of Marine and Environmental Sciences, Tianjin University of Science and Technology, China
5

IOCCP-JAMSTEC 2018 Inter calibration exercise
6
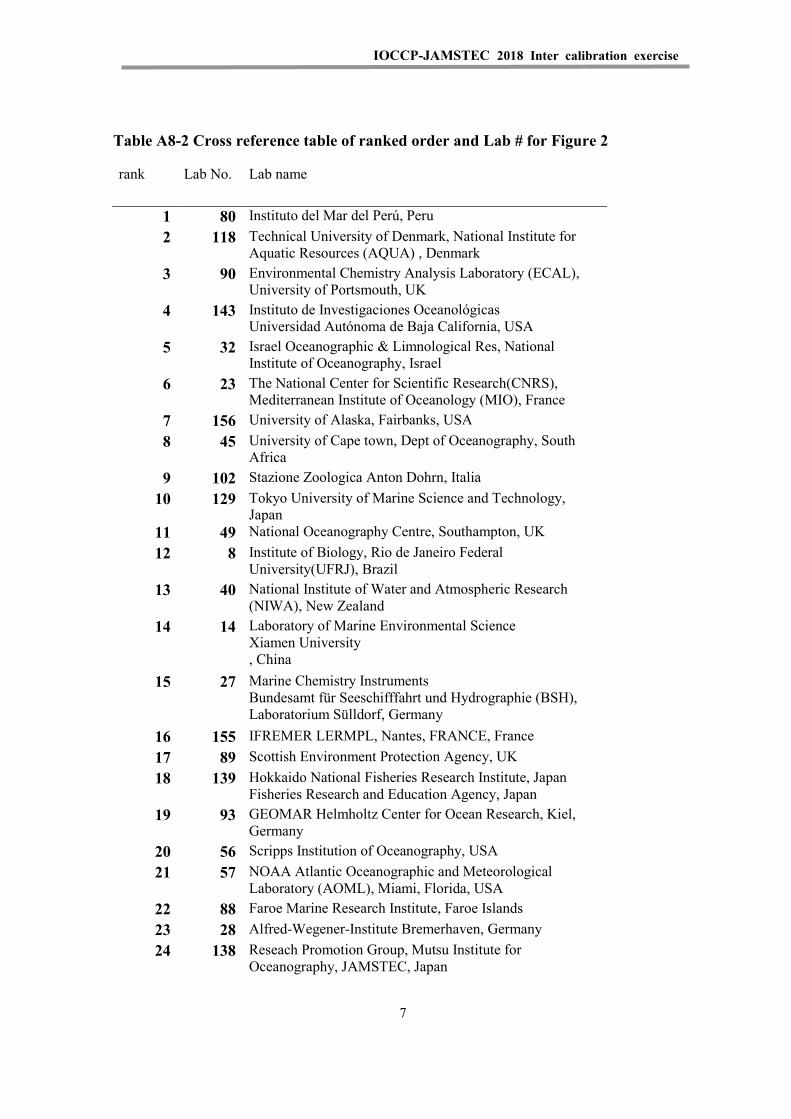
IOCCP-JAMSTEC 2018 Inter calibration exercise
Table A8-2 Cross reference table of ranked order and Lab # for Figure 2
rank Lab No. Lab name
1 80 Instituto del Mar del Perú, Peru 2 118 Technical University of Denmark, National Institute for
Aquatic Resources (AQUA) , Denmark 3 90 Environmental Chemistry Analysis Laboratory (ECAL),
University of Portsmouth, UK 4 143 Instituto de Investigaciones Oceanológicas
Universidad Autónoma de Baja California, USA 5 32 Israel Oceanographic & Limnological Res, National
Institute of Oceanography, Israel 6 23 The National Center for Scientific Research(CNRS),
Mediterranean Institute of Oceanology (MIO), France 7 156 University of Alaska, Fairbanks, USA 8 45 University of Cape town, Dept of Oceanography, South
Africa 9 102 Stazione Zoologica Anton Dohrn, Italia
10 129 Tokyo University of Marine Science and Technology, Japan
11 49 National Oceanography Centre, Southampton, UK 12 8 Institute of Biology, Rio de Janeiro Federal
University(UFRJ), Brazil 13 40 National Institute of Water and Atmospheric Research
(NIWA), New Zealand 14 14 Laboratory of Marine Environmental Science
Xiamen University , China
15 27 Marine Chemistry Instruments Bundesamt für Seeschifffahrt und Hydrographie (BSH), Laboratorium Sülldorf, Germany
16 155 IFREMER LERMPL, Nantes, FRANCE, France 17 89 Scottish Environment Protection Agency, UK 18 139 Hokkaido National Fisheries Research Institute, Japan
Fisheries Research and Education Agency, Japan 19 93 GEOMAR Helmholtz Center for Ocean Research, Kiel,
Germany 20 56 Scripps Institution of Oceanography, USA 21 57 NOAA Atlantic Oceanographic and Meteorological
Laboratory (AOML), Miami, Florida, USA 22 88 Faroe Marine Research Institute, Faroe Islands 23 28 Alfred-Wegener-Institute Bremerhaven, Germany 24 138 Reseach Promotion Group, Mutsu Institute for
Oceanography, JAMSTEC, Japan
7
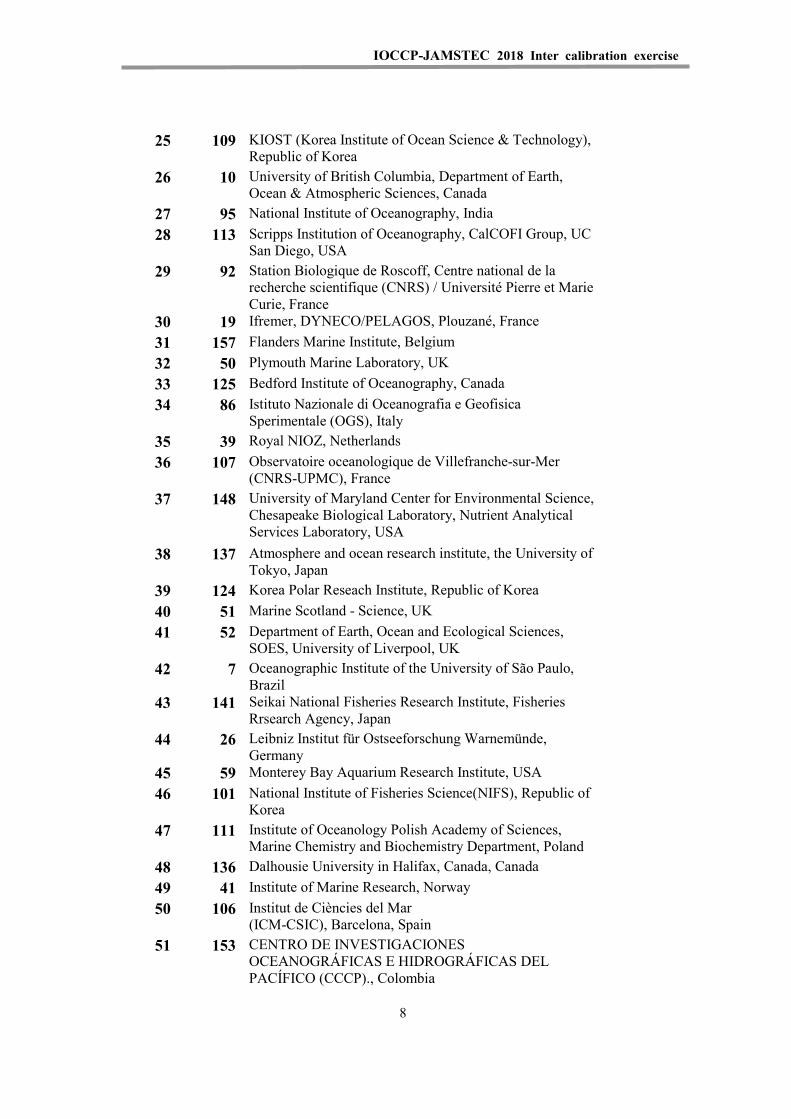
IOCCP-JAMSTEC 2018 Inter calibration exercise
25 109 KIOST (Korea Institute of Ocean Science & Technology), Republic of Korea
26 10 University of British Columbia, Department of Earth, Ocean & Atmospheric Sciences, Canada
27 95 National Institute of Oceanography, India 28 113 Scripps Institution of Oceanography, CalCOFI Group, UC
San Diego, USA 29 92 Station Biologique de Roscoff, Centre national de la
recherche scientifique (CNRS) / Université Pierre et Marie Curie, France
30 19 Ifremer, DYNECO/PELAGOS, Plouzané, France 31 157 Flanders Marine Institute, Belgium 32 50 Plymouth Marine Laboratory, UK 33 125 Bedford Institute of Oceanography, Canada 34 86 Istituto Nazionale di Oceanografia e Geofisica
Sperimentale (OGS), Italy 35 39 Royal NIOZ, Netherlands 36 107 Observatoire oceanologique de Villefranche-sur-Mer
(CNRS-UPMC), France 37 148 University of Maryland Center for Environmental Science,
Chesapeake Biological Laboratory, Nutrient Analytical Services Laboratory, USA
38 137 Atmosphere and ocean research institute, the University of Tokyo, Japan
39 124 Korea Polar Reseach Institute, Republic of Korea 40 51 Marine Scotland - Science, UK 41 52 Department of Earth, Ocean and Ecological Sciences,
SOES, University of Liverpool, UK 42 7 Oceanographic Institute of the University of São Paulo,
Brazil 43 141 Seikai National Fisheries Research Institute, Fisheries
Rrsearch Agency, Japan 44 26 Leibniz Institut für Ostseeforschung Warnemünde,
Germany 45 59 Monterey Bay Aquarium Research Institute, USA 46 101 National Institute of Fisheries Science(NIFS), Republic of
Korea 47 111 Institute of Oceanology Polish Academy of Sciences,
Marine Chemistry and Biochemistry Department, Poland 48 136 Dalhousie University in Halifax, Canada, Canada 49 41 Institute of Marine Research, Norway 50 106 Institut de Ciències del Mar
(ICM-CSIC), Barcelona, Spain 51 153 CENTRO DE INVESTIGACIONES
OCEANOGRÁFICAS E HIDROGRÁFICAS DEL PACÍFICO (CCCP)., Colombia
8
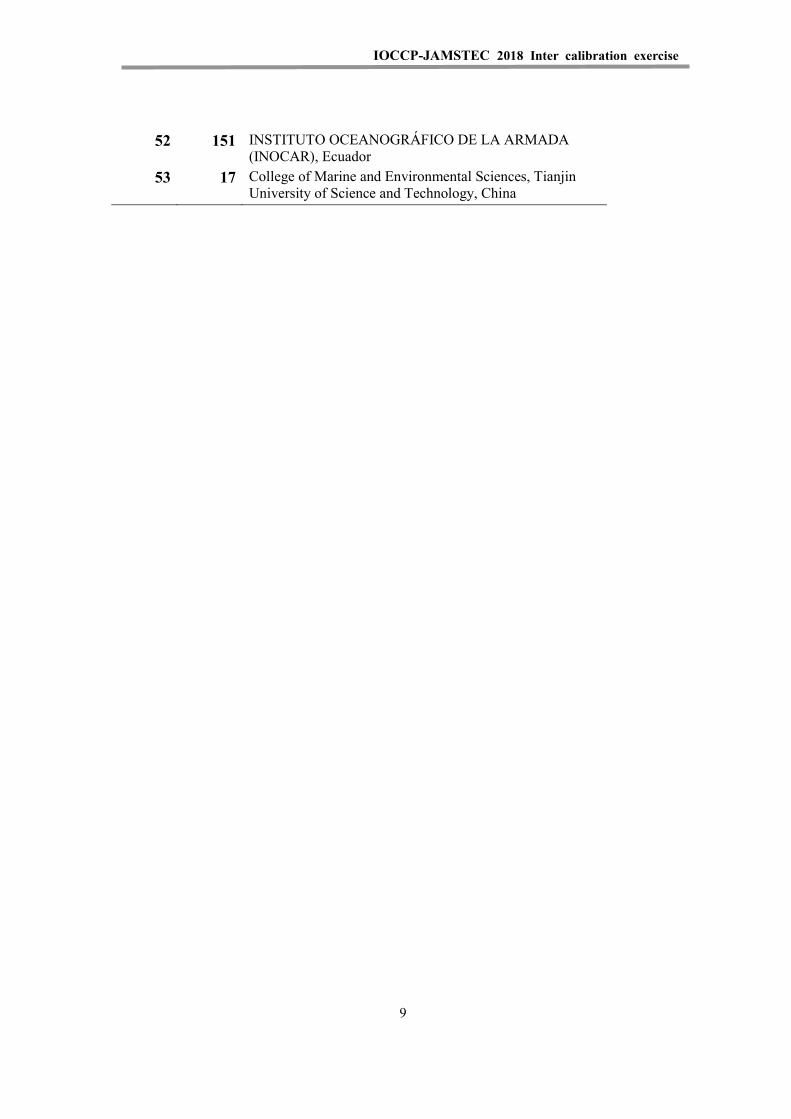
IOCCP-JAMSTEC 2018 Inter calibration exercise
52 151 INSTITUTO OCEANOGRÁFICO DE LA ARMADA (INOCAR), Ecuador
53 17 College of Marine and Environmental Sciences, Tianjin University of Science and Technology, China
9

IOCCP-JAMSTEC 2018 Inter calibration exercise
10
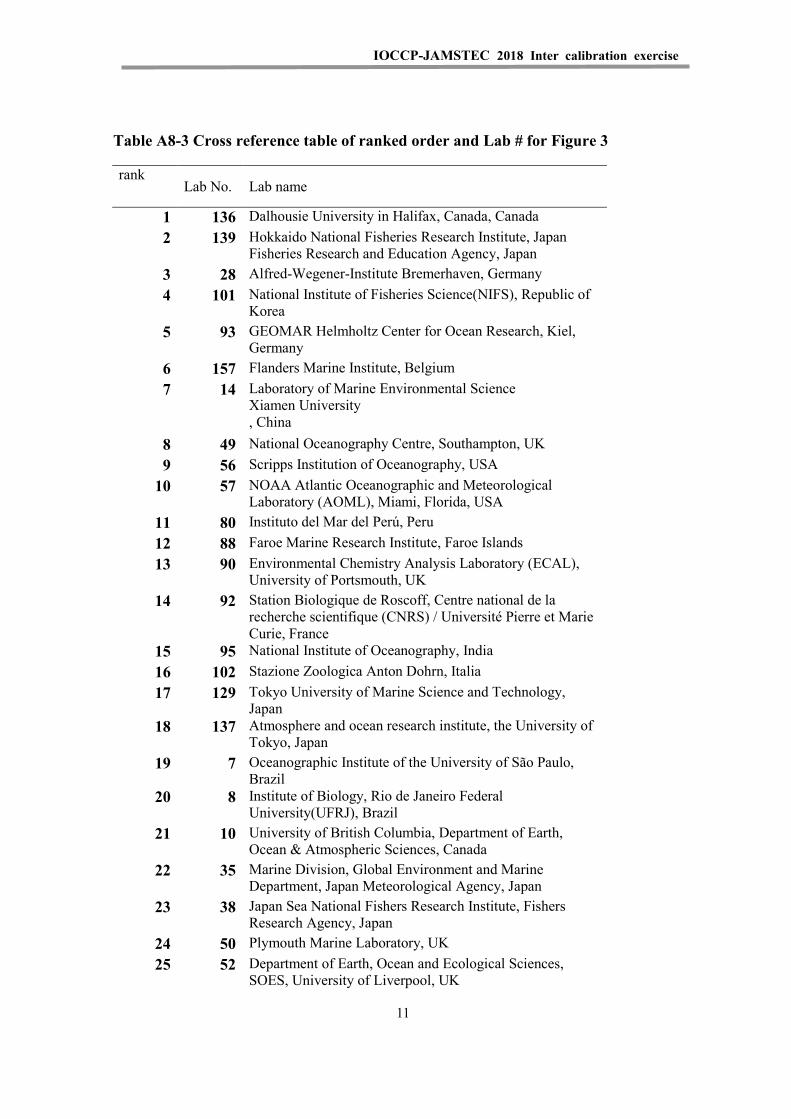
IOCCP-JAMSTEC 2018 Inter calibration exercise
Table A8-3 Cross reference table of ranked order and Lab # for Figure 3
rank Lab No. Lab name
1 136 Dalhousie University in Halifax, Canada, Canada 2 139 Hokkaido National Fisheries Research Institute, Japan
Fisheries Research and Education Agency, Japan 3 28 Alfred-Wegener-Institute Bremerhaven, Germany 4 101 National Institute of Fisheries Science(NIFS), Republic of
Korea 5 93 GEOMAR Helmholtz Center for Ocean Research, Kiel,
Germany 6 157 Flanders Marine Institute, Belgium 7 14 Laboratory of Marine Environmental Science
Xiamen University , China
8 49 National Oceanography Centre, Southampton, UK 9 56 Scripps Institution of Oceanography, USA
10 57 NOAA Atlantic Oceanographic and Meteorological Laboratory (AOML), Miami, Florida, USA
11 80 Instituto del Mar del Perú, Peru 12 88 Faroe Marine Research Institute, Faroe Islands 13 90 Environmental Chemistry Analysis Laboratory (ECAL),
University of Portsmouth, UK 14 92 Station Biologique de Roscoff, Centre national de la
recherche scientifique (CNRS) / Université Pierre et Marie Curie, France
15 95 National Institute of Oceanography, India 16 102 Stazione Zoologica Anton Dohrn, Italia 17 129 Tokyo University of Marine Science and Technology,
Japan 18 137 Atmosphere and ocean research institute, the University of
Tokyo, Japan 19 7 Oceanographic Institute of the University of São Paulo,
Brazil 20 8 Institute of Biology, Rio de Janeiro Federal
University(UFRJ), Brazil 21 10 University of British Columbia, Department of Earth,
Ocean & Atmospheric Sciences, Canada 22 35 Marine Division, Global Environment and Marine
Department, Japan Meteorological Agency, Japan 23 38 Japan Sea National Fishers Research Institute, Fishers
Research Agency, Japan 24 50 Plymouth Marine Laboratory, UK 25 52 Department of Earth, Ocean and Ecological Sciences,
SOES, University of Liverpool, UK
11
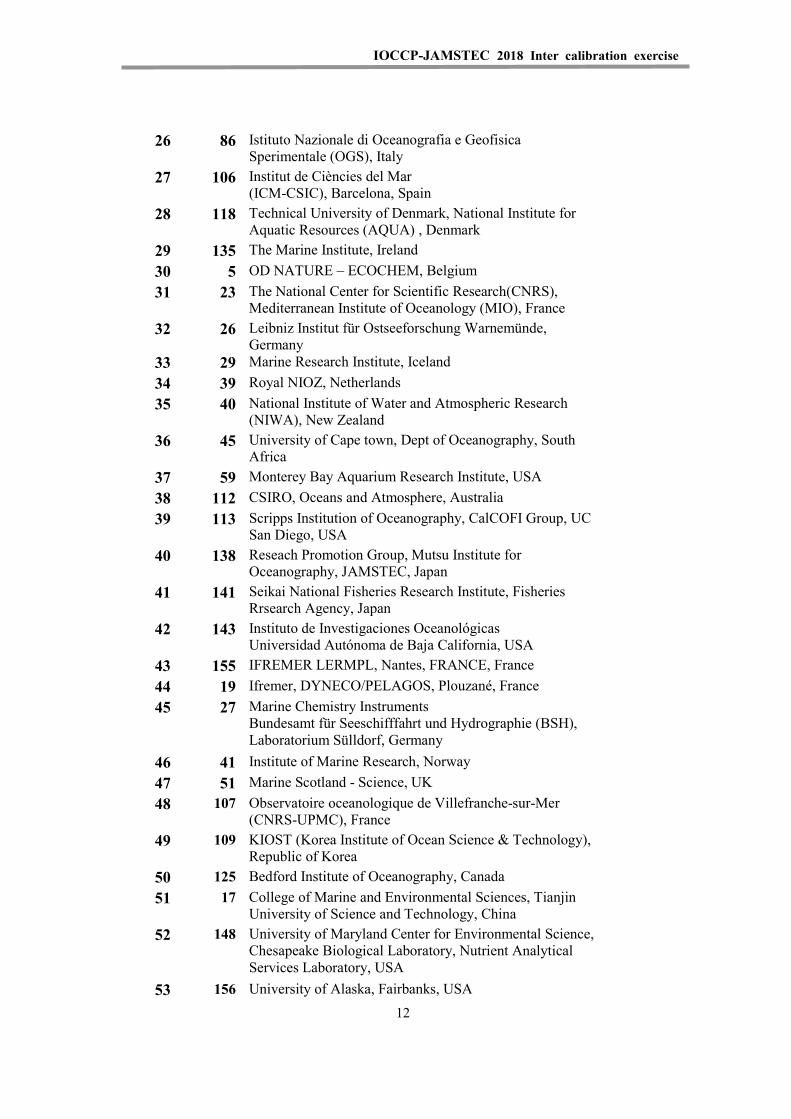
IOCCP-JAMSTEC 2018 Inter calibration exercise
26 86 Istituto Nazionale di Oceanografia e Geofisica Sperimentale (OGS), Italy
27 106 Institut de Ciències del Mar (ICM-CSIC), Barcelona, Spain
28 118 Technical University of Denmark, National Institute for Aquatic Resources (AQUA) , Denmark
29 135 The Marine Institute, Ireland 30 5 OD NATURE – ECOCHEM, Belgium 31 23 The National Center for Scientific Research(CNRS),
Mediterranean Institute of Oceanology (MIO), France 32 26 Leibniz Institut für Ostseeforschung Warnemünde,
Germany 33 29 Marine Research Institute, Iceland 34 39 Royal NIOZ, Netherlands 35 40 National Institute of Water and Atmospheric Research
(NIWA), New Zealand 36 45 University of Cape town, Dept of Oceanography, South
Africa 37 59 Monterey Bay Aquarium Research Institute, USA 38 112 CSIRO, Oceans and Atmosphere, Australia 39 113 Scripps Institution of Oceanography, CalCOFI Group, UC
San Diego, USA 40 138 Reseach Promotion Group, Mutsu Institute for
Oceanography, JAMSTEC, Japan 41 141 Seikai National Fisheries Research Institute, Fisheries
Rrsearch Agency, Japan 42 143 Instituto de Investigaciones Oceanológicas
Universidad Autónoma de Baja California, USA 43 155 IFREMER LERMPL, Nantes, FRANCE, France 44 19 Ifremer, DYNECO/PELAGOS, Plouzané, France 45 27 Marine Chemistry Instruments
Bundesamt für Seeschifffahrt und Hydrographie (BSH), Laboratorium Sülldorf, Germany
46 41 Institute of Marine Research, Norway 47 51 Marine Scotland - Science, UK 48 107 Observatoire oceanologique de Villefranche-sur-Mer
(CNRS-UPMC), France 49 109 KIOST (Korea Institute of Ocean Science & Technology),
Republic of Korea 50 125 Bedford Institute of Oceanography, Canada 51 17 College of Marine and Environmental Sciences, Tianjin
University of Science and Technology, China 52 148 University of Maryland Center for Environmental Science,
Chesapeake Biological Laboratory, Nutrient Analytical Services Laboratory, USA
53 156 University of Alaska, Fairbanks, USA 12
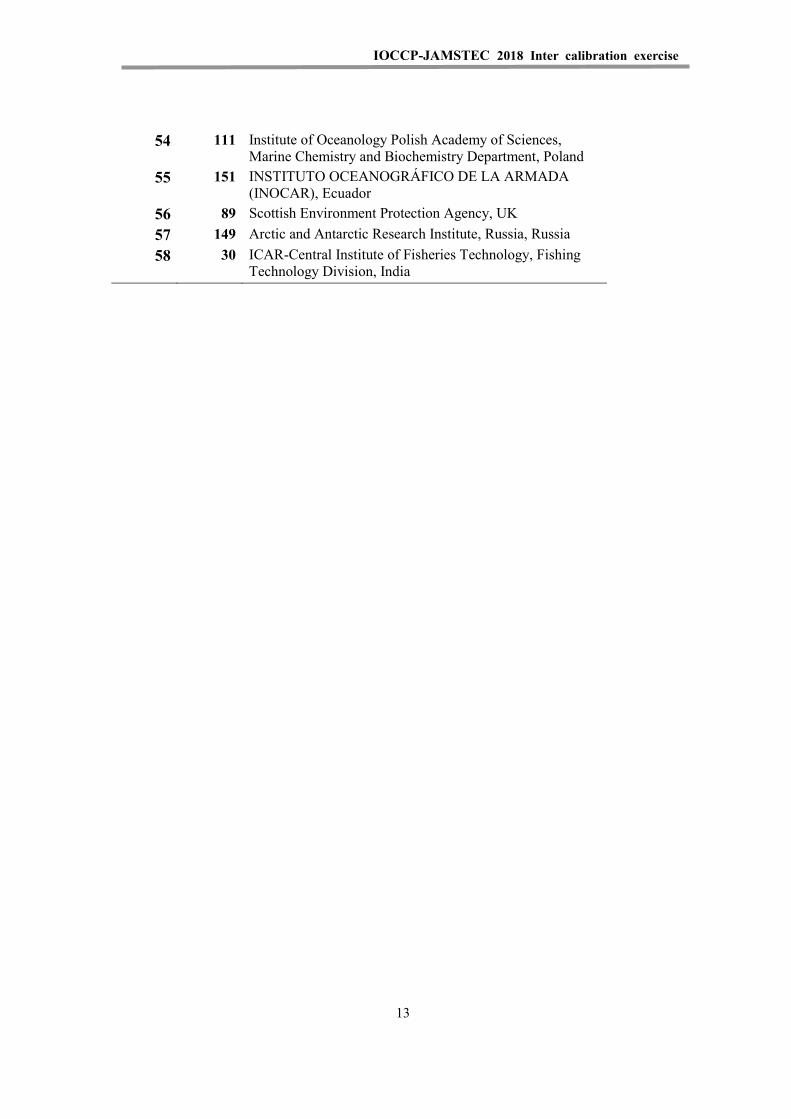
IOCCP-JAMSTEC 2018 Inter calibration exercise
54 111 Institute of Oceanology Polish Academy of Sciences, Marine Chemistry and Biochemistry Department, Poland
55 151 INSTITUTO OCEANOGRÁFICO DE LA ARMADA (INOCAR), Ecuador
56 89 Scottish Environment Protection Agency, UK 57 149 Arctic and Antarctic Research Institute, Russia, Russia 58 30 ICAR-Central Institute of Fisheries Technology, Fishing
Technology Division, India
13

IOCCP-JAMSTEC 2018 Inter calibration exercise
14
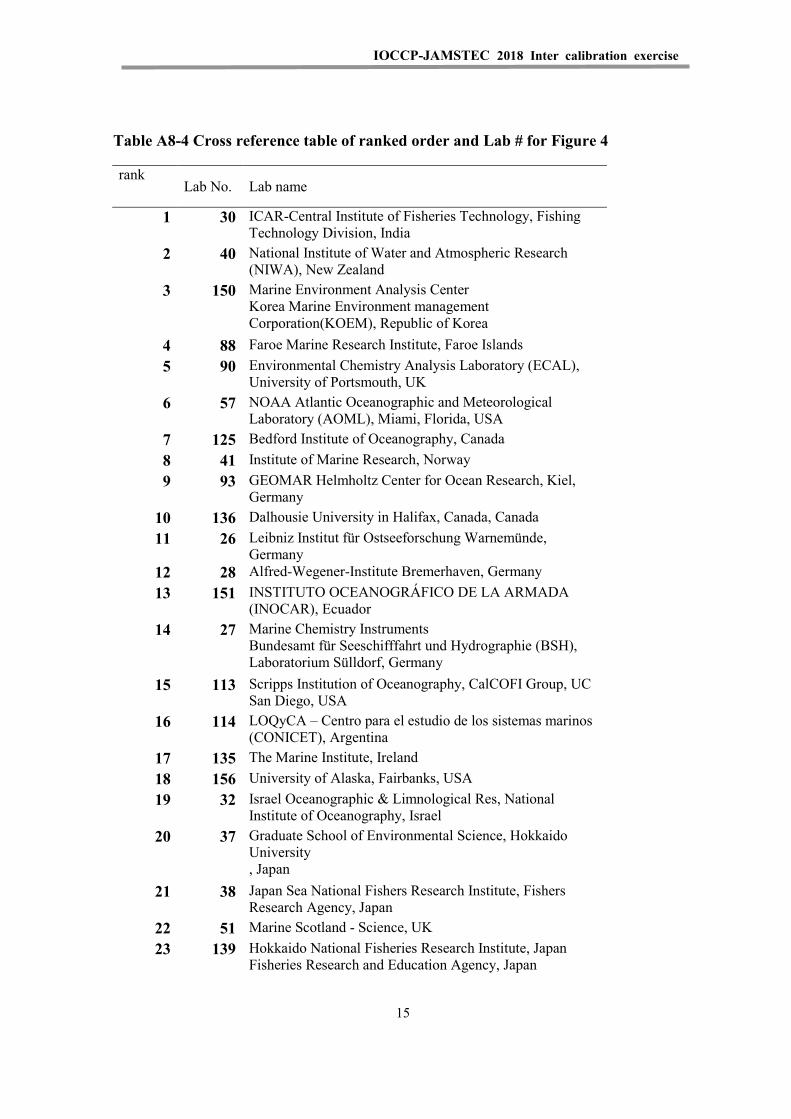
IOCCP-JAMSTEC 2018 Inter calibration exercise
Table A8-4 Cross reference table of ranked order and Lab # for Figure 4
rank Lab No. Lab name
1 30 ICAR-Central Institute of Fisheries Technology, Fishing Technology Division, India
2 40 National Institute of Water and Atmospheric Research (NIWA), New Zealand
3 150 Marine Environment Analysis Center Korea Marine Environment management Corporation(KOEM), Republic of Korea
4 88 Faroe Marine Research Institute, Faroe Islands 5 90 Environmental Chemistry Analysis Laboratory (ECAL),
University of Portsmouth, UK 6 57 NOAA Atlantic Oceanographic and Meteorological
Laboratory (AOML), Miami, Florida, USA 7 125 Bedford Institute of Oceanography, Canada 8 41 Institute of Marine Research, Norway 9 93 GEOMAR Helmholtz Center for Ocean Research, Kiel,
Germany 10 136 Dalhousie University in Halifax, Canada, Canada 11 26 Leibniz Institut für Ostseeforschung Warnemünde,
Germany 12 28 Alfred-Wegener-Institute Bremerhaven, Germany 13 151 INSTITUTO OCEANOGRÁFICO DE LA ARMADA
(INOCAR), Ecuador 14 27 Marine Chemistry Instruments
Bundesamt für Seeschifffahrt und Hydrographie (BSH), Laboratorium Sülldorf, Germany
15 113 Scripps Institution of Oceanography, CalCOFI Group, UC San Diego, USA
16 114 LOQyCA – Centro para el estudio de los sistemas marinos (CONICET), Argentina
17 135 The Marine Institute, Ireland 18 156 University of Alaska, Fairbanks, USA 19 32 Israel Oceanographic & Limnological Res, National
Institute of Oceanography, Israel 20 37 Graduate School of Environmental Science, Hokkaido
University , Japan
21 38 Japan Sea National Fishers Research Institute, Fishers Research Agency, Japan
22 51 Marine Scotland - Science, UK 23 139 Hokkaido National Fisheries Research Institute, Japan
Fisheries Research and Education Agency, Japan
15
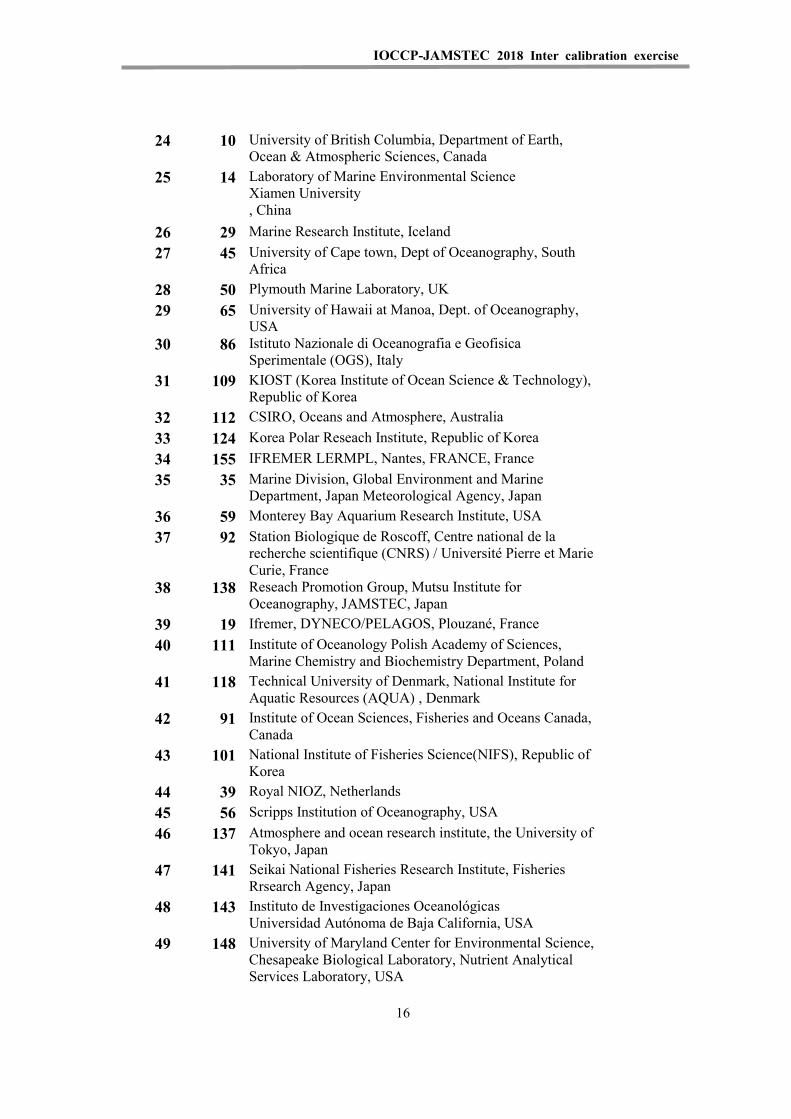
IOCCP-JAMSTEC 2018 Inter calibration exercise
24 10 University of British Columbia, Department of Earth, Ocean & Atmospheric Sciences, Canada
25 14 Laboratory of Marine Environmental Science Xiamen University , China
26 29 Marine Research Institute, Iceland 27 45 University of Cape town, Dept of Oceanography, South
Africa 28 50 Plymouth Marine Laboratory, UK 29 65 University of Hawaii at Manoa, Dept. of Oceanography,
USA 30 86 Istituto Nazionale di Oceanografia e Geofisica
Sperimentale (OGS), Italy 31 109 KIOST (Korea Institute of Ocean Science & Technology),
Republic of Korea 32 112 CSIRO, Oceans and Atmosphere, Australia 33 124 Korea Polar Reseach Institute, Republic of Korea 34 155 IFREMER LERMPL, Nantes, FRANCE, France 35 35 Marine Division, Global Environment and Marine
Department, Japan Meteorological Agency, Japan 36 59 Monterey Bay Aquarium Research Institute, USA 37 92 Station Biologique de Roscoff, Centre national de la
recherche scientifique (CNRS) / Université Pierre et Marie Curie, France
38 138 Reseach Promotion Group, Mutsu Institute for Oceanography, JAMSTEC, Japan
39 19 Ifremer, DYNECO/PELAGOS, Plouzané, France 40 111 Institute of Oceanology Polish Academy of Sciences,
Marine Chemistry and Biochemistry Department, Poland 41 118 Technical University of Denmark, National Institute for
Aquatic Resources (AQUA) , Denmark 42 91 Institute of Ocean Sciences, Fisheries and Oceans Canada,
Canada 43 101 National Institute of Fisheries Science(NIFS), Republic of
Korea 44 39 Royal NIOZ, Netherlands 45 56 Scripps Institution of Oceanography, USA 46 137 Atmosphere and ocean research institute, the University of
Tokyo, Japan 47 141 Seikai National Fisheries Research Institute, Fisheries
Rrsearch Agency, Japan 48 143 Instituto de Investigaciones Oceanológicas
Universidad Autónoma de Baja California, USA 49 148 University of Maryland Center for Environmental Science,
Chesapeake Biological Laboratory, Nutrient Analytical Services Laboratory, USA
16
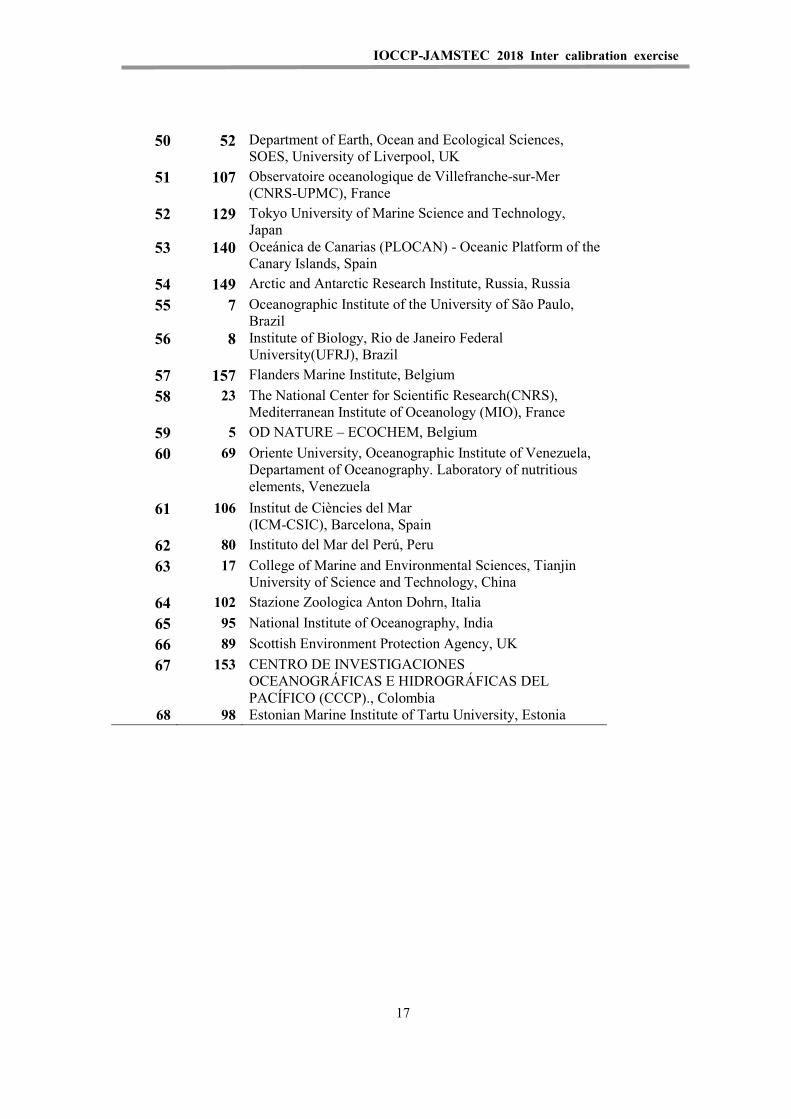
IOCCP-JAMSTEC 2018 Inter calibration exercise
50 52 Department of Earth, Ocean and Ecological Sciences, SOES, University of Liverpool, UK
51 107 Observatoire oceanologique de Villefranche-sur-Mer (CNRS-UPMC), France
52 129 Tokyo University of Marine Science and Technology, Japan
53 140 Oceánica de Canarias (PLOCAN) - Oceanic Platform of the Canary Islands, Spain
54 149 Arctic and Antarctic Research Institute, Russia, Russia 55 7 Oceanographic Institute of the University of São Paulo,
Brazil 56 8 Institute of Biology, Rio de Janeiro Federal
University(UFRJ), Brazil 57 157 Flanders Marine Institute, Belgium 58 23 The National Center for Scientific Research(CNRS),
Mediterranean Institute of Oceanology (MIO), France 59 5 OD NATURE – ECOCHEM, Belgium 60 69 Oriente University, Oceanographic Institute of Venezuela,
Departament of Oceanography. Laboratory of nutritious elements, Venezuela
61 106 Institut de Ciències del Mar (ICM-CSIC), Barcelona, Spain
62 80 Instituto del Mar del Perú, Peru 63 17 College of Marine and Environmental Sciences, Tianjin
University of Science and Technology, China 64 102 Stazione Zoologica Anton Dohrn, Italia 65 95 National Institute of Oceanography, India 66 89 Scottish Environment Protection Agency, UK 67 153 CENTRO DE INVESTIGACIONES
OCEANOGRÁFICAS E HIDROGRÁFICAS DEL PACÍFICO (CCCP)., Colombia
68 98 Estonian Marine Institute of Tartu University, Estonia
17

IOCCP-JAMSTEC 2018 Inter calibration exercise
18
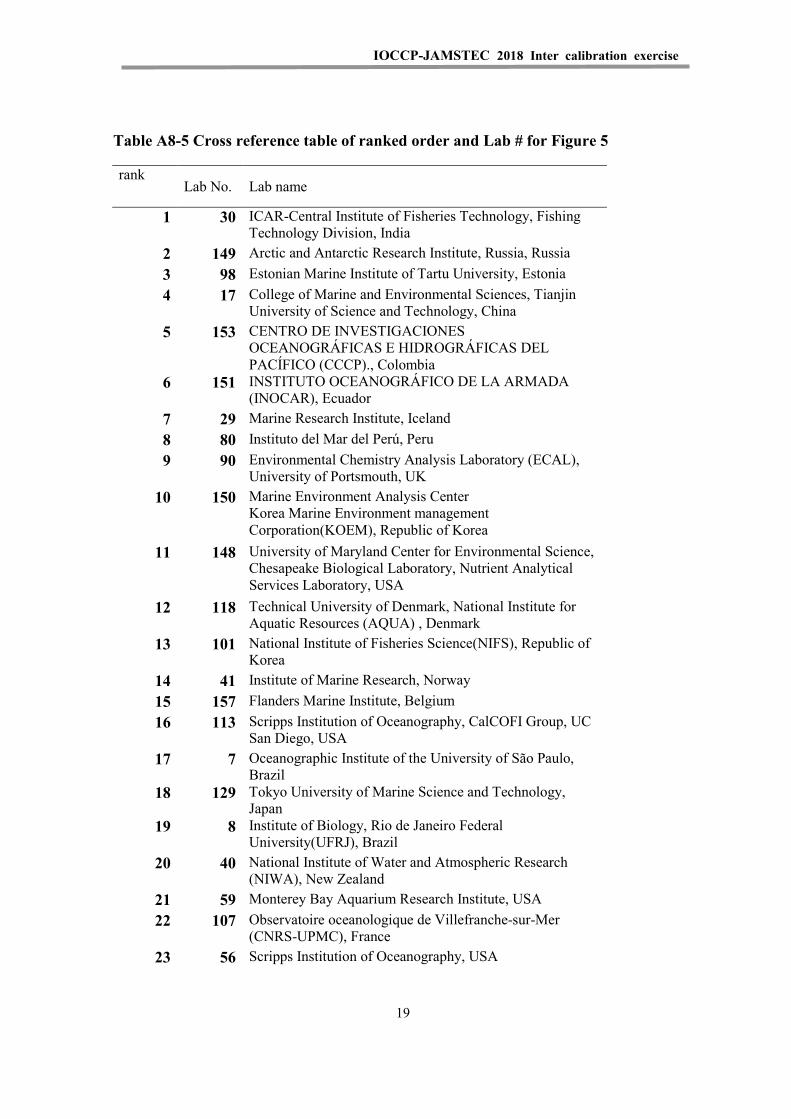
IOCCP-JAMSTEC 2018 Inter calibration exercise
Table A8-5 Cross reference table of ranked order and Lab # for Figure 5
rank Lab No. Lab name
1 30 ICAR-Central Institute of Fisheries Technology, Fishing Technology Division, India
2 149 Arctic and Antarctic Research Institute, Russia, Russia 3 98 Estonian Marine Institute of Tartu University, Estonia 4 17 College of Marine and Environmental Sciences, Tianjin
University of Science and Technology, China 5 153 CENTRO DE INVESTIGACIONES
OCEANOGRÁFICAS E HIDROGRÁFICAS DEL PACÍFICO (CCCP)., Colombia
6 151 INSTITUTO OCEANOGRÁFICO DE LA ARMADA (INOCAR), Ecuador
7 29 Marine Research Institute, Iceland 8 80 Instituto del Mar del Perú, Peru 9 90 Environmental Chemistry Analysis Laboratory (ECAL),
University of Portsmouth, UK 10 150 Marine Environment Analysis Center
Korea Marine Environment management Corporation(KOEM), Republic of Korea
11 148 University of Maryland Center for Environmental Science, Chesapeake Biological Laboratory, Nutrient Analytical Services Laboratory, USA
12 118 Technical University of Denmark, National Institute for Aquatic Resources (AQUA) , Denmark
13 101 National Institute of Fisheries Science(NIFS), Republic of Korea
14 41 Institute of Marine Research, Norway 15 157 Flanders Marine Institute, Belgium 16 113 Scripps Institution of Oceanography, CalCOFI Group, UC
San Diego, USA 17 7 Oceanographic Institute of the University of São Paulo,
Brazil 18 129 Tokyo University of Marine Science and Technology,
Japan 19 8 Institute of Biology, Rio de Janeiro Federal
University(UFRJ), Brazil 20 40 National Institute of Water and Atmospheric Research
(NIWA), New Zealand 21 59 Monterey Bay Aquarium Research Institute, USA 22 107 Observatoire oceanologique de Villefranche-sur-Mer
(CNRS-UPMC), France 23 56 Scripps Institution of Oceanography, USA
19
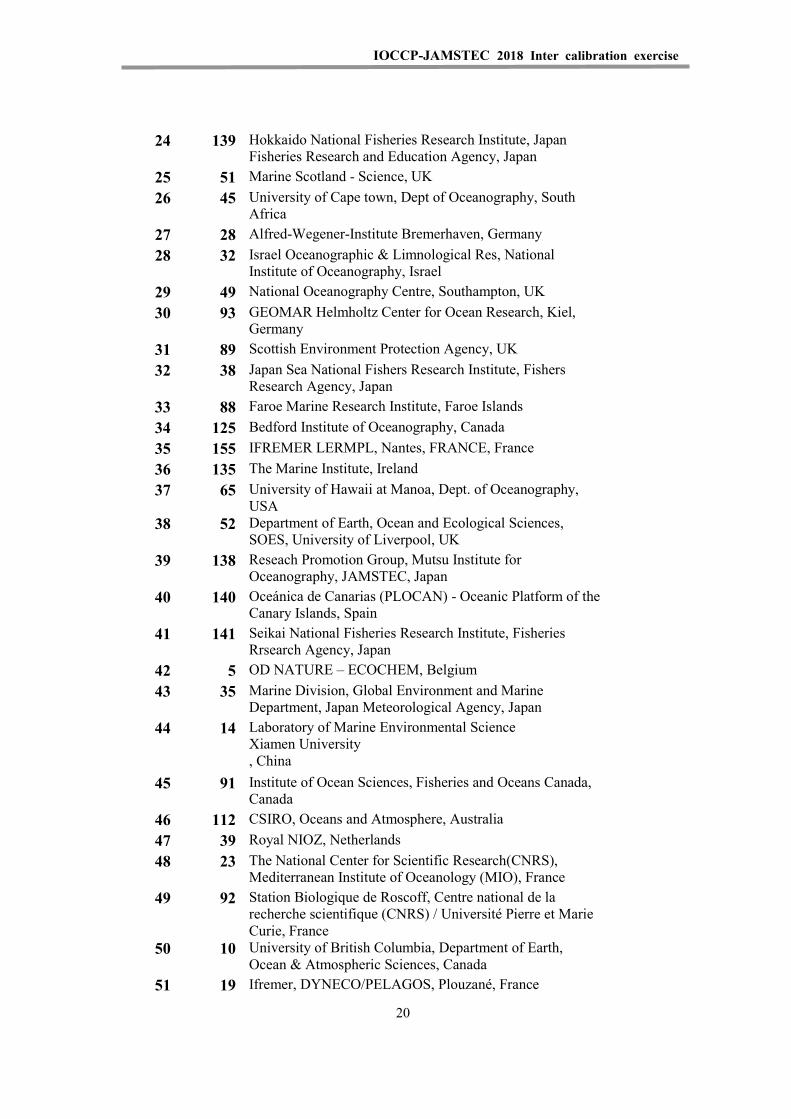
IOCCP-JAMSTEC 2018 Inter calibration exercise
24 139 Hokkaido National Fisheries Research Institute, Japan Fisheries Research and Education Agency, Japan
25 51 Marine Scotland - Science, UK 26 45 University of Cape town, Dept of Oceanography, South
Africa 27 28 Alfred-Wegener-Institute Bremerhaven, Germany 28 32 Israel Oceanographic & Limnological Res, National
Institute of Oceanography, Israel 29 49 National Oceanography Centre, Southampton, UK 30 93 GEOMAR Helmholtz Center for Ocean Research, Kiel,
Germany 31 89 Scottish Environment Protection Agency, UK 32 38 Japan Sea National Fishers Research Institute, Fishers
Research Agency, Japan 33 88 Faroe Marine Research Institute, Faroe Islands 34 125 Bedford Institute of Oceanography, Canada 35 155 IFREMER LERMPL, Nantes, FRANCE, France 36 135 The Marine Institute, Ireland 37 65 University of Hawaii at Manoa, Dept. of Oceanography,
USA 38 52 Department of Earth, Ocean and Ecological Sciences,
SOES, University of Liverpool, UK 39 138 Reseach Promotion Group, Mutsu Institute for
Oceanography, JAMSTEC, Japan 40 140 Oceánica de Canarias (PLOCAN) - Oceanic Platform of the
Canary Islands, Spain 41 141 Seikai National Fisheries Research Institute, Fisheries
Rrsearch Agency, Japan 42 5 OD NATURE – ECOCHEM, Belgium 43 35 Marine Division, Global Environment and Marine
Department, Japan Meteorological Agency, Japan 44 14 Laboratory of Marine Environmental Science
Xiamen University , China
45 91 Institute of Ocean Sciences, Fisheries and Oceans Canada, Canada
46 112 CSIRO, Oceans and Atmosphere, Australia 47 39 Royal NIOZ, Netherlands 48 23 The National Center for Scientific Research(CNRS),
Mediterranean Institute of Oceanology (MIO), France 49 92 Station Biologique de Roscoff, Centre national de la
recherche scientifique (CNRS) / Université Pierre et Marie Curie, France
50 10 University of British Columbia, Department of Earth, Ocean & Atmospheric Sciences, Canada
51 19 Ifremer, DYNECO/PELAGOS, Plouzané, France
20
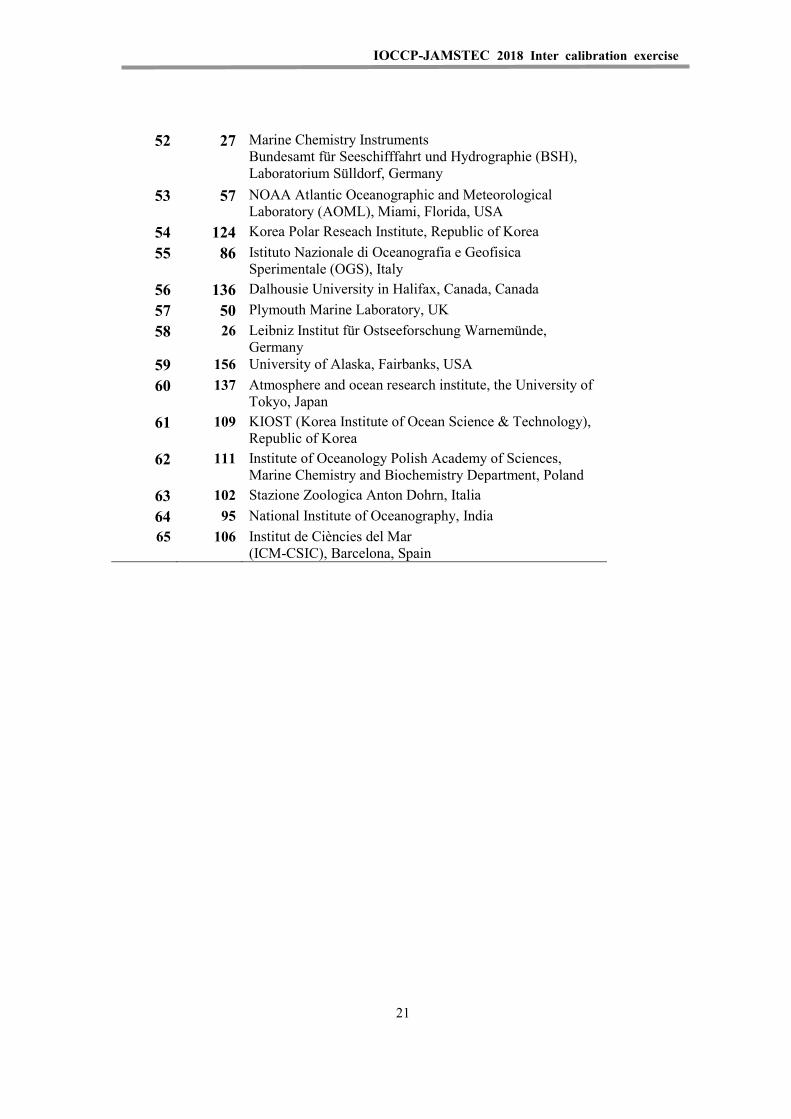
IOCCP-JAMSTEC 2018 Inter calibration exercise
52 27 Marine Chemistry Instruments Bundesamt für Seeschifffahrt und Hydrographie (BSH), Laboratorium Sülldorf, Germany
53 57 NOAA Atlantic Oceanographic and Meteorological Laboratory (AOML), Miami, Florida, USA
54 124 Korea Polar Reseach Institute, Republic of Korea 55 86 Istituto Nazionale di Oceanografia e Geofisica
Sperimentale (OGS), Italy 56 136 Dalhousie University in Halifax, Canada, Canada 57 50 Plymouth Marine Laboratory, UK 58 26 Leibniz Institut für Ostseeforschung Warnemünde,
Germany 59 156 University of Alaska, Fairbanks, USA 60 137 Atmosphere and ocean research institute, the University of
Tokyo, Japan 61 109 KIOST (Korea Institute of Ocean Science & Technology),
Republic of Korea 62 111 Institute of Oceanology Polish Academy of Sciences,
Marine Chemistry and Biochemistry Department, Poland 63 102 Stazione Zoologica Anton Dohrn, Italia 64 95 National Institute of Oceanography, India 65 106 Institut de Ciències del Mar
(ICM-CSIC), Barcelona, Spain
21

IOCCP-JAMSTEC 2018 Inter calibration exercise
22
IOCCP-JAMSTEC 2018 Inter calibration exercise
Appendix IV
Invitation letter to 2017/18 I/C exercise
1

IOCCP-JAMSTEC 2018 Inter calibration exercise
2
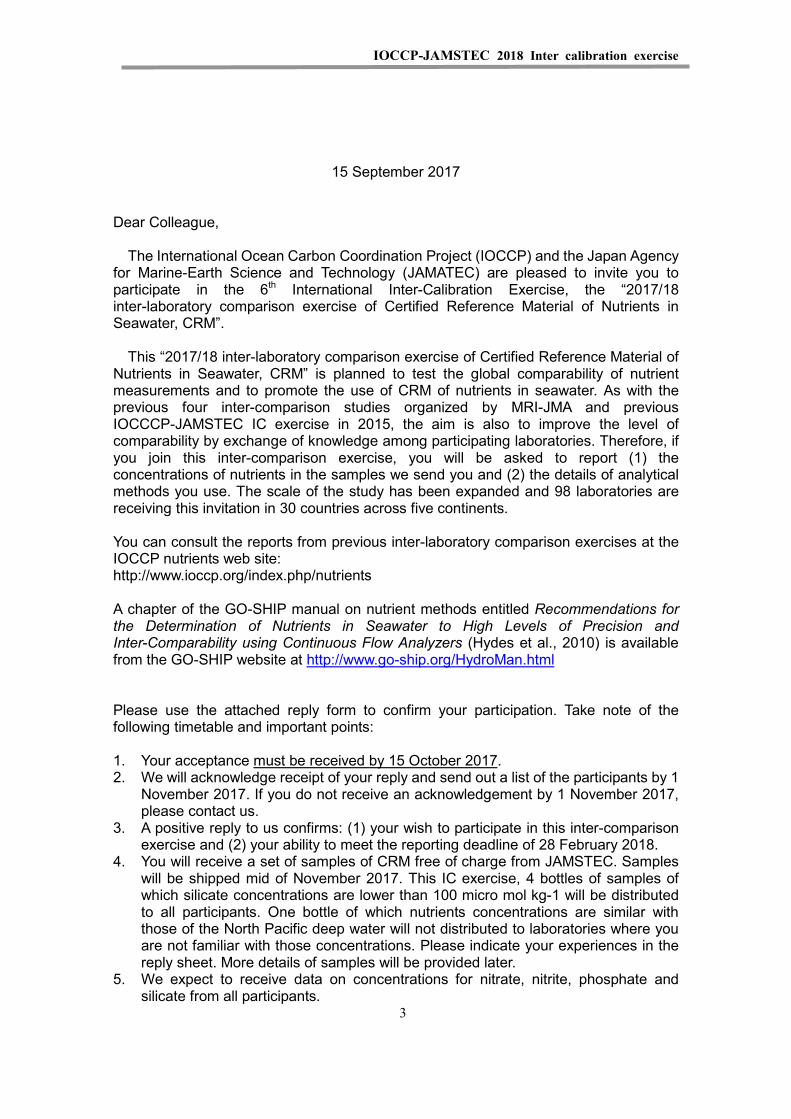
IOCCP-JAMSTEC 2018 Inter calibration exercise
15 September 2017 Dear Colleague,
The International Ocean Carbon Coordination Project (IOCCP) and the Japan Agency for Marine-Earth Science and Technology (JAMATEC) are pleased to invite you to participate in the 6th International Inter-Calibration Exercise, the “2017/18 inter-laboratory comparison exercise of Certified Reference Material of Nutrients in Seawater, CRM”.
This “2017/18 inter-laboratory comparison exercise of Certified Reference Material of
Nutrients in Seawater, CRM” is planned to test the global comparability of nutrient measurements and to promote the use of CRM of nutrients in seawater. As with the previous four inter-comparison studies organized by MRI-JMA and previous IOCCCP-JAMSTEC IC exercise in 2015, the aim is also to improve the level of comparability by exchange of knowledge among participating laboratories. Therefore, if you join this inter-comparison exercise, you will be asked to report (1) the concentrations of nutrients in the samples we send you and (2) the details of analytical methods you use. The scale of the study has been expanded and 98 laboratories are receiving this invitation in 30 countries across five continents. You can consult the reports from previous inter-laboratory comparison exercises at the IOCCP nutrients web site: http://www.ioccp.org/index.php/nutrients A chapter of the GO-SHIP manual on nutrient methods entitled Recommendations for the Determination of Nutrients in Seawater to High Levels of Precision and Inter-Comparability using Continuous Flow Analyzers (Hydes et al., 2010) is available from the GO-SHIP website at http://www.go-ship.org/HydroMan.html Please use the attached reply form to confirm your participation. Take note of the following timetable and important points: 1. Your acceptance must be received by 15 October 2017. 2. We will acknowledge receipt of your reply and send out a list of the participants by 1
November 2017. If you do not receive an acknowledgement by 1 November 2017, please contact us.
3. A positive reply to us confirms: (1) your wish to participate in this inter-comparison exercise and (2) your ability to meet the reporting deadline of 28 February 2018.
4. You will receive a set of samples of CRM free of charge from JAMSTEC. Samples will be shipped mid of November 2017. This IC exercise, 4 bottles of samples of which silicate concentrations are lower than 100 micro mol kg-1 will be distributed to all participants. One bottle of which nutrients concentrations are similar with those of the North Pacific deep water will not distributed to laboratories where you are not familiar with those concentrations. Please indicate your experiences in the reply sheet. More details of samples will be provided later.
5. We expect to receive data on concentrations for nitrate, nitrite, phosphate and silicate from all participants.
3

IOCCP-JAMSTEC 2018 Inter calibration exercise
6. We also welcome data for concentrations of ammonia and dissolved organic nitrogen and phosphorus from labs able to perform such analyses.
7. All resulting data reports will fully acknowledge the contribution of each participant. 8. Results of this IC exercise will be published with ISBN. A draft of this IC exercise will
be distributed until 30 June 2018. Best regards,
Prof. Michio AOYAMA, Dr. Principal Research Scientist, RCGC - JAMSTEC Professor, Institute of Environmental Radioactivity, Fukushima University, Japan IOCCP Scientific Steering Group Expert for Nutrients (www.ioccp.org/nutrients) Tel: +81-24-504-2882 E-mail: [email protected]
4
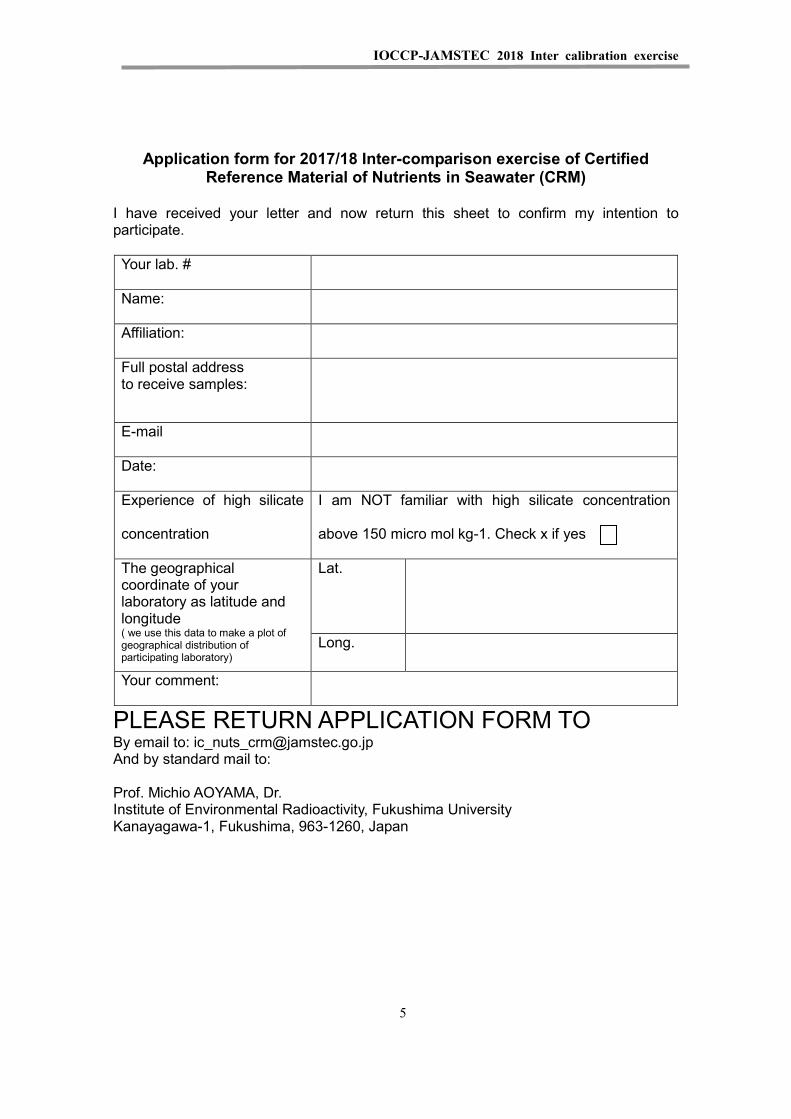
IOCCP-JAMSTEC 2018 Inter calibration exercise
Application form for 2017/18 Inter-comparison exercise of Certified
Reference Material of Nutrients in Seawater (CRM) I have received your letter and now return this sheet to confirm my intention to participate. Your lab. #
Name:
Affiliation:
Full postal address to receive samples:
Date:
Experience of high silicate
concentration
I am NOT familiar with high silicate concentration
above 150 micro mol kg-1. Check x if yes
The geographical coordinate of your laboratory as latitude and longitude ( we use this data to make a plot of geographical distribution of participating laboratory)
Lat.
Long.
Your comment:
PLEASE RETURN APPLICATION FORM TO By email to: [email protected] And by standard mail to: Prof. Michio AOYAMA, Dr. Institute of Environmental Radioactivity, Fukushima University Kanayagawa-1, Fukushima, 963-1260, Japan
5

IOCCP-JAMSTEC 2018 Inter calibration exercise
IOCCP-JAMSTEC 2018 Inter calibration exercise
Appendix V
Results KIOST of RMs
Figure KIOST-1. Nitrate+Nitrite results for KIOST RMs. Laboratories are ranked in order of concentrations reported for NAY.
Figure KIOST-2. Nitrate results for KIOST RMs. Laboratories are ranked in order of concentrations reported for NAY.
Figure KIOST-3. Nitrite results for KIOST RMs. Laboratories are ranked in order of concentrations reported for NBA.
Figure KIOST-4. Phosphate results for KIOST RMs. Laboratories are ranked in order of concentrations reported for NAY.
Figure KIOST-5. Silicate results for KIOST RMs. Laboratories are ranked in order of concentrations reported for NAY.
Table KIOST-1-1. Comparison between certified value by KANSO and measured value by KIOST.
Table KIOST-1-2. Homogeneity of K-RMS.
Table KIOST-1-3. Assigned values of KIOST RMS.
Table KIOST-2. Summary of responses from participants.
Table KIOST-3. Raw and robust statistics for nutrient concentrations calculated using all reported values.
Table KIOST-4. Consensus means, medians, and standard deviations for 3 samples.
IOCCP-JAMSTEC 2018 Inter calibration exercise
Table KIOST-5-1. Median and range of analytical precision of participating laboratories, and consensus coefficient of variation for analyses of nutrients in NAY.
Table KIOST-5-2. Median and range of analytical precision of participating laboratories, and consensus coefficient of variation for analyses of nutrients in NAZ.
Table KIOST-5-3. Median and range of analytical precision of participating laboratories, and consensus coefficient of variation for analyses of nutrients in NBA.
Table KIOST-6-1. Z-scores for nitrate+nitrite analyses.
Table KIOST-6-2. Z-scores for nitrate analyses.
Table KIOST-6-3. Z-scores for nitrite analyses.
Table KIOST-6-4. Z-scores for phosphate analyses.
Table KIOST-6-5. Z-scores for silicate analyses.
Table KIOST-6-6. Combined Z-scores for phosphate and nitrate+nitrite analyses.
Table KIOST-6-7. Combined Z-scores for phosphate, nitrate+nitrite, and silicate analyses.
TableKIOST-A1. List of participants.
Table KIOST-A2. Results reported by the participants.
Table KIOST-A3. Ammonia results reported by the participants
Table KIOST-A4-1 Cross reference table of ranked order and Lab # for Figure KIOST-1
Table KIOST-A4-2 Cross reference table of ranked order and Lab # for Figure KIOST-2
Table KIOST-A4-3 Cross reference table of ranked order and Lab # for Figure KIOST-3
Table KIOST-A4-4 Cross reference table of ranked order and Lab # for Figure KIOST-4
Table KIOST-A4-5 Cross reference table of ranked order and Lab # for Figure KIOST-5
IOCCP-JAMSTEC 2018 Inter calibration exercise
Description on KIOST Nutrient Reference Materials for Seawater (K-RMS)
1. Source seawater
Natural seawater was collected from Seawater Utilization Plant Research Center in Korea which provides seawater from the coastal station in Goseong at a depth of 650m (Goseong coastal water). Also collected from the surface at an open station (36o 5’N, 129 o48’E) in the East Sea. Seawater from the 650m of coastal station was collected on November, 2016 and seawater from the surface at open station was collected with Niskin bottles on R/V Eardo on August, 2015 (East Sea surface water). NAY batch was made by Goseong coastal water, NAZ batch was mixed with Goseong coastal water and East Sea surface water in a ratio of 1:2. And NBA batch was mixed with Goseong coastal water and East Sea surface water in a ratio of 2:1.
2. Pasteurization
Natural Seawater was filtered into a 100 L titanium tank through 0.22 µm pore size membrane filter and was autoclaved at 120 oC 210 kPa for 2 hours. Then it was cooled down to room temperature with homogenizing on rotary turn table.
3. Bottling
Pasteurized seawater was transferred directly to sterilized 15ml test tube with screw cap (Kartell, Germany) for one day within class 100 clean bench in a class 1000 clean room. 2000 tubes of K-RMS were made for each batch within two days, and three batches were produced in total.
4. Package
Three batches of K-RMS were vacuum sealed with aluminum film bag in the clean room. Total dimension of package is 10 cm*10 cm*3cm and total weight is less than 50 g. Each bottle contains only 12 ml of reference material.
1
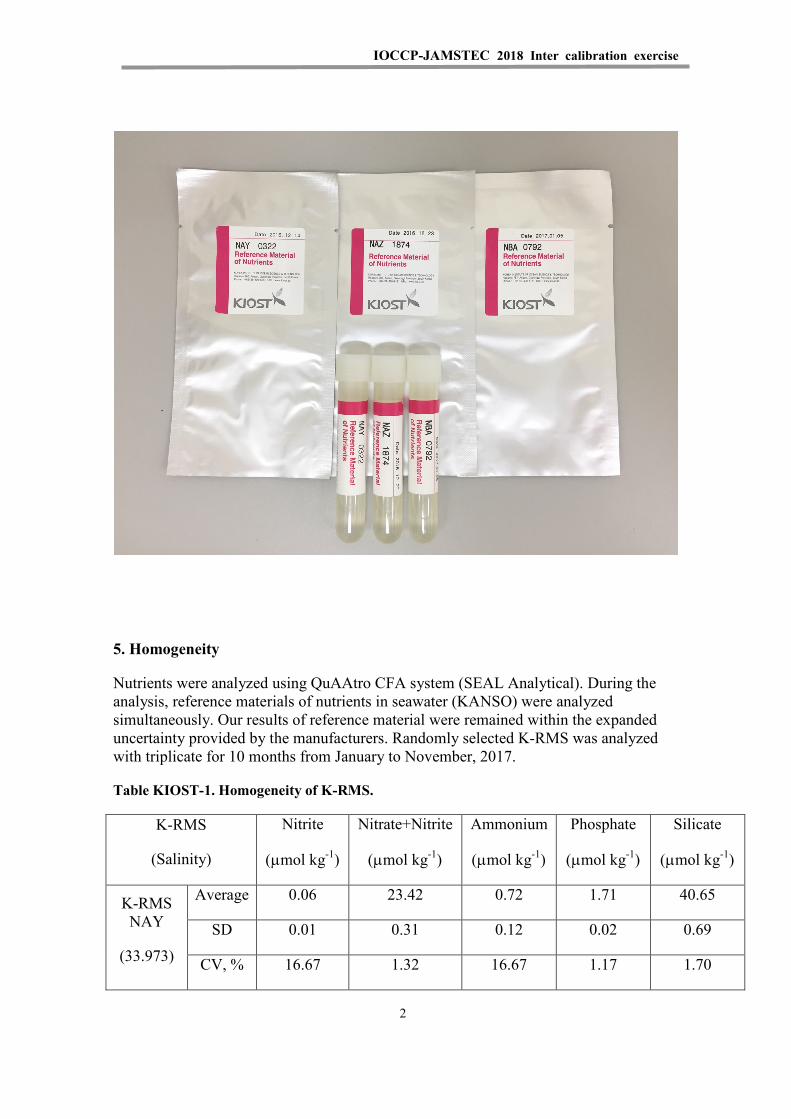
IOCCP-JAMSTEC 2018 Inter calibration exercise
5. Homogeneity
Nutrients were analyzed using QuAAtro CFA system (SEAL Analytical). During the analysis, reference materials of nutrients in seawater (KANSO) were analyzed simultaneously. Our results of reference material were remained within the expanded uncertainty provided by the manufacturers. Randomly selected K-RMS was analyzed with triplicate for 10 months from January to November, 2017.
Table KIOST-1. Homogeneity of K-RMS.
K-RMS
(Salinity)
Nitrite
(µmol kg-1)
Nitrate+Nitrite
(µmol kg-1)
Ammonium
(µmol kg-1)
Phosphate
(µmol kg-1)
Silicate
(µmol kg-1)
K-RMS NAY
(33.973)
Average 0.06 23.42 0.72 1.71 40.65
SD 0.01 0.31 0.12 0.02 0.69
CV, % 16.67 1.32 16.67 1.17 1.70
2
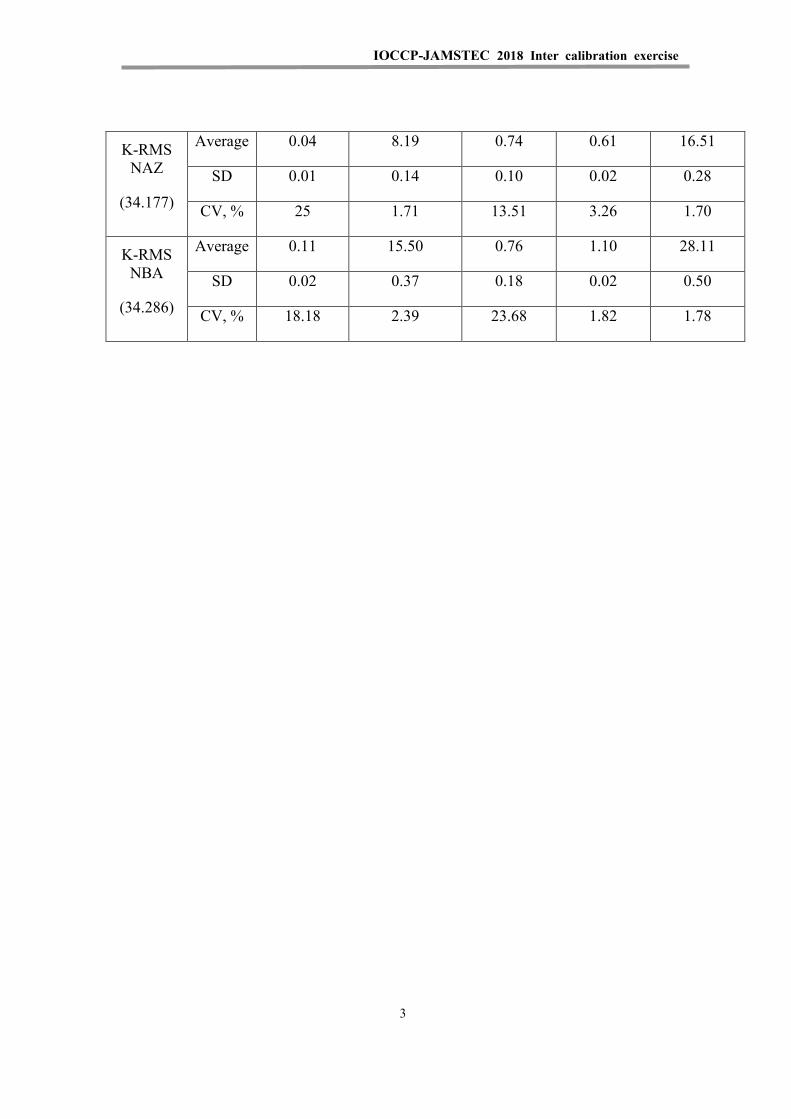
IOCCP-JAMSTEC 2018 Inter calibration exercise
K-RMS NAZ
(34.177)
Average 0.04 8.19 0.74 0.61 16.51
SD 0.01 0.14 0.10 0.02 0.28
CV, % 25 1.71 13.51 3.26 1.70
K-RMS NBA
(34.286)
Average 0.11 15.50 0.76 1.10 28.11
SD 0.02 0.37 0.18 0.02 0.50
CV, % 18.18 2.39 23.68 1.82 1.78
3
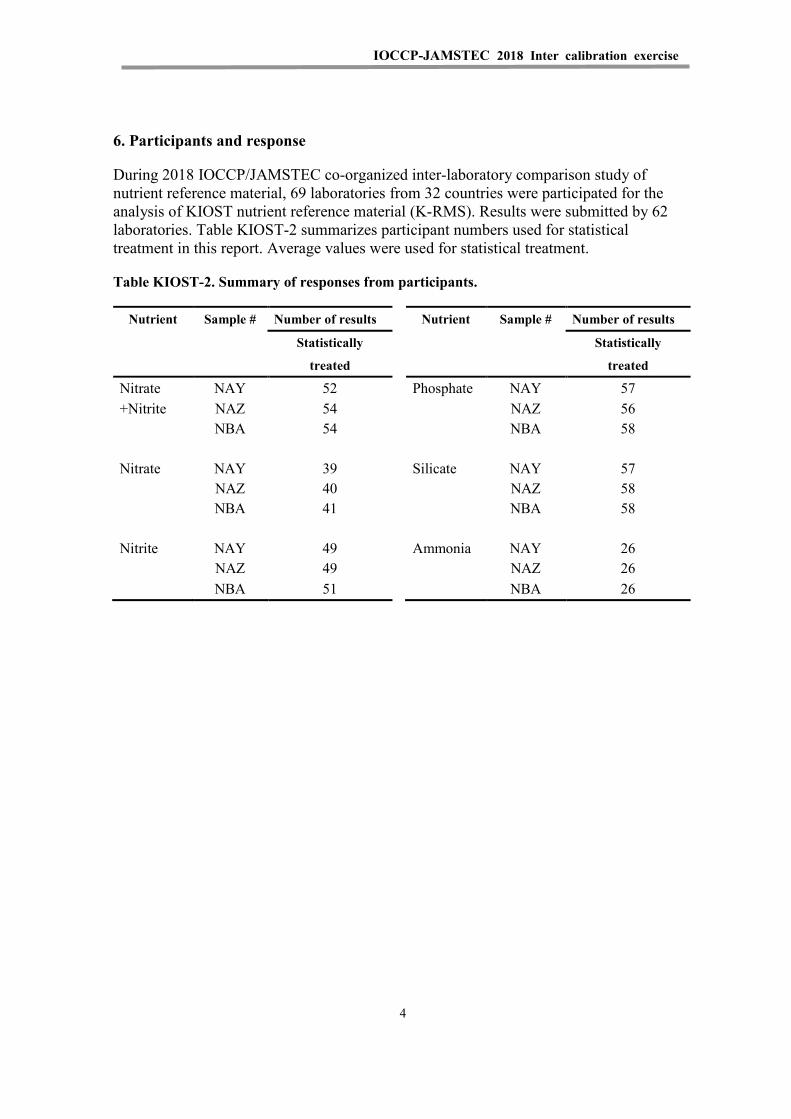
IOCCP-JAMSTEC 2018 Inter calibration exercise
6. Participants and response
During 2018 IOCCP/JAMSTEC co-organized inter-laboratory comparison study of nutrient reference material, 69 laboratories from 32 countries were participated for the analysis of KIOST nutrient reference material (K-RMS). Results were submitted by 62 laboratories. Table KIOST-2 summarizes participant numbers used for statistical treatment in this report. Average values were used for statistical treatment.
Table KIOST-2. Summary of responses from participants.
Nutrient Sample # Number of results Nutrient Sample # Number of results
Statistically
Statistically
treated treated
Nitrate NAY 52 Phosphate NAY 57 +Nitrite NAZ 54 NAZ 56
NBA 54 NBA 58
Nitrate NAY 39 Silicate NAY 57
NAZ 40 NAZ 58
NBA 41 NBA 58
Nitrite NAY 49 Ammonia NAY 26
NAZ 49 NAZ 26 NBA 51 NBA 26
4
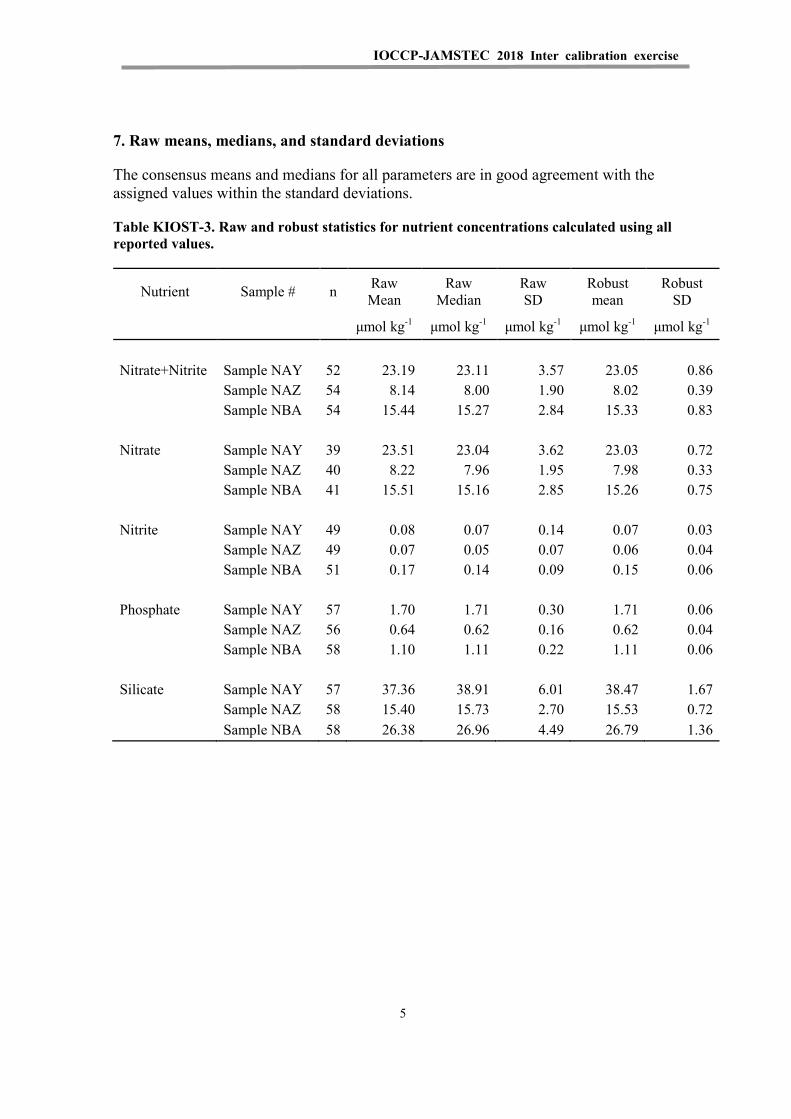
IOCCP-JAMSTEC 2018 Inter calibration exercise
7. Raw means, medians, and standard deviations
The consensus means and medians for all parameters are in good agreement with the assigned values within the standard deviations.
Table KIOST-3. Raw and robust statistics for nutrient concentrations calculated using all reported values.
Nutrient Sample # n Raw Mean
Raw Median
Raw SD
Robust mean
Robust SD
μmol kg-1 μmol kg-1 μmol kg-1 μmol kg-1 μmol kg-1
Nitrate+Nitrite Sample NAY 52 23.19 23.11 3.57 23.05 0.86
Sample NAZ 54 8.14 8.00 1.90 8.02 0.39
Sample NBA 54 15.44 15.27 2.84 15.33 0.83
Nitrate Sample NAY 39 23.51 23.04 3.62 23.03 0.72
Sample NAZ 40 8.22 7.96 1.95 7.98 0.33
Sample NBA 41 15.51 15.16 2.85 15.26 0.75
Nitrite Sample NAY 49 0.08 0.07 0.14 0.07 0.03
Sample NAZ 49 0.07 0.05 0.07 0.06 0.04
Sample NBA 51 0.17 0.14 0.09 0.15 0.06
Phosphate Sample NAY 57 1.70 1.71 0.30 1.71 0.06
Sample NAZ 56 0.64 0.62 0.16 0.62 0.04
Sample NBA 58 1.10 1.11 0.22 1.11 0.06
Silicate Sample NAY 57 37.36 38.91 6.01 38.47 1.67
Sample NAZ 58 15.40 15.73 2.70 15.53 0.72 Sample NBA 58 26.38 26.96 4.49 26.79 1.36
5
IOCCP-JAMSTEC 2018 Inter calibration exercise
8. Ranked scatter-plots
Ranked scatter-plots of nitrate+nitrite, nitrate, nitrite, phosphate and silicate of three K-RMS are shown at Figures KIOST- 1 to KIOST-5. For nitrate+nitrite, nitrate, phosphate and silicate, the laboratories results were sorted in order of the concentrations reported for NAY. For nitrite, the laboratories results were sorted in order of the concentrations for NBA. General trends of ranked scatter-plots of K-RMS are similar to those of KANSO.
6
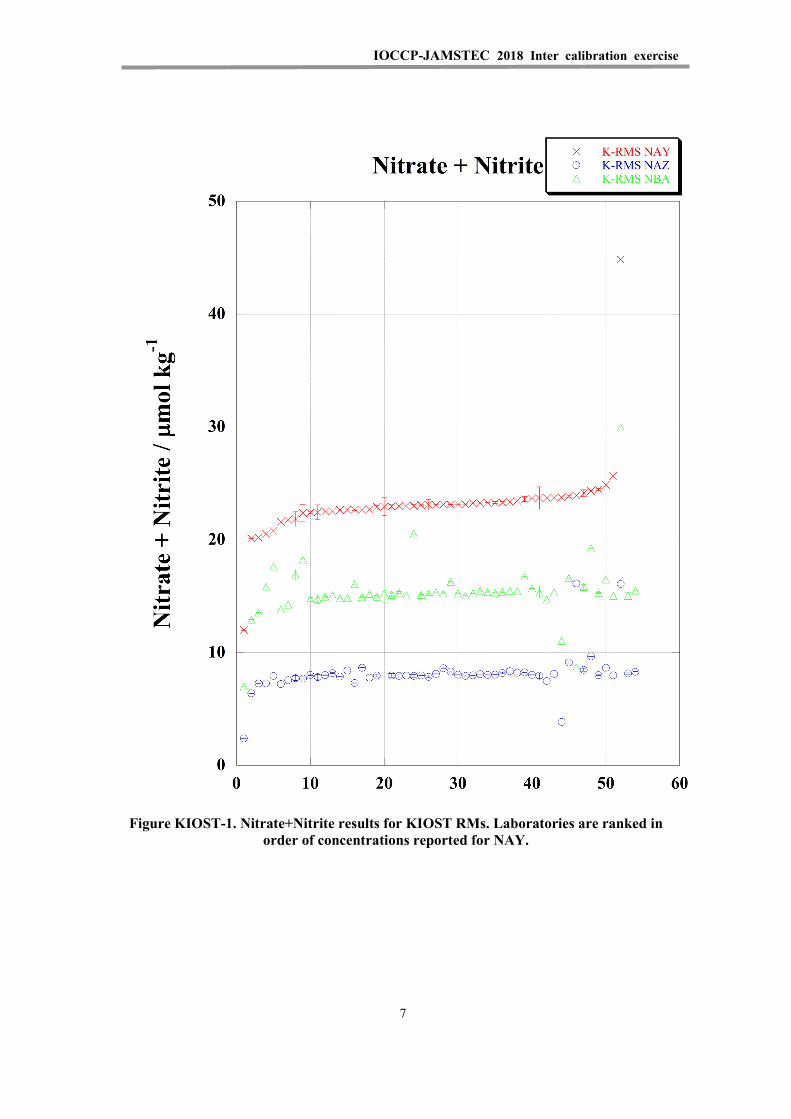
IOCCP-JAMSTEC 2018 Inter calibration exercise
Figure KIOST-1. Nitrate+Nitrite results for KIOST RMs. Laboratories are ranked in order of concentrations reported for NAY.
7
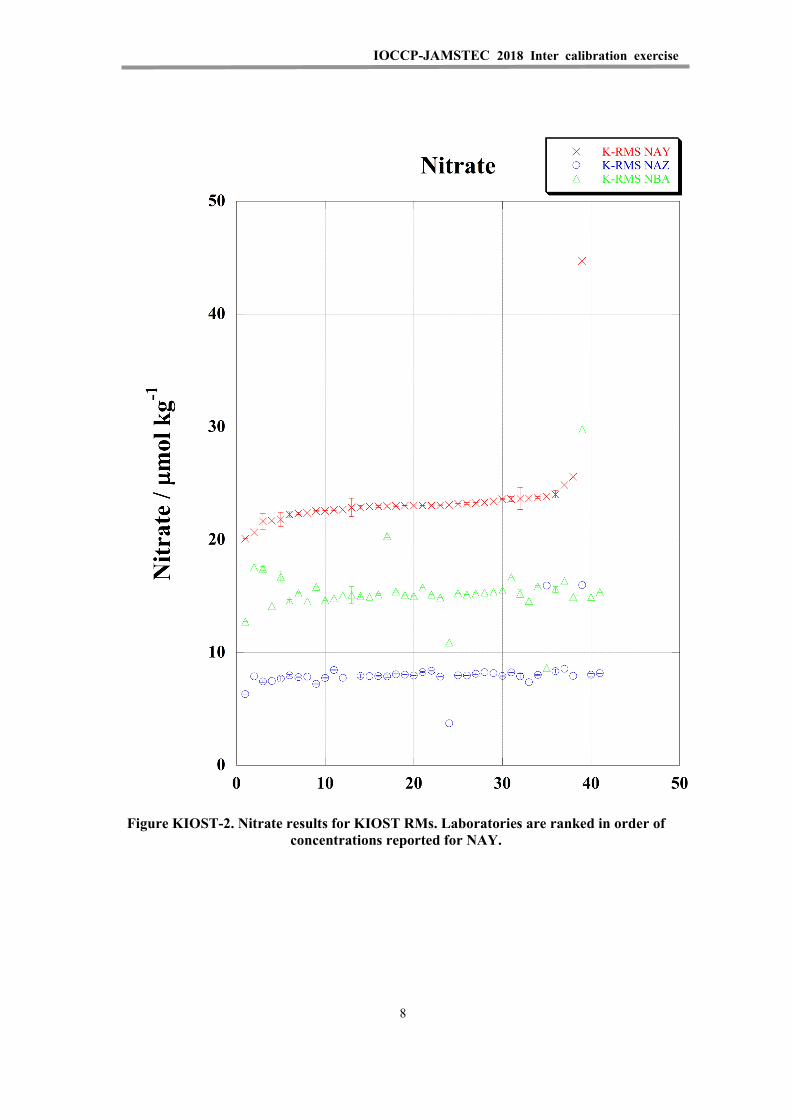
IOCCP-JAMSTEC 2018 Inter calibration exercise
Figure KIOST-2. Nitrate results for KIOST RMs. Laboratories are ranked in order of concentrations reported for NAY.
8
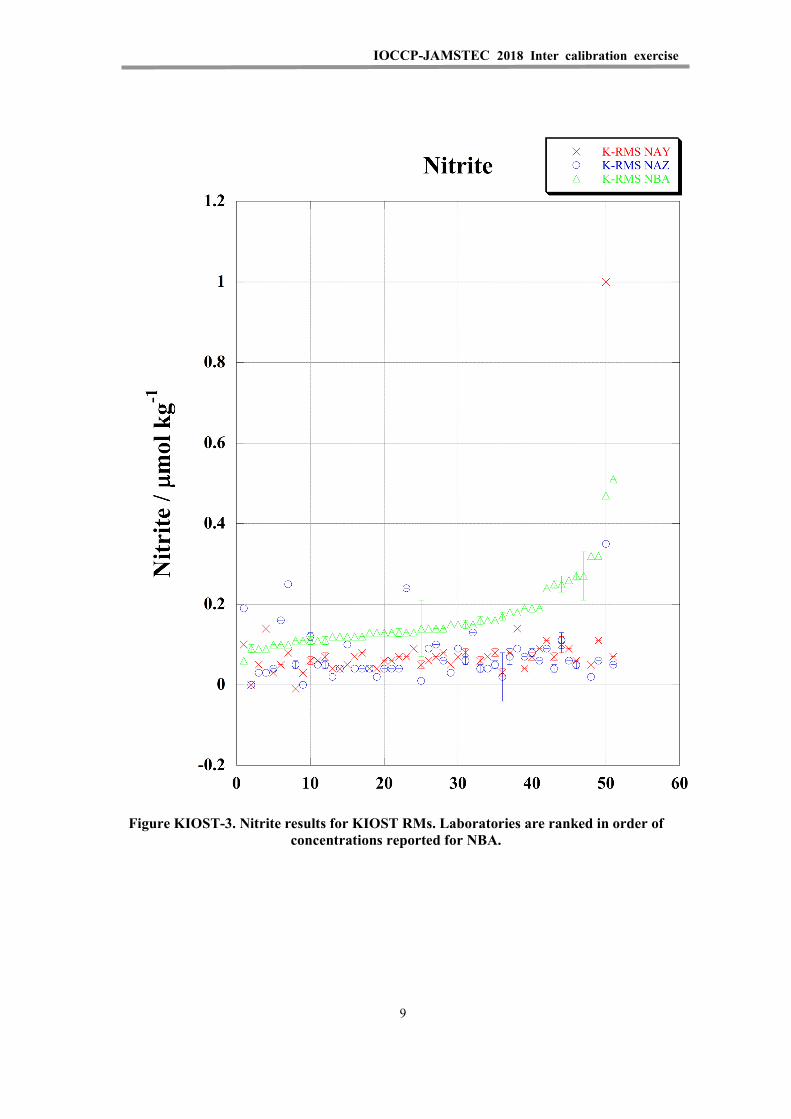
IOCCP-JAMSTEC 2018 Inter calibration exercise
Figure KIOST-3. Nitrite results for KIOST RMs. Laboratories are ranked in order of concentrations reported for NBA.
9
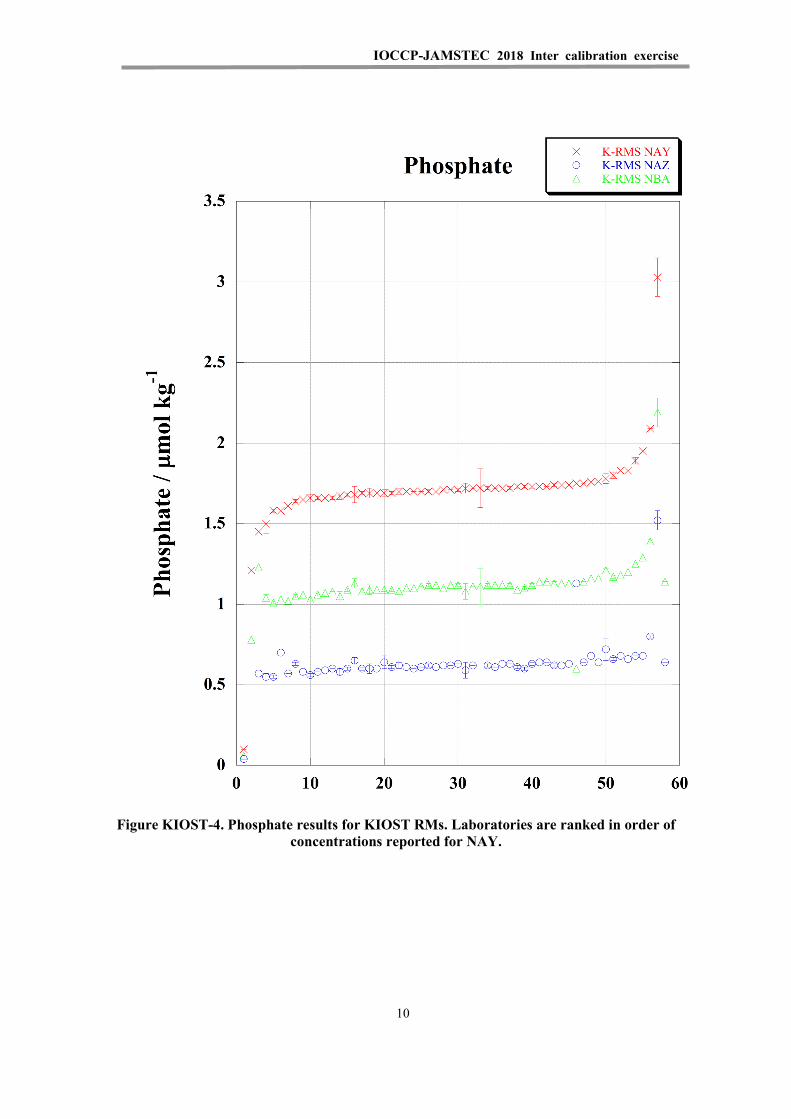
IOCCP-JAMSTEC 2018 Inter calibration exercise
Figure KIOST-4. Phosphate results for KIOST RMs. Laboratories are ranked in order of concentrations reported for NAY.
10
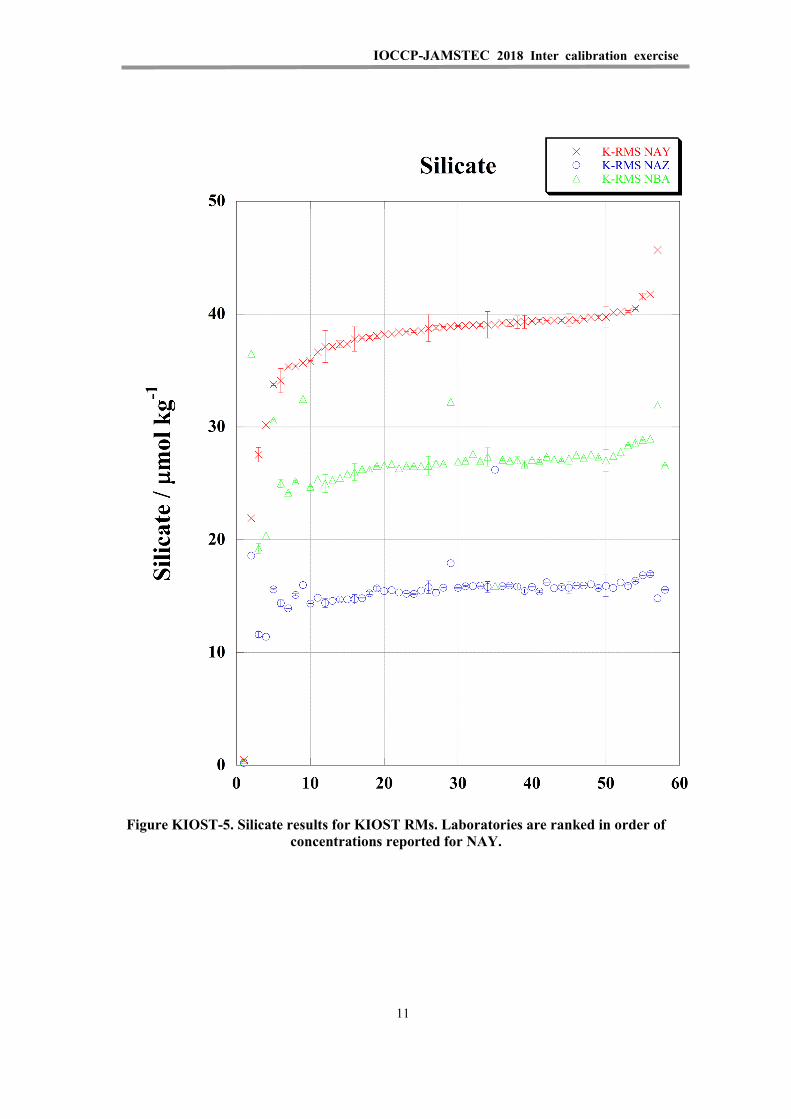
IOCCP-JAMSTEC 2018 Inter calibration exercise
Figure KIOST-5. Silicate results for KIOST RMs. Laboratories are ranked in order of concentrations reported for NAY.
11
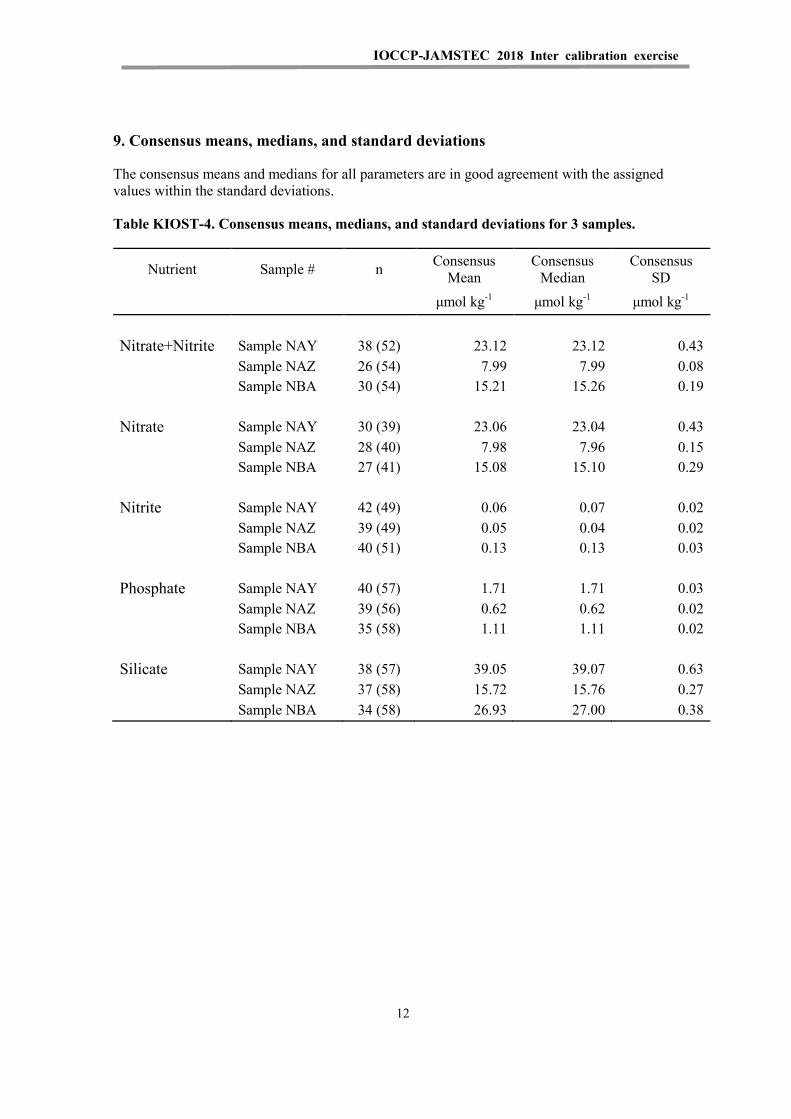
IOCCP-JAMSTEC 2018 Inter calibration exercise
9. Consensus means, medians, and standard deviations
The consensus means and medians for all parameters are in good agreement with the assigned values within the standard deviations.
Table KIOST-4. Consensus means, medians, and standard deviations for 3 samples.
Nutrient Sample # n Consensus Mean
Consensus Median
Consensus SD
μmol kg-1 μmol kg-1 μmol kg-1
Nitrate+Nitrite Sample NAY 38 (52) 23.12 23.12 0.43
Sample NAZ 26 (54) 7.99 7.99 0.08
Sample NBA 30 (54) 15.21 15.26 0.19
Nitrate Sample NAY 30 (39) 23.06 23.04 0.43
Sample NAZ 28 (40) 7.98 7.96 0.15
Sample NBA 27 (41) 15.08 15.10 0.29
Nitrite Sample NAY 42 (49) 0.06 0.07 0.02
Sample NAZ 39 (49) 0.05 0.04 0.02
Sample NBA 40 (51) 0.13 0.13 0.03
Phosphate Sample NAY 40 (57) 1.71 1.71 0.03
Sample NAZ 39 (56) 0.62 0.62 0.02
Sample NBA 35 (58) 1.11 1.11 0.02
Silicate Sample NAY 38 (57) 39.05 39.07 0.63
Sample NAZ 37 (58) 15.72 15.76 0.27 Sample NBA 34 (58) 26.93 27.00 0.38
12
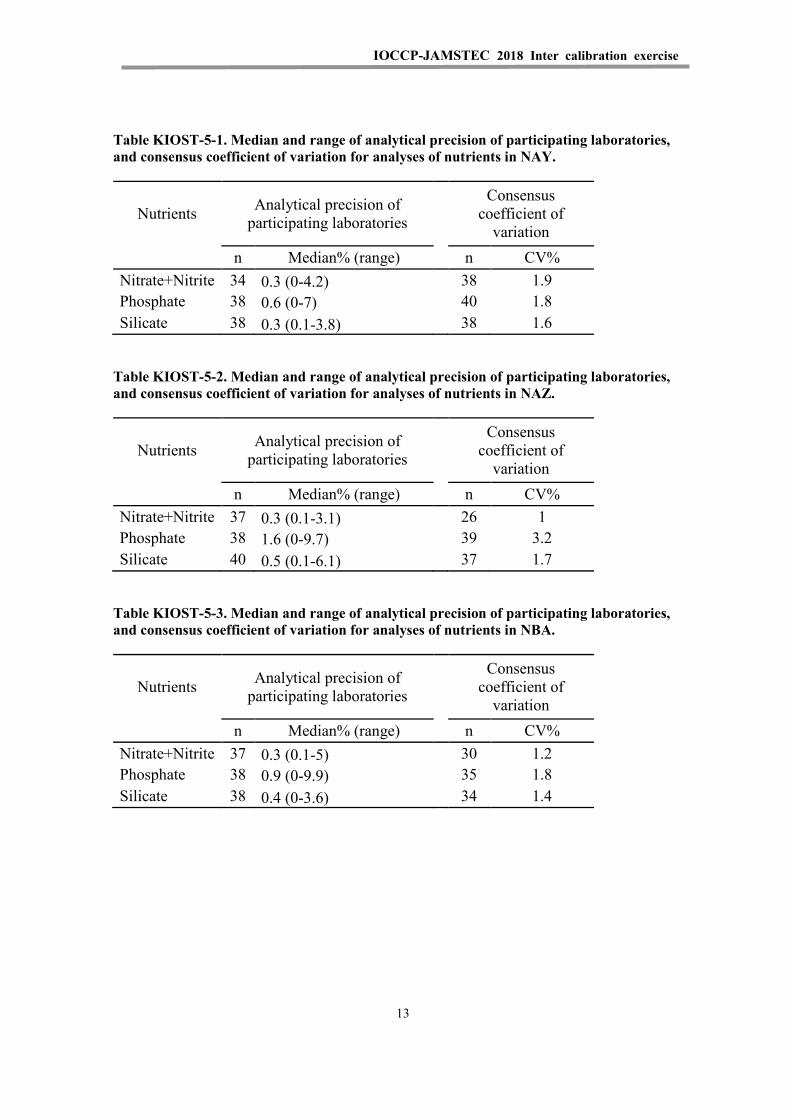
IOCCP-JAMSTEC 2018 Inter calibration exercise
Table KIOST-5-1. Median and range of analytical precision of participating laboratories, and consensus coefficient of variation for analyses of nutrients in NAY.
Nutrients Analytical precision of participating laboratories
Consensus coefficient of
variation n Median% (range) n CV% Nitrate+Nitrite 34 0.3 (0-4.2) 38 1.9 Phosphate 38 0.6 (0-7) 40 1.8 Silicate 38 0.3 (0.1-3.8) 38 1.6
Table KIOST-5-2. Median and range of analytical precision of participating laboratories, and consensus coefficient of variation for analyses of nutrients in NAZ.
Nutrients Analytical precision of participating laboratories
Consensus coefficient of
variation n Median% (range) n CV% Nitrate+Nitrite 37 0.3 (0.1-3.1) 26 1 Phosphate 38 1.6 (0-9.7) 39 3.2 Silicate 40 0.5 (0.1-6.1) 37 1.7
Table KIOST-5-3. Median and range of analytical precision of participating laboratories, and consensus coefficient of variation for analyses of nutrients in NBA.
Nutrients Analytical precision of participating laboratories
Consensus coefficient of
variation n Median% (range) n CV% Nitrate+Nitrite 37 0.3 (0.1-5) 30 1.2 Phosphate 38 0.9 (0-9.9) 35 1.8 Silicate 38 0.4 (0-3.6) 34 1.4
13
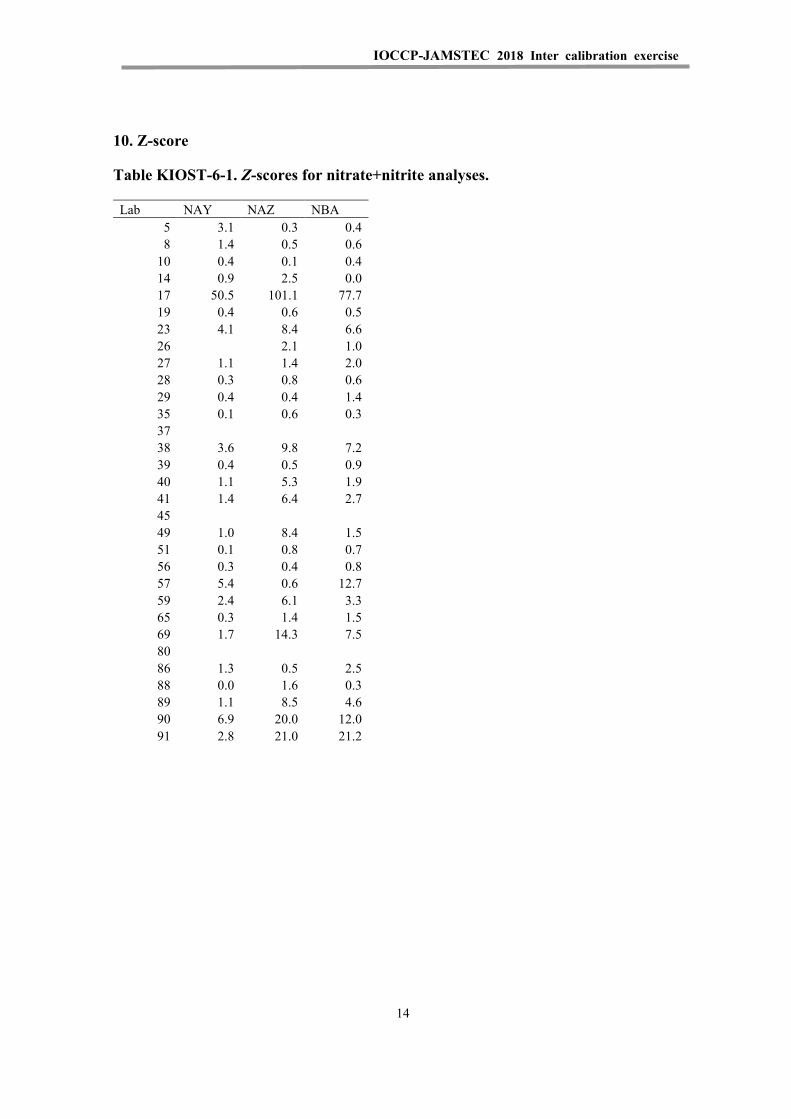
IOCCP-JAMSTEC 2018 Inter calibration exercise
10. Z-score
Table KIOST-6-1. Z-scores for nitrate+nitrite analyses.
Lab NAY NAZ NBA 5 3.1 0.3 0.4 8 1.4 0.5 0.6
10 0.4 0.1 0.4 14 0.9 2.5 0.0 17 50.5 101.1 77.7 19 0.4 0.6 0.5 23 4.1 8.4 6.6 26
2.1 1.0
27 1.1 1.4 2.0 28 0.3 0.8 0.6 29 0.4 0.4 1.4 35 0.1 0.6 0.3 37
38 3.6 9.8 7.2 39 0.4 0.5 0.9 40 1.1 5.3 1.9 41 1.4 6.4 2.7 45
49 1.0 8.4 1.5 51 0.1 0.8 0.7 56 0.3 0.4 0.8 57 5.4 0.6 12.7 59 2.4 6.1 3.3 65 0.3 1.4 1.5 69 1.7 14.3 7.5 80
86 1.3 0.5 2.5 88 0.0 1.6 0.3 89 1.1 8.5 4.6 90 6.9 20.0 12.0 91 2.8 21.0 21.2
14
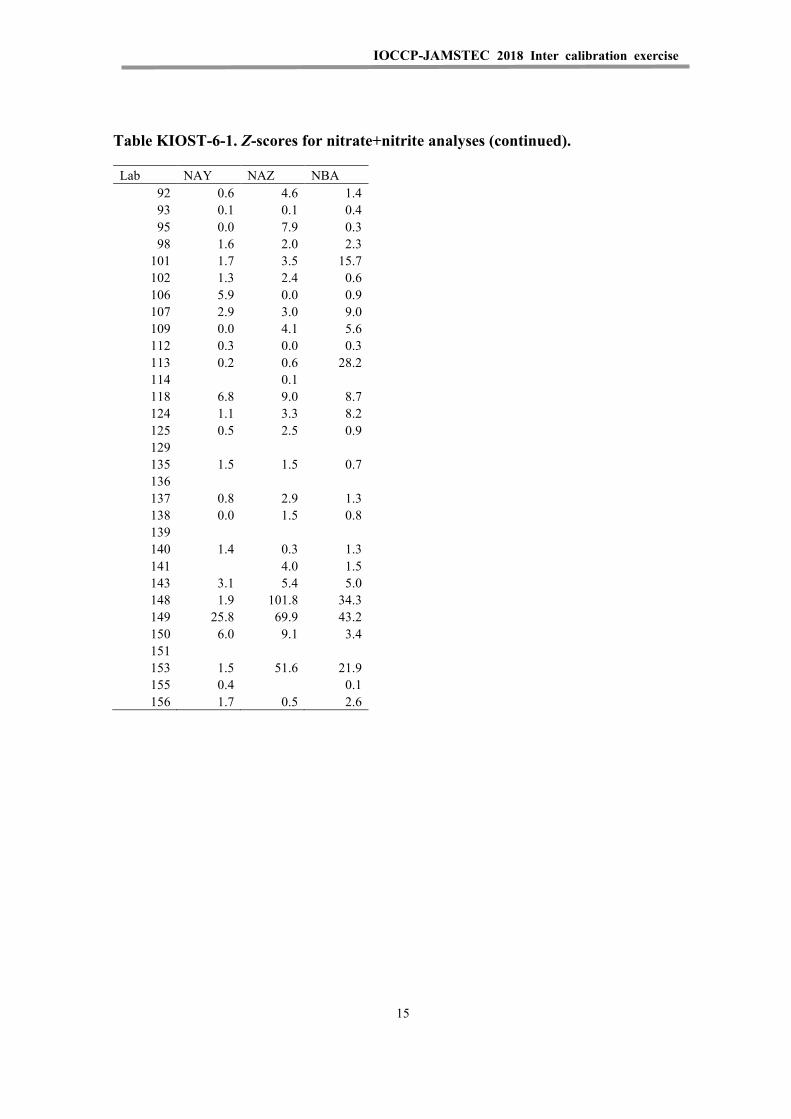
IOCCP-JAMSTEC 2018 Inter calibration exercise
Table KIOST-6-1. Z-scores for nitrate+nitrite analyses (continued).
Lab NAY NAZ NBA 92 0.6 4.6 1.4 93 0.1 0.1 0.4 95 0.0 7.9 0.3 98 1.6 2.0 2.3
101 1.7 3.5 15.7 102 1.3 2.4 0.6 106 5.9 0.0 0.9 107 2.9 3.0 9.0 109 0.0 4.1 5.6 112 0.3 0.0 0.3 113 0.2 0.6 28.2 114
0.1
118 6.8 9.0 8.7 124 1.1 3.3 8.2 125 0.5 2.5 0.9 129
135 1.5 1.5 0.7 136
137 0.8 2.9 1.3 138 0.0 1.5 0.8 139
140 1.4 0.3 1.3 141
4.0 1.5
143 3.1 5.4 5.0 148 1.9 101.8 34.3 149 25.8 69.9 43.2 150 6.0 9.1 3.4 151
153 1.5 51.6 21.9 155 0.4
0.1
156 1.7 0.5 2.6
15
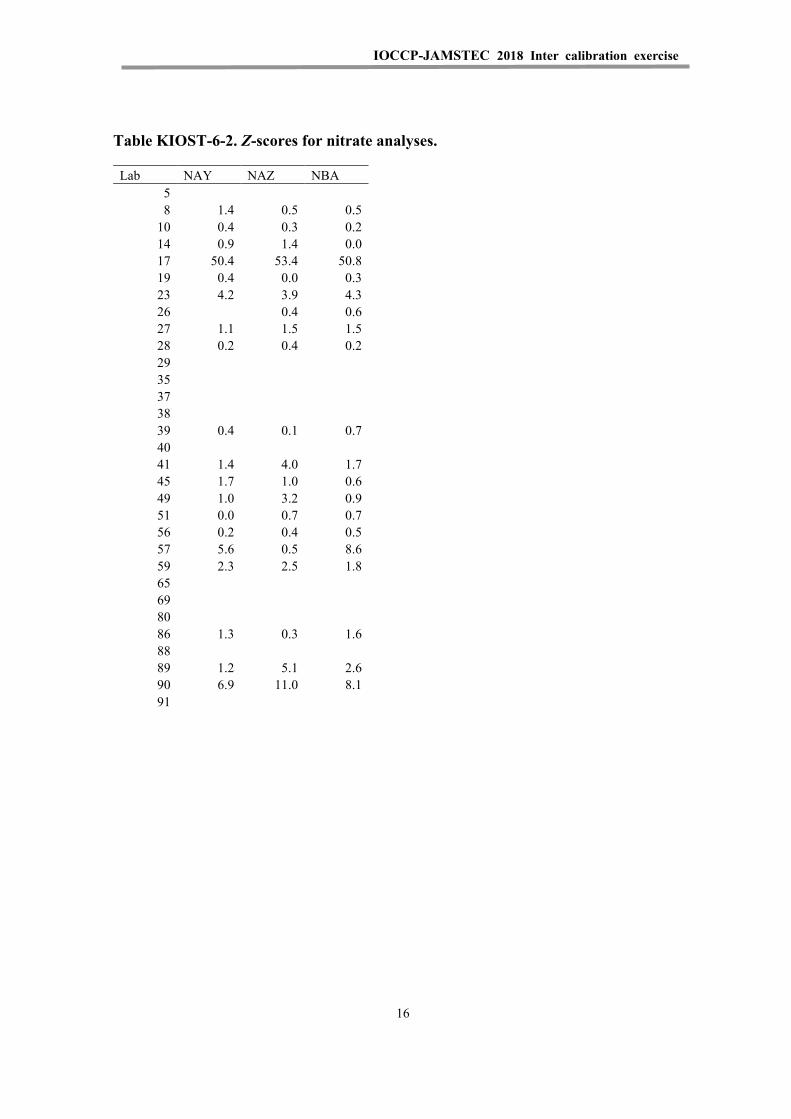
IOCCP-JAMSTEC 2018 Inter calibration exercise
Table KIOST-6-2. Z-scores for nitrate analyses.
Lab NAY NAZ NBA 5 8 1.4 0.5 0.5
10 0.4 0.3 0.2 14 0.9 1.4 0.0 17 50.4 53.4 50.8 19 0.4 0.0 0.3 23 4.2 3.9 4.3 26
0.4 0.6
27 1.1 1.5 1.5 28 0.2 0.4 0.2 29
35 37 38 39 0.4 0.1 0.7
40 41 1.4 4.0 1.7
45 1.7 1.0 0.6 49 1.0 3.2 0.9 51 0.0 0.7 0.7 56 0.2 0.4 0.5 57 5.6 0.5 8.6 59 2.3 2.5 1.8 65
69 80 86 1.3 0.3 1.6
88 89 1.2 5.1 2.6
90 6.9 11.0 8.1 91
16
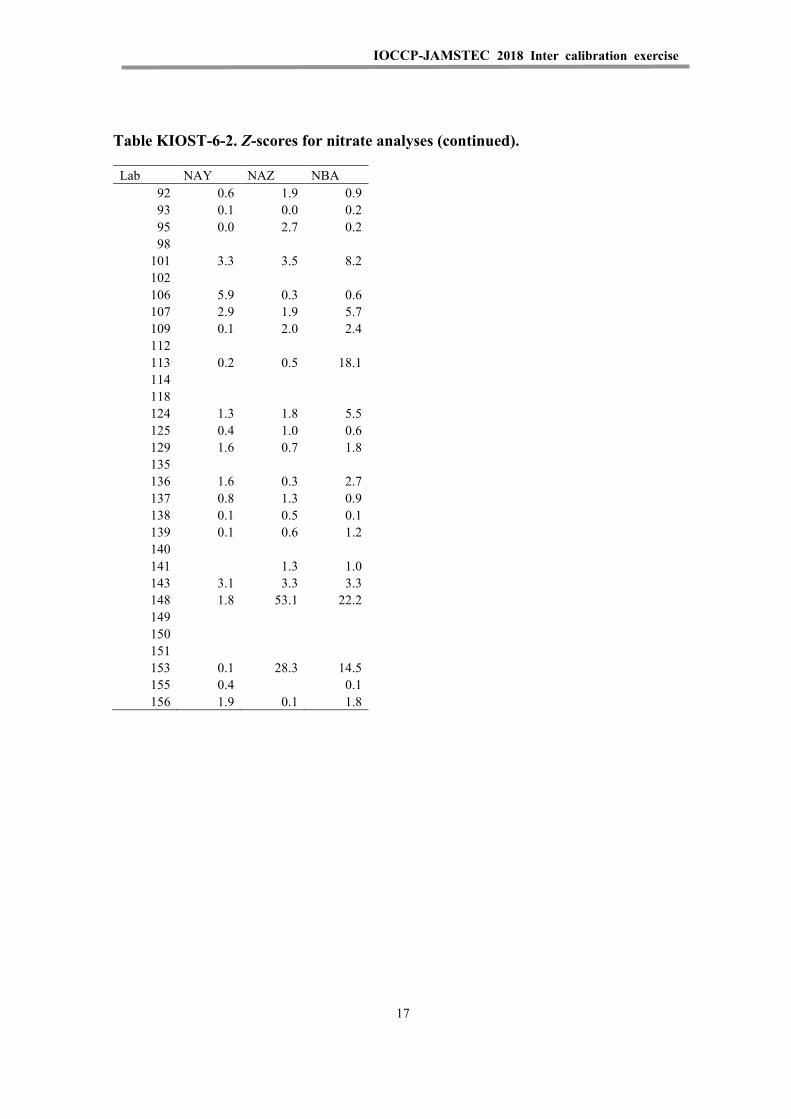
IOCCP-JAMSTEC 2018 Inter calibration exercise
Table KIOST-6-2. Z-scores for nitrate analyses (continued).
Lab NAY NAZ NBA 92 0.6 1.9 0.9 93 0.1 0.0 0.2 95 0.0 2.7 0.2 98
101 3.3 3.5 8.2 102
106 5.9 0.3 0.6 107 2.9 1.9 5.7 109 0.1 2.0 2.4 112
113 0.2 0.5 18.1 114
118 124 1.3 1.8 5.5
125 0.4 1.0 0.6 129 1.6 0.7 1.8 135
136 1.6 0.3 2.7 137 0.8 1.3 0.9 138 0.1 0.5 0.1 139 0.1 0.6 1.2 140
141
1.3 1.0 143 3.1 3.3 3.3 148 1.8 53.1 22.2 149
150 151 153 0.1 28.3 14.5
155 0.4
0.1 156 1.9 0.1 1.8
17
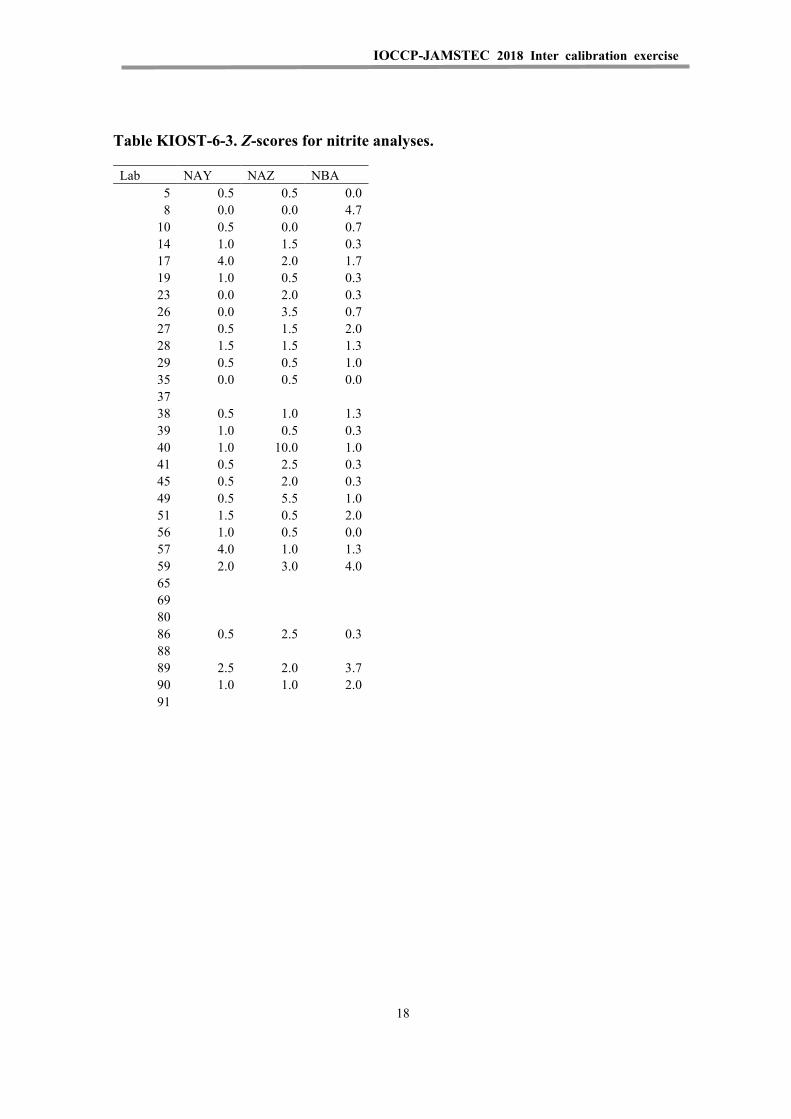
IOCCP-JAMSTEC 2018 Inter calibration exercise
Table KIOST-6-3. Z-scores for nitrite analyses.
Lab NAY NAZ NBA 5 0.5 0.5 0.0 8 0.0 0.0 4.7
10 0.5 0.0 0.7 14 1.0 1.5 0.3 17 4.0 2.0 1.7 19 1.0 0.5 0.3 23 0.0 2.0 0.3 26 0.0 3.5 0.7 27 0.5 1.5 2.0 28 1.5 1.5 1.3 29 0.5 0.5 1.0 35 0.0 0.5 0.0 37
38 0.5 1.0 1.3 39 1.0 0.5 0.3 40 1.0 10.0 1.0 41 0.5 2.5 0.3 45 0.5 2.0 0.3 49 0.5 5.5 1.0 51 1.5 0.5 2.0 56 1.0 0.5 0.0 57 4.0 1.0 1.3 59 2.0 3.0 4.0 65
69 80 86 0.5 2.5 0.3
88 89 2.5 2.0 3.7
90 1.0 1.0 2.0 91
18
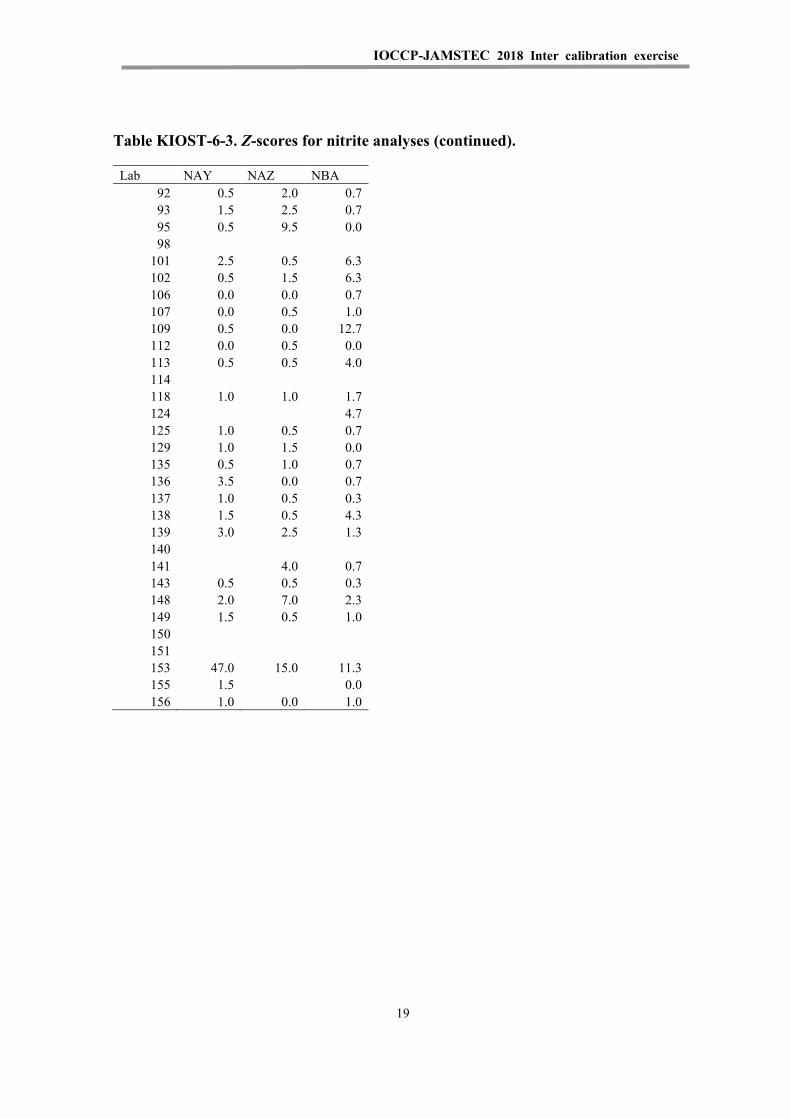
IOCCP-JAMSTEC 2018 Inter calibration exercise
Table KIOST-6-3. Z-scores for nitrite analyses (continued).
Lab NAY NAZ NBA 92 0.5 2.0 0.7 93 1.5 2.5 0.7 95 0.5 9.5 0.0 98
101 2.5 0.5 6.3 102 0.5 1.5 6.3 106 0.0 0.0 0.7 107 0.0 0.5 1.0 109 0.5 0.0 12.7 112 0.0 0.5 0.0 113 0.5 0.5 4.0 114
118 1.0 1.0 1.7 124
4.7
125 1.0 0.5 0.7 129 1.0 1.5 0.0 135 0.5 1.0 0.7 136 3.5 0.0 0.7 137 1.0 0.5 0.3 138 1.5 0.5 4.3 139 3.0 2.5 1.3 140
141
4.0 0.7 143 0.5 0.5 0.3 148 2.0 7.0 2.3 149 1.5 0.5 1.0 150
151 153 47.0 15.0 11.3
155 1.5
0.0 156 1.0 0.0 1.0
19
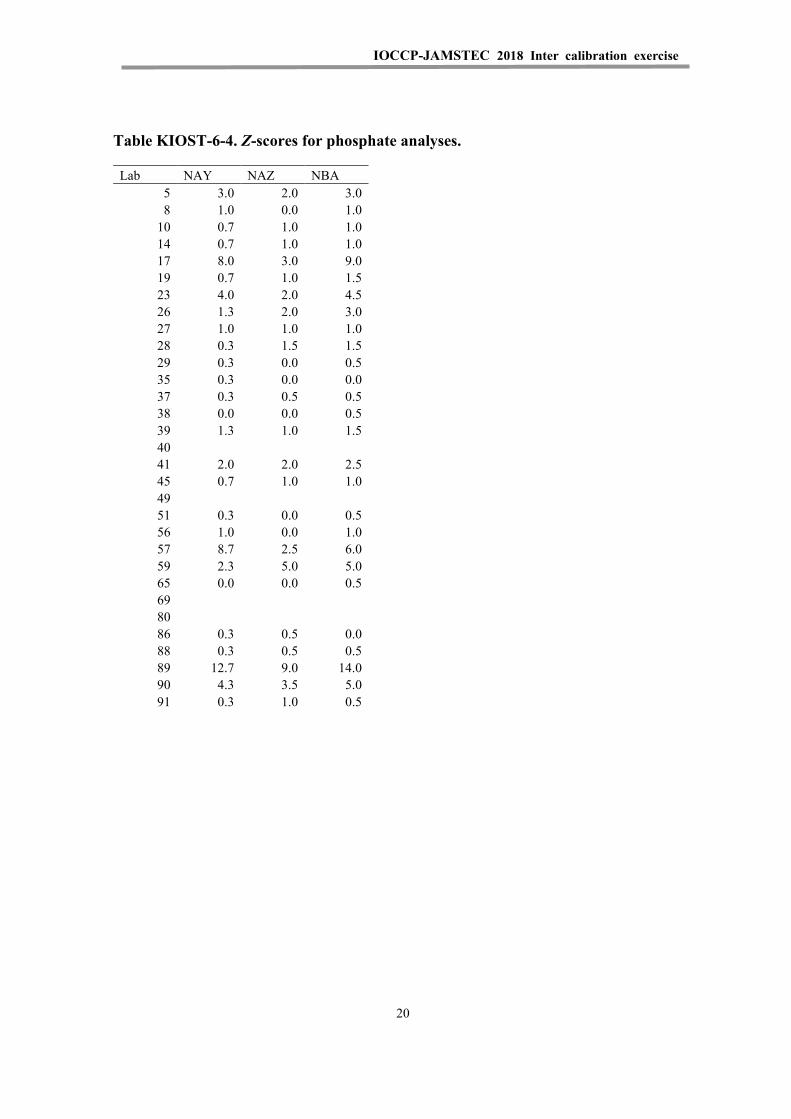
IOCCP-JAMSTEC 2018 Inter calibration exercise
Table KIOST-6-4. Z-scores for phosphate analyses.
Lab NAY NAZ NBA 5 3.0 2.0 3.0 8 1.0 0.0 1.0
10 0.7 1.0 1.0 14 0.7 1.0 1.0 17 8.0 3.0 9.0 19 0.7 1.0 1.5 23 4.0 2.0 4.5 26 1.3 2.0 3.0 27 1.0 1.0 1.0 28 0.3 1.5 1.5 29 0.3 0.0 0.5 35 0.3 0.0 0.0 37 0.3 0.5 0.5 38 0.0 0.0 0.5 39 1.3 1.0 1.5 40
41 2.0 2.0 2.5 45 0.7 1.0 1.0 49
51 0.3 0.0 0.5 56 1.0 0.0 1.0 57 8.7 2.5 6.0 59 2.3 5.0 5.0 65 0.0 0.0 0.5 69
80 86 0.3 0.5 0.0
88 0.3 0.5 0.5 89 12.7 9.0 14.0 90 4.3 3.5 5.0 91 0.3 1.0 0.5
20

IOCCP-JAMSTEC 2018 Inter calibration exercise
Table KIOST-6-4. Z-scores for phosphate analyses (continued).
Lab NAY NAZ NBA 92 0.3 0.5 0.5 93 1.7 1.0 1.5 95 1.7 3.0 4.0 98 44.0 45.0 54.0
101 7.0 3.5 3.5 102 6.0 3.0 7.0 106 4.0 3.0 3.5 107 1.0 1.5 1.0 109 0.0 0.5 0.5 112 0.3 0.5 0.5 113 0.3 0.0 1.5 114 1.7 1.5 2.0 118 0.7 0.5 1.0 124 0.7 0.5 0.5 125 2.3 0.5 3.0 129 1.7 3.0 2.5 135 0.3 0.5 0.5 136 1.7 2.0 2.5 137 1.0 0.5 1.0 138 0.7 1.0 1.5 139 0.7 0.5 1.0 140 0.7 1.0 0.5 141
1.0 1.5
143 1.7 1.0 2.5 148 1.3 25.5 25.5 149 3.3 2.5 4.5 150 4.3 4.0 4.0 151 53.7 29.0 52.5 153 16.7
16.5
155 0.3
0.0 156 0.7 1.0 1.5
21
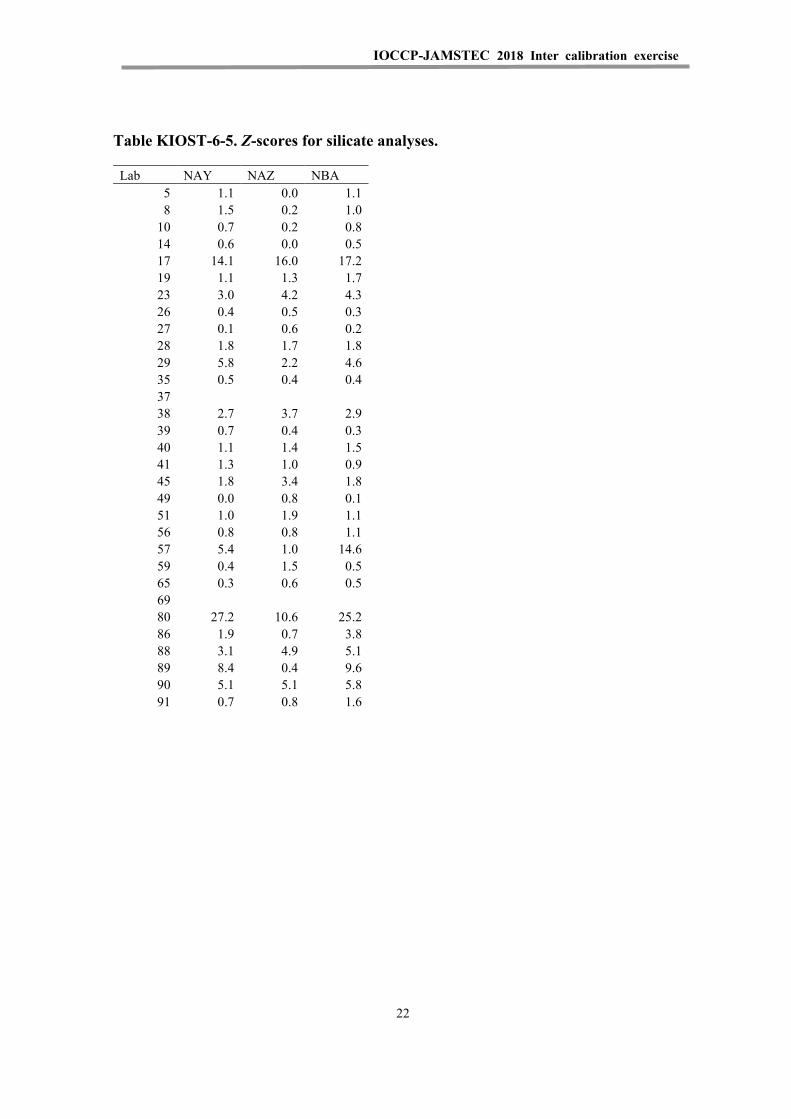
IOCCP-JAMSTEC 2018 Inter calibration exercise
Table KIOST-6-5. Z-scores for silicate analyses.
Lab NAY NAZ NBA 5 1.1 0.0 1.1 8 1.5 0.2 1.0
10 0.7 0.2 0.8 14 0.6 0.0 0.5 17 14.1 16.0 17.2 19 1.1 1.3 1.7 23 3.0 4.2 4.3 26 0.4 0.5 0.3 27 0.1 0.6 0.2 28 1.8 1.7 1.8 29 5.8 2.2 4.6 35 0.5 0.4 0.4 37
38 2.7 3.7 2.9 39 0.7 0.4 0.3 40 1.1 1.4 1.5 41 1.3 1.0 0.9 45 1.8 3.4 1.8 49 0.0 0.8 0.1 51 1.0 1.9 1.1 56 0.8 0.8 1.1 57 5.4 1.0 14.6 59 0.4 1.5 0.5 65 0.3 0.6 0.5 69
80 27.2 10.6 25.2 86 1.9 0.7 3.8 88 3.1 4.9 5.1 89 8.4 0.4 9.6 90 5.1 5.1 5.8 91 0.7 0.8 1.6
22

IOCCP-JAMSTEC 2018 Inter calibration exercise
Table KIOST-6-5. Z-scores for silicate analyses (continued).
Lab NAY NAZ NBA 92 1.8 1.9 2.2 93 0.3 0.1 0.5 95 0.5 0.3 1.0 98 18.3 15.3 20.2
101 7.8 5.0 5.1 102 4.3 4.6 5.3 106 10.6 3.4 13.1 107 2.0 3.7 2.5 109 4.0 4.2 5.1 112 0.9 0.9 0.8 113 1.1 0.7 0.3 114
118 2.7 3.8 3.8 124 0.6 1.1 0.1 125 0.2 0.1 0.0 129 1.3 0.7 0.6 135 0.0 0.6 1.8 136 2.3 2.4 4.4 137 1.8 0.0 1.3 138 0.6 2.0 1.2 139 1.0 1.9 1.1 140 0.4 1.0 0.7 141
0.6 0.8
143 148 0.1 38.9 29.0
149 5.9 6.7 7.2 150 3.8 3.2 4.1 151 61.2 57.4 70.0 153 0.2 8.2 14.0 155 0.0 0.4 1.1 156 0.3 0.9 0.2
23
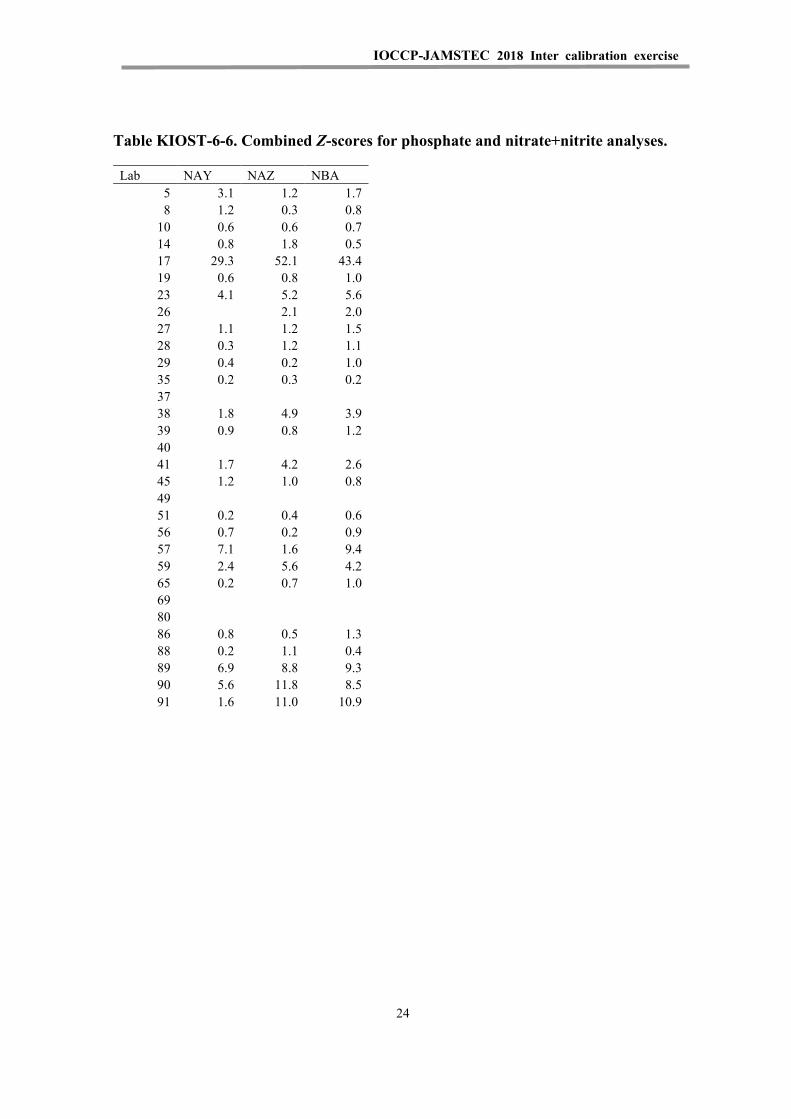
IOCCP-JAMSTEC 2018 Inter calibration exercise
Table KIOST-6-6. Combined Z-scores for phosphate and nitrate+nitrite analyses.
Lab NAY NAZ NBA 5 3.1 1.2 1.7 8 1.2 0.3 0.8
10 0.6 0.6 0.7 14 0.8 1.8 0.5 17 29.3 52.1 43.4 19 0.6 0.8 1.0 23 4.1 5.2 5.6 26
2.1 2.0
27 1.1 1.2 1.5 28 0.3 1.2 1.1 29 0.4 0.2 1.0 35 0.2 0.3 0.2 37
38 1.8 4.9 3.9 39 0.9 0.8 1.2 40
41 1.7 4.2 2.6 45 1.2 1.0 0.8 49
51 0.2 0.4 0.6 56 0.7 0.2 0.9 57 7.1 1.6 9.4 59 2.4 5.6 4.2 65 0.2 0.7 1.0 69
80 86 0.8 0.5 1.3
88 0.2 1.1 0.4 89 6.9 8.8 9.3 90 5.6 11.8 8.5 91 1.6 11.0 10.9
24
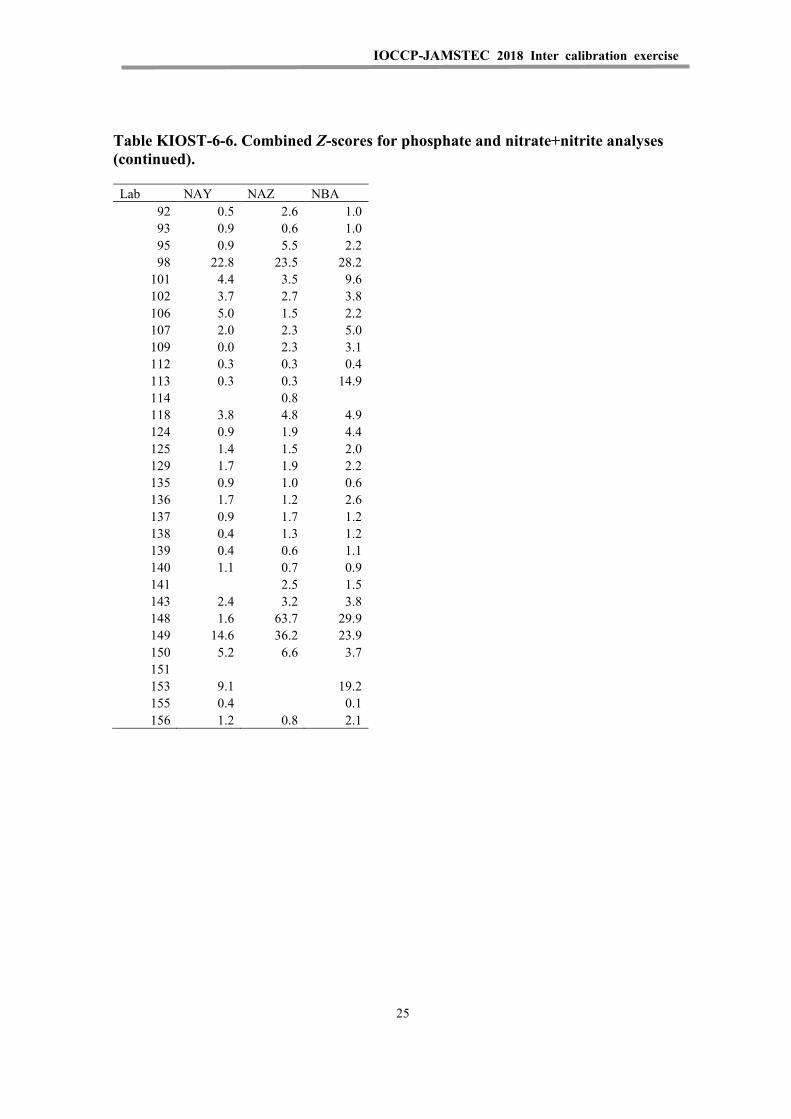
IOCCP-JAMSTEC 2018 Inter calibration exercise
Table KIOST-6-6. Combined Z-scores for phosphate and nitrate+nitrite analyses (continued).
Lab NAY NAZ NBA 92 0.5 2.6 1.0 93 0.9 0.6 1.0 95 0.9 5.5 2.2 98 22.8 23.5 28.2
101 4.4 3.5 9.6 102 3.7 2.7 3.8 106 5.0 1.5 2.2 107 2.0 2.3 5.0 109 0.0 2.3 3.1 112 0.3 0.3 0.4 113 0.3 0.3 14.9 114
0.8
118 3.8 4.8 4.9 124 0.9 1.9 4.4 125 1.4 1.5 2.0 129 1.7 1.9 2.2 135 0.9 1.0 0.6 136 1.7 1.2 2.6 137 0.9 1.7 1.2 138 0.4 1.3 1.2 139 0.4 0.6 1.1 140 1.1 0.7 0.9 141
2.5 1.5
143 2.4 3.2 3.8 148 1.6 63.7 29.9 149 14.6 36.2 23.9 150 5.2 6.6 3.7 151
153 9.1
19.2 155 0.4
0.1
156 1.2 0.8 2.1
25
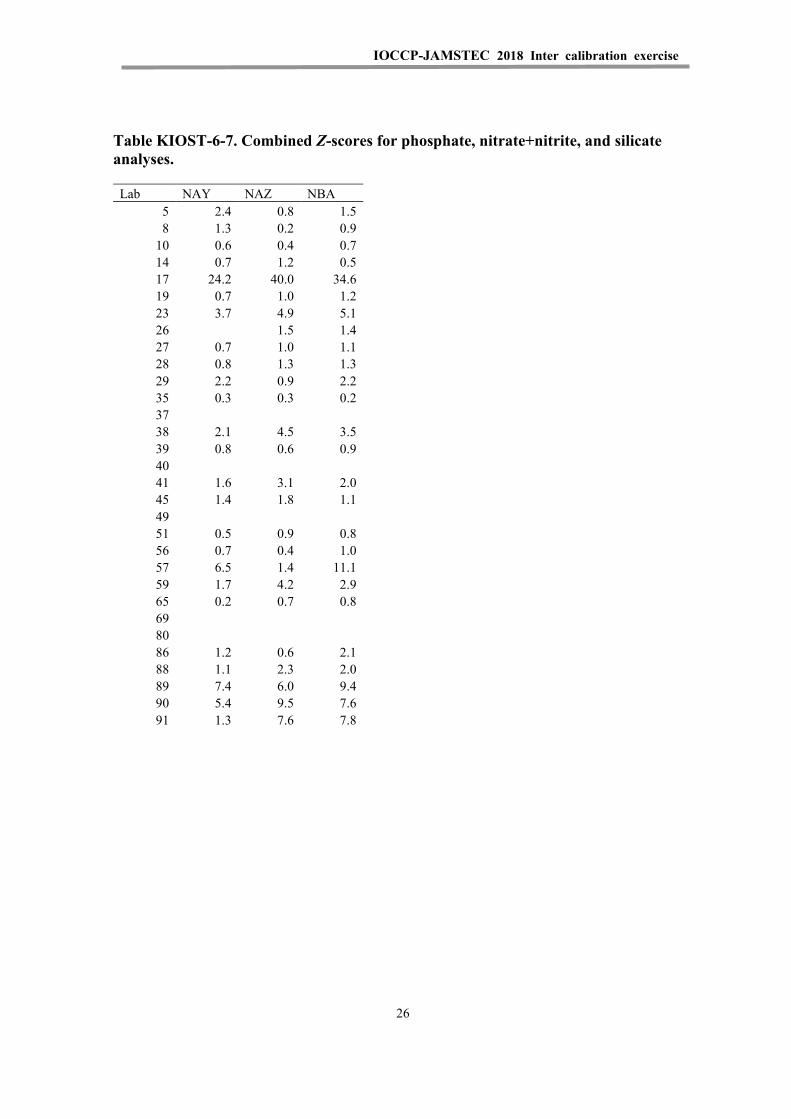
IOCCP-JAMSTEC 2018 Inter calibration exercise
Table KIOST-6-7. Combined Z-scores for phosphate, nitrate+nitrite, and silicate analyses.
Lab NAY NAZ NBA 5 2.4 0.8 1.5 8 1.3 0.2 0.9
10 0.6 0.4 0.7 14 0.7 1.2 0.5 17 24.2 40.0 34.6 19 0.7 1.0 1.2 23 3.7 4.9 5.1 26
1.5 1.4
27 0.7 1.0 1.1 28 0.8 1.3 1.3 29 2.2 0.9 2.2 35 0.3 0.3 0.2 37
38 2.1 4.5 3.5 39 0.8 0.6 0.9 40
41 1.6 3.1 2.0 45 1.4 1.8 1.1 49
51 0.5 0.9 0.8 56 0.7 0.4 1.0 57 6.5 1.4 11.1 59 1.7 4.2 2.9 65 0.2 0.7 0.8 69
80 86 1.2 0.6 2.1
88 1.1 2.3 2.0 89 7.4 6.0 9.4 90 5.4 9.5 7.6 91 1.3 7.6 7.8
26
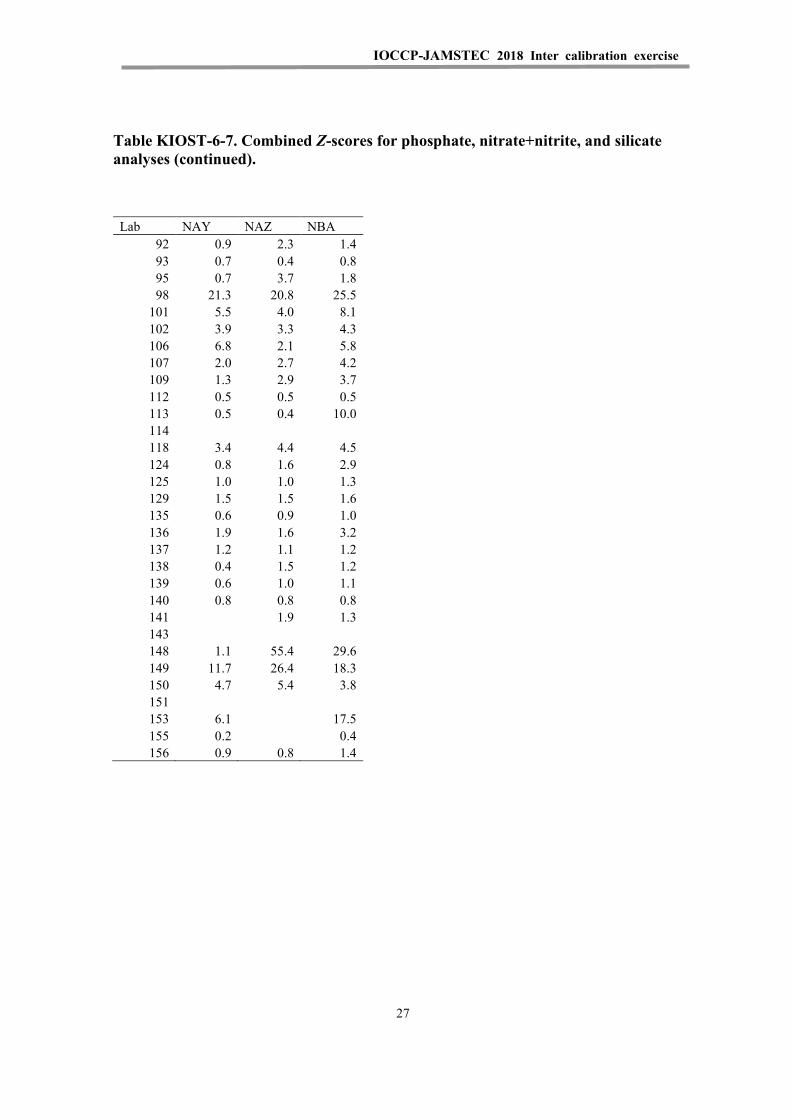
IOCCP-JAMSTEC 2018 Inter calibration exercise
Table KIOST-6-7. Combined Z-scores for phosphate, nitrate+nitrite, and silicate analyses (continued).
Lab NAY NAZ NBA 92 0.9 2.3 1.4 93 0.7 0.4 0.8 95 0.7 3.7 1.8 98 21.3 20.8 25.5
101 5.5 4.0 8.1 102 3.9 3.3 4.3 106 6.8 2.1 5.8 107 2.0 2.7 4.2 109 1.3 2.9 3.7 112 0.5 0.5 0.5 113 0.5 0.4 10.0 114
118 3.4 4.4 4.5 124 0.8 1.6 2.9 125 1.0 1.0 1.3 129 1.5 1.5 1.6 135 0.6 0.9 1.0 136 1.9 1.6 3.2 137 1.2 1.1 1.2 138 0.4 1.5 1.2 139 0.6 1.0 1.1 140 0.8 0.8 0.8 141
1.9 1.3
143 148 1.1 55.4 29.6
149 11.7 26.4 18.3 150 4.7 5.4 3.8 151
153 6.1
17.5 155 0.2
0.4
156 0.9 0.8 1.4
27
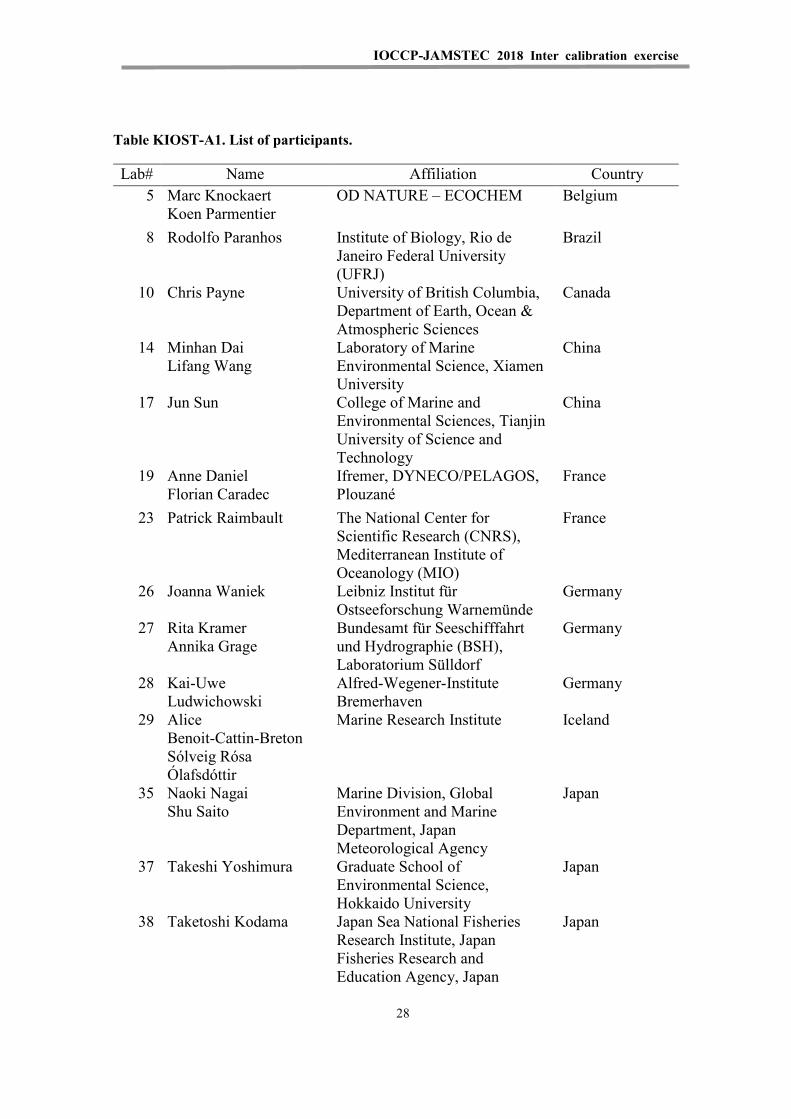
IOCCP-JAMSTEC 2018 Inter calibration exercise
Table KIOST-A1. List of participants.
Lab# Name Affiliation Country 5 Marc Knockaert
Koen Parmentier OD NATURE – ECOCHEM Belgium
8 Rodolfo Paranhos Institute of Biology, Rio de Janeiro Federal University (UFRJ)
Brazil
10 Chris Payne University of British Columbia, Department of Earth, Ocean & Atmospheric Sciences
Canada
14 Minhan Dai Lifang Wang
Laboratory of Marine Environmental Science, Xiamen University
China
17 Jun Sun College of Marine and Environmental Sciences, Tianjin University of Science and Technology
China
19 Anne Daniel Florian Caradec
Ifremer, DYNECO/PELAGOS, Plouzané
France
23 Patrick Raimbault The National Center for Scientific Research (CNRS), Mediterranean Institute of Oceanology (MIO)
France
26 Joanna Waniek Leibniz Institut für Ostseeforschung Warnemünde
Germany
27 Rita Kramer Annika Grage
Bundesamt für Seeschifffahrt und Hydrographie (BSH), Laboratorium Sülldorf
Germany
28 Kai-Uwe Ludwichowski
Alfred-Wegener-Institute Bremerhaven
Germany
29 Alice Benoit-Cattin-Breton Sólveig Rósa Ólafsdóttir
Marine Research Institute Iceland
35 Naoki Nagai Shu Saito
Marine Division, Global Environment and Marine Department, Japan Meteorological Agency
Japan
37 Takeshi Yoshimura Graduate School of Environmental Science, Hokkaido University
Japan
38 Taketoshi Kodama Japan Sea National Fisheries Research Institute, Japan Fisheries Research and Education Agency, Japan
Japan
28
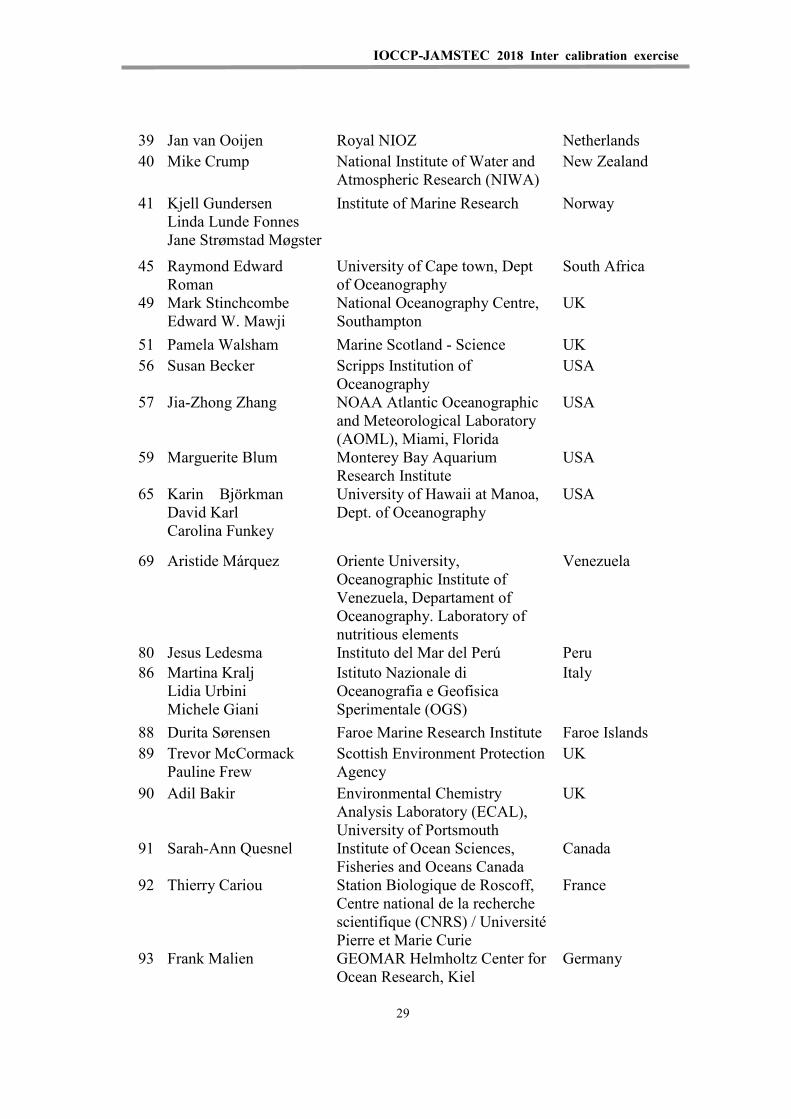
IOCCP-JAMSTEC 2018 Inter calibration exercise
39 Jan van Ooijen Royal NIOZ Netherlands 40 Mike Crump National Institute of Water and
Atmospheric Research (NIWA) New Zealand
41 Kjell Gundersen Linda Lunde Fonnes Jane Strømstad Møgster
Institute of Marine Research Norway
45 Raymond Edward Roman
University of Cape town, Dept of Oceanography
South Africa
49 Mark Stinchcombe Edward W. Mawji
National Oceanography Centre, Southampton
UK
51 Pamela Walsham Marine Scotland - Science UK 56 Susan Becker Scripps Institution of
Oceanography USA
57 Jia-Zhong Zhang NOAA Atlantic Oceanographic and Meteorological Laboratory (AOML), Miami, Florida
USA
59 Marguerite Blum Monterey Bay Aquarium Research Institute
USA
65 Karin Björkman David Karl Carolina Funkey
University of Hawaii at Manoa, Dept. of Oceanography
USA
69 Aristide Márquez Oriente University, Oceanographic Institute of Venezuela, Departament of Oceanography. Laboratory of nutritious elements
Venezuela
80 Jesus Ledesma Instituto del Mar del Perú Peru 86 Martina Kralj
Lidia Urbini Michele Giani
Istituto Nazionale di Oceanografia e Geofisica Sperimentale (OGS)
Italy
88 Durita Sørensen Faroe Marine Research Institute Faroe Islands 89 Trevor McCormack
Pauline Frew Scottish Environment Protection Agency
UK
90 Adil Bakir Environmental Chemistry Analysis Laboratory (ECAL), University of Portsmouth
UK
91 Sarah-Ann Quesnel Institute of Ocean Sciences, Fisheries and Oceans Canada
Canada
92 Thierry Cariou Station Biologique de Roscoff, Centre national de la recherche scientifique (CNRS) / Université Pierre et Marie Curie
France
93 Frank Malien GEOMAR Helmholtz Center for Ocean Research, Kiel
Germany
29
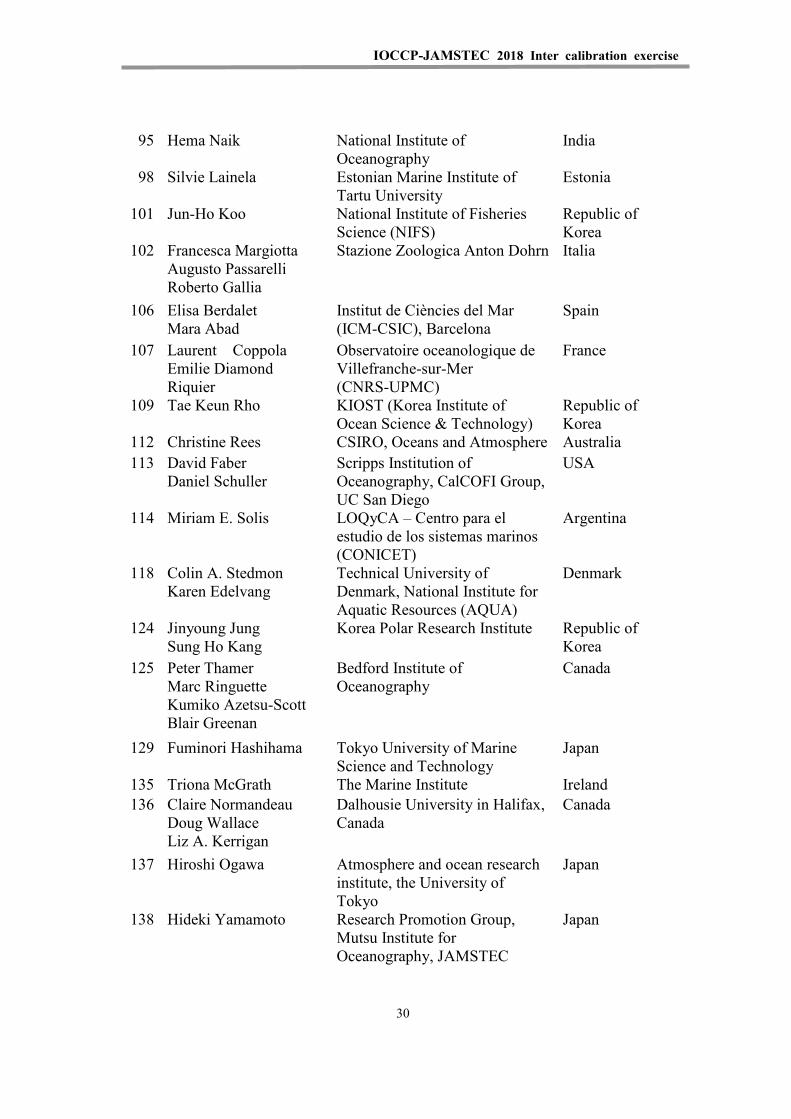
IOCCP-JAMSTEC 2018 Inter calibration exercise
95 Hema Naik National Institute of Oceanography
India
98 Silvie Lainela Estonian Marine Institute of Tartu University
Estonia
101 Jun-Ho Koo National Institute of Fisheries Science (NIFS)
Republic of Korea
102 Francesca Margiotta Augusto Passarelli Roberto Gallia
Stazione Zoologica Anton Dohrn Italia
106 Elisa Berdalet Mara Abad
Institut de Ciències del Mar (ICM-CSIC), Barcelona
Spain
107 Laurent Coppola Emilie Diamond Riquier
Observatoire oceanologique de Villefranche-sur-Mer (CNRS-UPMC)
France
109 Tae Keun Rho KIOST (Korea Institute of Ocean Science & Technology)
Republic of Korea
112 Christine Rees CSIRO, Oceans and Atmosphere Australia 113 David Faber
Daniel Schuller Scripps Institution of Oceanography, CalCOFI Group, UC San Diego
USA
114 Miriam E. Solis LOQyCA – Centro para el estudio de los sistemas marinos (CONICET)
Argentina
118 Colin A. Stedmon Karen Edelvang
Technical University of Denmark, National Institute for Aquatic Resources (AQUA)
Denmark
124 Jinyoung Jung Sung Ho Kang
Korea Polar Research Institute Republic of Korea
125 Peter Thamer Marc Ringuette Kumiko Azetsu-Scott Blair Greenan
Bedford Institute of Oceanography
Canada
129 Fuminori Hashihama Tokyo University of Marine Science and Technology
Japan
135 Triona McGrath The Marine Institute Ireland 136 Claire Normandeau
Doug Wallace Liz A. Kerrigan
Dalhousie University in Halifax, Canada
Canada
137 Hiroshi Ogawa Atmosphere and ocean research institute, the University of Tokyo
Japan
138 Hideki Yamamoto Research Promotion Group, Mutsu Institute for Oceanography, JAMSTEC
Japan
30
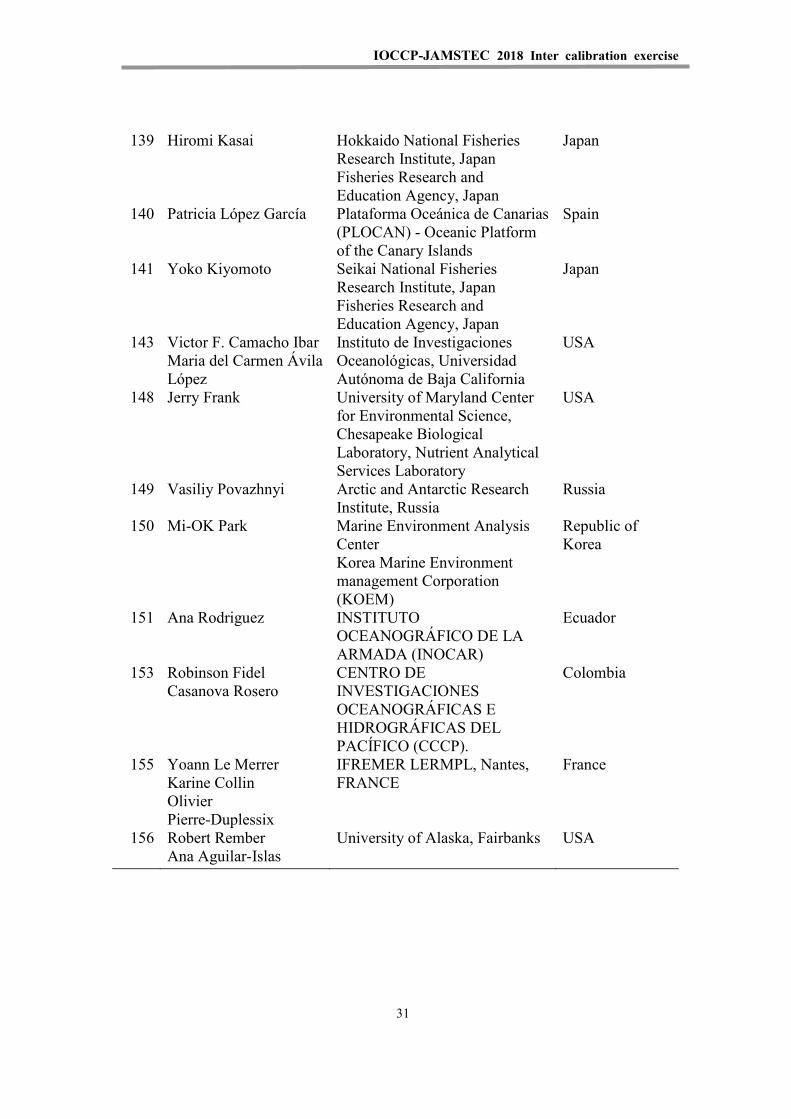
IOCCP-JAMSTEC 2018 Inter calibration exercise
139 Hiromi Kasai Hokkaido National Fisheries Research Institute, Japan Fisheries Research and Education Agency, Japan
Japan
140 Patricia López García Plataforma Oceánica de Canarias (PLOCAN) - Oceanic Platform of the Canary Islands
Spain
141 Yoko Kiyomoto Seikai National Fisheries Research Institute, Japan Fisheries Research and Education Agency, Japan
Japan
143 Victor F. Camacho Ibar Maria del Carmen Ávila López
Instituto de Investigaciones Oceanológicas, Universidad Autónoma de Baja California
USA
148 Jerry Frank University of Maryland Center for Environmental Science, Chesapeake Biological Laboratory, Nutrient Analytical Services Laboratory
USA
149 Vasiliy Povazhnyi Arctic and Antarctic Research Institute, Russia
Russia
150 Mi-OK Park Marine Environment Analysis Center Korea Marine Environment management Corporation (KOEM)
Republic of Korea
151 Ana Rodriguez INSTITUTO OCEANOGRÁFICO DE LA ARMADA (INOCAR)
Ecuador
153 Robinson Fidel Casanova Rosero
CENTRO DE INVESTIGACIONES OCEANOGRÁFICAS E HIDROGRÁFICAS DEL PACÍFICO (CCCP).
Colombia
155 Yoann Le Merrer Karine Collin Olivier Pierre-Duplessix
IFREMER LERMPL, Nantes, FRANCE
France
156 Robert Rember Ana Aguilar-Islas
University of Alaska, Fairbanks USA
31

IOCCP-JAMSTEC 2018 Inter calibration exercise
IOCCP-JAMSTEC 2018 Inter calibration exercise
Table KIOST-A2. Results reported by the participants.
32

IOCCP-JAMSTEC 2018 Inter calibration exercise
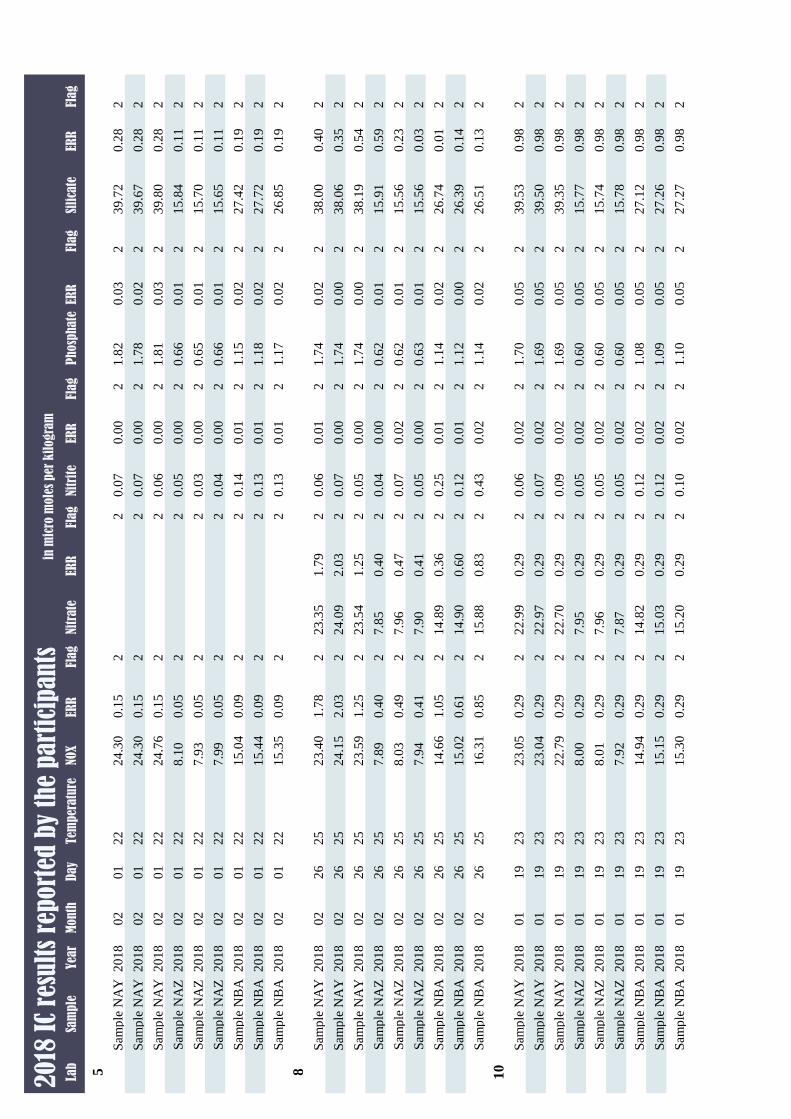
Lab
Sam
ple
Yea
rM
onth
Day
Tem
per
atu
reP
hosp
hate
ERR
Flag
Nitr
ite
ERR
Flag
Nitr
ate
ERR
Flag
NOX
ERR
Flag
Sili
cate
ERR
Flag
20
18 I
C re
sult
s re
port
ed b
y th
e p
art
icip
an
tsin
mic
ro m
ole
s per
kil
ogra
m
5
Sam
ple
NA
Y2
018
02
01
22
1.8
20
.03
20
.07
0.0
02
22
4.3
00
.15
23
9.7
20
.28
2
Sam
ple
NA
Y2
018
02
01
22
1.7
80
.02
20
.07
0.0
02
22
4.3
00
.15
23
9.6
70
.28
2
Sam
ple
NA
Y2
018
02
01
22
1.8
10
.03
20
.06
0.0
02
22
4.7
60
.15
23
9.8
00
.28
2
Sam
ple
NA
Z2
018
02
01
22
0.6
60
.01
20
.05
0.0
02
28
.10
0.0
52
15
.84
0.1
12
Sam
ple
NA
Z2
018
02
01
22
0.6
50
.01
20
.03
0.0
02
27
.93
0.0
52
15
.70
0.1
12
Sam
ple
NA
Z2
018
02
01
22
0.6
60
.01
20
.04
0.0
02
27
.99
0.0
52
15
.65
0.1
12
Sam
ple
NB
A2
018
02
01
22
1.1
50
.02
20
.14
0.0
12
21
5.0
40
.09
22
7.4
20
.19
2
Sam
ple
NB
A2
018
02
01
22
1.1
80
.02
20
.13
0.0
12
21
5.4
40
.09
22
7.7
20
.19
2
Sam
ple
NB
A2
018
02
01
22
1.1
70
.02
20
.13
0.0
12
21
5.3
50
.09
22
6.8
50
.19
2
8
Sam
ple
NA
Y2
018
02
26
25
1.7
40
.02
20
.06
0.0
12
23
.35
1.7
92
23
.40
1.7
82
38
.00
0.4
02
Sam
ple
NA
Y2
018
02
26
25
1.7
40
.00
20
.07
0.0
02
24
.09
2.0
32
24
.15
2.0
32
38
.06
0.3
52
Sam
ple
NA
Y2
018
02
26
25
1.7
40
.00
20
.05
0.0
02
23
.54
1.2
52
23
.59
1.2
52
38
.19
0.5
42
Sam
ple
NA
Z2
018
02
26
25
0.6
20
.01
20
.04
0.0
02
7.8
50
.40
27
.89
0.4
02
15
.91
0.5
92
Sam
ple
NA
Z2
018
02
26
25
0.6
20
.01
20
.07
0.0
22
7.9
60
.47
28
.03
0.4
92
15
.56
0.2
32
Sam
ple
NA
Z2
018
02
26
25
0.6
30
.01
20
.05
0.0
02
7.9
00
.41
27
.94
0.4
12
15
.56
0.0
32
Sam
ple
NB
A2
018
02
26
25
1.1
40
.02
20
.25
0.0
12
14
.89
0.3
62
14
.66
1.0
52
26
.74
0.0
12
Sam
ple
NB
A2
018
02
26
25
1.1
20
.00
20
.12
0.0
12
14
.90
0.6
02
15
.02
0.6
12
26
.39
0.1
42
Sam
ple
NB
A2
018
02
26
25
1.1
40
.02
20
.43
0.0
22
15
.88
0.8
32
16
.31
0.8
52
26
.51
0.1
32
10
Sam
ple
NA
Y2
018
01
19
23
1.7
00
.05
20
.06
0.0
22
22
.99
0.2
92
23
.05
0.2
92
39
.53
0.9
82
Sam
ple
NA
Y2
018
01
19
23
1.6
90
.05
20
.07
0.0
22
22
.97
0.2
92
23
.04
0.2
92
39
.50
0.9
82
Sam
ple
NA
Y2
018
01
19
23
1.6
90
.05
20
.09
0.0
22
22
.70
0.2
92
22
.79
0.2
92
39
.35
0.9
82
Sam
ple
NA
Z2
018
01
19
23
0.6
00
.05
20
.05
0.0
22
7.9
50
.29
28
.00
0.2
92
15
.77
0.9
82
Sam
ple
NA
Z2
018
01
19
23
0.6
00
.05
20
.05
0.0
22
7.9
60
.29
28
.01
0.2
92
15
.74
0.9
82
Sam
ple
NA
Z2
018
01
19
23
0.6
00
.05
20
.05
0.0
22
7.8
70
.29
27
.92
0.2
92
15
.78
0.9
82
Sam
ple
NB
A2
018
01
19
23
1.0
80
.05
20
.12
0.0
22
14
.82
0.2
92
14
.94
0.2
92
27
.12
0.9
82
Sam
ple
NB
A2
018
01
19
23
1.0
90
.05
20
.12
0.0
22
15
.03
0.2
92
15
.15
0.2
92
27
.26
0.9
82
Sam
ple
NB
A2
018
01
19
23
1.1
00
.05
20
.10
0.0
22
15
.20
0.2
92
15
.30
0.2
92
27
.27
0.9
82
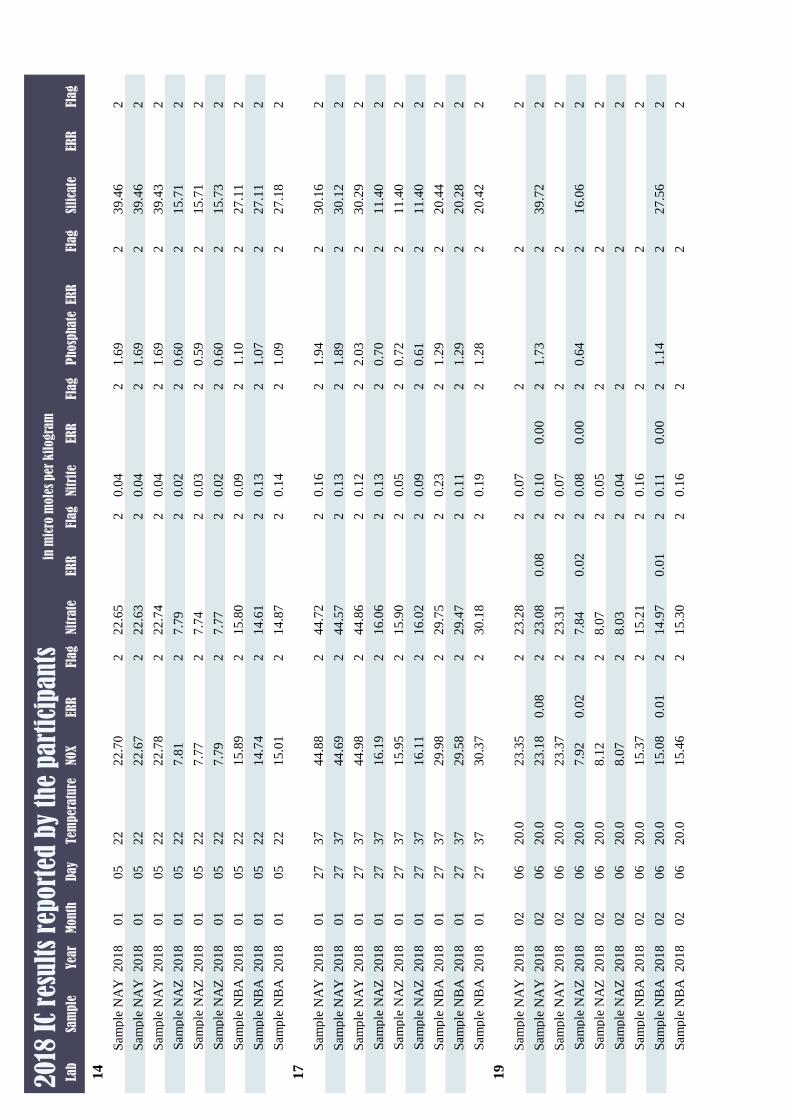
Lab
Sam
ple
Yea
rM
onth
Day
Tem
per
atu
reP
hosp
hate
ERR
Flag
Nitr
ite
ERR
Flag
Nitr
ate
ERR
Flag
NOX
ERR
Flag
Sili
cate
ERR
Flag
20
18 I
C re
sult
s re
port
ed b
y th
e p
art
icip
an
tsin
mic
ro m
ole
s per
kil
ogra
m
14
Sam
ple
NA
Y2
018
01
05
22
1.6
92
0.0
42
22
.65
22
2.7
02
39
.46
2
Sam
ple
NA
Y2
018
01
05
22
1.6
92
0.0
42
22
.63
22
2.6
72
39
.46
2
Sam
ple
NA
Y2
018
01
05
22
1.6
92
0.0
42
22
.74
22
2.7
82
39
.43
2
Sam
ple
NA
Z2
018
01
05
22
0.6
02
0.0
22
7.7
92
7.8
12
15
.71
2
Sam
ple
NA
Z2
018
01
05
22
0.5
92
0.0
32
7.7
42
7.7
72
15
.71
2
Sam
ple
NA
Z2
018
01
05
22
0.6
02
0.0
22
7.7
72
7.7
92
15
.73
2
Sam
ple
NB
A2
018
01
05
22
1.1
02
0.0
92
15
.80
21
5.8
92
27
.11
2
Sam
ple
NB
A2
018
01
05
22
1.0
72
0.1
32
14
.61
21
4.7
42
27
.11
2
Sam
ple
NB
A2
018
01
05
22
1.0
92
0.1
42
14
.87
21
5.0
12
27
.18
2
17
Sam
ple
NA
Y2
018
01
27
37
1.9
42
0.1
62
44
.72
24
4.8
82
30
.16
2
Sam
ple
NA
Y2
018
01
27
37
1.8
92
0.1
32
44
.57
24
4.6
92
30
.12
2
Sam
ple
NA
Y2
018
01
27
37
2.0
32
0.1
22
44
.86
24
4.9
82
30
.29
2
Sam
ple
NA
Z2
018
01
27
37
0.7
02
0.1
32
16
.06
21
6.1
92
11
.40
2
Sam
ple
NA
Z2
018
01
27
37
0.7
22
0.0
52
15
.90
21
5.9
52
11
.40
2
Sam
ple
NA
Z2
018
01
27
37
0.6
12
0.0
92
16
.02
21
6.1
12
11
.40
2
Sam
ple
NB
A2
018
01
27
37
1.2
92
0.2
32
29
.75
22
9.9
82
20
.44
2
Sam
ple
NB
A2
018
01
27
37
1.2
92
0.1
12
29
.47
22
9.5
82
20
.28
2
Sam
ple
NB
A2
018
01
27
37
1.2
82
0.1
92
30
.18
23
0.3
72
20
.42
2
19
Sam
ple
NA
Y2
018
02
06
20
.02
0.0
72
23
.28
22
3.3
52
2
Sam
ple
NA
Y2
018
02
06
20
.01
.73
20
.10
0.0
02
23
.08
0.0
82
23
.18
0.0
82
39
.72
2
Sam
ple
NA
Y2
018
02
06
20
.02
0.0
72
23
.31
22
3.3
72
2
Sam
ple
NA
Z2
018
02
06
20
.00
.64
20
.08
0.0
02
7.8
40
.02
27
.92
0.0
22
16
.06
2
Sam
ple
NA
Z2
018
02
06
20
.02
0.0
52
8.0
72
8.1
22
2
Sam
ple
NA
Z2
018
02
06
20
.02
0.0
42
8.0
32
8.0
72
2
Sam
ple
NB
A2
018
02
06
20
.02
0.1
62
15
.21
21
5.3
72
2
Sam
ple
NB
A2
018
02
06
20
.01
.14
20
.11
0.0
02
14
.97
0.0
12
15
.08
0.0
12
27
.56
2
Sam
ple
NB
A2
018
02
06
20
.02
0.1
62
15
.30
21
5.4
62
2
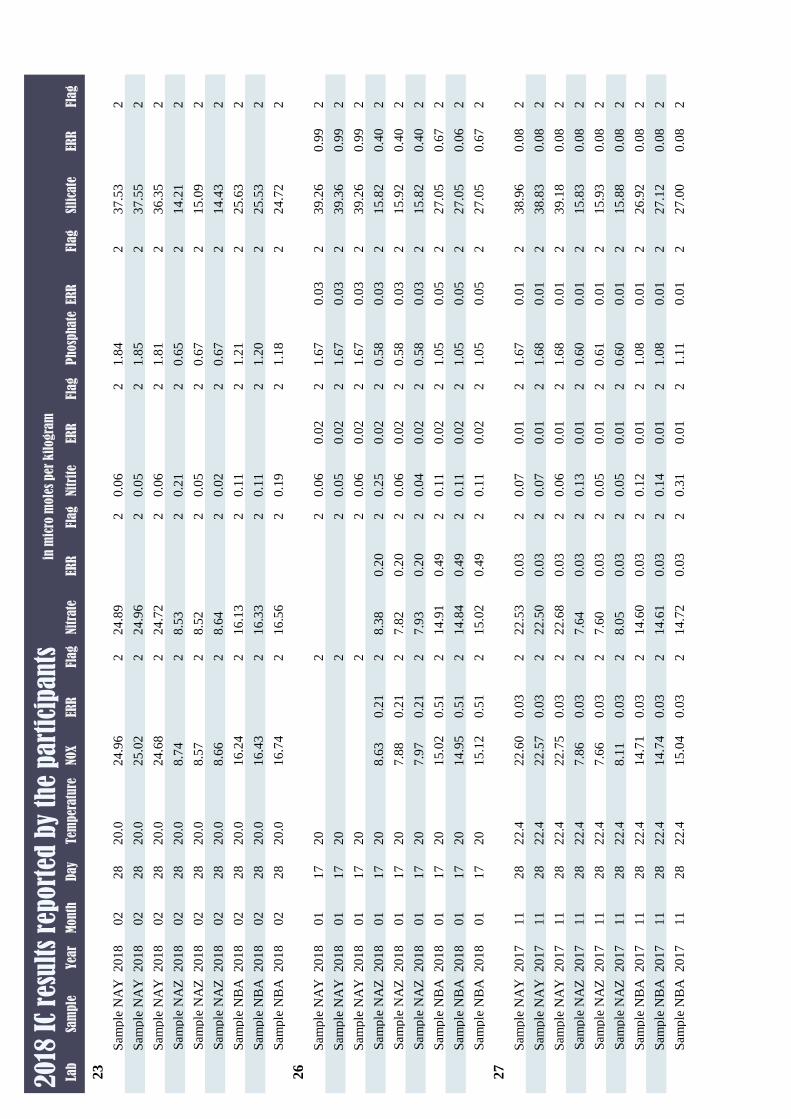
Lab
Sam
ple
Yea
rM
onth
Day
Tem
per
atu
reP
hosp
hate
ERR
Flag
Nitr
ite
ERR
Flag
Nitr
ate
ERR
Flag
NOX
ERR
Flag
Sili
cate
ERR
Flag
20
18 I
C re
sult
s re
port
ed b
y th
e p
art
icip
an
tsin
mic
ro m
ole
s per
kil
ogra
m
23
Sam
ple
NA
Y2
018
02
28
20
.01
.84
20
.06
22
4.8
92
24
.96
23
7.5
32
Sam
ple
NA
Y2
018
02
28
20
.01
.85
20
.05
22
4.9
62
25
.02
23
7.5
52
Sam
ple
NA
Y2
018
02
28
20
.01
.81
20
.06
22
4.7
22
24
.68
23
6.3
52
Sam
ple
NA
Z2
018
02
28
20
.00
.65
20
.21
28
.53
28
.74
21
4.2
12
Sam
ple
NA
Z2
018
02
28
20
.00
.67
20
.05
28
.52
28
.57
21
5.0
92
Sam
ple
NA
Z2
018
02
28
20
.00
.67
20
.02
28
.64
28
.66
21
4.4
32
Sam
ple
NB
A2
018
02
28
20
.01
.21
20
.11
21
6.1
32
16
.24
22
5.6
32
Sam
ple
NB
A2
018
02
28
20
.01
.20
20
.11
21
6.3
32
16
.43
22
5.5
32
Sam
ple
NB
A2
018
02
28
20
.01
.18
20
.19
21
6.5
62
16
.74
22
4.7
22
26
Sam
ple
NA
Y2
018
01
17
20
1.6
70
.03
20
.06
0.0
22
22
39
.26
0.9
92
Sam
ple
NA
Y2
018
01
17
20
1.6
70
.03
20
.05
0.0
22
22
39
.36
0.9
92
Sam
ple
NA
Y2
018
01
17
20
1.6
70
.03
20
.06
0.0
22
22
39
.26
0.9
92
Sam
ple
NA
Z2
018
01
17
20
0.5
80
.03
20
.25
0.0
22
8.3
80
.20
28
.63
0.2
12
15
.82
0.4
02
Sam
ple
NA
Z2
018
01
17
20
0.5
80
.03
20
.06
0.0
22
7.8
20
.20
27
.88
0.2
12
15
.92
0.4
02
Sam
ple
NA
Z2
018
01
17
20
0.5
80
.03
20
.04
0.0
22
7.9
30
.20
27
.97
0.2
12
15
.82
0.4
02
Sam
ple
NB
A2
018
01
17
20
1.0
50
.05
20
.11
0.0
22
14
.91
0.4
92
15
.02
0.5
12
27
.05
0.6
72
Sam
ple
NB
A2
018
01
17
20
1.0
50
.05
20
.11
0.0
22
14
.84
0.4
92
14
.95
0.5
12
27
.05
0.0
62
Sam
ple
NB
A2
018
01
17
20
1.0
50
.05
20
.11
0.0
22
15
.02
0.4
92
15
.12
0.5
12
27
.05
0.6
72
27
Sam
ple
NA
Y2
017
11
28
22
.41
.67
0.0
12
0.0
70
.01
22
2.5
30
.03
22
2.6
00
.03
23
8.9
60
.08
2
Sam
ple
NA
Y2
017
11
28
22
.41
.68
0.0
12
0.0
70
.01
22
2.5
00
.03
22
2.5
70
.03
23
8.8
30
.08
2
Sam
ple
NA
Y2
017
11
28
22
.41
.68
0.0
12
0.0
60
.01
22
2.6
80
.03
22
2.7
50
.03
23
9.1
80
.08
2
Sam
ple
NA
Z2
017
11
28
22
.40
.60
0.0
12
0.1
30
.01
27
.64
0.0
32
7.8
60
.03
21
5.8
30
.08
2
Sam
ple
NA
Z2
017
11
28
22
.40
.61
0.0
12
0.0
50
.01
27
.60
0.0
32
7.6
60
.03
21
5.9
30
.08
2
Sam
ple
NA
Z2
017
11
28
22
.40
.60
0.0
12
0.0
50
.01
28
.05
0.0
32
8.1
10
.03
21
5.8
80
.08
2
Sam
ple
NB
A2
017
11
28
22
.41
.08
0.0
12
0.1
20
.01
21
4.6
00
.03
21
4.7
10
.03
22
6.9
20
.08
2
Sam
ple
NB
A2
017
11
28
22
.41
.08
0.0
12
0.1
40
.01
21
4.6
10
.03
21
4.7
40
.03
22
7.1
20
.08
2
Sam
ple
NB
A2
017
11
28
22
.41
.11
0.0
12
0.3
10
.01
21
4.7
20
.03
21
5.0
40
.03
22
7.0
00
.08
2
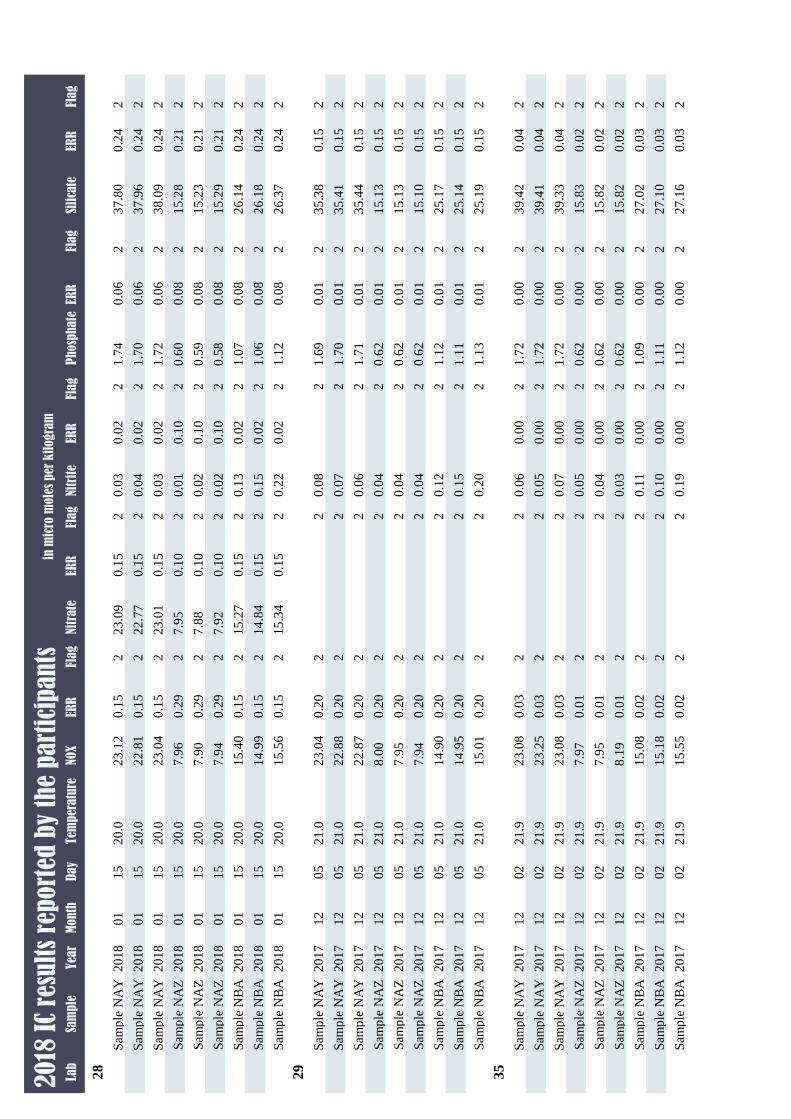
Lab
Sam
ple
Yea
rM
onth
Day
Tem
per
atu
reP
hosp
hate
ERR
Flag
Nitr
ite
ERR
Flag
Nitr
ate
ERR
Flag
NOX
ERR
Flag
Sili
cate
ERR
Flag
20
18 I
C re
sult
s re
port
ed b
y th
e p
art
icip
an
tsin
mic
ro m
ole
s per
kil
ogra
m
28
Sam
ple
NA
Y2
018
01
15
20
.01
.74
0.0
62
0.0
30
.02
22
3.0
90
.15
22
3.1
20
.15
23
7.8
00
.24
2
Sam
ple
NA
Y2
018
01
15
20
.01
.70
0.0
62
0.0
40
.02
22
2.7
70
.15
22
2.8
10
.15
23
7.9
60
.24
2
Sam
ple
NA
Y2
018
01
15
20
.01
.72
0.0
62
0.0
30
.02
22
3.0
10
.15
22
3.0
40
.15
23
8.0
90
.24
2
Sam
ple
NA
Z2
018
01
15
20
.00
.60
0.0
82
0.0
10
.10
27
.95
0.1
02
7.9
60
.29
21
5.2
80
.21
2
Sam
ple
NA
Z2
018
01
15
20
.00
.59
0.0
82
0.0
20
.10
27
.88
0.1
02
7.9
00
.29
21
5.2
30
.21
2
Sam
ple
NA
Z2
018
01
15
20
.00
.58
0.0
82
0.0
20
.10
27
.92
0.1
02
7.9
40
.29
21
5.2
90
.21
2
Sam
ple
NB
A2
018
01
15
20
.01
.07
0.0
82
0.1
30
.02
21
5.2
70
.15
21
5.4
00
.15
22
6.1
40
.24
2
Sam
ple
NB
A2
018
01
15
20
.01
.06
0.0
82
0.1
50
.02
21
4.8
40
.15
21
4.9
90
.15
22
6.1
80
.24
2
Sam
ple
NB
A2
018
01
15
20
.01
.12
0.0
82
0.2
20
.02
21
5.3
40
.15
21
5.5
60
.15
22
6.3
70
.24
2
29
Sam
ple
NA
Y2
017
12
05
21
.01
.69
0.0
12
0.0
82
22
3.0
40
.20
23
5.3
80
.15
2
Sam
ple
NA
Y2
017
12
05
21
.01
.70
0.0
12
0.0
72
22
2.8
80
.20
23
5.4
10
.15
2
Sam
ple
NA
Y2
017
12
05
21
.01
.71
0.0
12
0.0
62
22
2.8
70
.20
23
5.4
40
.15
2
Sam
ple
NA
Z2
017
12
05
21
.00
.62
0.0
12
0.0
42
28
.00
0.2
02
15
.13
0.1
52
Sam
ple
NA
Z2
017
12
05
21
.00
.62
0.0
12
0.0
42
27
.95
0.2
02
15
.13
0.1
52
Sam
ple
NA
Z2
017
12
05
21
.00
.62
0.0
12
0.0
42
27
.94
0.2
02
15
.10
0.1
52
Sam
ple
NB
A2
017
12
05
21
.01
.12
0.0
12
0.1
22
21
4.9
00
.20
22
5.1
70
.15
2
Sam
ple
NB
A2
017
12
05
21
.01
.11
0.0
12
0.1
52
21
4.9
50
.20
22
5.1
40
.15
2
Sam
ple
NB
A2
017
12
05
21
.01
.13
0.0
12
0.2
02
21
5.0
10
.20
22
5.1
90
.15
2
35
Sam
ple
NA
Y2
017
12
02
21
.91
.72
0.0
02
0.0
60
.00
22
23
.08
0.0
32
39
.42
0.0
42
Sam
ple
NA
Y2
017
12
02
21
.91
.72
0.0
02
0.0
50
.00
22
23
.25
0.0
32
39
.41
0.0
42
Sam
ple
NA
Y2
017
12
02
21
.91
.72
0.0
02
0.0
70
.00
22
23
.08
0.0
32
39
.33
0.0
42
Sam
ple
NA
Z2
017
12
02
21
.90
.62
0.0
02
0.0
50
.00
22
7.9
70
.01
21
5.8
30
.02
2
Sam
ple
NA
Z2
017
12
02
21
.90
.62
0.0
02
0.0
40
.00
22
7.9
50
.01
21
5.8
20
.02
2
Sam
ple
NA
Z2
017
12
02
21
.90
.62
0.0
02
0.0
30
.00
22
8.1
90
.01
21
5.8
20
.02
2
Sam
ple
NB
A2
017
12
02
21
.91
.09
0.0
02
0.1
10
.00
22
15
.08
0.0
22
27
.02
0.0
32
Sam
ple
NB
A2
017
12
02
21
.91
.11
0.0
02
0.1
00
.00
22
15
.18
0.0
22
27
.10
0.0
32
Sam
ple
NB
A2
017
12
02
21
.91
.12
0.0
02
0.1
90
.00
22
15
.55
0.0
22
27
.16
0.0
32
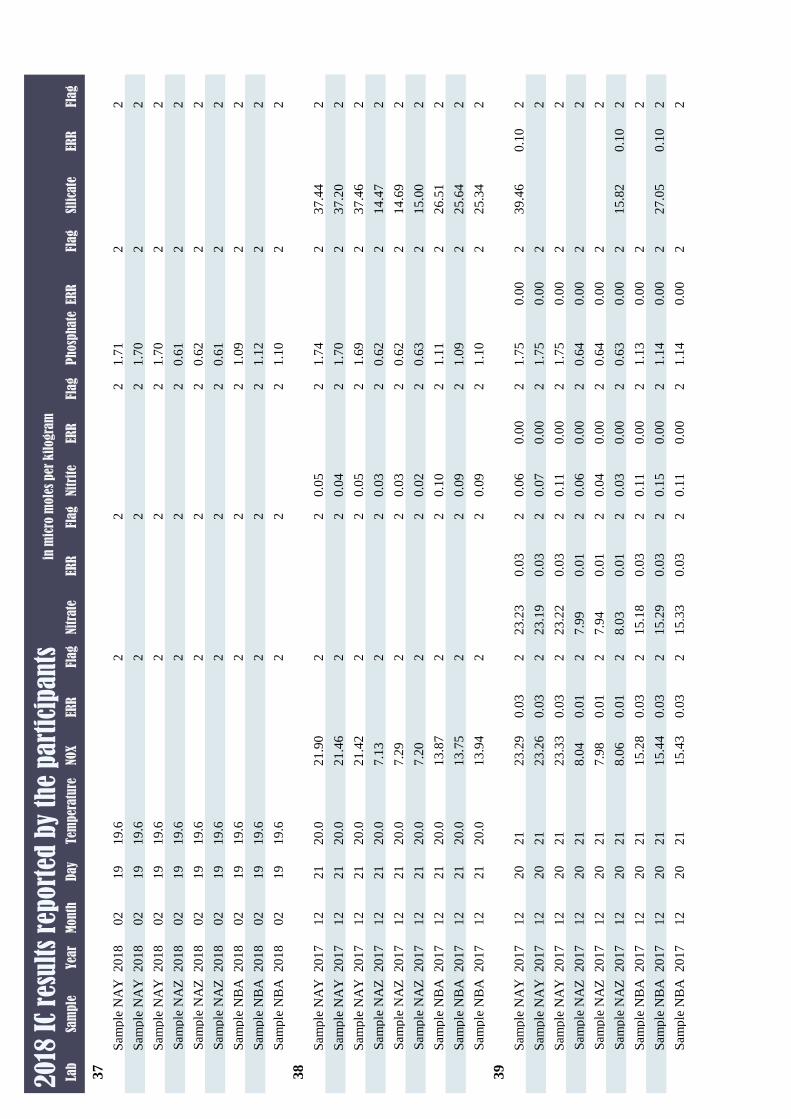
Lab
Sam
ple
Yea
rM
onth
Day
Tem
per
atu
reP
hosp
hate
ERR
Flag
Nitr
ite
ERR
Flag
Nitr
ate
ERR
Flag
NOX
ERR
Flag
Sili
cate
ERR
Flag
20
18 I
C re
sult
s re
port
ed b
y th
e p
art
icip
an
tsin
mic
ro m
ole
s per
kil
ogra
m
37
Sam
ple
NA
Y2
018
02
19
19
.61
.71
22
22
2
Sam
ple
NA
Y2
018
02
19
19
.61
.70
22
22
2
Sam
ple
NA
Y2
018
02
19
19
.61
.70
22
22
2
Sam
ple
NA
Z2
018
02
19
19
.60
.61
22
22
2
Sam
ple
NA
Z2
018
02
19
19
.60
.62
22
22
2
Sam
ple
NA
Z2
018
02
19
19
.60
.61
22
22
2
Sam
ple
NB
A2
018
02
19
19
.61
.09
22
22
2
Sam
ple
NB
A2
018
02
19
19
.61
.12
22
22
2
Sam
ple
NB
A2
018
02
19
19
.61
.10
22
22
2
38
Sam
ple
NA
Y2
017
12
21
20
.01
.74
20
.05
22
21
.90
23
7.4
42
Sam
ple
NA
Y2
017
12
21
20
.01
.70
20
.04
22
21
.46
23
7.2
02
Sam
ple
NA
Y2
017
12
21
20
.01
.69
20
.05
22
21
.42
23
7.4
62
Sam
ple
NA
Z2
017
12
21
20
.00
.62
20
.03
22
7.1
32
14
.47
2
Sam
ple
NA
Z2
017
12
21
20
.00
.62
20
.03
22
7.2
92
14
.69
2
Sam
ple
NA
Z2
017
12
21
20
.00
.63
20
.02
22
7.2
02
15
.00
2
Sam
ple
NB
A2
017
12
21
20
.01
.11
20
.10
22
13
.87
22
6.5
12
Sam
ple
NB
A2
017
12
21
20
.01
.09
20
.09
22
13
.75
22
5.6
42
Sam
ple
NB
A2
017
12
21
20
.01
.10
20
.09
22
13
.94
22
5.3
42
39
Sam
ple
NA
Y2
017
12
20
21
1.7
50
.00
20
.06
0.0
02
23
.23
0.0
32
23
.29
0.0
32
39
.46
0.1
02
Sam
ple
NA
Y2
017
12
20
21
1.7
50
.00
20
.07
0.0
02
23
.19
0.0
32
23
.26
0.0
32
2
Sam
ple
NA
Y2
017
12
20
21
1.7
50
.00
20
.11
0.0
02
23
.22
0.0
32
23
.33
0.0
32
2
Sam
ple
NA
Z2
017
12
20
21
0.6
40
.00
20
.06
0.0
02
7.9
90
.01
28
.04
0.0
12
2
Sam
ple
NA
Z2
017
12
20
21
0.6
40
.00
20
.04
0.0
02
7.9
40
.01
27
.98
0.0
12
2
Sam
ple
NA
Z2
017
12
20
21
0.6
30
.00
20
.03
0.0
02
8.0
30
.01
28
.06
0.0
12
15
.82
0.1
02
Sam
ple
NB
A2
017
12
20
21
1.1
30
.00
20
.11
0.0
02
15
.18
0.0
32
15
.28
0.0
32
2
Sam
ple
NB
A2
017
12
20
21
1.1
40
.00
20
.15
0.0
02
15
.29
0.0
32
15
.44
0.0
32
27
.05
0.1
02
Sam
ple
NB
A2
017
12
20
21
1.1
40
.00
20
.11
0.0
02
15
.33
0.0
32
15
.43
0.0
32
2
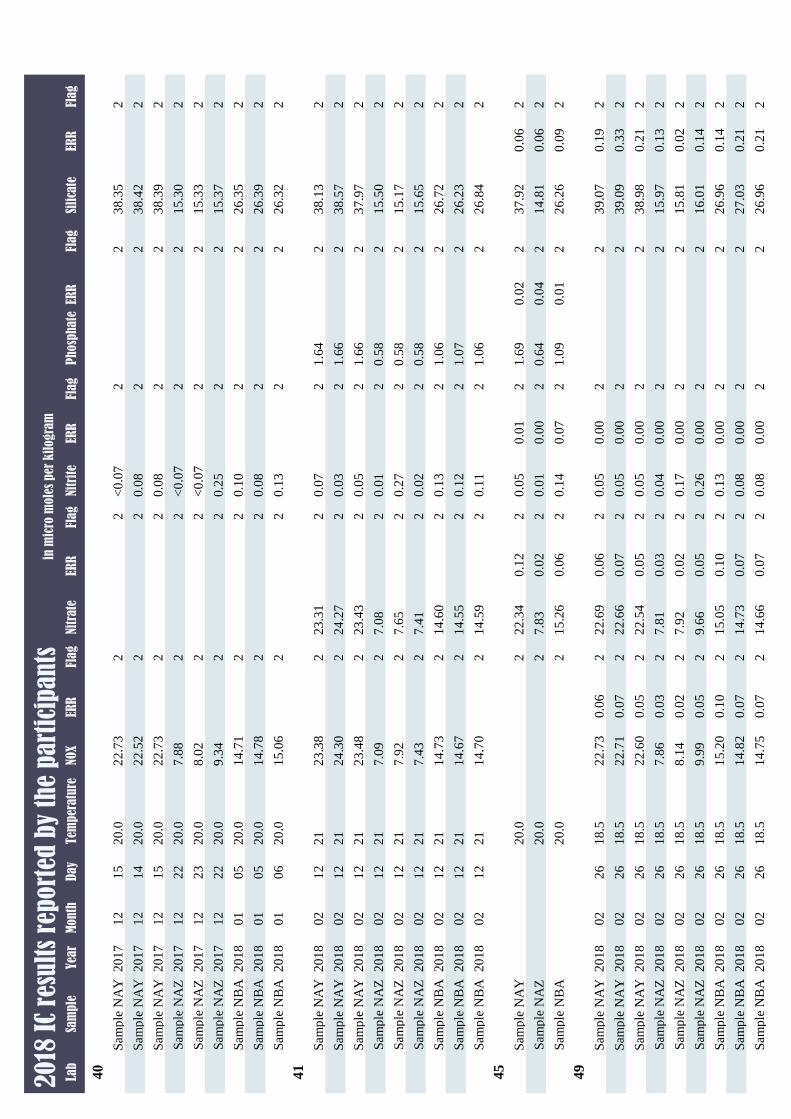
Lab
Sam
ple
Yea
rM
onth
Day
Tem
per
atu
reP
hosp
hate
ERR
Flag
Nitr
ite
ERR
Flag
Nitr
ate
ERR
Flag
NOX
ERR
Flag
Sili
cate
ERR
Flag
20
18 I
C re
sult
s re
port
ed b
y th
e p
art
icip
an
tsin
mic
ro m
ole
s per
kil
ogra
m
40
Sam
ple
NA
Y2
017
12
15
20
.02
<0
.07
22
22
.73
23
8.3
52
Sam
ple
NA
Y2
017
12
14
20
.02
0.0
82
22
2.5
22
38
.42
2
Sam
ple
NA
Y2
017
12
15
20
.02
0.0
82
22
2.7
32
38
.39
2
Sam
ple
NA
Z2
017
12
22
20
.02
<0
.07
22
7.8
82
15
.30
2
Sam
ple
NA
Z2
017
12
23
20
.02
<0
.07
22
8.0
22
15
.33
2
Sam
ple
NA
Z2
017
12
22
20
.02
0.2
52
29
.34
21
5.3
72
Sam
ple
NB
A2
018
01
05
20
.02
0.1
02
21
4.7
12
26
.35
2
Sam
ple
NB
A2
018
01
05
20
.02
0.0
82
21
4.7
82
26
.39
2
Sam
ple
NB
A2
018
01
06
20
.02
0.1
32
21
5.0
62
26
.32
2
41
Sam
ple
NA
Y2
018
02
12
21
1.6
42
0.0
72
23
.31
22
3.3
82
38
.13
2
Sam
ple
NA
Y2
018
02
12
21
1.6
62
0.0
32
24
.27
22
4.3
02
38
.57
2
Sam
ple
NA
Y2
018
02
12
21
1.6
62
0.0
52
23
.43
22
3.4
82
37
.97
2
Sam
ple
NA
Z2
018
02
12
21
0.5
82
0.0
12
7.0
82
7.0
92
15
.50
2
Sam
ple
NA
Z2
018
02
12
21
0.5
82
0.2
72
7.6
52
7.9
22
15
.17
2
Sam
ple
NA
Z2
018
02
12
21
0.5
82
0.0
22
7.4
12
7.4
32
15
.65
2
Sam
ple
NB
A2
018
02
12
21
1.0
62
0.1
32
14
.60
21
4.7
32
26
.72
2
Sam
ple
NB
A2
018
02
12
21
1.0
72
0.1
22
14
.55
21
4.6
72
26
.23
2
Sam
ple
NB
A2
018
02
12
21
1.0
62
0.1
12
14
.59
21
4.7
02
26
.84
2
45
Sam
ple
NA
Y2
0.0
1.6
90
.02
20
.05
0.0
12
22
.34
0.1
22
23
7.9
20
.06
2
Sam
ple
NA
Z2
0.0
0.6
40
.04
20
.01
0.0
02
7.8
30
.02
22
14
.81
0.0
62
Sam
ple
NB
A2
0.0
1.0
90
.01
20
.14
0.0
72
15
.26
0.0
62
22
6.2
60
.09
2
49
Sam
ple
NA
Y2
018
02
26
18
.52
0.0
50
.00
22
2.6
90
.06
22
2.7
30
.06
23
9.0
70
.19
2
Sam
ple
NA
Y2
018
02
26
18
.52
0.0
50
.00
22
2.6
60
.07
22
2.7
10
.07
23
9.0
90
.33
2
Sam
ple
NA
Y2
018
02
26
18
.52
0.0
50
.00
22
2.5
40
.05
22
2.6
00
.05
23
8.9
80
.21
2
Sam
ple
NA
Z2
018
02
26
18
.52
0.0
40
.00
27
.81
0.0
32
7.8
60
.03
21
5.9
70
.13
2
Sam
ple
NA
Z2
018
02
26
18
.52
0.1
70
.00
27
.92
0.0
22
8.1
40
.02
21
5.8
10
.02
2
Sam
ple
NA
Z2
018
02
26
18
.52
0.2
60
.00
29
.66
0.0
52
9.9
90
.05
21
6.0
10
.14
2
Sam
ple
NB
A2
018
02
26
18
.52
0.1
30
.00
21
5.0
50
.10
21
5.2
00
.10
22
6.9
60
.14
2
Sam
ple
NB
A2
018
02
26
18
.52
0.0
80
.00
21
4.7
30
.07
21
4.8
20
.07
22
7.0
30
.21
2
Sam
ple
NB
A2
018
02
26
18
.52
0.0
80
.00
21
4.6
60
.07
21
4.7
50
.07
22
6.9
60
.21
2
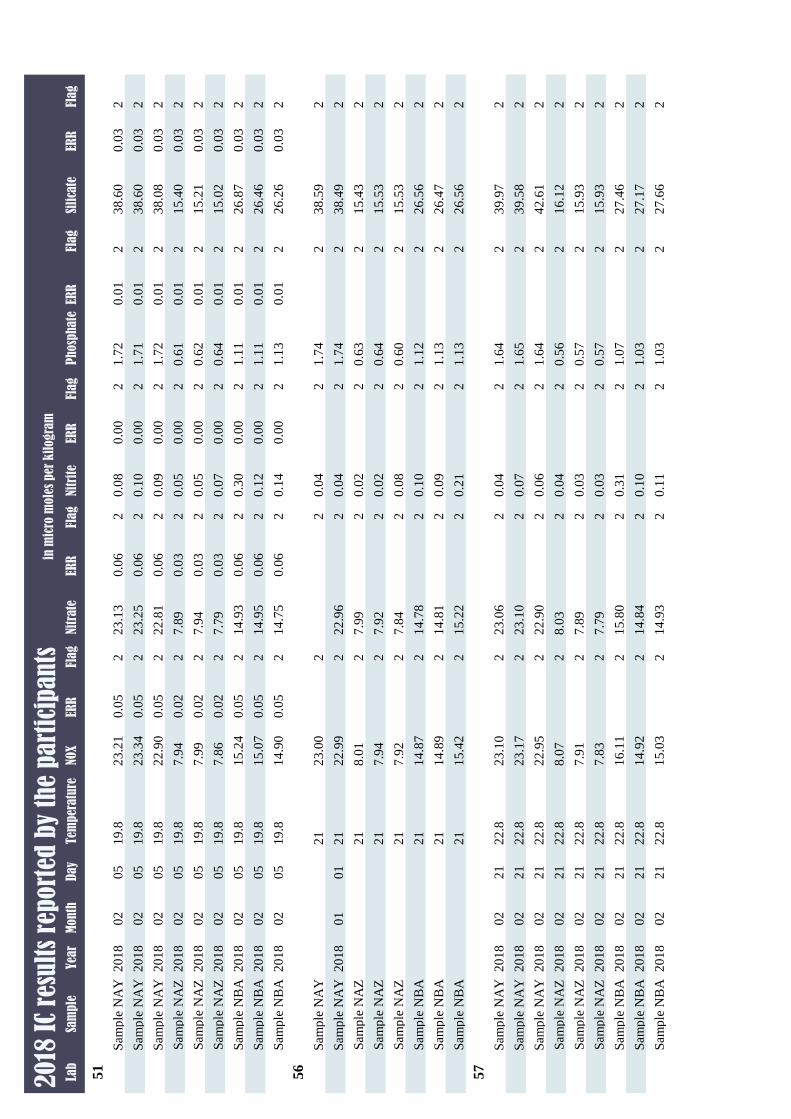
Lab
Sam
ple
Yea
rM
onth
Day
Tem
per
atu
reP
hosp
hate
ERR
Flag
Nitr
ite
ERR
Flag
Nitr
ate
ERR
Flag
NOX
ERR
Flag
Sili
cate
ERR
Flag
20
18 I
C re
sult
s re
port
ed b
y th
e p
art
icip
an
tsin
mic
ro m
ole
s per
kil
ogra
m
51
Sam
ple
NA
Y2
018
02
05
19
.81
.72
0.0
12
0.0
80
.00
22
3.1
30
.06
22
3.2
10
.05
23
8.6
00
.03
2
Sam
ple
NA
Y2
018
02
05
19
.81
.71
0.0
12
0.1
00
.00
22
3.2
50
.06
22
3.3
40
.05
23
8.6
00
.03
2
Sam
ple
NA
Y2
018
02
05
19
.81
.72
0.0
12
0.0
90
.00
22
2.8
10
.06
22
2.9
00
.05
23
8.0
80
.03
2
Sam
ple
NA
Z2
018
02
05
19
.80
.61
0.0
12
0.0
50
.00
27
.89
0.0
32
7.9
40
.02
21
5.4
00
.03
2
Sam
ple
NA
Z2
018
02
05
19
.80
.62
0.0
12
0.0
50
.00
27
.94
0.0
32
7.9
90
.02
21
5.2
10
.03
2
Sam
ple
NA
Z2
018
02
05
19
.80
.64
0.0
12
0.0
70
.00
27
.79
0.0
32
7.8
60
.02
21
5.0
20
.03
2
Sam
ple
NB
A2
018
02
05
19
.81
.11
0.0
12
0.3
00
.00
21
4.9
30
.06
21
5.2
40
.05
22
6.8
70
.03
2
Sam
ple
NB
A2
018
02
05
19
.81
.11
0.0
12
0.1
20
.00
21
4.9
50
.06
21
5.0
70
.05
22
6.4
60
.03
2
Sam
ple
NB
A2
018
02
05
19
.81
.13
0.0
12
0.1
40
.00
21
4.7
50
.06
21
4.9
00
.05
22
6.2
60
.03
2
56
Sam
ple
NA
Y2
11
.74
20
.04
22
23
.00
23
8.5
92
Sam
ple
NA
Y2
018
01
01
21
1.7
42
0.0
42
22
.96
22
2.9
92
38
.49
2
Sam
ple
NA
Z2
10
.63
20
.02
27
.99
28
.01
21
5.4
32
Sam
ple
NA
Z2
10
.64
20
.02
27
.92
27
.94
21
5.5
32
Sam
ple
NA
Z2
10
.60
20
.08
27
.84
27
.92
21
5.5
32
Sam
ple
NB
A2
11
.12
20
.10
21
4.7
82
14
.87
22
6.5
62
Sam
ple
NB
A2
11
.13
20
.09
21
4.8
12
14
.89
22
6.4
72
Sam
ple
NB
A2
11
.13
20
.21
21
5.2
22
15
.42
22
6.5
62
57
Sam
ple
NA
Y2
018
02
21
22
.81
.64
20
.04
22
3.0
62
23
.10
23
9.9
72
Sam
ple
NA
Y2
018
02
21
22
.81
.65
20
.07
22
3.1
02
23
.17
23
9.5
82
Sam
ple
NA
Y2
018
02
21
22
.81
.64
20
.06
22
2.9
02
22
.95
24
2.6
12
Sam
ple
NA
Z2
018
02
21
22
.80
.56
20
.04
28
.03
28
.07
21
6.1
22
Sam
ple
NA
Z2
018
02
21
22
.80
.57
20
.03
27
.89
27
.91
21
5.9
32
Sam
ple
NA
Z2
018
02
21
22
.80
.57
20
.03
27
.79
27
.83
21
5.9
32
Sam
ple
NB
A2
018
02
21
22
.81
.07
20
.31
21
5.8
02
16
.11
22
7.4
62
Sam
ple
NB
A2
018
02
21
22
.81
.03
20
.10
21
4.8
42
14
.92
22
7.1
72
Sam
ple
NB
A2
018
02
21
22
.81
.03
20
.11
21
4.9
32
15
.03
22
7.6
62
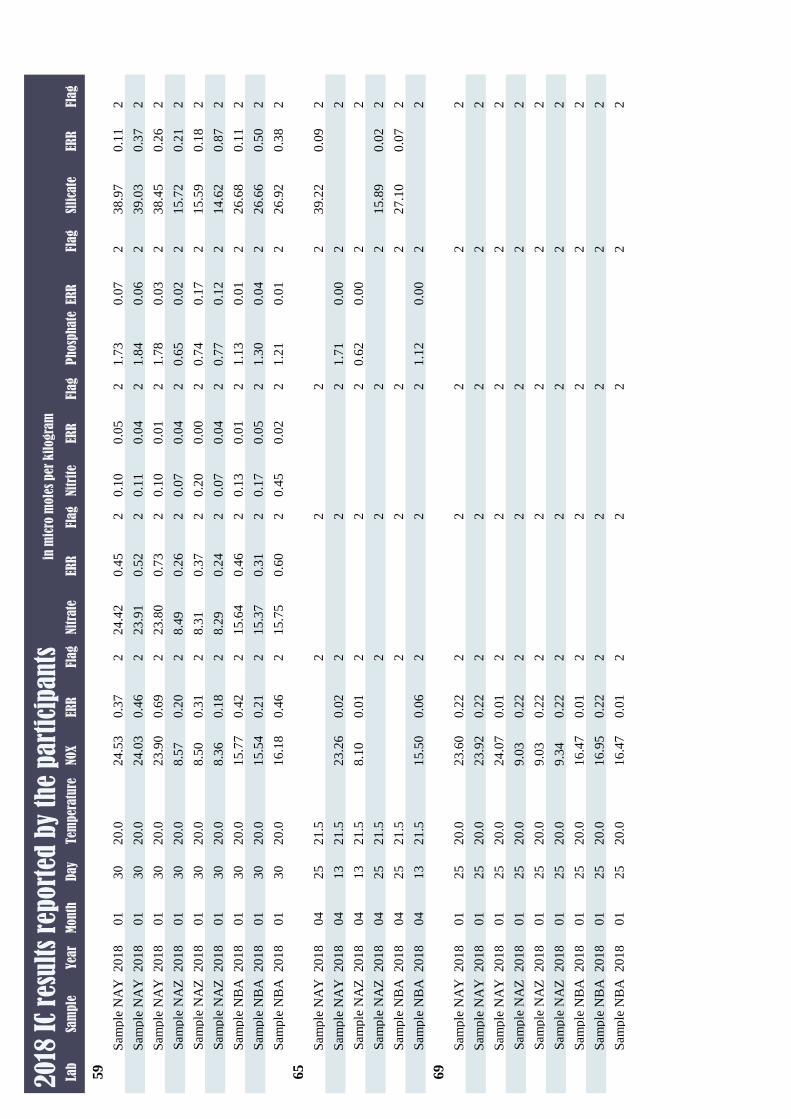
Lab
Sam
ple
Yea
rM
onth
Day
Tem
per
atu
reP
hosp
hate
ERR
Flag
Nitr
ite
ERR
Flag
Nitr
ate
ERR
Flag
NOX
ERR
Flag
Sili
cate
ERR
Flag
20
18 I
C re
sult
s re
port
ed b
y th
e p
art
icip
an
tsin
mic
ro m
ole
s per
kil
ogra
m
59
Sam
ple
NA
Y2
018
01
30
20
.01
.73
0.0
72
0.1
00
.05
22
4.4
20
.45
22
4.5
30
.37
23
8.9
70
.11
2
Sam
ple
NA
Y2
018
01
30
20
.01
.84
0.0
62
0.1
10
.04
22
3.9
10
.52
22
4.0
30
.46
23
9.0
30
.37
2
Sam
ple
NA
Y2
018
01
30
20
.01
.78
0.0
32
0.1
00
.01
22
3.8
00
.73
22
3.9
00
.69
23
8.4
50
.26
2
Sam
ple
NA
Z2
018
01
30
20
.00
.65
0.0
22
0.0
70
.04
28
.49
0.2
62
8.5
70
.20
21
5.7
20
.21
2
Sam
ple
NA
Z2
018
01
30
20
.00
.74
0.1
72
0.2
00
.00
28
.31
0.3
72
8.5
00
.31
21
5.5
90
.18
2
Sam
ple
NA
Z2
018
01
30
20
.00
.77
0.1
22
0.0
70
.04
28
.29
0.2
42
8.3
60
.18
21
4.6
20
.87
2
Sam
ple
NB
A2
018
01
30
20
.01
.13
0.0
12
0.1
30
.01
21
5.6
40
.46
21
5.7
70
.42
22
6.6
80
.11
2
Sam
ple
NB
A2
018
01
30
20
.01
.30
0.0
42
0.1
70
.05
21
5.3
70
.31
21
5.5
40
.21
22
6.6
60
.50
2
Sam
ple
NB
A2
018
01
30
20
.01
.21
0.0
12
0.4
50
.02
21
5.7
50
.60
21
6.1
80
.46
22
6.9
20
.38
2
65
Sam
ple
NA
Y2
018
04
25
21
.52
22
23
9.2
20
.09
2
Sam
ple
NA
Y2
018
04
13
21
.51
.71
0.0
02
22
23
.26
0.0
22
2
Sam
ple
NA
Z2
018
04
13
21
.50
.62
0.0
02
22
8.1
00
.01
22
Sam
ple
NA
Z2
018
04
25
21
.52
22
21
5.8
90
.02
2
Sam
ple
NB
A2
018
04
25
21
.52
22
22
7.1
00
.07
2
Sam
ple
NB
A2
018
04
13
21
.51
.12
0.0
02
22
15
.50
0.0
62
2
69
Sam
ple
NA
Y2
018
01
25
20
.02
22
23
.60
0.2
22
2
Sam
ple
NA
Y2
018
01
25
20
.02
22
23
.92
0.2
22
2
Sam
ple
NA
Y2
018
01
25
20
.02
22
24
.07
0.0
12
2
Sam
ple
NA
Z2
018
01
25
20
.02
22
9.0
30
.22
22
Sam
ple
NA
Z2
018
01
25
20
.02
22
9.0
30
.22
22
Sam
ple
NA
Z2
018
01
25
20
.02
22
9.3
40
.22
22
Sam
ple
NB
A2
018
01
25
20
.02
22
16
.47
0.0
12
2
Sam
ple
NB
A2
018
01
25
20
.02
22
16
.95
0.2
22
2
Sam
ple
NB
A2
018
01
25
20
.02
22
16
.47
0.0
12
2
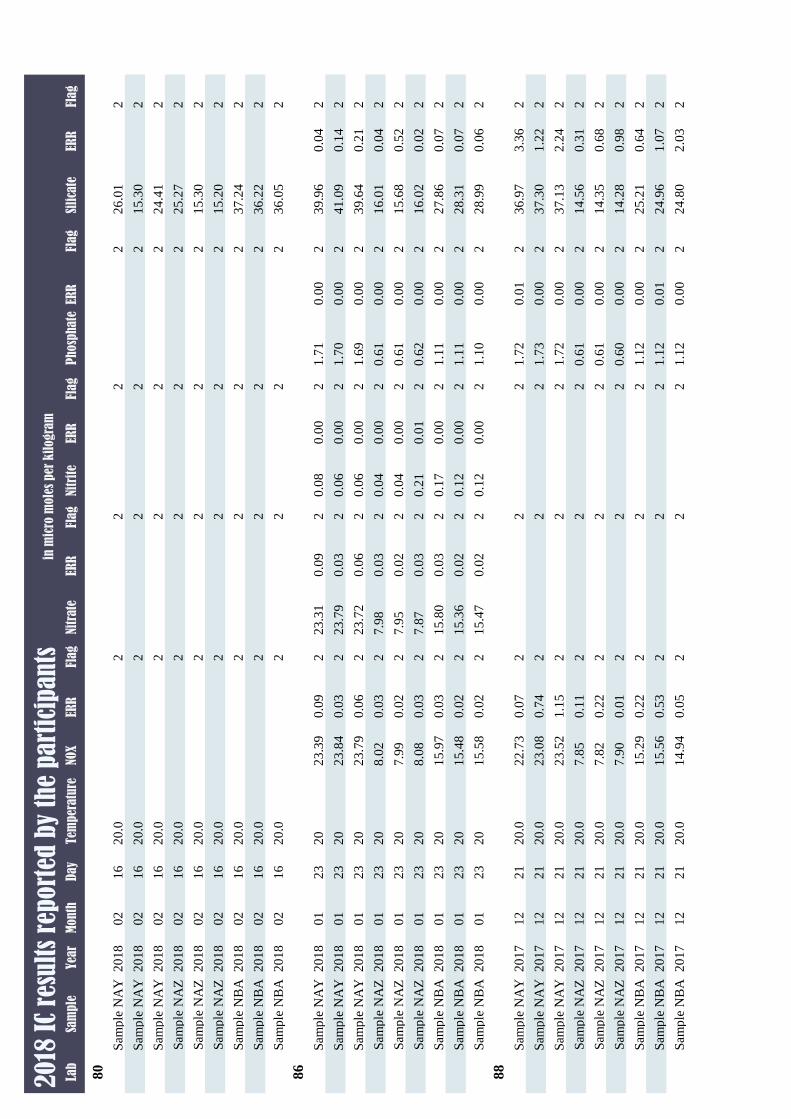
Lab
Sam
ple
Yea
rM
onth
Day
Tem
per
atu
reP
hosp
hate
ERR
Flag
Nitr
ite
ERR
Flag
Nitr
ate
ERR
Flag
NOX
ERR
Flag
Sili
cate
ERR
Flag
20
18 I
C re
sult
s re
port
ed b
y th
e p
art
icip
an
tsin
mic
ro m
ole
s per
kil
ogra
m
80
Sam
ple
NA
Y2
018
02
16
20
.02
22
22
6.0
12
Sam
ple
NA
Y2
018
02
16
20
.02
22
21
5.3
02
Sam
ple
NA
Y2
018
02
16
20
.02
22
22
4.4
12
Sam
ple
NA
Z2
018
02
16
20
.02
22
22
5.2
72
Sam
ple
NA
Z2
018
02
16
20
.02
22
21
5.3
02
Sam
ple
NA
Z2
018
02
16
20
.02
22
21
5.2
02
Sam
ple
NB
A2
018
02
16
20
.02
22
23
7.2
42
Sam
ple
NB
A2
018
02
16
20
.02
22
23
6.2
22
Sam
ple
NB
A2
018
02
16
20
.02
22
23
6.0
52
86
Sam
ple
NA
Y2
018
01
23
20
1.7
10
.00
20
.08
0.0
02
23
.31
0.0
92
23
.39
0.0
92
39
.96
0.0
42
Sam
ple
NA
Y2
018
01
23
20
1.7
00
.00
20
.06
0.0
02
23
.79
0.0
32
23
.84
0.0
32
41
.09
0.1
42
Sam
ple
NA
Y2
018
01
23
20
1.6
90
.00
20
.06
0.0
02
23
.72
0.0
62
23
.79
0.0
62
39
.64
0.2
12
Sam
ple
NA
Z2
018
01
23
20
0.6
10
.00
20
.04
0.0
02
7.9
80
.03
28
.02
0.0
32
16
.01
0.0
42
Sam
ple
NA
Z2
018
01
23
20
0.6
10
.00
20
.04
0.0
02
7.9
50
.02
27
.99
0.0
22
15
.68
0.5
22
Sam
ple
NA
Z2
018
01
23
20
0.6
20
.00
20
.21
0.0
12
7.8
70
.03
28
.08
0.0
32
16
.02
0.0
22
Sam
ple
NB
A2
018
01
23
20
1.1
10
.00
20
.17
0.0
02
15
.80
0.0
32
15
.97
0.0
32
27
.86
0.0
72
Sam
ple
NB
A2
018
01
23
20
1.1
10
.00
20
.12
0.0
02
15
.36
0.0
22
15
.48
0.0
22
28
.31
0.0
72
Sam
ple
NB
A2
018
01
23
20
1.1
00
.00
20
.12
0.0
02
15
.47
0.0
22
15
.58
0.0
22
28
.99
0.0
62
88
Sam
ple
NA
Y2
017
12
21
20
.01
.72
0.0
12
22
22
.73
0.0
72
36
.97
3.3
62
Sam
ple
NA
Y2
017
12
21
20
.01
.73
0.0
02
22
23
.08
0.7
42
37
.30
1.2
22
Sam
ple
NA
Y2
017
12
21
20
.01
.72
0.0
02
22
23
.52
1.1
52
37
.13
2.2
42
Sam
ple
NA
Z2
017
12
21
20
.00
.61
0.0
02
22
7.8
50
.11
21
4.5
60
.31
2
Sam
ple
NA
Z2
017
12
21
20
.00
.61
0.0
02
22
7.8
20
.22
21
4.3
50
.68
2
Sam
ple
NA
Z2
017
12
21
20
.00
.60
0.0
02
22
7.9
00
.01
21
4.2
80
.98
2
Sam
ple
NB
A2
017
12
21
20
.01
.12
0.0
02
22
15
.29
0.2
22
25
.21
0.6
42
Sam
ple
NB
A2
017
12
21
20
.01
.12
0.0
12
22
15
.56
0.5
32
24
.96
1.0
72
Sam
ple
NB
A2
017
12
21
20
.01
.12
0.0
02
22
14
.94
0.0
52
24
.80
2.0
32
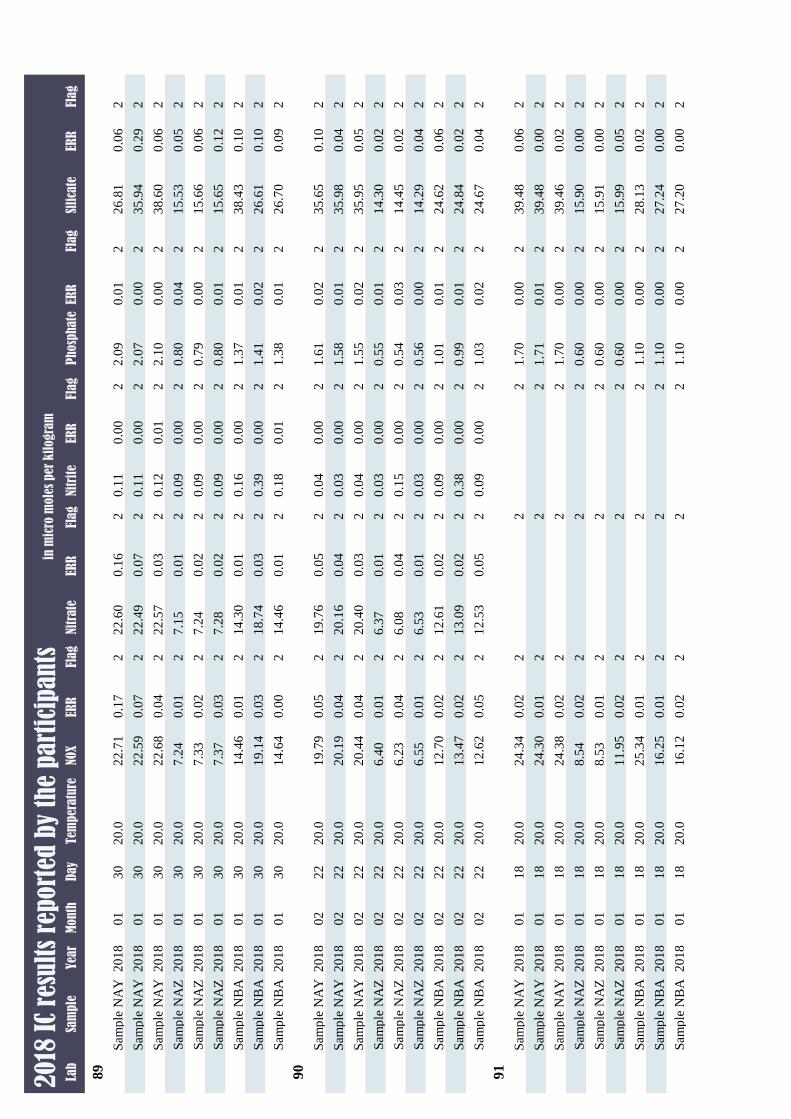
Lab
Sam
ple
Yea
rM
onth
Day
Tem
per
atu
reP
hosp
hate
ERR
Flag
Nitr
ite
ERR
Flag
Nitr
ate
ERR
Flag
NOX
ERR
Flag
Sili
cate
ERR
Flag
20
18 I
C re
sult
s re
port
ed b
y th
e p
art
icip
an
tsin
mic
ro m
ole
s per
kil
ogra
m
89
Sam
ple
NA
Y2
018
01
30
20
.02
.09
0.0
12
0.1
10
.00
22
2.6
00
.16
22
2.7
10
.17
22
6.8
10
.06
2
Sam
ple
NA
Y2
018
01
30
20
.02
.07
0.0
02
0.1
10
.00
22
2.4
90
.07
22
2.5
90
.07
23
5.9
40
.29
2
Sam
ple
NA
Y2
018
01
30
20
.02
.10
0.0
02
0.1
20
.01
22
2.5
70
.03
22
2.6
80
.04
23
8.6
00
.06
2
Sam
ple
NA
Z2
018
01
30
20
.00
.80
0.0
42
0.0
90
.00
27
.15
0.0
12
7.2
40
.01
21
5.5
30
.05
2
Sam
ple
NA
Z2
018
01
30
20
.00
.79
0.0
02
0.0
90
.00
27
.24
0.0
22
7.3
30
.02
21
5.6
60
.06
2
Sam
ple
NA
Z2
018
01
30
20
.00
.80
0.0
12
0.0
90
.00
27
.28
0.0
22
7.3
70
.03
21
5.6
50
.12
2
Sam
ple
NB
A2
018
01
30
20
.01
.37
0.0
12
0.1
60
.00
21
4.3
00
.01
21
4.4
60
.01
23
8.4
30
.10
2
Sam
ple
NB
A2
018
01
30
20
.01
.41
0.0
22
0.3
90
.00
21
8.7
40
.03
21
9.1
40
.03
22
6.6
10
.10
2
Sam
ple
NB
A2
018
01
30
20
.01
.38
0.0
12
0.1
80
.01
21
4.4
60
.01
21
4.6
40
.00
22
6.7
00
.09
2
90
Sam
ple
NA
Y2
018
02
22
20
.01
.61
0.0
22
0.0
40
.00
21
9.7
60
.05
21
9.7
90
.05
23
5.6
50
.10
2
Sam
ple
NA
Y2
018
02
22
20
.01
.58
0.0
12
0.0
30
.00
22
0.1
60
.04
22
0.1
90
.04
23
5.9
80
.04
2
Sam
ple
NA
Y2
018
02
22
20
.01
.55
0.0
22
0.0
40
.00
22
0.4
00
.03
22
0.4
40
.04
23
5.9
50
.05
2
Sam
ple
NA
Z2
018
02
22
20
.00
.55
0.0
12
0.0
30
.00
26
.37
0.0
12
6.4
00
.01
21
4.3
00
.02
2
Sam
ple
NA
Z2
018
02
22
20
.00
.54
0.0
32
0.1
50
.00
26
.08
0.0
42
6.2
30
.04
21
4.4
50
.02
2
Sam
ple
NA
Z2
018
02
22
20
.00
.56
0.0
02
0.0
30
.00
26
.53
0.0
12
6.5
50
.01
21
4.2
90
.04
2
Sam
ple
NB
A2
018
02
22
20
.01
.01
0.0
12
0.0
90
.00
21
2.6
10
.02
21
2.7
00
.02
22
4.6
20
.06
2
Sam
ple
NB
A2
018
02
22
20
.00
.99
0.0
12
0.3
80
.00
21
3.0
90
.02
21
3.4
70
.02
22
4.8
40
.02
2
Sam
ple
NB
A2
018
02
22
20
.01
.03
0.0
22
0.0
90
.00
21
2.5
30
.05
21
2.6
20
.05
22
4.6
70
.04
2
91
Sam
ple
NA
Y2
018
01
18
20
.01
.70
0.0
02
22
24
.34
0.0
22
39
.48
0.0
62
Sam
ple
NA
Y2
018
01
18
20
.01
.71
0.0
12
22
24
.30
0.0
12
39
.48
0.0
02
Sam
ple
NA
Y2
018
01
18
20
.01
.70
0.0
02
22
24
.38
0.0
22
39
.46
0.0
22
Sam
ple
NA
Z2
018
01
18
20
.00
.60
0.0
02
22
8.5
40
.02
21
5.9
00
.00
2
Sam
ple
NA
Z2
018
01
18
20
.00
.60
0.0
02
22
8.5
30
.01
21
5.9
10
.00
2
Sam
ple
NA
Z2
018
01
18
20
.00
.60
0.0
02
22
11
.95
0.0
22
15
.99
0.0
52
Sam
ple
NB
A2
018
01
18
20
.01
.10
0.0
02
22
25
.34
0.0
12
28
.13
0.0
22
Sam
ple
NB
A2
018
01
18
20
.01
.10
0.0
02
22
16
.25
0.0
12
27
.24
0.0
02
Sam
ple
NB
A2
018
01
18
20
.01
.10
0.0
02
22
16
.12
0.0
22
27
.20
0.0
02
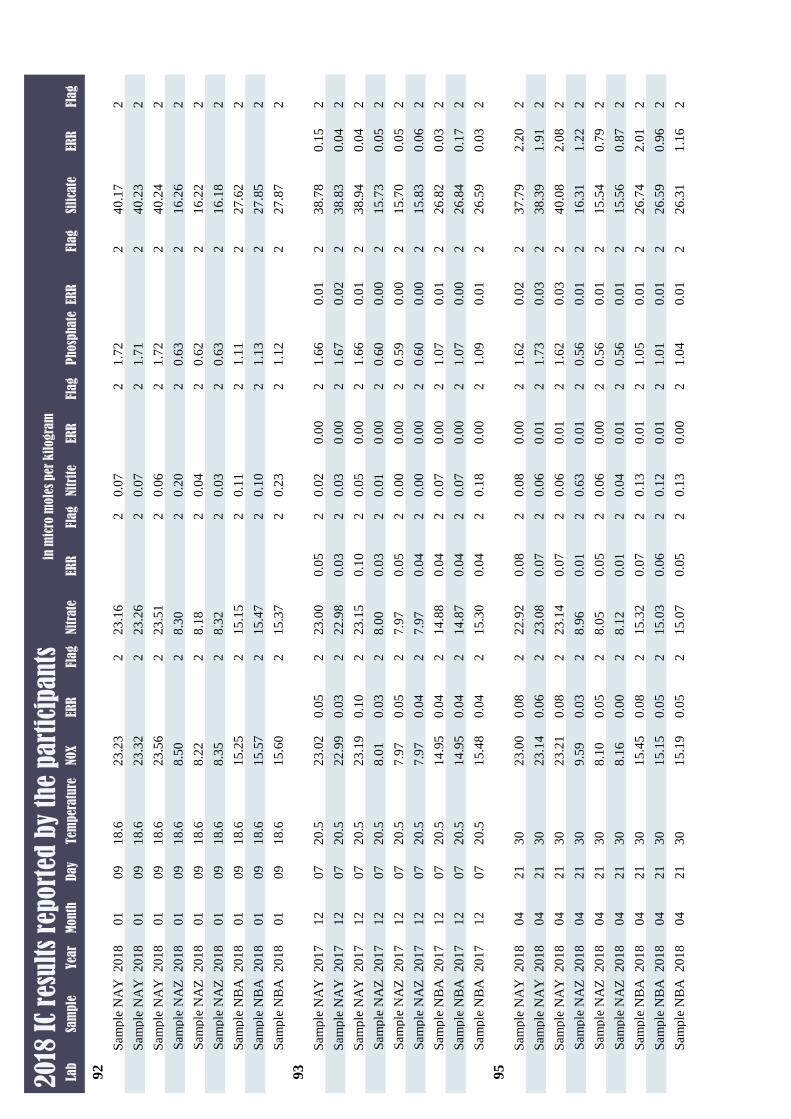
Lab
Sam
ple
Yea
rM
onth
Day
Tem
per
atu
reP
hosp
hate
ERR
Flag
Nitr
ite
ERR
Flag
Nitr
ate
ERR
Flag
NOX
ERR
Flag
Sili
cate
ERR
Flag
20
18 I
C re
sult
s re
port
ed b
y th
e p
art
icip
an
tsin
mic
ro m
ole
s per
kil
ogra
m
92
Sam
ple
NA
Y2
018
01
09
18
.61
.72
20
.07
22
3.1
62
23
.23
24
0.1
72
Sam
ple
NA
Y2
018
01
09
18
.61
.71
20
.07
22
3.2
62
23
.32
24
0.2
32
Sam
ple
NA
Y2
018
01
09
18
.61
.72
20
.06
22
3.5
12
23
.56
24
0.2
42
Sam
ple
NA
Z2
018
01
09
18
.60
.63
20
.20
28
.30
28
.50
21
6.2
62
Sam
ple
NA
Z2
018
01
09
18
.60
.62
20
.04
28
.18
28
.22
21
6.2
22
Sam
ple
NA
Z2
018
01
09
18
.60
.63
20
.03
28
.32
28
.35
21
6.1
82
Sam
ple
NB
A2
018
01
09
18
.61
.11
20
.11
21
5.1
52
15
.25
22
7.6
22
Sam
ple
NB
A2
018
01
09
18
.61
.13
20
.10
21
5.4
72
15
.57
22
7.8
52
Sam
ple
NB
A2
018
01
09
18
.61
.12
20
.23
21
5.3
72
15
.60
22
7.8
72
93
Sam
ple
NA
Y2
017
12
07
20
.51
.66
0.0
12
0.0
20
.00
22
3.0
00
.05
22
3.0
20
.05
23
8.7
80
.15
2
Sam
ple
NA
Y2
017
12
07
20
.51
.67
0.0
22
0.0
30
.00
22
2.9
80
.03
22
2.9
90
.03
23
8.8
30
.04
2
Sam
ple
NA
Y2
017
12
07
20
.51
.66
0.0
12
0.0
50
.00
22
3.1
50
.10
22
3.1
90
.10
23
8.9
40
.04
2
Sam
ple
NA
Z2
017
12
07
20
.50
.60
0.0
02
0.0
10
.00
28
.00
0.0
32
8.0
10
.03
21
5.7
30
.05
2
Sam
ple
NA
Z2
017
12
07
20
.50
.59
0.0
02
0.0
00
.00
27
.97
0.0
52
7.9
70
.05
21
5.7
00
.05
2
Sam
ple
NA
Z2
017
12
07
20
.50
.60
0.0
02
0.0
00
.00
27
.97
0.0
42
7.9
70
.04
21
5.8
30
.06
2
Sam
ple
NB
A2
017
12
07
20
.51
.07
0.0
12
0.0
70
.00
21
4.8
80
.04
21
4.9
50
.04
22
6.8
20
.03
2
Sam
ple
NB
A2
017
12
07
20
.51
.07
0.0
02
0.0
70
.00
21
4.8
70
.04
21
4.9
50
.04
22
6.8
40
.17
2
Sam
ple
NB
A2
017
12
07
20
.51
.09
0.0
12
0.1
80
.00
21
5.3
00
.04
21
5.4
80
.04
22
6.5
90
.03
2
95
Sam
ple
NA
Y2
018
04
21
30
1.6
20
.02
20
.08
0.0
02
22
.92
0.0
82
23
.00
0.0
82
37
.79
2.2
02
Sam
ple
NA
Y2
018
04
21
30
1.7
30
.03
20
.06
0.0
12
23
.08
0.0
72
23
.14
0.0
62
38
.39
1.9
12
Sam
ple
NA
Y2
018
04
21
30
1.6
20
.03
20
.06
0.0
12
23
.14
0.0
72
23
.21
0.0
82
40
.08
2.0
82
Sam
ple
NA
Z2
018
04
21
30
0.5
60
.01
20
.63
0.0
12
8.9
60
.01
29
.59
0.0
32
16
.31
1.2
22
Sam
ple
NA
Z2
018
04
21
30
0.5
60
.01
20
.06
0.0
02
8.0
50
.05
28
.10
0.0
52
15
.54
0.7
92
Sam
ple
NA
Z2
018
04
21
30
0.5
60
.01
20
.04
0.0
12
8.1
20
.01
28
.16
0.0
02
15
.56
0.8
72
Sam
ple
NB
A2
018
04
21
30
1.0
50
.01
20
.13
0.0
12
15
.32
0.0
72
15
.45
0.0
82
26
.74
2.0
12
Sam
ple
NB
A2
018
04
21
30
1.0
10
.01
20
.12
0.0
12
15
.03
0.0
62
15
.15
0.0
52
26
.59
0.9
62
Sam
ple
NB
A2
018
04
21
30
1.0
40
.01
20
.13
0.0
02
15
.07
0.0
52
15
.19
0.0
52
26
.31
1.1
62
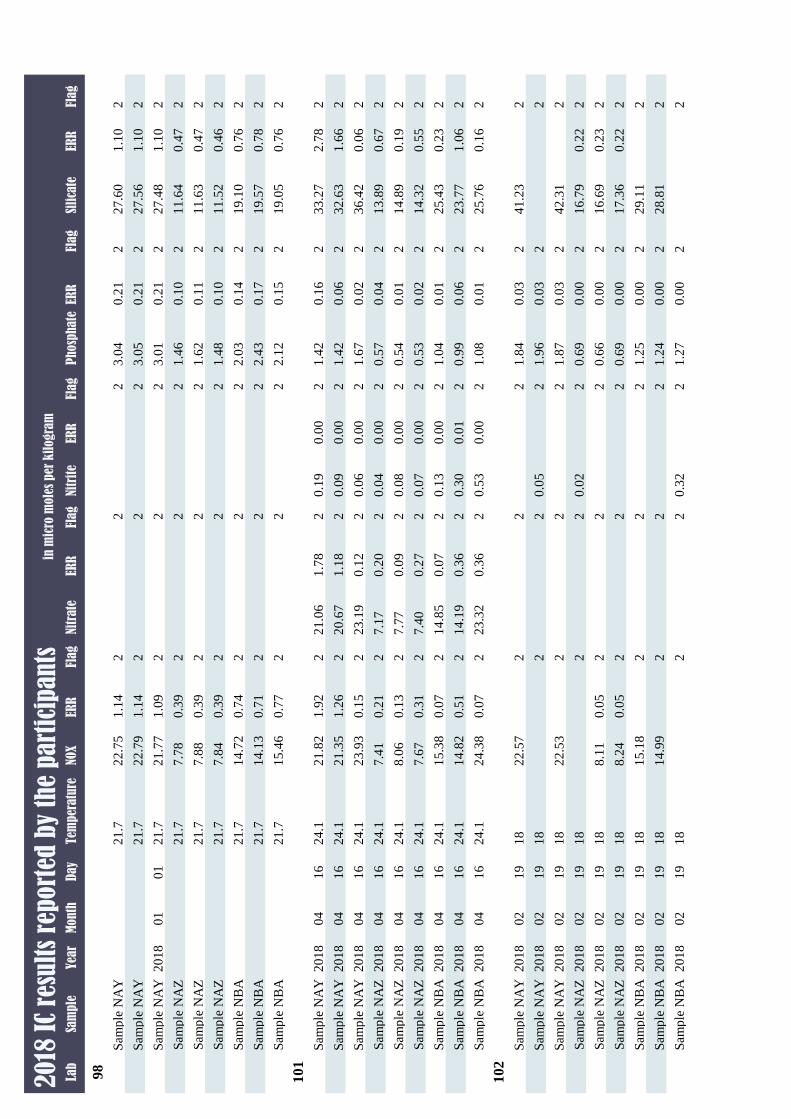
Lab
Sam
ple
Yea
rM
onth
Day
Tem
per
atu
reP
hosp
hate
ERR
Flag
Nitr
ite
ERR
Flag
Nitr
ate
ERR
Flag
NOX
ERR
Flag
Sili
cate
ERR
Flag
20
18 I
C re
sult
s re
port
ed b
y th
e p
art
icip
an
tsin
mic
ro m
ole
s per
kil
ogra
m
98
Sam
ple
NA
Y2
1.7
3.0
40
.21
22
22
2.7
51
.14
22
7.6
01
.10
2
Sam
ple
NA
Y2
1.7
3.0
50
.21
22
22
2.7
91
.14
22
7.5
61
.10
2
Sam
ple
NA
Y2
018
01
01
21
.73
.01
0.2
12
22
21
.77
1.0
92
27
.48
1.1
02
Sam
ple
NA
Z2
1.7
1.4
60
.10
22
27
.78
0.3
92
11
.64
0.4
72
Sam
ple
NA
Z2
1.7
1.6
20
.11
22
27
.88
0.3
92
11
.63
0.4
72
Sam
ple
NA
Z2
1.7
1.4
80
.10
22
27
.84
0.3
92
11
.52
0.4
62
Sam
ple
NB
A2
1.7
2.0
30
.14
22
21
4.7
20
.74
21
9.1
00
.76
2
Sam
ple
NB
A2
1.7
2.4
30
.17
22
21
4.1
30
.71
21
9.5
70
.78
2
Sam
ple
NB
A2
1.7
2.1
20
.15
22
21
5.4
60
.77
21
9.0
50
.76
2
101
Sam
ple
NA
Y2
018
04
16
24
.11
.42
0.1
62
0.1
90
.00
22
1.0
61
.78
22
1.8
21
.92
23
3.2
72
.78
2
Sam
ple
NA
Y2
018
04
16
24
.11
.42
0.0
62
0.0
90
.00
22
0.6
71
.18
22
1.3
51
.26
23
2.6
31
.66
2
Sam
ple
NA
Y2
018
04
16
24
.11
.67
0.0
22
0.0
60
.00
22
3.1
90
.12
22
3.9
30
.15
23
6.4
20
.06
2
Sam
ple
NA
Z2
018
04
16
24
.10
.57
0.0
42
0.0
40
.00
27
.17
0.2
02
7.4
10
.21
21
3.8
90
.67
2
Sam
ple
NA
Z2
018
04
16
24
.10
.54
0.0
12
0.0
80
.00
27
.77
0.0
92
8.0
60
.13
21
4.8
90
.19
2
Sam
ple
NA
Z2
018
04
16
24
.10
.53
0.0
22
0.0
70
.00
27
.40
0.2
72
7.6
70
.31
21
4.3
20
.55
2
Sam
ple
NB
A2
018
04
16
24
.11
.04
0.0
12
0.1
30
.00
21
4.8
50
.07
21
5.3
80
.07
22
5.4
30
.23
2
Sam
ple
NB
A2
018
04
16
24
.10
.99
0.0
62
0.3
00
.01
21
4.1
90
.36
21
4.8
20
.51
22
3.7
71
.06
2
Sam
ple
NB
A2
018
04
16
24
.11
.08
0.0
12
0.5
30
.00
22
3.3
20
.36
22
4.3
80
.07
22
5.7
60
.16
2
102
Sam
ple
NA
Y2
018
02
19
18
1.8
40
.03
22
22
2.5
72
41
.23
2
Sam
ple
NA
Y2
018
02
19
18
1.9
60
.03
20
.05
22
22
Sam
ple
NA
Y2
018
02
19
18
1.8
70
.03
22
22
2.5
32
42
.31
2
Sam
ple
NA
Z2
018
02
19
18
0.6
90
.00
20
.02
22
21
6.7
90
.22
2
Sam
ple
NA
Z2
018
02
19
18
0.6
60
.00
22
28
.11
0.0
52
16
.69
0.2
32
Sam
ple
NA
Z2
018
02
19
18
0.6
90
.00
22
28
.24
0.0
52
17
.36
0.2
22
Sam
ple
NB
A2
018
02
19
18
1.2
50
.00
22
21
5.1
82
29
.11
2
Sam
ple
NB
A2
018
02
19
18
1.2
40
.00
22
21
4.9
92
28
.81
2
Sam
ple
NB
A2
018
02
19
18
1.2
70
.00
20
.32
22
22
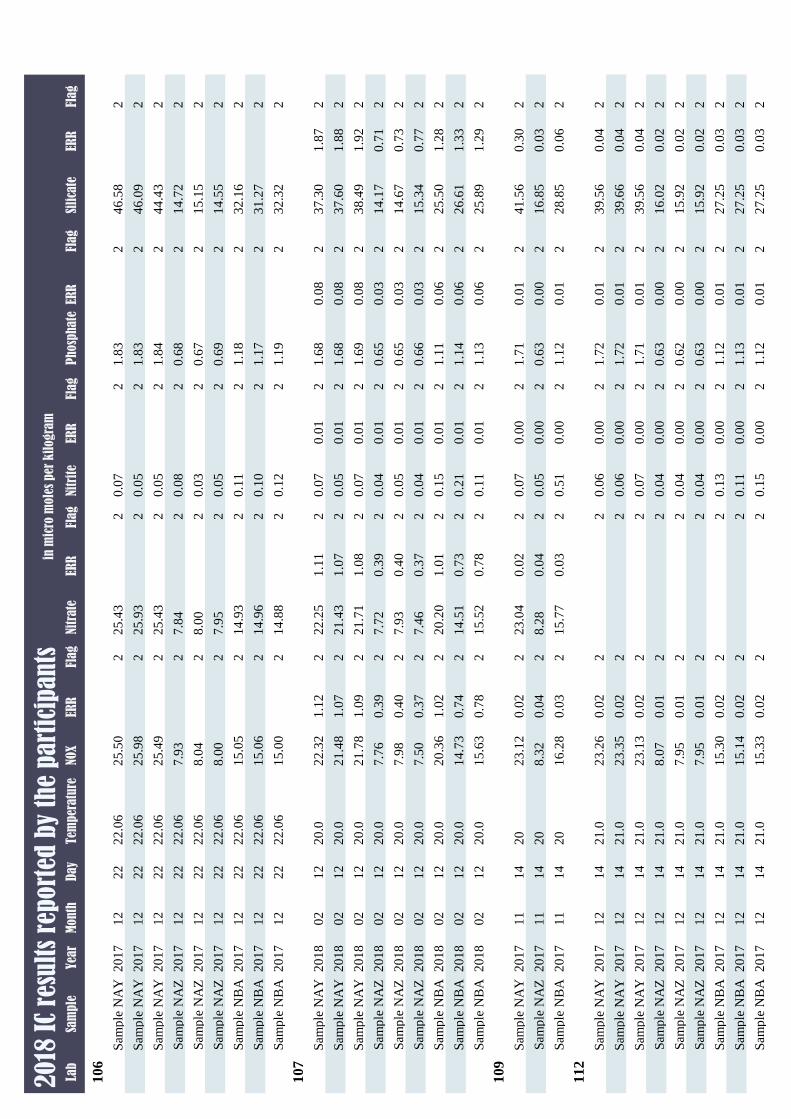
Lab
Sam
ple
Yea
rM
onth
Day
Tem
per
atu
reP
hosp
hate
ERR
Flag
Nitr
ite
ERR
Flag
Nitr
ate
ERR
Flag
NOX
ERR
Flag
Sili
cate
ERR
Flag
20
18 I
C re
sult
s re
port
ed b
y th
e p
art
icip
an
tsin
mic
ro m
ole
s per
kil
ogra
m
106
Sam
ple
NA
Y2
017
12
22
22
.06
1.8
32
0.0
72
25
.43
22
5.5
02
46
.58
2
Sam
ple
NA
Y2
017
12
22
22
.06
1.8
32
0.0
52
25
.93
22
5.9
82
46
.09
2
Sam
ple
NA
Y2
017
12
22
22
.06
1.8
42
0.0
52
25
.43
22
5.4
92
44
.43
2
Sam
ple
NA
Z2
017
12
22
22
.06
0.6
82
0.0
82
7.8
42
7.9
32
14
.72
2
Sam
ple
NA
Z2
017
12
22
22
.06
0.6
72
0.0
32
8.0
02
8.0
42
15
.15
2
Sam
ple
NA
Z2
017
12
22
22
.06
0.6
92
0.0
52
7.9
52
8.0
02
14
.55
2
Sam
ple
NB
A2
017
12
22
22
.06
1.1
82
0.1
12
14
.93
21
5.0
52
32
.16
2
Sam
ple
NB
A2
017
12
22
22
.06
1.1
72
0.1
02
14
.96
21
5.0
62
31
.27
2
Sam
ple
NB
A2
017
12
22
22
.06
1.1
92
0.1
22
14
.88
21
5.0
02
32
.32
2
107
Sam
ple
NA
Y2
018
02
12
20
.01
.68
0.0
82
0.0
70
.01
22
2.2
51
.11
22
2.3
21
.12
23
7.3
01
.87
2
Sam
ple
NA
Y2
018
02
12
20
.01
.68
0.0
82
0.0
50
.01
22
1.4
31
.07
22
1.4
81
.07
23
7.6
01
.88
2
Sam
ple
NA
Y2
018
02
12
20
.01
.69
0.0
82
0.0
70
.01
22
1.7
11
.08
22
1.7
81
.09
23
8.4
91
.92
2
Sam
ple
NA
Z2
018
02
12
20
.00
.65
0.0
32
0.0
40
.01
27
.72
0.3
92
7.7
60
.39
21
4.1
70
.71
2
Sam
ple
NA
Z2
018
02
12
20
.00
.65
0.0
32
0.0
50
.01
27
.93
0.4
02
7.9
80
.40
21
4.6
70
.73
2
Sam
ple
NA
Z2
018
02
12
20
.00
.66
0.0
32
0.0
40
.01
27
.46
0.3
72
7.5
00
.37
21
5.3
40
.77
2
Sam
ple
NB
A2
018
02
12
20
.01
.11
0.0
62
0.1
50
.01
22
0.2
01
.01
22
0.3
61
.02
22
5.5
01
.28
2
Sam
ple
NB
A2
018
02
12
20
.01
.14
0.0
62
0.2
10
.01
21
4.5
10
.73
21
4.7
30
.74
22
6.6
11
.33
2
Sam
ple
NB
A2
018
02
12
20
.01
.13
0.0
62
0.1
10
.01
21
5.5
20
.78
21
5.6
30
.78
22
5.8
91
.29
2
109
Sam
ple
NA
Y2
017
11
14
20
1.7
10
.01
20
.07
0.0
02
23
.04
0.0
22
23
.12
0.0
22
41
.56
0.3
02
Sam
ple
NA
Z2
017
11
14
20
0.6
30
.00
20
.05
0.0
02
8.2
80
.04
28
.32
0.0
42
16
.85
0.0
32
Sam
ple
NB
A2
017
11
14
20
1.1
20
.01
20
.51
0.0
02
15
.77
0.0
32
16
.28
0.0
32
28
.85
0.0
62
112
Sam
ple
NA
Y2
017
12
14
21
.01
.72
0.0
12
0.0
60
.00
22
23
.26
0.0
22
39
.56
0.0
42
Sam
ple
NA
Y2
017
12
14
21
.01
.72
0.0
12
0.0
60
.00
22
23
.35
0.0
22
39
.66
0.0
42
Sam
ple
NA
Y2
017
12
14
21
.01
.71
0.0
12
0.0
70
.00
22
23
.13
0.0
22
39
.56
0.0
42
Sam
ple
NA
Z2
017
12
14
21
.00
.63
0.0
02
0.0
40
.00
22
8.0
70
.01
21
6.0
20
.02
2
Sam
ple
NA
Z2
017
12
14
21
.00
.62
0.0
02
0.0
40
.00
22
7.9
50
.01
21
5.9
20
.02
2
Sam
ple
NA
Z2
017
12
14
21
.00
.63
0.0
02
0.0
40
.00
22
7.9
50
.01
21
5.9
20
.02
2
Sam
ple
NB
A2
017
12
14
21
.01
.12
0.0
12
0.1
30
.00
22
15
.30
0.0
22
27
.25
0.0
32
Sam
ple
NB
A2
017
12
14
21
.01
.13
0.0
12
0.1
10
.00
22
15
.14
0.0
22
27
.25
0.0
32
Sam
ple
NB
A2
017
12
14
21
.01
.12
0.0
12
0.1
50
.00
22
15
.33
0.0
22
27
.25
0.0
32
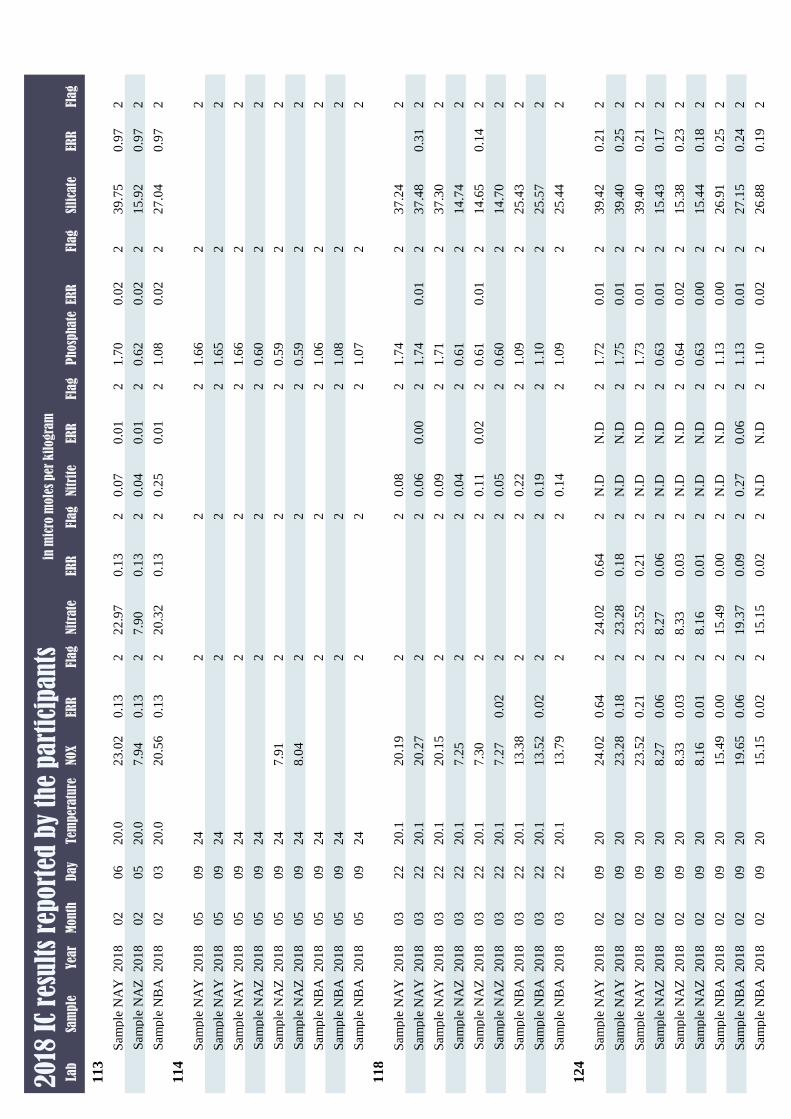
Lab
Sam
ple
Yea
rM
onth
Day
Tem
per
atu
reP
hosp
hate
ERR
Flag
Nitr
ite
ERR
Flag
Nitr
ate
ERR
Flag
NOX
ERR
Flag
Sili
cate
ERR
Flag
20
18 I
C re
sult
s re
port
ed b
y th
e p
art
icip
an
tsin
mic
ro m
ole
s per
kil
ogra
m
113
Sam
ple
NA
Y2
018
02
06
20
.01
.70
0.0
22
0.0
70
.01
22
2.9
70
.13
22
3.0
20
.13
23
9.7
50
.97
2
Sam
ple
NA
Z2
018
02
05
20
.00
.62
0.0
22
0.0
40
.01
27
.90
0.1
32
7.9
40
.13
21
5.9
20
.97
2
Sam
ple
NB
A2
018
02
03
20
.01
.08
0.0
22
0.2
50
.01
22
0.3
20
.13
22
0.5
60
.13
22
7.0
40
.97
2
114
Sam
ple
NA
Y2
018
05
09
24
1.6
62
22
22
Sam
ple
NA
Y2
018
05
09
24
1.6
52
22
22
Sam
ple
NA
Y2
018
05
09
24
1.6
62
22
22
Sam
ple
NA
Z2
018
05
09
24
0.6
02
22
22
Sam
ple
NA
Z2
018
05
09
24
0.5
92
22
7.9
12
2
Sam
ple
NA
Z2
018
05
09
24
0.5
92
22
8.0
42
2
Sam
ple
NB
A2
018
05
09
24
1.0
62
22
22
Sam
ple
NB
A2
018
05
09
24
1.0
82
22
22
Sam
ple
NB
A2
018
05
09
24
1.0
72
22
22
118
Sam
ple
NA
Y2
018
03
22
20
.11
.74
20
.08
22
20
.19
23
7.2
42
Sam
ple
NA
Y2
018
03
22
20
.11
.74
0.0
12
0.0
60
.00
22
20
.27
23
7.4
80
.31
2
Sam
ple
NA
Y2
018
03
22
20
.11
.71
20
.09
22
20
.15
23
7.3
02
Sam
ple
NA
Z2
018
03
22
20
.10
.61
20
.04
22
7.2
52
14
.74
2
Sam
ple
NA
Z2
018
03
22
20
.10
.61
0.0
12
0.1
10
.02
22
7.3
02
14
.65
0.1
42
Sam
ple
NA
Z2
018
03
22
20
.10
.60
20
.05
22
7.2
70
.02
21
4.7
02
Sam
ple
NB
A2
018
03
22
20
.11
.09
20
.22
22
13
.38
22
5.4
32
Sam
ple
NB
A2
018
03
22
20
.11
.10
20
.19
22
13
.52
0.0
22
25
.57
2
Sam
ple
NB
A2
018
03
22
20
.11
.09
20
.14
22
13
.79
22
5.4
42
124
Sam
ple
NA
Y2
018
02
09
20
1.7
20
.01
2N
.DN
.D2
24
.02
0.6
42
24
.02
0.6
42
39
.42
0.2
12
Sam
ple
NA
Y2
018
02
09
20
1.7
50
.01
2N
.DN
.D2
23
.28
0.1
82
23
.28
0.1
82
39
.40
0.2
52
Sam
ple
NA
Y2
018
02
09
20
1.7
30
.01
2N
.DN
.D2
23
.52
0.2
12
23
.52
0.2
12
39
.40
0.2
12
Sam
ple
NA
Z2
018
02
09
20
0.6
30
.01
2N
.DN
.D2
8.2
70
.06
28
.27
0.0
62
15
.43
0.1
72
Sam
ple
NA
Z2
018
02
09
20
0.6
40
.02
2N
.DN
.D2
8.3
30
.03
28
.33
0.0
32
15
.38
0.2
32
Sam
ple
NA
Z2
018
02
09
20
0.6
30
.00
2N
.DN
.D2
8.1
60
.01
28
.16
0.0
12
15
.44
0.1
82
Sam
ple
NB
A2
018
02
09
20
1.1
30
.00
2N
.DN
.D2
15
.49
0.0
02
15
.49
0.0
02
26
.91
0.2
52
Sam
ple
NB
A2
018
02
09
20
1.1
30
.01
20
.27
0.0
62
19
.37
0.0
92
19
.65
0.0
62
27
.15
0.2
42
Sam
ple
NB
A2
018
02
09
20
1.1
00
.02
2N
.DN
.D2
15
.15
0.0
22
15
.15
0.0
22
26
.88
0.1
92
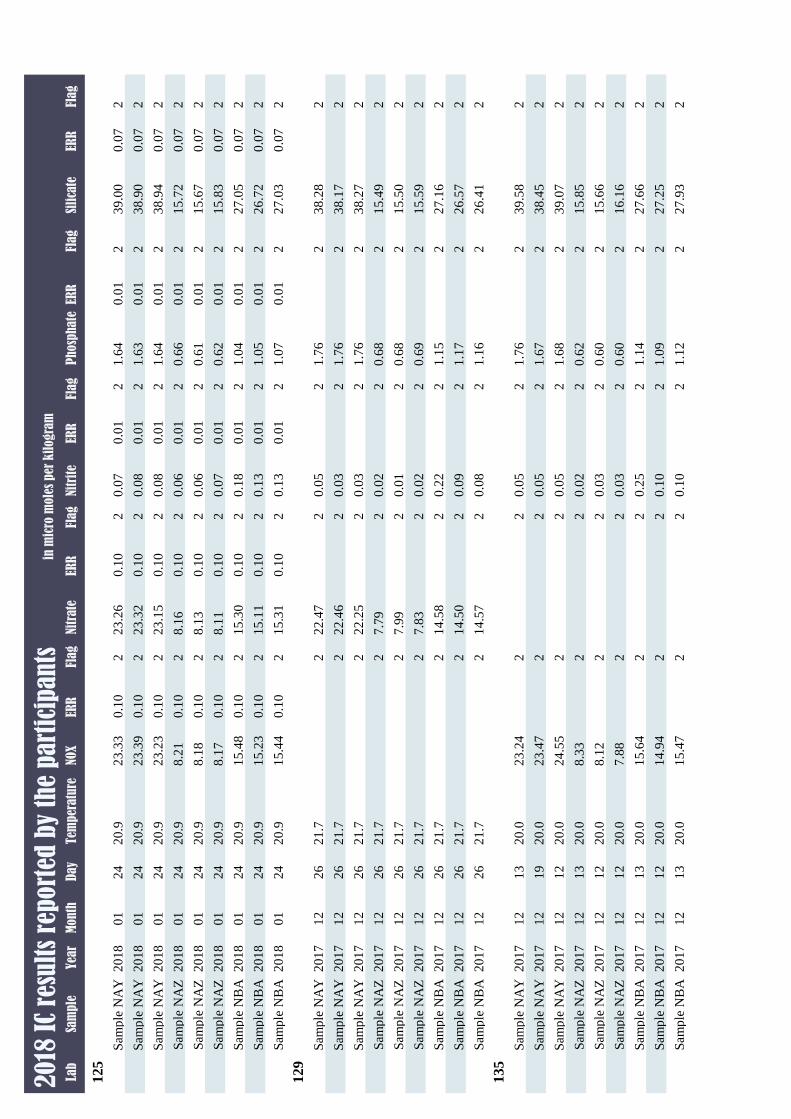
Lab
Sam
ple
Yea
rM
onth
Day
Tem
per
atu
reP
hosp
hate
ERR
Flag
Nitr
ite
ERR
Flag
Nitr
ate
ERR
Flag
NOX
ERR
Flag
Sili
cate
ERR
Flag
20
18 I
C re
sult
s re
port
ed b
y th
e p
art
icip
an
tsin
mic
ro m
ole
s per
kil
ogra
m
125
Sam
ple
NA
Y2
018
01
24
20
.91
.64
0.0
12
0.0
70
.01
22
3.2
60
.10
22
3.3
30
.10
23
9.0
00
.07
2
Sam
ple
NA
Y2
018
01
24
20
.91
.63
0.0
12
0.0
80
.01
22
3.3
20
.10
22
3.3
90
.10
23
8.9
00
.07
2
Sam
ple
NA
Y2
018
01
24
20
.91
.64
0.0
12
0.0
80
.01
22
3.1
50
.10
22
3.2
30
.10
23
8.9
40
.07
2
Sam
ple
NA
Z2
018
01
24
20
.90
.66
0.0
12
0.0
60
.01
28
.16
0.1
02
8.2
10
.10
21
5.7
20
.07
2
Sam
ple
NA
Z2
018
01
24
20
.90
.61
0.0
12
0.0
60
.01
28
.13
0.1
02
8.1
80
.10
21
5.6
70
.07
2
Sam
ple
NA
Z2
018
01
24
20
.90
.62
0.0
12
0.0
70
.01
28
.11
0.1
02
8.1
70
.10
21
5.8
30
.07
2
Sam
ple
NB
A2
018
01
24
20
.91
.04
0.0
12
0.1
80
.01
21
5.3
00
.10
21
5.4
80
.10
22
7.0
50
.07
2
Sam
ple
NB
A2
018
01
24
20
.91
.05
0.0
12
0.1
30
.01
21
5.1
10
.10
21
5.2
30
.10
22
6.7
20
.07
2
Sam
ple
NB
A2
018
01
24
20
.91
.07
0.0
12
0.1
30
.01
21
5.3
10
.10
21
5.4
40
.10
22
7.0
30
.07
2
129
Sam
ple
NA
Y2
017
12
26
21
.71
.76
20
.05
22
2.4
72
23
8.2
82
Sam
ple
NA
Y2
017
12
26
21
.71
.76
20
.03
22
2.4
62
23
8.1
72
Sam
ple
NA
Y2
017
12
26
21
.71
.76
20
.03
22
2.2
52
23
8.2
72
Sam
ple
NA
Z2
017
12
26
21
.70
.68
20
.02
27
.79
22
15
.49
2
Sam
ple
NA
Z2
017
12
26
21
.70
.68
20
.01
27
.99
22
15
.50
2
Sam
ple
NA
Z2
017
12
26
21
.70
.69
20
.02
27
.83
22
15
.59
2
Sam
ple
NB
A2
017
12
26
21
.71
.15
20
.22
21
4.5
82
22
7.1
62
Sam
ple
NB
A2
017
12
26
21
.71
.17
20
.09
21
4.5
02
22
6.5
72
Sam
ple
NB
A2
017
12
26
21
.71
.16
20
.08
21
4.5
72
22
6.4
12
135
Sam
ple
NA
Y2
017
12
13
20
.01
.76
20
.05
22
23
.24
23
9.5
82
Sam
ple
NA
Y2
017
12
19
20
.01
.67
20
.05
22
23
.47
23
8.4
52
Sam
ple
NA
Y2
017
12
12
20
.01
.68
20
.05
22
24
.55
23
9.0
72
Sam
ple
NA
Z2
017
12
13
20
.00
.62
20
.02
22
8.3
32
15
.85
2
Sam
ple
NA
Z2
017
12
12
20
.00
.60
20
.03
22
8.1
22
15
.66
2
Sam
ple
NA
Z2
017
12
12
20
.00
.60
20
.03
22
7.8
82
16
.16
2
Sam
ple
NB
A2
017
12
13
20
.01
.14
20
.25
22
15
.64
22
7.6
62
Sam
ple
NB
A2
017
12
12
20
.01
.09
20
.10
22
14
.94
22
7.2
52
Sam
ple
NB
A2
017
12
13
20
.01
.12
20
.10
22
15
.47
22
7.9
32
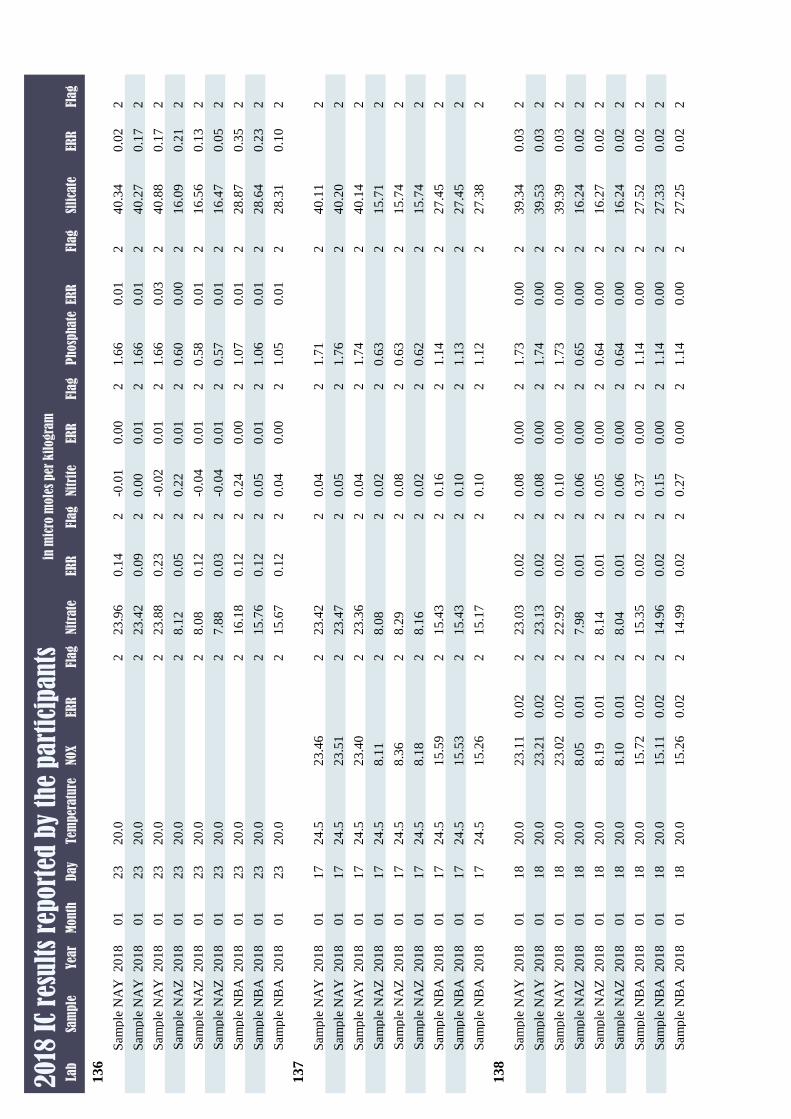
Lab
Sam
ple
Yea
rM
onth
Day
Tem
per
atu
reP
hosp
hate
ERR
Flag
Nitr
ite
ERR
Flag
Nitr
ate
ERR
Flag
NOX
ERR
Flag
Sili
cate
ERR
Flag
20
18 I
C re
sult
s re
port
ed b
y th
e p
art
icip
an
tsin
mic
ro m
ole
s per
kil
ogra
m
136
Sam
ple
NA
Y2
018
01
23
20
.01
.66
0.0
12
-0.0
10
.00
22
3.9
60
.14
22
40
.34
0.0
22
Sam
ple
NA
Y2
018
01
23
20
.01
.66
0.0
12
0.0
00
.01
22
3.4
20
.09
22
40
.27
0.1
72
Sam
ple
NA
Y2
018
01
23
20
.01
.66
0.0
32
-0.0
20
.01
22
3.8
80
.23
22
40
.88
0.1
72
Sam
ple
NA
Z2
018
01
23
20
.00
.60
0.0
02
0.2
20
.01
28
.12
0.0
52
21
6.0
90
.21
2
Sam
ple
NA
Z2
018
01
23
20
.00
.58
0.0
12
-0.0
40
.01
28
.08
0.1
22
21
6.5
60
.13
2
Sam
ple
NA
Z2
018
01
23
20
.00
.57
0.0
12
-0.0
40
.01
27
.88
0.0
32
21
6.4
70
.05
2
Sam
ple
NB
A2
018
01
23
20
.01
.07
0.0
12
0.2
40
.00
21
6.1
80
.12
22
28
.87
0.3
52
Sam
ple
NB
A2
018
01
23
20
.01
.06
0.0
12
0.0
50
.01
21
5.7
60
.12
22
28
.64
0.2
32
Sam
ple
NB
A2
018
01
23
20
.01
.05
0.0
12
0.0
40
.00
21
5.6
70
.12
22
28
.31
0.1
02
137
Sam
ple
NA
Y2
018
01
17
24
.51
.71
20
.04
22
3.4
22
23
.46
24
0.1
12
Sam
ple
NA
Y2
018
01
17
24
.51
.76
20
.05
22
3.4
72
23
.51
24
0.2
02
Sam
ple
NA
Y2
018
01
17
24
.51
.74
20
.04
22
3.3
62
23
.40
24
0.1
42
Sam
ple
NA
Z2
018
01
17
24
.50
.63
20
.02
28
.08
28
.11
21
5.7
12
Sam
ple
NA
Z2
018
01
17
24
.50
.63
20
.08
28
.29
28
.36
21
5.7
42
Sam
ple
NA
Z2
018
01
17
24
.50
.62
20
.02
28
.16
28
.18
21
5.7
42
Sam
ple
NB
A2
018
01
17
24
.51
.14
20
.16
21
5.4
32
15
.59
22
7.4
52
Sam
ple
NB
A2
018
01
17
24
.51
.13
20
.10
21
5.4
32
15
.53
22
7.4
52
Sam
ple
NB
A2
018
01
17
24
.51
.12
20
.10
21
5.1
72
15
.26
22
7.3
82
138
Sam
ple
NA
Y2
018
01
18
20
.01
.73
0.0
02
0.0
80
.00
22
3.0
30
.02
22
3.1
10
.02
23
9.3
40
.03
2
Sam
ple
NA
Y2
018
01
18
20
.01
.74
0.0
02
0.0
80
.00
22
3.1
30
.02
22
3.2
10
.02
23
9.5
30
.03
2
Sam
ple
NA
Y2
018
01
18
20
.01
.73
0.0
02
0.1
00
.00
22
2.9
20
.02
22
3.0
20
.02
23
9.3
90
.03
2
Sam
ple
NA
Z2
018
01
18
20
.00
.65
0.0
02
0.0
60
.00
27
.98
0.0
12
8.0
50
.01
21
6.2
40
.02
2
Sam
ple
NA
Z2
018
01
18
20
.00
.64
0.0
02
0.0
50
.00
28
.14
0.0
12
8.1
90
.01
21
6.2
70
.02
2
Sam
ple
NA
Z2
018
01
18
20
.00
.64
0.0
02
0.0
60
.00
28
.04
0.0
12
8.1
00
.01
21
6.2
40
.02
2
Sam
ple
NB
A2
018
01
18
20
.01
.14
0.0
02
0.3
70
.00
21
5.3
50
.02
21
5.7
20
.02
22
7.5
20
.02
2
Sam
ple
NB
A2
018
01
18
20
.01
.14
0.0
02
0.1
50
.00
21
4.9
60
.02
21
5.1
10
.02
22
7.3
30
.02
2
Sam
ple
NB
A2
018
01
18
20
.01
.14
0.0
02
0.2
70
.00
21
4.9
90
.02
21
5.2
60
.02
22
7.2
50
.02
2
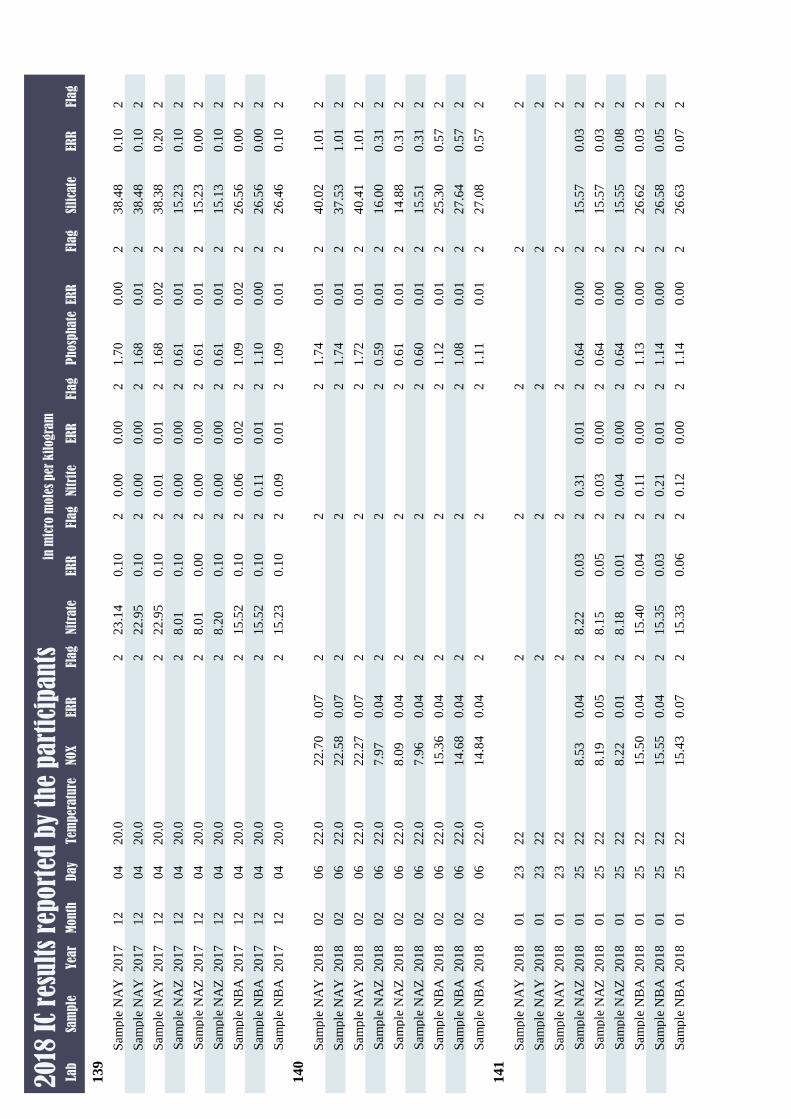
Lab
Sam
ple
Yea
rM
onth
Day
Tem
per
atu
reP
hosp
hate
ERR
Flag
Nitr
ite
ERR
Flag
Nitr
ate
ERR
Flag
NOX
ERR
Flag
Sili
cate
ERR
Flag
20
18 I
C re
sult
s re
port
ed b
y th
e p
art
icip
an
tsin
mic
ro m
ole
s per
kil
ogra
m
139
Sam
ple
NA
Y2
017
12
04
20
.01
.70
0.0
02
0.0
00
.00
22
3.1
40
.10
22
38
.48
0.1
02
Sam
ple
NA
Y2
017
12
04
20
.01
.68
0.0
12
0.0
00
.00
22
2.9
50
.10
22
38
.48
0.1
02
Sam
ple
NA
Y2
017
12
04
20
.01
.68
0.0
22
0.0
10
.01
22
2.9
50
.10
22
38
.38
0.2
02
Sam
ple
NA
Z2
017
12
04
20
.00
.61
0.0
12
0.0
00
.00
28
.01
0.1
02
21
5.2
30
.10
2
Sam
ple
NA
Z2
017
12
04
20
.00
.61
0.0
12
0.0
00
.00
28
.01
0.0
02
21
5.2
30
.00
2
Sam
ple
NA
Z2
017
12
04
20
.00
.61
0.0
12
0.0
00
.00
28
.20
0.1
02
21
5.1
30
.10
2
Sam
ple
NB
A2
017
12
04
20
.01
.09
0.0
22
0.0
60
.02
21
5.5
20
.10
22
26
.56
0.0
02
Sam
ple
NB
A2
017
12
04
20
.01
.10
0.0
02
0.1
10
.01
21
5.5
20
.10
22
26
.56
0.0
02
Sam
ple
NB
A2
017
12
04
20
.01
.09
0.0
12
0.0
90
.01
21
5.2
30
.10
22
26
.46
0.1
02
140
Sam
ple
NA
Y2
018
02
06
22
.01
.74
0.0
12
22
22
.70
0.0
72
40
.02
1.0
12
Sam
ple
NA
Y2
018
02
06
22
.01
.74
0.0
12
22
22
.58
0.0
72
37
.53
1.0
12
Sam
ple
NA
Y2
018
02
06
22
.01
.72
0.0
12
22
22
.27
0.0
72
40
.41
1.0
12
Sam
ple
NA
Z2
018
02
06
22
.00
.59
0.0
12
22
7.9
70
.04
21
6.0
00
.31
2
Sam
ple
NA
Z2
018
02
06
22
.00
.61
0.0
12
22
8.0
90
.04
21
4.8
80
.31
2
Sam
ple
NA
Z2
018
02
06
22
.00
.60
0.0
12
22
7.9
60
.04
21
5.5
10
.31
2
Sam
ple
NB
A2
018
02
06
22
.01
.12
0.0
12
22
15
.36
0.0
42
25
.30
0.5
72
Sam
ple
NB
A2
018
02
06
22
.01
.08
0.0
12
22
14
.68
0.0
42
27
.64
0.5
72
Sam
ple
NB
A2
018
02
06
22
.01
.11
0.0
12
22
14
.84
0.0
42
27
.08
0.5
72
141
Sam
ple
NA
Y2
018
01
23
22
22
22
2
Sam
ple
NA
Y2
018
01
23
22
22
22
2
Sam
ple
NA
Y2
018
01
23
22
22
22
2
Sam
ple
NA
Z2
018
01
25
22
0.6
40
.00
20
.31
0.0
12
8.2
20
.03
28
.53
0.0
42
15
.57
0.0
32
Sam
ple
NA
Z2
018
01
25
22
0.6
40
.00
20
.03
0.0
02
8.1
50
.05
28
.19
0.0
52
15
.57
0.0
32
Sam
ple
NA
Z2
018
01
25
22
0.6
40
.00
20
.04
0.0
02
8.1
80
.01
28
.22
0.0
12
15
.55
0.0
82
Sam
ple
NB
A2
018
01
25
22
1.1
30
.00
20
.11
0.0
02
15
.40
0.0
42
15
.50
0.0
42
26
.62
0.0
32
Sam
ple
NB
A2
018
01
25
22
1.1
40
.00
20
.21
0.0
12
15
.35
0.0
32
15
.55
0.0
42
26
.58
0.0
52
Sam
ple
NB
A2
018
01
25
22
1.1
40
.00
20
.12
0.0
02
15
.33
0.0
62
15
.43
0.0
72
26
.63
0.0
72
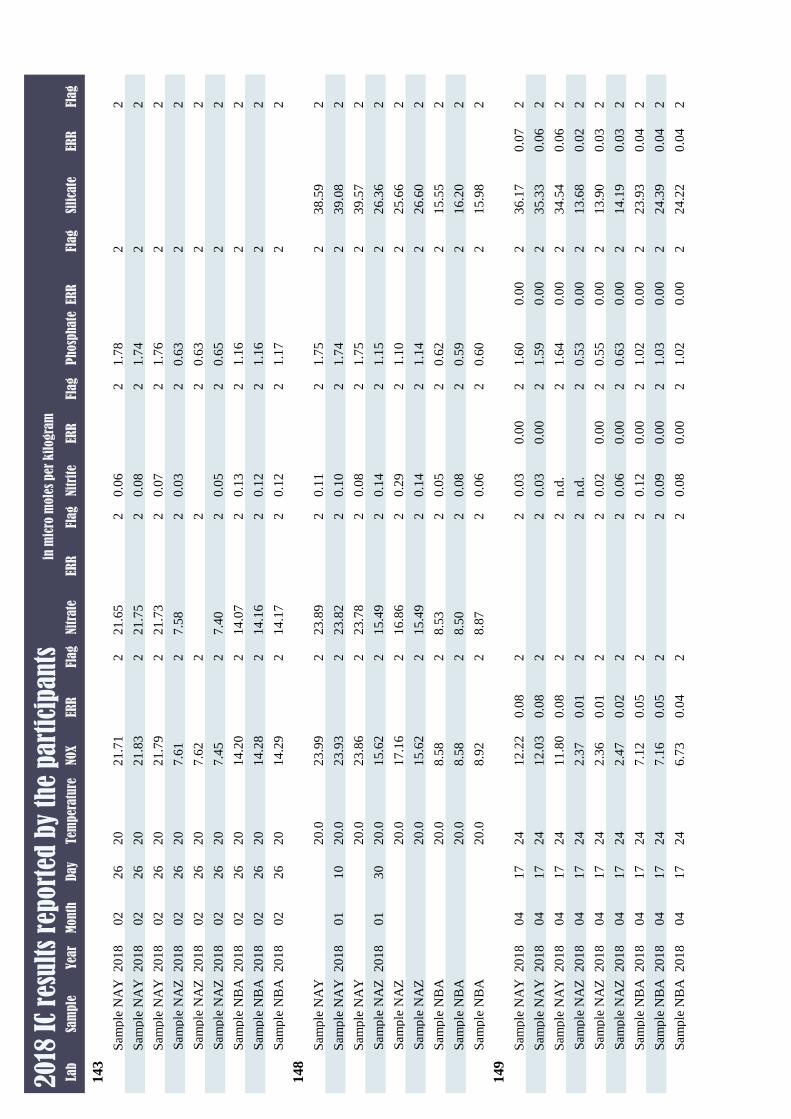
Lab
Sam
ple
Yea
rM
onth
Day
Tem
per
atu
reP
hosp
hate
ERR
Flag
Nitr
ite
ERR
Flag
Nitr
ate
ERR
Flag
NOX
ERR
Flag
Sili
cate
ERR
Flag
20
18 I
C re
sult
s re
port
ed b
y th
e p
art
icip
an
tsin
mic
ro m
ole
s per
kil
ogra
m
143
Sam
ple
NA
Y2
018
02
26
20
1.7
82
0.0
62
21
.65
22
1.7
12
2
Sam
ple
NA
Y2
018
02
26
20
1.7
42
0.0
82
21
.75
22
1.8
32
2
Sam
ple
NA
Y2
018
02
26
20
1.7
62
0.0
72
21
.73
22
1.7
92
2
Sam
ple
NA
Z2
018
02
26
20
0.6
32
0.0
32
7.5
82
7.6
12
2
Sam
ple
NA
Z2
018
02
26
20
0.6
32
22
7.6
22
2
Sam
ple
NA
Z2
018
02
26
20
0.6
52
0.0
52
7.4
02
7.4
52
2
Sam
ple
NB
A2
018
02
26
20
1.1
62
0.1
32
14
.07
21
4.2
02
2
Sam
ple
NB
A2
018
02
26
20
1.1
62
0.1
22
14
.16
21
4.2
82
2
Sam
ple
NB
A2
018
02
26
20
1.1
72
0.1
22
14
.17
21
4.2
92
2
148
Sam
ple
NA
Y2
0.0
1.7
52
0.1
12
23
.89
22
3.9
92
38
.59
2
Sam
ple
NA
Y2
018
01
10
20
.01
.74
20
.10
22
3.8
22
23
.93
23
9.0
82
Sam
ple
NA
Y2
0.0
1.7
52
0.0
82
23
.78
22
3.8
62
39
.57
2
Sam
ple
NA
Z2
018
01
30
20
.01
.15
20
.14
21
5.4
92
15
.62
22
6.3
62
Sam
ple
NA
Z2
0.0
1.1
02
0.2
92
16
.86
21
7.1
62
25
.66
2
Sam
ple
NA
Z2
0.0
1.1
42
0.1
42
15
.49
21
5.6
22
26
.60
2
Sam
ple
NB
A2
0.0
0.6
22
0.0
52
8.5
32
8.5
82
15
.55
2
Sam
ple
NB
A2
0.0
0.5
92
0.0
82
8.5
02
8.5
82
16
.20
2
Sam
ple
NB
A2
0.0
0.6
02
0.0
62
8.8
72
8.9
22
15
.98
2
149
Sam
ple
NA
Y2
018
04
17
24
1.6
00
.00
20
.03
0.0
02
21
2.2
20
.08
23
6.1
70
.07
2
Sam
ple
NA
Y2
018
04
17
24
1.5
90
.00
20
.03
0.0
02
21
2.0
30
.08
23
5.3
30
.06
2
Sam
ple
NA
Y2
018
04
17
24
1.6
40
.00
2n.d
.2
21
1.8
00
.08
23
4.5
40
.06
2
Sam
ple
NA
Z2
018
04
17
24
0.5
30
.00
2n.d
.2
22
.37
0.0
12
13
.68
0.0
22
Sam
ple
NA
Z2
018
04
17
24
0.5
50
.00
20
.02
0.0
02
22
.36
0.0
12
13
.90
0.0
32
Sam
ple
NA
Z2
018
04
17
24
0.6
30
.00
20
.06
0.0
02
22
.47
0.0
22
14
.19
0.0
32
Sam
ple
NB
A2
018
04
17
24
1.0
20
.00
20
.12
0.0
02
27
.12
0.0
52
23
.93
0.0
42
Sam
ple
NB
A2
018
04
17
24
1.0
30
.00
20
.09
0.0
02
27
.16
0.0
52
24
.39
0.0
42
Sam
ple
NB
A2
018
04
17
24
1.0
20
.00
20
.08
0.0
02
26
.73
0.0
42
24
.22
0.0
42
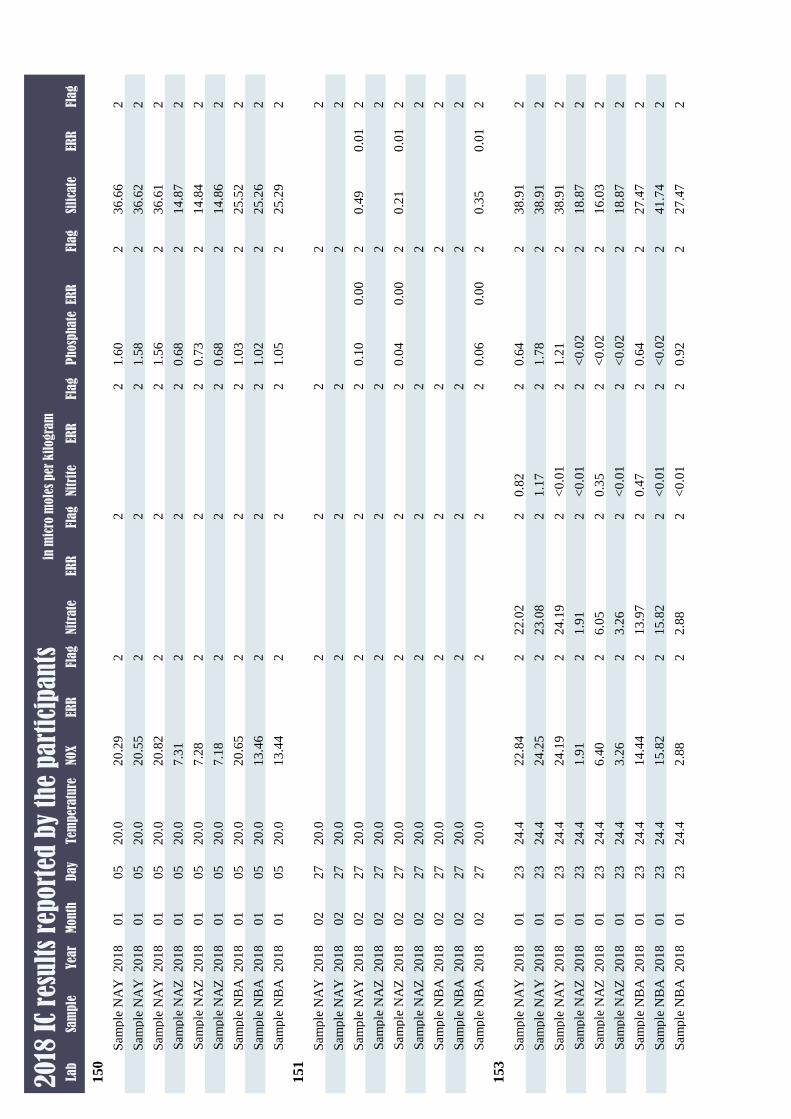
Lab
Sam
ple
Yea
rM
onth
Day
Tem
per
atu
reP
hosp
hate
ERR
Flag
Nitr
ite
ERR
Flag
Nitr
ate
ERR
Flag
NOX
ERR
Flag
Sili
cate
ERR
Flag
20
18 I
C re
sult
s re
port
ed b
y th
e p
art
icip
an
tsin
mic
ro m
ole
s per
kil
ogra
m
150
Sam
ple
NA
Y2
018
01
05
20
.01
.60
22
22
0.2
92
36
.66
2
Sam
ple
NA
Y2
018
01
05
20
.01
.58
22
22
0.5
52
36
.62
2
Sam
ple
NA
Y2
018
01
05
20
.01
.56
22
22
0.8
22
36
.61
2
Sam
ple
NA
Z2
018
01
05
20
.00
.68
22
27
.31
21
4.8
72
Sam
ple
NA
Z2
018
01
05
20
.00
.73
22
27
.28
21
4.8
42
Sam
ple
NA
Z2
018
01
05
20
.00
.68
22
27
.18
21
4.8
62
Sam
ple
NB
A2
018
01
05
20
.01
.03
22
22
0.6
52
25
.52
2
Sam
ple
NB
A2
018
01
05
20
.01
.02
22
21
3.4
62
25
.26
2
Sam
ple
NB
A2
018
01
05
20
.01
.05
22
21
3.4
42
25
.29
2
151
Sam
ple
NA
Y2
018
02
27
20
.02
22
22
Sam
ple
NA
Y2
018
02
27
20
.02
22
22
Sam
ple
NA
Y2
018
02
27
20
.00
.10
0.0
02
22
20
.49
0.0
12
Sam
ple
NA
Z2
018
02
27
20
.02
22
22
Sam
ple
NA
Z2
018
02
27
20
.00
.04
0.0
02
22
20
.21
0.0
12
Sam
ple
NA
Z2
018
02
27
20
.02
22
22
Sam
ple
NB
A2
018
02
27
20
.02
22
22
Sam
ple
NB
A2
018
02
27
20
.02
22
22
Sam
ple
NB
A2
018
02
27
20
.00
.06
0.0
02
22
20
.35
0.0
12
153
Sam
ple
NA
Y2
018
01
23
24
.40
.64
20
.82
22
2.0
22
22
.84
23
8.9
12
Sam
ple
NA
Y2
018
01
23
24
.41
.78
21
.17
22
3.0
82
24
.25
23
8.9
12
Sam
ple
NA
Y2
018
01
23
24
.41
.21
2<
0.0
12
24
.19
22
4.1
92
38
.91
2
Sam
ple
NA
Z2
018
01
23
24
.4<
0.0
22
<0
.01
21
.91
21
.91
21
8.8
72
Sam
ple
NA
Z2
018
01
23
24
.4<
0.0
22
0.3
52
6.0
52
6.4
02
16
.03
2
Sam
ple
NA
Z2
018
01
23
24
.4<
0.0
22
<0
.01
23
.26
23
.26
21
8.8
72
Sam
ple
NB
A2
018
01
23
24
.40
.64
20
.47
21
3.9
72
14
.44
22
7.4
72
Sam
ple
NB
A2
018
01
23
24
.4<
0.0
22
<0
.01
21
5.8
22
15
.82
24
1.7
42
Sam
ple
NB
A2
018
01
23
24
.40
.92
2<
0.0
12
2.8
82
2.8
82
27
.47
2

Lab
Sam
ple
Yea
rM
onth
Day
Tem
per
atu
reP
hosp
hate
ERR
Flag
Nitr
ite
ERR
Flag
Nitr
ate
ERR
Flag
NOX
ERR
Flag
Sili
cate
ERR
Flag
20
18 I
C re
sult
s re
port
ed b
y th
e p
art
icip
an
tsin
mic
ro m
ole
s per
kil
ogra
m
155
Sam
ple
NA
Y2
018
01
19
20
.02
22
23
9.0
61
.17
2
Sam
ple
NA
Y2
018
01
19
20
.01
.72
0.1
72
0.1
02
22
.36
1.1
22
22
.46
1.1
22
2
Sam
ple
NA
Y2
018
01
19
20
.01
.72
0.1
72
0.0
72
23
.37
1.1
72
23
.44
1.1
72
2
Sam
ple
NA
Z2
018
01
19
20
.02
22
22
Sam
ple
NA
Z2
018
01
19
20
.02
22
21
5.8
20
.47
2
Sam
ple
NA
Z2
018
01
19
20
.02
22
22
Sam
ple
NB
A2
018
01
19
20
.01
.11
0.1
12
0.1
32
15
.10
0.7
62
15
.23
0.7
62
2
Sam
ple
NB
A2
018
01
19
20
.02
22
22
Sam
ple
NB
A2
018
01
19
20
.02
22
22
7.3
40
.82
2
156
Sam
ple
NA
Y2
018
02
16
21
.31
.70
0.0
12
0.0
80
.01
22
2.3
60
.18
22
2.4
40
.17
23
9.3
90
.21
2
Sam
ple
NA
Y2
018
02
16
21
.31
.67
0.0
22
0.0
80
.02
22
2.0
20
.67
22
2.4
00
.16
23
8.8
10
.89
2
Sam
ple
NA
Y2
018
02
16
21
.31
.69
0.0
12
0.0
70
.02
22
2.3
30
.17
22
2.4
00
.15
23
9.5
30
.19
2
Sam
ple
NA
Z2
018
02
16
21
.30
.60
0.0
02
0.0
50
.01
27
.73
0.1
02
7.7
60
.05
21
5.9
60
.11
2
Sam
ple
NA
Z2
018
02
16
21
.30
.59
20
.04
28
.59
28
.62
21
5.9
02
Sam
ple
NA
Z2
018
02
16
21
.30
.61
0.0
12
0.0
70
.01
27
.65
0.0
92
7.7
20
.08
21
5.9
90
.09
2
Sam
ple
NB
A2
018
02
16
21
.31
.09
0.0
12
0.1
30
.00
21
4.5
70
.18
21
4.7
00
.18
22
7.1
00
.07
2
Sam
ple
NB
A2
018
02
16
21
.31
.09
0.0
12
0.1
30
.00
21
4.5
60
.18
21
4.6
90
.17
22
7.1
00
.07
2
Sam
ple
NB
A2
018
02
16
21
.31
.07
0.0
22
0.2
30
.01
21
4.5
20
.40
21
4.7
70
.41
22
6.8
40
.11
2
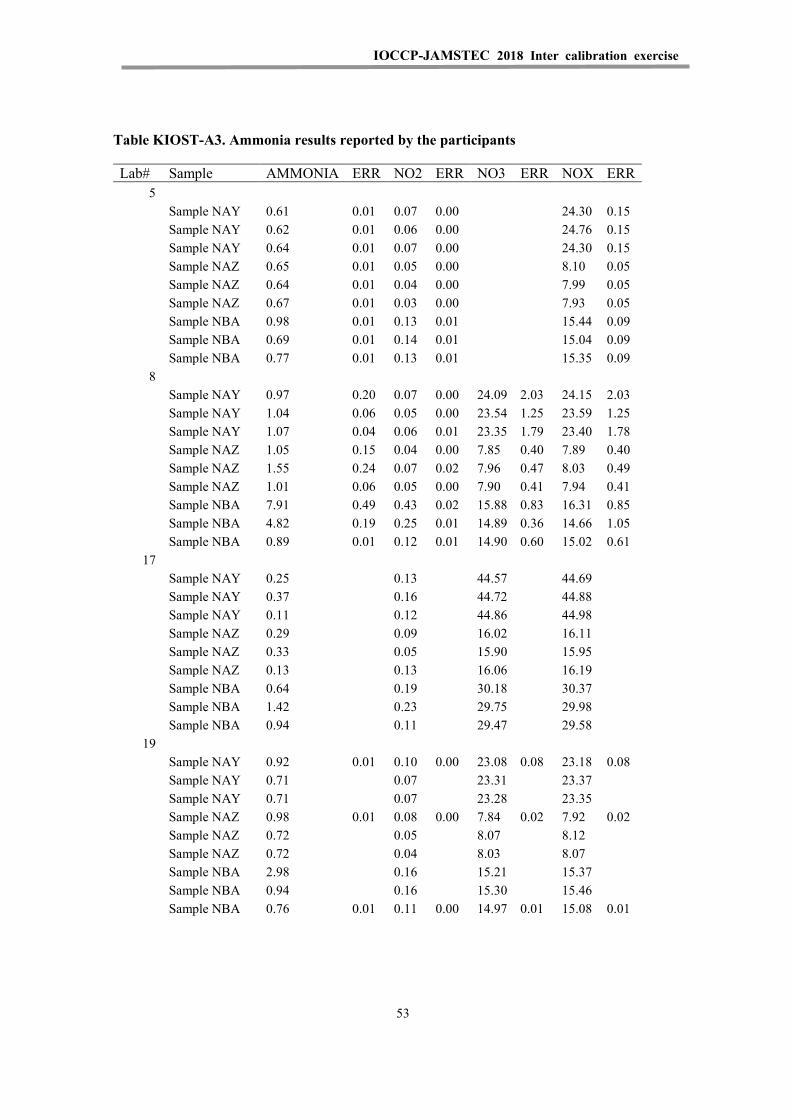
IOCCP-JAMSTEC 2018 Inter calibration exercise
Table KIOST-A3. Ammonia results reported by the participants
Lab# Sample AMMONIA ERR NO2 ERR NO3 ERR NOX ERR 5
Sample NAY 0.61 0.01 0.07 0.00
24.30 0.15
Sample NAY 0.62 0.01 0.06 0.00
24.76 0.15
Sample NAY 0.64 0.01 0.07 0.00
24.30 0.15
Sample NAZ 0.65 0.01 0.05 0.00
8.10 0.05
Sample NAZ 0.64 0.01 0.04 0.00
7.99 0.05
Sample NAZ 0.67 0.01 0.03 0.00
7.93 0.05
Sample NBA 0.98 0.01 0.13 0.01
15.44 0.09
Sample NBA 0.69 0.01 0.14 0.01
15.04 0.09
Sample NBA 0.77 0.01 0.13 0.01
15.35 0.09
8
Sample NAY 0.97 0.20 0.07 0.00 24.09 2.03 24.15 2.03
Sample NAY 1.04 0.06 0.05 0.00 23.54 1.25 23.59 1.25
Sample NAY 1.07 0.04 0.06 0.01 23.35 1.79 23.40 1.78
Sample NAZ 1.05 0.15 0.04 0.00 7.85 0.40 7.89 0.40
Sample NAZ 1.55 0.24 0.07 0.02 7.96 0.47 8.03 0.49
Sample NAZ 1.01 0.06 0.05 0.00 7.90 0.41 7.94 0.41
Sample NBA 7.91 0.49 0.43 0.02 15.88 0.83 16.31 0.85
Sample NBA 4.82 0.19 0.25 0.01 14.89 0.36 14.66 1.05
Sample NBA 0.89 0.01 0.12 0.01 14.90 0.60 15.02 0.61
17
Sample NAY 0.25
0.13
44.57
44.69
Sample NAY 0.37
0.16
44.72
44.88
Sample NAY 0.11
0.12
44.86
44.98
Sample NAZ 0.29
0.09
16.02
16.11
Sample NAZ 0.33
0.05
15.90
15.95
Sample NAZ 0.13
0.13
16.06
16.19
Sample NBA 0.64
0.19
30.18
30.37
Sample NBA 1.42
0.23
29.75
29.98
Sample NBA 0.94
0.11
29.47
29.58
19
Sample NAY 0.92 0.01 0.10 0.00 23.08 0.08 23.18 0.08
Sample NAY 0.71
0.07
23.31
23.37
Sample NAY 0.71
0.07
23.28
23.35
Sample NAZ 0.98 0.01 0.08 0.00 7.84 0.02 7.92 0.02
Sample NAZ 0.72
0.05
8.07
8.12
Sample NAZ 0.72
0.04
8.03
8.07
Sample NBA 2.98
0.16
15.21
15.37
Sample NBA 0.94
0.16
15.30
15.46
Sample NBA 0.76 0.01 0.11 0.00 14.97 0.01 15.08 0.01
53
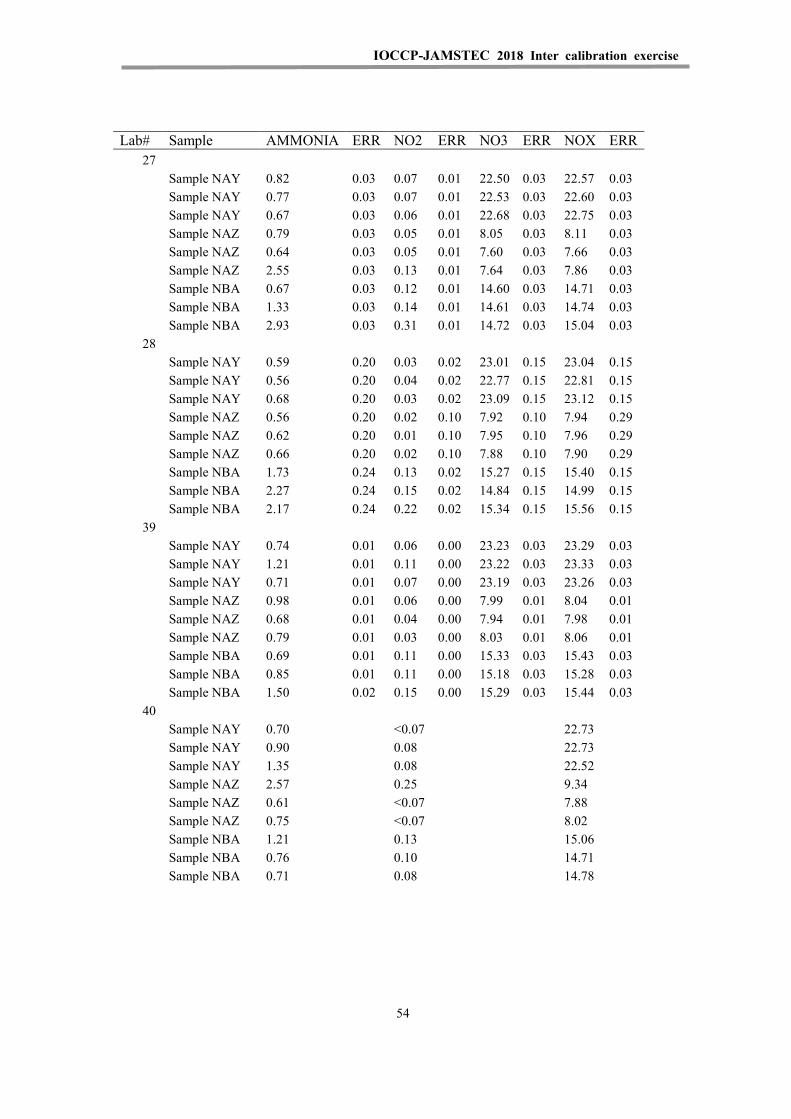
IOCCP-JAMSTEC 2018 Inter calibration exercise
Lab# Sample AMMONIA ERR NO2 ERR NO3 ERR NOX ERR 27
Sample NAY 0.82 0.03 0.07 0.01 22.50 0.03 22.57 0.03
Sample NAY 0.77 0.03 0.07 0.01 22.53 0.03 22.60 0.03
Sample NAY 0.67 0.03 0.06 0.01 22.68 0.03 22.75 0.03
Sample NAZ 0.79 0.03 0.05 0.01 8.05 0.03 8.11 0.03
Sample NAZ 0.64 0.03 0.05 0.01 7.60 0.03 7.66 0.03
Sample NAZ 2.55 0.03 0.13 0.01 7.64 0.03 7.86 0.03
Sample NBA 0.67 0.03 0.12 0.01 14.60 0.03 14.71 0.03
Sample NBA 1.33 0.03 0.14 0.01 14.61 0.03 14.74 0.03
Sample NBA 2.93 0.03 0.31 0.01 14.72 0.03 15.04 0.03
28
Sample NAY 0.59 0.20 0.03 0.02 23.01 0.15 23.04 0.15
Sample NAY 0.56 0.20 0.04 0.02 22.77 0.15 22.81 0.15
Sample NAY 0.68 0.20 0.03 0.02 23.09 0.15 23.12 0.15
Sample NAZ 0.56 0.20 0.02 0.10 7.92 0.10 7.94 0.29
Sample NAZ 0.62 0.20 0.01 0.10 7.95 0.10 7.96 0.29
Sample NAZ 0.66 0.20 0.02 0.10 7.88 0.10 7.90 0.29
Sample NBA 1.73 0.24 0.13 0.02 15.27 0.15 15.40 0.15
Sample NBA 2.27 0.24 0.15 0.02 14.84 0.15 14.99 0.15
Sample NBA 2.17 0.24 0.22 0.02 15.34 0.15 15.56 0.15
39
Sample NAY 0.74 0.01 0.06 0.00 23.23 0.03 23.29 0.03
Sample NAY 1.21 0.01 0.11 0.00 23.22 0.03 23.33 0.03
Sample NAY 0.71 0.01 0.07 0.00 23.19 0.03 23.26 0.03
Sample NAZ 0.98 0.01 0.06 0.00 7.99 0.01 8.04 0.01
Sample NAZ 0.68 0.01 0.04 0.00 7.94 0.01 7.98 0.01
Sample NAZ 0.79 0.01 0.03 0.00 8.03 0.01 8.06 0.01
Sample NBA 0.69 0.01 0.11 0.00 15.33 0.03 15.43 0.03
Sample NBA 0.85 0.01 0.11 0.00 15.18 0.03 15.28 0.03
Sample NBA 1.50 0.02 0.15 0.00 15.29 0.03 15.44 0.03
40
Sample NAY 0.70
<0.07
22.73
Sample NAY 0.90
0.08
22.73
Sample NAY 1.35
0.08
22.52
Sample NAZ 2.57
0.25
9.34
Sample NAZ 0.61
<0.07
7.88
Sample NAZ 0.75
<0.07
8.02
Sample NBA 1.21
0.13
15.06
Sample NBA 0.76
0.10
14.71
Sample NBA 0.71
0.08
14.78
54
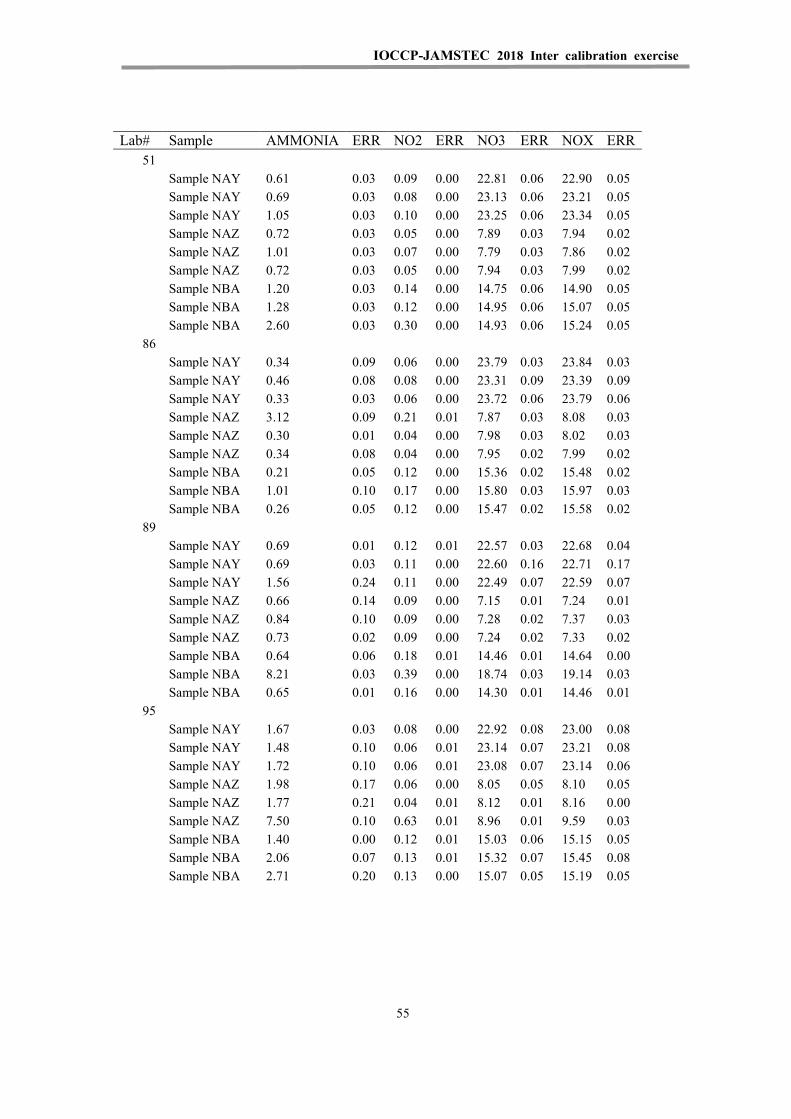
IOCCP-JAMSTEC 2018 Inter calibration exercise
Lab# Sample AMMONIA ERR NO2 ERR NO3 ERR NOX ERR 51
Sample NAY 0.61 0.03 0.09 0.00 22.81 0.06 22.90 0.05
Sample NAY 0.69 0.03 0.08 0.00 23.13 0.06 23.21 0.05
Sample NAY 1.05 0.03 0.10 0.00 23.25 0.06 23.34 0.05
Sample NAZ 0.72 0.03 0.05 0.00 7.89 0.03 7.94 0.02
Sample NAZ 1.01 0.03 0.07 0.00 7.79 0.03 7.86 0.02
Sample NAZ 0.72 0.03 0.05 0.00 7.94 0.03 7.99 0.02
Sample NBA 1.20 0.03 0.14 0.00 14.75 0.06 14.90 0.05
Sample NBA 1.28 0.03 0.12 0.00 14.95 0.06 15.07 0.05
Sample NBA 2.60 0.03 0.30 0.00 14.93 0.06 15.24 0.05
86
Sample NAY 0.34 0.09 0.06 0.00 23.79 0.03 23.84 0.03
Sample NAY 0.46 0.08 0.08 0.00 23.31 0.09 23.39 0.09
Sample NAY 0.33 0.03 0.06 0.00 23.72 0.06 23.79 0.06
Sample NAZ 3.12 0.09 0.21 0.01 7.87 0.03 8.08 0.03
Sample NAZ 0.30 0.01 0.04 0.00 7.98 0.03 8.02 0.03
Sample NAZ 0.34 0.08 0.04 0.00 7.95 0.02 7.99 0.02
Sample NBA 0.21 0.05 0.12 0.00 15.36 0.02 15.48 0.02
Sample NBA 1.01 0.10 0.17 0.00 15.80 0.03 15.97 0.03
Sample NBA 0.26 0.05 0.12 0.00 15.47 0.02 15.58 0.02
89
Sample NAY 0.69 0.01 0.12 0.01 22.57 0.03 22.68 0.04
Sample NAY 0.69 0.03 0.11 0.00 22.60 0.16 22.71 0.17
Sample NAY 1.56 0.24 0.11 0.00 22.49 0.07 22.59 0.07
Sample NAZ 0.66 0.14 0.09 0.00 7.15 0.01 7.24 0.01
Sample NAZ 0.84 0.10 0.09 0.00 7.28 0.02 7.37 0.03
Sample NAZ 0.73 0.02 0.09 0.00 7.24 0.02 7.33 0.02
Sample NBA 0.64 0.06 0.18 0.01 14.46 0.01 14.64 0.00
Sample NBA 8.21 0.03 0.39 0.00 18.74 0.03 19.14 0.03
Sample NBA 0.65 0.01 0.16 0.00 14.30 0.01 14.46 0.01
95
Sample NAY 1.67 0.03 0.08 0.00 22.92 0.08 23.00 0.08
Sample NAY 1.48 0.10 0.06 0.01 23.14 0.07 23.21 0.08
Sample NAY 1.72 0.10 0.06 0.01 23.08 0.07 23.14 0.06
Sample NAZ 1.98 0.17 0.06 0.00 8.05 0.05 8.10 0.05
Sample NAZ 1.77 0.21 0.04 0.01 8.12 0.01 8.16 0.00
Sample NAZ 7.50 0.10 0.63 0.01 8.96 0.01 9.59 0.03
Sample NBA 1.40 0.00 0.12 0.01 15.03 0.06 15.15 0.05
Sample NBA 2.06 0.07 0.13 0.01 15.32 0.07 15.45 0.08
Sample NBA 2.71 0.20 0.13 0.00 15.07 0.05 15.19 0.05
55
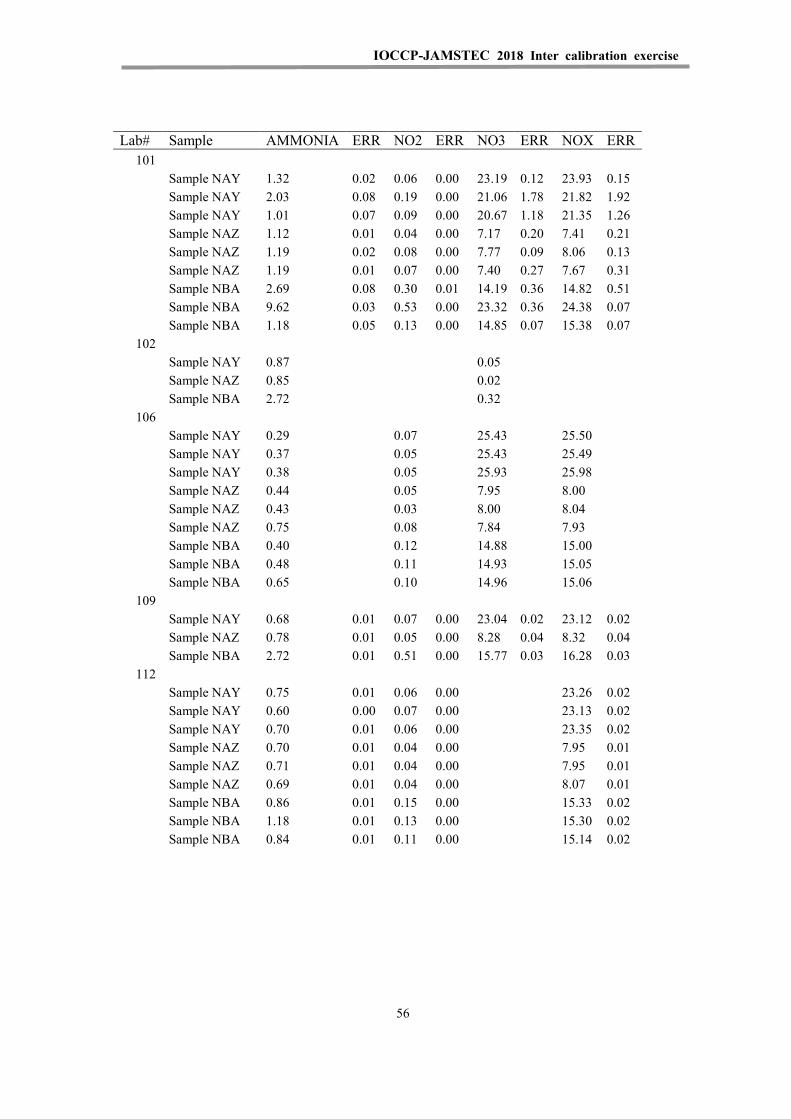
IOCCP-JAMSTEC 2018 Inter calibration exercise
Lab# Sample AMMONIA ERR NO2 ERR NO3 ERR NOX ERR 101
Sample NAY 1.32 0.02 0.06 0.00 23.19 0.12 23.93 0.15
Sample NAY 2.03 0.08 0.19 0.00 21.06 1.78 21.82 1.92
Sample NAY 1.01 0.07 0.09 0.00 20.67 1.18 21.35 1.26
Sample NAZ 1.12 0.01 0.04 0.00 7.17 0.20 7.41 0.21
Sample NAZ 1.19 0.02 0.08 0.00 7.77 0.09 8.06 0.13
Sample NAZ 1.19 0.01 0.07 0.00 7.40 0.27 7.67 0.31
Sample NBA 2.69 0.08 0.30 0.01 14.19 0.36 14.82 0.51
Sample NBA 9.62 0.03 0.53 0.00 23.32 0.36 24.38 0.07
Sample NBA 1.18 0.05 0.13 0.00 14.85 0.07 15.38 0.07
102
Sample NAY 0.87
0.05
Sample NAZ 0.85
0.02
Sample NBA 2.72
0.32
106
Sample NAY 0.29
0.07
25.43
25.50
Sample NAY 0.37
0.05
25.43
25.49
Sample NAY 0.38
0.05
25.93
25.98
Sample NAZ 0.44
0.05
7.95
8.00
Sample NAZ 0.43
0.03
8.00
8.04
Sample NAZ 0.75
0.08
7.84
7.93
Sample NBA 0.40
0.12
14.88
15.00
Sample NBA 0.48
0.11
14.93
15.05
Sample NBA 0.65
0.10
14.96
15.06
109
Sample NAY 0.68 0.01 0.07 0.00 23.04 0.02 23.12 0.02
Sample NAZ 0.78 0.01 0.05 0.00 8.28 0.04 8.32 0.04
Sample NBA 2.72 0.01 0.51 0.00 15.77 0.03 16.28 0.03
112
Sample NAY 0.75 0.01 0.06 0.00
23.26 0.02
Sample NAY 0.60 0.00 0.07 0.00
23.13 0.02
Sample NAY 0.70 0.01 0.06 0.00
23.35 0.02
Sample NAZ 0.70 0.01 0.04 0.00
7.95 0.01
Sample NAZ 0.71 0.01 0.04 0.00
7.95 0.01
Sample NAZ 0.69 0.01 0.04 0.00
8.07 0.01
Sample NBA 0.86 0.01 0.15 0.00
15.33 0.02
Sample NBA 1.18 0.01 0.13 0.00
15.30 0.02
Sample NBA 0.84 0.01 0.11 0.00
15.14 0.02
56
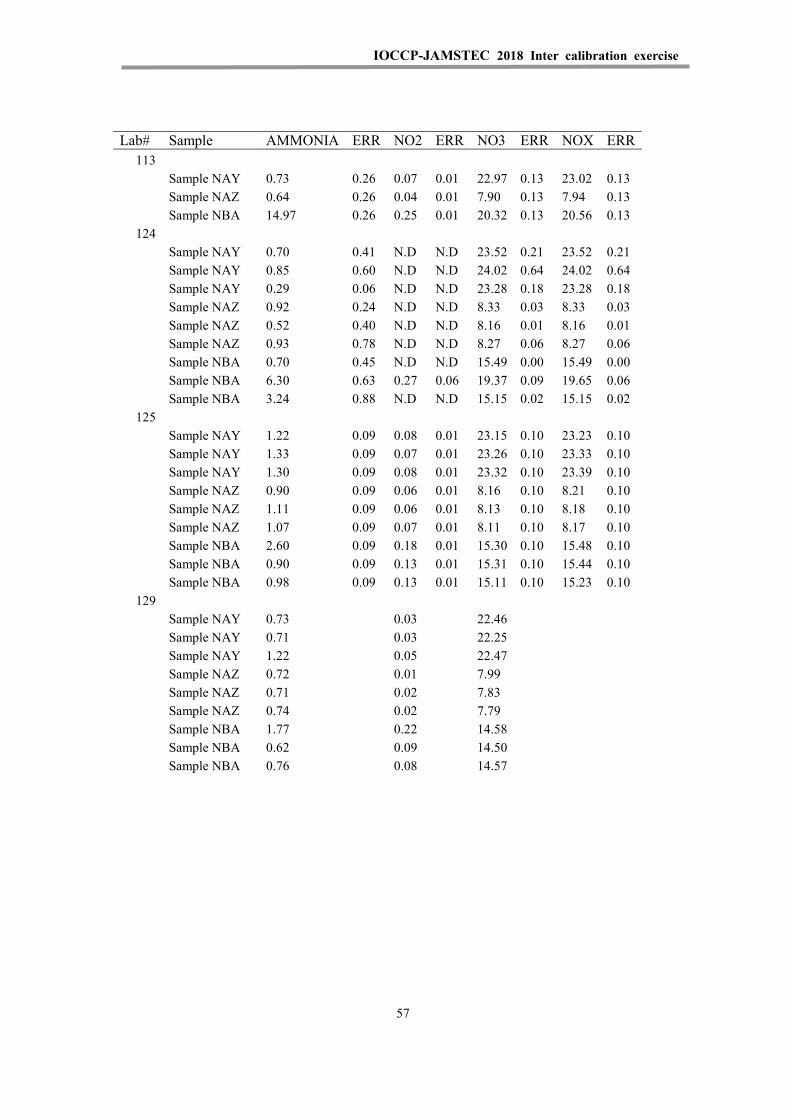
IOCCP-JAMSTEC 2018 Inter calibration exercise
Lab# Sample AMMONIA ERR NO2 ERR NO3 ERR NOX ERR 113
Sample NAY 0.73 0.26 0.07 0.01 22.97 0.13 23.02 0.13
Sample NAZ 0.64 0.26 0.04 0.01 7.90 0.13 7.94 0.13
Sample NBA 14.97 0.26 0.25 0.01 20.32 0.13 20.56 0.13
124
Sample NAY 0.70 0.41 N.D N.D 23.52 0.21 23.52 0.21
Sample NAY 0.85 0.60 N.D N.D 24.02 0.64 24.02 0.64
Sample NAY 0.29 0.06 N.D N.D 23.28 0.18 23.28 0.18
Sample NAZ 0.92 0.24 N.D N.D 8.33 0.03 8.33 0.03
Sample NAZ 0.52 0.40 N.D N.D 8.16 0.01 8.16 0.01
Sample NAZ 0.93 0.78 N.D N.D 8.27 0.06 8.27 0.06
Sample NBA 0.70 0.45 N.D N.D 15.49 0.00 15.49 0.00
Sample NBA 6.30 0.63 0.27 0.06 19.37 0.09 19.65 0.06
Sample NBA 3.24 0.88 N.D N.D 15.15 0.02 15.15 0.02
125
Sample NAY 1.22 0.09 0.08 0.01 23.15 0.10 23.23 0.10
Sample NAY 1.33 0.09 0.07 0.01 23.26 0.10 23.33 0.10
Sample NAY 1.30 0.09 0.08 0.01 23.32 0.10 23.39 0.10
Sample NAZ 0.90 0.09 0.06 0.01 8.16 0.10 8.21 0.10
Sample NAZ 1.11 0.09 0.06 0.01 8.13 0.10 8.18 0.10
Sample NAZ 1.07 0.09 0.07 0.01 8.11 0.10 8.17 0.10
Sample NBA 2.60 0.09 0.18 0.01 15.30 0.10 15.48 0.10
Sample NBA 0.90 0.09 0.13 0.01 15.31 0.10 15.44 0.10
Sample NBA 0.98 0.09 0.13 0.01 15.11 0.10 15.23 0.10
129
Sample NAY 0.73
0.03
22.46
Sample NAY 0.71
0.03
22.25
Sample NAY 1.22
0.05
22.47
Sample NAZ 0.72
0.01
7.99
Sample NAZ 0.71
0.02
7.83
Sample NAZ 0.74
0.02
7.79
Sample NBA 1.77
0.22
14.58
Sample NBA 0.62
0.09
14.50
Sample NBA 0.76
0.08
14.57
57
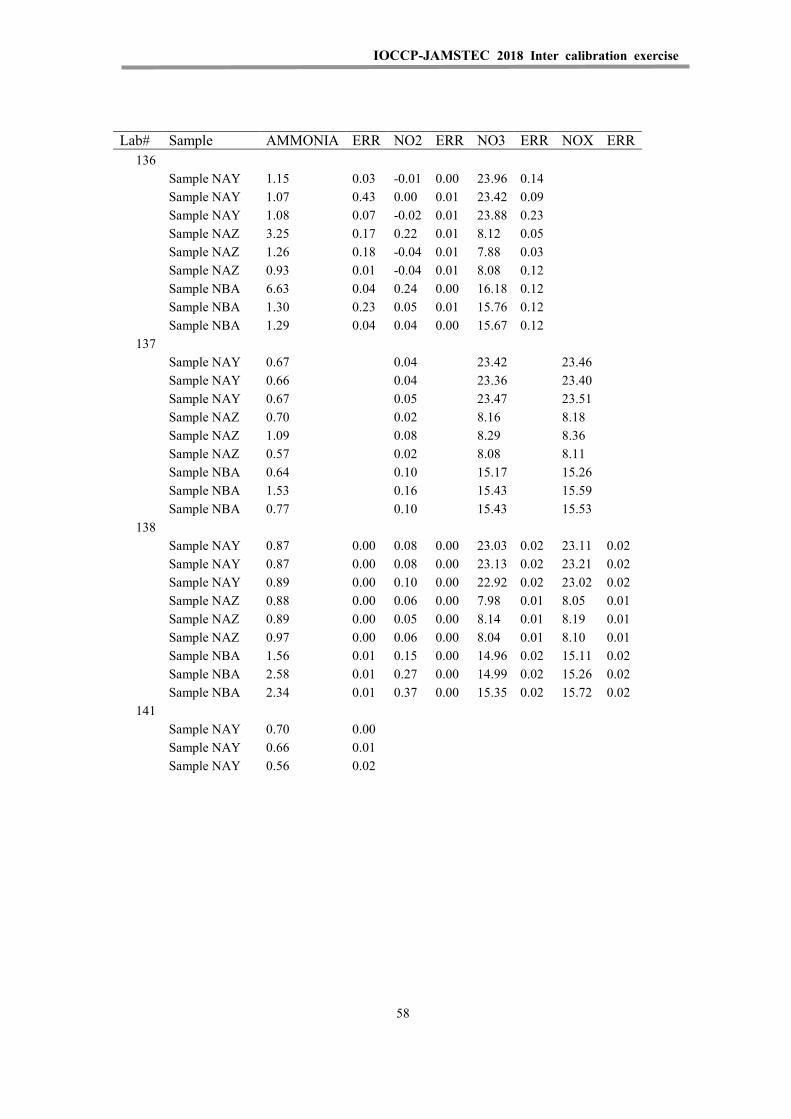
IOCCP-JAMSTEC 2018 Inter calibration exercise
Lab# Sample AMMONIA ERR NO2 ERR NO3 ERR NOX ERR 136
Sample NAY 1.15 0.03 -0.01 0.00 23.96 0.14
Sample NAY 1.07 0.43 0.00 0.01 23.42 0.09
Sample NAY 1.08 0.07 -0.02 0.01 23.88 0.23
Sample NAZ 3.25 0.17 0.22 0.01 8.12 0.05
Sample NAZ 1.26 0.18 -0.04 0.01 7.88 0.03
Sample NAZ 0.93 0.01 -0.04 0.01 8.08 0.12
Sample NBA 6.63 0.04 0.24 0.00 16.18 0.12
Sample NBA 1.30 0.23 0.05 0.01 15.76 0.12
Sample NBA 1.29 0.04 0.04 0.00 15.67 0.12 137
Sample NAY 0.67
0.04
23.42
23.46
Sample NAY 0.66
0.04
23.36
23.40
Sample NAY 0.67
0.05
23.47
23.51
Sample NAZ 0.70
0.02
8.16
8.18
Sample NAZ 1.09
0.08
8.29
8.36
Sample NAZ 0.57
0.02
8.08
8.11
Sample NBA 0.64
0.10
15.17
15.26
Sample NBA 1.53
0.16
15.43
15.59
Sample NBA 0.77
0.10
15.43
15.53 138
Sample NAY 0.87 0.00 0.08 0.00 23.03 0.02 23.11 0.02
Sample NAY 0.87 0.00 0.08 0.00 23.13 0.02 23.21 0.02
Sample NAY 0.89 0.00 0.10 0.00 22.92 0.02 23.02 0.02
Sample NAZ 0.88 0.00 0.06 0.00 7.98 0.01 8.05 0.01
Sample NAZ 0.89 0.00 0.05 0.00 8.14 0.01 8.19 0.01
Sample NAZ 0.97 0.00 0.06 0.00 8.04 0.01 8.10 0.01
Sample NBA 1.56 0.01 0.15 0.00 14.96 0.02 15.11 0.02
Sample NBA 2.58 0.01 0.27 0.00 14.99 0.02 15.26 0.02
Sample NBA 2.34 0.01 0.37 0.00 15.35 0.02 15.72 0.02
141
Sample NAY 0.70 0.00
Sample NAY 0.66 0.01
Sample NAY 0.56 0.02
58
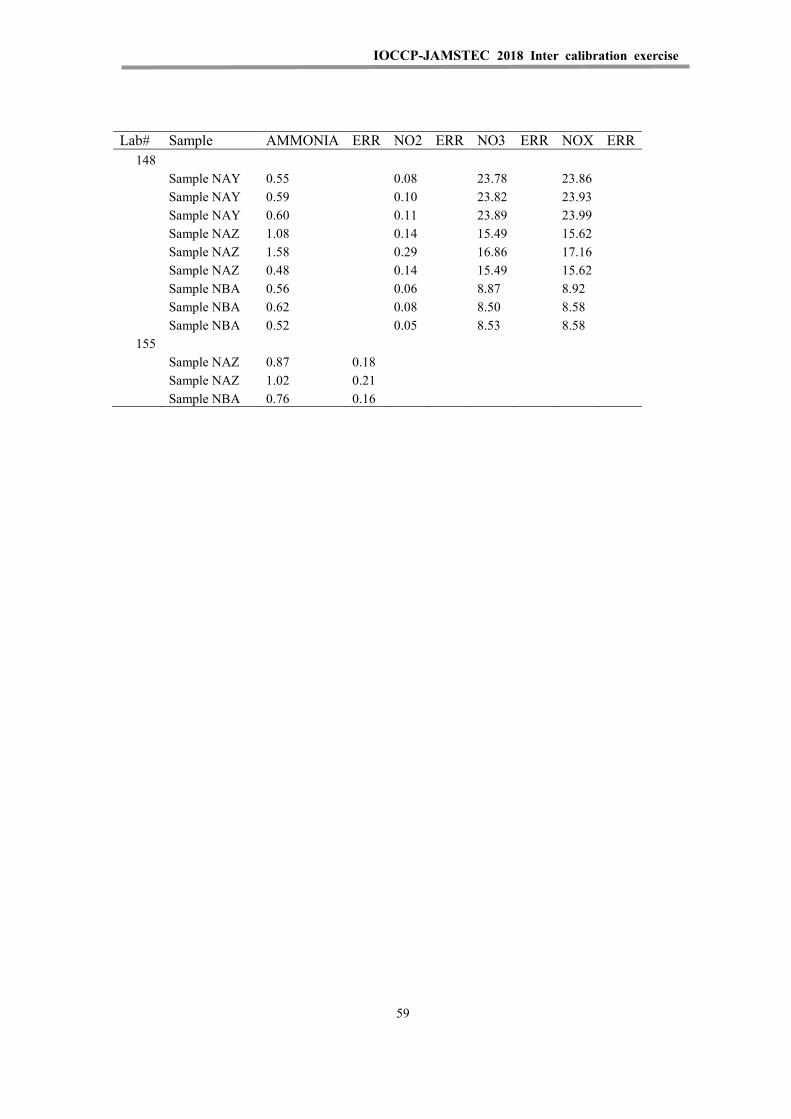
IOCCP-JAMSTEC 2018 Inter calibration exercise
Lab# Sample AMMONIA ERR NO2 ERR NO3 ERR NOX ERR 148
Sample NAY 0.55
0.08
23.78
23.86
Sample NAY 0.59
0.10
23.82
23.93
Sample NAY 0.60
0.11
23.89
23.99
Sample NAZ 1.08
0.14
15.49
15.62
Sample NAZ 1.58
0.29
16.86
17.16
Sample NAZ 0.48
0.14
15.49
15.62
Sample NBA 0.56
0.06
8.87
8.92
Sample NBA 0.62
0.08
8.50
8.58
Sample NBA 0.52
0.05
8.53
8.58 155
Sample NAZ 0.87 0.18
Sample NAZ 1.02 0.21
Sample NBA 0.76 0.16
59
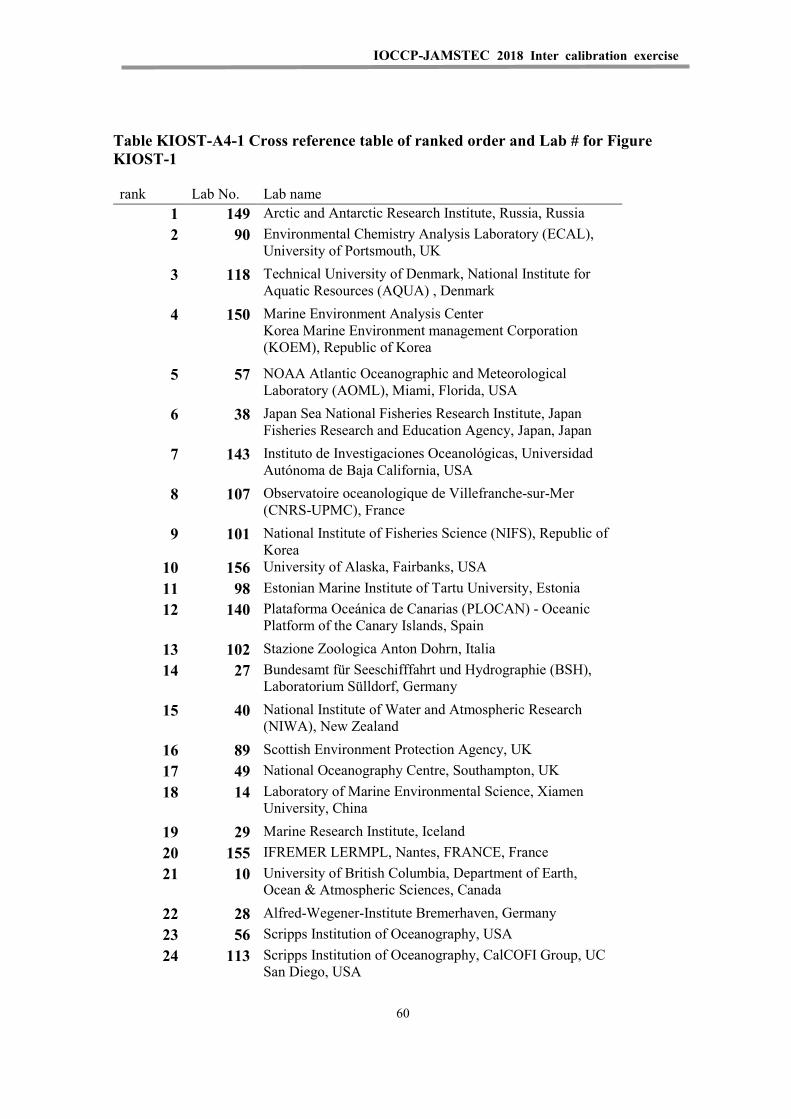
IOCCP-JAMSTEC 2018 Inter calibration exercise
Table KIOST-A4-1 Cross reference table of ranked order and Lab # for Figure KIOST-1
rank Lab No. Lab name 1 149 Arctic and Antarctic Research Institute, Russia, Russia 2 90 Environmental Chemistry Analysis Laboratory (ECAL),
University of Portsmouth, UK
3 118 Technical University of Denmark, National Institute for Aquatic Resources (AQUA) , Denmark
4 150 Marine Environment Analysis Center Korea Marine Environment management Corporation (KOEM), Republic of Korea
5 57 NOAA Atlantic Oceanographic and Meteorological Laboratory (AOML), Miami, Florida, USA
6 38 Japan Sea National Fisheries Research Institute, Japan Fisheries Research and Education Agency, Japan, Japan
7 143 Instituto de Investigaciones Oceanológicas, Universidad Autónoma de Baja California, USA
8 107 Observatoire oceanologique de Villefranche-sur-Mer (CNRS-UPMC), France
9 101 National Institute of Fisheries Science (NIFS), Republic of Korea
10 156 University of Alaska, Fairbanks, USA 11 98 Estonian Marine Institute of Tartu University, Estonia 12 140 Plataforma Oceánica de Canarias (PLOCAN) - Oceanic
Platform of the Canary Islands, Spain
13 102 Stazione Zoologica Anton Dohrn, Italia 14 27 Bundesamt für Seeschifffahrt und Hydrographie (BSH),
Laboratorium Sülldorf, Germany
15 40 National Institute of Water and Atmospheric Research (NIWA), New Zealand
16 89 Scottish Environment Protection Agency, UK 17 49 National Oceanography Centre, Southampton, UK 18 14 Laboratory of Marine Environmental Science, Xiamen
University, China
19 29 Marine Research Institute, Iceland 20 155 IFREMER LERMPL, Nantes, FRANCE, France 21 10 University of British Columbia, Department of Earth,
Ocean & Atmospheric Sciences, Canada
22 28 Alfred-Wegener-Institute Bremerhaven, Germany 23 56 Scripps Institution of Oceanography, USA 24 113 Scripps Institution of Oceanography, CalCOFI Group, UC
San Diego, USA
60
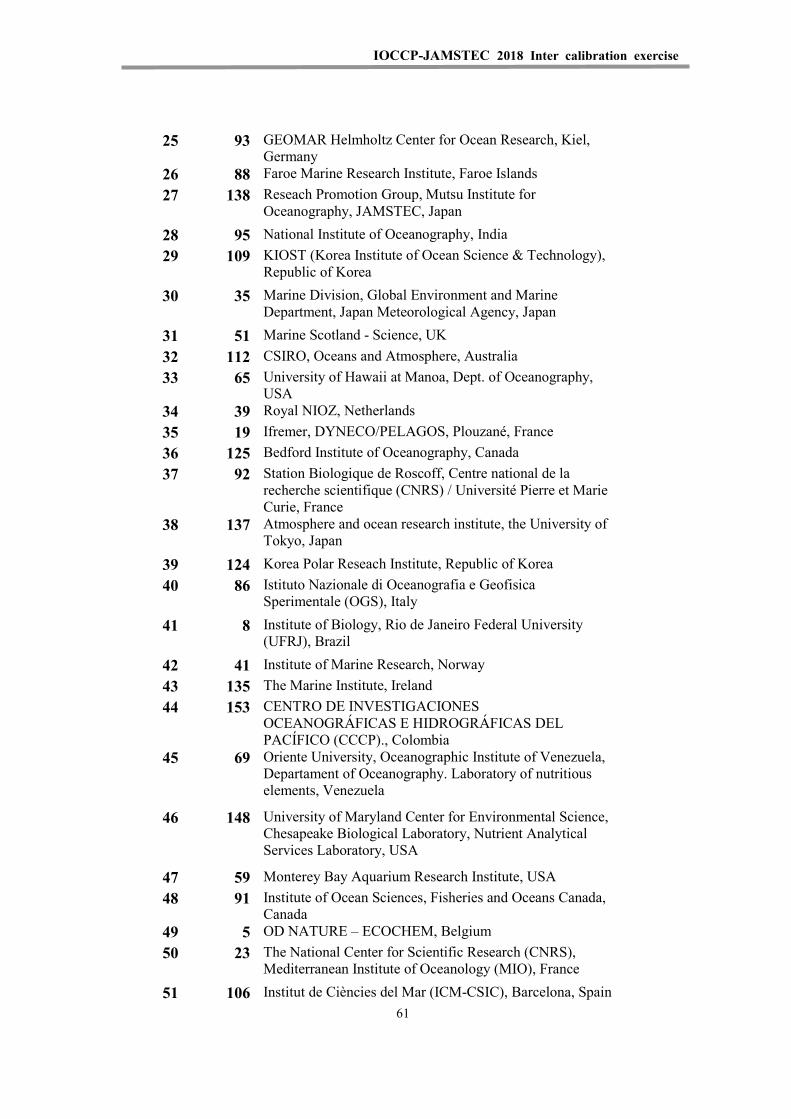
IOCCP-JAMSTEC 2018 Inter calibration exercise
25 93 GEOMAR Helmholtz Center for Ocean Research, Kiel, Germany
26 88 Faroe Marine Research Institute, Faroe Islands 27 138 Reseach Promotion Group, Mutsu Institute for
Oceanography, JAMSTEC, Japan
28 95 National Institute of Oceanography, India 29 109 KIOST (Korea Institute of Ocean Science & Technology),
Republic of Korea
30 35 Marine Division, Global Environment and Marine Department, Japan Meteorological Agency, Japan
31 51 Marine Scotland - Science, UK 32 112 CSIRO, Oceans and Atmosphere, Australia 33 65 University of Hawaii at Manoa, Dept. of Oceanography,
USA 34 39 Royal NIOZ, Netherlands 35 19 Ifremer, DYNECO/PELAGOS, Plouzané, France 36 125 Bedford Institute of Oceanography, Canada 37 92 Station Biologique de Roscoff, Centre national de la
recherche scientifique (CNRS) / Université Pierre et Marie Curie, France
38 137 Atmosphere and ocean research institute, the University of Tokyo, Japan
39 124 Korea Polar Reseach Institute, Republic of Korea 40 86 Istituto Nazionale di Oceanografia e Geofisica
Sperimentale (OGS), Italy
41 8 Institute of Biology, Rio de Janeiro Federal University (UFRJ), Brazil
42 41 Institute of Marine Research, Norway 43 135 The Marine Institute, Ireland 44 153 CENTRO DE INVESTIGACIONES
OCEANOGRÁFICAS E HIDROGRÁFICAS DEL PACÍFICO (CCCP)., Colombia
45 69 Oriente University, Oceanographic Institute of Venezuela, Departament of Oceanography. Laboratory of nutritious elements, Venezuela
46 148 University of Maryland Center for Environmental Science, Chesapeake Biological Laboratory, Nutrient Analytical Services Laboratory, USA
47 59 Monterey Bay Aquarium Research Institute, USA 48 91 Institute of Ocean Sciences, Fisheries and Oceans Canada,
Canada 49 5 OD NATURE – ECOCHEM, Belgium 50 23 The National Center for Scientific Research (CNRS),
Mediterranean Institute of Oceanology (MIO), France
51 106 Institut de Ciències del Mar (ICM-CSIC), Barcelona, Spain 61
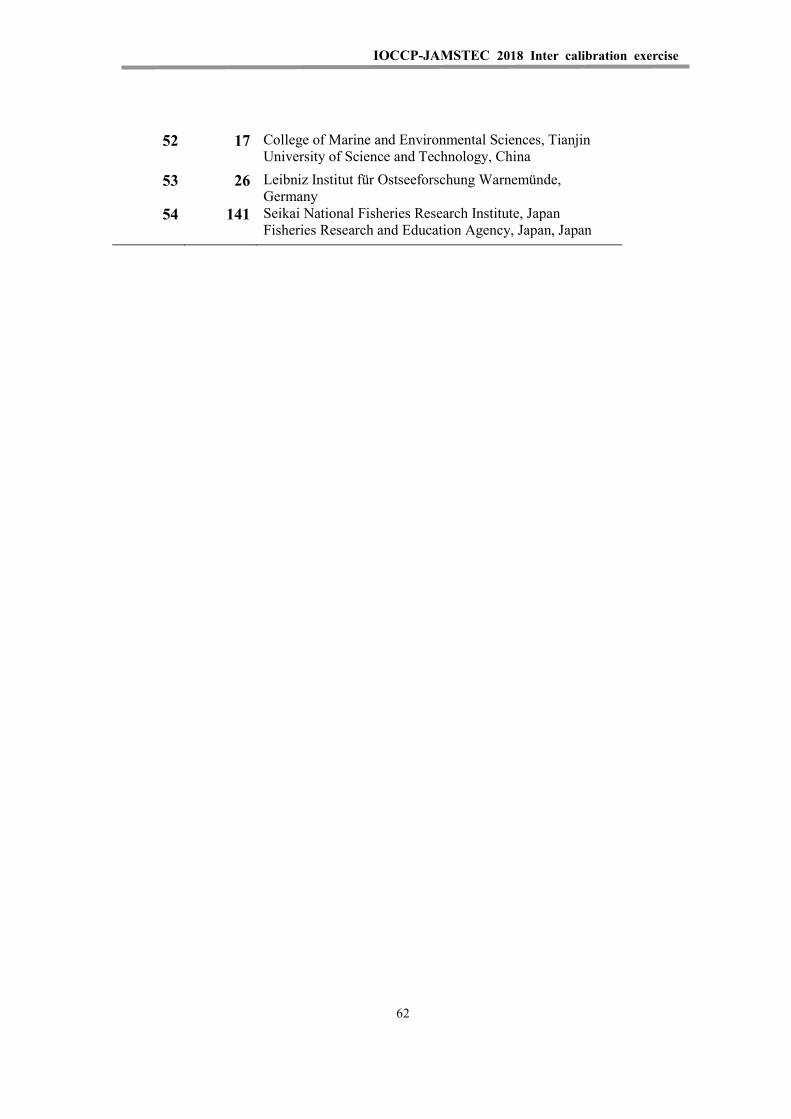
IOCCP-JAMSTEC 2018 Inter calibration exercise
52 17 College of Marine and Environmental Sciences, Tianjin University of Science and Technology, China
53 26 Leibniz Institut für Ostseeforschung Warnemünde, Germany
54 141 Seikai National Fisheries Research Institute, Japan Fisheries Research and Education Agency, Japan, Japan
62
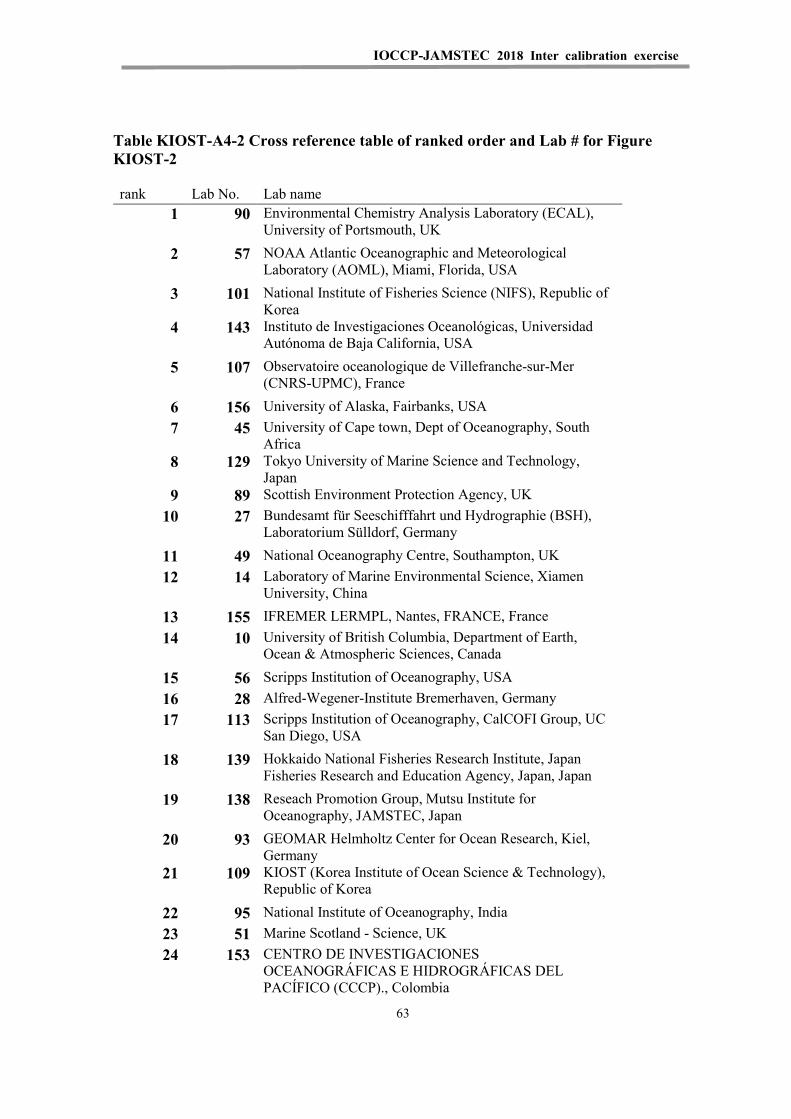
IOCCP-JAMSTEC 2018 Inter calibration exercise
Table KIOST-A4-2 Cross reference table of ranked order and Lab # for Figure KIOST-2
rank Lab No. Lab name 1 90 Environmental Chemistry Analysis Laboratory (ECAL),
University of Portsmouth, UK
2 57 NOAA Atlantic Oceanographic and Meteorological Laboratory (AOML), Miami, Florida, USA
3 101 National Institute of Fisheries Science (NIFS), Republic of Korea
4 143 Instituto de Investigaciones Oceanológicas, Universidad Autónoma de Baja California, USA
5 107 Observatoire oceanologique de Villefranche-sur-Mer (CNRS-UPMC), France
6 156 University of Alaska, Fairbanks, USA 7 45 University of Cape town, Dept of Oceanography, South
Africa 8 129 Tokyo University of Marine Science and Technology,
Japan 9 89 Scottish Environment Protection Agency, UK
10 27 Bundesamt für Seeschifffahrt und Hydrographie (BSH), Laboratorium Sülldorf, Germany
11 49 National Oceanography Centre, Southampton, UK 12 14 Laboratory of Marine Environmental Science, Xiamen
University, China
13 155 IFREMER LERMPL, Nantes, FRANCE, France 14 10 University of British Columbia, Department of Earth,
Ocean & Atmospheric Sciences, Canada
15 56 Scripps Institution of Oceanography, USA 16 28 Alfred-Wegener-Institute Bremerhaven, Germany 17 113 Scripps Institution of Oceanography, CalCOFI Group, UC
San Diego, USA
18 139 Hokkaido National Fisheries Research Institute, Japan Fisheries Research and Education Agency, Japan, Japan
19 138 Reseach Promotion Group, Mutsu Institute for Oceanography, JAMSTEC, Japan
20 93 GEOMAR Helmholtz Center for Ocean Research, Kiel, Germany
21 109 KIOST (Korea Institute of Ocean Science & Technology), Republic of Korea
22 95 National Institute of Oceanography, India 23 51 Marine Scotland - Science, UK 24 153 CENTRO DE INVESTIGACIONES
OCEANOGRÁFICAS E HIDROGRÁFICAS DEL PACÍFICO (CCCP)., Colombia
63
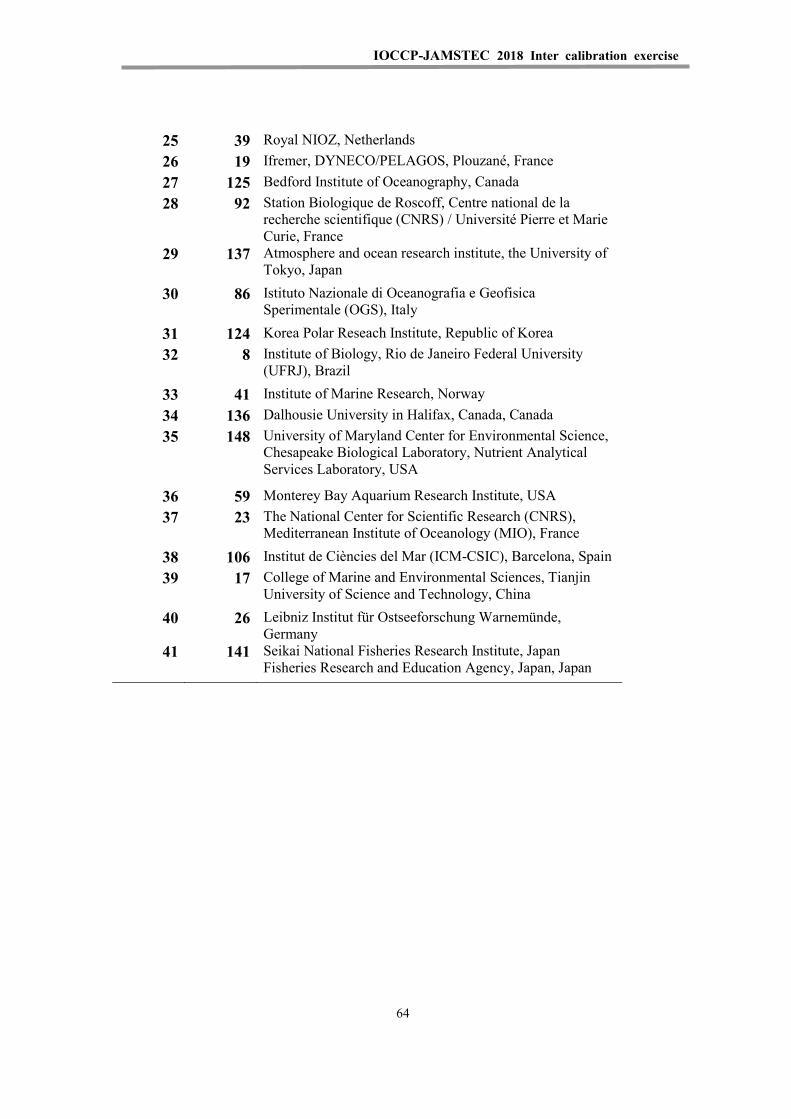
IOCCP-JAMSTEC 2018 Inter calibration exercise
25 39 Royal NIOZ, Netherlands 26 19 Ifremer, DYNECO/PELAGOS, Plouzané, France 27 125 Bedford Institute of Oceanography, Canada 28 92 Station Biologique de Roscoff, Centre national de la
recherche scientifique (CNRS) / Université Pierre et Marie Curie, France
29 137 Atmosphere and ocean research institute, the University of Tokyo, Japan
30 86 Istituto Nazionale di Oceanografia e Geofisica Sperimentale (OGS), Italy
31 124 Korea Polar Reseach Institute, Republic of Korea 32 8 Institute of Biology, Rio de Janeiro Federal University
(UFRJ), Brazil
33 41 Institute of Marine Research, Norway 34 136 Dalhousie University in Halifax, Canada, Canada 35 148 University of Maryland Center for Environmental Science,
Chesapeake Biological Laboratory, Nutrient Analytical Services Laboratory, USA
36 59 Monterey Bay Aquarium Research Institute, USA 37 23 The National Center for Scientific Research (CNRS),
Mediterranean Institute of Oceanology (MIO), France
38 106 Institut de Ciències del Mar (ICM-CSIC), Barcelona, Spain 39 17 College of Marine and Environmental Sciences, Tianjin
University of Science and Technology, China
40 26 Leibniz Institut für Ostseeforschung Warnemünde, Germany
41 141 Seikai National Fisheries Research Institute, Japan Fisheries Research and Education Agency, Japan, Japan
64
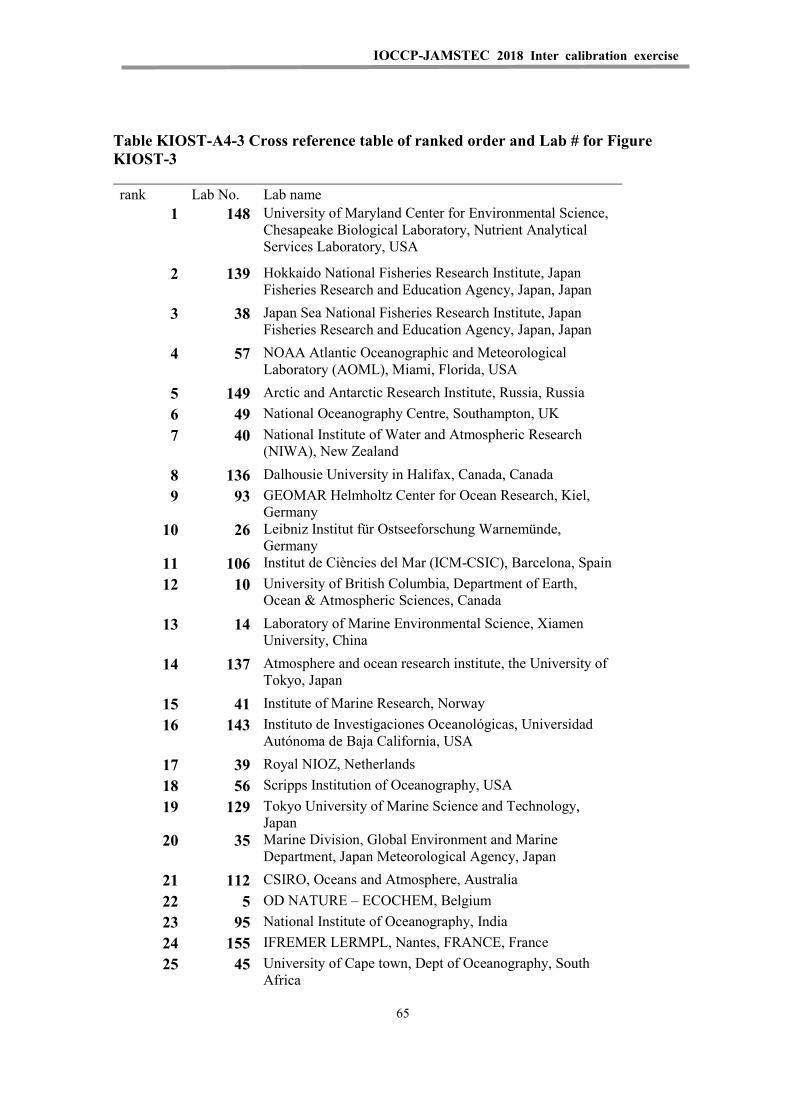
IOCCP-JAMSTEC 2018 Inter calibration exercise
Table KIOST-A4-3 Cross reference table of ranked order and Lab # for Figure KIOST-3
rank Lab No. Lab name 1 148 University of Maryland Center for Environmental Science,
Chesapeake Biological Laboratory, Nutrient Analytical Services Laboratory, USA
2 139 Hokkaido National Fisheries Research Institute, Japan Fisheries Research and Education Agency, Japan, Japan
3 38 Japan Sea National Fisheries Research Institute, Japan Fisheries Research and Education Agency, Japan, Japan
4 57 NOAA Atlantic Oceanographic and Meteorological Laboratory (AOML), Miami, Florida, USA
5 149 Arctic and Antarctic Research Institute, Russia, Russia 6 49 National Oceanography Centre, Southampton, UK 7 40 National Institute of Water and Atmospheric Research
(NIWA), New Zealand
8 136 Dalhousie University in Halifax, Canada, Canada 9 93 GEOMAR Helmholtz Center for Ocean Research, Kiel,
Germany 10 26 Leibniz Institut für Ostseeforschung Warnemünde,
Germany 11 106 Institut de Ciències del Mar (ICM-CSIC), Barcelona, Spain 12 10 University of British Columbia, Department of Earth,
Ocean & Atmospheric Sciences, Canada
13 14 Laboratory of Marine Environmental Science, Xiamen University, China
14 137 Atmosphere and ocean research institute, the University of Tokyo, Japan
15 41 Institute of Marine Research, Norway 16 143 Instituto de Investigaciones Oceanológicas, Universidad
Autónoma de Baja California, USA
17 39 Royal NIOZ, Netherlands 18 56 Scripps Institution of Oceanography, USA 19 129 Tokyo University of Marine Science and Technology,
Japan 20 35 Marine Division, Global Environment and Marine
Department, Japan Meteorological Agency, Japan
21 112 CSIRO, Oceans and Atmosphere, Australia 22 5 OD NATURE – ECOCHEM, Belgium 23 95 National Institute of Oceanography, India 24 155 IFREMER LERMPL, Nantes, FRANCE, France 25 45 University of Cape town, Dept of Oceanography, South
Africa
65
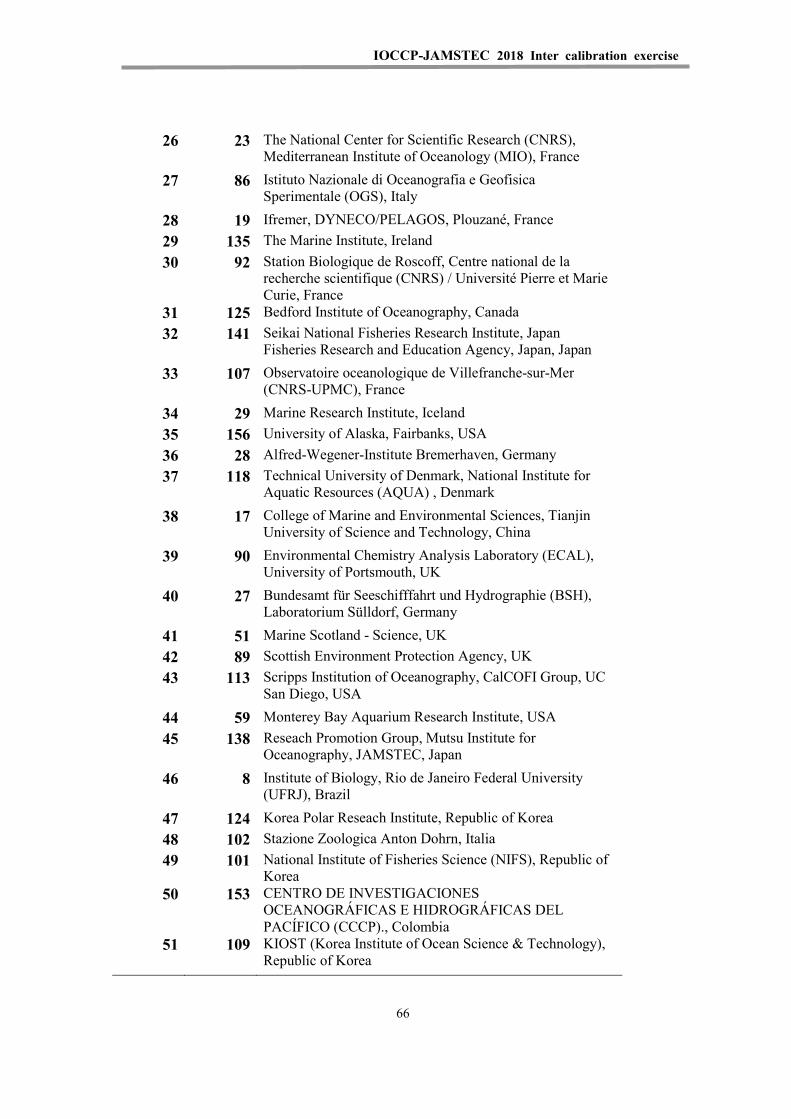
IOCCP-JAMSTEC 2018 Inter calibration exercise
26 23 The National Center for Scientific Research (CNRS), Mediterranean Institute of Oceanology (MIO), France
27 86 Istituto Nazionale di Oceanografia e Geofisica Sperimentale (OGS), Italy
28 19 Ifremer, DYNECO/PELAGOS, Plouzané, France 29 135 The Marine Institute, Ireland 30 92 Station Biologique de Roscoff, Centre national de la
recherche scientifique (CNRS) / Université Pierre et Marie Curie, France
31 125 Bedford Institute of Oceanography, Canada 32 141 Seikai National Fisheries Research Institute, Japan
Fisheries Research and Education Agency, Japan, Japan
33 107 Observatoire oceanologique de Villefranche-sur-Mer (CNRS-UPMC), France
34 29 Marine Research Institute, Iceland 35 156 University of Alaska, Fairbanks, USA 36 28 Alfred-Wegener-Institute Bremerhaven, Germany 37 118 Technical University of Denmark, National Institute for
Aquatic Resources (AQUA) , Denmark
38 17 College of Marine and Environmental Sciences, Tianjin University of Science and Technology, China
39 90 Environmental Chemistry Analysis Laboratory (ECAL), University of Portsmouth, UK
40 27 Bundesamt für Seeschifffahrt und Hydrographie (BSH), Laboratorium Sülldorf, Germany
41 51 Marine Scotland - Science, UK 42 89 Scottish Environment Protection Agency, UK 43 113 Scripps Institution of Oceanography, CalCOFI Group, UC
San Diego, USA
44 59 Monterey Bay Aquarium Research Institute, USA 45 138 Reseach Promotion Group, Mutsu Institute for
Oceanography, JAMSTEC, Japan
46 8 Institute of Biology, Rio de Janeiro Federal University (UFRJ), Brazil
47 124 Korea Polar Reseach Institute, Republic of Korea 48 102 Stazione Zoologica Anton Dohrn, Italia 49 101 National Institute of Fisheries Science (NIFS), Republic of
Korea 50 153 CENTRO DE INVESTIGACIONES
OCEANOGRÁFICAS E HIDROGRÁFICAS DEL PACÍFICO (CCCP)., Colombia
51 109 KIOST (Korea Institute of Ocean Science & Technology), Republic of Korea
66
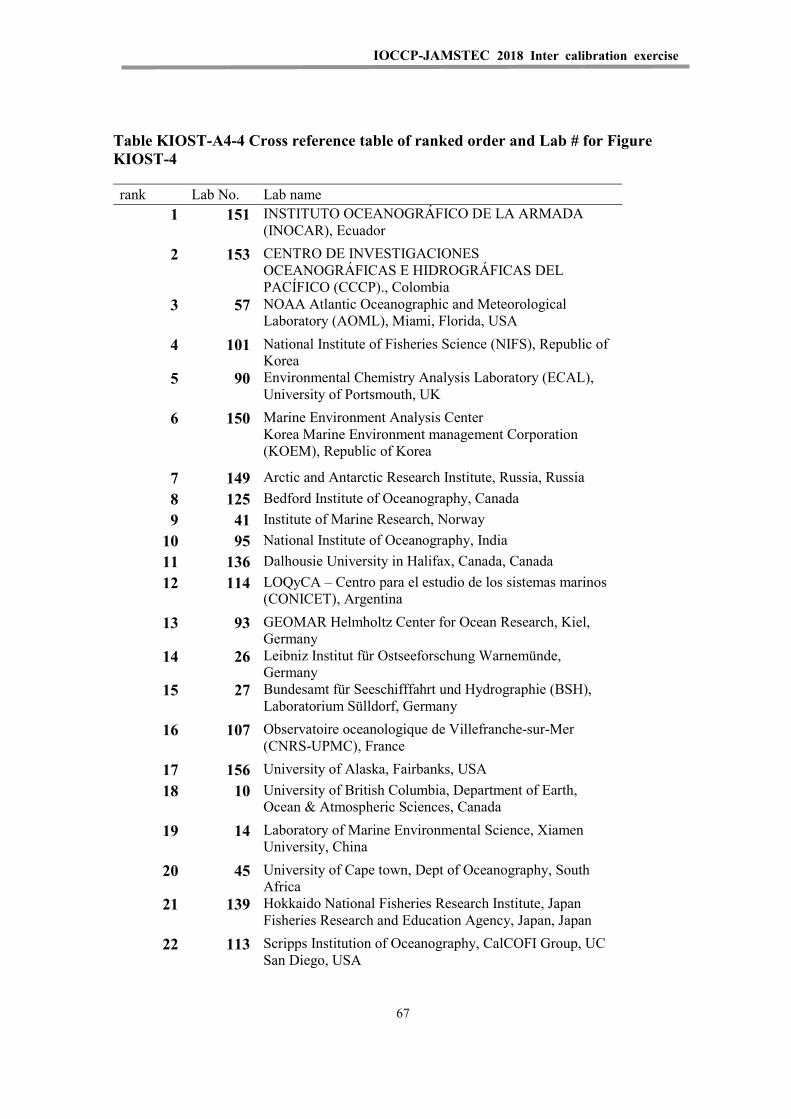
IOCCP-JAMSTEC 2018 Inter calibration exercise
Table KIOST-A4-4 Cross reference table of ranked order and Lab # for Figure KIOST-4
rank Lab No. Lab name 1 151 INSTITUTO OCEANOGRÁFICO DE LA ARMADA
(INOCAR), Ecuador
2 153 CENTRO DE INVESTIGACIONES OCEANOGRÁFICAS E HIDROGRÁFICAS DEL PACÍFICO (CCCP)., Colombia
3 57 NOAA Atlantic Oceanographic and Meteorological Laboratory (AOML), Miami, Florida, USA
4 101 National Institute of Fisheries Science (NIFS), Republic of Korea
5 90 Environmental Chemistry Analysis Laboratory (ECAL), University of Portsmouth, UK
6 150 Marine Environment Analysis Center Korea Marine Environment management Corporation (KOEM), Republic of Korea
7 149 Arctic and Antarctic Research Institute, Russia, Russia 8 125 Bedford Institute of Oceanography, Canada 9 41 Institute of Marine Research, Norway
10 95 National Institute of Oceanography, India 11 136 Dalhousie University in Halifax, Canada, Canada 12 114 LOQyCA – Centro para el estudio de los sistemas marinos
(CONICET), Argentina
13 93 GEOMAR Helmholtz Center for Ocean Research, Kiel, Germany
14 26 Leibniz Institut für Ostseeforschung Warnemünde, Germany
15 27 Bundesamt für Seeschifffahrt und Hydrographie (BSH), Laboratorium Sülldorf, Germany
16 107 Observatoire oceanologique de Villefranche-sur-Mer (CNRS-UPMC), France
17 156 University of Alaska, Fairbanks, USA 18 10 University of British Columbia, Department of Earth,
Ocean & Atmospheric Sciences, Canada
19 14 Laboratory of Marine Environmental Science, Xiamen University, China
20 45 University of Cape town, Dept of Oceanography, South Africa
21 139 Hokkaido National Fisheries Research Institute, Japan Fisheries Research and Education Agency, Japan, Japan
22 113 Scripps Institution of Oceanography, CalCOFI Group, UC San Diego, USA
67
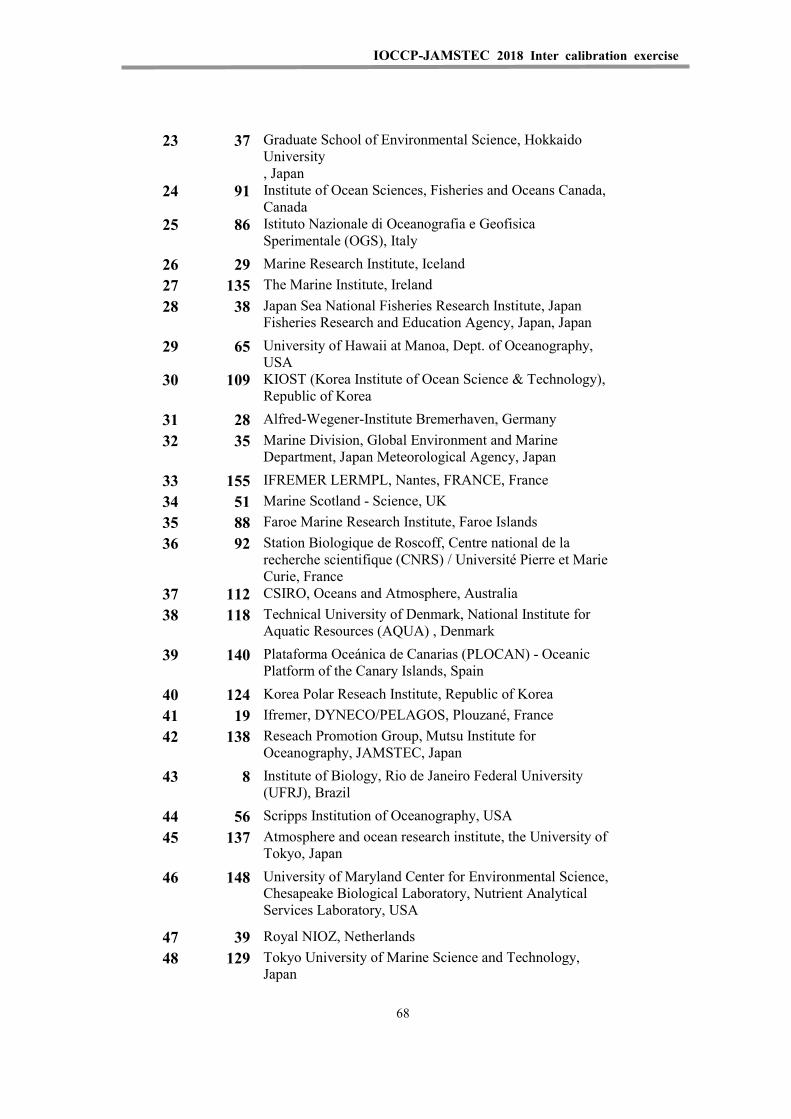
IOCCP-JAMSTEC 2018 Inter calibration exercise
23 37 Graduate School of Environmental Science, Hokkaido University , Japan
24 91 Institute of Ocean Sciences, Fisheries and Oceans Canada, Canada
25 86 Istituto Nazionale di Oceanografia e Geofisica Sperimentale (OGS), Italy
26 29 Marine Research Institute, Iceland 27 135 The Marine Institute, Ireland 28 38 Japan Sea National Fisheries Research Institute, Japan
Fisheries Research and Education Agency, Japan, Japan
29 65 University of Hawaii at Manoa, Dept. of Oceanography, USA
30 109 KIOST (Korea Institute of Ocean Science & Technology), Republic of Korea
31 28 Alfred-Wegener-Institute Bremerhaven, Germany 32 35 Marine Division, Global Environment and Marine
Department, Japan Meteorological Agency, Japan
33 155 IFREMER LERMPL, Nantes, FRANCE, France 34 51 Marine Scotland - Science, UK 35 88 Faroe Marine Research Institute, Faroe Islands 36 92 Station Biologique de Roscoff, Centre national de la
recherche scientifique (CNRS) / Université Pierre et Marie Curie, France
37 112 CSIRO, Oceans and Atmosphere, Australia 38 118 Technical University of Denmark, National Institute for
Aquatic Resources (AQUA) , Denmark
39 140 Plataforma Oceánica de Canarias (PLOCAN) - Oceanic Platform of the Canary Islands, Spain
40 124 Korea Polar Reseach Institute, Republic of Korea 41 19 Ifremer, DYNECO/PELAGOS, Plouzané, France 42 138 Reseach Promotion Group, Mutsu Institute for
Oceanography, JAMSTEC, Japan
43 8 Institute of Biology, Rio de Janeiro Federal University (UFRJ), Brazil
44 56 Scripps Institution of Oceanography, USA 45 137 Atmosphere and ocean research institute, the University of
Tokyo, Japan
46 148 University of Maryland Center for Environmental Science, Chesapeake Biological Laboratory, Nutrient Analytical Services Laboratory, USA
47 39 Royal NIOZ, Netherlands 48 129 Tokyo University of Marine Science and Technology,
Japan
68
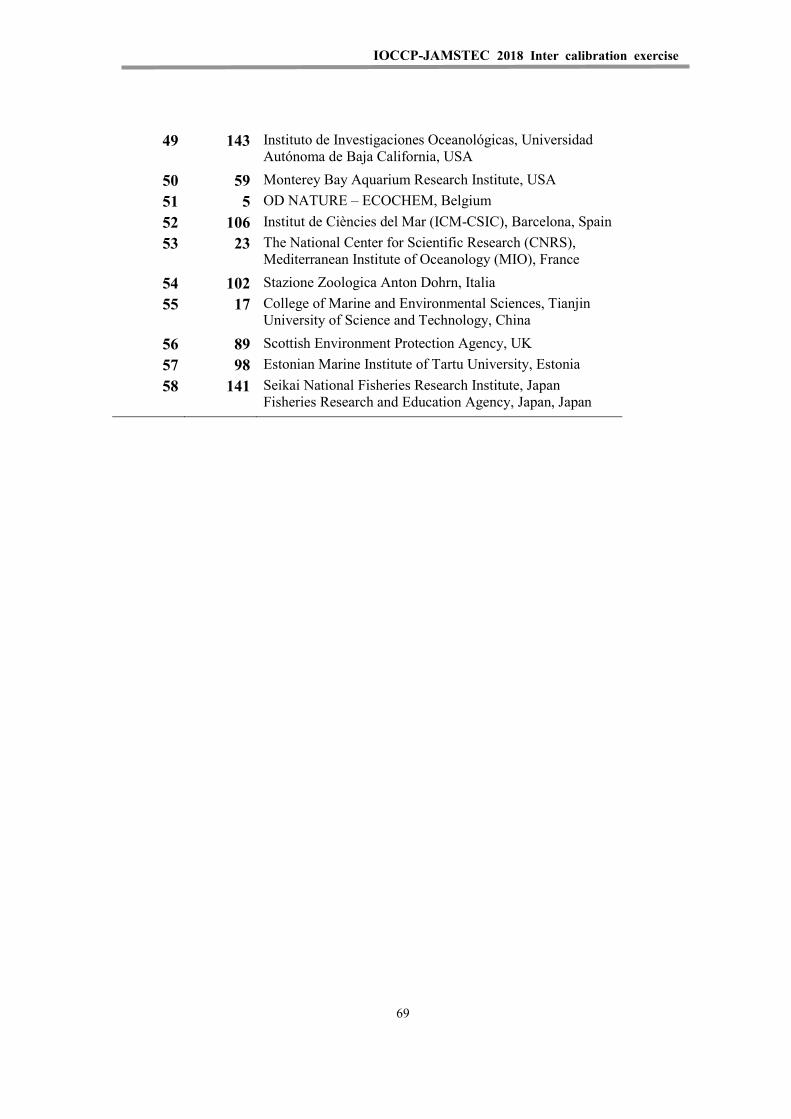
IOCCP-JAMSTEC 2018 Inter calibration exercise
49 143 Instituto de Investigaciones Oceanológicas, Universidad Autónoma de Baja California, USA
50 59 Monterey Bay Aquarium Research Institute, USA 51 5 OD NATURE – ECOCHEM, Belgium 52 106 Institut de Ciències del Mar (ICM-CSIC), Barcelona, Spain 53 23 The National Center for Scientific Research (CNRS),
Mediterranean Institute of Oceanology (MIO), France
54 102 Stazione Zoologica Anton Dohrn, Italia 55 17 College of Marine and Environmental Sciences, Tianjin
University of Science and Technology, China
56 89 Scottish Environment Protection Agency, UK 57 98 Estonian Marine Institute of Tartu University, Estonia 58 141 Seikai National Fisheries Research Institute, Japan
Fisheries Research and Education Agency, Japan, Japan
69
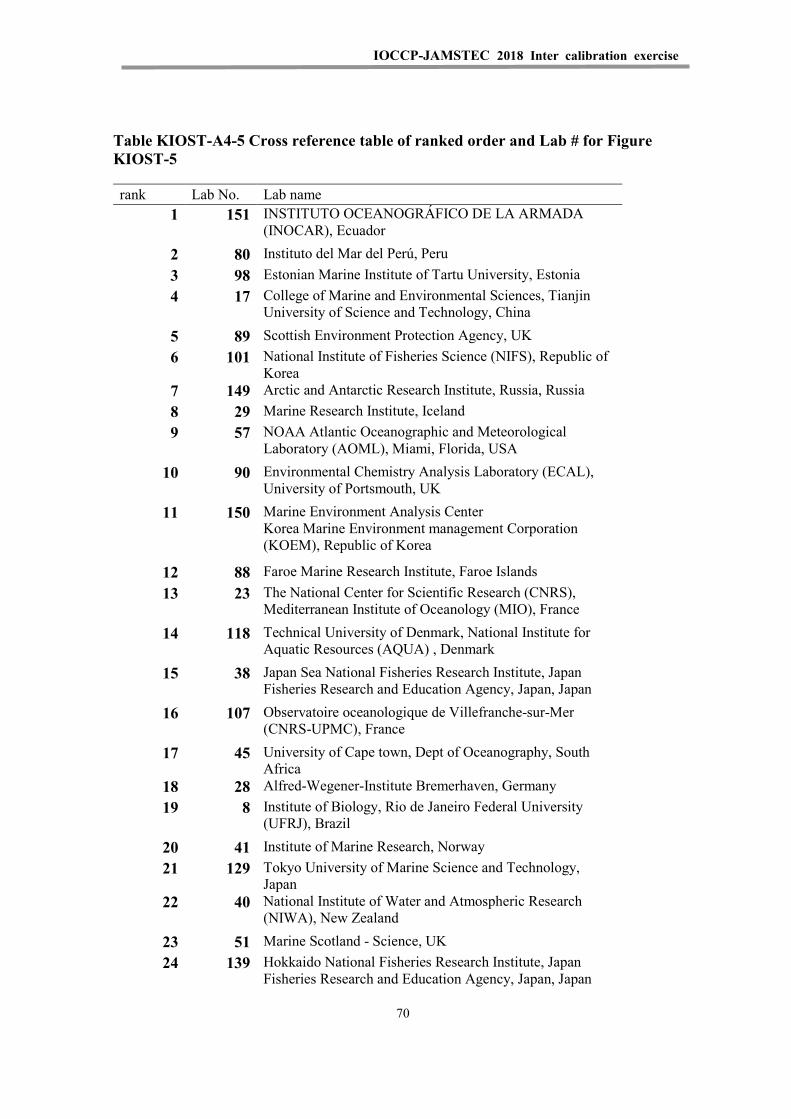
IOCCP-JAMSTEC 2018 Inter calibration exercise
Table KIOST-A4-5 Cross reference table of ranked order and Lab # for Figure KIOST-5
rank Lab No. Lab name 1 151 INSTITUTO OCEANOGRÁFICO DE LA ARMADA
(INOCAR), Ecuador
2 80 Instituto del Mar del Perú, Peru 3 98 Estonian Marine Institute of Tartu University, Estonia 4 17 College of Marine and Environmental Sciences, Tianjin
University of Science and Technology, China
5 89 Scottish Environment Protection Agency, UK 6 101 National Institute of Fisheries Science (NIFS), Republic of
Korea 7 149 Arctic and Antarctic Research Institute, Russia, Russia 8 29 Marine Research Institute, Iceland 9 57 NOAA Atlantic Oceanographic and Meteorological
Laboratory (AOML), Miami, Florida, USA
10 90 Environmental Chemistry Analysis Laboratory (ECAL), University of Portsmouth, UK
11 150 Marine Environment Analysis Center Korea Marine Environment management Corporation (KOEM), Republic of Korea
12 88 Faroe Marine Research Institute, Faroe Islands 13 23 The National Center for Scientific Research (CNRS),
Mediterranean Institute of Oceanology (MIO), France
14 118 Technical University of Denmark, National Institute for Aquatic Resources (AQUA) , Denmark
15 38 Japan Sea National Fisheries Research Institute, Japan Fisheries Research and Education Agency, Japan, Japan
16 107 Observatoire oceanologique de Villefranche-sur-Mer (CNRS-UPMC), France
17 45 University of Cape town, Dept of Oceanography, South Africa
18 28 Alfred-Wegener-Institute Bremerhaven, Germany 19 8 Institute of Biology, Rio de Janeiro Federal University
(UFRJ), Brazil
20 41 Institute of Marine Research, Norway 21 129 Tokyo University of Marine Science and Technology,
Japan 22 40 National Institute of Water and Atmospheric Research
(NIWA), New Zealand
23 51 Marine Scotland - Science, UK 24 139 Hokkaido National Fisheries Research Institute, Japan
Fisheries Research and Education Agency, Japan, Japan
70
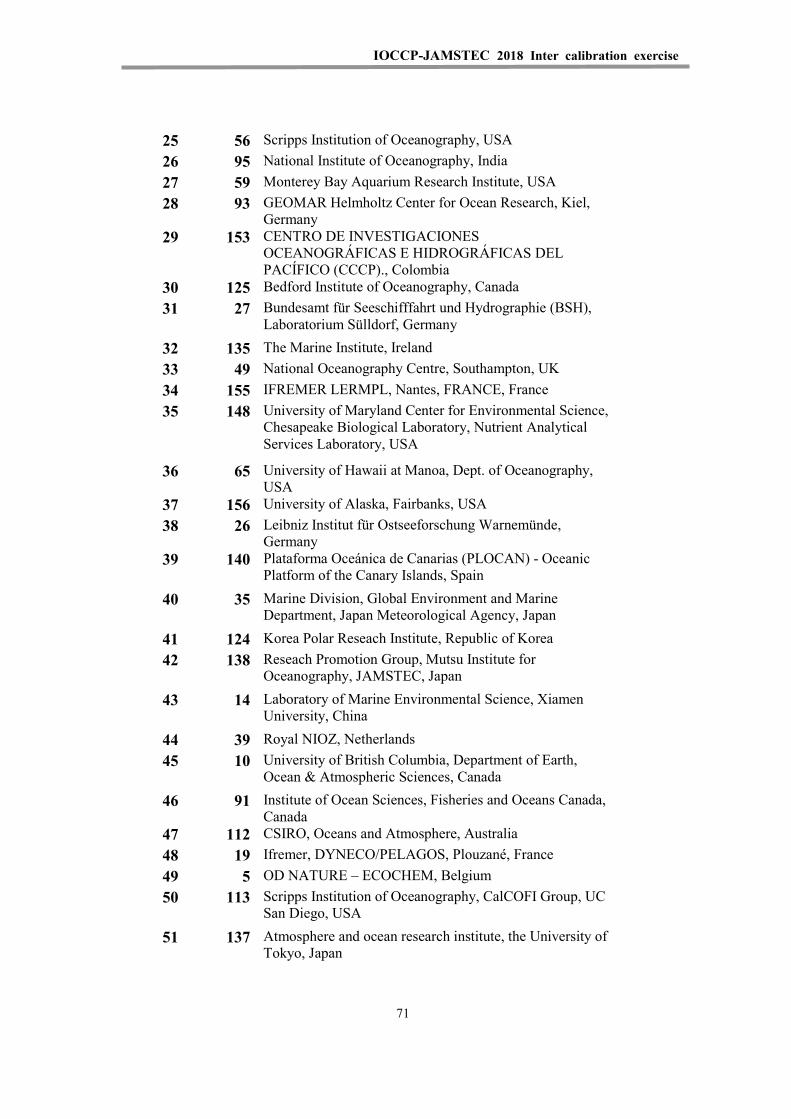
IOCCP-JAMSTEC 2018 Inter calibration exercise
25 56 Scripps Institution of Oceanography, USA 26 95 National Institute of Oceanography, India 27 59 Monterey Bay Aquarium Research Institute, USA 28 93 GEOMAR Helmholtz Center for Ocean Research, Kiel,
Germany 29 153 CENTRO DE INVESTIGACIONES
OCEANOGRÁFICAS E HIDROGRÁFICAS DEL PACÍFICO (CCCP)., Colombia
30 125 Bedford Institute of Oceanography, Canada 31 27 Bundesamt für Seeschifffahrt und Hydrographie (BSH),
Laboratorium Sülldorf, Germany
32 135 The Marine Institute, Ireland 33 49 National Oceanography Centre, Southampton, UK 34 155 IFREMER LERMPL, Nantes, FRANCE, France 35 148 University of Maryland Center for Environmental Science,
Chesapeake Biological Laboratory, Nutrient Analytical Services Laboratory, USA
36 65 University of Hawaii at Manoa, Dept. of Oceanography, USA
37 156 University of Alaska, Fairbanks, USA 38 26 Leibniz Institut für Ostseeforschung Warnemünde,
Germany 39 140 Plataforma Oceánica de Canarias (PLOCAN) - Oceanic
Platform of the Canary Islands, Spain
40 35 Marine Division, Global Environment and Marine Department, Japan Meteorological Agency, Japan
41 124 Korea Polar Reseach Institute, Republic of Korea 42 138 Reseach Promotion Group, Mutsu Institute for
Oceanography, JAMSTEC, Japan
43 14 Laboratory of Marine Environmental Science, Xiamen University, China
44 39 Royal NIOZ, Netherlands 45 10 University of British Columbia, Department of Earth,
Ocean & Atmospheric Sciences, Canada
46 91 Institute of Ocean Sciences, Fisheries and Oceans Canada, Canada
47 112 CSIRO, Oceans and Atmosphere, Australia 48 19 Ifremer, DYNECO/PELAGOS, Plouzané, France 49 5 OD NATURE – ECOCHEM, Belgium 50 113 Scripps Institution of Oceanography, CalCOFI Group, UC
San Diego, USA
51 137 Atmosphere and ocean research institute, the University of Tokyo, Japan
71
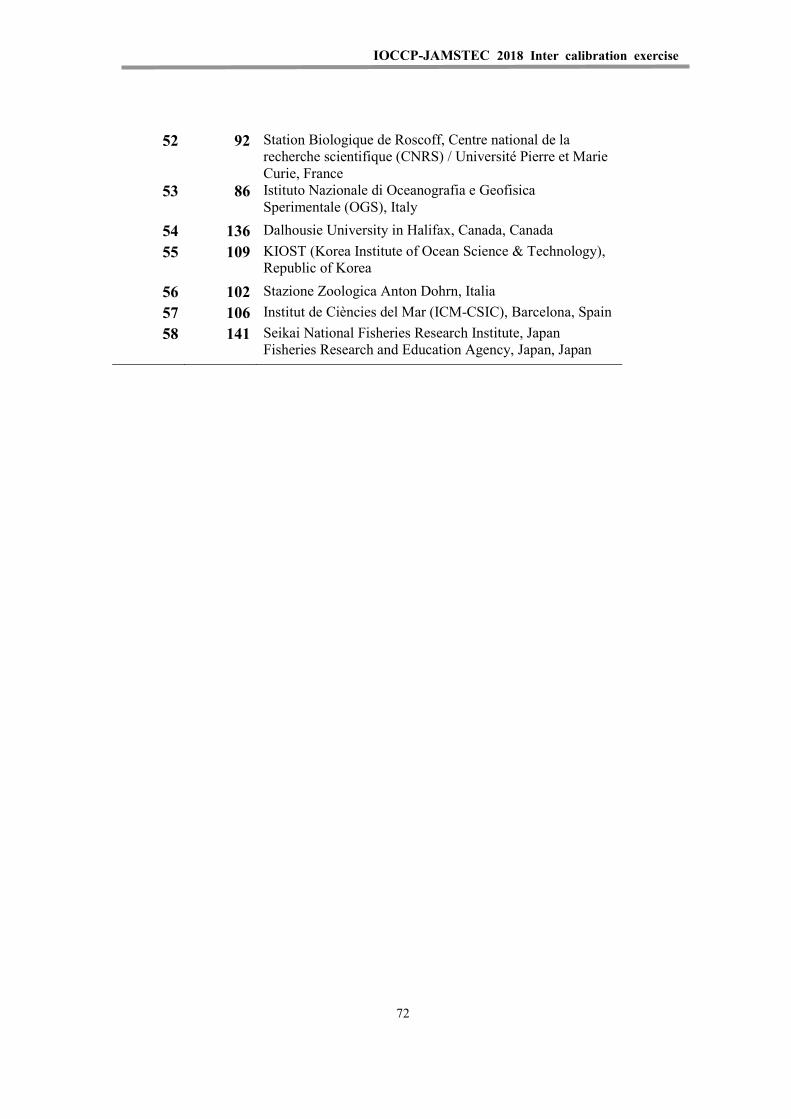
IOCCP-JAMSTEC 2018 Inter calibration exercise
52 92 Station Biologique de Roscoff, Centre national de la recherche scientifique (CNRS) / Université Pierre et Marie Curie, France
53 86 Istituto Nazionale di Oceanografia e Geofisica Sperimentale (OGS), Italy
54 136 Dalhousie University in Halifax, Canada, Canada 55 109 KIOST (Korea Institute of Ocean Science & Technology),
Republic of Korea
56 102 Stazione Zoologica Anton Dohrn, Italia 57 106 Institut de Ciències del Mar (ICM-CSIC), Barcelona, Spain 58 141 Seikai National Fisheries Research Institute, Japan
Fisheries Research and Education Agency, Japan, Japan
72
IOCCP-JAMSTEC 2018 Inter-calibration exercise
Appendix VI
History of the inter-comparison studies
1

IOCCP-JAMSTEC 2018 Inter-calibration exercise
2
IOCCP-JAMSTEC 2018 Inter-calibration exercise
History of the Inter-comparison studies
This history of the nutrient inter-laboratory comparison study is based on several reports of previous intercomparison exercises. The histories of the first to fourth ICES exercises were derived from Aminot and Kirkwood’s (1995) detailed report of the fifth ICES intercomparison, which includes histories of the first four ICES exercises. Histories of the fifth ICES exercise, the first and second NOAA/NRC inter-laboratory comparison study, and MRI 2003, 2006, 2008, and 2012 intercomparisons are also summarized in this appendix.
1. First ICES Exercise
The first inter-calibration to include nutrients was an entirely Baltic affair in June 1965, when three research vessels met by private agreement in Copenhagen:
Aranda Institute of Marine Research (IMR), Helsinki
Hermann Wattenberg Institut für Meereskunde, Kiel
Skagerak Royal Fishery Board, Gothenburg
Each ship contributed freshly collected bulk samples to the experiment, which were sub-sampled and analyzed onboard each of the three participating ships on the same day. Oxygen, salinity, chlorinity, alkalinity, and phosphate were determined.
2. Second ICES Exercise
The second ICES exercise, which was carried out in 1966 under the auspices of the newly formed ICES Working Group on the Intercalibration of Chemical Methods, was still predominantly a Baltic initiative and consisted of two parts: Part I, Leningrad, during the 5th Conference of Baltic Oceanographers; and Part II, Copenhagen, at the 54th ICES Statutory Meeting.
Part I, Leningrad (May 1966)
The participating research vessels were the following:
Alkor Institut für Meereskunde, Kiel
Okeanograf Institute of Marine Research, Leningrad
Prof Otto Krammel Institut für Meereskunde, Warnemünde
Skagerak Fisheries Board of Sweden, Gothenburg
The research vessels delivered bulk samples, which were subsampled and analyzed almost immediately for oxygen, salinity, chlorinity, pH, and phosphate.
3
IOCCP-JAMSTEC 2018 Inter-calibration exercise
Part II, Copenhagen (September 1966)
The list of interested parties continued to grow and, in addition to Baltic countries, Norway and the UK were represented. Research vessels delivered bulk samples, and the various participants analyzed samples simultaneously in Copenhagen. The determinants of primary interest included not only oxygen, salinity, chlorinity, and phosphate, as in Part I (Leningrad) and the previous year's exercise (Copenhagen, 1965), but also nitrate, nitrite, and silicate.
The final report, edited by Grasshoff (UNESCO, 1966), makes no mention of nitrate or nitrite, but some of those who were present confessed that these results were "too terrible to be included". To be fair to those involved, 1966 was an early time in the development of heterogeneous cadmium-based nitrate/nitrite reduction techniques, and some of the associated problems were presumably not fully appreciated at the time.
Evidently nitrate analysis had some way to go to achieve the reliability and ease of operation of the Murphy and Riley (1962) phosphate technique, but it is worth noting that intercomparison work on phosphate so far had consisted of simultaneous analysis of freshly obtained subsamples by a small number of highly competent workers, in close contact with each other, exchanging calibration solutions, ideas, technical details, etc. Subsequent to the Copenhagen trial, Jones and Folkard (ICES, 1966) undertook a detailed laboratory examination of the individual methods used by the participants and, in their contribution to Grasshoff’s report, they announced, "There seems to be no need for any further intercalibration in the determination of inorganic phosphate by this method."
Clearly this happy state of affairs could not and did not last. Along came the autoanalyzer!
3. Third ICES Exercise
The third ICES exercise was organized by the ICES Working Group on Chemical Analysis of Sea Water under the joint auspices of ICES and SCOR and its official title, "The International Intercalibration Exercise for Nutrient Methods2” shows that it set out to be an ambitious project.
Samples were distributed in 1969–1970, and 45 laboratories from 20 countries submitted results, but the final report on the results of the exercise was not published for several years (ICES, 1977).
The time had come to study "nutrients" separately from oxygen, salinity, chlorinity, and pH, but with the awareness of problems arising from the instability of natural seawater samples, the organizers chose to use standard solutions that were prepared and distributed by the Sagami Chemical Research Center, Japan. [Note added by Aoyama: The standard solutions used in this exercise were Cooperative Survey of Kuroshio (CSK) standards, which are solutions in artificial seawater for nitrate, phosphate, and silicate and in pure water for nitrite.]
4
IOCCP-JAMSTEC 2018 Inter-calibration exercise
In this exercise, participants performed the analyses in their own laboratories but, despite being supplied (knowingly) with appropriate blank solutions for each determination, the overall accuracy, particularly for phosphate and nitrate, was disappointing.
The report concludes, "As methods did not diverge much, it is clear that variations must be sought primarily in the standardization procedures. The results will also aid participants in re-evaluating their analytical procedures by comparison of their methods with those that appear most satisfactory from this exercise".
The names of the participating laboratories were listed, as were the tables of results, but it was not possible to link them together. Hindsight suggests that this may have been counterproductive; we now suspect that there is no greater incentive for a laboratory to improve its performance than the knowledge that peer laboratories throughout the world are aware that it is producing poor quality data.
4. Fourth ICES Exercise
Various "workshop" and multi-ship events following the ICES/SCOR exercise included nutrient studies, but it was many years later (1988) that the ICES Marine Chemistry Working Group produced volunteers (Don Kirkwood, Alain Aminot, and Matti Perttilä) to organize the next large-scale intercalibration exercise, designated "NUTS I/C 4". This exercise did not set out to be worldwide. It began only with laboratories in ICES Member Countries, but other laboratories that were interested in participating were not turned away.
The fourth exercise differed from the third exercise in three important respects.
1) The test samples were natural or near-natural seawater rather than standard solutions. (Strictly speaking, this made the exercise an intercomparison rather than an intercalibration.)
2) Participants were unaware that "blank" samples were included.
3) Anonymity was abolished. Participants were made aware from the outset that the final report would list identities of laboratories, results, and a means for any reader to contact them.
Sixty-nine laboratories from 22 countries submitted results and, thanks in some measure to the telefax machine, the final 83-page report (Kirkwood et al., 1991) was in the hands of participants within two years of the distribution of samples. Statistical treatment identified 58 laboratories consistent in phosphate analysis, 51 consistent in nitrate analysis, and 48 consistent in both phosphate and nitrate analysis, including a group of 12 whose results were especially close to the consensus concentrations.
5
IOCCP-JAMSTEC 2018 Inter-calibration exercise
5. Fifth ICES Exercise
Due to the generally perceived need for more and better quality control in analytical measurement, a fifth ICES intercomparison exercise was carried out in 1993. A total of 142 sets of samples were distributed in 31 countries. Results were returned by 132 laboratories, 61 of which had participated in the fourth intercomparison and 56 of which were participating in QUASIMEME (Quality Assurance of Information for Marine Environmental Monitoring in Europe).
The distribution of laboratories was as follows:
UK (22), Germany (18), Sweden (13), France (11), Spain (8), USA (7), Norway (5), Ireland (5), Australia (4) Canada (4), Netherlands (4), Denmark (3), Greece (3), Portugal (3), Belgium (2), Estonia (2), Finland (2), Italy (2), Poland (2), Argentina (1), Bermuda (1), China (1), Faroe Islands (1), Iceland (1), Japan (1), Latvia (1), Lithuania (1), New Zealand (1), Qatar (1), South Africa (1), Turkey (1).
The method of sample preparation and autoclaving for the fifth intercomparison imposed constraints that resulted in there being only two relevant determinants per sample (nitrate and nitrite in one series, and phosphate and ammonia in the other series).
A large volume of low-nutrient natural seawater was spiked with known concentrations of nutrient salts. Although the concentrations in the distributed samples covered a greater concentration range than in the fourth intercomparison, the concentrations were representative of the Atlantic Ocean, 1–26 μmol L–1 for nitrate and 0.08–1.85 μmol L–1 for phosphate.
There have been no further ICES intercomparison exercises since 1993.
6. QUASIMEME
The European Union (EU) supported the QUASIMEME project between 1993 and 1995. Its aim was to develop a holistic quality assurance program for marine environmental monitoring information in Europe. As a result of this pioneering project, marine network and laboratory performance studies have been established for most of the determinants measured in the marine environmental programs for both monitoring and research purposes. The nutrient part of QUASIMEME was entirely based on the groundbreaking work of ICES experts, and the principles and methodology of ICES IC study were used. The project proved that laboratories that followed on a regular basis the learning programs and the laboratory testing schemes improved the quality of their data. After EU funding was ended in 1995, the QUASIMEME scheme continued on a subscription basis. Now it became possible for any laboratory worldwide to participate. QUASIMEME results have been used to assess the quality of data submitted to the marine conventions for the purpose of assessing the quality of the marine environment.
7. 2000 NOAA/NRC Intercomparison
The test material distributed in this intercomparison was MOOS-1, a certified
6
IOCCP-JAMSTEC 2018 Inter-calibration exercise
reference material for nutrients in seawater (Clancy and Willie, 2004). The sample material was intended to be a certified reference material for silicate, phosphate, nitrite, and nitrate+nitrite. Participating laboratories were each sent two bottles of MOOS-1 and asked to perform duplicate analyses on each of the bottles. The prepared samples were sent to 36 participating laboratories. Thirty sets of results were returned.
The results of this intercomparison may, in several respects, have been compromised by sample homogeneity problems. The target standard deviation for measuring p-scores was too broad and did not reflect the measurement precision that could be attained at the time.
8. 2002 NOAA/NRC Intercomparison
A further intercomparison exercise was undertaken to assess the current capabilities of a group of laboratories to quantitate orthophosphate, silicate, nitrite, and nitrite+nitrate in a seawater sample. This was the second such exercise sponsored by the NOAA Center for Coastal Monitoring and Assessment (CCMA) and coordinated by the Institute for National Measurement Standards of the National Research Council of Canada. Two seawater samples—one from Pensacola Sound, FL, and the other MOOS-1—were distributed to 31 laboratories.
Twenty-four laboratories submitted data. Methodologies were not prescribed to the participants; however, all reported results were obtained using traditional colorimetric procedures. Generally, satisfactory agreement among participants was achieved, with results within 10% of the assigned mean values.
The results from this exercise suggested that the homogeneity problem identified in the first NOAA/NRC intercomparison exercise was overcome, although the orthophosphate data indicated a larger inter-laboratory spread of results than expected.
Results for silicate, nitrite, and nitrite+nitrate in the distributed seawater samples were acceptable for the majority of the participants and generally deviated by less than ±10% from the assigned mean. All laboratories used methodologies based on colorimetric principles.
9. 2003 MRI Intercomparison
Autoclaved natural seawater was prepared as inter-laboratory comparison study samples. Sample homogeneity was confirmed by repeatability of measurements. Sets of 6 samples covering a concentration range greater than that in any previous inter-laboratory comparison study were distributed. The concentrations were 0–38 μmol kg–1 for nitrate, 0–0.9 μmol kg–1 for nitrite, 0–2.7 μmol kg–1 for phosphate, and 0–136 μmol kg–1 for silicate. A total of 18 sets of samples were distributed to 18 laboratories in 5 countries. Results were returned by 17 laboratories in 5 countries. Although consensus concentrations were obtained for the 6 samples, the standard deviations were 4.5 times and more than 10 times greater than those of the homogeneities for phosphate and silicate, respectively. For nitrate, the standard deviations were only about double the homogeneities. These results indicated that variability of in-house standards of the
7
IOCCP-JAMSTEC 2018 Inter-calibration exercise
participating laboratories, rather than analytical precision, was the primary source of inter-laboratory discrepancies. Therefore, use of a certified RMNS was essential for establishing nutrient datasets that could be compared across laboratories, especially for silicate and phosphate.
10. 2006 MRI Intercomparison
Autoclaved natural seawater was used for an inter-laboratory comparison study of a reference material for nutrients in seawater in 2006, similar to the 2003 intercomparison exercise. Sample homogeneity was confirmed by repeatability of measurements. Homogeneities for nitrate, phosphate, and silicate were 0.2%, 0.3%, and 0.2%, respectively. Sets of 6 samples covering a concentration range of 0.1–42.4 μmol kg–1 for nitrate, 0.0–0.6 μmol kg–1 for nitrite, 0.0–3.0 μmol kg–1 for phosphate, and 1.7–156.1 μmol kg–1 for silicate were prepared. A total of 55 sets of samples were distributed to 55 laboratories in 20 countries. Results were returned by 52 laboratories from 19 countries.
11. 2008 MRI Intercomparison
Autoclaved natural seawater was used for the next inter-laboratory comparison study of a reference material for nutrients in seawater in 2008, just as in 2003 and 2006. A total of 58 sets of samples were distributed to 58 laboratories in 20 countries. Results were returned by 52 laboratories from 19 countries.
Two of 6 samples used in the 2008 I/C study were the same lots as used in the 2006 I/C study. Therefore, we could see the internal comparability at each laboratory that participated in both the 2006 and 2008 studies as well as the international comparability of the nutrient data among the participating laboratories.
12. 2012 MRI Intercomparison
Autoclaved natural seawater was used for the next inter-laboratory comparison study of a reference material for nutrients in seawater in 2012, just as in 2003, 2006, and 2008. A total of 69 sets of samples were distributed to 69 laboratories in 28 countries. Results were returned by 67 laboratories in 28 countries.
Sample #1 used in the 2012 I/C study came from the same lots used in the 2006 and 2008 I/C study. Sample #2 used in the 2012 I/C study came from the same lots used in the 2006 I/C study, and sample #3 used in the 2012 I/C study came from the same lots used in the 2008 I/C study. Therefore, we could see the internal comparability at each laboratory that participated in the previous I/C studies as well as the international comparability of the nutrient data among the participating laboratories.
Results of internal comparability showed that our community had good internal comparability, but less external comparability.
13. IOCCP-JAMSTEC 2015 Inter-laboratory Calibration Exercise of a Certified Reference Material for Nutrients in Seawater
8
IOCCP-JAMSTEC 2018 Inter-calibration exercise
In 2014, IOCCP and JAMSTEC co-organized an inter-laboratory calibration exercise of nutrients in seawater using four lots of recently certified RM produced by KANSO. A former RMNS produced by KANSO had already shown an excellent homogeneity of 0.2 %, and the concentrations of nitrate, phosphate, and silicate did not change more than 1.0 % during 6.4 years. By the criterion of ISO Guide 35:2006, there was no instability of the RM nutrient concentrations (Aoyama et al., 2012). Three CRMs provided by the National Metrology Institute of Japan were certified in March 2014.
The Korean Institute of Ocean Science and Technology, KIOST, also offered to provide their recently developed RMs to this I/C exercise. In addition, the Royal Netherlands Institute for Sea Research, NIOZ, offered to provide silicate stock solution to contribute to the overall assessment of results from this I/C exercise.
A set of four samples of CRMs was distributed to all 71 participating laboratories around the globe (28 countries) at no charge, and some combination of three lots of NMIJ CRM were distributed to 21 laboratories, which agreed to pay for them. Korean RMs were also distributed to 24 voluntary laboratories that agreed to analyze them. NIOZ stock solutions were sent to selected laboratories that were working on deep-water samples and agreed to analyze the silicate stock solution.
Seventy-one laboratories in 28 countries replied to the call for participants. Results were returned from 58 laboratories.
In general, the normalized cumulative distributions for nitrate and silicate were quite similar. The magnitudes of comparability during these three I/C studies were thus similar. Those for phosphate were relatively flat, an indication that comparability was better for phosphate analysis than for the other nutrients.
There are good signs in the results that although consensus standard deviations were relatively large, the consensus median/mean of each sample showed good agreement, with certified values of the samples within consensus SDs. This implies that the majority of the participating laboratories had good capability to measure nutrient concentration in seawater, and the use of CRM will further increase the comparability of results. The results may be SI traceable in the near future.
Results of this IC indicated that non-linearity of the calibration curves for nutrient analysis was a significant source of reduced comparability of nutrient data. This implies that we need to use a set of nutrient CRMs the concentrations of which cover the whole range of nutrient concentrations in seawater to maintain comparability of nutrients concentrations measured anywhere in the world’s oceans.
9

IOCCP-JAMSTEC 2018 Inter calibration exercise
10
IOCCP-JAMSTEC 2018 Inter calibration exercise
IOCCP-JAMSTEC 2018 Inter calibration exercise
ISBN 978-4-901833-37-0