Embed Size (px)
Citation preview
CBL NI43-101_NorthumberlandResource_2008.07.28.doc July 28, 2008
Technical Report on theNorthumberland Project
Nye County, Nevada, USA:
Resource Update 2008
Prepared by
Fronteer Development Group Inc.(FRG: TSX, AMEX)
July 28, 2008

Fronteer Development Group Inc.Technical Report, Northumberland Project: Resource Update 2008 Page ii
CBL NI43-101_NorthumberlandResource_2008.07.28.doc July 28, 2008
Technical Report onthe Northumberland ProjectNye County, Nevada, USA:
Resource Update 2008
Fronteer Development Group Inc.(FRG: TSX, AMEX)
Suite 1650, 1055 West Hastings StreetVancouver, BC V63 2E9
Tel: +1.604.632.4677 Fax: +1.604.632.4678Email: [email protected]
Website: www.fronteergroup.com
Prepared by:Christopher Lee, P.Geo
Jim Ashton, P.Eng.
Submitted in fulfillment of reporting requirementsunder National Instrument 43-101
on
July 28, 2008

Fronteer Development Group Inc.Technical Report, Northumberland Project: Resource Update 2008 Page iii
CBL NI43-101_NorthumberlandResource_2008.07.28.doc July 28, 2008
TABLE OF CONTENTS
Section Page
1.0 EXECUTIVE SUMMARY.............................................................................................................91.1 Introduction .........................................................................................................................91.2 Geology and Mineralization ..............................................................................................101.3 Mining and Exploration History........................................................................................101.4 Drill-Hole and Assay Database .........................................................................................101.5 Metallurgical Testing.........................................................................................................111.6 Mineral Resource Estimation ............................................................................................111.7 Exploration Potential .........................................................................................................121.8 Conclusions and Recommendations..................................................................................12
2.0 INTRODUCTION.........................................................................................................................13
3.0 RELIANCE ON OTHER EXPERTS............................................................................................17
4.0 PROPERTY DESCRIPTION AND LOCATION.........................................................................184.1 Location.............................................................................................................................184.2 Land Area ..........................................................................................................................184.3 Mining Claim Description.................................................................................................184.4 Agreements and Encumbrances ........................................................................................214.5 Permits...............................................................................................................................234.6 Environmental Liabilities ..................................................................................................24
5.0 ACCESS; CLIMATE; LOCAL RESOURCES; INFRASTRUCTURE; AND PHYSIOGRAPHY.......................................................................................................................................................255.1 Access................................................................................................................................255.2 Climate ..............................................................................................................................255.3 Local Resources and Infrastructure ...................................................................................255.4 Physiography .....................................................................................................................25
6.0 HISTORY......................................................................................................................................266.1 Exploration and Mining History........................................................................................266.2 WSMC and NewWest .......................................................................................................276.3 Newmont – Nevada Western Joint Venture ......................................................................28
7.0 GEOLOGIC SETTING .................................................................................................................337.1 Regional Geology..............................................................................................................337.2 Local Geology ...................................................................................................................35
8.0 DEPOSIT TYPE............................................................................................................................38
9.0 MINERALIZATION.....................................................................................................................399.1 Zanzibar Deposit ...............................................................................................................449.2 States and Main Deposits ..................................................................................................44

Fronteer Development Group Inc.Technical Report, Northumberland Project: Resource Update 2008 Page iv
CBL NI43-101_NorthumberlandResource_2008.07.28.doc July 28, 2008
9.3 Chipmunk Deposit.............................................................................................................469.4 Pad 4 Deposit.....................................................................................................................469.5 South Ridge Deposit..........................................................................................................469.6 Wedge-Shaped Deposit .....................................................................................................469.7 Rockwell Deposit ..............................................................................................................479.8 Other Mineralization .........................................................................................................47
10.0 EXPLORATION BY ISSUER......................................................................................................4810.1 Development......................................................................................................................4810.2 Pit Exploration...................................................................................................................4810.3 Regional Exploration.........................................................................................................48
11.0 DRILLING ....................................................................................................................................4911.1 Drill Data ...........................................................................................................................5011.2 Pre-WSMC Drilling...........................................................................................................5111.3 WSMC Drilling .................................................................................................................5211.4 Newmont Drilling..............................................................................................................52
12.0 SAMPLING METHOD AND APPROACH.................................................................................5412.1 Cyprus Core Sampling ......................................................................................................5412.2 WSMC RC and Core Sampling.........................................................................................5412.3 Newmont RC and Core Sampling .....................................................................................5512.4 Rotary and RC Sample Contamination .............................................................................55
13.0 SAMPLE PREPARATION, ANALYSIS, AND SECURITY......................................................5713.1 Sample Handling, Security, and Preparation.....................................................................5713.2 Analytical Procedures........................................................................................................5713.3 Soil Sample Analyses ........................................................................................................6013.4 Drill-Hole Database...........................................................................................................60
14.0 DATA VERIFICATION ...............................................................................................................6214.1 Check Assaying .................................................................................................................6214.2 Twin-Hole Comparisons ...................................................................................................7114.3 Assays Removed From Database ......................................................................................79
15.0 ADJACENT PROPERTIES..........................................................................................................80
16.0 MINERAL PROCESSING AND METALLURGICAL TESTING .............................................8116.1 Gold Recoveries from Mining Operations at Northumberland.........................................8116.2 Geo-Metallurgical Studies.................................................................................................8216.3 Metallurgical Testing.........................................................................................................82
17.0 MINERAL RESOURCE ESTIMATE ..........................................................................................8817.1 Drill Hole Data ..................................................................................................................8817.2 Deposit Geology Pertinent to Mineral Resource Estimation ............................................8817.3 Grade Modeling.................................................................................................................8917.4 Assay Data.........................................................................................................................94
17.4.1 Model Data ............................................................................................................98

Fronteer Development Group Inc.Technical Report, Northumberland Project: Resource Update 2008 Page v
CBL NI43-101_NorthumberlandResource_2008.07.28.doc July 28, 2008
17.4.2 Comparison of Old vs New .................................................................................10117.4.3 Grade Capping.....................................................................................................10317.4.4 Composites ..........................................................................................................105
17.5 Unwrinkling.....................................................................................................................10617.6 Variography.....................................................................................................................10817.7 Block Model ....................................................................................................................110
17.7.1 Grade Estimation .................................................................................................11017.7.2 Density and Oxidation Modeling ........................................................................11117.7.3 Metallurgical Modeling .......................................................................................113
17.8 Block Model Validation ..................................................................................................11417.9 Resource Classification ...................................................................................................11717.10 Other Mineralization .......................................................................................................12217.11 Recommended Improvements for Subsequent Modeling ...............................................122
18.0 MINERAL RESERVE ESTIMATE ...........................................................................................123
19.0 OTHER RELEVANT DATA AND INFORMATION...............................................................124
20.0 INTERPRETATIONS AND CONCLUSIONS ..........................................................................125
21.0 RECOMMENDATIONS ............................................................................................................12721.1 2008 Recommendations ..................................................................................................127
22.0 REFERENCES............................................................................................................................129
23.0 DATE AND SIGNATURE PAGE..............................................................................................134
24.0 CERTIFICATE OF AUTHORS..................................................................................................135

Fronteer Development Group Inc.Technical Report, Northumberland Project: Resource Update 2008 Page vi
CBL NI43-101_NorthumberlandResource_2008.07.28.doc July 28, 2008
LIST OF TABLES
Table PageTable 1.1 - Northumberland Classified Resources July 2008, Fronteer Development Group..................12Table 4.1 Northumberland Land Holdings and Obligations .....................................................................21Table 6.1 Northumberland Gold and Silver Production............................................................................27Table 6.2 Northumberland JV Drill Summary: Selected Results..............................................................30Table 6.2 Northumberland JV Drill Summary: Selected Results, cont.....................................................31Table 6.2 Northumberland JV Drill Summary: Selected Results, cont.....................................................32Table 11.1 Northumberland Resource Drill-Hole Database Summary.....................................................49Table 11.2 Northumberland Resource Drill-Hole Database - Statistics....................................................50Table 11.3 Northumberland Resource Drill-Hole Database – Sample Statistics by Drill Type ...............50Table 11.4 Northumberland Resource Drill-Hole Database – Sample Statistics by Company ................51Table 13.1 Laboratories and Assay Methods Employed Through 1997 ...................................................59Table 14.1 Comparison: American Assay Original vs. Duplicate ............................................................67Table 14.2 Drill Sample Assay Comparison: American Assay vs. WSMC..............................................68Table 14.3 Drill Sample Assay Comparison: American Assay Fire Assay vs. WSMC CN Leach ..........68Table 16.1 Summary of N2TEC Flotation Testing on Northumberland Samples.....................................86Table 17.1 Simplified Orientations of Geological Domains .....................................................................89Table 17.2 Grade Envelopes Used in Resource Estimation ......................................................................92Table 17.3 Descriptive Statistics and Box Plots Showing Assay Data By Drill Type..............................99Table 17.4 Descriptive Statistics and Box Plots Showing Assay Data By Operator ................................99Table 17.5 Descriptive Statistics and Box Plots of Gold Assays by Domain .........................................100Table 17.6 Descriptive Statistics and Box Plots of Silver Assays by Domain........................................101Table 17.7 Descriptive Statistics for Raw and Capped Gold and Silver Grades ....................................104Table 17.8 Summary Statistics for Gold Composites .............................................................................105Table 17.9 Summary Statistics for Silver Composites ............................................................................105Table 17.10 Traditional Semi-Variogram Models for Mineralized Domains .........................................108Table 17.11 Block Model Dimensions in Real Space.............................................................................110Table 17.12 Estimation Parameters for Northumberland Grade Estimation...........................................111Table 17.13 Tonnage Factors by Lithology ............................................................................................112Table 17.14 Tonnage Factors by Deposit................................................................................................112Table 17.15 Summary of Northumberland Cyanide Extraction Estimation Parameters.........................113Table 17.16 Northumberland Block Classification Parameters ..............................................................118Table 17.17 Northumberland Classified Resources July 2008, Fronteer Development Group ..............119Table 17.18 Northumberland Gold Resources by Cutoff Grade.............................................................120Table 17.19 Northumberland Silver Resources by Cutoff Grade ...........................................................121

Fronteer Development Group Inc.Technical Report, Northumberland Project: Resource Update 2008 Page vii
CBL NI43-101_NorthumberlandResource_2008.07.28.doc July 28, 2008
LIST OF FIGURES
Figure PageFigure 4.1 Northumberland Location Map................................................................................................19Figure 4.2 Northumberland Land Status Map...........................................................................................20Figure 7.1 Regional Geology of Northumberland Area ............................................................................34Figure 7.2 Local Geology of Northumberland ..........................................................................................36Figure 9.1 Geologic Cross Sections Showing the Northumberland Gold Deposits..................................40Figure 9.1 Geologic Cross Sections Showing the Northumberland Gold Deposits, continued ................41Figure 9.2 Plan Views of Northumberland Gold-Silver Host Horizons ...................................................42Figure 9.3 Cross Section 445100E Showing the Modeled Zanzibar and Rockwell Deposits ..................45Figure 9.4 Cross Section 447100E Showing the Modeled Zanzibar, States, South Ridge, and Chipmunk
Deposits .............................................................................................................................45Figure 11.1 Drill-Hole Location Map .......................................................................................................53Figure 13.1 Rules Governing Selection of Assay Value for Drill-Hole Database ....................................61Figure 14.1 Check Assays of Pulps/Rejects: Monitor vs. Skyline ............................................................63Figure 14.2 Check Assays of Pulps/Rejects: Monitor vs. WSMC............................................................63Figure 14.3 Check Assays of Pulps/Rejects: American Assay vs. Barringer ...........................................64Figure 14.4 Check Assays of Pulps/Rejects: WSMC vs. Barringer..........................................................65Figure 14.5 Check Assays of Pulps/Rejects: WSMC vs. Hunter ..............................................................65Figure 14.6 Check Assays of Pulps/Rejects: Barringer vs. Rocky Mountain ...........................................66Figure 14.7 Check Assays of Pulps/Rejects: American Assay vs. WSMC...............................................66Figure 14.8 Check Assays of Pulps/Rejects: American Assay vs. Cone ..................................................67Figure 14.9 Scatter Plot of Newmont Rig Duplicates ...............................................................................69Figure 14.10 Check Assays of Pulps: Chemex vs. American Assay ........................................................70Figure 14.11 Down-Hole Gold Grade Plots of Core-Rotary and Core-RC Twin Sets .............................71Figure 14.11 Down-Hole Gold Grade Plots of Core-Rotary and Core-RC Twin Sets (continued) ..........72Figure 14.11 Down-Hole Gold Grade Plots of Core-Rotary and Core-RC Twin Sets (continued) ..........73Figure 14.11 Down-Hole Gold Grade Plots of Core-Rotary and Core-RC Twin Sets (continued) ..........74Figure 14.12 Down-Hole Gold Grade Plots of Core-RC Twin Pairs........................................................75Figure 14.12 Down-Hole Gold Grade Plots of Core-RC Twin Pairs.......................................................76(continued) 76Figure 14.13 Down-Hole Gold Grade Plots of RC-Rotary and RC-RC Twin Sets ..................................77Figure 14.13 Down-Hole Gold Grade Plots of RC-Rotary and RC-RC Twin Sets (continued)...............78Figure 17.1 Quantile Plot of Northumberland Au Sample Data ...............................................................90Figure 17.2 Section 445200E illustrating the relationships between stratigraphy, thrust faults (dashed
lines) and grade envelopes.................................................................................................93Figure 17.3 Scattergram Showing Lack of Correlation Between Gold and Silver ...................................94Figure 17.4 Box & Whisker Plots Comparing Rotary Drilling by Operator.............................................95Figure 17.5 Q-Q Plots Comparing Rotary Drilling Results by Operator ..................................................95Figure 17.6 Box & Whisker Plots Comparing RC Drilling By Operator .................................................96Figure 17.7 Q-Q Plots Comparing RC Drilling By Operator....................................................................96Figure 17.8 Box & Whisker Plot Comparing Core Drilling By Operator.................................................97

Fronteer Development Group Inc.Technical Report, Northumberland Project: Resource Update 2008 Page viii
CBL NI43-101_NorthumberlandResource_2008.07.28.doc July 28, 2008
Figure 17.9 Q-Q Plots Comparing Core Drilling By Operator .................................................................97Figure 17.10 Q-Q Plots Comparing Drill Types by Cyprus......................................................................98Figure 17.11 Histograms Showing (a) Gold and (b) Silver Assays Captured Within Modeled Grade
Envelopes ..........................................................................................................................98Figure 17.12 (a) Old and (b) New Assay Data Collected Pre- and Post-2006 MDA Mineral Resource
Estimate, respectively. (c) and (d) are old and new, west of 445500 ft E. ......................102Figure 17.13 Q-Q Plots Showing Comparisons of Old vs New Data Across the Entire Deposit (a) and
only west of 445500ft E (b).............................................................................................103Figure 17.14 Log Probability Curves of Gold in High and Low Grade Domains ..................................104Figure 17.15 Log Probability Curve for Silver Grades ...........................................................................104Figure 17.16 Histograms of capped composites (>0.1 g/t Au) in High Grade Domains: (a) Layers 1, (b)
Layer 2, and (c) Layer 3 ..................................................................................................106Figure 17.17 Histograms of capped composites (>0.1 g/t Au) in Low Grade Domains: (a) Layers 1, (b)
Layer 2, and (c) Layer 3 ..................................................................................................106Figure 17.18 East-West Long Section Showing Distribution of Stratigraphic Layers ...........................107Figure 17.19 Traditional Semi-Variograms for the Principal Directions of Continuity in Each of the
High and Low Grade Domains: (a) L1_HG, (b) L1_LG, (c) L2_HG, (d) L2_LG, (e)L3_HG, (f) L3_LG ..........................................................................................................109
Figure 17.20 Histograms Showing Grade Distributions for Nearest-Neighbour, ID2 and OrdinaryKriging Estimates ............................................................................................................114
Figure 17.21 Q-Q Plots Comparing Grade Estimates for Each Interpolation Above a Cut-Off Grade 0.3g/t Au ...............................................................................................................................114
Figure 17.22 Vertical east-west swath plot comparing nearest neighbour (NN), inverse distance squared(ID2), and ordinary kriging (OK) estimates along a 240 foot wide swath across the centerof the deposit ...................................................................................................................115
Figure 17.23 Plan View of the Northumberland Block Model Grades (Blue=0.25-0.50, Green=0.5-1.0,Yellow=1.0-3.0, Orange=3.0-6.0, Red>6.0) ...................................................................116
Figure 17.24 Long Section 1532000N Showing Block Grades (colours as in Figure 17.23) .................116Figure 17.25 Cross-Section 445100E Showing Zanzibar and Rockwell Block Grades and Geology
(grade colours as in Figure 17.23; c.f. Figure 17.2 for geology).....................................117

Fronteer Development Group Inc.Technical Report, Northumberland Project: Resource Update 2008 Page 9
CBL NI43-101_NorthumberlandResource_2008.07.28.doc July 28, 2008
1.0 EXECUTIVE SUMMARY
This technical report on the Northumberland project was prepared by Fronteer DevelopmentGroup Inc. (“Fronteer”) as an update to the independent technical report by MineralDevelopment Associates (“MDA”), dated November 1, 2007. The update describes a newMineral Resource estimate that incorporates new drilling information collected aftercompletion of the previous estimate, which is described in the MDA report. This reportincorporates most of MDA’s previous report, with the exception of Section 17, describing theupdated Mineral Resource, and other updates where appropriate. The report was written incompliance with disclosure and reporting requirements set forth in the Canadian SecuritiesAdministrators’ National Instrument 43-101, Companion Policy 43-101CP, and Form 43-101F1.
The Northumberland project is comprised of unpatented lode mining claims, patented miningclaims, and fee lands owned by Nevada Western Gold LLC (“Nevada Western”), a whollyowned subsidiary of NewWest Gold Corp. USA (“NewWest”). Fronteer acquired 100% ofNewWest, including the Northumberland project, on September 24, 2007.
The Northumberland Mineral Resources discussed in this technical report were estimated inApril and May 2008 by Christopher Lee, Fronteer Chief Geoscientist, with the assistance ofJim Ashton, NewWest Senior Engineer. Mr. Lee and Mr. Ashton are qualified persons underCanadian Securities Administrators’ National Instrument 43-101. Mr. Lee is an employee andshareholder of Fronteer. Mr. Ashton is also an employee of the company.
1.1 Introduction
The Northumberland project is located near the geographic center of Nevada in northern NyeCounty, approximately 300-road miles northwest of Las Vegas and 250-road miles east-southeast of Reno. The towns of Austin and Round Mountain are the nearest populationcenters to the project. Open-pit heap-leach mining activities were undertaken at the projectfrom 1981 through 1990.
The Northumberland project is comprised of approximately 34,000 acres (13,760ha) ofunpatented lode claims and 3,885 acres (1,572ha) of patented mining claims, patented millsiteclaims, and fee lands, all of which are owned or controlled by Nevada Western Gold LLC(“Nevada Western”), a wholly owned subsidiary of NewWest. The fee lands include twoblocks, the Upper Site and Lower Site. The Upper Site is entirely surrounded by landsadministered by the U.S. Forest Service and the Lower Site is surrounded by public landsadministered by the Bureau of Land Management. All mining activities have taken place atthe Upper Site, while some of the processing and other mining infrastructure from modernmining operations was located at the Lower Site. The unpatented claims are held in threediscrete blocks, the largest of which surrounds the fee lands at the Upper Site. All of theMineral Resources described this report lie within the fee lands owned by Nevada Western.Title to the property was verified in an independent title report by Erwin and Thompson LLPthat was commissioned by NewWest, completed in June 2005, and supplemented mostrecently in July 2007.

Fronteer Development Group Inc.Technical Report, Northumberland Project: Resource Update 2008 Page 10
CBL NI43-101_NorthumberlandResource_2008.07.28.doc July 28, 2008
A small portion of the Mineral Resources summarized below are subject to a 1% net smelterreturns royalty.
1.2 Geology and Mineralization
The Northumberland mineralization occurs as stacked, sediment-hosted, finely disseminated,Carlin-type gold-silver deposits. Intrusive rocks also host significant mineralization. Thisdeposit type and the overall geologic setting of the mineralization are quite similar to theGoldstrike deposit of the northern Carlin Trend. The gold-silver mineralization atNorthumberland occurs in a cluster of eight more-or-less spatially distinct deposits that forman arcuate belt approximately 1.6 miles long in an east-west direction and 0.3 miles wide.The deposits are generally stratiform and follow three low-angle tectono-stratigraphic hosthorizons near the crest and within the west limb of the Northumberland anticline. The hosthorizons are structural discontinuities that include the intersection zone of the Prospect andMormon thrusts and two bedding-plane faults. The overall geometry of the deposits and thehigher-grade zones within the deposits appears to be locally influenced by east-trending high-angle structures in the area of the crest of the anticline.
Gold occurs as micron- to sub-micron-size particles that are intimately associated withsulfides. The gold is disseminated primarily within sedimentary units, although intrusiverocks host a significant portion of the mineralization. Silver occurs in a complex assemblageof copper-antimony sulfides and arsenic sulfosalts. The total sulfide content is less than fivepercent; pyrite, arsenopyrite, and marcasite are the most abundant species present. Themineralization is associated with both silicification and decalcification of carbonate hosts, andquartz-illite-pyrite alteration of igneous hosts.
1.3 Mining and Exploration History
The Northumberland property was in production under the operatorship of NorthumberlandMining Company from 1939 to 1942, Cyprus Mining Company (“Cyprus”) from 1981 to1984, and Western States Minerals Corporation (“WSMC”) from 1985 to 1990. TheNorthumberland Mining Company production details are not documented. Cyprus andWSMC mined over seven-million tons of ore from several open pits and produced over230,000 ounces of gold and 485,000 ounces of silver by heap leaching of oxidized andpartially oxidized ore that was either crushed or run-of-mine. Gold recoveries for crushedoxide ore and run-of-mine, partially oxidized ore from these operations has been estimated atapproximately 75% and 50%, respectively.
Reconnaissance geologic mapping and soil geochemical sampling have been completed overmost of the project, with detailed mapping undertaken in the area of the deposits. Variousgeophysical surveys cover significant portions of the property.
1.4 Drill-Hole and Assay Database
The Northumberland digital database used in the estimation of Mineral Resources includes1,502 drill holes totaling 606,369.5 ft of drilling. These holes were drilled from 1968 through

Fronteer Development Group Inc.Technical Report, Northumberland Project: Resource Update 2008 Page 11
CBL NI43-101_NorthumberlandResource_2008.07.28.doc July 28, 2008
2007 by Homestake Mining Company, Idaho Mining Corporation, Cyprus, WSMC, andNewmont by air-track, conventional rotary, reverse circulation, and diamond core methods.Entire series of older drill holes are not included in the database due to sample quality andassay reliability issues.
Although QA/QC programs were apparently not systematically implemented and documentedprior to Newmont’s 2004-2007 exploration work, check assay and twin-hole data from theCyprus and WSMC drilling campaigns were compiled by MDA in 2006. An analysis of thesedata found no serious problems with the assay database, although additional check-assay dataare needed. The twin-hole data suggests that down-hole contamination may be presentlocally. Several possible contaminated intervals were identified during the grade modeling ofthe deposits. These suspect assay intervals, as well as the contaminated volumes, wereexcluded from the resource estimation.
A number of assay pulps and/or rejects from mineralized WSMC drill intervals should beretrieved from storage and analyzed by an independent laboratory. All further drillingprograms at Northumberland should continue the QA/QC procedures implemented byNewmont in 2004.
1.5 Metallurgical Testing
Metallurgical studies indicate that differences in the amenability of the Northumberlandmineralization to direct cyanidation are primarily due to the degree of oxidation, as opposedto deposit-specific characteristics or crush size. Oxide material appears to be amenable todirect cyanidation by heap leaching, while sulfide mineralization requires oxidation prior tocyanidation. Sulfide mineralization is refractory due the close association of micron-size goldwith sulfides and the local presence of preg-robbing carbonaceous material.
Diagnostic metallurgical testing completed to date indicates that gold and silver extractionsfrom sulfide mineralization can be optimized by utilizing the N2TEC flotation technology ofNewmont with autoclaving of the concentrates. Extractions in excess of 90% for both goldand silver in the flotation concentrate were attained in the samples tested.
1.6 Mineral Resource Estimation
The Northumberland gold and silver resources were estimated in April and May 2008 byFronteer Development Group personnel (Table 1.1). Resource cut-off grades were chosen todefine material that might have a reasonable prospect of economic extraction under thefollowing scenarios: open-pit mining and heap leaching of oxide mineralization [0.3 g/t Au(0.01 opt) cut-off]; open-pit mining and treatment of sulfide material [1.0 g/t Au (0.03 opt)cut-off]; and underground mining and processing of sulfide material [2.5 g/t Au (0.07 opt)cut-off]. No silver resources are classified as Measured due to the generalized nature of theestimation, and only silver lying within the modeled gold zones was tabulated. Silverresources are compiled from all modeled blocks that exceed the gold cut-offs; no silver cut-off is applied.

Fronteer Development Group Inc.Technical Report, Northumberland Project: Resource Update 2008 Page 12
CBL NI43-101_NorthumberlandResource_2008.07.28.doc July 28, 2008
Table 1.1 - Northumberland Classified Resources July 2008, FronteerDevelopment Group
Gold Gold Equivalent*Resource Type Cut-off (g/t) Cut-off (opt) Tonnes g/t opt oz ozOpen Pit Oxide 0.3 0.01 12,888,000 1.19 0.035 492,000 492,000Open Pit Sulfide 1.0 0.03 13,781,000 2.31 0.067 1,022,000 1,022,000Underground 2.5 0.07TOTAL 26,669,000 1.77 0.05 1,514,000 1,514,000
Gold Silver Gold Equivalent*Resource Type Cut-off (g/t) Cut-off (opt) Tonnes g/t opt oz Tonnes g/t opt oz ozOpen Pit Oxide 0.3 0.01 739,000 1.94 0.057 46,000 13,627,000 7.31 0.213 3,202,000 110,000Open Pit Sulfide 1.0 0.03 8,794,000 2.35 0.069 665,000 22,575,000 8.01 0.234 5,815,000 781,000Underground 2.5 0.07 316,000 3.35 0.098 34,000 316,000 4.43 0.129 45,000 35,000TOTAL 9,849,000 2.35 0.07 745,000 36,518,000 7.72 0.23 9,062,000 926,000
Gold Silver Gold Equivalent*Resource Type Cut-off (g/t) Cut-off (opt) Tonnes g/t opt oz Tonnes g/t opt oz ozOpen Pit Oxide 0.3 0.01 13,627,000 1.23 0.036 538,000 13,627,000 7.31 0.213 3,202,000 602,000Open Pit Sulfide 1.0 0.03 22,575,000 2.32 0.068 1,687,000 22,575,000 8.01 0.234 5,815,000 1,803,000Underground 2.5 0.07 316,000 3.35 0.098 34,000 316,000 4.43 0.129 45,000 35,000TOTAL 36,518,000 1.92 0.06 2,259,000 36,518,000 7.72 0.23 9,062,000 2,440,000
Gold Silver Gold Equivalent*Resource Type Cut-off (g/t) Cut-off (opt) Tonnes g/t opt oz Tonnes g/t opt oz ozOpen Pit Oxide 0.3 0.01 17,000 2.38 0.069 1,300 17,000 10.98 0.320 6,000 1,400Open Pit Sulfide 1.0 0.03 1,335,000 2.59 0.075 111,000 1,335,000 7.69 0.224 330,000 118,000Underground 2.5 0.07 5,574,000 3.70 0.108 664,000 5,574,000 5.95 0.174 1,067,000 685,000TOTAL 6,926,000 3.49 0.10 776,300 6,926,000 6.30 0.18 1,403,000 804,400*AuEq calculated at a Au:Ag ratio of 50:1
MEASURED
INDICATED
INFERRED
MEASURED & INDICATED
1.7 Exploration Potential
The potential to find additional gold resources at Northumberland is considered to beexcellent, both within the deposit area and in other portions of the large property holdings.The possibility of high-grade gold mineralization within structurally controlled zones in thecore areas of the deposits warrants careful evaluation and drill testing. There is also potentialto discover additional mineralization in the general area of the deposits in geologic settingssimilar to the known deposits.
There are a number of targets well beyond the limits of the Mineral Resources that are definedby soil and/or rock gold anomalies and favorable geology. Fronteer plans to drill test anumber of targets within, and outside, the main resource area.
1.8 Conclusions and Recommendations
There is excellent exploration potential at Northumberland, both within the deposit area andin other areas of the large property holdings. Within the deposit area, gold-silvermineralization in each of the three tectono-stratigraphic horizons locally breaches theintervening rock units and merges with mineralization in the neighboring host horizon. Thesediscordant zones are frequently cored by high-grade mineralization that is presumablystructurally controlled and in many cases not properly defined by drilling. These high-gradecore zones warrant further drill testing, as do the possible deeper extensions of the controllingstructures. In addition, There are many open, untested ares within the shallower, moreoxidized portions of the deposit that may allow expansion of the known deposits. Fronteeralso plans to explore beyond the limits of the known deposits in an attempt to discoveradditional mineralization in similar geologic settings.

Fronteer Development Group Inc.Technical Report, Northumberland Project: Resource Update 2008 Page 13
CBL NI43-101_NorthumberlandResource_2008.07.28.doc July 28, 2008
2.0 INTRODUCTION
This technical report on the Northumberland project was prepared by Fronteer DevelopmentGroup Inc. (“Fronteer”), which is based in Vancouver, British Columbia and listed on theTSX and AMEX stock exchanges under the trading symbol “FRG”. The report describes anupdated Mineral Resource estimate for the Northumberland deposit that incorporates new drillhole data collected since the previous estimate, which is documented in the independenttechnical report by Mineral Development Associates (“MDA”), dated November 1, 2007.This report incorporates most of MDA’s report, with the exception of Section 17, describingthe updated Mineral Resource, and other updates where appropriate. The report was writtenin compliance with disclosure and reporting requirements set forth in the Canadian SecuritiesAdministrators’ National Instrument 43-101, Companion Policy 43-101CP, and Form 43-101F1.
The Northumberland project is comprised of unpatented lode mining claims, patented miningclaims, and fee lands owned by Nevada Western Gold LLC (“Nevada Western”), a whollyowned subsidiary of NewWest Gold Corp. USA (“NewWest”). Fronteer acquired 100% ofNewWest, including the Northumberland project, on September 24, 2007.
The Northumberland Mineral Resources discussed in this technical report were estimated inApril and May 2008 by Christopher Lee, Fronteer Chief Geoscientist, with the assistance ofJim Ashton, NewWest Senior Engineer, and Ross Sherlock, former Fronteer ChiefExploration Geologist. Mr. Lee’s familiarity with the project has been gained primarilythrough discussions with George Lanier, NewWest Regional Geologist, and Jim Ashton,including desktop data analysis and interpretation over the past year, and during a site visit inJuly 2007. Mr. Ashton and Mr. Lanier have been actively involved in the Northumberlandproject for more than 10 years and, together, they personally conducted the previous MineralResource modeling and estimation under the guidance of MDA in January 2005. Mr. Lee andMr. Ashton are the qualified persons for this report, and have the knowledge and capacity todo so under Canadian Securities Administrators’ National Instrument 43-101.
The information in this report is current as of July 21, 2008 unless otherwise noted.

Fronteer Development Group Inc.Technical Report, Northumberland Project: Resource Update 2008 Page 14
CBL NI43-101_NorthumberlandResource_2008.07.28.doc July 28, 2008
Currency, units of measure, and conversion factors used in this report include:
Linear Measure1 inch = 2.54 centimetres1 foot = 0.3048 metre1 yard = 0.9144 metre1 mile = 1.6 kilometres
Area Measure1 acre = 0.4047 hectares1 square mile = 640 acres = 259 hectares
Capacity Measure (liquid)1 US gallon = 4 quarts = 3.785 liter
Weight1 short ton = 2000 pounds = 0.907 tonne1 pound = 16 oz = 0.454 kg = 14.5833 troy ounces
Analytical Values grams per troy ounces per percent metric tonne short ton
1% 1% 10,000 291.6671 gm/tonne 0.0001% 1 0.02916671 oz troy/short ton 0.003429% 34.2857 110 ppb 0.00029 100 ppm 2.917
Densityg/cc = 32.0369 ÷ tonnage factor (ft3/ton)g/cc = 0.016018 x pounds/ft3
CurrencyUnless otherwise indicated, all references to dollars ($) in this report refer to currency
of the United States.

Fronteer Development Group Inc.Technical Report, Northumberland Project: Resource Update 2008 Page 15
CBL NI43-101_NorthumberlandResource_2008.07.28.doc July 28, 2008
Frequently used acronyms and abbreviationsAA atomic absorption spectrometryac. acreADR adsorption-desorption-recoveryAg silverAmerican Assay American Assay LaboratoriesAu goldBLM U.S. Department of the Interior, Bureau of Land ManagementBoyles Brothers Boyles Brothers Drilling CompanyoC degrees Centigradecc cubic centimetresCIL carbon-in-leach treatmentCIM Canadian Institute of Mining, Metallurgical, and Petroleumcm centimetrecore diamond drill coreCSAMT controlled source audio-magneto-tellurics surveyCV coefficient of variationCyprus Cyprus Northumberland Mining Company or Cyprus MinesCorporationdeposit area area including the Northumberland open pits and known gold depositsEklund Eklund Drilling CompanyElsing Elsing Drilling and Pump Co., Inc.Fronteer Fronteer Development Group°F degrees Fahrenheitft foot or feetg gramsg/t grams per metric ton (tonne)g Ag/t grams silver per metric tong Au/t grams gold per metric tonha hectareHomestake Homestake Mining CompanyICP-MS inductively coupled plasma – mass spectrometryIdaho Mining Idaho Mining Corporationin inchK-Ar potassium-argon age dating methodKerr McGee Kerr McGee Mining Companym metreMa million years

Fronteer Development Group Inc.Technical Report, Northumberland Project: Resource Update 2008 Page 16
CBL NI43-101_NorthumberlandResource_2008.07.28.doc July 28, 2008
Frequently used acronyms and abbreviations, cont.Nevada Western Nevada Western Gold LLCNewWest NewWest Gold CorporationNewmont Newmont Mining CorporationNorthumberland Northumberland projectNMC Northumberland Mining CompanyNSR net smelter returnoz Ag/ton troy ounces silver per short tonoz Au/ton troy ounces gold per short tonPAH Pincock, Allen & Holt, Inc.RC reverse circulation drillingRotary conventional open-hole rotary drillingSanta Fe Santa Fe Pacific Gold CorporationSG specific gravityTF tonnage factorton short tont metric ton or tonneTonto Tonto Drilling Services Inc.USFS U.S. Department of Agriculture, Forest ServiceWSMC Western States Minerals CorporationWSRC Western States Royalty Corporation

Fronteer Development Group Inc.Technical Report, Northumberland Project: Resource Update 2008 Page 17
CBL NI43-101_NorthumberlandResource_2008.07.28.doc July 28, 2008
3.0 RELIANCE ON OTHER EXPERTS
A mineral status report of the Northumberland property prepared by Erwin and ThompsonLLP (Erwin, 2005) documents royalty burdens and discusses the title status of the unpatentedmining claims, fee lands, and patented mining claims as of April 2005. This report wasupdated with a fourth supplement, in July 2007 (Erwin 2007). Fronteer relies on theconclusions of Erwin and Thompson LLP (Erwin 2005, 2007) as to the title of, and royaltiesapplicable to, the Northumberland properties.
Fronteer has not conducted any independent exploration on the Northumberland property andmust rely on data and information provided by previous owners, NewWest, WSMC and otheroperators of the Northumberland project. However, based on thorough reviews by Fronteerand the independent consultants responsible for the previous Mineral Resource estimate andtechnical report, MDA, Fronteer believes that the data are general an accurate and reasonablerepresentation of the project.
George Lanier, Regional Geologist for Fronteer, is a co-author of this technical report inrecognition of his efforts in assisting in the preparation of Sections 7, 8, 9, and 16 of the reportand his extensive contributions to the general understanding of the geology and mineralizationat Northumberland.

Fronteer Development Group Inc.Technical Report, Northumberland Project: Resource Update 2008 Page 18
CBL NI43-101_NorthumberlandResource_2008.07.28.doc July 28, 2008
4.0 PROPERTY DESCRIPTION AND LOCATION
4.1 Location
The Northumberland project is located in northern Nye County near the geographic center ofNevada at 38º 57' 29" N latitude and 116 º 50’ 44” W longitude (Figure 4.1). The project isapproximately 300-road miles northwest of Las Vegas and 250-road miles east-southeast ofReno. The nearest population center to Northumberland is the Round Mountain area, whichis located approximately 25 miles to the south. The central portion of the project lies in thecenter of the Toquima Range at Northumberland Pass.
4.2 Land Area
The Northumberland project is comprised of approximately 38,000 acres (15,380ha) ofpatented and unpatented mining claims and fee lands owned or controlled by NewWest(Figure 4.2). The fee lands include the Upper Site, which is entirely surrounded by ToyaibeNational Forest lands administered by the U.S. Forest Service (“USFS”), and the Lower Site,which is surrounded by public lands administered by the Bureau of Land Management(“BLM”) (Figure 4.2). The Upper and Lower Site fee lands cover a total of 3,885 acres(1,572ha). All mining activities to date have occurred at the Upper Site, while some of theprocessing and other mining infrastructure from modern mining operations were located at theLower Site (see Sections 6 and 10 for the mining and exploration history).
A mineral survey was conducted on the fee lands as part of the land exchange processdiscussed below. The unpatented mining claims in the general area of the Upper Site weresurveyed by WSMC in the early 1990s; the remaining claims have not been surveyed.
4.3 Mining Claim Description
The Northumberland project includes 1,745 unpatented lode mining claims for a total ofapproximately 34,000 acres (13,760ha) (based on an assumption of 20 acres per claim thatdoes not include 27 CAN claims staked to cover gaps in the other claims), and 3,885 acres(1,572ha) of patented mining claims, patented millsite claims, and fee lands. Some of theproject lands are subject to net smelter return (“NSR”) royalties on production (Table 4.1).The unpatented claims, which are listed in Appendix A, lie in three discreet blocks, the largestof which surrounds the fee lands at the Upper Site (Figure 4.2). This block of claims includesone inlier claim block not controlled by Fronteer (shown as white in Figure 4.2). The 27CAN claims were located in September 2006 to cover open fractions; the staking of theseclaims resulted in no additional area to the project relative to that reported in the 2006technical report (Gustin et al., 2006).

Fronteer Development Group Inc.Technical Report, Northumberland Project: Resource Update 2008 Page 19
CBL NI43-101_NorthumberlandResource_2008.07.28.doc July 28, 2008
Figure 4.1 Northumberland Location Map

Fronteer Development Group Inc.Technical Report, Northumberland Project: Resource Update 2008 Page 20
CBL NI43-101_NorthumberlandResource_2008.07.28.doc July 28, 2008
Figure 4.2 Northumberland Land Status Map
UPPER SITE

Fronteer Development Group Inc.Technical Report, Northumberland Project: Resource Update 2008 Page 21
CBL NI43-101_NorthumberlandResource_2008.07.28.doc July 28, 2008
Table 4.1 Northumberland Land Holdings and Obligations
Property Type Number ApproximateArea (acres)1
ApproximateArea (hectares)
AnnualHoldingCosts2
RoyaltyObligations
1,194 24,040 9,730 $160,467 -
15 300 120 $2,002.50 1% of grossrevenue3
73 1,320 535 $8,811.00 1% NSR
100%-OwnedUnpatented Claims
1 20 8 $135.50 1.5% NSR
Claims staked byNewmont withinArea of Interest4
253 4,520 1,830 $30,171.00 -
Leased UnpatentedClaims (Sterling or
“Hoodoo”)209 4,180 1,690 $47, 901.50 4% NSR
Patented Claims 9 184.47 74.65 -
Patented MillsiteClaims 63 315.00 127.5 -
Fee Lands 3,385.53 1,370.12
$10,200
1% NSR onsome portions
Totals 1,817 claims approx. 34,879acres
Approx. 15,477hectares $259,689
1 Assumes each claim covers 20 acres (with the exception of the 27 CAN claims): actual acreage may vary.2 Includes $125 Federal claim-holding fees, $8.50 County filing fees, lease or advance royalty payments, andcounty taxes.3 Applies to gold and silver; a 1% NSR applies to other minerals.4 Not including the Thumb claims, which are listed as Leased Unpatented Claims.
4.4 Agreements and Encumbrances
The royalty burdens and status of the unpatented mining claims and private lands discussed inthis section are based on a review of various legal documents provided by WSMC andNewWest, as well as a mineral status report on the Northumberland property effective June2005 and supplemented in 2007 (Erwin, 2005, 2007).
The Northumberland property includes unpatented mining claims, patented mining claims,patented millsite claims, and fee lands, all of which are 100% owned by Nevada Western, aswell as unpatented claims controlled by Nevada Western by means of a lease agreement withSterling Gold Mining Corporation.
Fronteer Development Group Inc.Technical Report, Northumberland Project: Resource Update 2008 Page 22
CBL NI43-101_NorthumberlandResource_2008.07.28.doc July 28, 2008
The lands 100% owned by Nevada Western were acquired by staking and through a series ofpurchases and agreements. These agreements include:
• the sale of various unpatented claims and assets to WSMC by Cyprus NorthumberlandMining Company (“Cyprus”) on July 1, 1985;
• the sale of 9 unpatented claims to WSMC by Kohlmoos and others on September 24,1992 subject to a 1% NSR royalty retained by Kohlmoos;
• the sale of 15 claims to WSMC by Wilson Minerals on October 15, 1992 subject to amineral production royalty equal to 1% of the gross revenues on gold and silver and a1% NSR royalty on other minerals retained by Wilson Minerals (Erwin, 2005);
• the sale of 106 unpatented claims to WSMC by Kohlmoos on November 6, 1992subject to a 1% NSR royalty retained by Kohlmoos;
• an interest in 176 claims assigned to WSMC and Gooding Corporation, a Coloradocorporation that subsequently merged with WSMC (Erwin, 2005), by ArroyoMinerals, Inc. and Bankruptcy Trustee on March 28, 1994;
• a land exchange between WSMC and the USFS on April 1, 1997, in which 3,385.53acres of USFS-administered public lands in the core of the Northumberland projectarea, including claims held by WSMC by means of the Cyprus and Kohlmoosagreements summarized above, were deeded to WSMC in exchange for 767.28 acresof privately owned fee acreage in Nye, White Pine and Lander Counties, Nevada; and
• the sale of the Kay No. 18 claim to Nevada Western by Kohlmoos on December 20,2005 subject to a 1.5% NSR royalty retained by the original owners (the royalty willbe reduced to 1% if the US government imposes a production royalty in the future).
The Sterling Gold Mining Corporation lease (the “Hoodoo” lease in Table 4.1 and Figure 4.2)was originally executed on June 12, 1991 and applied to 204 HD and ZIG unpatented miningclaims. Erwin (2005) reported that the HD and ZIG claims were located in 1978. A Notice ofIntent to Hold for these claims was filed with the BLM in December of 1979, but was notrecorded in Nye County during the 1979 calendar year as is required under the provisions ofthe Federal Land Policy and Management Act. Instead, the Notice of Intent to Hold wasrecorded on January 17, 1980. Erwin (2005) recommended that the matter be investigatedfurther and, if the situation as reported was found to be accurate, the claims should berelocated. In cooperation with Mr. Sterling, Newmont abandoned the HD and ZIG claims andstaked 209 Thumb claims in their place in 2005. The lease will remain in effect so long asannual minimum advance royalty payments of $20,000 are paid. These payments applytowards a mineral production royalty equal to 4% of the net smelter returns from mineralsproduced from the claims.
Nevada Western entered into a joint venture with Newmont to further explore and, ifwarranted, develop the Northumberland project on December 19, 2003. Under the terms ofthe joint venture agreement, Newmont was to spend US$25 million within six years to earn asixty percent interest in the project. From 2004 through 2007, Newmont spent approximately$8,700,000 exploring Northumberland. The JV agreement was terminated on June 1, 2008,and all interests in the property revert back to NewWest, including 253 claims staked byNewmont within the area of interest of the JV. As part of the termination agreement,Newmont granted NewWest a license, free of royalty and at no fee, to use Newmont’sproprietary flotation process knowledge known as “N2TEC”, for the processing of

Fronteer Development Group Inc.Technical Report, Northumberland Project: Resource Update 2008 Page 23
CBL NI43-101_NorthumberlandResource_2008.07.28.doc July 28, 2008
Northumberland ores. In exchange, NewWest will grant Newmont the first right of refusal toprocess Northumberland ores, should NewWest elect not to build a refractory ore treatmentplant of its own.
The Mineral Resources reported in Section 17 of this technical report lie within the fee landsand patented mining claims owned by Nevada Western (Figure 4.2). A very small portion ofthe resources is subject to the Kohlmoos 1% NSR royalty (Figure 4.2).
The Federal annual unpatented mining claim maintenance fees for the annual assessment yearfrom September 1, 2006 to September 1, 2007 have been properly and timely paid on theNorthumberland unpatented claims (Erwin, 2007). Erwin (2007) reports that the BLMmining claim records indicate that the Northumberland unpatented claims are active and ingood standing through September 1, 2007. The maintenance fees for the Northumberlandunpatented claims have been paid for the September 1, 2007 to September 1, 2008 assessmentyear.
4.5 Permits
All necessary permits are current at Northumberland, and the required reclamation bonding isin place. Current reclamation bonding with the Nevada Division of EnvironmentalProtection, Bureau of Mining Regulation and Reclamation (BMRR) to cover disturbances atNorthumberland currently stands at $2,100,854. This amount is comprised of two approvedNevada State Reclamation Permits. The mine site reclamation along with several explorationroads is covered under Permit #0028 ($1,544,454) and the Gooding Exploration is approvedunder Permit #0230 ($556,400). The Gooding Exploration Permit was transferred fromNewmont to NewWest Gold USA Inc. (Fronteer) and approved by the BMRR in May 2008.The Gooding Exploration Permit allows for exploration activities on Northumberland feelands with up to 200 acres of disturbance.
In 2005 the USFS approved four Plan of Operation permits submitted by Newmont to coveranticipated exploration of various targets in 2005 through 2007, including the Rim, Orocopter,Wilson, and Ziggurat targets. Newmont also obtained the Ziggurat and Orocopter Noticesfrom the BLM for exploration activities planned for 2005 through 2007 (Newmont, 2006).NewWest is currently in the process of transferring the Orocopter, Wilson, and Rim Plan ofOperation permits from Newmont. Associated with each of these Plan of Operation permits isa Nevada State Reclamation Permit. The USFS is the lead agency and holds the bond foreach Plan. NewWest is currently waiting for approval from the USFS before initiating thetransfer of the associated Reclamation Permits from the BMRR. The Ziggurat Plan ofOperation and Notice were closed by Newmont after all reclamation work was completed.No exploration activities were done on the Orocopter Notice and therefore Newmont closedthe permit.

Fronteer Development Group Inc.Technical Report, Northumberland Project: Resource Update 2008 Page 24
CBL NI43-101_NorthumberlandResource_2008.07.28.doc July 28, 2008
4.6 Environmental Liabilities
There are ongoing environmental liabilities at Northumberland that are primarily related tothe prior mining activities undertaken at both the Upper and Lower Sites. The most importantof the environmental liabilities includes the closure of heaps and process ponds at the UpperSite, as well as sites with hydrocarbon-impacted soils at both the Upper and Lower Sites.Impacts to shallow ground water have been detected near ore-processing infrastructure relatedto WSMC’s prior mining activities at the Upper Site, including an ore heap and a smallpregnant solution pond, although no impacts to ground water have been detected to date in thedeep aquifer or in shallow monitor wells situated down the hydraulic gradient.
Original total mining disturbance at the Upper Site was 285 acres; reclamation activities havereduced the disturbed acreage to approximately 126 acres. All mine-waste dumps at theUpper Site have been re-contoured where required and reseeded. Two underground storage-tank sites and the barren-pond generator sites have been excavated and are considered closedby the Nevada Department of Environmental Protection. A total of 4,500 cubic yards ofpetroleum-impacted soils have been removed from the Upper Site and stockpiled at the LowerSite. Reclamation issues currently being addressed at the Upper Site include the repair ofsolution ditches at heap No. 2X and heap No. 1 and the relining of the large overflowpregnant pond. All areas are being monitored both visually and through monitor wells, as arethe three hydrocarbon-impacted sites.
Disturbance at the Lower Site originally totaled 94 acres; approximately 21 acres remain to bereclaimed. Completed work includes the re-contouring of old heaps and the reclamation ofthe six process ponds. One block building, a metal shop building, fencing, and some accessroads remain to be reclaimed in the Lower Site, as well as approximately 4,500 cubic yards ofhydrocarbon-impacted (diesel and motor oil) soils that are stockpiled on a closed heap.
In addition to the environmental liabilities attributable to past mining activities atNorthumberland, there are lesser liabilities related to both prior and ongoing explorationactivities, including drill access roads and drill sites.

Fronteer Development Group Inc.Technical Report, Northumberland Project: Resource Update 2008 Page 25
CBL NI43-101_NorthumberlandResource_2008.07.28.doc July 28, 2008
5.0 ACCESS; CLIMATE; LOCAL RESOURCES;INFRASTRUCTURE; AND PHYSIOGRAPHY
5.1 Access
Northumberland can be accessed from State Highway 376 on the western margin of BigSmoky Valley by way of a well-maintained dirt road through West Northumberland Canyon.This dirt road intersects Highway 376 eighteen-road miles south of State Highway 50, and 85-road miles north of State Highway 6 (Figure 4.1).
5.2 Climate
The climate at the project site is typical of central Nevada's mid-latitude high-desertenvironment with warm dry summers and relatively cold windy winters. Averagetemperatures range from 74o F in July to 30o F in January. Precipitation is generally less than12 inches per year with the bulk of it accumulating during winter storms and summerthunderstorms. Annual snowfall varies from year to year depending on the intensity andseverity of individual storms. Vegetation ranges from sagebrush and grass at the Lower Siteto juniper, pinion, and mountain cedar at the Upper Site.
5.3 Local Resources and Infrastructure
The town of Austin, located approximately 53-road miles to the northwest ofNorthumberland, and the Round Mountain area, located about 25-road miles to the south, arethe nearest population centers to the project. The Round Mountain and Tonopah communitiescurrently support mining operations at the Round Mountain gold mine.
A 230 kV transmission line that traverses Big Smoky Valley is the nearest power line to theproject. It is situated at the eastern edge of the Lower Site, approximately 11 miles from theUpper Site. Power for the Cyprus and WSMC mining and processing activities at the uppersite was provided by on-site generators. The private lands in the Upper and Lower Sitesprovide sufficient space for mining infrastructure required for extraction of the currentlydefined resources described in Section 17.
5.4 Physiography
The topography is moderately rugged with elevations across the property ranging fromapproximately 7,700ft to 9,165ft at Mount Gooding. The Cyprus and WSMC open pits in theUpper Site are at about 8,600ft. There is sufficient space in the area of the resourcesdiscussed in Section 17 to allow the construction of needed mining infrastructure.

Fronteer Development Group Inc.Technical Report, Northumberland Project: Resource Update 2008 Page 26
CBL NI43-101_NorthumberlandResource_2008.07.28.doc July 28, 2008
6.0 HISTORY
6.1 Exploration and Mining History
Much of the following summary is taken from WSMC (1998).
The exploration and production history of Northumberland occurred during two periods. Thefirst period began in 1866 when a prospector named Logan reportedly discovered silvermineralization in the Northumberland Mining district. Relatively minor amounts of silverwere extracted from veins by underground mining methods during this time.
The second period of intermittent mining and exploration began in 1936 and continues to thepresent day. Significant low-grade gold mineralization was first discovered in 1936. TheNorthumberland Mining Company (“NMC”) acquired the main properties of the district in1938 and initiated production in 1939. NMC mined oxide ore from three small open pits thatwere located in what is now the east Main pit area. The ore was milled near the open pits andprocessed by cyanidation. Tailings were transported as slurry via a wooden flume one andone-half miles down East Northumberland Canyon to two tailing ponds. Operations stoppedin 1942 when the federal government shut down gold mines by order L-208 as a result ofWorld War II. In addition to its mining activities, NMC drilled 214 exploration anddevelopment churn holes between 1938 and 1942.
Gold exploration was the main activity at Northumberland between 1942 and 1975. PeterJoralemon drilled 47 conventional rotary (“rotary”) holes between 1959 and 1963, KerrMcGee Mining Company (“Kerr McGee”) drilled 27 rotary holes in 1963 and 1964,Homestake Mining Company (“Homestake”) drilled 21 rotary holes in 1968; and IdahoMining Corporation (“Idaho Mining”) drilled 34 rotary holes between 1972 and 1974.
Cyprus Mines Corporation (“Cyprus”) obtained the property in 1975 and drilled 53 rotary andcore holes between 1975 and 1984 and 36 air-track holes in 1978. In addition to these holes,Cyprus drilled an unknown number of holes of unknown type with a “T83” prefix; thedatabase includes 42 of these holes.
Cyprus succeeded in developing two distinct oxide gold deposits and began mining operationsat the Upper Site in the Main and Chipmunk open pits in 1981. Mineralization from part ofthe Main deposit was mined in the Main pit, while the Chipmunk pit mined gold from theStates deposit. The ore was crushed to -1/2 inch at facilities near the pits and hauled by truckto the Lower Site where heap-leach facilities were located. The pregnant solution producedfrom the heap was passed through activated-carbon columns, pressure stripped, and the goldand silver were recovered by electrowinning. Cyprus terminated heap-leaching operations inmid-1985.
Gold and silver production from Northumberland is summarized in Table 6.1.

Fronteer Development Group Inc.Technical Report, Northumberland Project: Resource Update 2008 Page 27
CBL NI43-101_NorthumberlandResource_2008.07.28.doc July 28, 2008
Table 6.1 Northumberland Gold and Silver Production(WSMC, 1998)
Company Period Tons Gold(ounces)
RecoveredGrade
(oz Au/ton)
Silver(ounces)
Recoveredgrade
(oz Ag/ton)Pre-1939 ? ? ? ? ?
NMC 1939-1942 220,284 45,000 0.204 N/A NACyprus 1981-1984 2,153,016 92,000 0.043 103,900 0.048WSMC 1985-1991 5,019,000 93,730 0.019 381,862 0.076
Totals 7,392,300 230,730 0.031 485,762 0.068
6.2 WSMC and NewWest
WSMC acquired the Northumberland property from Cyprus in 1985. After turning theCyprus heaps with a bulldozer, WSMC began to re-leach the heaps at the Lower Site shortlyafter acquiring the project. WSMC mined material from the two open pits developed byCyprus from 1987 to 1990, with the primary ore production coming from the Chipmunk pit.Instead of hauling the crushed ore by truck to the Lower Site, as Cyprus had done, WSMCtreated run-of-mine ore year-round on new heaps constructed at the Upper Site. WSMCceased mining in 1990 and emphasis was then placed on exploration. Gold production fromthe WSMC heaps ended in 1991.
WSMC contracted Analytical Surveys, Inc. to conduct an aerial survey in 1990. This surveywas used to create digital topography of the post-mining Northumberland surface.
Modeling of the known deposits allowed WSMC to understand the significance of thetectono-stratigraphic host horizons, project higher-grade mineralization within these horizonsalong lineaments, and test for mineralization in new areas. The significance of the SouthRidge mineralization and high-grade core of the Chipmunk deposit was first recognized in1990. The geometry of the high-grade cores of these deposits defined the east-strikinglineaments. Deep holes drilled in Mormon Canyon approximately one-half mile west of theChipmunk pit along the westward projection of these lineaments led to the discovery of theZanzibar deposit in 1991. Further drilling in the southwestern portion of the Mormon Canyontarget area resulted in the discovery of the high-grade Rockwell deposit in 1992. Thenortheast orientation of the Rockwell deposit and its potential to contain high grade (up to oneoz Au/ton) was recognized in the 1997 drilling program. The presence of the Pad 4 depositalong the Chipmunk lineament was verified with a drill hole in the same year.
WSMC completed a land exchange with the USFS in 1997 that resulted in 3,386 acres(1,370ha) of USFS-administered public domain land becoming private fee land owned byWSMC. This fee land included the Upper Site and all of the gold deposits defined to date atNorthumberland.
WSMC completed 679 RC and core holes for a total of approximately 310,000ft between1985 and 1997. The geology of the entire project area was mapped and sampled on areconnaissance scale. WSMC defined over 30 exploration targets outside of the deposit area

Fronteer Development Group Inc.Technical Report, Northumberland Project: Resource Update 2008 Page 28
CBL NI43-101_NorthumberlandResource_2008.07.28.doc July 28, 2008
based on the results from a trend analysis of satellite imagery, a CSAMT geophysical survey,two aeromagnetic surveys, over 6,600 rock chip samples, and 6,300 soil samples. Eight ofthese targets were drilled without encountering significant mineralization.
A number of metallurgical tests were completed by WSMC. The most significant of these aredescribed in Section 16.
6.3 Newmont – Nevada Western Joint Venture
WSMC’s interests in the Northumberland project were held by Nevada Western, a whollyowned subsidiary. Nevada Western entered into a joint venture with Newmont on theNorthumberland project in December 2003. Through a series of transactions, NevadaWestern became a wholly owned subsidiary of NewWest in 2005. Newmont, as operator ofthe joint venture, immediately began exploration work and completed soil geochemicalsampling, geological mapping, geophysical surveys, metallurgical testing, and drilling. From2004 through 2007, Newmont spent $8,700,000 exploring the Northumberland property.
Newmont collected a total of 1,512 B-horizon soil samples in 2003 on a 328 by 328ft grid thatcovered much of the fee lands in the deposit area. A total of 818 soil samples were taken inareas of Paleozoic carbonate units lying to the north of the deposit area that were deemed tobe favorable but were lacking in geochemical data (Branham, Lauha, and Powell, 2004;Lauha and Powell, 2004a). Newmont also was able to retrieve and re-assay 1,950 of 2,200assay pulps from WSMC soil samples collected on 600ft by 750ft grids on the outer portionsof the Northumberland claims (Branham, Lauha, and Powell, 2004). The 250 soil sites forwhich the sample pulps could not be found were re-sampled and 568 soil samples werecollected to fill various gaps in the property soil grid (Lauha and Powell, 2004a). Anadditional 200 soil samples were collected on the east side of the property (Lauha and Powell,2004a; see Section 9.8). Multi-element geochemical analyses were completed on all of thegeochemical samples. Based on a detailed analysis of the results of the soil sampling in andaround the deposit area, Jackson (2004) stated, “the Northumberland system is characterizedby strong enrichment of elements known to be associated with Carlin deposits on the CarlinTrend and it exhibits many of the element zonation relationships observed on the Trend.…The levels of metal enrichment indicate it [the Northumberland mineral system] is apowerful system with the potential to host high grade deposits.”
A 200-sample stream-sediment survey was conducted in the various drainages within theNorthumberland caldera northwest of the Northumberland deposit area in 2004 (Lauha andPowell, 2004a). This survey was designed to examine a 100-square-mile area underlain byTertiary volcanic rocks interpreted to include several altered diatreme breccia pipes. Allanomalous results from the survey are considered by Newmont to reflect material eroded fromthe Northumberland deposit area (Branham, Lauha, and Powell, 2004; Newmont, 2005).Additional stream sediment sampling was undertaken in 2005 to infill and follow-up resultsobtained in the 2004 survey. At total of 27 bulk-leach extractable gold (BLEG) samples weretaken (Newmont, 2006).
Detailed geologic mapping was completed over an area of about 10-square miles that includedthe fee ground and USFS lands south to the property boundary. New interpretative geologic

Fronteer Development Group Inc.Technical Report, Northumberland Project: Resource Update 2008 Page 29
CBL NI43-101_NorthumberlandResource_2008.07.28.doc July 28, 2008
cross sections of the deposit area were created. Preliminary mapping was also completed atspecific target areas (Newmont, 2005; Newmont, 2006).
A total of 301 ten-foot channel samples were collected from 15 trenches excavated in thewestern portion of the Zanzibar area. These samples, as well as road-cut samples from thesame area, were used to identify drill targets for potential drill testing.
Newmont conducted a reconnaissance gravity survey over much of the property. An infillgravity survey was also completed to attempt to define the eastern margin of theNorthumberland caldera and improve the resolution around the Mount Gooding pluton(Newmont, 2005). A five-line CSAMT geophysical survey was completed over the MountGooding intrusion to assist in interpreting the shape of the pluton and its possible extension tothe east (Lahua and Powell, 2004b; 2004d). Newmont completed an IP survey totaling 12.4line miles in the Ziggurat target area and collected gravity data from 132 stations to infillexisting data (Newmont, 2006). Newmont conducted a district-scale ground gravity survey in2007 consisting of 658 new stations at 1640 ft centers, and a helicopter magnetic andradiometric survey totaling l709 ine miles with 328 ft line spacings and a nominal drape of200 ft (Brock Bolin, oral communication).
Newmont defined drilling targets after compiling all available geological, geochemical,geophysical, and drilling data. A 26-hole RC drilling program, for a total of 32,595ft, wasthen completed in and around the deposit area in 2004, and an additional 20 RC holes totaling22,200ft were drilled in 2005 (Lauha and Powell, 2004f; Newmont, 2006). The Zanzibardeposit and the southern edge of the Chipmunk deposit were the principle targets of thedrilling, with additional holes testing the possible buried eastern extension of the MountGooding pluton, various targets in the area of the existing open pits, and the southern edge ofthe Mount Gooding pluton.
The 2006 holes were drilled with the goal of expanding the resource, establishing theorientation of the deeper high-grade mineralization discovered by Newmont hole NN-5,obtaining core samples for metallurgical and waste-rock characterization, and providing initialtesting of the Ziggurat anomaly (Newmont, 2007). Five RC holes were completed at Zigguratin 2006, all of which failed to return values in excess of 0.01 oz Au/ton. Newmont drilled 54holes, for a total of 53,691 feet in 2006.
In 2007, Newmont completed 22 holes, for a total of 27,748 feet, in the main resource area.Newmont’s 2007 program tested for high-grade structural conduits to the Zanzibar deposit, aswell as district targets in the Orocopter, Barite Pit, and South Mormon Canyon areas.
Five composites of RC samples were sent to Newmont’s metallurgical laboratory at the LoneTree mine for testing in 2004. Three core samples of oxide material were sent to Newmont’sCarlin Metallurgical Laboratory in 2006 to determine gold amenability to cyanide leaching.Also in 2006, core from four holes drilled in the Zanzibar deposit was used to obtain sulfidematerial for roaster and autoclave amenability tests. There are no reported results from thesesulfide samples. Further details on metallurgical tests are discussed in Section 16.
Fronteer Development Group Inc.Technical Report, Northumberland Project: Resource Update 2008 Page 30
CBL NI43-101_NorthumberlandResource_2008.07.28.doc July 28, 2008
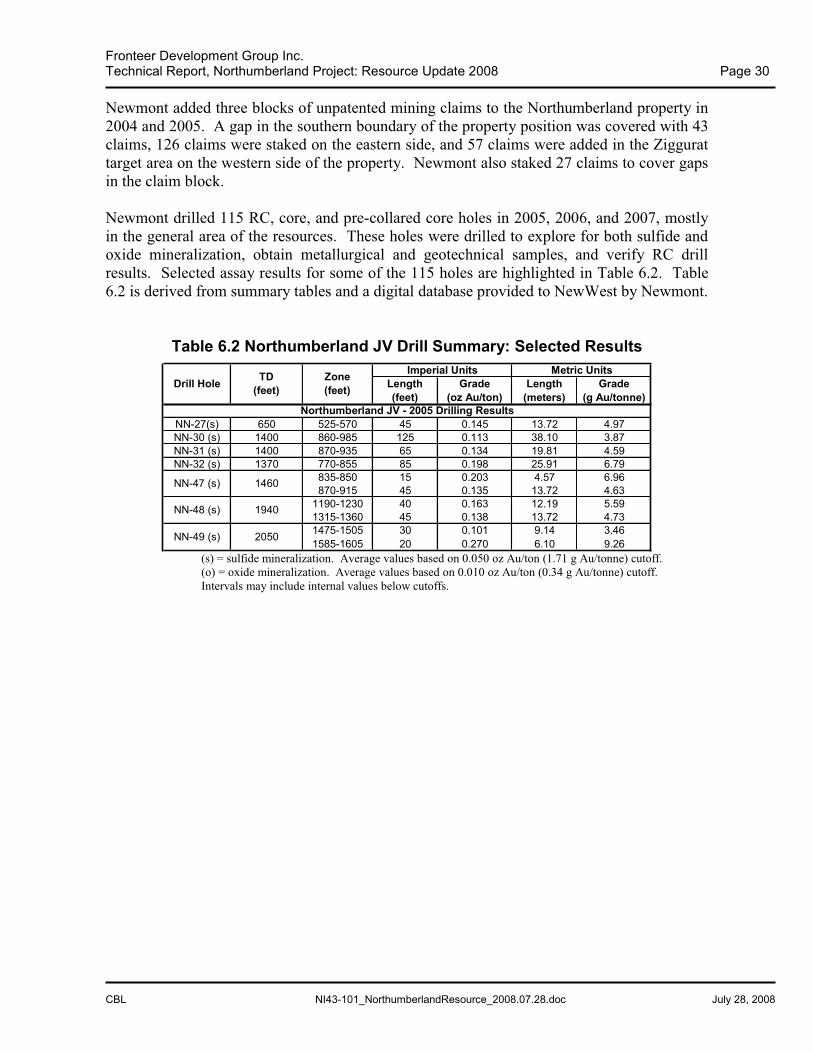
Newmont added three blocks of unpatented mining claims to the Northumberland property in2004 and 2005. A gap in the southern boundary of the property position was covered with 43claims, 126 claims were staked on the eastern side, and 57 claims were added in the Ziggurattarget area on the western side of the property. Newmont also staked 27 claims to cover gapsin the claim block.
Newmont drilled 115 RC, core, and pre-collared core holes in 2005, 2006, and 2007, mostlyin the general area of the resources. These holes were drilled to explore for both sulfide andoxide mineralization, obtain metallurgical and geotechnical samples, and verify RC drillresults. Selected assay results for some of the 115 holes are highlighted in Table 6.2. Table6.2 is derived from summary tables and a digital database provided to NewWest by Newmont.
Table 6.2 Northumberland JV Drill Summary: Selected ResultsImperial Units Metric Units
NN-27(s) 650 525-570 45 0.145 13.72 4.97NN-30 (s) 1400 860-985 125 0.113 38.10 3.87NN-31 (s) 1400 870-935 65 0.134 19.81 4.59NN-32 (s) 1370 770-855 85 0.198 25.91 6.79
835-850 15 0.203 4.57 6.96870-915 45 0.135 13.72 4.63
1190-1230 40 0.163 12.19 5.591315-1360 45 0.138 13.72 4.731475-1505 30 0.101 9.14 3.461585-1605 20 0.270 6.10 9.26
NN-48 (s) 1940
NN-49 (s) 2050
Length(feet)
Grade(oz Au/ton)
Length(meters)
Grade(g Au/tonne)
Northumberland JV - 2005 Drilling Results
NN-47 (s) 1460
Drill Hole TD(feet)
Zone(feet)
(s) = sulfide mineralization. Average values based on 0.050 oz Au/ton (1.71 g Au/tonne) cutoff.(o) = oxide mineralization. Average values based on 0.010 oz Au/ton (0.34 g Au/tonne) cutoff.Intervals may include internal values below cutoffs.

Fronteer Development Group Inc.Technical Report, Northumberland Project: Resource Update 2008 Page 31
CBL NI43-101_NorthumberlandResource_2008.07.28.doc July 28, 2008
Table 6.2 Northumberland JV Drill Summary: Selected Results, cont.Imperial Units Metric Units
1480-1505 25 0.127 7.62 4.351565-1655 90 0.118 27.43 4.05
NN-50 (s) 1550 1015-1065 50 0.142 15.24 4.871205-1225 20 0.152 6.10 5.211250-1260 10 0.104 3.05 3.571280-1305 25 0.124 7.62 4.251700-1720 20 0.123 6.10 4.22820-845 25 0.168 7.62 5.76850-860 10 0.104 3.05 3.57
1530 770-1060 290 0.118 88.39 4.05(includes) 995-1010 15 0.236 4.57 8.09
750-900 150 0.130 45.72 4.46955-965 10 0.124 3.05 4.25520-575 55 0.151 16.76 5.18600-605 5 0.200 1.52 6.86
580 440-535 95 0.170 28.96 5.83includes 440-490 50 0.242 15.24 8.30
45-55 10 0.021 3.05 0.72160-220 60 0.089 18.29 3.05225-245 20 0.093 6.10 3.19
NN-61(o) 300 135-230 95 0.057 28.96 1.95505-570 65 0.186 19.81 6.38710-775 65 0.104 19.81 3.57720-820 100 0.226 30.48 7.75835-875 40 0.104 12.19 3.57
990-1015 25 0.437 7.62 14.981228 785-865 80 0.215 24.38 7.37
includes 800-830 30 0.306 9.14 10.491170-1190 20 0.156 6.10 5.35
950 740-790 50 0.223 15.24 7.65includes 765-785 20 0.401 6.10 13.75
NUN-71 (s) 1080 850-895 45 0.149 13.72 5.11NUN-72 (s) 900 755-800 45 0.220 13.72 7.54NUN-74 (o) 150 30-70 40 0.285 12.19 9.77NUN-75 (s) 600 420-495 75 0.159 22.86 5.45
1900 1680-1755 75 0.176 22.86 6.03includes 1725-1755 30 0.246 9.14 8.43
1800 1615-1665 50 0.198 15.24 6.79includes 1650-1660 10 0.448 3.05 15.36
1445-1455 10 0.116 3.05 3.981545-1555 10 0.288 3.05 9.87
1800 1415-1485 70 0.153 21.34 5.25includes 1455-1475 20 0.287 6.10 9.84
1055-1100 45 0.136 13.72 4.661110-1125 15 0.098 4.57 3.361140-1180 40 0.129 12.19 4.42
NUN-92 (s) 1910 1805-1855 50 0.166 15.24 5.69NUN-93 (s) 1365 890-930 40 0.139 12.19 4.77
1225 820-880 60 0.112 18.29 3.84includes 865-875 10 0.220 3.05 7.54
NN-102 (o) 150 20-55 35 0.108 10.67 3.70120 25-85 60 0.078 18.29 2.67
includes 45-70 25 0.157 7.62 5.38NN-105 (o) 100 40-55 15 0.157 4.57 5.38
Length(meters)
Grade(g Au/tonne)
Drill Hole TD(feet)
NN-104 (o)
NUN-84 (s) 1795
NN-85 (s)
NUN-89 (s) 1400
NUN-94 (s)
NN-63 (s) 1077
NN-64 (s)
NN-66 (s)
NUN82 (s)
NUN83 (s)
NN-58 (s) 680
NN-59 (s)
NN-60 (o) 320
NN-62 (s) 850
NN-54 (s) 1820
NN-55 (s) 1530
NN-56 (s)
NN-57 (s) 1150
Northumberland JV - 2006 Drilling Results
NN-45 (s) 2000
Zone(feet) Length
(feet)Grade
(oz Au/ton)

Fronteer Development Group Inc.Technical Report, Northumberland Project: Resource Update 2008 Page 32
CBL NI43-101_NorthumberlandResource_2008.07.28.doc July 28, 2008
Table 6.2 Northumberland JV Drill Summary: Selected Results, cont.Imperial Units Metric Units
NUN-88 (s) 1800 1020-1085 65 0.110 19.81 3.77NUN-90 (s) 1800 1240-1265 25 0.133 7.62 4.56NUN-95 (s) 1300 800-840 40 0.243 12.19 8.33NUN-96 (s) 1216 725-765 40 0.247 12.19 8.47
750-775 25 0.184 7.62 6.31795-805 10 0.180 3.05 6.17
NUN-98 (s) 1206 680-770 90 0.147 27.43 5.04NUN-107 (o) 645 0-25 25 0.032 7.62 1.10
85-100 15 0.026 4.57 0.89110-180 70 0.045 21.34 1.5410-25ft 15 0.061 4.57 2.0995-105 10 0.101 3.05 3.46
145-160 15 0.022 4.57 0.75NUN-110 (o) 445 195-330 135 0.038 41.15 1.30
1915-1925 10 0.141 3.05 4.831930-1935 5 0.097 1.52 3.33
Drill Hole TD(feet)
Zone(feet) Length
(feet)Grade
(oz Au/ton)Length
(meters)Grade
(g Au/tonne)
NUN-109 (o) 400
NUN-113 (s) 2000
Northumberland JV - 2007 Drilling Results
NUN-97 (s) 1402
NUN-108 (o) 485
Hole NN-5, drilled by Newmont in 2004, encountered two zones of mineralization, including105 feet of 0.142 oz Au/ton within the Zanzibar deposit and 65 feet of 0.267 oz Au/tonimmediately below the Zanzibar deposit. Two follow-up holes, NN56 and NN63, extendedthese mineralized zones. Hole N-56, located 65 feet east of NN-5, returned a 290-footcontinuously mineralized zone grading 0.118 oz Au/ton that appears to be associated withboth the Zanzibar Deposit and the lower zone discovered in hole NN-5. NN-63 and -64 weredrilled to better define the deeper zone of mineralization encountered in both NN-5 and NN-56. NN-64 intercepted 80 feet of mineralization in the Zanzibar deposit with a grade of 0.215oz Au/ton between 785 and 865 feet, which includes 30 feet of 0.306 oz Au/ton between 800and 830 feet, but did not encounter the deeper zone. Hole NN-63 also intercepted theZanzibar deposit (100 feet of 0.226 oz Au/ton between 720 and 820 feet) and encountered 25feet of 0.437 oz Au/ton in the lower zone between 990 and 1015 feet. This deeper high-gradezone in NN-63 extended the mineralization in NN-56 approximately 60 feet to the south.
Hole NUN 113 was drilled 700 feet west of the northwestern-most hole in the Zanzibardeposit. NUN113 intersected a zone of mineralization that includes 10 feet of 0.141 ozAu/ton and five feet of 0.097 oz Au/ton between 1915 and 1935 ft. This hole may haveintercepted an extension of the Zanzibar deposit, or may have encountered new sulfidemineralization.
Newmont drilled holes into oxide mineralization to obtain samples for metallurgical testingand to attempt to add oxide resources. NUN-110 was drilled to further test the oxide potentialof the Pad 4 deposit. This hole intersected 135 feet of mineralization with a grade of 0.038 ozAu/ton between 195 and 330 feet.

Fronteer Development Group Inc.Technical Report, Northumberland Project: Resource Update 2008 Page 33
CBL NI43-101_NorthumberlandResource_2008.07.28.doc July 28, 2008
7.0 GEOLOGIC SETTING
The following discussion is largely derived from an internal WSMC document (WSMC,1998) that summarizes the geologic knowledge gained by the various governmental andcompany representatives that have studied the Northumberland project and its surroundingareas and from Kleinhampl and Ziony (1984). Additional observations of coauthor G. Lanier,Regional Geologist, Fronteer, are also included.
7.1 Regional Geology
Northumberland is situated near the center of the Toquima Range, one of the north-trendingranges centrally located in the Great Basin portion of the Basin and Range Province.Northumberland lies along a north-northeast-trending alignment of large metal deposits inNye County that includes Round Mountain, Manhattan, and Tonopah.
Paleozoic sedimentary rocks and Mesozoic plutons are exposed in an erosional windowthrough Tertiary rhyolitic ash-flow tuff in the central portion of the Toquima Range (Figure7.1). The window has been referred to as both the Ikes Canyon window and theNorthumberland window (WSMC, 1998). The Paleozoic units include representatives of theautochthonous (units formed in their present location), parautochthonous (used here torepresent units that formed at some intermediate distance from their present location that weretransported by thrust faulting), allochthonous (used here to represent units formed asignificant distance from their present location that were transported by thrust faulting), andoverlap (sedimentary units derived from the erosion of the previously mentioned units)assemblages that characterize central Nevada. Ordovician to Devonian limestone, shale, andargillite total about 3,000ft in thickness and represent the autochthon in this region.Parautochthonous rocks include about the same thickness of the same units as the autochthon,but shaly limestone and shaly argillite that make up the Perkins Canyon Formation in theparautochthon correspond to a more basinward facies of the calcareous Pogonip Group of theautochthon (Kay and Crawford, 1964, cited in Kleinhampl and Ziony, 1984). Severalthousand feet or more of argillite, chert, shale, and greenstone represent the allochthon in thispart of the Toquima Range. Transported eastward from their original site of basinaldeposition, some of these rocks may be correlatives of the Vinini Formation (McKee, 1972,cited in Kleinhampl and Ziony, 1984). The overlap assemblage in the Northumberland areaconsists of the Wildcat Peak Formation of Pennsylvanian age, which is made up of limy andclastic rocks. The Wildcat Peak Formation unconformably overlies the allochthon and locallythe autochthon in the region.
A number of Jurassic plutons have been identified and dated in the Northumberland area. Thelargest in the district is named the Clipper Gap pluton and has been dated with K-Ar at 151 +3 Ma (Kleinhampl and Ziony, 1984).
Oligocene and Miocene tuffs, welded tuffs, and tuffaceous lacustrine sedimentsunconformably overlie the Paleozoic and Mesozoic units. According to Kleinhampl andZiony (1984), these Tertiary rocks formed in part after the precious metal deposits wereemplaced. A rhyolitic dome that is about 28 Ma cuts part of the Tertiary tuffs about fivemiles southwest of Northumberland. Tertiary megabreccias that may have been landslide and

Fronteer Development Group Inc.Technical Report, Northumberland Project: Resource Update 2008 Page 34
CBL NI43-101_NorthumberlandResource_2008.07.28.doc July 28, 2008
talus deposits (Kleinhampl and Ziony, 1984) are exposed west of the divide between East andWest Northumberland canyons.
Figure 7.1 Regional Geology of Northumberland Area

Fronteer Development Group Inc.Technical Report, Northumberland Project: Resource Update 2008 Page 35
CBL NI43-101_NorthumberlandResource_2008.07.28.doc July 28, 2008
Dioritic to felsitic dikes in the region cut the Jurassic plutons and Paleozoic units; someintermediate dikes cut Tertiary tuffs. These dikes have been variously assigned Cretaceousand Tertiary(?) ages. Some of the dikes are thought to be related to the hydrothermal eventthat produced the gold mineralization (Kleinhampl and Ziony, 1984).
Folding and thrust faulting, probably part of the Paleozoic Antler Orogeny, have complexlydeformed the Paleozoic rocks in the Toquima Range. Paleozoic sedimentary and the Jurassicintrusive rocks have been folded and cut by high-angle normal, high-angle oblique-slip, andlow-angle thrust and bedding-plane faults. Tertiary and younger rocks were subjected toblock faulting, which produced moderate tilting of the bedded Tertiary units. In addition,there are prominent volcanic structures, such as the partially collapsed NorthumberlandCaldera, which lies on the western flank of the range (McKee, 1974 and 1976, cited inKleinhampl and Ziony, 1984).
7.2 Local Geology
The area that includes the Northumberland open pits and surrounding gold deposits (the“deposit area”) is underlain by lower Paleozoic sedimentary and metasedimentary rocksexposed in an erosional window through Tertiary volcanic rocks (Figure 7.2). In general, thePaleozoic stratigraphic units occur within a folded low-angle shear zone. The units arestructurally bound and internally sheared, and also exhibit rapid facies changes. In theNorthumberland mine area, the Prospect thrust, thought to be of Antler age, placedparautochthonous Ordovician Zanzibar Formation over the autochthonous, transitional,Silurian Roberts Mountains Formation. The Zanzibar Formation, which consists of chertylimestone with distinctive alternating bands of chert and argillaceous limestone and siltstoneat its base, is an off-shelf facies equivalent to part of the Pogonip Group carbonate rocks(Harris, 2003). The Roberts Mountains Formation includes limy shale with a chertydolostone bed at its base. A carbonate assemblage of the Hanson Creek Formation with upperdolostone and lower limestone members underlies the Roberts Mountains Formation.
The Paleozoic rocks have been intruded by the Jurassic Mount Gooding pluton and relatedapophyses, dikes, and sills. The stock is a fine- to medium-grained equigranular granodioritewith locally porphyritic margins. The stock consists of two parts, a high-angle root below alow-angle sill-like shelf that extends up to 1,500ft north of the root. The bottom of the shelf isin fault contact with sedimentary rocks. The fault contact consists of up to 40ft of generallysilicified breccia and is defined as the Mormon thrust. This configuration suggests that thetop of the stock has been decapitated and shifted to the northwest or that the top of the stock isa laccolith with a faulted contact at its bottom. The stock, including the root and shelf, islocally strongly altered to quartz-illite on its northern side. This assemblage grades topropylitic alteration distal from the structural controls. An east-trending dike swarm cuts theNorthumberland mine area. These dikes can be completely altered to illite but are thought tobe related to the Jurassic intrusive event based on relict texture. The Mount Gooding stockhas been dated by K-Ar methods to be 154 + 3 Ma (Silberman and McKee, 1971).
The Mormon thrust of probable Jurassic age truncates the Prospect thrust as well as Jurassicigneous bodies. The contacts between the Roberts Mountains and Hanson Creek Formationsas well as the limestone-dolostone members of the Hanson Creek Formation are locally

Fronteer Development Group Inc.Technical Report, Northumberland Project: Resource Update 2008 Page 36
CBL NI43-101_NorthumberlandResource_2008.07.28.doc July 28, 2008
bedding-plane faults. The two bedding-plane faults and the Prospect thrust near itsintersection with the Mormon thrust are the main low-angle horizons that are known to havecontrolled mineralization at Northumberland.
Figure 7.2 Local Geology of Northumberland

Fronteer Development Group Inc.Technical Report, Northumberland Project: Resource Update 2008 Page 37
CBL NI43-101_NorthumberlandResource_2008.07.28.doc July 28, 2008
The Paleozoic rocks and associated low-angle structures described above are folded along thebroad, north-trending Northumberland anticline, which, south of the deposit area, appears toplunge to the south. Much smaller northeast- to east-trending anticlines and synclines aresuperimposed on the larger anticline near its crest.
Tertiary intrusive rocks are also present in the Northumberland mine area and consist ofandesitic and rhyolitic dikes, sills, and small stocks. The South Ridge dike in theNorthumberland mine area represents the oldest dated Tertiary intrusive event. The dike isandesitic in composition, has an aphanitic to porphyritic texture, intrudes granodiorite justsouth of the mineralized area, and has a late Eocene to early Oligocene 40Ar/39Ar age of 35.2+ 0.2 Ma (Peters, 1996 and 1997). The South Ridge dike locally exhibits propylitic andargillic alteration and hosts low-level anomalous gold values. Quartz-phyric dikes and sills ofrhyolitic composition are also exposed in the mine area. These rocks are too altered to dateand classify but may be related to the Mount Ziggurat rhyolitic intrusive event, which hasbeen K-Ar dated at 26.5 + 0.7 Ma (Boden, 1992).
Stratigraphic units are less understood outside of the immediate Northumberland deposit area.The Roberts Mountains thrust has been inferred to be present on the western side of thedistrict where it may have placed the Vinini Formation over the Zanzibar Formation. To theeast, the Roberts Mountains thrust could be absent, and there is a normal sequence ofsedimentary rocks ranging from the Ordovician Antelope Valley Formation at the base, to theRoberts Mountains Formation, to the early Mississippian Pinecone Formation of Coles (1988)at the top. If this interpretation is correct, the Pinecone Formation is an autochthonoussiliciclastic unit. The Pinecone Formation is similar to the Slaven Chert and contains thick-bedded barite deposits. The Pennsylvanian Wildcat Peak Formation, part of the overlapassemblage, is locally exposed in the northeast portion of the project area. The formationrests unconformably on older Paleozoic units.
A thick sequence of the volcanic rocks is exposed west of the Northumberland Paleozoicwindow. Volcanic rocks also occur as erosional remnants that cap peaks on the eastern sideof the range and, prior to mining, at the Northumberland mine site. The main volcanic pile iscomposed of thick, continuous, northwest-dipping sheets of rhyolitic crystal lithic ash-flowtuff, out-flow breccia, water-laid tuffaceous sediments and minor interbeds of vitrophyre.Volcanic rocks have been subdivided into the Northumberland Tuff, K-Ar dated at 33 + 0.8Ma (Zhafiqullah, 1992), the overlying Hoodoo Tuff with a K-Ar date of 30.4 Ma (McKee1974), and the Moores Creek Tuff with a K-Ar date of 27.2 + 0.6 Ma (Boden, 1992). TheMoores Creek Tuff is exposed in the southernmost part of the project area and is temporallyrelated to the Toquima volcanic complex at Round Mountain, Nevada. The volcanic complexat Northumberland includes discordant breccias that have been variously interpreted asdiatremes, breccia pipes, talus, or landslide deposits. The breccia bodies typically have aneast-west elongation with poorly defined and steeply dipping internal layering. The brecciasare clast-supported and composed predominantly of fragments of Paleozoic basement rockwith minor igneous fragments. The volcanic pile in the vicinity of Northumberland isconsidered by some to be part of the Northumberland Caldera (McKee, 1974). Tuffs exposedalong the western range front have locally anomalous gold mineralization associated withfaults.

Fronteer Development Group Inc.Technical Report, Northumberland Project: Resource Update 2008 Page 38
CBL NI43-101_NorthumberlandResource_2008.07.28.doc July 28, 2008
8.0 DEPOSIT TYPE
The Northumberland mineralization occurs as stacked, sediment-hosted, finely disseminated,Carlin-type gold deposits. The mineralization is analogous in many ways to the Goldstrike(Betze\Post) deposit of the northern Carlin Trend in north-central Nevada (Leonardson andRahn, 1996). Both are Carlin-type deposits that have a close spatial association with Jurassic-aged granodioritic stocks. The age of mineralization in both cases appears to be younger thanthe stocks, probably Eocene. Hydrothermal alteration and mineralization occur within andoverprint contact metamorphic aureoles adjacent to the stocks. Host stratigraphic units areOrdovician to Silurian in age and include the Roberts Mountains Formation. There areinferred sill caps or traps above the deposits and there is a strong stratiform component todeposit geometries. Gold deposits are associated with the crests and limbs of anticlines, andboth high- and low-angle structures are recognized as being important controls of themineralization. Gold mineralization is micron-sized, disseminated, and associated with ironsulfides where not oxidized. Late hydrothermal barite is present at both Goldstrike andNorthumberland.
The gold anomalies that occur in tuff to the west of the Paleozoic window at Northumberlandare volcanic-hosted epithermal occurrences, similar in origin to the mineralization at RoundMountain, Nevada.

Fronteer Development Group Inc.Technical Report, Northumberland Project: Resource Update 2008 Page 39
CBL NI43-101_NorthumberlandResource_2008.07.28.doc July 28, 2008
9.0 MINERALIZATION
The following discussion is derived primarily from the work of G. Lanier.
Gold and silver mineralization at Northumberland occurs in eight stratigraphically and more-or-less spatially distinct deposits that form an arcuate belt approximately 1.6 miles long in aneast-west direction and 0.3 miles wide. The deposits are generally stratiform and follow threelow-angle tectono-stratigraphic host horizons near the crest and within the west limb of theNorthumberland anticline (Figures 9.1 and 9.2). The deposits can merge between horizonswhere the intervening rock layers are locally breached. From tectono-stratigraphic top tobottom, the mineralized horizons are referred to as the Prospect-Mormon thrust (upper), BasalChert fault (middle), and Hanson Creek fault (lower) host horizons. As a generalization, thedeposits that occur along the upper horizons are more dispersed laterally, while those at thelower horizon are more restricted perpendicular to stratigraphic layering.
The three host horizons are structural discontinuities that include the Prospect-Mormon thrustintersection zone and two bedding-plane faults. The Prospect-Mormon thrust horizon is acomplex intersection between the two low-angle sub-parallel thrust faults that consists of a20- to 40-ft thick shear zone. The shear zone consists of fault breccia with large sausage-shaped blocks of sedimentary and intrusive rocks bounded by internal shear planes. TheZanzibar deposit, the largest deposit at Northumberland, occurs along the Prospect-Mormonthrust horizon.
The Basal Chert and Hanson Creek fault horizons are bedding-plane faults. The formerseparates the lowermost Roberts Mountains Formation from the underlying Hanson CreekFormation. The basal chert unit of the Roberts Mountains Formation consists of interbeddedchert and dolostone immediately above the Basal Chert fault and is often closely associatedwith gold mineralization. Deposits that are localized along this horizon include the States andMain deposits. The Hanson Creek fault separates the lower limestone member from the upperdolostone member of the Hanson Creek Formation. Deposits that generally follow or seem tooriginate from this fault horizon include Rockwell, Pad 4, Wedge-Shaped, Chipmunk, andSouth Ridge.
High-angle east-trending structures and dike swarms controlled the location and overallgeometry of many of the Northumberland gold deposits. The distribution and internal high-grade zones of deposits associated with the Hanson Creek fault horizon define two east-trending deposit lineaments. The alignment of the east-oriented high-grade core within theChipmunk deposit with the Pad 4 deposit defines the Chipmunk lineament, while thealignment of the South Ridge and Wedge-Shaped deposits defines the South Ridge lineament.The east-trending structural influence is also evident in the Basal Chert fault horizon wherethe States and Main deposits have geometric components that follow the two lineaments.
Northwest-trending structures had a local limiting effect on mineralization. The best exampleof this is the South Ridge dike and its projection. The dike establishes the western limit of theSouth Ridge deposit. The dike’s northwest projection along a presumed structure establishesthe eastern limit to most of the high-grade mineralization in the Zanzibar deposit.

Fronteer Development Group Inc.Technical Report, Northumberland Project: Resource Update 2008 Page 40
CBL NI43-101_NorthumberlandResource_2008.07.28.doc July 28, 2008
Figure 9.1 Geologic Cross Sections Showing the Northumberland GoldDeposits
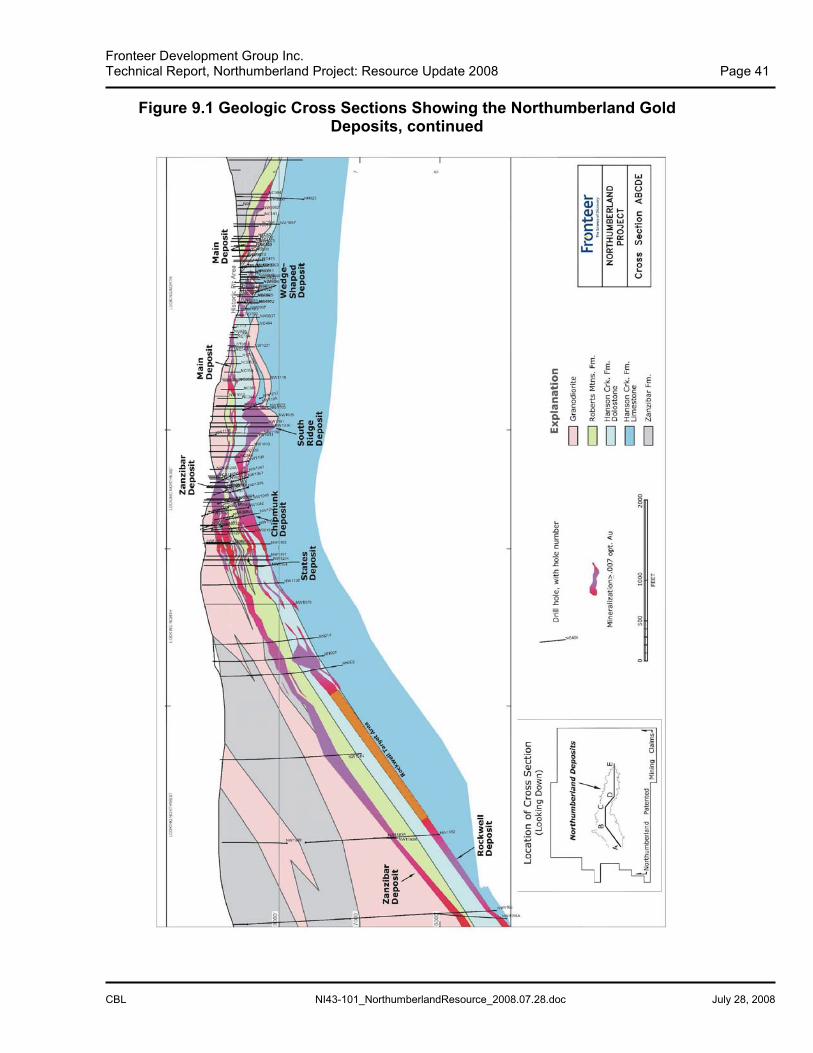
Fronteer Development Group Inc.Technical Report, Northumberland Project: Resource Update 2008 Page 41
CBL NI43-101_NorthumberlandResource_2008.07.28.doc July 28, 2008
Figure 9.1 Geologic Cross Sections Showing the Northumberland GoldDeposits, continued

Fronteer Development Group Inc.Technical Report, Northumberland Project: Resource Update 2008 Page 42
CBL NI43-101_NorthumberlandResource_2008.07.28.doc July 28, 2008
Figure 9.2 Plan Views of Northumberland Gold-Silver Host Horizons

Fronteer Development Group Inc.Technical Report, Northumberland Project: Resource Update 2008 Page 43
CBL NI43-101_NorthumberlandResource_2008.07.28.doc July 28, 2008
Gold mineralization is also spatially associated with folds. The cluster of Northumberlanddeposits is situated in the crest and west limb of the north-trending Northumberland anticline.Much smaller northeast- to east-trending anticlines and synclines are superimposed on thelarger anticline. Two of the smaller anticlines are well defined and spatially associated withdeposits. The States deposit is associated with the Chipmunk anticline, while the MainDeposit is associated with the Main anticline.
Gold localization was also fundamentally influenced by the contact aureole of the MountGooding pluton. There is a narrow, poorly mineralized zone adjacent to the stock thatcorresponds to the highest-grade of contact metamorphism. This proximal zone is mainlydecarbonized (primary organic carbon is removed) through the formation of garnet-diopsidehornfels, although marble is present as well. Gold deposits are best developed in a moredistal zone of the northern contact aureole of the Mount Gooding pluton that is stronglycarbonized (carbon remobilized from the proximal zone is added), especially along structures;hornfels is present only locally.
Gold occurs as micron-sized particles in quartz veinlets and enclosed in goethitepseudomorphs after pyrite (Kuipers, 1991). In general, gold in unoxidized Northumberlandmineralization is thought to be intimately associated with pyrite and arsenopyrite, which istypical for a Carlin-type system. The pyrite association is supported by the fact that gold isliberated upon natural and metallurgically induced oxidation. The total sulfide abundance isless than five percent, of which pyrite, arsenopyrite and marcasite are the most abundantspecies present. The gold is disseminated primarily within sedimentary rocks, although theMount Gooding pluton and its associated intrusive rocks also host significant disseminatedmineralization in all deposits.
Honea (1992) examined mineralized specimens with a scanning electron microscope andfound fine-grained gold particles occurring as silver-rich electrum (Au:Ag = 2.6:1) that rangein size from 0.5 to 72 microns. The electrum is associated with a complex silver-bearingassemblage of copper-antimony sulfides, arsenic sulfosalts, and stibnite. Copper, lead, zincand molybdenum sulfides, as well as gold and lead tellurides, are present in trace amounts.
The oxidation of sulfides extends variably to a depth of over 800ft below surface and isgrossly layered with respect to topography and the mineralized horizons. The deeper layeredoxidation is only locally pervasive; islands of unoxidized to partially oxidized sulfides areusually present within these deeper oxide zones.
The alteration at Northumberland is generally typical of Carlin-type deposits. Alteration ofcarbonate host rocks involves decarbonatization (some percentage of the carbonate mineralsare removed, often resulting in a poorly consolidated rock; this process is also referred to as“sanding”) followed by partial to locally complete silicification of the decarbonated rocks.Silicified rock is composed mainly of fibrous to anhedral replacement quartz that enclosesorganic carbon, sericite/illite, pyrite, and probably detrital quartz. Quartz veiningaccompanies the silicification, is locally abundant, and preserves up to five generations offracturing and healing. Although significant gold mineralization can occur within bothunsilicified sanded rock and silicified rock (jasperoid), jasperoid is the main gold host,especially in the upper horizons. Late-stage calcite and local barite veins overprint the

Fronteer Development Group Inc.Technical Report, Northumberland Project: Resource Update 2008 Page 44
CBL NI43-101_NorthumberlandResource_2008.07.28.doc July 28, 2008
silicification and decarbonatization. Northumberland is well known for its collection-qualitybarite specimens that are derived from the late-stage alteration.
Gold mineralization in igneous rocks is associated with two types of alteration, a typicalquartz-illite/sericite-pyrite alteration and carbonation. The quartz-illite/sericite-pyritealteration is common and occurs in the quartz-pyrite vein wall rocks. Adjacent to the mainstructural controls, the wall-rock alteration coalesces into pervasive zones of illite/sericite,which are locally accompanied by silicification. This alteration distally transitions topropylitically altered rock. The transition zone is characterized by the replacement offeldspars by illite/sericite and the replacement of biotite and hornblende with chlorite.Propylitic wall-rock alteration consists of chlorite-calcite-pyrite aggregates after maficminerals and pyrite after magnetite.
Gold mineralization is also associated with an unusual occurrence of carbonated igneous rock.Dolomite is the main replacement mineral and can make up to 40% of the rock. While thegeneral abundance and distribution of carbonated igneous rock are uncertain, it is known to beassociated with high-grade gold mineralization in the Rockwell deposit and may also bepresent in the South Ridge and Wedge-Shaped deposits.
The eight gold deposits at Northumberland are briefly described below in the followingstratigraphic order. The size dimensions of the deposits reported below are the horizontaldistances of all gold mineralization enclosed within a grade-thickness contour of one ounce-ftper ton. Except where noted, thickness is the vertical thickness of gold mineralization greaterthan 0.007 oz Au/ton.
9.1 Zanzibar Deposit
The Zanzibar deposit (Figures 9.3 and 9.4) occurs in the Prospect-Mormon thrust horizon andis the largest known deposit at the project. The deposit is a tabular body of largely sulfidemineralization that is exposed in the high-wall of the Chipmunk pit and continues southwestfor 4,700ft down the west-dipping limb of the Northumberland anticline to a drilled depth of2,800ft. The mineralized zone is up to 140ft thick and is mainly hosted in silicified faultbreccia of the Mormon thrust. Mineralization also extends above the breccia into broken andaltered granodiorite, and below the fault into broken Roberts Mountains Formation.
The shallower, eastern portion of the deposit was drilled on a 100- by 200-ft grid in 1997 toevaluate the continuity of the higher-grade gold mineralization and the possibility of limitedopen pit mining. Grades up to about 0.2 oz Au/ton have good continuity within this area,while higher grades are less continuous. The western, deeper portion of the deposit is lessdensely drilled and the western limit of the deposit has not been established. The Zanzibardeposit is under active exploration by Newmont for high-grade zones.
9.2 States and Main Deposits
Most of the modern-day oxide gold production at Northumberland has come from the Statesand Main deposits. WSMC and Cyprus mined the States deposit from the Chipmunk pit.NMC, Cyprus, and WSMC mined high-grade pods of the Main deposit from a number of pits

Fronteer Development Group Inc.Technical Report, Northumberland Project: Resource Update 2008 Page 45
CBL NI43-101_NorthumberlandResource_2008.07.28.doc July 28, 2008
in the Main pit area. The mineralization that remains around the Chipmunk and Main pitsincludes both sulfide and oxide components.
Figure 9.3 Cross Section 445100E Showing the Modeled Zanzibar and RockwellDeposits
Figure 9.4 Cross Section 447100E Showing the Modeled Zanzibar, States,South Ridge, and Chipmunk Deposits
Au Grades (g/t)
0.25 - 0.50
0.50 – 1.00
1.00 – 3.00
3.00 – 6.00
6.00 – 10.00
>10.00
Au Grades (g/t)
0.25 - 0.50
0.50 – 1.00
1.00 – 3.00
3.00 – 6.00
6.00 – 10.00
>10.00

Fronteer Development Group Inc.Technical Report, Northumberland Project: Resource Update 2008 Page 46
CBL NI43-101_NorthumberlandResource_2008.07.28.doc July 28, 2008
The States and Main deposits occur at the Basal Chert fault horizon where mineralization ismainly hosted in the 20-ft thick basal cherty bed of the Roberts Mountains Formation. Inmineralized areas the bed is always silicified, with the silicification extending up to 100ftabove the cherty bed. The dolostone in the basal chert unit of the Roberts MountainsFormation is generally sanded where the Hanson Creek dolostone underlies the States andMain deposits. A portion of the Main deposit is hosted in an argillized and unusually sulfidicgranodiorite sill that is present below the basal chert unit. Coarsely crystalline baritemineralization is common in the States and Main deposits. The barite partially fills openfractures and cavities in jasperoid and is later than at least the bulk of the gold mineralization.
9.3 Chipmunk Deposit
The Chipmunk deposit is 2,000ft long in an east-west direction and 700ft wide. A high-gradecore zone occurs along the Chipmunk lineament where the deposit is locally up to 170ft thick,contains grades up to one oz Au/ton, and merges vertically with the States deposit. Thehighest point of the deposit has been exposed in the bottom of the Chipmunk pit, while theeastern half of the deposit is present below the pit. The western half extends to the westbeneath the pit high-wall where the top of the deposit is presently defined at 750ft below thesurface at its deepest point.
The deposit occurs or appears to originate at the Hanson Creek fault horizon and is hosted bysanded and locally silicified dolostone, and by lesser-decalcified limestone and argillizedigneous dikes. A significant portion of the deposit is oxidized.
9.4 Pad 4 Deposit
The Pad 4 deposit is incompletely defined with only enough drill-hole penetrations toestablish that a deposit is present. Existing drilling suggests that the deposit is relatively lowgrade but has the potential to be primarily oxidized. The deposit occurs along the HansonCreek fault horizon and is located east of the Chipmunk deposit along the Chipmunklineament.
9.5 South Ridge Deposit
The South Ridge deposit is a sulfide body that occurs beneath South Ridge along the SouthRidge lineament. The deposit is 1,800ft long in an east-west direction, and up to 400ft wideand 350ft thick. The top of the deposit is 500ft below South Ridge at its deepest point.
Gold mineralization in the South Ridge deposit is related to the Hanson Creek fault horizon.Most of the mineralization is hosted in dolostone and sanded dolostone; silicification ispresent but minor. The thick mineralized body contains internal near-horizontal lenses ofhigher-grade gold mineralization that approach 0.5 oz Au/ton. A lower-grade deeper portionof the deposit is hosted in altered granodiorite.
9.6 Wedge-Shaped DepositThe Wedge-Shaped deposit is a small, partially oxidized body located 50ft below the Main pitbetween 8,200- and 8,400-ft elevations. The deposit is essentially a continuation of the South

Fronteer Development Group Inc.Technical Report, Northumberland Project: Resource Update 2008 Page 47
CBL NI43-101_NorthumberlandResource_2008.07.28.doc July 28, 2008
Ridge deposit along the South Ridge lineament, but is distinguished by its unique geometry.While the other Northumberland deposits have a dominant low-angle stratiform component,the Wedge-Shaped deposit is for the most part internally and externally discordant to thestratigraphy. The deposit originates at the Hanson Creek fault horizon and ascends upthrough the dolostone member with an inclination of approximately 50 degrees to the south.The deposit is at least 800ft long and has a true thickness of up to 100ft.
Approximately half of the gold mineralization in the Wedge-Shaped deposit is hosted inaltered igneous rock, 40 % is hosted in sanded dolostone, dolostone, and hornfels, and only10% is hosted in jasperoid. The deposit is centered on a dark-gray aphanitic dike(?) thatappears to be the control for mineralization. Internal higher-grade and lower-grade zonesstrike easterly.
9.7 Rockwell Deposit
The Rockwell Deposit is a deep extension of the Hanson Creek Fault Horizon that also hoststhe Chipmunk, Pad 4, South Ridge and Wedge-Shaped deposits at shallower levels. Theinitial four discovery core holes drilled by WSMC encountered grades up to one oz Au/ton atthe Hanson Creek fault horizon within a vertical depth range of 2,600 to 3,200ft. Thediscovery holes were drilled approximately one mile southwest of the Chipmunk pit to test alineament. Other drilling that tested the deep horizon in the general area indicates that thedeposit is at least 400ft wide in a northwest to southeast direction and lower-grade portions ofthe deposit could extend several thousand feet to the northeast. Newmont’s RC hole NN-5was drilled 2,100ft northeast of the initial drill holes and encountered 65ft with an averagegrade of 0.267 oz Au/ton within a 340ft thick zone of grades greater than 0.007 ounces perton; the true thickness of this intercept is not known. Follow-up drilling by Newmontdemonstrated that the high-grade mineralization intersected by NN-5 forms a pod that isdiscrete from the high-grade mineralized center defined by the WSMC discovery holes.Present drilling is consistent with the possibility that these pods are connected by continuouslower-grade mineralization.
The Rockwell deposit is hosted by sanded dolostone and decalcified limestone with localsilicification at the initial discovery area with some of the highest grades occurring withindolomitized intrusive rock. The Rockwell deposit mineralization intersected in drill hole NN-5 occurs throughout the Hanson Creek dolostone and extends well up into the RobertsMountains Formation where gold grades are highest.
9.8 Other Mineralization
There are numerous areas of gold mineralization at Northumberland, both within the generalarea of the defined deposits as well as in other portions of the large property. The areas aredefined by soil and/or rock gold anomalies and favorable geology, only some of which havebeen tested by drilling. Fronteer plans to develop and test some of these targets in theirupcoming drill program.

Fronteer Development Group Inc.Technical Report, Northumberland Project: Resource Update 2008 Page 48
CBL NI43-101_NorthumberlandResource_2008.07.28.doc July 28, 2008
10.0 EXPLORATION BY ISSUER
Fronteer has not conducted any exploration on the Northumberland property prior to theMineral Resource update described in Section 17 of this report. The Mineral Resource updateis based entirely on the exploration work of previous operators, as discussed in Section 6.
On May 16, 2008, Fronteer began the first of a two-phase drill program at Northumberland,which will include approximately 20 drill holes for a combined 26,000 feet of RC and coredrilling. Additional drilling in the second phase of the program will be based on the results ofthe first phase.
This two-phase program is designed with specific goals intended to provide for newdiscoveries and/or contribute significant increases in grade at known mineralized horizons.Phase I of the program will expend approximately $2.0M of the $3.6M 2008 budget. Thetargeting strategy was developed on the basis of a new Gemcom model and interpretation ofthe key structural-stratigraphic horizons. It focuses on testing the extents open-endedmineralized trends and expansion of large tonnage, high grade zones projected from gradethickness models. From the review of this data, specific targets were generated that fall intothree categories; Development, Pit Exploration and Regional Exploration.
10.1 DevelopmentThe development portion of the program is designed to add additional near-surface, oxidematerial by providing new information on the Pad 4 Deposit that may tie the two existing pitstogether and stepping out on open ended mineralization peripheral to the model. A furthergoal of this program is to provide geotechnical information pertinent to mine design andfeasibility. Eight core and RC holes have been sited for the initial phase of this program withfurther drilling contingent on information developed in Phase I.
10.2 Pit ExplorationThe Pit Exploration portion of the program is a multi-faceted approach to identify new zonesof mineralization within a conceptual open pit envelope. It will target the margins of the Mt.Gooding Stock and stacked favorable stratigraphy at depth below or proximal to, knownresources. Several holes will test down plunge on the lower Rockwell Deposit to extendprevious high grade intersections. Several holes will provide further information in poorlydefined areas of the Rockwell Deposit while providing infill data in the overlying ZanzibarDeposit. Lastly, several aggressive step-out holes are designed to add additional resourceounces to the Zanzibar and Rockwell deposits. Six core holes with RC pre-collars arescheduled for Phase I of the program with follow up in Phase II based on outcome.
10.3 Regional ExplorationTwo District targets will be further explored in the Phase I program, to identify new deposits,on the Northumberland property. Two holes are planned for the East Pluton to test foradditional structural and stratigraphic mineralized horizons below the known systems. And afour to six hole fence will test for mineralization in the stratigraphy in contact with theZiggurat rhyolite intrusion, which is in a similar geological environment to Northumberland.

Fronteer Development Group Inc.Technical Report, Northumberland Project: Resource Update 2008 Page 49
CBL NI43-101_NorthumberlandResource_2008.07.28.doc July 28, 2008
11.0 DRILLING
The Northumberland database used in the Mineral Resource estimation reported in Section 17contains information from 1,502 drill holes for a total of 606,369.5ft, including holes drilledby Newmont from 2004 - 2007 (Table 11.1). These include holes drilled by air-track,conventional open-hole rotary, RC, and core methods, as well as 42 holes of unknown type.
The database does not include the 214 churn holes drilled by Northumberland Mining Co., 47rotary holes drilled by Joralemon, and 27 rotary holes drilled by Kerr McGee. These holeswere removed from the database by WSMC due to suspect sample quality and suspect assays,including assays with a high detection limit (0.01 oz Au/ton). Eleven Homestake rotary holesare not in the database for unknown reasons. Cyprus holes NC079, NC080, NC255 throughNC259, and NC289 are also not in the database due to missing data. WSMC holes T3-01through T3-14 are in the database, but all assays are considered suspect and have beenremoved.
Table 11.1 Northumberland Resource Drill-Hole Database Summary
Air-track Rotary RC CoreCompany Year
No. Feet No. Feet No. Feet No. Feet
TotalDrill
Holes
TotalFootage
Homestake 1968 11 2,045 11 2,045IdahoMining
1972-1974 34 5,229 34 5,229
Cyprus 1975-1983 41 2,766 553 139,398 (2)1 ?1 271 9,3311 6632 155,4552
WSMC 1985-1997 6453 270,732 343 41,015.5 679 311,747.5
Newmont 2004-2007 954 120,649.5 204 11,243.5 115 131,893
TOTAL 41 2,766 598 146,672 740 391,381.5 81 61,590 1,502 606,369.51 Two core holes pre-collared by RC, with unknown footage of RC; all footage is reported as core intable.2 Includes 42 holes of unknown type, for 3,960ft of the total footage.3 Includes 22 core holes pre-collared by RC, with 21,400ft of RC and 25,284ft of core.4 Includes 15 core holes pre-collared by RC, with 10,759ft of RC and 8,823.5ft of core.

Fronteer Development Group Inc.Technical Report, Northumberland Project: Resource Update 2008 Page 50
CBL NI43-101_NorthumberlandResource_2008.07.28.doc July 28, 2008
11.1 Drill Data
Statistics of the drill-hole database used in the resource estimation described in Section 17 aregiven in Table 11.2. Summary statistics for the gold-assay data are summarized in Table 11.3by drill type, and in Table 11.4 by company.
Table 11.2 Northumberland Resource Drill-Hole Database - Statistics
Item Number FootageAvg.
FootageDrill Holes 1,502 606,369.5 403.7Samples Assayed for Au by Fire Assay 87,908 563,314.5 6.4Samples Assayed for Au by Cyanide Leach 21,266 121,620.3 5.7Samples Assayed for Au by Cyanide Leach with no Fire Assay 2,404 12,620 5.2Samples Assayed for Total Ag (Fire Assay or Acid Digestion) 63,049 439,136.3 7.0Samples Assayed for Ag by Cyanide Leach 20,283 129,081 6.4Samples Assayed for Ag by Cyanide Leach with no Total Ag 2,026 10,830 5.3
Item HoleID
Northing(ft)
Easting(ft)
Elevation(ft)
Depth(ft)
Minimum Northing of Collar NW1142 1520695 415350 6575 2002Maximum Northing of Collar NW1164 1557510 422430 6350 390Minimum Easting of Collar NW1142 1520695 415350 6575 2002Maximum Easting of Collar NC533 1530617 452917 8918 210Minimum Elevation of Collar NW1164 1557510 422430 6350 390Maximum Elevation of Collar NW1127 1531075 445529 9160 75Minimum Depth of Hole NC105 1531971 450072 8622 10Maximum Depth of Hole NW1143 1531601 442552 8750 3426
Table 11.3 Northumberland Resource Drill-Hole Database – Sample Statisticsby Drill Type
Samples Au Grade (oz Au/ton)Drill Type
Number Avg. Length (ft) Mean Min Max Std. Dev. CVAir-track 515 5.3 0.018 0.001 0.520 0.046 2.579Rotary 15,003 9.7 0.010 0.001 1.290 0.029 3.089RC 65,703 5.6 0.009 0.000 1.200 0.030 3.253Core 6,476 6.4 0.019 0.000 1.244 0.064 3.335Unknown 211 18.4 0.026 0.001 0.300 0.066 2.514Total 87,908 6.4 0.010 0.000 1.290 0.034 3.365

Fronteer Development Group Inc.Technical Report, Northumberland Project: Resource Update 2008 Page 51
CBL NI43-101_NorthumberlandResource_2008.07.28.doc July 28, 2008
Table 11.4 Northumberland Resource Drill-Hole Database – Sample Statisticsby Company
Samples Au Grade (oz Au/ton)Company
Number Avg. Length (ft) Mean Min Max Std. Dev. CVHomestake 387 5.1 0.003 0.001 0.060 0.007 2.350Idaho Mining 518 10.0 0.016 0.001 0.310 0.034 2.088Cyprus 15,778 9.7 0.011 0.001 1.290 0.037 3.357WSMC 45,126 6.1 0.011 0.000 1.200 0.034 2.978Newmont 26,099 5.0 0.007 0.000 0.646 0.032 4.434
Total 87,908 6.4 0.010 0.000 1.290 0.034 3.365
The average grade of the Newmont drilling is low compared to the campaigns of most otheroperators. The 115 Newmont holes were drilled to depths of 100 to 2175ft and were assayedover their entire lengths, much of which was unmineralized. Many holes were drilled outsideof the limits of the deposits and did not encounter significant mineralization. Fronteer hasaudited the Newmont holes drilled within the known deposit areas on cross sections andconcludes that the Newmont results are consistent with those from previous operators.
Newmont drill-hole collars were surveyed using a Real Time Trimble GPS Navigation unit,model TSCI. WSMC hole collars were surveyed using a theodolite. Fronteer does not knowif the other hole collars were surveyed.
The database includes down-hole survey data for 80 of the WSMC holes and all Newmontholes except for five shallow holes. The WSMC surveys were completed by CenturyGeophysics using a down-hole gyro instrument. The Newmont down-hole surveys wereconducted using truck-mounted, wire-line, down-hole survey equipment. Constant dip anglesare assumed for the remaining 1,306 holes in the database. This assumption is likely tointroduce increasing location error with increasing depth of the drill holes, especially forangle holes. Of the holes lacking down-hole surveys, 135 are drilled to down-hole depths of500ft or greater. All except two of these deep holes, however, were drilled vertically.
Of the 1502 holes in the database, 1420 were drilled at an angle of -80º or steeper. Theoverwhelming bulk of the Northumberland gold mineralization is grossly stratiform andbroadly folded by the Northumberland anticline. Near-vertical drilling, therefore, will cut themineralization at acceptable angles. The steepest dips to the mineralized bodies occur in thedeep Zanzibar and Rockwell deposits, which have an average dip of about -45º. While near-vertical drill holes do not cut this mineralization orthogonally, the three-dimensional resourcemodeling of the drill-hole data described in Section 17 accurately reflects the true thicknessesof the mineralization.
11.2 Pre-WSMC Drilling
There are no records of the drill contractors, drill rigs, drilling equipment, etc. used in theHomestake, Idaho Mining, and Cyprus drilling campaigns.

Fronteer Development Group Inc.Technical Report, Northumberland Project: Resource Update 2008 Page 52
CBL NI43-101_NorthumberlandResource_2008.07.28.doc July 28, 2008
11.3 WSMC Drilling
WSMC used a number of RC drilling contractors from 1985 to 1991. RC contractors knownto Fronteer include Hackworth Drilling, Inc. of Elko, Nevada; Kelmine; Pioneer DrillingCompany; Eklund Drilling Company of Carlin, Nevada (“Eklund”); and Elsing Drilling andPump Co., Inc. of Twin Falls, Idaho (“Elsing”). In 1989 and 1990, Elsing used an Ingersoll-Rand TH60 with 5 ½- and 5 ¾-inch hammer bits. In 1990 and 1991, Hackworth used 5 1/2-inch hammer bits. Leroy Kay Drilling of Yerington, Nevada and Tonto Drilling Services Inc.of Salt Lake City, Utah (“Tonto”) drilled core for WSMC in 1991. Elsing, Eklund, andBoyles Brothers Drilling Company of Sparks, Nevada (“Boyles Brothers”, part of LayneChristensen Company) were used as RC contractors and Tonto as the core contractor in 1992and 1993. Elsing used a 5 1/2-inch bit and Eklund used a VT-100 rig with 6-, 5 3/4-, and 57/8-inch bits. RC and core contractors used in 1997 were Boyles Brothers and Tonto,respectively. Boyles Brothers used a TH100A RC rig in 1992 and 1993, and the TH100A rigas well as an MPD-1500 rig in 1997. The types of rigs used by the other contractors are notknown.
For all RC drilling, holes were started with hammer bits and were used to the end of holesunless ground conditions, such as broken rock or high-ground-water flow, required the use ofa rock bit. Further details of the drilling procedures are not known.
11.4 Newmont Drilling
Newmont contracted Eklund for their 2004 through 2007 drilling campaigns. Eklund used anIngersoll-Rand TH-75 drill rig with 5½- to 6-inch conventional-hammer and center-returntricone bits. The tricone bits were used when significant ground water was encountered in thedrilling. Drilling additives and water were used to condition the hole and to maintaincirculation in difficult rock conditions. Newmont contracted Layne Christensen Company fortheir 2006 and 2007 core and pre-collar core drilling programs. Holes were drilled using HQ-size bits. When required by ground conditions, holes were reduced using NQ-size bits.
Newmont drilled an additional 89 RC, core, and pre-collared core holes since the last resourceestimate in 2005. These new holes have been included in the updated resource estimationdiscussed in Section 17, and were mostly drilled in the general area of the resources (Figure11.1). These holes were drilled to explore for both sulfide and oxide mineralization, obtainmetallurgical and geotechnical samples, and verify RC drill results. The results from thisdrilling are discussed in Section 6.

Fronteer Development Group Inc.Technical Report, Northumberland Project: Resource Update 2008 Page 53
CBL NI43-101_NorthumberlandResource_2008.07.28.doc July 28, 2008
Figure 11.1 Drill-Hole Location Map

Fronteer Development Group Inc.Technical Report, Northumberland Project: Resource Update 2008 Page 54
CBL NI43-101_NorthumberlandResource_2008.07.28.doc July 28, 2008
12.0 SAMPLING METHOD AND APPROACH
Fronteer has no information concerning the RC and rotary sampling methods or approachesby operators at Northumberland prior to WSMC in 1989 other than the sample lengths storedin the master digital database. Average drill sample lengths by company are given in Table11.4.
Essentially all of the Homestake rotary samples were taken from five-ft intervals, while theIdaho Mining holes were sampled at 10-ft intervals. Cyprus air-track and rotary holes weresampled predominantly at five-ft and 10-ft intervals, respectively.
The drill holes in the Northumberland database are predominantly vertical, and sampleintervals are usually in the range of five to ten feet. Fronteer believes the orientation andlength of these samples are appropriate for the style of mineralization at Northumberland.
Individual drill-hole intercept grades and lengths are not given in this report; the resourcesdescribed in Section 17 provide more meaningful data with regards to the scale and grade ofthe Northumberland mineralization.
12.1 Cyprus Core Sampling
WSMC was able to recover a significant amount of Cyprus core from a storage shed atNorthumberland that had collapsed. The recovered core was then catalogued and stored intrailers at the site. The recovered Cyprus core is both NX- and NC-sized. The core was splitwith a mechanical splitter, with one-half of the core sent for assaying and one-half kept in thecore boxes for future reference. Approximately 50% of the core footage was sampled at 10-ftintervals and the reminder was sampled at 5-ft intervals.
12.2 WSMC RC and Core Sampling
As part of an audit and verification of the Northumberland mineable reserves, Pincock, Allen& Holt, Inc. (“PAH”) conducted a site visit in July 1989 and reviewed the drill samplingprocedures. PAH (1989) reports that two approximately five-pound drill-sample splits werecollected for each five-ft interval at the RC rig. One sample split was sent for assaying andthe other split was stored at Northumberland for future reference.
Documentation of RC- and rotary-sampling methods beyond the PAH 1989 report is lacking.The following information on the 1989 to 1997 WSMC RC-drilling programs is derived fromthe personal knowledge of G. Lanier (pers. comm., 2005). A WSMC geologist was presentwhile the rig was actively drilling. Cuttings collected during dry drilling were split withJones-type tiered splitters supplied by the drilling contractor. Wet samples were split usingthe drillers’ rotary splitters. Two identical splits, usually weighing at least five-pounds each,were collected at the rig and set on the ground at the drill site. According to the digitaldatabase, approximately one-half of the RC samples were collected at 10-ft intervals and theothers were collected at five-ft intervals. The higher percentage of 10-ft intervals is related todrilling through known thick sections of unmineralized ground in Mormon Canyon. Thisdetermination was based on a modeled interpretation of mineralization prior to drilling

Fronteer Development Group Inc.Technical Report, Northumberland Project: Resource Update 2008 Page 55
CBL NI43-101_NorthumberlandResource_2008.07.28.doc July 28, 2008
specific holes. Five-foot intervals were used in all cases where there was a possibility ofintersecting mineralization.
WSMC drill core, which was essentially all HQ-size, was sawed in half at the truck shop inthe Upper Site. Approximately 55% of the core was sampled at 10-ft intervals, 27% at 5-ftintervals and less, and 18% between 5- and 10-ft intervals. A very small amount of the corewas sampled at intervals greater than 10ft and less than 20ft. The core size was reduced fromHQ to NQ in hole NW1165A due to ground conditions. NQ-size core was processed thesame as the HQ-size.
12.3 Newmont RC and Core Sampling
The following details of the Newmont 2004 RC and Core sampling programs were providedby Eric Lauha, Newmont geologist (pers. comm., 2008). Water was injected by the drillersduring the entire program, so that all samples were collected wet after passing through arotary splitter. The sampler and/or driller adjusted the rotating splitter to optimize the fillingof the 18-inch by 26-inch bags with the wet cuttings from each five-ft interval withoutoverflow. The sample bags were labeled by hand, and a bar-code tag that identified the drill-hole number and footage interval was also attached to the bag. No rig duplicate samples werecollected.
Occasional sample recovery problems due to lost circulation were experienced during theNewmont drilling program. The worst case was the lack of any sample recovery in hole NN-15 in the interval between 490 and 535ft, probably due to a broken structural zone and anassociated solution cavity (Lauha, pers. comm., 2005). No significant gold was intersectedimmediately above and below this interval of no recovery. Other instances of loss of recoverywere usually restricted to single 5-ft intervals.
Newmont drill core was all HQ-size. The core was sawed in half at Newmont’s MaggieCreek Core Facility where Chemex would pick up the samples to be assayed. All of the corewas sampled at 5-ft intervals. Standards were inserted into the sample stream as was done forthe RC samples. Core recovery was generally very good as was the RQD.
12.4 Rotary and RC Sample Contamination
Newmont recognized indications of down-hole contamination in some holes that encountereddifficult drilling conditions and where good circulation could not always be maintained(Lauha, pers. comm., 2005). The contamination was recognized by unusual mixtures of RCcuttings whereby lithologies previously encountered in the hole but not expected in theinterval being drilled were seen. This type of contamination was sometimes seen at the end ofdrilling a 20-ft pipe length and the beginning of the next 20-ft section when drilling waspaused and the hole was blown clean. The contaminating cuttings were derived from brokenzones intersected higher in the drill holes.
No contamination is explicitly documented in the RC and rotary holes drilled prior toNewmont. However, several mineralized intervals suspected of being contaminated wereexcluded from the mineral envelopes created during the sectional grade modeling and

Fronteer Development Group Inc.Technical Report, Northumberland Project: Resource Update 2008 Page 56
CBL NI43-101_NorthumberlandResource_2008.07.28.doc July 28, 2008
therefore the resource estimation (see Section 17). These intervals were identified on thebasis of gold values that extend to anomalous depths compared to nearby holes. Ascontamination is often difficult to recognize, it is likely that additional contaminated intervalsremain in the database.

Fronteer Development Group Inc.Technical Report, Northumberland Project: Resource Update 2008 Page 57
CBL NI43-101_NorthumberlandResource_2008.07.28.doc July 28, 2008
13.0 SAMPLE PREPARATION, ANALYSIS, AND SECURITY
13.1 Sample Handling, Security, and Preparation
Fronteer has no information on sample handling, security, or preparation for operators atNorthumberland prior to WSMC’s work in 1989.
American Assay Laboratories of Sparks, Nevada (“American Assay”) analyzed the 1989through 1997 drill samples of WSMC. American Assay obtained ISO 9002 registration in2000. American Assay picked up the RC drill samples that were stored on the drill pads, aswell as the core samples stored in the truck shop, and transported them either to their Elko,Nevada facility for sample preparation prior to transporting the sample pulps to their Sparks,Nevada laboratory for analysis, or directly to Sparks for both preparation and analysis.WSMC would occasionally transport the drill samples directly to the Sparks laboratory whena short turnaround time on the analyses was desired.
WSMC also stored duplicate RC samples at the drill sites. If the sample sent for analysis wasmineralized (~0.01 oz Au/ton or greater) or within a mineralized interval, the rig duplicatewas placed in a secured sample storage facility at one of two ranches owned by WSMC in theBattle Mountain area. The rig duplicates of unmineralized samples were discarded. Thestored rig duplicates, along with assay pulps, assay rejects, and half-core, were recentlymoved to secured storage at the Lower Site at Northumberland.
The Newmont 2004 - 2007 RC samples were stored at the drill site and were periodicallypicked up by ALS Chemex (“Chemex”) personnel. A Newmont geologist would typicallyarrange a pick-up with Chemex as soon as a drill hole was nearing termination, and a Chemextruck would often arrive when the drillers were abandoning the hole. Otherwise, the samplesfrom the completed hole would be picked up by Chemex on the following day (Lauha, pers.comm., 2008).
13.2 Analytical Procedures
Many of the details of the analytical procedures used in the assaying of the drill-hole samplesare not fully documented. As discussed in Section 11, all holes drilled by NMC, Joralemon,and Kerr McGee have been removed from the database due to suspect sample quality andassays, and will not be discussed further. Although gold and silver fire assays are included inthe database for the Homestake drill holes and T83 series holes of Cyprus, neither thelaboratory nor details of the analytical procedure are known. WSMC did not acquire theoriginal assay certificates for holes drilled by Cyprus and earlier operators at the time WSMCtook possession of Northumberland, although summary assay logs prepared by Whitney &Whitney, Inc. were obtained (Lanier, 1992a). Table 13.1 shows the extent of informationknown about the assay laboratories and analytical techniques used for the various series ofdrill holes through 1997.
Union Assay of Salt Lake City, Utah (“Union”); Skyline Laboratories of Denver, Colorado(“Skyline”); and Rocky Mountain Geochemical Corporation, of Sparks, Nevada (“RockyMountain”) assayed Idaho mining drill samples.

Fronteer Development Group Inc.Technical Report, Northumberland Project: Resource Update 2008 Page 58
CBL NI43-101_NorthumberlandResource_2008.07.28.doc July 28, 2008
Laboratories used to analyze the Cyprus drill samples include CMS of Salt Lake City, Utah;CRL of Salt Lake City; Hunter Mining Laboratory of Sparks, Nevada (“Hunter”); MonitorGeochemical Laboratory of Elko, Nevada (“Monitor”); Skyline; Union; Rocky Mountain;Western Testing Laboratories; Legend Laboratories of Reno, Nevada (“Legend”); and theCyprus mine laboratory at Northumberland. Samples from holes NC01 through NC38 wereanalyzed by CMS using an MIBK technique whereby samples were roasted to 600º C toremove carbon, digested in aqua regia, and analyzed by atomic absorption (“AA”). Little isknown of the analytical procedures used by the various laboratories. As discussed below,WSMC performed cyanide leach analyses on selected mineralized samples from some of theCyprus holes at their laboratories in Elko and the Northumberland mine site.
Lanier (1992a) reported that the original gold and silver analyses for holes NC337 throughNC553 (drilled by Cyprus during the period 1979-1983) were performed by Monitor by ½-assay-ton (15g charge) fire assay with gravimetric finish. Skyline was used for check assaysand also analyzed by ½-assay-ton fire assay, although the finish is not known. Cyprusanalyzed samples from many of these holes for silver by cyanide leach methods; gold wasanalyzed by cyanide leach in samples from NC337. Details of the cyanide leach proceduresare not known. WSMC’s Northumberland mine laboratory later ran check gold and silveranalyses on NC341 and is believed to have used ½-assay-ton fire assaying. The WSMC labalso analyzed selected Cyprus samples by one-hour cold-cyanide leach with final gold andsilver determination by AA.
Samples from WSMC holes T3-01 through T3-14, the CD88 series, and NW554 throughNW799 were initially assayed at the WSMC Northumberland mine laboratory by cyanidesoluble methods. Gold and silver were analyzed by one-hour 180º F shake-leach methodsusing a 10g charge in four-pound per ton cyanide solution with final determination by AA.Monitor also completed cyanide soluble assays of unknown type on some of the samples.Gold and silver cyanide leach values of samples from holes NW800 through NW958 werecompleted by WSMC, Barringer Laboratories, Inc. (“Barringer”), Universal Laboratories ofElko, Nevada (“Universal”), and Rocky Mountain. Samples from these WSMC holes thatreturned cyanide leach gold values of 0.010 oz Au/ton or greater were fire assayed, with goldand silver primarily determined by one-assay-ton (30g charge) fire assay with gravimetricfinish at the WSMC laboratory (Lanier, 1992a).
The lack of comprehensive fire assay data precipitated the initiation of a program in mid-1989to obtain complete gold and silver fire assays for all drill intervals. Available pulps or rejectsfrom Cyprus and WSMC intervals lacking fire assay data were analyzed at the WSMClaboratory at Northumberland by fire assay with gravimetric determination of gold and silvervalues. Approximately 94% of the drill samples that were only analyzed by cyanide leachmethods were fire assayed by the end of the program in 1990; neither pulps nor rejects for theremaining 6% could be located. The original cyanide soluble gold results commonlyexceeded the new fire assay gold results, mainly for the NW700 series of holes drilled in1987. Additional cyanide soluble gold assays were determined on these samples if the samplepulps could be located, and the original cyanide assays were replaced in the database with thenew values. The original cyanide soluble results for those samples whose pulps could not befound were removed from the database.

Fronteer Development Group Inc.Technical Report, Northumberland Project: Resource Update 2008 Page 59
CBL NI43-101_NorthumberlandResource_2008.07.28.doc July 28, 2008
Table 13.1 Laboratories and Assay Methods Employed Through 1997Gold Analytical Technique and Laboratory Silver Analytical Technique and Laboratory
Company DrillHoles
FA/AA FA/Grav FA/? Other CN FA/AA FA/Grav FA/? AD/AA CN
N01-16 Union Union
N17-31 Skyline;Union
Skyline;Union
IdahoMining
N32 RockyMountain
RockyMountain
Homestake NU01-21 ? ? ? ? ? ? ? ? ? ?
NC001-038
CMS: Auassays
byMIBK/AA
WSMC CMS
NC039-081 CMS CRL;
Union WSMC CMS
NC082-220 Hunter Union WSMC Hunter Union
NC221-274A Monitor Union Monitor Union
NC275-298
Hunter;Skyline;Western;Legend
WSMCHunter;Skyline;Western
WSMC
NC299-336 Skyline Skyline;
Monitor WSMC Skyline Skyline;Monitor WSMC
NC337-536 Skyline Monitor;
WSMCMonitor;Skyline
WSMC;Cyprus Monitor WSMC Monitor;
SkylineCyprus;WSMC
NC537-553 ? Monitor ? ? ? ? Monitor ? ? ?
CT01-36A
Hunter;Monitor;Rocky
Mountain
Hunter;Monitor;Rocky
Mountain
Cyprus
T83 001-152 ? ? ? ? ? ? ? ? ? ?
NW554-799 WSMC Monitor;
BarringerWSMC;Monitor WSMC Monitor;
BarringerWSMC;Monitor
NW800-923 WSMC
Barringer;Rocky
Mountain
Barringer;WSMC;Rocky
Mountain
WSMC BarringerBarringer;
RockyMountain
WSMC
NW924-1222
AmericanAssay
Universal;American
Assay;Cone
Universal;American
Assay;WSMC
AmericanAssay Cone
Universal;American
AssayWSMC
T3 01-14 WSMC WSMC WSMC WSMC
T3 15-17 AmericanAssay
AmericanAssay
CNDM01-11 Barringer Barringer
WSMC
CD88 01-03 WSMC WSMC WSMC WSMC
FA=fire assay AD=acid digestion CN=cyanide leach MIBK (see text)AA=atomic absorption finish GRAV=gravimetric finish ?=unknown finish
Fronteer Development Group Inc.Technical Report, Northumberland Project: Resource Update 2008 Page 60
CBL NI43-101_NorthumberlandResource_2008.07.28.doc July 28, 2008
Samples from holes NW946 through NW1222 were analyzed by American Assay by fireassay with AA finish. Samples returning values in excess of 3-ppm gold (0.088 oz Au/ton)were re-analyzed by fire assay with gravimetric finish. Cone Geochemical Inc. of Reno,Nevada (“Cone”) performed some check analyses of selected samples from these holes by fireassaying with AA finish. Holes NW946 to NW1079 were analyzed by two-assay-ton (60gcharge) fire assay; one-assay ton fire assaying was used on holes NW1080 through NW1222.The change to a charge weight of one-assay-ton was justified on the basis of 52 drill-holesamples assayed by both methods at American Assay. Silver was analyzed by an aqua regiapartial digestion with an AA determination using a 0.3g charge. Samples that returned silvervalues in excess of 50 ppm were re-run using a 1g charge. Cyanide-soluble gold and silverwere determined for mineralized intervals (greater than or equal to 0.01 oz Au/ton) using a15-g, three-hour, cold-cyanide shake leach. The three-hour leach time was chosen after astatistical comparison between one-hour hot shake tests performed at the Northumberlandlaboratory and three-hour cold-shake tests performed at American Assay showed nosignificant differences.
All Samples from Newmont’s 2004 - 2007 drill holes were sent to the Chemex preparationfacility in Elko, Nevada except for drill holes NN037, NN039, NN042, and NN046 whichwere sent to American Assay Laboratory in Reno, Nevada. The sample cuttings were driedand all of the cuttings were passed through a preliminary jaw crusher and a secondary rotatingjaw crusher. The crushed cuttings were passed through a riffle splitter several times to obtaina 250g subsample. The subsample was pulverized and a 100g split of the pulp was sent to theChemex laboratory in Reno, Nevada or Vancouver, British Columbia for analysis. Chemexhas ISO 9002 laboratory accreditation and ISO:9001:2000 for North America. Chemexanalyzed the pulps by 30g fire assay with AA finish. The original pulp of any sample thatreturned a gold value greater than 10 ppm was re-assayed by 30g fire assay with gravimetricfinish. The four drill holes that were sent to American Assay were prepared and analyzed in amanner similar to that used by Chemex.
13.3 Soil Sample Analyses
The Newmont soil samples were sieved by Chemex and the 0.5- to 2.0-mm fraction wasanalyzed by fire assay with gold determination by inductively coupled plasma-massspectrometry (“ICP-MS”). Trace elements were analyzed by aqua regia digestion withdetermination by ICP-MS and ICP-emission spectrometry. The analytical procedure used forthe stream sediment samples is not known to Fronteer.
13.4 Drill-Hole Database
Due to multiple analytical gold and silver values for many of the drill-hole intervals, andaveraging of values is statistically inappropriate, WSMC created a set of rules to govern theselection of a single assay value for use in the digital database for any given drill interval(Figure 13.1). These rules were followed closely and are unlikely to have introduced anymaterial bias into the database.

Fronteer Development Group Inc.Technical Report, Northumberland Project: Resource Update 2008 Page 61
CBL NI43-101_NorthumberlandResource_2008.07.28.doc July 28, 2008
Figure 13.1 Rules Governing Selection of Assay Value for Drill-Hole Database
D.L. = Detection Limit
One Value Yes Use Value
Two Values YesValues Agreewithin Error? Use Primary Lab Value
No
Both ValuesAbove D.L.? Use Conservative Value
No
Yes
Yes
Value Bounded bydetectable Values? Use Value Above D.L.
No
Yes
Use .001 oz Au/tonor
.01 oz Ag/ton
No
Both ValuesAbove D.L.? Use Conservative ValueYes
Value Bounded bydetectable Values? Use Value Above D.L.
No
Yes
No
Do Two of theValues Agreewithin Error?
Yes
Use ValueClosest to Meanof All Values
No
Use .001 oz Au/tonor
.01 oz Ag/ton
No
Fronteer Development Group Inc.Technical Report, Northumberland Project: Resource Update 2008 Page 62
CBL NI43-101_NorthumberlandResource_2008.07.28.doc July 28, 2008
14.0 DATA VERIFICATION
Documentation reviewed by Fronteer indicates that the drill-hole database was audited,corrected, and updated several times by WSMC. During the 2005 resource estimate, MDAaudited the WSMC database using drill-hole log sheets, original assay certificates, copies oforiginal assay certificates, and original down-hole survey data. As previously discussed,assay certificates are not available for the Cyprus holes, so typed sheets of assay resultsprovided to WSMC at the time of the acquisition of the property from Cyprus were used tocheck these assay results. The collar coordinates for the Cyprus NC-series drill holes throughNC314 that were selected for auditing had no survey data to compare with the database.These early holes were originally located on a local coordinate system and their collarlocations were likely to have been verified by Northumberland personnel on the basis ofCyprus drill-hole plan maps (Lanier, pers. comm., 2004). Slightly more than five percent ofthe database was checked by MDA with only a few insignificant errors found and these werecorrected.
Drill sample assays from several major mining companies are included in the database,including assays from all the Newmont holes, and these companies used multiple recognizedassay laboratories. The assay data from these operators are consistent with the resultsgenerated by the WSMC drilling programs. Fronteer personnel are very familiar with theNorthumberland project and have actively participated in every facet of exploration andrelated work and believe the data to be satisfactory and up to industry standards. During the2005 resource estimate, MDA did conduct a site visit to Northumberland, which included aninspection of gold-silver mineralization exposed in the open pits, road cuts, surface trenches,and drill core.
14.1 Check Assaying
Systematic, consistently implemented data checks and validation procedures appear to belacking in many of the drilling programs conducted at Northumberland. While this may bepartially due to the inability of WSMC to obtain all of the data from previous operators, manyQA/QC procedures were either not commonly followed or not completely documented at thetime of the Homestake, Idaho Mining, Cyprus, and early WSMC exploration programs.
During the 2005 resource estimate, MDA compiled and analyzed gold check assay data for allNorthumberland holes. In most cases, the documentation did not allow the distinction ofcheck assays performed on pulps versus rejects. The WSMC checks of Cyprus NC-seriesholes are an exception, as these checks were predominantly performed on rejects (Lanier,pers. comm., 2005). In the discussion below, all check-assay data are considered to have beenperformed on ‘pulps/rejects’.
Cyprus Drill Holes. Figure 14.1 compares Monitor original assays versus Skyline checkassays of samples from holes in the sequence NC348 through NC385. The means comparequite well and the data yield a high correlation coefficient (0.99).
WSMC check assays of samples from three of the holes compared above are compared withthe original Monitor assays in Figure 14.2. These results do not compare well (correlation

Fronteer Development Group Inc.Technical Report, Northumberland Project: Resource Update 2008 Page 63
CBL NI43-101_NorthumberlandResource_2008.07.28.doc July 28, 2008
coefficient = 0.34), although the means are closer than might be expected from a visualinspection of the graph. Since the Monitor assays are the primary assays that are used in theassay database, and the Skyline check results verify the Monitor results, the poor WSMCcheck data are not considered to be a problem.
Figure 14.1 Check Assays of Pulps/Rejects: Monitor vs. SkylineFire Assays: Monitor vs Skyline Pulps/Rejects
Holes NC348-385
0.00
0.05
0.10
0.15
0.20
0.25
0.30
0.00 0.05 0.10 0.15 0.20 0.25 0.30
Monitor (oz Au/ton)
Skyl
ine
(oz
Au/
ton)
N=45
Mean (oz Au/ton)Monitor 0.039Skyline 0.038
Figure 14.2 Check Assays of Pulps/Rejects: Monitor vs. WSMCFire Assays: WSMC vs Monitor Pulps/Rejects
Holes NC348, NC354 & NC362
0.00
0.05
0.10
0.15
0.20
0.25
0.30
0.00 0.05 0.10 0.15 0.20 0.25 0.30
WSMC (oz Au/ton)
Mon
itor(
ozA
u/to
n)
N=59
Mean (oz Au/ton)WSMC 0.020Monitor 0.016

Fronteer Development Group Inc.Technical Report, Northumberland Project: Resource Update 2008 Page 64
CBL NI43-101_NorthumberlandResource_2008.07.28.doc July 28, 2008
WSMC Drill Holes. American Assay original results are compared with Barringer checkassays from holes NW959 and NW964 in Figure 14.3. The data compare very well, with acorrelation coefficient of essentially 1.0.
Figure 14.3 Check Assays of Pulps/Rejects: American Assay vs. BarringerFire Assays: American Assay vs Barringer Pulps/Rejects
Holes NW959 & NW964
0.00
0.02
0.04
0.06
0.08
0.10
0.12
0.14
0.16
0.18
0.20
0.00 0.05 0.10 0.15 0.20
American Assay (oz Au/ton)
Bar
ringe
r(oz
Au/
ton)
N=13
Mean (oz Au/ton)American 0.021Barringer 0.023
Figure 14.4 compares Barringer check assays with WSMC original assays from holes NW561through NW964. The data compare reasonably well for samples where both assays grade upto about 0.05 oz Au/ton, while four samples with higher grades show considerable scatter.Thirty-three of the 40 assays values used in the database are from Barringer, including all thefour higher-grade outlier samples.
WSMC assays from holes NW595 through NW959 are compared with Hunter check assays inFigure 14.5. The WSMC mean is 15% higher than the Hunter mean, and the data have acorrelation coefficient of 0.82. Samples where both labs returned results less than about 0.05oz Au/ton exhibit typical scatter for rig duplicate samples, while the remaining samples showa bias towards higher grades in the WSMC analyses.
Twenty Barringer sample results from hole NW887, all of which are used in the assaydatabase, are compared with Rocky Mountain assays in Figure 14.6. The Rocky Mountainresults are slightly, but systematically, higher than the Barringer assays.

Fronteer Development Group Inc.Technical Report, Northumberland Project: Resource Update 2008 Page 65
CBL NI43-101_NorthumberlandResource_2008.07.28.doc July 28, 2008
Figure 14.4 Check Assays of Pulps/Rejects: WSMC vs. BarringerFire Assays: WSMC vs Barringer Pulps/Rejects
Holes NW561-964
0.00
0.05
0.10
0.15
0.20
0.25
0.30
0.35
0.40
0.00 0.05 0.10 0.15 0.20 0.25 0.30 0.35 0.40
WSMC (oz Au/ton)
Bar
ringe
r(oz
Au/
ton)
N=40
Mean (oz Au/ton)WSMC 0.030Barringer 0.025
Figure 14.5 Check Assays of Pulps/Rejects: WSMC vs. HunterFire Assays: WSMC vs Hunter Pulps/Rejects
Holes NW595-959
0.00
0.05
0.10
0.15
0.20
0.25
0.00 0.05 0.10 0.15 0.20 0.25
WSMC (oz Au/ton)
Hun
ter(
ozA
u/to
n)
N=52
Mean (oz Au/ton)WSMC 0.047Hunter 0.040

Fronteer Development Group Inc.Technical Report, Northumberland Project: Resource Update 2008 Page 66
CBL NI43-101_NorthumberlandResource_2008.07.28.doc July 28, 2008
Figure 14.6 Check Assays of Pulps/Rejects: Barringer vs. Rocky MountainFire Assays: Rocky Mountain vs Barringer Pulps/Rejects
Hole NW887
0.00
0.05
0.10
0.15
0.20
0.25
0.00 0.05 0.10 0.15 0.20 0.25
Rocky Mountain (oz Au/ton)
Bar
ringe
r(oz
Au/
ton)
N=20
Mean (oz Au/ton)Rocky Mountain 0.074Barringer 0.070
Figure 14.7 Check Assays of Pulps/Rejects: American Assay vs. WSMCFire Assays: WSMC vs American Assay Pulps/Rejects
Holes NW946-1073
0.00
0.20
0.40
0.60
0.80
1.00
1.20
1.40
0.00 0.20 0.40 0.60 0.80 1.00 1.20 1.40
WSMC (oz Au/ton)
Am
eric
anA
ssay
(oz
Au/
ton)
N=605
Mean (oz Au/ton)American 0.025WSMC 0.026

Fronteer Development Group Inc.Technical Report, Northumberland Project: Resource Update 2008 Page 67
CBL NI43-101_NorthumberlandResource_2008.07.28.doc July 28, 2008
Original American Assay results compare well with WSMC check assays from holes NW946through NW1073 (Figure 14.7). The WSMC mean grade is insignificantly higher than theAmerican Assay mean, and the data have a correlation coefficient of 0.98.
Figure 14.8 compares original American Assay results with Cone Geochemical Inc. (“Cone”)check assays for samples from holes NW959 through NW1165. With the exception of a fewoutliers, the data compare quite well.
Figure 14.8 Check Assays of Pulps/Rejects: American Assay vs. ConeFire Assays: American Assay vs Cone Pulps/Rejects
Holes NW959-1165
0.00
0.20
0.40
0.60
0.80
1.00
1.20
0.00 0.20 0.40 0.60 0.80 1.00 1.20
American Assay (oz Au/ton)
Con
e(o
zA
u/to
n)
N=164
Mean (oz Au/ton)American 0.099Cone 0.102
PAH (1989) compared the results of American Assay original analyses of 47 drill samples toAmerican Assay check assays on rig duplicate samples (Table 14.1). The samples were of1989 drill intervals with original assays exceeding 0.01 oz Au/ton; drill hole numbers andintervals were not provided, although holes drilled in 1989 include NW946 to NW958. Boththe original and check analyses were by fire assay with AA finish. PAH noted that, “Thesimilar means, and very high correlation coefficient show excellent precision.”
Table 14.1 Comparison: American Assay Original vs. Duplicate(adapted from PAH, 1989)
American Assay(oz Au/ton)
American Assay(oz Au/ton)
Number 47 47Mean 0.1580 0.1616Standard Deviation 0.2517 0.2549Correlation Coefficient 0.9952
The results of 40 mineralized samples analyzed by WSMC in 1989 by fire assay withgravimetric finish were compared with American Assay fire assays with AA finish (Table14.2; PAH, 1989). PAH concluded that there was good agreement between the two labs and

Fronteer Development Group Inc.Technical Report, Northumberland Project: Resource Update 2008 Page 68
CBL NI43-101_NorthumberlandResource_2008.07.28.doc July 28, 2008
that care was taken in the WSMC laboratory to ensure that analytical values were of highquality. It is not clear whether the duplicate samples analyzed by American Assay representcheck assays on the same pulps or on pulps prepared on a different sample split; MDAbelieves the checks represent analyses of the original pulps.
Table 14.2 Drill Sample Assay Comparison: American Assay vs. WSMC(adapted from PAH, 1989)
American Assay(oz Au/ton)
WSMC(oz Au/ton)
Number 40 40Mean 0.1524 0.1491Standard Deviation 0.2667 0.2743Correlation Coefficient 0.9902
Finally, PAH conducted a statistical analysis of 217 drill samples with American Assay fireassay/AA values greater than 0.01 oz Au/ton versus WSMC cyanide leach assays of rigduplicate samples (Table 14.3). Fire assays are considered to represent the total gold contentof the samples, while CN leach analyses represent the cyanide-soluble fraction of the samples.PAH (1989) believed that the correlation coefficient shows good correlation between the twoanalytical methods.
Table 14.3 Drill Sample Assay Comparison: American Assay Fire Assay vs.WSMC CN Leach
(adapted from PAH, 1989)American Assay
Fire Assay(oz Au/ton)
WSMCCN Assay
(oz Au/ton)CN/Fire Assay
Number 217 217Mean 0.0496 0.0337 0.6794Standard Deviation 0.0866 0.0573Correlation Coefficient 0.8993
PAH (1989) concluded that, “Quality control is maintained at the [WSMC Northumberlandmine and American Assay] labs by including internal standards and duplicate samples as acheck on lab accuracy and precision.”
Newmont submitted assay standards at various grades routinely with the 2004 – 2007 drill-hole samples (Lauha, pers. comm., 2008). One standard was included for every 50th samplesubmitted. The standards at various grades are created by Newmont and distributed to thevarious drill programs. Personnel at the site then insert the standards into the samplesequence and try to place a standard with similar grade to the surrounding samples. Newmonthas not provided the QA/QC for the standard samples nor have they provided a compilation ofthe standard assay data.
Duplicate samples from Newmont’s 2004 – 2007 drill programs were collected as a secondsplit at the rig. Rig duplicates were collected at 100-ft intervals throughout most of thedrilling program. The correlation between the original (AUOPT) and duplicate (AUDUP)samples is shown in Figure 14.9. The data compare quite well with a correlation coefficient

Fronteer Development Group Inc.Technical Report, Northumberland Project: Resource Update 2008 Page 69
CBL NI43-101_NorthumberlandResource_2008.07.28.doc July 28, 2008
of 0.946 and mean grade quite close. The poor precision of a few samples at the lowerconcentration is normal as precision improves with higher concentrations.
Figure 14.9 Scatter Plot of Newmont Rig Duplicates
Mean (oz/ton) SDOriginal 0.021 0.053Duplicate 0.022 0.051
N = 273

Fronteer Development Group Inc.Technical Report, Northumberland Project: Resource Update 2008 Page 70
CBL NI43-101_NorthumberlandResource_2008.07.28.doc July 28, 2008
Figure 14.10 compares original Chemex results with American Assay check assays forsamples drill during the 2004 – 2007 programs. With a correlation coefficient of 0.982 andcomparable means the data compare quite well. The check assays have a slightly highergrade than the original samples used in the resource estimate.
Figure 14.10 Check Assays of Pulps: Chemex vs. American Assay
While the available check assays do not indicate serious problems with the assay database,more check data are needed before definitive conclusions can be made. Selected pulps andrejects from those that remain in WSMC storage should be re-assayed in order to augment theexisting check-assay database. The early WSMC drilling data, in particular, warrant carefulreview and further verification by check assaying. All further drilling programs atNorthumberland should continue to follow a sound QA/QC procedure similar to thatimplemented by Newmont.
Mean (oz/ton) SDOriginal 0.072 0.083Duplicate 0.076 0.087
N = 263

Fronteer Development Group Inc.Technical Report, Northumberland Project: Resource Update 2008 Page 71
CBL NI43-101_NorthumberlandResource_2008.07.28.doc July 28, 2008
14.2 Twin-Hole Comparisons
Core Twins. Whitney & Whitney, Inc. (1980) undertook a statistical analysis of 12core/rotary twin pairs drilled by Cyprus and concluded that no significant bias existed in therotary gold and silver assay results as compared to the core results.
During the 2005 resource estimate, MDA compared five core/rotary twin pairs and onecore/rotary/RC twin set (Figures 14.11 a-f). All of the core holes and all but one of the rotaryholes in the twin sets were drilled by Cyprus. An Idaho Mining rotary hole and a WSMC RChole are also included in the comparisons. The maximum distance between holes in any ofthe core twin sets is 17.5ft. The morphologies of the down-hole grade curves for each of thetwin sets compare reasonably well, indicating that the twin holes sampled similar geology.The mean and median values of the mineralized core intervals are higher than the rotary twinsin three cases and lower in the other three sets.
Figure 14.11 Down-Hole Gold Grade Plots of Core-Rotary and Core-RC TwinSets
Twin Hole Au ValuesN20 (Rotary) vs NC039 (Core)
0
0.05
0.1
0.15
0.2
0.25
0 50 100 150 200Feet Down-the-Hole
ozA
u/to
n N20
NC039
10-140 ftMean Median
N20 0.084 0.070NC039 0.073 0.065
Horizontal collar offsetis 11.2ft
(a)

Fronteer Development Group Inc.Technical Report, Northumberland Project: Resource Update 2008 Page 72
CBL NI43-101_NorthumberlandResource_2008.07.28.doc July 28, 2008
Figure 14.11 Down-Hole Gold Grade Plots of Core-Rotary and Core-RC TwinSets (continued)
Core-RC Twin Hole Au ValuesNW0561 (RC) vs NC206 (Core) vs NC026 (Rotary)
0
0.05
0.1
0.15
0.2
0.25
0.3
0.35
0.4
0.45
20 45 70 95 120 145Feet Down-the-Hole
ozA
u/to
n NW0561NC206NC026
60-130 ftMean Median
NW0561 0.082 0.079NC206 0.139 0.088NC026 0.069 0.053
Horizontal collar offsets:NW0561<>NC206=10.8ftNC206<>NC026 = 12.4ftNC026<>NW0561=17.5ft
(b)
Twin Hole Au ValuesNC028 (Rotary) vs NC207 (Core)
0
0.05
0.1
0.15
0.2
0.25
0.3
0.35
0.4
65 85 105 125 145 165 185 205Feet Down-the-Hole
ozA
u/to
n NC028
NC207
90-200 ftMean Median
NC028 0.096 0.056NC207 0.046 0.005
Horizontal collar offsetis 16.3ft
(c)
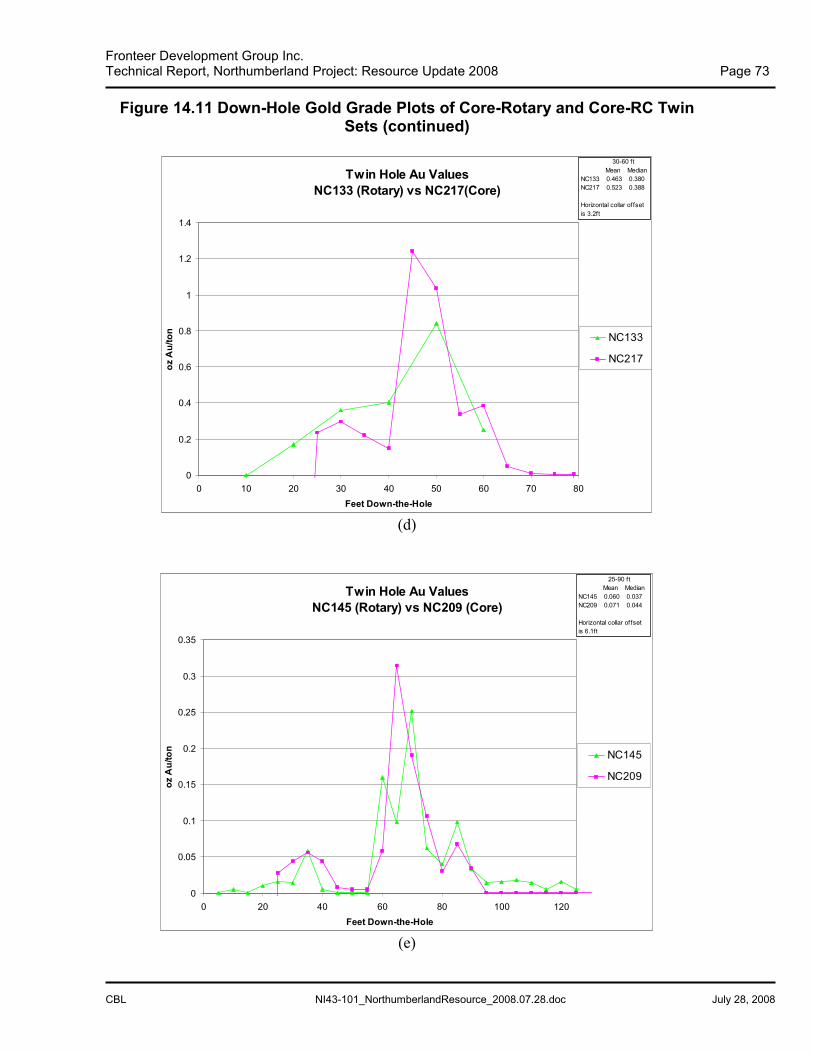
Fronteer Development Group Inc.Technical Report, Northumberland Project: Resource Update 2008 Page 73
CBL NI43-101_NorthumberlandResource_2008.07.28.doc July 28, 2008
Figure 14.11 Down-Hole Gold Grade Plots of Core-Rotary and Core-RC TwinSets (continued)
Twin Hole Au ValuesNC133 (Rotary) vs NC217(Core)
0
0.2
0.4
0.6
0.8
1
1.2
1.4
0 10 20 30 40 50 60 70 80Feet Down-the-Hole
ozA
u/to
n NC133
NC217
30-60 ftMean Median
NC133 0.463 0.380NC217 0.523 0.388
Horizontal collar offsetis 3.2ft
(d)
Twin Hole Au ValuesNC145 (Rotary) vs NC209 (Core)
0
0.05
0.1
0.15
0.2
0.25
0.3
0.35
0 20 40 60 80 100 120Feet Down-the-Hole
ozA
u/to
n NC145
NC209
25-90 ftMean Median
NC145 0.060 0.037NC209 0.071 0.044
Horizontal collar offsetis 6.1ft
(e)

Fronteer Development Group Inc.Technical Report, Northumberland Project: Resource Update 2008 Page 74
CBL NI43-101_NorthumberlandResource_2008.07.28.doc July 28, 2008
Figure 14.11 Down-Hole Gold Grade Plots of Core-Rotary and Core-RC TwinSets (continued)
Twin Hole Au ValuesNC150 (Rotary) vs NC214 (Core)
0
0.02
0.04
0.06
0.08
0.1
0.12
0.14
0.16
0.18
0.2
50 70 90 110 130 150Feet Down-the-Hole
ozA
u/to
n NC150
NC214
85-130 ftMean Median
NC150 0.046 0.027NC214 0.029 0.020
Horizontal collar offsetis 3.6ft
(f)
One of the main concerns with rotary and RC drilling is the potential for down-holecontamination. Contamination is possibly indicated by the gradual tailing off of values inrotary hole NC145 below the high-grade peak, which is in contrast to the abrupt loss of goldvalues in the core hole (Figure 14.11e). A certain amount of down-hole contamination is alsoevidenced in Figure 14.11e and f, where the baseline RC gold values down-hole of themineralized intercepts are higher than the core baseline values.
The grade differences in the core/rotary and core/RC twin pairs are not systematic, but appearto be primarily related to the magnitude of the higher-grade spikes. MDA believes that thelimited data provided by these twin holes do not indicate a grade bias between core andRC/rotary drilling methods at Northumberland.
Fronteer compared three RC/Core twin pairs for the Newmont drilling (Figures 14.12 a-c).Two of the RC holes were drilled by WSMC while all the other holes were drilled byNewmont. The distances between the three pairs is (NW1001-NN061C) 6 feet, (NW1132-NN062C) 10 feet, and (NN005-NN057) 14.2 feet. The morphologies of the down-hole gradecurves for each of the twin pairs compare quite well, indicating that the twin holes sampledsimilar geology. The mean values of the mineralized RC intervals are higher than the RCtwins in all cases. The median values for the RC holes were higher in two instances andlower in the third. Down-hole contamination is not apparent in Figures 14.12 b or c. Figure14.12a could indicate contamination at the bottom of NW1001. Fronteer believes that the

Fronteer Development Group Inc.Technical Report, Northumberland Project: Resource Update 2008 Page 75
CBL NI43-101_NorthumberlandResource_2008.07.28.doc July 28, 2008
data provided by the Newmont twin holes show good correlation and concur with MDA’sassessment that a grade bias between core and RC drilling methods is not indicated atNorthumberland .
Figure 14.12 Down-Hole Gold Grade Plots of Core-RC Twin PairsNorthumberland Twin Hole Au Values
NW1001 (RC) vs NN061C (Core)
0
0.02
0.04
0.06
0.08
0.1
0.12
0.14
0.16
0.18
0 30 60 90 120 150 180 210 243 270
Feet Down-the-Hole
ozA
u/to
n
NW1001 NN061C
100 - 270 ftMean Median
NW1001 0.051 0.052NN061C 0.033 0.021
(a)
Northumberland Twin Hole Au ValuesNW1132 (RC) vs NN062C (Core)
0
0.1
0.2
0.3
0.4
0.5
0.6
0.7
0.8
0.9
0 50 100 150 200 250 300 350 400 450 500 550
Feet Down-the-Hole
ozA
u/to
n
NW1132 NN062C
375 - 790 ftMean Median
NW1132 0.054 0.008NN062C 0.053 0.013
(b)

Fronteer Development Group Inc.Technical Report, Northumberland Project: Resource Update 2008 Page 76
CBL NI43-101_NorthumberlandResource_2008.07.28.doc July 28, 2008
Figure 14.12 Down-Hole Gold Grade Plots of Core-RC Twin Pairs(continued)
Northumberland Twin Hole Au ValuesNN005 (RC) vs NN057 (Core)
0
0.05
0.1
0.15
0.2
0.25
0.3
0.35
0.4
0.45
0 100 200 300 400 500 600 700 800 900 1000 1100 1200 1300
Feet Down-the-Hole
ozA
u/to
n
NN005 NN057
755 - 1150 ftMean Median
NN005 0.099 0.061NN057 0.062 0.025
(c)
RC Twins. Down-hole grade plots of RC/rotary and RC/RC twin pairs are shown in Figure14.13 a-d. The grade curves have been shifted in some cases to account for elevationdifferences and to facilitate visual comparisons.
The morphologies of the grade plots compare well for each twin pair with the exception ofNW621/NW904, which only has a gross correspondence of the curves. The results fromrotary hole NC316 compare well with RC hole NW1106 (Figure 14.13a). The rotary/RCcomparison in Figure 14.13b suggests that the rotary hole may have experienced down-holesmearing of values below higher-grade spikes, however. Grade differences in the RC/RCtwin pair in Figure 14.13c may be due to sampling slightly different geology.The RC twin data are insufficient to allow for meaningful conclusions. There are suggestionsof at least local down-hole contamination of gold values, consistent with observationsdiscussed in Section 12.4. It is noteworthy that the more recent RC holes demonstrate lesscontamination than the older holes, a relationship that implies ever-increasing vigilance withrespect to drilling hygiene on the part of the operators.

Fronteer Development Group Inc.Technical Report, Northumberland Project: Resource Update 2008 Page 77
CBL NI43-101_NorthumberlandResource_2008.07.28.doc July 28, 2008
Figure 14.13 Down-Hole Gold Grade Plots of RC-Rotary and RC-RC Twin Sets
Twin Hole Au ValuesNC316 (Rotary) vs NW1106 (RC)
0
0.02
0.04
0.06
0.08
0.1
0.12
0.14
0 50 100 150 200 250 300Feet Down-the-Hole
ozA
u/to
n NC316
NW1106
120-300 ftMean Median
NC316 0.021 0.010NW1106 0.016 0.011
Horizontal collar offsetis 16.7ft
(a)
Twin Hole Au ValuesNC494 (Rotary) vs NW0925 (RC)[65ft added to NW0925 down-the-hole depths]
0
0.05
0.1
0.15
0.2
0.25
50 70 90 110 130 150 170 190 210Feet Down-the-Hole
ozA
u/to
n NC494
NW0925
"80-200" ftMean Median
NC494 0.053 0.028NW0925 0.038 0.009
Horizontal collar offsetis 14ft
(b)
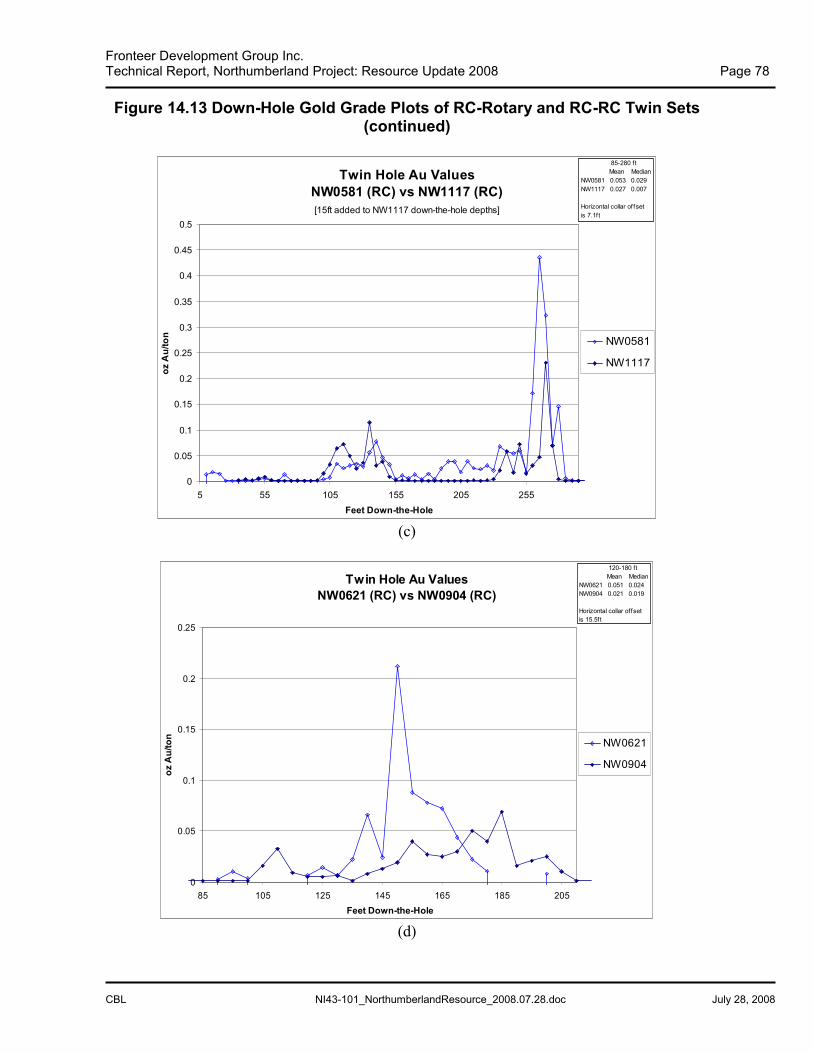
Fronteer Development Group Inc.Technical Report, Northumberland Project: Resource Update 2008 Page 78
CBL NI43-101_NorthumberlandResource_2008.07.28.doc July 28, 2008
Figure 14.13 Down-Hole Gold Grade Plots of RC-Rotary and RC-RC Twin Sets(continued)
Twin Hole Au ValuesNW0581 (RC) vs NW1117 (RC)[15ft added to NW1117 down-the-hole depths]
0
0.05
0.1
0.15
0.2
0.25
0.3
0.35
0.4
0.45
0.5
5 55 105 155 205 255Feet Down-the-Hole
ozA
u/to
n NW0581
NW1117
85-280 ftMean Median
NW0581 0.053 0.029NW1117 0.027 0.007
Horizontal collar offsetis 7.1ft
(c)
Twin Hole Au ValuesNW0621 (RC) vs NW0904 (RC)
0
0.05
0.1
0.15
0.2
0.25
85 105 125 145 165 185 205Feet Down-the-Hole
ozA
u/to
n NW0621
NW0904
120-180 ftMean Median
NW0621 0.051 0.024NW0904 0.021 0.019
Horizontal collar offsetis 15.5ft
(d)

Fronteer Development Group Inc.Technical Report, Northumberland Project: Resource Update 2008 Page 79
CBL NI43-101_NorthumberlandResource_2008.07.28.doc July 28, 2008
14.3 Assays Removed From Database
As discussed in Section 11, entire series of older drill holes have been removed from thedatabase due to sample quality and assay reliability issues. Other assays have been removedduring the mineral domain modeling discussed in Section 17 due to suspected down-holecontamination (see Section 12.4).

Fronteer Development Group Inc.Technical Report, Northumberland Project: Resource Update 2008 Page 80
CBL NI43-101_NorthumberlandResource_2008.07.28.doc July 28, 2008
15.0 ADJACENT PROPERTIES
No properties adjacent to Northumberland are discussed in this report. Northumberland is aproperty of merit on its own and needs no additional support from properties.

Fronteer Development Group Inc.Technical Report, Northumberland Project: Resource Update 2008 Page 81
CBL NI43-101_NorthumberlandResource_2008.07.28.doc July 28, 2008
16.0 MINERAL PROCESSING AND METALLURGICAL TESTING
Historic gold production by Cyprus and WSMC from over seven million tons of ore utilizedheap leaching of sized and run-of-mine oxide and semi-refractory ore. Gold recovery foroxide ore has been estimated at approximately 75% (Fiddler, 2003). Although a significanttonnage of the resources reported in Section 17 are categorized as oxide, the bulk of theresources are unoxidized (refractory) to partially oxidized (semi-refractory) and necessitateoxidation prior to cyanidation. Diagnostic metallurgical testing to date indicates that the bestextraction of gold and silver from sulfide material can be achieved utilizing N2TEC flotationtechnology of Newmont, which yielded recoveries in excess of 92% for both gold and silverin the mineralized material tested.
Due to the historic nature of much of the metallurgical data, Fronteer cannot definitivelycomment on the representivity of the samples used in each of the tests summarized below.Fronteer believes, however, that the test results can reasonably be used in the choice of theminimum cutoff grades applied to the resources discussed in Section 17.
16.1 Gold Recoveries from Mining Operations at Northumberland
Oxide ore, mainly from the Main and States deposits, was processed using cyanide leachingfrom 1939 to 1942 by the NMC, followed in 1981 to 1985 by Cyprus, and then in 1986through 1990 by WSMC. NMC operated an all-sliming cyanide plant with a capacity ofapproximately 200 tons per day (Wark, 1943). Cyprus crushed ore to minus-½ inch at theUpper Site and hauled the crushed ore by truck to the Lower Site, which included heaps andan adsorption-desorption-recovery (“ADR”) plant. The pregnant solution produced from theheaps was passed through activated-carbon columns, pressure stripped, and dore wasproduced from the solution by electrowinning. WSMC used essentially the same process,except heaps of run-of mine ore and the ADR plant were located at the Upper Site, whichgreatly reduced the hauling distance. Otherwise, WSMC’s operations were essentially acontinuation of the operations of Cyprus.
Prior to a production decision, Cyprus completed a test heap-leach program in 1978 (Kappes,1979). The program consisted of mining and leaching mineralized material on two heaps; oneheap was composed of 1,440 tons of crushed material from the Main deposit and the otherconsisted of 2,200 tons of ripped material from what is now referred to as the States deposit.The field tests indicated that gold recovery from crushed States deposit ore might be 75% to80% with 90 days of leaching, and 61% with 80 days of leaching for Main deposit ore.
Actual gold recoveries from the commercial mining operations of Cyprus and WSMC wereestimated by Fiddler (2003) using the average grade of the leached heaps as determined by a2003 heap drilling program, the ounces produced and sold, and the tons delivered to the heapsbased on production records. Ore mined by Cyprus from both the States and Main depositswent to the heap at the Lower Site. Estimated actual gold recovery for this heap is 75%,which is comparable to the test-heap predicted recoveries. Ore mined by WSMC was run-of-mine and was leached at the mine site in four separate heaps. Estimated actual gold recoveryfor these heaps is 50%. This lower recovery may be more related to an increase in partially

Fronteer Development Group Inc.Technical Report, Northumberland Project: Resource Update 2008 Page 82
CBL NI43-101_NorthumberlandResource_2008.07.28.doc July 28, 2008
oxidized material encountered below the oxide ore mined by Cyprus than to the difference inCyprus’ sized ore verses WSMC’s run-of-mine ore.
Low gold recoveries caused the cessation of mining in 1990. This, along with the discoveryof significant sulfide resources at about the same time, resulted in the initiation of preliminarygeometallurgical studies and diagnostic metallurgical testing needed to establish a process totreat the semi-refractory and the newly discovered sulfide mineralization. A significanttonnage of oxide material remains in all deposits except Zanzibar, South Ridge, andRockwell. This remaining oxide mineralization is expected to behave similarly to thehistorically processed oxide ore.
16.2 Geo-Metallurgical Studies
Drill-sample lithologies, percent of oxidation, percent of sulfide, carbon content (0-3 scale),and percent of clay from drill logs were compared to the corresponding cyanide-soluble/fire-assay gold ratios in order to obtain a geologic framework from which to understand themetallurgical characteristics of the Northumberland mineralization (Lanier, 1990). The ratiois considered an indicator of the amenability of the mineralized material to direct cyanidation(leachability). The analysis of the Wedge-Shaped deposit, which was studied in its entirety,and contains mineralization representative of all oxidation stages present at Northumberland,showed that oxidation and lithology are the two variables that have the largest effect onleachability. As a generalization, samples with more complete oxidation have higher ratios.The effect of lithology is demonstrated by unique population distributions for intrusive andsedimentary rocks. The study also showed that there is no apparent relationship betweengrade and leachability, and that there is not an association between visible carbon and lowcyanide-soluble/fire-assay gold ratios.
16.3 Metallurgical Testing
A number of metallurgical tests have been conducted on mineralized sulfide samples andmixed sulfide/oxide samples, some of the more important of which are summarized below. Adetailed presentation of all testing completed to date is beyond the scope of this report.Metallurgical testing completed to date indicates that the N2TEC flotation technology is themost promising method to achieve a viable processing option for the sulfide mineralization atNorthumberland.
Dawson Metallurgical Laboratories (“Dawson”; 1990). Dawson performed non-optimized,pre-oxidation diagnostic testing on 11 gold-bearing drill-hole samples from 11 RC holes(Thompson, 1990). The samples were selected to represent refractory and semi-refractorymaterial from the Zanzibar (NW1027 and NW1029), South Ridge (NW1007 and NW1009),States (NW953, NW1009, and NW1025), and Chipmunk (NW959, NW1001, and NW1005)deposits. Each composite sample was stage crushed to 20 mesh using a parallel-rolls crusherin closed circuit with a vibrating screen. Head grades were established for fire-assay Au andAg, cyanide-soluble Au and Ag, total and sulfide sulfur, and total and organic carbon.Specific tests included whole-sample cyanidation; gravity concentration followed by bulksulfide flotation with flotation tailings cyanidation; alkaline pre-oxidation with Na2CO3,NaOCl, and air followed by cyanidation; pre-acidification with H2SO4 followed by

Fronteer Development Group Inc.Technical Report, Northumberland Project: Resource Update 2008 Page 83
CBL NI43-101_NorthumberlandResource_2008.07.28.doc July 28, 2008
cyanidation; and pre-acidification followed by acid autoclaving with cyanidation of theautoclaved solids.
Average indicated extractions from these tests are as follows: whole-sample cyanidation -40.7%, pre-acidification followed by cyanidation - 44.3%, gravity concentration followed bybulk sulfide flotation with tailing cyanidation - 46.9%, alkaline chlorination pre-oxidationfollowed by cyanidation - 68.0%, and pre-acidification followed by acid autoclaving followedby cyanidation - 81.0%. High cyanide consumption of up to 33 lbs/ton of material tested wasobserved during cyanidation of the alkaline chlorination pre-oxidized samples. High acidrequirements were calculated for most of the samples tested in the acid autoclaving followedby cyanidation samples. Results indicated that the refractory nature of the material is mainlydue to sulfide association. Gold extraction by cyanidation increased significantly aftersulfides were oxidized by acid autoclaving in all but one sample, whose poor extraction wasattributed to carbonaceous material that was not oxidized by acid autoclaving.
Western States Minerals Corporation (1991). WSMC (Kuipers, 1991) developed and directeda metallurgical study to analyze mineralogy, elemental content, response to diagnosticleaching, cyanidation amenability, and physical beneficiation by flotation and other methods.Microscopy of mineralized samples was conducted by Russ Honea; Resource DevelopmentInc. and International Process Research Inc., both of Denver, Colorado, conductedmetallurgical tests. The study used seven composited samples from 37 RC holes and 420five-ft assay intervals chosen to represent the Main (composite M), South Ridge (S),Chipmunk (A, B, and I), and Zanzibar (Z and ND) deposits. The ND composite was derivedfrom a deeper portion of the Zanzibar deposit than the Z composite. Samples were reduced tosix mesh in a gyratory crusher and thoroughly blended into the composites.
The test procedure entailed “cyanidation leaching of a sample, ground to 80% -200 mesh toremove and recover non-refractory gold naturally existing in a ‘free milling’ state. Followingthis the sample is subjected to a hydrochloric acid leach, which should decompose oxides andhydroxides (i.e., hematite, goethite, etc.), the sulfide pyrrhotite, and carbonates such asdolomite and calcite. Following this acid leach the sample is again cyanidation leached toremove and recover any gold that is ‘free’ due to the decomposition of related materials. Theprocedure is repeated with nitric acid leach to decompose any remaining sulfides such aspyrite and arsenopyrite, followed by cyanidation, after which the sample is roasted to destroyany organic carbonaceous mineralization, again followed by cyanidation. Finally the sampleis screened, and the various size fractions assayed to determine the distribution of theremaining encapsulated gold and gold associated minerals which did not yield to thedecomposition and leaching processes” (Kuiper, 1991).
The main conclusions of the study were as follows (Kuiper, 1991):• Gold occurs as micron- to sub-micron-size particles of metallic gold intimately
associated with sulfides, occasionally in association with oxidized sulfide minerals,and rarely as free particles.
• The occurrence of gold is highly consistent throughout the deposits. Differences incyanide leachability are mostly due to the degree of oxidation and silicification. 10%to 20% of the gold was not recoverable in the South Ridge, Zanzibar, and Chipmunkintrusion-hosted mineralization tested due to apparent silica encapsulation.

Fronteer Development Group Inc.Technical Report, Northumberland Project: Resource Update 2008 Page 84
CBL NI43-101_NorthumberlandResource_2008.07.28.doc July 28, 2008
• The organic carbonaceous material is only slightly preg-robbing (absorbs goldpreferentially over the cyanide solutions) within the areas of higher-grademineralization. The organic carbonaceous material does not contain gold of highergrade than the rock itself and can be fairly efficiently removed by flotation, if desired.
• Flotation tests indicated that the gold-bearing mineralization can be effectivelyconcentrated by flotation methods.
• The South Ridge and Zanzibar deposits are highly refractory and require completepre-oxidation of sulfide and carbonaceous components to yield economic processrecoveries. Roasting is probably the most applicable pre-oxidation process to followpre-concentration by flotation.
• The Main deposit, along with unoxidized ores and some intrusive rocks from portionsof the Chipmunk deposit, exhibit semi-refractory characteristics. Tests showed that anappreciable quantity of the gold (40-70%) is amenable to cyanidation without pre-oxidation. The remainder of the gold is associated with sulfides that require pre-oxidation.
• Oxidized rock from the Chipmunk deposit exhibits no significant refractorycharacteristics and is likely amenable to cyanidation by heap leaching.
• A generalized sequential milling and processing flow sheet could begin with thecyanidation of easily recoverable oxides, progressing to the treatment of semi-refractory material, and eventually to highly refractory material.
• All of the deposits contain elevated concentrations of arsenic (255-3000 ppm), and theZanzibar deposit also contains elevated antimony (55 and 2100 ppm).
Kappes, Cassiday & Associates (“KCA”; 1993). Osmanson (1993) of Kappes, Cassidy &Associates of Sparks, Nevada ran 12 flotation tests on two composite samples of sulfidematerial, one from the Zanzibar deposit (the Z composite discussed above) and the other fromthe Chipmunk deposit (A composite, above), to optimize grind size, flotation pH, andcollector type and dosage. A total of 12 tests were performed using products ranging from44% +100 mesh to 100% -100 mesh (92.5% -325 mesh). Two variations were also tested thatexamined neutral to acid pH flotation, and one test examined pre-oxidation and carbon-in-leach (“CIL”) treatment.
The flotation tests concentrated from 28% to 62% of the gold. In search of an alternativetreatment method, the flotation tests were then followed by what KCA referred to as a“double-ox pre-oxidation test”. This test program consisted of a caustic dosage of 30 poundsper ton of sample at 80º C with a continuous air sparge for a period of 62 hours, followed bycarbon-in-leach (“CIL”) cyanidation. Oxidation of the sulfides appeared complete, but thedominance of a graphite froth led to the belief that CIL would fail due to preg robbing. Allpreg-robbing analyses failed to confirm this, however. Omanson (1993) concluded that thecarbon does not possess preg-robbing potential.
Dawson Metallurgical Laboratories (“Dawson”; 1996-1997). Dawson conducted a series ofdiagnostic tests in 1996 and 1997. The initial testing was conducted on a split-core samplefrom the Zanzibar deposit and compared the effect on cyanide leaching of crushing themineralized material using High Pressure Grinding Rolls (“HPGR”) with that of crushing themineralized material using a simulated Vertical Shaft Impact Crusher (“VSI”) (Allen, 1996a).

Fronteer Development Group Inc.Technical Report, Northumberland Project: Resource Update 2008 Page 85
CBL NI43-101_NorthumberlandResource_2008.07.28.doc July 28, 2008
In addition, a cursory test was performed to investigate whether recovery could be improvedby oxidation of the sulfides using a neutral pH autoclave test procedure. This latter test wasconducted because the use of acid autoclaving may not be practical due to high acidconsumptions. Test results indicated that only slightly improved gold extraction was obtainedafter crushing the sample using the HPGR crusher (56% extraction) compared withconventional crushing to minus ¼ inch or VSI crushing to minus 6 mesh (52% extraction).More fines were produced in the HPGR crush (32 weight-percent) than in the simulated VSIcrush (17 weight-percent) in the minus 100-mesh fraction with gold upgraded slightly in thisfraction. Results of an unoptimized neutral autoclaving test followed by CIL cyanideleaching yielded about 82% gold extraction.
Dawson then compared autoclave pretreatment followed by CIL cyanidation (Allen, 1996b).A direct CIL cyanide leach test on refractory material from the Zanzibar deposit extracted lessthan 2% of the gold and oxidized 8% of the sulfide sulfur. This test was followed by neutralautoclave tests on two different grind sizes, 80% minus 145 microns, and 80% minus 58microns. Gold extraction after cyanidation was 36% and 41%, with 29% and 32% of thesulfide sulfur oxidized for coarsely and finely ground samples, respectively. These tests werefollowed by acid autoclave of the fine grind material, which produced 88% extraction with98% of the sulfide sulfur being oxidized; net acid consumption was 350 lb/ton. These resultsindicate that gold extraction is proportional to the degree of sulfide oxidation and is notsignificantly related to grind-size (Allen, 1996b).
Finally, Dawson evaluated the effect of grind size on flotation response, with and without pre-float acid addition (Thompson, 1996). The purpose of the acid was to help liberate sulfidesfrom the carbonate gangue. The Zanzibar deposit sample was ground to achieve a fineness of80% minus 132 microns, 80% minus 63 microns, and 80% minus 58 microns. Standard bulk-sulfide flotation procedures were used. Flotation at the lower grind fineness recovered about55% of the gold into a combined rougher concentrate. Three stages of collector addition andflotation were used. The concentrate contained about 15% of the sample weight and assayed0.533 oz Au/ton and only 5.5% sulfide sulfur. When the fineness was increased to the nextstep, gold recovery increased to nearly 61% from a 0.151 oz Au/ton back-calculated headgrade. Further increasing the grind fineness did not result in any significant improvement ineither gold or sulfide-sulfur recovery. Results from a bulk sulfide flotation test on a sampleground to 80% minus 63 microns with acid conditioning indicated that with 20 or 50 lb/tonsulfuric acid there was no increase in gold recovery from the sample after three stages ofrougher flotation. A slight increase in recovery to about 67% occurred when a fourth stage ofrougher flotation was added to the test with 50 lb/ton sulfuric acid. These flotation testsresulted in relatively low sulfide and gold recoveries, and low concentrate grades. Dawsonconcluded that the low recovery is mainly due to the very fine sulfide-grain structure and tothe fact that the sulfide is well disseminated throughout the gangue.
Roasting the Zanzibar sample ground to 80% minus 145 microns resulted in the oxidation ofover 98% of the sulfide. About 61% of the gold was extracted from this roasted sample byCIL. Although roasting oxidized about the same percentage of the sulfide as the acidautoclave test described above, gold leach extraction was higher in the acid autoclave test.

Fronteer Development Group Inc.Technical Report, Northumberland Project: Resource Update 2008 Page 86
CBL NI43-101_NorthumberlandResource_2008.07.28.doc July 28, 2008
Geobiotics, Inc. (“Geobiotics”; 1996). Preliminary bio-oxidation tests on samples from theZanzibar deposit were conducted by Geobiotics, Inc. (Rollin, 1996). The work indicated thatthe samples contained about 20 weight-percent carbonate and were therefore high acidconsumers. Geobiotics concluded that an overall gold recovery of about 90% could beachieved with moderate operating cost in a process where the needed acid would be producedby bio-oxidation of the sample material when blended with a high-sulfide material.
The bio-oxidation test results are considered by WSMC, MDA and Fronteer to beinconclusive.
Hazen Research, Inc. (1996). Tests using Newmont’s proprietary N2TEC flotationtechnology were conducted on two refractory samples from the Zanzibar deposit by HazenResearch, Inc. (Oberg, 1996). The N2TEC flotation technology was originally developed bySanta Fe Pacific Gold Corporation, who was subsequently acquired by Newmont. The twotest samples consisted of drill-sample composites from holes drilled in the Zanzibar deposit.Sample #1 was a composite of 46 intervals from holes NW1029, NW1080, NW1081,NW1082A, NW1085, and NW1114. Sample #2 was a composite of 16 intervals of RobertsMountains Formation and two intervals of intrusive rock from core hole NW1086A. Eachsample weighed approximately three kilograms.
Bench-scale rougher concentrates extracted 92.9% and 92.0% of the gold and 98.5% and96.3% of the silver in the two samples (Table 16.1). Following cyanidation, the flotation tailsprovided an additional 2 to 3% extraction of the gold. Organic carbon concentrations of0.99% and 0.34% were obtained, which was considered to be a significant additionalrefractory component of the two samples. Using conventional flotation with comparableoperating conditions, gold extraction was only 77.0% (Oberg, 1996).
Table 16.1 Summary of N2TEC Flotation Testing on Northumberland Samples(From Hanson, 1996)
Type Calc. Head(oz Au/ton)
Residue(oz
Au/ton)
CombinedConcentrate(weight %)
GoldRecovery
(%)
SilverRecovery
(%)
Total SulfurRecovery
(%)Sample #1 0.126 0.013 33.5% 92.9% 98.5% 91.5%Sample #2 0.145 0.015 22.7% 92.0% 96.3% 94.3%
Note: Test work performed by Hazen Research, Inc. using proprietary technology of Newmont
The test results were considered promising, with experience in pilot plant operations withsimilar feed types indicating that the rougher concentrate weight might be reduced with only aminor loss of gold recovery (Hanson, 1996). Preliminary indications are that a 200-meshgrind is sufficient to liberate the submicron-size gold particles.
Newmont (2004). Composite samples of coarse rejects from four mineralized intervals inthree Newmont 2004 RC holes drilled in the Zanzibar deposit and one RC composite from2004 RC holes in the Main deposit were submitted to the metallurgical laboratory atNewmont’s Lone Tree mine for flotation testing (Lauha and Powell, 2004c; 2004e). Directcyanide leaching, roasting, and autoclaving were performed on a composite of all of thesamples, and flotation tests were conducted on the individual intervals (Lauha and Powell,

Fronteer Development Group Inc.Technical Report, Northumberland Project: Resource Update 2008 Page 87
CBL NI43-101_NorthumberlandResource_2008.07.28.doc July 28, 2008
2004c). Newmont stated that “typical roaster recoveries were around 60%, with flotationrecovery near 70%, but autoclave recovery achieved over 80% recovery” and concluded that“due to the high organic carbon and the preg-robbing characteristics of some Northumberlandores, roasting initially appeared to be the process of choice based on head assays and preg-robtests. However, the autoclave followed by cyanide leach achieved the highest recovery.These results are validated by test work performed in the early 1990s. Typical roasterrecoveries were around 60%, with flotation recovery near 70%, but autoclave recoveryachieved over 80% recovery. The overall best recovery was achieved by using the N2TECprocess at the Denver lab in 1996. Gold recovery was 92.4% average. This technology wasnot exactly duplicated at Lone Tree; however, further testing of Northumberlandmineralization may be necessary to determine if the recovery can be improved to match the1996 work” (House, 2004).
Newmont (2006-2007). Composite samples of oxide mineralization from 2006 core holesNN-60, NN-61, and NN-74 were studied by Newmont’s Carlin Metallurgical Laboratory todetermine the amenability of the gold to cyanide leaching (Eyzaguirre, 2007). The studyincluded head assays, screen-fraction analysis at -1 inch, -10 mesh, and -200 mesh, standardcyanidation bottle-roll tests without charcoal addition at the three different size fractions, andcolumn cyanide-leach tests performed on each composite of -1 inch agglomerated sample.Eyzaguirre’s conclusions of the study are summarized as follows:
• The size fraction analysis showed homogeneous distribution of gold contentsthroughout all size fractions of the composites.
• Low values of mercury and relatively high values of arsenic should be consideredwhen identifying final design of a flow sheet for the deposit.
• The Northumberland samples responded well to the fine-grind standard bottle-roll testprocedure. The percent measured gold extractions for the three samples ranged from78% to 85%.
• Drill hole NN-74 did not perform well in the -1 inch column and bottle roll tests. Thisis attributed to silicification of that sample. However, in view of the increasedrecoveries obtained in the bottle roll tests at finer grinds, and considering this is thehighest-grade sample, milling of the material should be evaluated.
• Average reagent additions required to achieve gold extractions from the oxide samplesare within acceptable limits.
• There are very small indications of preg-robbing effects in the three drill-hole samples.• NCV values are all within positive ranges and indicate no signs of potential acid
generation.• Overall, and based on the samples studied, the oxide zone of the Northumberland
deposit would qualify as a good heap-leach candidate.

Fronteer Development Group Inc.Technical Report, Northumberland Project: Resource Update 2008 Page 88
CBL NI43-101_NorthumberlandResource_2008.07.28.doc July 28, 2008
17.0 MINERAL RESOURCE ESTIMATE
The Mineral Resource Estimate for the Northumberland deposit has been updated to includenew drilling information that post-dates the previous independent estimate by MDA (Gustinet al., 2006). The new drilling information includes 89 new drill holes (69 RC, 20 Core),drilled by Newmont under the Northumberland JV, mostly within the extents of the 2006resource area.
Mineral resource estimation reported for Northumberland follows the guidelines of CanadianNational Instrument 43-101. The modeling and estimate of gold and silver resources weredone by Fronteer personnel under the guidance of Christopher Lee, Fronteer ChiefGeoscientist and Jim Ashton, Fronteer Senior Engineer, both of whom are consideredQualified Persons by the definitions and criteria set forth in NI 43-101.
17.1 Drill Hole Data
Cyprus compiled a digital database of the Northumberland drill data in 1984. This databasewas acquired by WSMC in 1985 as part of the acquisition of the property. WSMC, NewWestand Newmont subsequently and continually updated and refined the database. The databaseused in the estimation of gold and silver Mineral Resources at Northumberland, which wascompleted in May 2008, contains assay and geological information for 1,502 drill holes,including the 89 new Newmont holes drilled from 2005 through 2007. Digital topography ofthe post-mining surface was used in the modeling with all waste dumps and heaps uniquelyidentified.
17.2 Deposit Geology Pertinent to Mineral Resource Estimation
Gold and silver mineralization at Northumberland occurs in a cluster of eight generallystratiform deposits that follow three low-angle tectono-stratigraphic host horizons: the HansonCreek fault, Basal Chert and Prospect-Mormon thrust horizons (see Section 7 for detailsbeyond those summarized here). These horizons define the crest and west limb of theNorthumberland anticline. The Rockwell, Pad 4, Wedge-Shaped, Chipmunk, and SouthRidge deposits occur along the Hanson Creek fault horizon. The Rockwell deposit is spatiallydistinct and lies within the west limb of the anticline, while the other Hanson Creek horizondeposits lie along the crest of the anticline and partially merge with each other. The BasalChert fault horizon hosts the States and Main deposits, which lie in the crest of the anticlineand also merge near their extremities. The Zanzibar deposit occurs along the Prospect-Mormon thrust horizon near the crest and within the west limb of the anticline.Mineralization in each of the tectono-stratigraphic horizons locally breaches the interveningrock units and merges with mineralization in the neighboring host horizon. The overallgeometry of the deposits and the higher-grade zones within the deposits appear to beinfluenced by east-trending high-angle structures in the area of the crest of theNorthumberland anticline. The deposits are relatively laterally extensive and verticallyrestricted.
Small folds with northeast- to east-trending axial planes are superimposed on theNorthumberland anticline. Two such anticlinal-synclinal sets cause significant variations in

Fronteer Development Group Inc.Technical Report, Northumberland Project: Resource Update 2008 Page 89
CBL NI43-101_NorthumberlandResource_2008.07.28.doc July 28, 2008
the orientations of the host horizons near the crest of the larger anticline. An attempt wasmade to simplify this corrugated layer-cake geometry to aid in the estimation process (Table17.1); however, the degree of minor folding in the deposit is such that an impractical amountof sub-domaining would be required to adequately represent the deposit. For this reason, thecurrent estimate used an ‘Unwrinkling’ process in Gemcom software (described below),which transforms the deposit into a flat plane to facilitate seamless interpolation across foldhinges. Each deposit was grouped into one of three ‘Resource Layers’, corresponding to theirstratigraphic position within the deposit, for the unwrinkling transformation (Table 17.1).
Table 17.1 Simplified Orientations of Geological Domains
Deposit Domain Code Dip Dip Direction Stratigraphic Horizon Resource LayerChipmunk CHP 100 0 0 Hanson Creek Fault Layer 3
CHP_DIP 101 -20 160Main MAN 200 0 0 Basal Chert Layer 2
MAN_DIP 201 -20 90Pad 4 PD4 300 0 0 Hanson Creek Fault Layer 3Rockwell RKW 400 -15 270 Hanson Creek Fault Layer 3
RKW_DIP 401 -50 285States STA 500 0 0 Basal Chert Layer 2
STA_DIP 501 -20 305Zanzibar ZAN 600 0 0 Prospect-Mormon Thrust Layer 1
ZAN_DIP 601 -30 250ZAN_DIP2 602 -45 255
Interpretation of the sectional geology was completed and updated with the new drilling. Thegeology focused on defining the stratigraphic units, the intrusive rocks and thestructural/stratigraphic contacts between the stratigraphic units. The geological interpretationwas prepared by hand on paper sections and then digitized, and imported into Gemcom aspolygons. These polygons are located in the database under the GeopolyA workspace and theLitholog layer group. These polygons were used as a general guide for the grade modelingdescribed below.
17.3 Grade Modeling
The gold grade distributions for the drill-hole assays were examined collectively and bydeposit groupings (e.g., Zanzibar and Rockwell; Chipmunk, South Ridge, Pad 4, and Wedge-shaped; etc.) in order to identify grade population characteristics. The entire Northumberlanddatabase was found not to be significantly different from the deposit groupings examined, andthe distribution of all of the assays was therefore used to determine natural population breaks(Figure 17.1).
The gold distribution curve is for the most part curvilinear, with distinct breaks at about 0.3and 0.6 oz Au/ton. More subtle breaks are discernable at about 0.007, 0.02, 0.04, and 0.09 ozAu/ton. To be consistent with the previous MDA 2006 estimate, grade envelopes werecreated at a 0.007 opt composite and at a 0.040 opt composite, as a subset of the 0.007 gradeenvelope.

Fronteer Development Group Inc.Technical Report, Northumberland Project: Resource Update 2008 Page 90
CBL NI43-101_NorthumberlandResource_2008.07.28.doc July 28, 2008
Grade envelopes were constructed by Ross Sherlock, under the supervision of ChristopherLee. Two sets of envelopes were created: a coarse “grade envelope” (0.007 opt) and a highergrade internal “grade subset” (0.04 opt). The grade envelope was constructed on sectionsusing a composite grade of 0.007 opt (0.24 g/t) gold and allowing 10 feet (3.05 m) of internaldilution. The grade envelopes were constructed following the general trend of the stratigraphyand centered over structural/ stratigraphic intervals. The composite intervals were used onlyas a guide, incorporating intervals of lower or null grade if it allowed for continuity of thezones and the geology was consistent. Grade envelopes were only constructed if the zonescould be identified with confidence over more than 4 sections with more than two drill holesper section.
The higher grade subsets were constructed internal to the grade envelopes. These solids wereconstructed if a higher grade portion of the grade envelope could be identified withconfidence over at least 3 sections with at least two drill holes per section. The higher gradesubsets were constructed around a 0.04 opt (1.37 g/t) gold composite allowing for 5 feet (1.53m) of internal dilution. Lower or null grade intervals were not incorporated into the gradesubset solids.
Figure 17.1 Quantile Plot of Northumberland Au Sample Data

Fronteer Development Group Inc.Technical Report, Northumberland Project: Resource Update 2008 Page 91
CBL NI43-101_NorthumberlandResource_2008.07.28.doc July 28, 2008
In general, the zones follow the stratigraphy and the polygons as previously interpreted byGustin et al., (2006). The main difference in this model and the previous 2006 resourceestimate is that this model created a 3D wire frame of the grade envelopes with strongcontinuity between sections. These wireframes represent geologic interpretations of themineralized bodies, with strong sectional continuity, whereas the previous 2006 resource wasa grade contour without strong sectional continuity. The greater continuity in the currentmodel was achieved by smoothing the grade shapes, relative to previous interpretation, andinterpolating between sections on the basis of geological continuity. As such, there is muchgreater geological confidence in the shape and extent of the mineralized domains in 3D space.Table 17.2 outlines the various parameters of the solids created, including file names andworkspaces within the database.
Grade envelopes were constructed on north south sections spaced at 100 feet for Rockwelland Zanzibar and 50 feet for the remaining deposits. As there has been historic mining anumber of drill hole collars are located in space where the deposits have been previouslymined out. The geologic interpretation, including the grade envelopes were interpreted abovethe existing topography. This will allow for the resource estimate to be extended intopreviously mined material and allowing reconciliation between the resource estimate and theproduction statistics.
The nomenclature of the Northumberland deposit is driven to some extent by historicaluseage. In this iteration of the resource model the same names were used whenever possible.However, local continuity between the different deposit areas makes some of the boundariesfairly arbitrary and the current wireframe solids locally cross historic boundaries. Forexample, Zanzibar – States and Main deposits are, in places, located at the same structural-stratigraphic interval and the naming of the solid, in this model, may not correspond exactly toprevious work. Wherever possible the names correspond, however there may be somediscrepancies when compared with previous models. This has no impact on the distribution orvolume of mineralized material.
Silver exhibits a strong spatial association with gold, with most of the known silvermineralization occurring within or adjacent to the gold mineralized horizons described above.Outside of these gold envelopes, silver occurs in two modes. Discrete zones of higher grade(+100g/t Ag), which have an unknown geometry and controls on mineralization. Outside ofthe discrete higher grade zones are long intervals of low grade (< 20 g/t Ag). The controlsand geometry of this mineralization is also unknown, and despite their strong spatialcorrelation within the gold domains, gold and silver do not show any direct statisticalcorrelation (Figure 17.3). Since the controls on both styles of mineralization are unknown,the silver mineralization was not explicitly modeled. Silver occurring outside these goldenvelopes is considered to be volumetrically negligible.

Fronteer Development Group Inc.Technical Report, Northumberland Project: Resource Update 2008 Page 92
CBL NI43-101_NorthumberlandResource_2008.07.28.doc July 28, 2008
Table 17.2 Grade Envelopes Used in Resource Estimation

Fronteer Development Group Inc.Technical Report, Northumberland Project: Resource Update 2008 Page 93
CBL NI43-101_NorthumberlandResource_2008.07.28.doc July 28, 2008
Figure 17.2 Section 445200E illustrating the relationships between stratigraphy,thrust faults (dashed lines) and grade envelopes.

Fronteer Development Group Inc.Technical Report, Northumberland Project: Resource Update 2008 Page 94
CBL NI43-101_NorthumberlandResource_2008.07.28.doc July 28, 2008
Figure 17.3 Scattergram Showing Lack of Correlation Between Gold and Silver
1
10
100
1000
1 10 100
Au (g/t)
Ag
(g/t)
17.4 Assay Data
The Northumberland database contains assay data from five different operators and fourdifferent drill types. These data have been compared here by drill type and operator to assesstheir compatibility and suitability for resource estimation. Assaying for silver was inconsistentamong the different operators, so these comparisons only consider the gold assay data.
Three operators used Rotary drilling: Cyprus, Homestake and Idaho Mining. Assay resultsfrom Idaho Mining and Cyprus compare well; however, the Homestake assays aresignificantly lower (Figure 17.4). The differences between the three data populations areparticularly evident in Q-Q plots (Figure 17.5). Idaho Mining assays tend to be slightly higherthan the Cyprus assays over most of their grade ranges; however, the lower grade Homestakedata are clearly not compatible with the others. Homestake Rotary drill hole data are thereforeconsidered unreliable and were not used for the purpose of resource estimation. There areonly 11 Homestake drill holes and 29 assays above 0 g/t Au, so their omission will not have asignificant impact on the resource estimate.

Fronteer Development Group Inc.Technical Report, Northumberland Project: Resource Update 2008 Page 95
CBL NI43-101_NorthumberlandResource_2008.07.28.doc July 28, 2008
Figure 17.4 Box & Whisker Plots Comparing Rotary Drilling by Operator
Figure 17.5 Q-Q Plots Comparing Rotary Drilling Results by Operator
Three operators used RC drilling: Cyprus, Newmont and WSMC. The Newmont data tends tobe slightly higher than the others, particularly in the grade range of interest, but much of theNorthumberland drilling focused on the higher grade Zanzibar deposit to the west of theshallower WSMC drilling. Considering this difference the Newmont data compare well withthe WSMC data (Figure 17.6 and Figure 17.7). On the other hand, Cyprus RC drill hole dataare significantly lower than both the Newmont and WSMC data. Cyprus used RC drillingonly to drill 2 pre-collars for core holes. Since their data don’t agree well with others in thegrade range of interest, and account for a negligible amount of data, the Cyrpus RC holeswere also rejected from the resource estimation database.
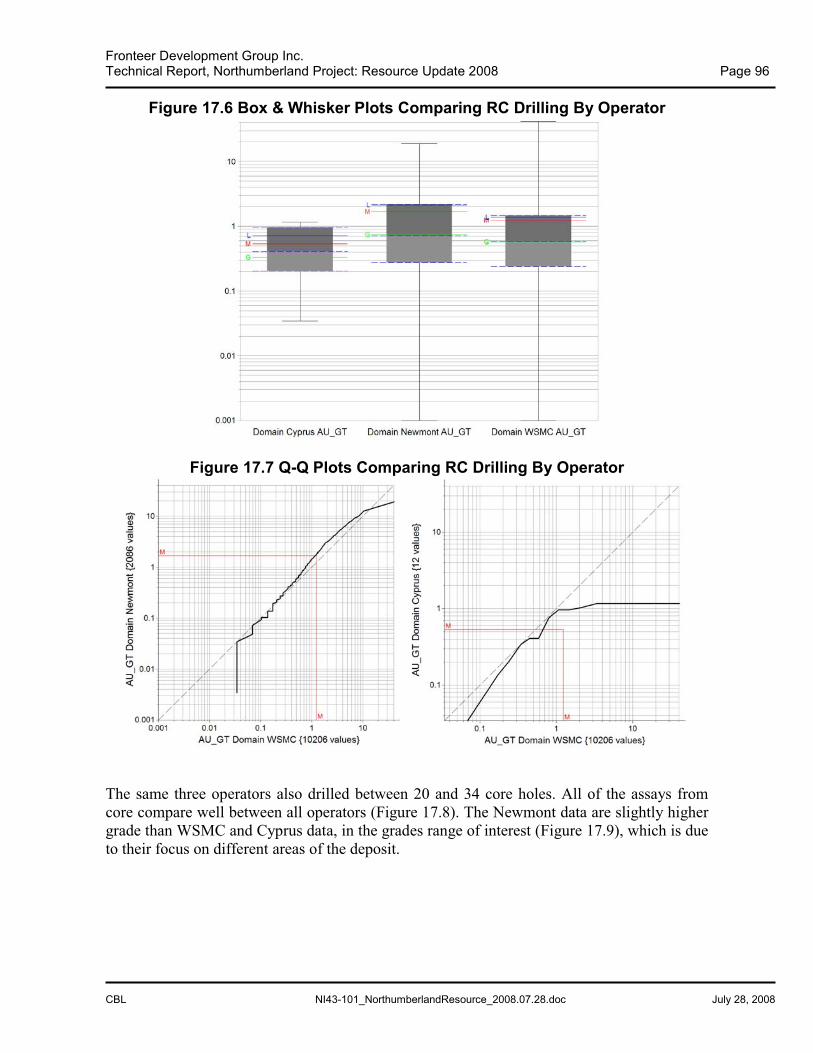
Fronteer Development Group Inc.Technical Report, Northumberland Project: Resource Update 2008 Page 96
CBL NI43-101_NorthumberlandResource_2008.07.28.doc July 28, 2008
Figure 17.6 Box & Whisker Plots Comparing RC Drilling By Operator
Figure 17.7 Q-Q Plots Comparing RC Drilling By Operator
The same three operators also drilled between 20 and 34 core holes. All of the assays fromcore compare well between all operators (Figure 17.8). The Newmont data are slightly highergrade than WSMC and Cyprus data, in the grades range of interest (Figure 17.9), which is dueto their focus on different areas of the deposit.

Fronteer Development Group Inc.Technical Report, Northumberland Project: Resource Update 2008 Page 97
CBL NI43-101_NorthumberlandResource_2008.07.28.doc July 28, 2008
Figure 17.8 Box & Whisker Plot Comparing Core Drilling By Operator
Figure 17.9 Q-Q Plots Comparing Core Drilling By Operator
Cyprus also conducted a small amount of Airtrack drilling. The resulting data compare wellwith Rotary drill holes, although slightly higher grade; whereas, Airtrack drilling issignificantly lower grade than core hole data (Figure 17.10). Considering that core assay datatends to be generally higher grade than other drill types, and Rotary drilling tends be generallylower grade, the Airtrack drilling appears to be in line with the median assay data populationand will be used regardless of the minor discrepancies.

Fronteer Development Group Inc.Technical Report, Northumberland Project: Resource Update 2008 Page 98
CBL NI43-101_NorthumberlandResource_2008.07.28.doc July 28, 2008
Figure 17.10 Q-Q Plots Comparing Drill Types by Cyprus
17.4.1 Model Data
A total of 17,148 gold assays and 15,365 silver assays were captured within the 3Dinterpreted grade envelopes (Figure 17.11). These data are largely dominated by RC drillingand data collected by WSMC. The higher grades in the Newmont data (Table 17.4) reflectdrilling in the western Zanzibar and Rockwell areas, and assays from core remain consistentlyhigher on average (Table 17.3).
Figure 17.11 Histograms Showing (a) Gold and (b) Silver Assays CapturedWithin Modeled Grade Envelopes
(a) (b)

Fronteer Development Group Inc.Technical Report, Northumberland Project: Resource Update 2008 Page 99
CBL NI43-101_NorthumberlandResource_2008.07.28.doc July 28, 2008
Table 17.3 Descriptive Statistics and Box Plots Showing Assay Data By DrillType
Unknown AirTrack Rotary RC CoreSamples 31 200 3,464 12,090 1,363
Mean 2.95 1.48 1.12 1.33 2.71Std Dev 8.19 2.27 1.92 1.93 3.99
Variance 67.01 5.15 3.68 3.71 15.92CV 2.77 1.53 1.72 1.45 1.47
Max 34.11 17.83 44.23 41.14 42.65Median 0.31 0.69 0.55 0.62 1.11
Min 0.03 0.03 0.03 0.01 0.01
Table 17.4 Descriptive Statistics and Box Plots Showing Assay Data ByOperator
Idaho Cyprus WSMC NewmontSamples 199 3,746 10,692 2,511
Mean 1.3 1.2 1.3 2.0Std Dev 1.6 2.3 2.1 2.7
Variance 2.7 5.4 4.2 7.1CV 1.2 1.9 1.6 1.3
Max 10.6 44.2 41.1 22.1Median 0.7 0.6 0.6 0.9
Min 0.0 0.0 0.0 0.0

Fronteer Development Group Inc.Technical Report, Northumberland Project: Resource Update 2008 Page 100
CBL NI43-101_NorthumberlandResource_2008.07.28.doc July 28, 2008
Summary statistics for each deposit and grade domain are shown in Table 17.5 and Table17.6. Mean gold values for each of the domains show the differences between the high andlow grade domains, supporting the consistency in the model interpretation of the gold values.A similar pattern can be seen in the silver data for some domains, albeit more subtle and lessconsistent. The Main, States and Zanzibar deposits have moderately higher silver grades thanthe rest of the deposits.
A notable characteristic of both the gold and the silver assay data is the remarkableconsistency in grade across the full range of the deposit, both in low and high grade domains.This strength of continuity is further supported by the variography, described below andpromotes a high degree of geological confidence to grade interpolation and extrapolation.
Table 17.5 Descriptive Statistics and Box Plots of Gold Assays by DomainPad 4
LG (100) HG (110) LG (200) HG (210) LG (300) LG (400) HG (410) LG (500) HG (510) LG (600) HG (610)
Samples 2,996 608 990 675 115 361 22 3,079 956 5,554 1,792Mean 1.0 3.0 0.8 3.1 0.7 1.3 5.4 0.7 2.6 0.8 3.7
Std Dev 1.5 3.5 1.8 3.6 0.8 2.2 10.5 0.9 3.0 1.1 3.2Variance 2.1 12.2 3.1 13.3 0.6 5.0 110.7 0.8 8.7 1.1 10.3
CV 1.4 1.2 2.2 1.2 1.0 1.8 1.9 1.3 1.1 1.4 0.9Max 19.3 41.1 38.7 44.2 5.4 14.2 34.1 10.3 42.7 13.5 35.8
Median 0.5 2.2 0.3 2.0 0.5 0.5 1.1 0.4 1.8 0.4 2.8Min 0.0 0.0 0.0 0.0 0.0 0.0 0.0 0.0 0.0 0.0 0.0
ZanzibarChipmunk Main Rockwell States

Fronteer Development Group Inc.Technical Report, Northumberland Project: Resource Update 2008 Page 101
CBL NI43-101_NorthumberlandResource_2008.07.28.doc July 28, 2008
Table 17.6 Descriptive Statistics and Box Plots of Silver Assays by DomainPad 4
LG (100) HG (110) LG (200) HG (210) LG (300) LG (400) HG (410) LG (500) HG (510) LG (600) HG (610)
Samples 2,910 574 963 656 115 269 22 3,039 942 4,873 1,442Mean 3.8 6.7 7.3 6.7 2.3 4.8 5.6 7.4 8.7 12.0 12.5
Std Dev 15.5 17.9 31.4 13.4 4.2 13.4 9.1 29.5 18.8 73.9 27.1Variance 239.1 320.6 985.2 179.6 17.5 178.8 82.8 873.1 353.5 5468.5 733.6
CV 4.0 2.7 4.3 2.0 1.8 2.8 1.6 4.0 2.2 6.1 2.2Max 422.1 255.8 541.7 137.1 27.4 187.0 29.8 784.8 266.4 2120.0 463.2
Median 1.4 3.8 1.7 3.4 1.0 1.5 2.4 2.1 4.1 2.1 5.3Min 0.0 0.0 0.0 0.0 0.0 0.0 0.0 0.0 0.0 0.0 0.0
Chipmunk Main Rockwell States Zanzibar
17.4.2 Comparison of Old vs New
The interpreted mineralized domains in the current model captured 2,107 assays from 77 ofthe new holes (18 core, 59 RC) drilled by Newmont between 2005 and 2007. The mean gradeof the new assays is considerably higher than the mean grade of the pre-existing data (Figure17.12(a) and (b), and Figure 17.13(a)). The bulk of the post-2006 MDA resource drillingtargeted the deeper Zanzibar and Rockwell deposits in the west. The differences are far lessmarked when old and new data are compared west of 445500 ft Easting only (Figure 17.12(c)and (d), and Figure 17.13(b)), demonstrating that the two datasets are comparable by location.
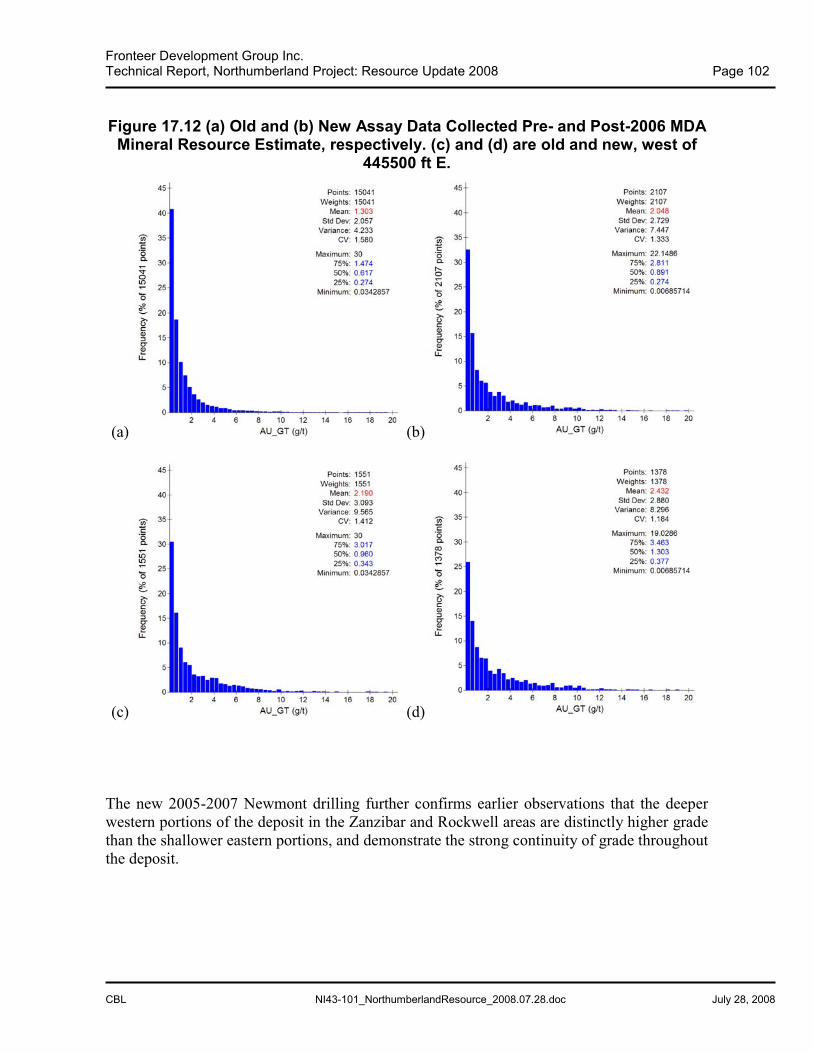
Fronteer Development Group Inc.Technical Report, Northumberland Project: Resource Update 2008 Page 102
CBL NI43-101_NorthumberlandResource_2008.07.28.doc July 28, 2008
Figure 17.12 (a) Old and (b) New Assay Data Collected Pre- and Post-2006 MDAMineral Resource Estimate, respectively. (c) and (d) are old and new, west of
445500 ft E.
(a) (b)
(c) (d)
The new 2005-2007 Newmont drilling further confirms earlier observations that the deeperwestern portions of the deposit in the Zanzibar and Rockwell areas are distinctly higher gradethan the shallower eastern portions, and demonstrate the strong continuity of grade throughoutthe deposit.
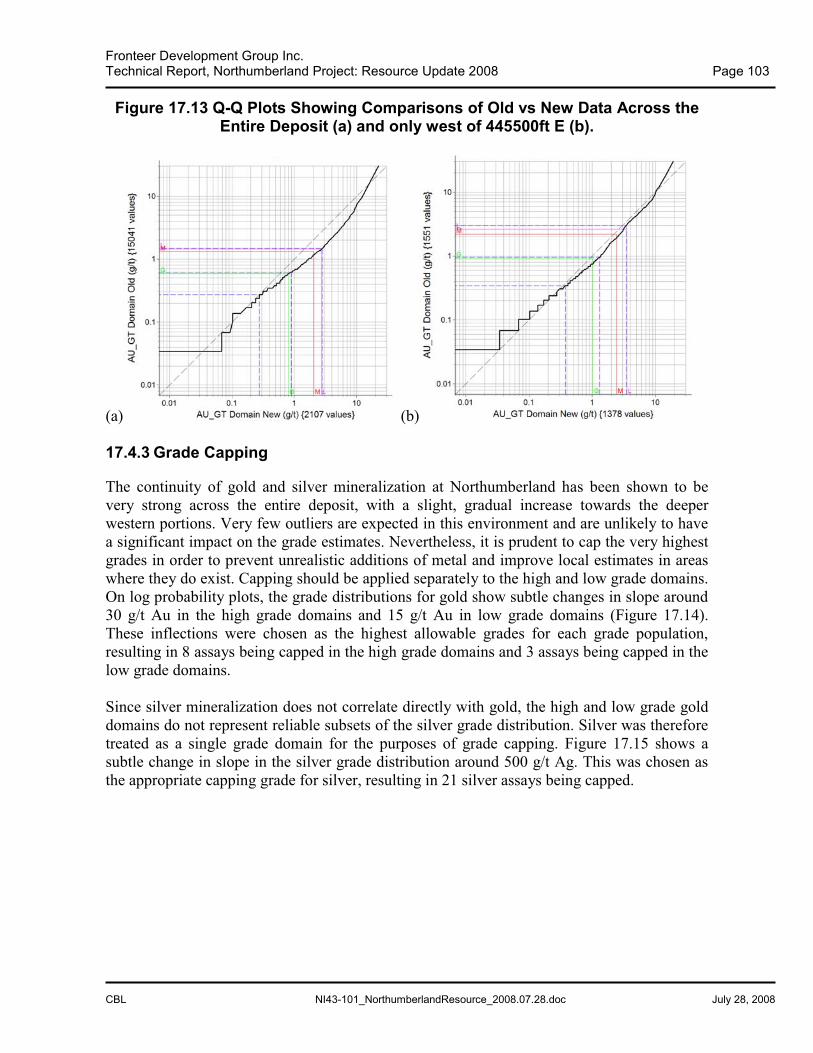
Fronteer Development Group Inc.Technical Report, Northumberland Project: Resource Update 2008 Page 103
CBL NI43-101_NorthumberlandResource_2008.07.28.doc July 28, 2008
Figure 17.13 Q-Q Plots Showing Comparisons of Old vs New Data Across theEntire Deposit (a) and only west of 445500ft E (b).
(a) (b)
17.4.3 Grade Capping
The continuity of gold and silver mineralization at Northumberland has been shown to bevery strong across the entire deposit, with a slight, gradual increase towards the deeperwestern portions. Very few outliers are expected in this environment and are unlikely to havea significant impact on the grade estimates. Nevertheless, it is prudent to cap the very highestgrades in order to prevent unrealistic additions of metal and improve local estimates in areaswhere they do exist. Capping should be applied separately to the high and low grade domains.On log probability plots, the grade distributions for gold show subtle changes in slope around30 g/t Au in the high grade domains and 15 g/t Au in low grade domains (Figure 17.14).These inflections were chosen as the highest allowable grades for each grade population,resulting in 8 assays being capped in the high grade domains and 3 assays being capped in thelow grade domains.
Since silver mineralization does not correlate directly with gold, the high and low grade golddomains do not represent reliable subsets of the silver grade distribution. Silver was thereforetreated as a single grade domain for the purposes of grade capping. Figure 17.15 shows asubtle change in slope in the silver grade distribution around 500 g/t Ag. This was chosen asthe appropriate capping grade for silver, resulting in 21 silver assays being capped.

Fronteer Development Group Inc.Technical Report, Northumberland Project: Resource Update 2008 Page 104
CBL NI43-101_NorthumberlandResource_2008.07.28.doc July 28, 2008
Figure 17.14 Log Probability Curves of Gold in High and Low Grade Domains
(a) (b)
Figure 17.15 Log Probability Curve for Silver Grades
Capping resulted in a negligible change in the mean gold grade, and moderate change in themean silver grade (Table 17.7).
Table 17.7 Descriptive Statistics for Raw and Capped Gold and Silver GradesAu Au capped % diff Ag Ag capped %diff
Mean 1.40 1.39 -0.38% 8.6 7.9 -7.98%Median 0.62 0.62 2.1 2.1Standard Deviation 2.23 2.15 45.6 29.7Sample Variance 4.96 4.64 2078.3 884.7Minimum 0.01 0.01 0.0 0.0Maximum 44.23 30.00 2120.0 500.0Number Capped 0 11 0 21Count 17,148 17,148 15,805 15,805

Fronteer Development Group Inc.Technical Report, Northumberland Project: Resource Update 2008 Page 105
CBL NI43-101_NorthumberlandResource_2008.07.28.doc July 28, 2008
17.4.4 Composites
The capped drill-hole assays were composited down-hole at 10-ft intervals and coded bymineral domain and deposit. Due to typically abrupt changes in grade across each of themineral domain envelopes, only assays from a particular mineral domain were used to createcomposites coded to that domain, and composites were cut to match domain boundaries.
A total of 11,435 composites were generated within the mineralized domains. Of these, 3,252composites (28%) are less than 10 feet in length and 1,579 (14%) are less than 5 feet long. Inorder to restrict undue weighting of smaller samples on the edges of the domain boundaries,the resource estimate was conducted using only those composites greater than 5 ft in length(“GT5”). In the case of gold, the mean grade of the final dataset (Au Comps GT5) iseffectively equivalent to that of the raw uncapped, uncomposited database, with only -0.5%difference (Table 17.9). In the case of silver, the removal of the shorter composites mitigatesthe losses introduced by capping and compositing (Table 17.9), with a -10% difference fromthe original raw data.
Table 17.8 Summary Statistics for Gold CompositesAu Au capped % diff Au Comps % diff Au Comps GT5 % diff
Mean 1.40 1.39 -0.38% 1.34 -4.43% 1.39 -0.48%Median 0.62 0.62 0.68 0.69Standard Deviation 2.23 2.15 1.90 1.95Sample Variance 4.96 4.64 3.61 3.82Minimum 0.01 0.01 0 0Maximum 44.23 30.00 30.00 30.00Number Capped 0 11 11.00 11.00Count 17,148 17,148 11,435 9,856
Table 17.9 Summary Statistics for Silver CompositesAg Ag capped %diff Ag Comps %diff Ag Comps GT5 %diff
Mean 8.6 7.9 -7.98% 7.5 -14.42% 7.7 -10.58%Median 2.1 2.1 2.1 2.2Standard Deviation 45.6 29.7 25.1 25.4Sample Variance 2078.3 884.7 628.7 645.4Minimum 0.0 0.0 0.0 0.0Maximum 2120.0 500.0 500.0 500.0Number Capped 0 21 21.0 21.0Count 15,805 15,805 11,435 9,856
All composites were coded according to whether they reside in the high (0.04 opt) or low(0.007 opt) grade domains within their respective deposit areas (Zanzibar, Rockwell,Chipmunk, States, Main and Pad 4), and also assigned to their respective stratigraphic layer(c.f. Table 17.1). These stratigraphic layers form the basic deposit shapes that were used to‘Unwrinkle’ the deposit. Figure 17.16 and Figure 17.17 show the grade distributions withineach stratigraphic layer for the high and low grade domains, respectively.
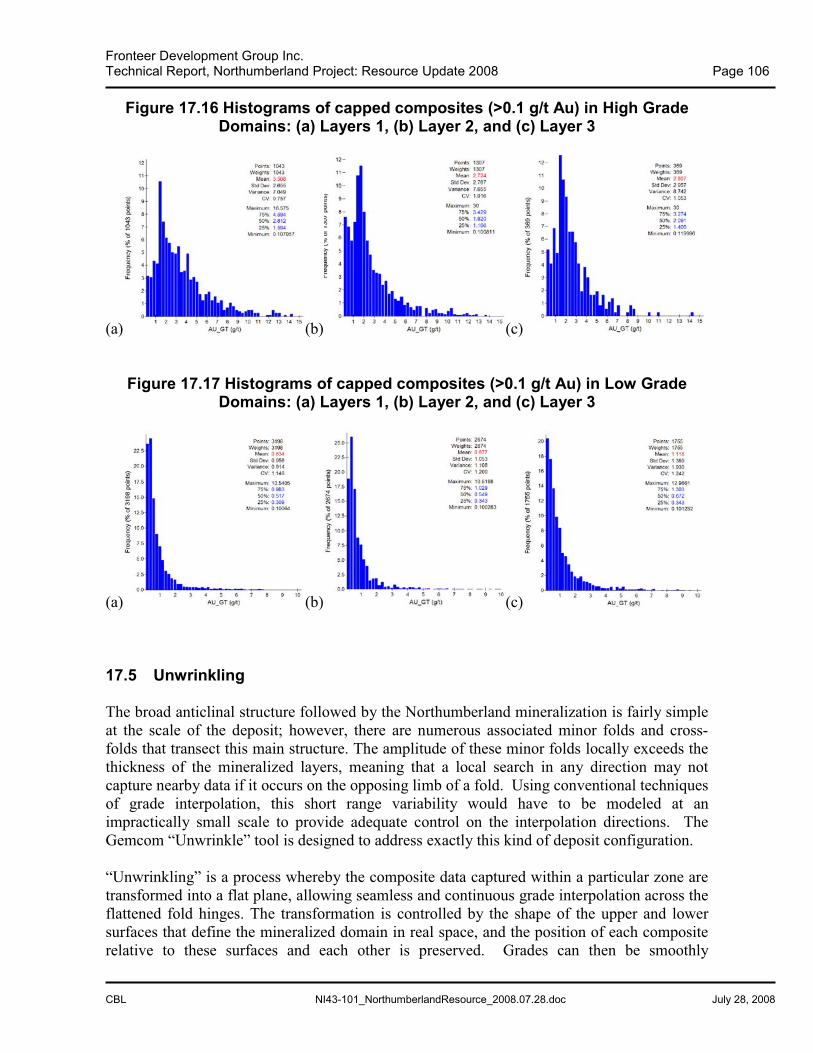
Fronteer Development Group Inc.Technical Report, Northumberland Project: Resource Update 2008 Page 106
CBL NI43-101_NorthumberlandResource_2008.07.28.doc July 28, 2008
Figure 17.16 Histograms of capped composites (>0.1 g/t Au) in High GradeDomains: (a) Layers 1, (b) Layer 2, and (c) Layer 3
(a) (b) (c)
Figure 17.17 Histograms of capped composites (>0.1 g/t Au) in Low GradeDomains: (a) Layers 1, (b) Layer 2, and (c) Layer 3
(a) (b) (c)
17.5 Unwrinkling
The broad anticlinal structure followed by the Northumberland mineralization is fairly simpleat the scale of the deposit; however, there are numerous associated minor folds and cross-folds that transect this main structure. The amplitude of these minor folds locally exceeds thethickness of the mineralized layers, meaning that a local search in any direction may notcapture nearby data if it occurs on the opposing limb of a fold. Using conventional techniquesof grade interpolation, this short range variability would have to be modeled at animpractically small scale to provide adequate control on the interpolation directions. TheGemcom “Unwrinkle” tool is designed to address exactly this kind of deposit configuration.
“Unwrinkling” is a process whereby the composite data captured within a particular zone aretransformed into a flat plane, allowing seamless and continuous grade interpolation across theflattened fold hinges. The transformation is controlled by the shape of the upper and lowersurfaces that define the mineralized domain in real space, and the position of each compositerelative to these surfaces and each other is preserved. Grades can then be smoothly

Fronteer Development Group Inc.Technical Report, Northumberland Project: Resource Update 2008 Page 107
CBL NI43-101_NorthumberlandResource_2008.07.28.doc July 28, 2008
interpolated across fold hinges within a new flat block model in the unwrinkled space. Theinterpolated block grades can then be back-transformed, by inverting the original forwardtransformation, and used to update the block model in real space.
Three independent layers were created to capture the principal stratigraphically-controlledmineralized horizons at Northumberland. These are: the Prospect-Mormon Thrust Horizon(Layer 1), the Basal Chert Horizon (Layer 2), and the Hanson Creek Fault Horizon (Layer 3)(Figure 17.18). Each layer, including their contained high and low grade domains, wastransformed into a flat layer of uniform 100 feet thickness.
Figure 17.18 East-West Long Section Showing Distribution of StratigraphicLayers
Hanson Creek Fault Horizon(Layer 3)
Prospect-Mormon Thrust Horizon(Layer 1)
Basal Chert Horizon(Layer 2)

Fronteer Development Group Inc.Technical Report, Northumberland Project: Resource Update 2008 Page 108
CBL NI43-101_NorthumberlandResource_2008.07.28.doc July 28, 2008
17.6 Variography
Variography was performed on gold composites from the high and low grade domains withineach of the mineralized layers independently, at varying lags, azimuths, and dips. Well-developed structures with strong continuity over long ranges were defined in traditional semi-variograms using log-transformed data in layers 1 and 3, and non-transformed data in layer 2.Table 17.10 provides the details of the variogram models, and the semi-variograms for eachof the principal directions of continuity are shown in Figure 17.19. Such strong continuity andlong ranges would not have been identifiable in real space, and illustrate the benefit of usingthe unwrinkling transformation.
No variography was conducted on the silver data, because the data selection was basedentirely on the modeled gold distribution and may not comprise a viable geostatisticalpopulation.
Table 17.10 Traditional Semi-Variogram Models for Mineralized Domains
Structure C0 C1 C2 C0 C1 C2 C0 C1 C2 C0 C1 C2 C0 C1 C0 C1 C2
Type Nugget Exp Exp Nugget Exp Sph Nugget Exp Sph Nugget Exp Exp Nugget Exp Nugget Exp ExpSill 0.2 0.5 0.3 0.1 0.52 0.38 0.1 0.55 0.35 0.1 0.6 0.3 0.15 0.85 0.15 0.25 0.6Orientation rotX 0 0 0 0 0 0 0 0 0 0 0
rotY 0 0 0 0 0 0 0 0 0 0 0rotZ -10 -10 -20 -20 80 80 -5 -5 0 -15 -15
Dimensions rangeX 650 1000 150 2500 550 800 260 1500 450 100 1000rangeY 500 650 150 800 225 550 230 900 250 200 300rangeZ 50 65 55 150 60 65 55 100 100 90 100
L3_HG L3_LGL1_HG L1_LG L2_HG L2_LG
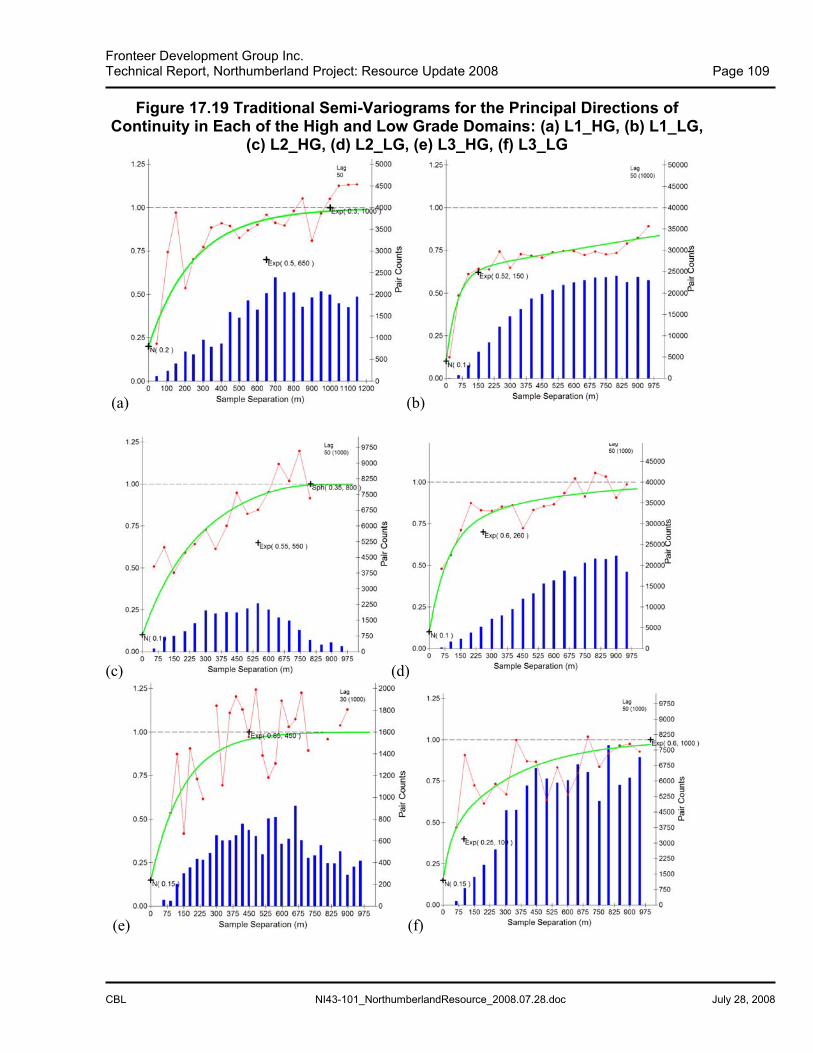
Fronteer Development Group Inc.Technical Report, Northumberland Project: Resource Update 2008 Page 109
CBL NI43-101_NorthumberlandResource_2008.07.28.doc July 28, 2008
Figure 17.19 Traditional Semi-Variograms for the Principal Directions ofContinuity in Each of the High and Low Grade Domains: (a) L1_HG, (b) L1_LG,
(c) L2_HG, (d) L2_LG, (e) L3_HG, (f) L3_LG
(a) (b)
(c) (d)
(e) (f)

Fronteer Development Group Inc.Technical Report, Northumberland Project: Resource Update 2008 Page 110
CBL NI43-101_NorthumberlandResource_2008.07.28.doc July 28, 2008
17.7 Block Model
A 3D block model was created using Gemcom software to capture all of the relevant data forresource estimation. Block codes were assigned for each grade envelope in each deposit alongwith the percentage of each domain falling within the block. Each block was assigned a goldand silver grade, a density, oxidation indicator, and an extraction ratio, according to theestimation process and modeling described below. Block model dimensions are given inTable 17.11.
A separate unwrinkled block model was created for each layer at an arbitrary elevation belowthe actual deposit to capture the grade estimates. The unwrinkled block model dimensionswere chosen to mimic the original block model in the X and Y directions, but with half thevertical thickness to account for the reduced uniform thickness of 100 ft. The unwrinkledblock dimensions are: 25 feet in the X direction, 40 feet in the Y direction and 10 feet in the Zdirection.
Table 17.11 Block Model Dimensions in Real SpaceOrigin minX 441,012.5
minY 1,530,020maxZ 9,150
Rotation 0Block Size Column (ft) 25
Row (ft) 40Level (ft) 20
Dimensions # Columns 400# Rows 115
# Levels 248Total # Blocks 11,408,000
17.7.1 Grade Estimation
Gold grades were estimated using Ordinary Kriging in a single pass for each of theunwrinkled block model layers. Each block was assigned a high grade value and a low gradevalue using only those composites coded from each respective domain. The estimationparameters for the samples used in the grade estimates are given in Table 17.12. Theseparameters were derived from the variography for each separate domain and representapproximately 90% of the full range defined by each respective variogram model.

Fronteer Development Group Inc.Technical Report, Northumberland Project: Resource Update 2008 Page 111
CBL NI43-101_NorthumberlandResource_2008.07.28.doc July 28, 2008
Table 17.12 Estimation Parameters for Northumberland Grade EstimationL1_HG L1_LG L2_HG L2_LG L3_HG L3_LG
Orientation Zrot -10 -20 80 -5 0 -15Xrot 0 0 0 0 0 0Zrot 0 0 0 0 0 0
Dimensions rangeX 800 1750 650 1000 450 850rangeY 550 550 400 600 250 275rangeZ 50 100 50 70 100 90
Samples Min 4 4 4 4 4 4Max 16 16 16 16 16 16
perDH 4 4 4 4 4 4
Silver grades were estimated in a single pass by Inverse Distance Squared weighting in theunwrinkled block models, using the same search parameters as those used for gold.
All grade estimates in the unwrinkled block models were back-transformed into real spaceand used to update the real space block model. A single back-transformed grade value wasused to populate each block with a nearest neighbour interpolation.
17.7.2 Density and Oxidation Modeling
Specific gravity (“SG”) measurements of mineralized Northumberland material were made byWSMC using the immersion method and the Marcy direct-reading pulp-density scale. For theimmersion method, selected samples of core were cleaned with a brush and sprayed with athin lacquer (Krylon) to prevent the samples from absorbing water during the test (Lanier,1992b). Hip chain string was used to suspend the samples, which were weighed suspended inair and in tap water. Bulk specific gravity was then calculated using the following equation:
SG = A / (A - B)where: A = weight in air; and B = weight in water
A comparison was made of 30 Marcy measurements with determinations on the same samplesusing the immersion method. The Marcy and immersion method measurements averaged2.59 and 2.61, respectively (Lanier, 1997). In addition to the WSMC data, Core Laboratories,Inc. of Dallas, Texas determined the SG of 19 samples for Cyprus.
A total of 295 SG, or tonnage factor (“TF”), measurements collected from mineralizedNorthumberland samples were used to determine densities. The SG results vary principallyby lithology and oxidation. Since a lithologic model of Northumberland has not been created,average TF’s were estimated for each deposit based on the percentage of each lithology in thedeposit. Lithologic codes of all samples assigned to gold domains were used to estimate therelative amounts of mineralized dolostone, limestone, siltstone/silty limestone, jasperoid,hornfels, and intrusions in each deposit (Table 17.13). The average TF values for each of thelithologies were then weight-averaged to determine the ‘unfactored’ TF for each deposit.These values were increased by a 2% factor in oxidized rocks and 1% in unoxidized rocks inorder to account for unmeasured void spaces, such as open fractures (Table 17.14).

Fronteer Development Group Inc.Technical Report, Northumberland Project: Resource Update 2008 Page 112
CBL NI43-101_NorthumberlandResource_2008.07.28.doc July 28, 2008
Table 17.13 Tonnage Factors by LithologyDolostone Limestone Ls-Siltstone Jasperoid Intrusions HornfelsDepositNo TF No TF No TF No TF No TF No TF
Totals1
Zanzibar 12 11.95 6 12.42 28 12.29 51 12.38 43 12.20 3 11.94 143Rockwell 7 12.76 7 12.09 1 11.69 2 12.00 4 12.00 21Chipmunk 25 12.37 4 12.97 3 13.69 6 12.61 47 12.21 85States-Main 8 14.90 8 12.76 16S Ridge 9 12.97 16 13.13 2 15.48 3 13.18 30
Totals 53 12.42 41 13.12 31 12.42 66 12.44 94 12.26 10 12.31 2951 Table does not include two measurements of calc-silicate rocks
Table 17.14 Tonnage Factors by DepositDeposit Oxidized TF Unoxidized TF
Zanzibar 12.53 12.41Rockwell 12.76 12.63Chipmunk 12.78 12.65States 12.95 12.82Main 12.95 12.82Wedge Shaped 12.80 12.68Pad 4 13.10 12.97South Ridge 12.78 12.66
In order to assign the tonnage factors to the blocks, an oxidation model was estimated usingthe oxidized (“2”), mixed (“1”), and unoxidized (“0”) codes in the drill sample database.Oxidation trends within the deposits mimic the stratigraphy. Drill hole geologic codes weretherefore contoured to create a digital surface representing the base of the Roberts MountainsFormation. The relative vertical distance of the blocks to the Roberts Mountains surface werecalculated and stored in the block model. The block model was then used to code the relativevertical distance to the 10-ft oxidation composites. These procedures normalize trueelevations of the composites and blocks to the Roberts Mountains surface, effectivelyflattening the undulating stratigraphy for the purposes of the oxidation estimation.
The oxide code was interpolated using the inverse-distance-cubed method that recognized therelative distances stored in the composites as the elevation values. Each geologic area wasinterpolated separately with unique search parameters. The search ellipses were highlyanisotropic, with relatively long axes in the horizontal directions and short minor axes in thevertical direction in order to honor the stratigraphic control. The lengths of the major andsemi-major axes of the search ellipses ranged from 550ft in geologic area 1 to 440ft in areas 4 and 5, while the minor axes used ranges of 35ft to 50ft. A minor amount of blocks were notestimated in the Zanzibar deposit. These blocks were set to zero (unoxidized).
The oxide codes were interpolated to assign blocks oxidation codes to the first decimal place.All blocks greater than or equal to 1.5 were assigned oxidized tonnage factors, while theremaining blocks were assigned unoxidized tonnage factors.

Fronteer Development Group Inc.Technical Report, Northumberland Project: Resource Update 2008 Page 113
CBL NI43-101_NorthumberlandResource_2008.07.28.doc July 28, 2008
17.7.3 Metallurgical Modeling
Portions of the Northumberland gold-silver mineralization are amenable to direct cyanidation,while other portions require metallurgical treatment that includes oxidation prior tocyanidation (see Section 16). Due to the significant difference in costs involved in therecovery of gold and silver from these two styles of mineralization, unique grade cutoffs arenecessary for the purposes of resource reporting. A generalized metallurgical model wastherefore developed to define both the mineralization that is amenable to direct cyanidationand the mineralization that requires oxidation prior to cyanidation. These types ofmineralization were identified on the basis of gold cyanide extraction ratios, which aredefined as the ratios of cyanide leach assays to original fire assays expressed in percent. Themetallurgical modeling, therefore, has been completed solely for the purposes of tabulatingthe Mineral Resources at appropriate cutoffs. Additional work, including the possibledevelopment of a new metallurgical model, would need to be completed prior to taking theseresources to reserves.
Variography performed on gold cyanide extraction ratio data indicated maximum ranges ofabout 700 to 800ft in both global and directional variograms, with most of the relationshipbetween samples accounted for at a range of 550ft.
Cyanide extraction ratios were estimated by the inverse-distance-cubed (“ID3”) method usingthe parameters in Table 17.15. Relative elevations of the 10-ft composites to the RobertsMountains surface were used in a similar fashion as the oxidation estimation described above.Cyanide extraction ratios derived from gold assays of less than 0.005 oz Au/ton were not usedin the composites, as these low assay values can lead to spuriously high cyanide extractionsand otherwise rather meaningless ratios. Only cyanide extraction ratios within the mineraldomains were composited.
Approximately 90% of the blocks were estimated by the inverse-distance interpolation. Theequation of a best-fit line derived from the relationship between cyanide extraction ratios andlogged oxidation code was applied to the interpolated oxidation codes to calculate the cyanideextraction ratios for the unestimated blocks. The data used to derive the best-fit line wereconstrained to samples that: (1) have a minimum fire assay value of 0.01 oz Au/ton; (2) liewithin the gold mineral domains; and (3) have a maximum extraction ratio of 115%.
Table 17.15 Summary of Northumberland Cyanide Extraction EstimationParameters
Areas 1 through 5Composites:Min / Max / Max per hole 1 / 5 / 3
Composite Length-weighting Yes
Estimation method ID3
Search Distances (ft) 550 / 550 / 50Search Directions:Azimuth / Dip / Tilt 0º / 0º / 0º

Fronteer Development Group Inc.Technical Report, Northumberland Project: Resource Update 2008 Page 114
CBL NI43-101_NorthumberlandResource_2008.07.28.doc July 28, 2008
The minimum fire assay limit is imposed in order to remove many of the spurious extractionratios well in excess of 100% and otherwise meaningless ratios, which are common at gradesof less than 0.01 oz Au/ton. Only data lying within the mineral domains were used in theestimation. While the best-fit line reflects the expected positive relationship betweenincreasing oxidation and increasing extraction values, the correlation is not strong (correlationcoefficient = 0.49). This is partially due to the subjectivity associated with various loggersassigning codes of 1, 2, and 3 in the description of oxidation state. The interpolated extractionratios were capped at 100%.
17.8 Block Model Validation
A nearest-neighbor and an ID2 estimate of the deposit was undertaken as a check on thekriged grade model. At no cutoff grade, the tons and grade of all estimated blocks in the twomodels are essentially identical. Grade distribution plots (Figure 17.20), Q-Q plots (Figure17.21), and swath plots (Figure 17.22) of the nearest neighbor, ID2 and kriged block gradeswere also evaluated. In addition, local block grade estimates were visually evaluated incomparison to neighbouring composite grades. The results showed good agreement in thestatistical and spatial grade distributions of each interpolation method.
Figure 17.20 Histograms Showing Grade Distributions for Nearest-Neighbour,ID2 and Ordinary Kriging Estimates
Figure 17.21 Q-Q Plots Comparing Grade Estimates for Each InterpolationAbove a Cut-Off Grade 0.3 g/t Au

Fronteer Development Group Inc.Technical Report, Northumberland Project: Resource Update 2008 Page 115
CBL NI43-101_NorthumberlandResource_2008.07.28.doc July 28, 2008
Figure 17.22 Vertical east-west swath plot comparing nearest neighbour (NN),inverse distance squared (ID2), and ordinary kriging (OK) estimates along a 240
foot wide swath across the center of the deposit
West-East Vertical Swath Plot (Rows 55-61)
0.00
1.00
2.00
3.00
4.00
5.00
6.00
50 100 150 200 250 300 350
Columns (numbers increase westward)
Ave
rage
bloc
kgr
ade
(g/t
Au)
NN
ID2
OK
3 per. Mov. Avg. (NN)
Various views of the Northumberland block model are shown in Figure 17.23, Figure 17.24,and Figure 17.25. Cross-section 445100E (Figure 17.25) shows the strong stratigraphiccontrols in part of the Zanzibar (Layer 1) and Rockwell (Layer 3) deposits. Note the thrustedcap of the Mount Gooding pluton along Layer 1).

Fronteer Development Group Inc.Technical Report, Northumberland Project: Resource Update 2008 Page 116
CBL NI43-101_NorthumberlandResource_2008.07.28.doc July 28, 2008
Figure 17.23 Plan View of the Northumberland Block Model Grades (Blue=0.25-0.50, Green=0.5-1.0, Yellow=1.0-3.0, Orange=3.0-6.0, Red>6.0)
Figure 17.24 Long Section 1532000N Showing Block Grades (colours as inFigure 17.23)
Long Section 1532000N
Cross Section 445100E
Cross Section 445100E

Fronteer Development Group Inc.Technical Report, Northumberland Project: Resource Update 2008 Page 117
CBL NI43-101_NorthumberlandResource_2008.07.28.doc July 28, 2008
Figure 17.25 Cross-Section 445100E Showing Zanzibar and Rockwell BlockGrades and Geology (grade colours as in Figure 17.23; c.f. Figure 17.2 for
geology)
17.9 Resource Classification
The Mineral Resources stated in this report for the Northumberland project conform to thedefinitions and categories set out in the Canadian Institute of Mining, Metallurgy andPetroleum (“CIM”) Definition Standards on Mineral Resources and Mineral Reserves adoptedby the CIM Council on August 20, 2000 and the revisions adopted on December 11, 2005.
Gold resources were classified on the basis of: (i) geological confidence, (ii) the averagedistance of the model blocks to composite samples used in the estimate, and (ii) the minimumnumber of composites used to estimate the block grades (Table 17.16). The average distancesare those measured in the unwrinkled block model, and correspond to approximately ¼ thevariogram range for Measured, ½ the range for Indicated and the full range for inferred. In allcases the classified blocks lie at least partially within a defined mineral zone. In cases wherea block was coded to both high and low grade domains, the classification parameters for thehighest tonnage domain in the block were used.
No silver resources are classified as Measured due to the lack of time spent studying thegeology of its occurrence, the high silver CV’s, and the generalized nature of the estimation.Silver was not modeled independently of the gold, so that only silver lying within the limits ofthe modeled gold zones was estimated. Significant additional silver lies outside of the gold

Fronteer Development Group Inc.Technical Report, Northumberland Project: Resource Update 2008 Page 118
CBL NI43-101_NorthumberlandResource_2008.07.28.doc July 28, 2008
zones and therefore was not estimated. This is far from an optimum method of estimatingsilver grades and tons, but it does serve to provide some insight into the magnitude of thesilver mineralization associated directly with the gold. There is a good possibility that whenestimated properly, the grades and tons will change.
Table 17.16 Northumberland Block Classification Parameters
AvgDist MinSam AvgDist MinSam AvgDist MinSamL1_HG 200 5 400 5 800 1L1_LG 425 5 850 5 1750 1L2_HG 150 5 300 5 650 1L2_LG 250 5 500 5 1000 1L3_HG 100 5 200 5 450 1L3_LG 200 5 400 5 850 1
MEASURED INDICATED INFERREDDomain
The gold resources are tabulated using three gold-grade cutoffs that are applied to the blockmodel on the basis of reasonably expected mining methods, metallurgical characteristics, andcomparisons with similar mining operations in Nevada. A cutoff grade of 0.3 g/t Au (0.01opt) is applied to blocks that can reasonably be considered to be available for potential open-pit extraction and heap-leach processing; all blocks above an elevation of 7,500 ft with acyanide extraction ratio of 50% or higher are deemed to be potentially mineable by open-pitmethods and oxidized sufficiently to be amenable to heap leaching. The 7,500-ft elevationlimits blocks potentially available to open-pit mining. This elevation is supported by internalscoping-level economic studies undertaken by Jim Ashton, Senior Engineer, Fronteer. The0.01 cutoff grade for oxide material is derived from comparable open-pit heap-leachoperations in Nevada.
Two cutoff grades are used for sulfide material, which will likely require oxidation prior tocyanide leaching. The sulfide material is identified by cyanide extraction ratios less than50%. Sulfide blocks that lie above 7,500ft can reasonably be considered available forpotential open-pit extraction and are compiled using a cutoff grade of 1.0 g/t Au (0.03 opt).This cutoff was chosen with consideration given to the Fronteer internal economic analysesmentioned above. Blocks lying below 7,500ft will likely require more costly undergroundmining methods and are compiled using a cutoff grade of 2.5 g/t Au (0.07 opt).
The gold grades for each block represent the weighted average of the grades estimated foreach of the mineral domains included in the block; they are not diluted to full blocks butrather to the mineralized zone only. Similarly, the tons of a block are derived from thatportion of the block below surface topography and within the gold mineral domains.
The silver resources are compiled from all gold resource blocks based on the gold cutoffgrades discussed above; no silver cutoff is applied.
The Measured, Indicated, and Inferred gold and silver resources are summarized in Table17.17. The gold resources at additional cutoffs are listed in Table 17.18 and Table 17.19.

Fronteer Development Group Inc.Technical Report, Northumberland Project: Resource Update 2008 Page 119
CBL NI43-101_NorthumberlandResource_2008.07.28.doc July 28, 2008
Table 17.17 Northumberland Classified Resources July 2008, FronteerDevelopment Group
Gold Gold Equivalent*Resource Type Cut-off (g/t) Cut-off (opt) Tonnes g/t opt oz ozOpen Pit Oxide 0.3 0.01 12,888,000 1.19 0.035 492,000 492,000Open Pit Sulfide 1.0 0.03 13,781,000 2.31 0.067 1,022,000 1,022,000Underground 2.5 0.07TOTAL 26,669,000 1.77 0.05 1,514,000 1,514,000
Gold Silver Gold Equivalent*Resource Type Cut-off (g/t) Cut-off (opt) Tonnes g/t opt oz Tonnes g/t opt oz ozOpen Pit Oxide 0.3 0.01 739,000 1.94 0.057 46,000 13,627,000 7.31 0.213 3,202,000 110,000Open Pit Sulfide 1.0 0.03 8,794,000 2.35 0.069 665,000 22,575,000 8.01 0.234 5,815,000 781,000Underground 2.5 0.07 316,000 3.35 0.098 34,000 316,000 4.43 0.129 45,000 35,000TOTAL 9,849,000 2.35 0.07 745,000 36,518,000 7.72 0.23 9,062,000 926,000
Gold Silver Gold Equivalent*Resource Type Cut-off (g/t) Cut-off (opt) Tonnes g/t opt oz Tonnes g/t opt oz ozOpen Pit Oxide 0.3 0.01 13,627,000 1.23 0.036 538,000 13,627,000 7.31 0.213 3,202,000 602,000Open Pit Sulfide 1.0 0.03 22,575,000 2.32 0.068 1,687,000 22,575,000 8.01 0.234 5,815,000 1,803,000Underground 2.5 0.07 316,000 3.35 0.098 34,000 316,000 4.43 0.129 45,000 35,000TOTAL 36,518,000 1.92 0.06 2,259,000 36,518,000 7.72 0.23 9,062,000 2,440,000
Gold Silver Gold Equivalent*Resource Type Cut-off (g/t) Cut-off (opt) Tonnes g/t opt oz Tonnes g/t opt oz ozOpen Pit Oxide 0.3 0.01 17,000 2.38 0.069 1,300 17,000 10.98 0.320 6,000 1,400Open Pit Sulfide 1.0 0.03 1,335,000 2.59 0.075 111,000 1,335,000 7.69 0.224 330,000 118,000Underground 2.5 0.07 5,574,000 3.70 0.108 664,000 5,574,000 5.95 0.174 1,067,000 685,000TOTAL 6,926,000 3.49 0.10 776,300 6,926,000 6.30 0.18 1,403,000 804,400*AuEq calculated at a Au:Ag ratio of 50:1
MEASURED
INDICATED
INFERRED
MEASURED & INDICATED

Fronteer Development Group Inc.Technical Report, Northumberland Project: Resource Update 2008 Page 120
CBL NI43-101_NorthumberlandResource_2008.07.28.doc July 28, 2008
Table 17.18 Northumberland Gold Resources by Cutoff Grade
Tonn
esG
rade
(g/t)
Gra
de(o
pt)
Oun
ces
(Au)
Tonn
esG
rade
(g/t)
Gra
de(o
pt)
Oun
ces
(Au)
Tonn
esG
rade
(g/t)
Gra
de(o
pt)
Oun
ces
(Au)
Tonn
esG
rade
(g/t)
Gra
de(o
pt)
Oun
ces
(Au)
0.30
12,8
88,0
001.
190.
0349
2,00
027
,513
,000
1.47
0.04
1,29
9,00
040
,401
,000
1.53
0.04
1,79
2,00
00.
5010
,584
,000
1.36
0.04
462,
000
23,3
18,0
001.
660.
051,
245,
000
33,9
02,0
001.
730.
051,
707,
000
1.00
5,12
4,00
02.
050.
0633
7,00
013
,781
,000
2.31
0.07
1,02
2,00
018
,905
,000
2.46
0.07
1,35
8,00
01.
502,
980,
000
2.63
0.08
252,
000
8,58
1,00
02.
960.
0981
7,00
011
,561
,000
3.16
0.09
1,06
9,00
02.
001,
823,
000
3.21
0.09
188,
000
5,76
2,00
03.
570.
1066
1,00
07,
585,
000
3.83
0.11
849,
000
2.50
1,16
3,00
03.
770.
1114
1,00
04,
258,
000
4.04
0.12
553,
000
5,42
1,00
04.
380.
1369
4,00
03.
0072
9,00
04.
390.
1310
3,00
03,
356,
000
4.39
0.13
474,
000
4,08
6,00
04.
840.
1457
7,00
03.
5049
2,00
04.
930.
1478
,000
2,58
1,00
04.
740.
1439
3,00
03,
073,
000
5.25
0.15
471,
000
4.00
314,
000
5.65
0.16
57,0
001,
933,
000
5.07
0.15
315,
000
2,24
7,00
05.
670.
1737
2,00
04.
5020
6,00
06.
340.
1842
,000
1,27
4,00
05.
490.
1622
5,00
01,
480,
000
6.19
0.18
267,
000
5.00
165,
000
6.79
0.20
36,0
0084
7,00
05.
840.
1715
9,00
01,
012,
000
6.63
0.19
196,
000
Tonn
esG
rade
(g/t)
Gra
de(o
pt)
Oun
ces
(Au)
Tonn
esG
rade
(g/t)
Gra
de(o
pt)
Oun
ces
(Au)
Tonn
esG
rade
(g/t)
Gra
de(o
pt)
Oun
ces
(Au)
Tonn
esG
rade
(g/t)
Gra
de(o
pt)
Oun
ces
(Au)
0.30
739,
000
1.94
0.06
46,0
0012
,761
,000
1.83
0.05
752,
000
2,86
1,00
01.
720.
0515
8,00
016
,361
,000
1.82
0.05
956,
000
0.50
650,
000
2.15
0.06
45,0
0011
,810
,000
1.95
0.06
739,
000
2,83
5,00
01.
720.
0515
7,00
015
,295
,000
1.91
0.06
941,
000
1.00
546,
000
2.45
0.07
43,0
008,
794,
000
2.35
0.07
665,
000
2,35
7,00
01.
910.
0614
5,00
011
,696
,000
2.27
0.07
853,
000
1.50
442,
000
2.74
0.08
39,0
006,
071,
000
2.85
0.08
557,
000
1,61
7,00
02.
210.
0611
5,00
08,
130,
000
2.72
0.08
711,
000
2.00
294,
000
3.17
0.09
30,0
004,
624,
000
3.20
0.09
476,
000
848,
000
2.64
0.08
72,0
005,
766,
000
3.12
0.09
579,
000
2.50
183,
000
3.74
0.11
22,0
003,
441,
000
3.53
0.10
391,
000
316,
000
3.35
0.10
34,0
003,
940,
000
3.53
0.10
447,
000
3.00
113,
000
4.40
0.13
16,0
002,
386,
000
3.88
0.11
298,
000
161,
000
4.06
0.12
21,0
002,
660,
000
3.92
0.11
335,
000
3.50
75,0
004.
980.
1512
,000
1,48
3,00
04.
280.
1220
4,00
099
,000
4.40
0.13
14,0
001,
657,
000
4.34
0.13
231,
000
4.00
51,0
005.
490.
169,
000
830,
000
4.72
0.14
126,
000
56,0
005.
000.
159,
000
936,
000
4.78
0.14
144,
000
4.50
37,0
005.
880.
177,
000
416,
000
5.16
0.15
69,0
0036
,000
5.18
0.15
6,00
048
9,00
05.
280.
1583
,000
5.00
27,0
006.
910.
206,
000
207,
000
5.71
0.17
38,0
0025
,000
6.22
0.18
5,00
026
0,00
05.
740.
1748
,000
Tonn
esG
rade
(g/t)
Gra
de(o
pt)
Oun
ces
(Au)
Tonn
esG
rade
(g/t)
Gra
de(o
pt)
Oun
ces
(Au)
Tonn
esG
rade
(g/t)
Gra
de(o
pt)
Oun
ces
(Au)
Tonn
esG
rade
(g/t)
Gra
de(o
pt)
Oun
ces
(Au)
0.30
17,0
002.
380.
071,
300
1,82
7,00
02.
080.
0612
2,00
035
,916
,000
1.45
0.04
1,67
3,00
037
,760
,000
1.48
0.04
1,79
7,00
00.
5016
,000
2.53
0.07
1,30
01,
752,
000
2.15
0.06
121,
000
33,0
77,0
001.
540.
041,
635,
000
34,8
46,0
001.
570.
051,
757,
000
1.00
16,0
002.
530.
071,
300
1,33
5,00
02.
590.
0811
1,00
018
,681
,000
2.14
0.06
1,28
8,00
020
,033
,000
2.17
0.06
1,40
0,00
01.
5013
,000
2.87
0.08
1,20
01,
173,
000
2.76
0.08
104,
000
10,5
30,0
002.
870.
0897
2,00
011
,716
,000
2.86
0.08
1,07
8,00
02.
008,
000
3.11
0.09
800
934,
000
3.03
0.09
91,0
007,
635,
000
3.31
0.10
812,
000
8,57
7,00
03.
280.
1090
4,00
02.
505,
000
3.73
0.11
600
600,
000
3.47
0.10
67,0
005,
574,
000
3.70
0.11
664,
000
6,17
9,00
03.
680.
1173
1,00
03.
003,
000
5.18
0.15
500
342,
000
4.00
0.12
44,0
003,
915,
000
4.11
0.12
518,
000
4,26
0,00
04.
110.
1256
3,00
03.
501,
300
7.18
0.21
300
198,
000
4.56
0.13
29,0
002,
747,
000
4.49
0.13
397,
000
2,94
7,00
04.
500.
1342
6,00
04.
001,
300
7.18
0.21
300
129,
000
5.06
0.15
21,0
001,
665,
000
4.99
0.15
267,
000
1,79
5,00
04.
990.
1528
8,00
04.
501,
300
7.18
0.21
300
84,0
005.
550.
1615
,000
997,
000
5.52
0.16
177,
000
1,08
2,00
05.
520.
1619
2,00
05.
001,
300
7.18
0.21
300
58,0
005.
900.
1711
,000
597,
000
6.04
0.18
116,
000
657,
000
6.01
0.18
127,
000
TOTA
LC
ut-o
ff(g
/tAu
)O
xide
- >22
86 m
Sulfi
de->
2286
mSu
lfide
-<22
86 m
INFE
RR
ED
IND
ICA
TED
Cut
-off
(g/t
Au)
Oxi
de- >
2286
mSu
lfide
->22
86 m
Sulfi
de-<
2286
mTO
TAL
MEA
SUR
EDC
ut-o
ff(g
/tAu
)O
xide
- >22
86 m
Sulfi
de->
2286
mSu
lfide
-<22
86 m
TOTA
L

Fronteer Development Group Inc.Technical Report, Northumberland Project: Resource Update 2008 Page 121
CBL NI43-101_NorthumberlandResource_2008.07.28.doc July 28, 2008
Table 17.19 Northumberland Silver Resources by Cutoff Grade
Tonn
esG
rade
(g/t)
Gra
de(o
pt)
Oun
ces
(Ag)
Tonn
esG
rade
(g/t)
Gra
de(o
pt)
Oun
ces
(Ag)
Tonn
esG
rade
(g/t)
Gra
de(o
pt)
Oun
ces
(Ag)
Tonn
esG
rade
(g/t)
Gra
de(o
pt)
Oun
ces
(Ag)
0.30
13,6
26,0
007.
310.
213,
202,
000
40,2
75,0
007.
130.
219,
239,
000
2,86
1,00
04.
110.
1237
8,00
056
,761
,000
7.02
0.20
12,8
20,0
000.
5011
,234
,000
7.12
0.21
2,57
3,00
035
,128
,000
7.24
0.21
8,17
9,00
02,
835,
000
4.14
0.12
377,
000
49,1
97,0
007.
040.
2111
,129
,000
1.00
5,67
0,00
06.
980.
201,
272,
000
22,5
75,0
008.
010.
235,
814,
000
2,35
7,00
04.
240.
1232
1,00
030
,601
,000
7.53
0.22
7,40
7,00
01.
503,
423,
000
6.62
0.19
729,
000
14,6
52,0
009.
210.
274,
339,
000
1,61
7,00
04.
040.
1221
0,00
019
,691
,000
8.34
0.24
5,27
8,00
02.
002,
117,
000
6.68
0.19
455,
000
10,3
86,0
0010
.31
0.30
3,44
4,00
084
8,00
04.
220.
1211
5,00
013
,351
,000
9.35
0.27
4,01
4,00
02.
501,
346,
000
6.95
0.20
301,
000
7,69
8,00
011
.39
0.33
2,81
9,00
031
6,00
04.
430.
1345
,000
9,36
0,00
010
.52
0.31
3,16
5,00
03.
0084
3,00
07.
270.
2119
7,00
05,
742,
000
12.3
50.
362,
280,
000
161,
000
4.83
0.14
25,0
006,
746,
000
11.5
30.
342,
501,
000
3.50
567,
000
7.68
0.22
140,
000
4,06
5,00
013
.58
0.40
1,77
5,00
099
,000
5.34
0.16
17,0
004,
730,
000
12.7
00.
371,
932,
000
4.00
364,
000
8.46
0.25
99,0
002,
763,
000
14.8
40.
431,
318,
000
56,0
006.
110.
1811
,000
3,18
3,00
013
.95
0.41
1,42
8,00
04.
5024
3,00
09.
470.
2874
,000
1,69
0,00
015
.86
0.46
862,
000
36,0
006.
910.
208,
000
1,96
9,00
014
.89
0.43
943,
000
5.00
192,
000
9.88
0.29
61,0
001,
054,
000
16.3
50.
4855
4,00
025
,000
7.46
0.22
6,00
01,
272,
000
15.1
80.
4462
1,00
0
Tonn
esG
rade
(g/t)
Gra
de(o
pt)
Oun
ces
(Ag)
Tonn
esG
rade
(g/t)
Gra
de(o
pt)
Oun
ces
(Ag)
Tonn
esG
rade
(g/t)
Gra
de(o
pt)
Oun
ces
(Ag)
Tonn
esG
rade
(g/t)
Gra
de(o
pt)
Oun
ces
(Ag)
0.30
17,0
0010
.98
0.32
6,00
01,
827,
000
6.57
0.19
386,
000
35,9
16,0
0010
.90
0.32
12,5
90,0
0037
,760
,000
10.6
90.
3112
,982
,000
0.50
16,0
0011
.66
0.34
6,00
01,
752,
000
6.76
0.20
381,
000
33,0
77,0
0011
.40
0.33
12,1
28,0
0034
,846
,000
11.1
70.
3312
,516
,000
1.00
16,0
0011
.66
0.34
6,00
01,
335,
000
7.69
0.22
330,
000
18,6
81,0
009.
580.
285,
754,
000
20,0
33,0
009.
450.
286,
090,
000
1.50
13,0
0011
.96
0.35
5,00
01,
173,
000
8.03
0.23
303,
000
10,5
30,0
008.
840.
262,
992,
000
11,7
16,0
008.
760.
263,
299,
000
2.00
8,00
011
.66
0.34
3,00
093
4,00
08.
560.
2525
7,00
07,
635,
000
6.53
0.19
1,60
4,00
08,
577,
000
6.76
0.20
1,86
4,00
02.
505,
000
12.4
40.
362,
000
600,
000
8.71
0.25
168,
000
5,57
4,00
05.
950.
171,
067,
000
6,17
9,00
06.
230.
181,
237,
000
3.00
3,00
010
.37
0.30
1,00
034
2,00
08.
730.
2596
,000
3,91
5,00
05.
930.
1774
6,00
04,
260,
000
6.15
0.18
843,
000
3.50
1,00
031
.10
0.91
1,00
019
8,00
08.
320.
2453
,000
2,74
7,00
06.
060.
1853
5,00
02,
947,
000
6.22
0.18
589,
000
4.00
1,00
031
.10
0.91
1,00
012
9,00
08.
680.
2536
,000
1,66
5,00
06.
050.
1832
4,00
01,
795,
000
6.24
0.18
360,
000
4.50
1,00
031
.10
0.91
1,00
084
,000
8.89
0.26
24,0
0099
7,00
06.
050.
1819
4,00
01,
082,
000
6.29
0.18
219,
000
5.00
1,00
031
.10
0.91
1,00
058
,000
9.12
0.27
17,0
0059
7,00
05.
780.
1711
1,00
065
7,00
06.
110.
1812
9,00
0
Sulfi
de-<
2286
mTO
TAL
Cut
-off
(g/t
Au)
Oxi
de->
2286
mSu
lfide
->22
86 m
Sulfi
de-<
2286
mTO
TAL
INFE
RR
ED
IND
ICAT
EDC
ut-o
ff(g
/tAu
)O
xide
->22
86 m
Sulfi
de->
2286
m

Fronteer Development Group Inc.Technical Report, Northumberland Project: Resource Update 2008 Page 122
CBL NI43-101_NorthumberlandResource_2008.07.28.doc July 28, 2008
17.10 Other Mineralization
In addition to the resources reported in Table 17.17, there are approximately 80 million tonsgrading 1.5 g/t Au (0.04 opt) at a cut-off of 0.3 g/t Au (0.01opt) were estimated in the modelbut excluded from the resources. This additional gold mineralization is not currentlyconsidered to have reasonable prospects for economic extraction. The portion of this materialthat lies above 7,500 feet warrants re-evaluation, if silver mineralization is properly modeled,which may lead to added value, or if positive changes are realized in such factors ascommodity prices, operating-cost efficiencies, or metallurgical advances.
In addition to the other gold mineralization described above, a significant amount of silver liesoutside of the gold mineral domains and therefore was not estimated.
17.11 Recommended Improvements for Subsequent Modeling
The silver mineralization needs to be modeled independently of the gold in order to upgradesilver resources into the Measured and Indicated categories. Modeling procedures similar tothose described above for gold should be used. In order to accomplish this, a betterunderstanding of the geology of the silver mineralization needs to be obtained and the silverassay database needs to be verified.
Consideration should be given to improving the three-dimensional model of metallurgicalparameters, such as oxidation and cyanide extraction ratios. The generalized oxidation andmetallurgical models in this study were created for the purpose of applying appropriatespecific gravity factors and gold-grade cut-off values for resource reporting, respectively. Amore robust metallurgical model would be needed for feasibility-type studies.

Fronteer Development Group Inc.Technical Report, Northumberland Project: Resource Update 2008 Page 123
CBL NI43-101_NorthumberlandResource_2008.07.28.doc July 28, 2008
18.0 MINERAL RESERVE ESTIMATE
No reserves are estimated in this report.

Fronteer Development Group Inc.Technical Report, Northumberland Project: Resource Update 2008 Page 124
CBL NI43-101_NorthumberlandResource_2008.07.28.doc July 28, 2008
19.0 OTHER RELEVANT DATA AND INFORMATION
Fronteer is not aware of additional information that is material to this technical report.

Fronteer Development Group Inc.Technical Report, Northumberland Project: Resource Update 2008 Page 125
CBL NI43-101_NorthumberlandResource_2008.07.28.doc July 28, 2008
20.0 INTERPRETATIONS AND CONCLUSIONS
The Northumberland mineralization occurs as stacked, primarily sediment-hosted, finelydisseminated, Carlin-type gold-silver deposits that, taken as a whole, are similar to theGoldstrike deposit of the northern Carlin Trend. The gold-silver mineralization atNorthumberland occurs in a cluster of eight more-or-less spatially distinct deposits that forman arcuate belt approximately 1.6 miles long in an east-west direction and 0.3 miles wide.The deposits are generally stratiform and follow three low-angle tectono-stratigraphic hosthorizons near the crest and within the west limb of the Northumberland anticline. Thedeposits locally merge between horizons where the intervening rock units are breached. Fromstratigraphic top to bottom, the mineralized horizons are referred to as the Prospect-Mormonthrust (upper), Basal Chert fault (middle), and Hanson Creek fault (lower) host horizons. Thethree horizons are structural discontinuities that include the Prospect-Mormon thrustintersection zone and two bedding-plane faults. The overall geometry of the deposits and thehigher-grade zones within the deposits appear to be influenced by east-trending high-anglestructures in the area of the crest of the anticline.
Gold occurs as micron- to sub-micron-size particles that are intimately associated withsulfides, occasionally in association with oxidized sulfide minerals, and rarely as freeparticles. The gold is disseminated primarily within sedimentary units, although the MountGooding pluton and its associated intrusive rocks host disseminated mineralization in all ofthe deposits. Silver occurs in a complex assemblage of copper-antimony sulfides and arsenicsulfosalts. The total sulfide content is less than five percent; pyrite, arsenopyrite, andmarcasite are the most abundant species present. The mineralization is associated with bothsilicification and decalcification of carbonate hosts, and quartz-illite-pyrite alteration ofigneous hosts.
Cyprus and WSMC mined over seven-million tons of ore from several open pits and producedover 230,000 ounces of gold and 485,000 ounces of silver by heap leaching of sized and run-of-mine oxidized and partially oxidized ore. Gold recoveries for crushed oxide ore and run-of-mine, partially oxidized ore from these operations have been estimated at approximately75% and 50%, respectively.
Metallurgical studies indicated that differences in the amenability of the Northumberlandmineralization to direct cyanidation are primarily due to the degree of oxidation, as opposedto deposit-specific characteristics or crush size. Oxide material appears to be amenable todirect cyanidation, while sulfide mineralization requires oxidation prior to cyanidation. Silicaencapsulation may be a local factor, but does not appear to be a major impediment to goldrecovery. Sulfide mineralization is refractory due the close association of micron-size goldwith sulfides and the local presence of preg-robbing organic-rich/carbonaceous material.
Diagnostic metallurgical testing to date indicates gold and silver extractions from sulfidemineralization can be optimized by utilizing the N2TEC flotation technology of Newmontwith autoclaving of the concentrates. Extractions in excess of 90% for both gold and silver inthe flotation concentrate were attained in the samples tested.

Fronteer Development Group Inc.Technical Report, Northumberland Project: Resource Update 2008 Page 126
CBL NI43-101_NorthumberlandResource_2008.07.28.doc July 28, 2008
Gold and silver resources at Northumberland were estimated from information provided by adatabase that includes 1,502 holes for a total of 606,369.5 ft of drilling. These holes weredrilled from 1968 through 2007 by conventional rotary, reverse circulation, and core methods;a small amount of air-track data is also included. Entire series of older drill holes have beenremoved from the database due to sample quality and assay reliability issues. AlthoughQA/QC programs were not systematically implemented and documented prior to Newmont’s2004-2007 exploration work, check assay and twin hole data were compiled by MDA in2006. An analysis of these data found no serious problems with the assay database, althoughadditional check assay data are needed. The twin-hole data suggest the possibility of localdown-hole contamination. Several possible contaminated intervals were identified during thegrade modeling of the deposits, and the suspect assay intervals, as well as the contaminatedvolumes, were excluded from the resource estimation.
There is excellent exploration potential at Northumberland, both within the deposit area andin other areas of the large property holdings. Within the deposit area, gold-silvermineralization in each of the three tectono-stratigraphic horizons locally breaches theintervening rock units and merges with mineralization in the neighboring host horizon. Thesediscordant zones are frequently cored by high-grade mineralization that is presumablystructurally controlled and in many cases not properly defined by drilling. These high-gradecore zones warrant further drill testing, as do the possible deeper extensions of the controllingstructures. In addition, Fronteer plans to explore beyond the limits of the known deposits inan attempt to discover additional mineralization in similar geologic settings.
There are a number of targets beyond the limits of the deposit area that are defined by soiland/or rock gold anomalies, only some of which have been tested by drilling. Fronteer plansto evaluate and test more of these anomalies in the future.

Fronteer Development Group Inc.Technical Report, Northumberland Project: Resource Update 2008 Page 127
CBL NI43-101_NorthumberlandResource_2008.07.28.doc July 28, 2008
21.0 RECOMMENDATIONS
Additional check assay data are needed at Northumberland. A number of assay pulps and/orrejects from mineralized WSMC drill intervals should be retrieved from storage and analyzedby an independent laboratory. A set of existing pulps and/or rejects from mineralized WSMCdrill intervals should be analyzed by an independent laboratory.
21.1 2008 Recommendations
A preliminary economic assessment and scoping study (Economic Study) using the updatedNorthumberland resource has been initiated. This work is intended as a managementplanning tool to guide and accelerate pre-feasibility investigations and future mine-development by defining mining, metallurgical, environmental and infrastructure options;developing an optimum operating scenario; and obtaining an early estimate of economicviability of the project. The Economic Study will be 43-101 compliant and completed underthe supervision of an independent engineering group, SRK Consulting. This phase of theproposed work program is budgeted at US$250,000.
A two phase drill program has been developed by Fronteer to test new ideas and targetswithin and around the known deposit (see Section 10 for details). A summary of the proposedwork is summarized here:
Phase I
• Define high-grade targets at the deposit complex.• Employing the geophysical data newly acquired by Newmont,define district drill targets.• Conduct a biostratgraphic study of sedimentary and metasedimentary
rocks in the Northumberland window to define potential district hosthorizons using an academic institution to collect and identify fossils.
Phase II
• Drill 16,000m (21 holes~52,500 ft) of precollared core (6,400m RC& 9,600m core) to test high-grade targets in the
Zanzibar and Rockwell deposits.• Drill 4,570m (10 holes~15,000 ft) of RC holes to test district targets.
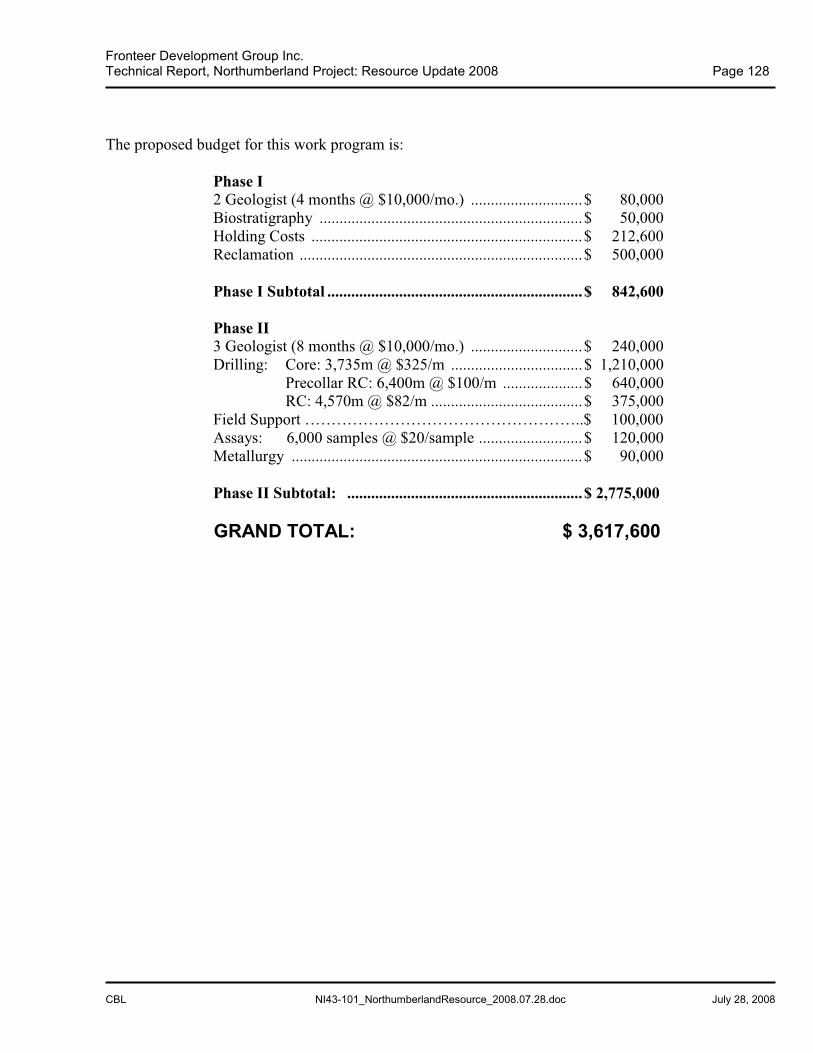
Fronteer Development Group Inc.Technical Report, Northumberland Project: Resource Update 2008 Page 128
CBL NI43-101_NorthumberlandResource_2008.07.28.doc July 28, 2008
The proposed budget for this work program is:
Phase I 2 Geologist (4 months @ $10,000/mo.) ............................$ 80,000 Biostratigraphy ..................................................................$ 50,000 Holding Costs ....................................................................$ 212,600 Reclamation .......................................................................$ 500,000
Phase I Subtotal ................................................................$ 842,600
Phase II 3 Geologist (8 months @ $10,000/mo.) ............................$ 240,000Drilling: Core: 3,735m @ $325/m .................................$ 1,210,000
Precollar RC: 6,400m @ $100/m ....................$ 640,000 RC: 4,570m @ $82/m ......................................$ 375,000
Field Support ……………………………………………..$ 100,000 Assays: 6,000 samples @ $20/sample ..........................$ 120,000 Metallurgy .........................................................................$ 90,000
Phase II Subtotal: ...........................................................$ 2,775,000
GRAND TOTAL: $ 3,617,600

Fronteer Development Group Inc.Technical Report, Northumberland Project: Resource Update 2008 Page 129
CBL NI43-101_NorthumberlandResource_2008.07.28.doc July 28, 2008
22.0 REFERENCES
Allen, Perry, 1996a, Results of Laboratory Test Work Comparing HPGR and Simulated VSICrushing Effects on Cyanide Gold Leaching on Core Samples from theNorthumberland Project: report prepared for Western States Minerals Corporation byDawson Metallurgical Laboratories, Inc., 10 p. with appendices.
Allen, Perry, 1996b, Results of Laboratory Test Work Comparing Autoclave PretreatmentFollowed by CIL Cyanidation on Ore Samples from the Northumberland Project:report prepared for Western States Minerals Company by Dawson MetallurgicalLaboratories, Inc., 6 p. with appendices.
Boden, David R., 1992, Geology of the Toquima Complex, Central Nevada: Nevada Bureauof Mines and Geology, Map 98.
Branham, A., Lauha, E., and Powell, J., 2004, Monthly Exploration Report NorthumberlandProject, Nye Co., Nevada: internal Newmont Memorandum to Western StatesMinerals Corporation, 3 p.
Coles, K. C., 1988, Stratigraphy and Structure of the Pinecone Sequence, Roberts MountainsAllochthon, Nevada, and Aspects of Mid-Paleozoic Sedimentation and Tectonics in theCordilleran Geosyncline: doctoral dissertation, Columbia Univ., 327 p.
Erwin, Thomas P., 2005, Confidential Legal Advice, Northumberland Project, Nye County,Nevada: Erwin & Thompson LLP mineral status report to NewWest Gold Corporation56 p.
Erwin, Thomas P., 2007, Fourth Supplement of Mineral Status Report for NorthumberlandProject; Nye County, Nevada: Erwin & Thompson LLP mineral status report toNewWest Gold Corporation 2p.
Eyzaguirre, Carlos, 2007, Ore Evaluation from the Northumberland Deposit: NewmontMemorandum, 13 p. with Appendix of tables.
Fiddler, Rick, April 24, 2003, Northumberland Mine Heap Drilling: internal Western StatesMinerals Corporation report, 1 p.
Gustin, Michael M., Ristorcelli, Steve, and Lanier, George, 2006, Technical Report,Northumberland Project, Nye County, Nevada USA, 43-101 Technical Reportprepared by Mine Development Associates for NewWest Gold Corporation, 109 p. and Appendices.
Gustin, Michael M., Ristorcelli, Steve, and Lanier, George, 2007, Updated Technical Report,Northumberland Project, Nye County, Nevada USA, 43-101 Technical Reportprepared by Mine Development Associates for Fronteer Development Group, 116 p. and Appendices.

Fronteer Development Group Inc.Technical Report, Northumberland Project: Resource Update 2008 Page 130
CBL NI43-101_NorthumberlandResource_2008.07.28.doc July 28, 2008
Harris, Anita C., November 11, 2003, Report on Referred Fossils: report prepared forWestern States Minerals Corporation, 3 p.
Hansen, B. D., 1996, N2TEC Flotation Technology Results: letter to Western States MineralsCorporation from Santa Fe Pacific, 3 p.
Honea, Russell M., 1992, Scanning electron microprobe data for P (T). S. 29 (NW1088-2109.5'): private
report prepared for Western States Minerals Corporation, 2p. and photographs andgraphs.
House, Adam, 2004, Northumberland Test Work at Lone Tree: internal memorandum ofNewmont Mining Corporation, 6 p.
Isaacson, P.E. and Measures, E.A., 1986, Stratigraphic Problem, Northumberland Area,Nevada, Submitted by Steve Singer, Western States Minerals: report prepared byDepartment of Geology, U. of Idaho, Moscow for Western States MineralsCorporation, 9 p.
Jackson, R. G., 2004, Northumberland Soil Geochemistry Mine Area Grid Interpretation and Resulting Targets: internal report for Newmont Mining Corporation, 6 p. plus 11 figures.
Kay, M., and Crawford, J. P., 1964, Paleozoic Facies from Miogeosynclinal to theEugeosynclinal Belt in Thrust Slices, Central Nevada: Geological Society of AmericaBulletin, v. 75, no. 5, p. 425- 454.
Kappes, Dan, 1979, Field Test Heap Leach Program 1977-1978: in Chapman, P. E. andSchmidt, E. A., Geological Summary Report, Northumberland Project, Nye County,Nevada: private report prepared for AMOCO Minerals Company by Whitney &Whitney, p. 40-47 with appendices.
Kappes, D. W., 1982, Northumberland Nevada, Problem Ore Zone (Southeast Main Zone),Summary of Cyanide Leach Tests: private report prepared for AMOCO MineralsCorporation by Kappes, Cassiday & Associates, 13p
Kleinhampl, F. J. and Ziony, J. I., 1984, Mineral Resources of Northern Nye County, Nevada:Nevada Bureau of Mines and Geology, Bulletin 99B, 243 p.
Kuipers, James R., 1991, Report on Phase I investigation: Metallurgical Characterization ofthe
Northumberland Ore Deposits: internal Western States Minerals Corporation report,17p with figures, graphs, and tables.
Lanier, George, 1989, Fire Assaying Program, Northumberland: internal Western StatesMinerals Corporation document, 10 p.

Fronteer Development Group Inc.Technical Report, Northumberland Project: Resource Update 2008 Page 131
CBL NI43-101_NorthumberlandResource_2008.07.28.doc July 28, 2008
Lanier, George, 1990, Geometallurgy of the Wedge-Shaped Deposit, Northumberland Mainpit: internal
Western States Minerals Corporation report, 2 p. with figures.
Lanier, George, 1992a, Western States Minerals Corporation, Northumberland Project:internal Western States Minerals Corporation document, 15 p.
Lanier, George, 1992b, Rock Density, Chipmunk and Mormon Canyon Zanziabr Deposits:internal Western States Minerals Corporation document, 1 p.
Lanier, George, 1997, Northumberland Exploration Monthly Report, July 199: internalWestern States Mineral Corporation document, 2 p.
Lanier, G., Wilson, J. D., and Pratt, C. L., 1993, Mineralization at the Northumberland Mine,Exploration Concept: internal Western States Minerals Corporation document.
Leonardson, R. W., and Rahn, J. E., 1996, Geology of the Betze-Post Gold Deposits, EurekaCounty, Nevada: in Coyner, Alan A., and Fahey, Patrick L., eds, Geology and OreDeposits of the American Cordillera, Symposium Proceedings, p. 61-94.
Lauha, E., and Powell, J., 2004a, Monthly Exploration Report Northumberland Project, NyeCo., NV, April 27, 2004: internal Newmont Gold Company memorandum to WesternStates Minerals Corporation, 3 p.
Lauha, E., and Powell, J., 2004b, Monthly Exploration Report Northumberland Project, NyeCo., NV, August 27, 2004: internal Newmont Gold Company memorandum toWestern States Minerals Corporation, 4 p.
Lauha, E., and Powell, J., 2004c, Monthly Exploration Report Northumberland Project, NyeCo., NV, December 21, 2004: internal Newmont Gold Company memorandum toWestern States Minerals Corporation, 3 p
Lauha, E., and Powell, J., 2004d, Monthly Exploration Report Northumberland Project, NyeCo., NV, June 30, 2004: internal Newmont Gold Company memorandum to WesternStates Minerals Corporation, 2 p.
Lauha, E., and Powell, J., 2004e, Monthly Exploration Report Northumberland Project, NyeCo., NV, November 24, 2004: internal Newmont Gold Company memorandum toWestern States Minerals Corporation, 2 p.
Lauha, E., and Powell, J., 2004f, Monthly Exploration Report Northumberland Project, NyeCo., NV, September 27, 2004: internal Newmont Gold Company memorandum toWestern States Minerals Corporation, 4 p.
Maxwell, Doug, 1992, Preliminary Diagnostic Testing to Achieve Economic Recovery ofGold or Removal of Undesirable Components from Northumberland Bulk Samples:private report prepared by Interpro for Western States Minerals Corporation.

Fronteer Development Group Inc.Technical Report, Northumberland Project: Resource Update 2008 Page 132
CBL NI43-101_NorthumberlandResource_2008.07.28.doc July 28, 2008
McKee, E. H., 1972, Preliminary Geologic Map of the Wildcat Peak Quadrangle and theWestern Part of the Dianas Punch Bowl Quadrangle, Nevada: U.S. GeologicalSurvey Miscellaneous Field Studies Map MF-337, scale 1:62,500.
McKee, E. H., 1974, Northumberland Caldera and Northumberland Tuff: Nevada Bureau ofMines and Geology, Report 19, p. 35-41.
McKee, E. H., 1976, Geology of the Northern Part of the Toquima Range, Lander, Eureka,and Nye Counties, Nevada: U.S. Geological Survey Professional Paper 931, 49 p.
Newmont Mining Corporation, 2005, Northumberland Project Joint Venture, 2004 ProgressReport, January 2005: private report to Western States Minerals Corporation, 21 p. and folded maps.
Newmont Mining Corporation, 2006, Northumberland Project Joint Venture, 2005 ProgressReport, January 2006: private report to Western States Minerals Corporation, 19 p. and folded maps.
Newmont Mining Corporation, 2007, Northumberland Project Joint Venture, 2006 ProgressReport, January 2006: private report to NewWest Gold USA Inc., 21 p. and foldedmaps.
Oberg, K. C., 1996, Metallurgical Testing of a Gold Ore Sample from Western StatesMinerals, HRI Projects 8582-11 and 8930: report prepared for Santa Fe Pacific GoldCorporation by Hazen Research, Inc, 10 p. and cover letter.
Osmanson, R. D., 1993, Northumberland Flotation Testing and Preliminary Pre-OxidationScoping Test, Final Report: private report prepared for Western States MineralsCorporation by Kappes, Cassiday & Associates, 16 p. with appendix.
Peters, Lisa, 1996, Ar40Ar39 Date on Biotite from Andesite Dike: report prepared by NewMexico Bureau of Mines & Mineral Resources for Western States MineralsCorporation.
Peters, Lisa, 1997, Ar40Ar39 Date on Biotite from Andesite Dike: report prepared by NewMexico Bureau of Mines & Mineral Resources for Western States MineralsCorporation.
Pincock, Allen & Holt, Inc., 1989, Audit and Verification of Reserves, NorthumberlandProperty, Nye County, Nevada: private report prepared for Western States MineralsCorporation, 40 p.
Rollin, G. E., 1996, no title: private report prepared for Western States Minerals Corporationby Geobiotics, Inc., 9 p. with attachment.
Silberman, M.L. and McKee, E. H., 1971, K-Ar Ages of Granitic Plutons in North-CentralNevada: Isochron/West, vol. 71-1, p. 15-32.

Fronteer Development Group Inc.Technical Report, Northumberland Project: Resource Update 2008 Page 133
CBL NI43-101_NorthumberlandResource_2008.07.28.doc July 28, 2008
Thompson, Philip, 1990, Results of Diagnostic Leach Tests Performed on 11 Samples fromthe Northumberland Refractory Gold Project: private report prepared for Roberts &Schaefer Company by Dawson Metallurgical Laboratories, 19 p. with appendices.
Thompson, Philip for Allen, Perry, 1996, Results of Continued Test Work Including CursoryLaboratory Flotation and Roasting Followed by CIL Cyanidation on Ore Samplesfrom the Northumberland Project: private report prepared for Western States MineralsCorporation by Dawson Metallurgical Laboratories, 6 p. with appendices.
Wark, C. R., and Silver, S. A., 1943, Cyanidation Tests on a Refractory Gold Ore Submittedby the Northumberland Mining Company: internal Western States MineralsCorporation document by American Cyanamid Company, 34p.
West-Sells, Paul and Chong, Tony, 2003, Diagnostic Leaching and Placer Dome EnhancedCyanidation Tests on Zanzibar Samples: private report prepared for Western StatesMinerals Corporation by Placer dome Research Center, 3 p. with tables.
Western States Minerals Corporation, 1998, Northumberland Gold Project, Nye County,Nevada, Information Memorandum: internal Western States Minerals Corporationdocument, 27 p.
Whitney & Whitney, Inc., 1980, Summary Report of a Statistical Comparison of Core and Rotary Drill Assay Results, Northumberland project: 9 p. and Appendices.
Zhafiqullah, Muhammad, 1992, K-Ar Date on Sanidine from Northumberland Ash Flow Tuff,NW-1100, 776-782: private report prepared by University of Arizona for WesternStates Minerals Corporation.
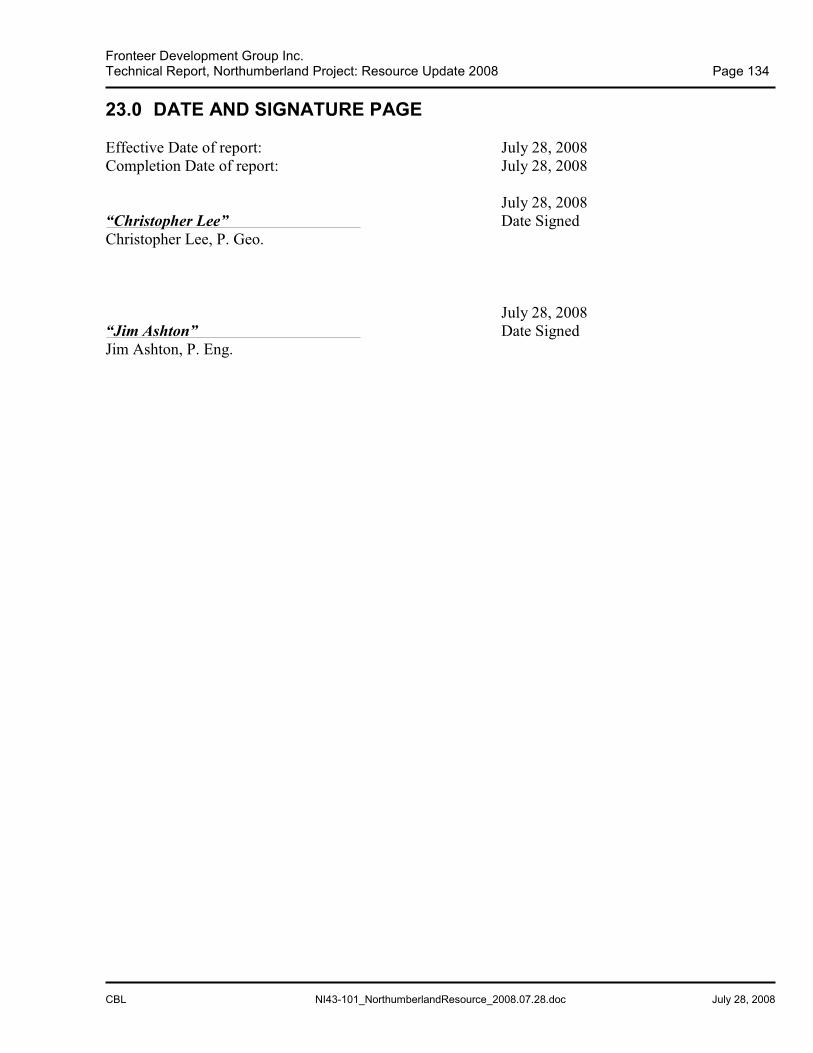
Fronteer Development Group Inc.Technical Report, Northumberland Project: Resource Update 2008 Page 134
CBL NI43-101_NorthumberlandResource_2008.07.28.doc July 28, 2008
23.0 DATE AND SIGNATURE PAGE
Effective Date of report: July 28, 2008Completion Date of report: July 28, 2008
July 28, 2008“Christopher Lee” Date SignedChristopher Lee, P. Geo.
July 28, 2008“Jim Ashton” Date SignedJim Ashton, P. Eng.

Fronteer Development Group Inc.Technical Report, Northumberland Project: Resource Update 2008 Page 135
CBL NI43-101_NorthumberlandResource_2008.07.28.doc July 28, 2008
24.0 CERTIFICATE OF AUTHORS
I, Christopher Lee, P. Geo., do hereby certify that:
1) I am a geologist residing at 303-141 Water Street, Vancouver, BC, V6B 1A7,and employed by Fronteer Development Group Inc as Chief Geoscientist.
2) I am a graduate of the University of Waterloo, with an Honours B.Sc. Co-op inGeology, 1991, and I obtained a M.Sc. in Geology from the MemorialUniversity of Newfoundland in 1994. I have practiced my professioncontinuously since 1991;
3) I am a Professional Geoscientist registered in good standing with theAssociation of Professional Engineers and Geoscientists of British Columbia(#29049);
4) I have read the definition of “qualified person” set out in National Instrument43-101 (“NI432-101”) and certify that by reason of my education, affiliationwith professional associations (as deemed in NI43-101) and past relevant workexperience, I fulfill the requirements to be a “qualified person” for thepurposes of NI 43-101.
5) I am responsible for the preparation of this report entitled “Technical Reporton the Northumberland Project, Nye County, Nevada, USA: Resource Update2008” and dated July 28, 2008 (the “Technical Report”) relating to theNorthumberland project, with the exception of Sections 11, 12, 13 and 14. Ihave visited the Northumberland project in July 2007, following all explorationactivity described herein, and am very familiar with the database havingconducted detailed review, analysis and preparation of the Mineral ResourceEstimate.
6) As of July 28, 2008, and to the best of my knowledge, information and belief,the Technical Report contains all scientific and technical information that isrequired to be disclosed to make the technical report not misleading and I haveread the disclosure being filed and it fairly and accurately represents theinformation in the Technical Report that supports the disclosure.
7) I am not aware of any material fact or material change with respect to thesubject matter of the Technical Report that is not reflected in the TechnicalReport, the omission to disclose which make the Technical Report misleading.

Fronteer Development Group Inc.Technical Report, Northumberland Project: Resource Update 2008 Page 136
CBL NI43-101_NorthumberlandResource_2008.07.28.doc July 28, 2008
8) I am not independent of the issuer applying all the tests in Section 1.5 ofNational Instrument 43-101 and acknowledge that I hold securities of theFronteer Development Group inc. in the form of shares and stock optionagreements.
9) I have read National Instrument 43-101 and Form 43-101F1, and the TechnicalReport has been prepared in compliance with that instrument and form.
10) I consent to the filing of the Technical Report with any stock exchange andother regulatory authority and any publication by them, including electronicpublication in the public company files on their websites accessible by thepublic, of the Technical Report.
Dated this 25th day of July 2008, in Vancouver, B.C.

Fronteer Development Group Inc.Technical Report, Northumberland Project: Resource Update 2008 Page 137
CBL NI43-101_NorthumberlandResource_2008.07.28.doc July 28, 2008
I, James W. Ashton, do hereby certify that:
1. I am currently employed as Senior Project Engineer by:
NewWest Gold USA, Inc.230 South Rock Blvd. Suite 30 Reno, Nevada 89502.
2. I graduated with a Bachelor of Science degree in Mining Engineering from theUniversity of Nevada, Reno in 1984. I have practiced my profession continuouslysince 1984.
3. I am a Registered Professional Engineer (#9162) in the State of Nevada and a Registeredmember of the Society of Mining Engineers.
4. I have performed worked on the property intermittently since 1997 and have relevantexperience having led or participated in both engineering and geological studiessupporting all facets of operating and development projects.
5. I have read the definition of “Qualified Person” set out in National Instrument 43-101 (NI43-101) and certify that by reason of my education, affiliation with a professionalassociation (as defined in NI 43-101) and past relevant work experience, I fulfill therequirements to be a “Qualified Person” for the purposes of NI 43-101.
6. I am responsible for assisting in the preparation and specifically for Sections 11, 12, 13, and 14 of the technical report titled “Technical Report on the Northumberland Project,Nye County, Nevada, USA: Resource Update 2008” and dated July 28, 2008 (the“Technical Report”) relating to the Northumberland project. I have visited theNorthumberland project numerous times.
7. As of July 25th, 2008 and to the best of my knowledge, information and belief, theTechnical Report contains all scientific and technical information that is required to bedisclosed to make the technical report not misleading and I have read the disclosure beingfiled and it fairly and accurately represents the information in the Technical Report thatsupports the disclosure.
8. I am not aware of any material fact or material change with respect to the subject matter ofthe Technical Report that is not reflected in the Technical Report, the omission to disclosewhich makes the Technical Report misleading.
9. I am not independent of the issuer applying the tests in Section 1.5 of National Instrument43-101 and acknowledge that I hold securities of the Fronteer Development Group in theform of stock options.
10. I have read National Instrument 43-101 and Form 43-101F1, and the Technical Report hasbeen prepared in compliance with that instrument and form.
11. I consent to the filing of the Technical Report with any stock exchange and otherregulatory authority and any publication by them, including electronic publication in thepublic company files on their websites accessible by the public, of the Technical Report.

Fronteer Development Group Inc.Technical Report, Northumberland Project: Resource Update 2008 Page 138
CBL NI43-101_NorthumberlandResource_2008.07.28.doc July 28, 2008
Dated this 25th day of July 2008.
“James W. Ashton”Signature of Qualified Person
James W. Ashton

CBL NI43-101_NorthumberlandResource_2008.07.28.doc July 28, 2008