Embed Size (px)
Citation preview
Technical Report
Climate change exposures, chronic diseases and mental health in urban populations:
a threat to health security, particularly for the poor and disadvantaged
2009
© World Health Organization 2009
All rights reserved. Requests for permission to reproduce or translate WHO publications – whether for sale or for noncommercial distribution – should be addressed to the WHO Centre for Health Development, I.H.D. Centre Building, 9th Floor, 5-1, 1-chome, Wakinohama-Kaigandori, Chuo-ku, Kobe City, Hyogo Prefecture, 651-0073, Japan (fax: +81 78 230 3178; email: [email protected]).
The designations employed and the presentation of the material in this publication do not imply the expression of any opinion whatsoever on the part of the World Health Organization concerning the legal status of any country, territory, city or area or of its authorities, or concerning the delimitation of its frontiers or boundaries. Dotted lines on maps represent approximate border lines for which there may not yet be full agreement.
The mention of specific companies or of certain manufacturers’ products does not imply that they are endorsed or recommended by the World Health Organization in preference to others of a similar nature that are not mentioned. Errors and omissions excepted, the names of proprietary products are distinguished by initial capital letters.
All reasonable precautions have been taken by WHO to verify the information contained in this publication. However, the published material is being distributed without warranty of any kind, either express or implied. The responsibility for the interpretation and use of the material lies with the reader. In no event shall the World Health Organization be liable for damages arising from its use. This publication contains the collective commissioned research team and does not necessarily represent the decisions or the stated policy of the World Health Organization.
CONTENTS
ABSTRACT ....................................................................................................................................................................iv
ACKNOWLEDGEMENTS ..........................................................................................................................................iv
1. INTRODUCTION.......................................................................................................................................................1
2. CLIMATE CHANGE TRENDS AND PROJECTIONS........................................................................................3
3. OVERVIEW OF HEALTH IMPACTS OF CLIMATE CHANGE .....................................................................5
4. DEFINITION OF CHRONIC DISEASES AND MENTAL HEALTH CONDITIONS IN THIS REPORT ..........................................................................................................................................................................7
5. LINKAGES AND PATHWAYS, CHRONIC DISEASES.....................................................................................9
5.1 Exposure and effect pathways ..................................................................................................................9
5.2 Impacts via direct heat exposure ............................................................................................................10
5.3 Impacts via increased air pollution ........................................................................................................13
5.4 Impacts via malnutrition .........................................................................................................................14
5.5 Impacts via extreme weather and sea level rise ....................................................................................14
5.6 Impacts via communicable or vector-borne diseases ...........................................................................14
5.7 Impacts via increased exposure to other environmental hazards ......................................................14
6. LINKAGES AND PATHWAYS, MENTAL HEALTH .......................................................................................16
6.1 Impacts via direct heat exposure ............................................................................................................16
6.2 Impacts via malnutrition .........................................................................................................................16
6.3 Indirect impacts via extreme weather events........................................................................................16
6.4 Indirect impacts via effects on farm production...................................................................................17
6.5 Other pathways.........................................................................................................................................17
7. TRENDS OF CLIMATE CHANGE AND HEAT EXPOSURES IN SELECTED CITIES............................18
7.1 Data sources and methods .......................................................................................................................18
7.2 Yearly climate trends ...............................................................................................................................19
7.3 Hourly diurnal variations of selected heat variables by month..........................................................22
7.4 Estimates of the loss of monthly work ability due to physiological heat stress.................................27
8. ROLE OF SOCIETAL AND DEMOGRAPHIC FACTORS FOR HEALTH SECURITY IN CLIMATE CHANGE...................................................................................................................................................31
8.1 Urbanization .............................................................................................................................................31
8.2 Ageing ........................................................................................................................................................32
8.3 Socioeconomic factors ..............................................................................................................................33
8.4 Health systems ..........................................................................................................................................33
8.5 Adaptation and mitigation ......................................................................................................................33
9. HEALTH EQUITY ISSUES IN URBAN AREAS................................................................................................35
10. RESEARCH GAPS.................................................................................................................................................37

11. RECOMMENDATIONS FOR SELECTED NEW RESEARCH ACTIVITIES TO SUPPORT CITY-BASED POLICIES FOR HEALTH SECURITY AND HEALTH EQUITY ............................................40
12. REFERENCES........................................................................................................................................................41
iv
Abstract This report summarizes climate change trends globally and in selected urban areas. It analyses to what extent climate variables and climate change can influence chronic disease and mental health occurrence in populations in different places, with a particular focus on urban settings. The report also highlights gaps in the scientific evidence and provides recommendations for future research of WHO and other entities. Finally, it makes proposals for new research within the WHO urban health activities. The material used in this report is selective, and a full review of all the aspects of this topic would require a more substantial analysis. This was not possible with the limited scope of the project. Until now, the assessments of the global health impact of climate change have focused only on acute effects that can be approximately quantified. Malnutrition, diarrhoeal diseases and vector-borne diseases dominate such assessments, but no analysis to date has considered all potential health impacts of climate variability and climate change. It is possible that a number of the acute health problems associated with climate change could lead to long-lasting chronic conditions in affected individuals. Increasing heat exposure can also worsen the clinical condition of people with pre-existing chronic diseases and mental health problems. This would of course add to the burden of prevalent chronic disease problems in a population. The physiological reaction to increased heat exposure may also under certain conditions cause metabolic malfunction that would lead to chronic conditions. The international research recommendations in this field are relatively vague, but they do highlight the need to learn more about the specific health problems that are associated with direct heat exposure and the various indirect exposures that may occur with climate change. The identification of factors associated with vulnerability to health effects of climate change is also a priority. The health sector needs new decision-support tools and evaluations of health protection strategies in relation to climate change, including mitigation and adaptation strategies.
Acknowledgements This report was prepared by Dr Tord Kjellstrom, Health and Environment International Trust, New Zealand, and National Centre for Epidemiology and Population Health, Australian National University. During the preparation of this report valuable materials and comments were received from Drs Ruth Bonita, Robert Beaglehole, Helen Berry, and Bruno Lemke. The city heat exposure graphs were produced in collaboration with Bruno Lemke and will be published separately. The report preparation was supported financially by the WHO Centre for Health Development, Kobe, Japan.
1
1. INTRODUCTION
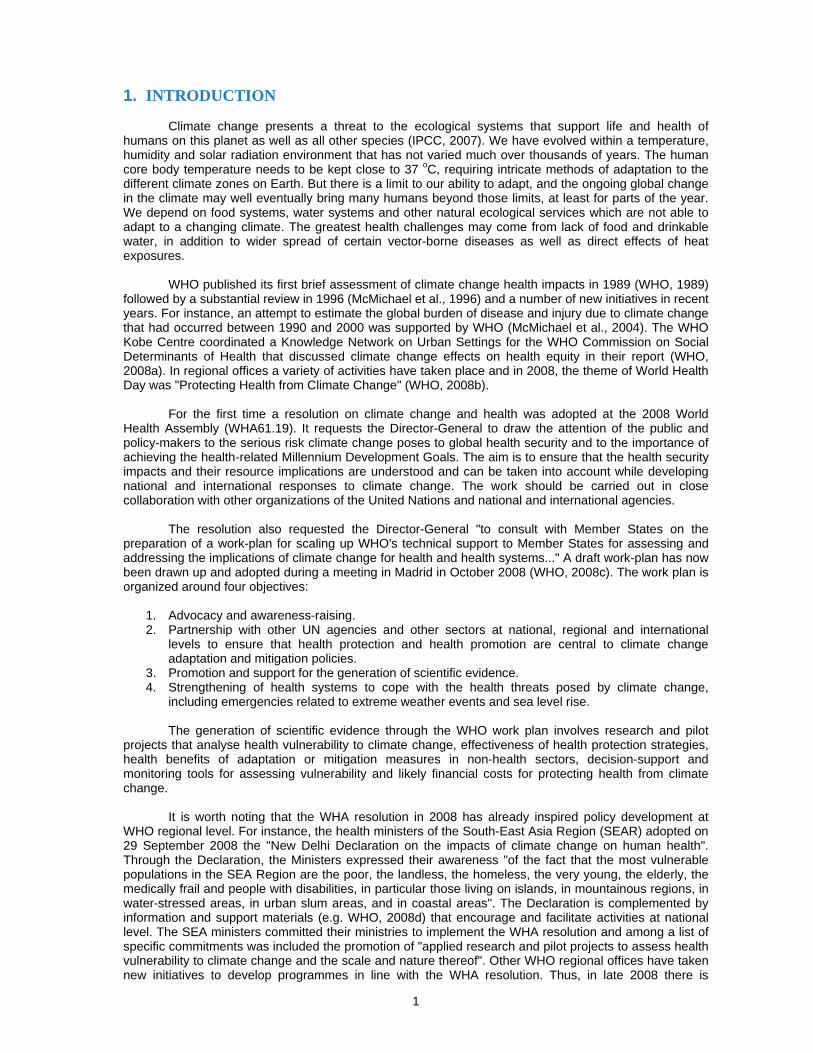
Climate change presents a threat to the ecological systems that support life and health of humans on this planet as well as all other species (IPCC, 2007). We have evolved within a temperature, humidity and solar radiation environment that has not varied much over thousands of years. The human core body temperature needs to be kept close to 37 oC, requiring intricate methods of adaptation to the different climate zones on Earth. But there is a limit to our ability to adapt, and the ongoing global change in the climate may well eventually bring many humans beyond those limits, at least for parts of the year. We depend on food systems, water systems and other natural ecological services which are not able to adapt to a changing climate. The greatest health challenges may come from lack of food and drinkable water, in addition to wider spread of certain vector-borne diseases as well as direct effects of heat exposures.
WHO published its first brief assessment of climate change health impacts in 1989 (WHO, 1989) followed by a substantial review in 1996 (McMichael et al., 1996) and a number of new initiatives in recent years. For instance, an attempt to estimate the global burden of disease and injury due to climate change that had occurred between 1990 and 2000 was supported by WHO (McMichael et al., 2004). The WHO Kobe Centre coordinated a Knowledge Network on Urban Settings for the WHO Commission on Social Determinants of Health that discussed climate change effects on health equity in their report (WHO, 2008a). In regional offices a variety of activities have taken place and in 2008, the theme of World Health Day was "Protecting Health from Climate Change" (WHO, 2008b).
For the first time a resolution on climate change and health was adopted at the 2008 World Health Assembly (WHA61.19). It requests the Director-General to draw the attention of the public and policy-makers to the serious risk climate change poses to global health security and to the importance of achieving the health-related Millennium Development Goals. The aim is to ensure that the health security impacts and their resource implications are understood and can be taken into account while developing national and international responses to climate change. The work should be carried out in close collaboration with other organizations of the United Nations and national and international agencies.
The resolution also requested the Director-General "to consult with Member States on the preparation of a work-plan for scaling up WHO's technical support to Member States for assessing and addressing the implications of climate change for health and health systems..." A draft work-plan has now been drawn up and adopted during a meeting in Madrid in October 2008 (WHO, 2008c). The work plan is organized around four objectives:
1. Advocacy and awareness-raising. 2. Partnership with other UN agencies and other sectors at national, regional and international
levels to ensure that health protection and health promotion are central to climate change adaptation and mitigation policies.
3. Promotion and support for the generation of scientific evidence. 4. Strengthening of health systems to cope with the health threats posed by climate change,
including emergencies related to extreme weather events and sea level rise.
The generation of scientific evidence through the WHO work plan involves research and pilot projects that analyse health vulnerability to climate change, effectiveness of health protection strategies, health benefits of adaptation or mitigation measures in non-health sectors, decision-support and monitoring tools for assessing vulnerability and likely financial costs for protecting health from climate change.
It is worth noting that the WHA resolution in 2008 has already inspired policy development at WHO regional level. For instance, the health ministers of the South-East Asia Region (SEAR) adopted on 29 September 2008 the "New Delhi Declaration on the impacts of climate change on human health". Through the Declaration, the Ministers expressed their awareness "of the fact that the most vulnerable populations in the SEA Region are the poor, the landless, the homeless, the very young, the elderly, the medically frail and people with disabilities, in particular those living on islands, in mountainous regions, in water-stressed areas, in urban slum areas, and in coastal areas". The Declaration is complemented by information and support materials (e.g. WHO, 2008d) that encourage and facilitate activities at national level. The SEA ministers committed their ministries to implement the WHA resolution and among a list of specific commitments was included the promotion of "applied research and pilot projects to assess health vulnerability to climate change and the scale and nature thereof". Other WHO regional offices have taken new initiatives to develop programmes in line with the WHA resolution. Thus, in late 2008 there is
2
considerable momentum towards research, analysis and action on the health impacts of climate change and WHO is playing an important role.
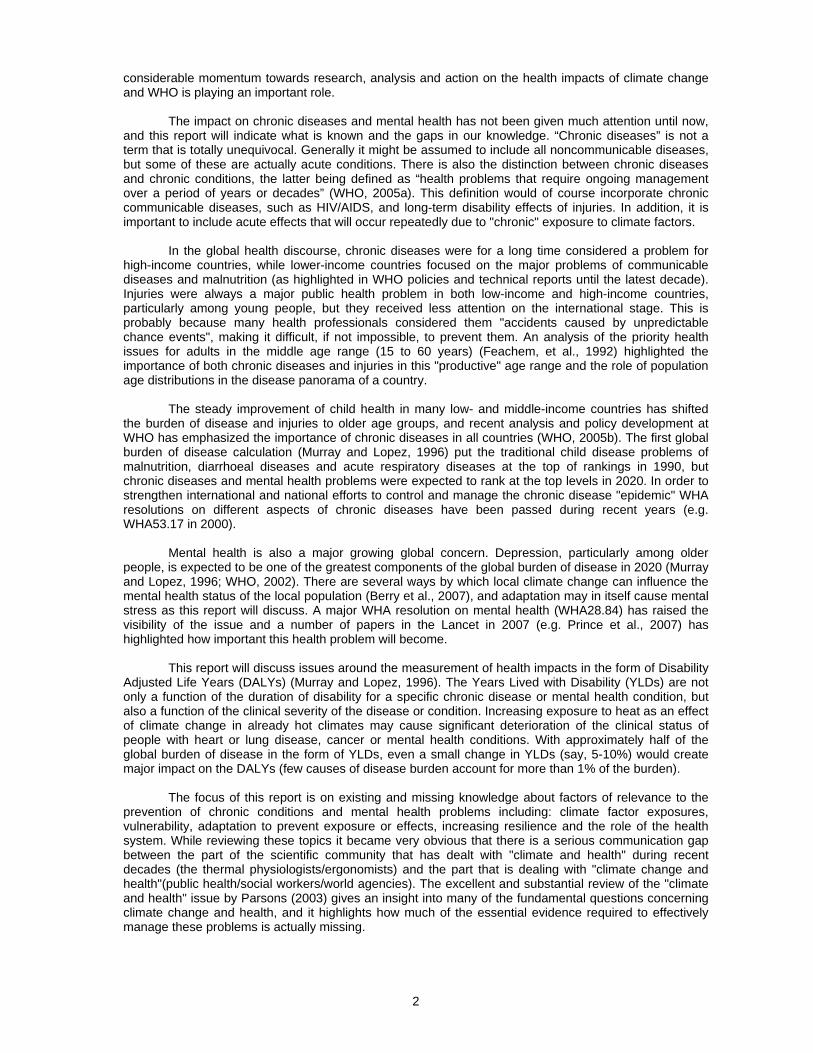
The impact on chronic diseases and mental health has not been given much attention until now, and this report will indicate what is known and the gaps in our knowledge. “Chronic diseases” is not a term that is totally unequivocal. Generally it might be assumed to include all noncommunicable diseases, but some of these are actually acute conditions. There is also the distinction between chronic diseases and chronic conditions, the latter being defined as “health problems that require ongoing management over a period of years or decades” (WHO, 2005a). This definition would of course incorporate chronic communicable diseases, such as HIV/AIDS, and long-term disability effects of injuries. In addition, it is important to include acute effects that will occur repeatedly due to "chronic" exposure to climate factors.
In the global health discourse, chronic diseases were for a long time considered a problem for high-income countries, while lower-income countries focused on the major problems of communicable diseases and malnutrition (as highlighted in WHO policies and technical reports until the latest decade). Injuries were always a major public health problem in both low-income and high-income countries, particularly among young people, but they received less attention on the international stage. This is probably because many health professionals considered them "accidents caused by unpredictable chance events", making it difficult, if not impossible, to prevent them. An analysis of the priority health issues for adults in the middle age range (15 to 60 years) (Feachem, et al., 1992) highlighted the importance of both chronic diseases and injuries in this "productive" age range and the role of population age distributions in the disease panorama of a country.
The steady improvement of child health in many low- and middle-income countries has shifted the burden of disease and injuries to older age groups, and recent analysis and policy development at WHO has emphasized the importance of chronic diseases in all countries (WHO, 2005b). The first global burden of disease calculation (Murray and Lopez, 1996) put the traditional child disease problems of malnutrition, diarrhoeal diseases and acute respiratory diseases at the top of rankings in 1990, but chronic diseases and mental health problems were expected to rank at the top levels in 2020. In order to strengthen international and national efforts to control and manage the chronic disease "epidemic" WHA resolutions on different aspects of chronic diseases have been passed during recent years (e.g. WHA53.17 in 2000).
Mental health is also a major growing global concern. Depression, particularly among older people, is expected to be one of the greatest components of the global burden of disease in 2020 (Murray and Lopez, 1996; WHO, 2002). There are several ways by which local climate change can influence the mental health status of the local population (Berry et al., 2007), and adaptation may in itself cause mental stress as this report will discuss. A major WHA resolution on mental health (WHA28.84) has raised the visibility of the issue and a number of papers in the Lancet in 2007 (e.g. Prince et al., 2007) has highlighted how important this health problem will become.
This report will discuss issues around the measurement of health impacts in the form of Disability Adjusted Life Years (DALYs) (Murray and Lopez, 1996). The Years Lived with Disability (YLDs) are not only a function of the duration of disability for a specific chronic disease or mental health condition, but also a function of the clinical severity of the disease or condition. Increasing exposure to heat as an effect of climate change in already hot climates may cause significant deterioration of the clinical status of people with heart or lung disease, cancer or mental health conditions. With approximately half of the global burden of disease in the form of YLDs, even a small change in YLDs (say, 5-10%) would create major impact on the DALYs (few causes of disease burden account for more than 1% of the burden).
The focus of this report is on existing and missing knowledge about factors of relevance to the prevention of chronic conditions and mental health problems including: climate factor exposures, vulnerability, adaptation to prevent exposure or effects, increasing resilience and the role of the health system. While reviewing these topics it became very obvious that there is a serious communication gap between the part of the scientific community that has dealt with "climate and health" during recent decades (the thermal physiologists/ergonomists) and the part that is dealing with "climate change and health"(public health/social workers/world agencies). The excellent and substantial review of the "climate and health" issue by Parsons (2003) gives an insight into many of the fundamental questions concerning climate change and health, and it highlights how much of the essential evidence required to effectively manage these problems is actually missing.
3
2. CLIMATE CHANGE TRENDS AND PROJECTIONS
During recent years increasing attention has been paid to the health impacts of global climate change. The latest international evaluation of the cause and effects of climate change (IPCC, 2007) has concluded that greenhouse gases from human activities are a major cause of the ongoing climate change at planetary level. At local level in urban areas, urban densification and expansion of tarseal and concrete on the ground, as well as heat emissions from local energy sources (including air conditioning units) contribute to local climate change via the so-called "heat island effect" (Oke, 1973).
In most countries a significant part of greenhouse gas (GHG) emissions have their origin in electricity production from fossil fuels, major industry and road transport. These emissions are dominated by carbon dioxide (CO2) from the burning of coal, oil or gas products. In some countries the methane from cows and sheep are also major contributors to the GHG emissions. In order to prevent further climate change, the emissions of greenhouse gases must be significantly reduced and urban heat management methods need to be implemented. At the same time, policies and programs to adapt to climate change are needed which protect the population from the inevitable exposures of the changing climate.
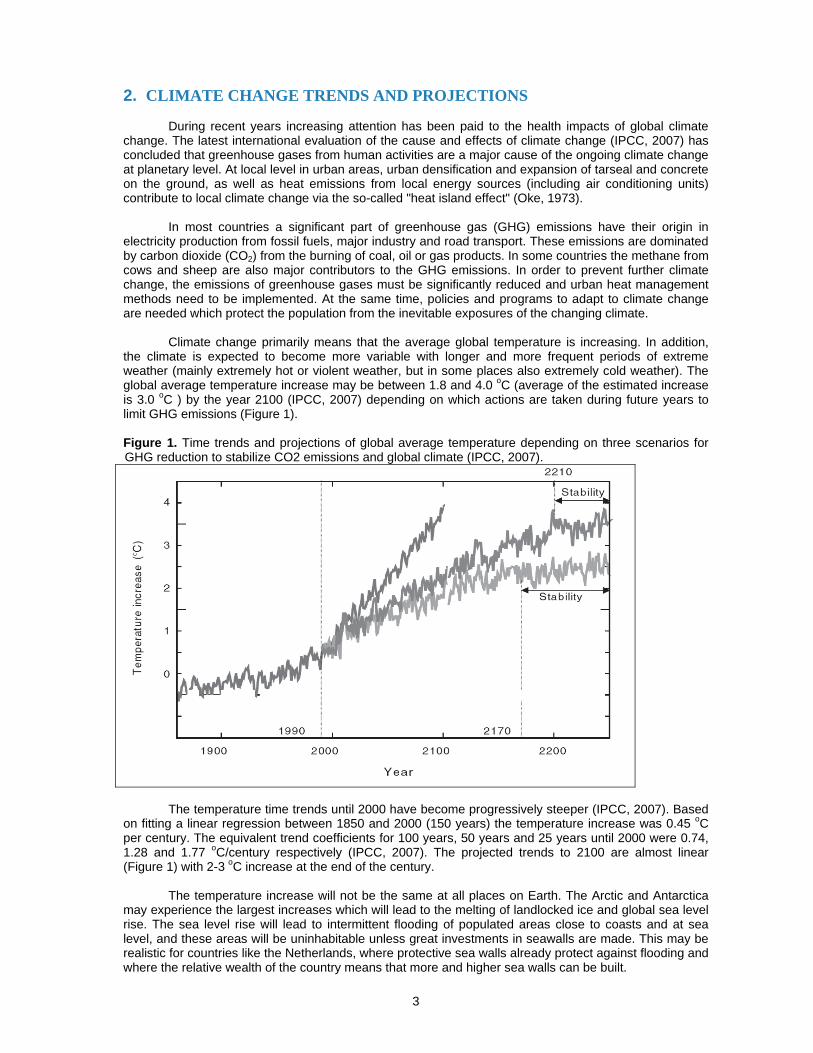
Climate change primarily means that the average global temperature is increasing. In addition, the climate is expected to become more variable with longer and more frequent periods of extreme weather (mainly extremely hot or violent weather, but in some places also extremely cold weather). The global average temperature increase may be between 1.8 and 4.0 oC (average of the estimated increase is 3.0 oC ) by the year 2100 (IPCC, 2007) depending on which actions are taken during future years to limit GHG emissions (Figure 1). Figure 1. Time trends and projections of global average temperature depending on three scenarios for GHG reduction to stabilize CO2 emissions and global climate (IPCC, 2007).
The temperature time trends until 2000 have become progressively steeper (IPCC, 2007). Based on fitting a linear regression between 1850 and 2000 (150 years) the temperature increase was 0.45 oC per century. The equivalent trend coefficients for 100 years, 50 years and 25 years until 2000 were 0.74, 1.28 and 1.77 oC/century respectively (IPCC, 2007). The projected trends to 2100 are almost linear (Figure 1) with 2-3 oC increase at the end of the century.
The temperature increase will not be the same at all places on Earth. The Arctic and Antarctica may experience the largest increases which will lead to the melting of landlocked ice and global sea level rise. The sea level rise will lead to intermittent flooding of populated areas close to coasts and at sea level, and these areas will be uninhabitable unless great investments in seawalls are made. This may be realistic for countries like the Netherlands, where protective sea walls already protect against flooding and where the relative wealth of the country means that more and higher sea walls can be built.
4
In low/middle income countries with long coasts (e.g. Bangladesh, India and China), however, it
will not be possible to protect large parts of the current inhabited areas and millions of people will be affected by flooding and the associated health risks. Eventually the population will have to move to higher ground, most likely experiencing increased poverty due to the dislocation and creating many "environmental refugees". The melting of inland ice shelves and glaciers (e.g in the Himalayas and the Andes) will cause another health risk: when the ice has fully melted, the water flow in downstream rivers will totally cease during parts of the year. Populations downstream will lose their main drinking water source and many of these populations are totally dependent on such water sources.
In the densely populated tropical and sub-tropical areas the highest temperature increases are mainly in inland areas. Within the large continents of these areas, the expected increase is 1-3 oC by 2020 and 3-5 oC by 2080. Maps in the IPCC (2007) report show that densely populated tropical areas within Latin America, Africa, India and Southeast Asia are expected to get substantial temperature increases. In these areas, the maximum temperatures during the hottest part of the year already exceed 40 oC. An additional 3-5 degrees will make daily life activities and work (e.g. in agriculture and construction work) very difficult to carry out during the hottest periods. In addition, vulnerable people with pre-existing diseases (communicable, chronic or mental) will be affected clinically during hot periods, and hospital admissions and mortality will increase due to heat exposure.
It should be emphasized that the changes in climate variables as expressed by global or regional atmospheric models will not necessarily be equal to the changes in human exposures to climate variables. The difference is related to local variations in the expression of climate change and behavioral patterns of the local population. A common concern in urban areas is the "heat island effect" (Oke, 1973) which creates higher heat exposure in densely populated urban areas with large areas covered in concrete buildings or tar-sealed roads that absorb solar heat radiation during the day in addition to the presence of heat-emitting vehicles and air conditioners. Actual population exposure can be reduced through cultural practices of adaptation to heat that are part of the daily routine (e.g. "siesta") and only needs slight modification to achieve adaptation. This difference between the "state of the environment" as measured by atmospheric variables and the actual human exposure has been analyzed in the context of WHO environmental health indicators (Kjellstrom and Corvalan, 1995).
Several billions of people will be affected and air conditioning is not an option for outdoor activities or for low-income groups. Air conditioning reduces heat exposure indoors, but the running costs can be high and too expensive for large swathes of the population both for residential homes and workplaces. In addition, the energy consumption of air conditioning contributes to the greenhouse gases that cause global warming. Alternative methods to create an acceptable indoor climate are therefore of great importance, including building design that creates natural ventilation, building materials that isolate against heating of the indoor air, and urban design, including “greening” the environment, that reduces direct heat exposure and the "heat island effect" (Oke, 1973).
The increasing temperature at the Earth's surface is expected to lead to an increasing amount of water vapour in the air, and increasing rain in some areas, while in other areas it will be drier (IPCC, 2007). In addition, hurricanes and typhoons will increase in frequency and the wind speeds within them will be greater, likely leading to more widespread damage.
Those least responsible for climate change will be the most affected. This includes the poor from
developing countries and even indigenous peoples whose livelihoods have become threatened.
5
3. OVERVIEW OF HEALTH IMPACTS OF CLIMATE CHANGE
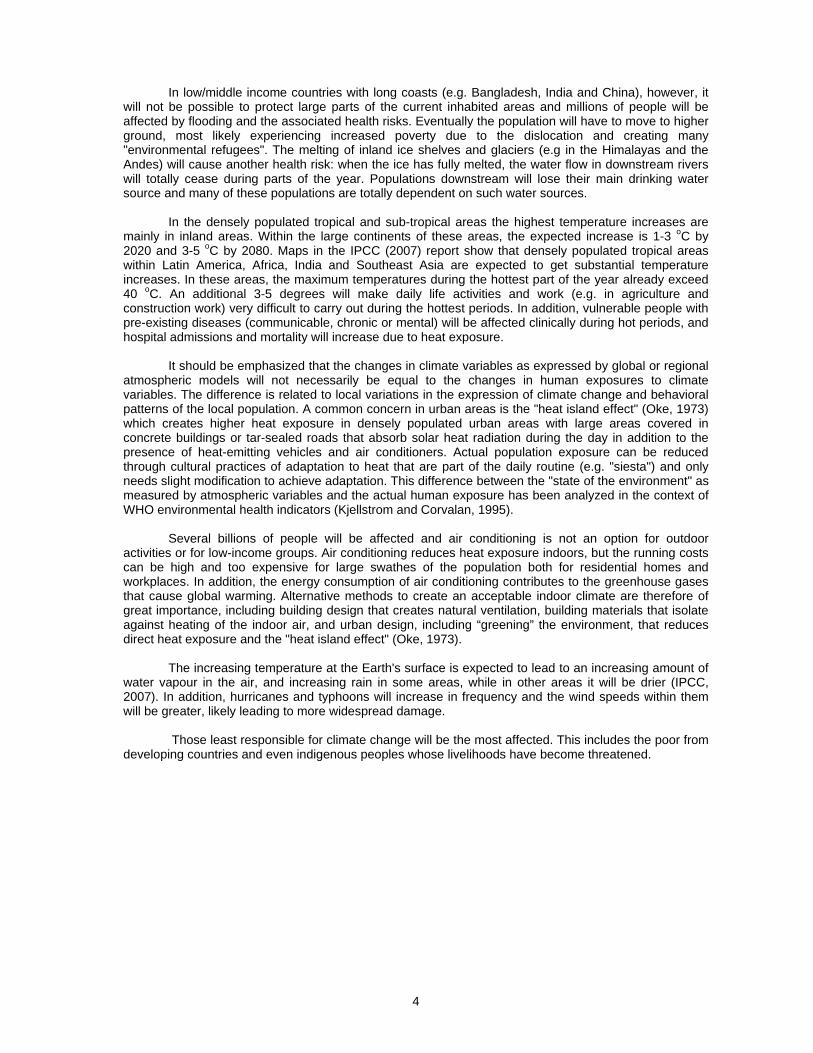
These changes in the climate may lead to a large number of dead and injured in extreme weather situations, floods, droughts. There is also the possibility of increased cases of infectious diseases and vector-borne diseases, as well as lack of food due to the weather calamities. Increasing temperatures in combination with high air humidity will also lead to heat wave deaths, especially among the elderly and young children. These types of effects are of course already occurring in hot parts of the world as a result of climate variable exposures, and climate change will exacerbate the health challenges. Heat exposure will also create difficulties in carrying out physical and mental work tasks (Parsons, 2003; IPCC, 2007). Figure 2 summarizes the different health effects and the causal pathways. Figure 2. Pathways for health effects of global climate change (Source: McMichael et al, 2003)
It is possible to conceive of chronic disease and mental health issues associated with each of the
health effects listed at the right side of the figure. Temperature-related illnesses and deaths are to a great extent induced via effects on the cardiovascular system. Recurring, chronic, exposures can lead to dehydration and chronic kidney disease. Heat exhaustion can also have mental health consequences. Extreme weather-related effects on mental health include post-traumatic stress syndrome. Air pollution (e.g. ozone, PM10) affects the respiratory and cardiovascular systems and can cause chronic conditions. Water- and food-borne diseases are essentially communicable disease issues, but they may be associated with psychological stress due to lack of water access for drinking or farm use. Diminishing water quality and quantity can also cause additional heat stress for people (mainly women) who have to carry water longer distances to their household. Vector-borne diseases are essentially acute and communicable. Food shortages will affect the victims' mental state and malnutrition during childhood is a risk factor for certain chronic diseases. Population displacement creates major mental stress.
One way of assessing the overall health impact of climate change is to use the Global Burden of Disease (GBD) methodology (Pruss-Ustun and Corvalan, 2006). The method estimates the number of deaths in a population that are preventable, using whichever country that currently has the lowest mortality rate as a baseline. Attributable risk is then assigned to climate change (or any other exposure factor) for the relevant disease types in order to calculate the number of preventable deaths that are due to climate change. This calculation produces a YLL (Years of Life Lost) due to climate change. For each of the relevant diseases there is also a calculated YLD equivalent to the preventable non-fatal ill health in this population. If the attributable risk is applied to the YLDs, the morbidity part of the preventable ill health can be calculated. The sum of YLL and YLD is the burden of disease and injury expressed in DALYs. It is very difficult to produce valid attributable risks for climate change exposures, and so far no detailed estimate using DALYs has been produced. An attempt was made (McMichael et al., 2004) but it was decided to simply calculate the likely number of deaths due to different health problems caused by the limited climate change that occurred between 1990 and 2000 (Table 1).
Air pollutionlevels
Contaminationpathways
Transmissiondynamics
Natural ecosytems& Agriculture
HEALTH EFFECTSTemperature-relatedillness, death
Extreme weather-related health effects
Air pollution-relatedhealth effects
Water- and food bornediseases
Vector- and rodentborne diseases
Effects of food & watershortages
Effects of Populationdisplacement
Adaptationmeasures
Moderatinginfluences
GLOBALCLIMATE CHANGE
REGIONALWEATHERCHANGES:- heatwaves
- extreme weather
- temperature
- precipitation
6
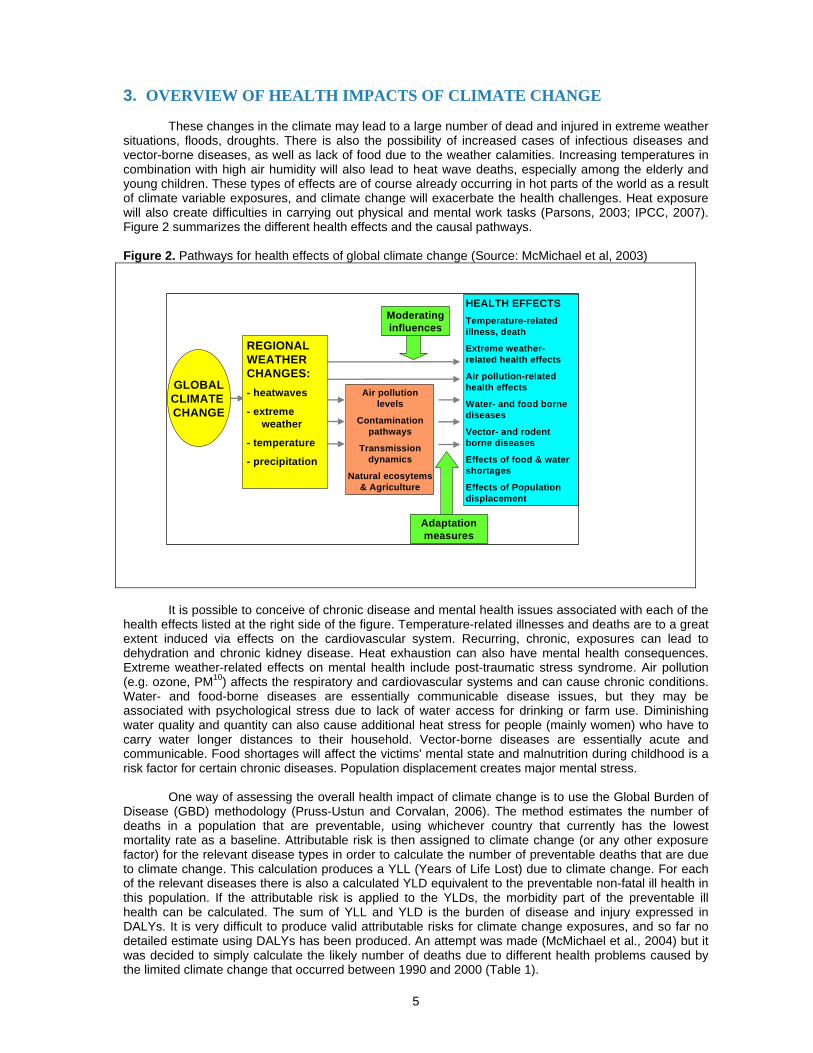
Table 1. Estimated number of deaths (thousands) in different WHO-regions likely to be caused by global climate change between 1990 and 2000. (Source: McMichael et al, 2004). WHO-region Mal-
nutrition Diarrhoea Malaria Floods,
extreme weather
Cardio- vascular disease
Total
AFR-D 8 5 5 0 1 19 AFR-E 9 8 18 0 1 36 AMR-A 0 0 0 0 0 0 AMR-B 0 0 0 1 1 2 AMR-D 0 1 0 0 0 1 EMR-B 0 0 3 0 0 3 EMR-D 9 8 0 1 1 19 EUR-A 0 0 0 0 0 0 EUR-B 0 0 0 0 0 0 EUR-C 0 0 0 0 0 0 SEAR-B 0 1 0 0 1 2 SEAR-D 52 22 0 0 7 81 WPR-A 0 0 0 0 0 0 WPR-B 0 2 1 0 0 3 Total (T) 78 47 27 2 12 166 % of Total=T/166 47 28 16 1 7.2 100 Sub-total, D + E (S)
78 44 23 1 10 156
% , D + E = S/T 100 94 85 50 83 94
In Table 1, the six WHO regions are included with their abbreviations: AFR = African Region, AMR = American Region, EMR = Easter Mediterranean Region, EUR = European Region, SEAR = South East Asia Region, and WPR = Western Pacific Region. There are five country categories (A to E) based on national life expectancy and public health status with D and E being the worst, including countries with the lowest economic status.
The table shows that during this limited period of assessment it is concluded that increased malnutrition (due to reduced agricultural production as a result of climate change induced drought, etc.) causes about half of the estimated 166,000 additional deaths. Diarrhoeal disease due to increased lack of clean drinking water is the second largest health effect of current climate change, followed by vector-borne diseases, mortality from heat exposure (CVD = cardiovascular diseases) and extreme weather damage (floods). The poorest countries with the worst health situation (in the D and E categories) are the victims of 94% of the calculated climate change related deaths (Table 1). The deaths in the three first disease categories are primarily among infants and young children. It is expected that socioeconomic development, particularly in India (SEAR-D), will reduce these effects of climate change. An ageing population in most parts of the world will most likely increase the number of people vulnerable to cardiovascular disease deaths during heat waves. Thus, the relative distribution of estimated deaths is likely to shift towards the right side of Table 1.
This table is a minimalist approach to quantifying the health impact of climate change as it only covers deaths and a selection of potential climate change-related deaths. It does not include physiological effects on human performance and comfort (Parsons, 2003), which are issues of importance for the economic status and mental/physical well-being of exposed people. The chronic disease and mental health concerns discussed in this report were also not included in this first estimate of the global burden of disease related to climate change (McMichael et al., 2004). An updated calculation of the global burden of disease due to climate change until 2005 (including estimates of morbidity impacts) is currently in progress under WHO guidance.
The health impacts of climate change are expected to increase substantially as change in the climate progresses, unless effective adaptation methods can be applied in all parts of the world. The vulnerability of the lowest income countries is obvious from Table 1, and one way to reduce the specific health impacts of climate change would be to reduce that vulnerability via major efforts to reduce the risk of malnutrition, diarrhoeal diseases and vector-borne diseases in the most affected populations. In addition, mitigation actions to reduce the degree of change in the global and local climate are essential to prevent health risks in all countries. Specifically, developed nations need to reduce GHG emissions and developing nations must follow such examples as they grow economically.
7
4. DEFINITION OF CHRONIC DISEASES AND MENTAL HEALTH CONDITIONS IN THIS REPORT
In health policy analysis the distinction between acute diseases and chronic diseases is often made. Usually "acute" in this context really refers to communicable diseases, which in general have a rapid development in the individual, last for a relatively short time and in many cases only occur once because the affected person develops immunity. Injuries are also of an "acute" nature, but they will in many cases lead to long-lasting disabilities if the initial injury cannot be fully healed. This type of "chronic" ill health can also develop after an infection, but may be less common. In any case, when we evaluate the chronic disease and mental health impacts of climate change, it is very important to include these long lasting, and often severely disabling, chronic conditions in the analysis.
Mental illnesses can be of either acute or chronic character, but are also considered as separate types of diseases. The remaining disease combination is what is usually considered "chronic diseases". "Chronic" is defined in a recent WHO document (WHO, 2008e) as "occurring over a long period of time -- several weeks months or years. The term is used to describe recurring symptoms of disease". In another document (WHO, 2005a) chronic diseases and chronic conditions are defined as “health problems that require ongoing management over a period of years or decades”. Thus, chronic diseases last for long time, often for life, but can be managed effectively with drugs or other treatment to reduce the clinical impact on the individual. The major categories usually included in this disease grouping are cardiovascular diseases, cancers, chronic respiratory diseases, diabetes and neurological diseases (WHO, 2005b). In addition, there are mechanistic links with more uncommon disease categories, such as kidney stones, which have recently been associated with climate factors and climate change in the USA (Brikowski, et al., 2008).
Exposure to hot climate also has "acute" effects that are not usually defined as "disease" such as heat exhaustion related to high heat exposure (as described above). These exposures and short-term effects will occur every day during a hot period, and such exposure and effect situations will increase as the heat exposure goes up with climate change. One could argue that these effects become "chronic" because the exposure is repeated every day and the daily impacts are the same unless effective adaptation precautions are taken. For instance, a person who is physically active in conditions of high heat exposure will experience an increased core body temperature above the usual 37 oC (see Section 5.2). If this temperature regularly reaches 38 oC there is no lasting impact on health, but if the core body temperature every day reaches above 38 oC, or even above 39 oC, the risk of acute health impact (heat stroke) increases (see Section 5.2). There may also be an increased risk of specific chronic diseases or mental ill-health after long-term daily exposures to such high levels of body temperature, due to impacts of blood temperature on metabolic mechanisms. The same potential for chronic health damage can be suspected if every day a person suffers substantial dehydration due to a high level of sweating (caused by heat exposure and physical activity) and lack of replacement of sweat by water or other fluid intake. Thus, without adaptation for heat protection, the impact may be long-term reduced well-being or disability, and in this report these effects will be discussed in the context of chronic diseases.
Another mechanism for chronic disease development is the increased exposure to air pollution due to climate change that causes higher levels of ozone in the air (see Section 5.3). It should be noted that increased exposure can also be due to increased daily respiration of air, as an effect of heat exposure. The physiological reaction to heat exposure includes an increased heart rate and a related increase of respiratory volume (Parsons, 2003). This reaction would increase the daily intake of any environmental hazards in the air: urban air pollutants, allergenic pollens and other dusts, industrial air pollution, pesticides sprayed in agriculture, etc. In addition, chronic conditions can be caused, particularly in occupational settings, by increased skin absorption of toxic chemicals when exposure to heat increases (Johanson and Boman, 1991).
The major impacts on mental health of climate change factors are likely to be associated with the stress and shock of weather extremes: storms, droughts, floods, etc. (Berry et al., 2007). The "oppressive environment" of extreme heat exposure will increase daily acute mortality in many parts of the world (Kovats and Hajak, 2008) during hot seasons, and in survivors mental stress will increase, even to the extent of an increased suicide risk (Page et al., 2007). Increased suicide is also an effect in farmers affected by drought in Australia (Berry et al., 2007). Weather catastrophes of the type that occurred in New Orleans in 2006 will also create dramatic effects on many affected individuals, for instance in the form of post-traumatic stress syndrome. In places affected by sea level rise and extreme weather, a

8
number of people will also become "environmental refugees" with a need for major displacement and succumbing to depression and trauma (Campbell and Campbell, 2007; Haq et al., 2007) .
9
5. LINKAGES AND PATHWAYS, CHRONIC DISEASES
5.1 Exposure and effect pathways
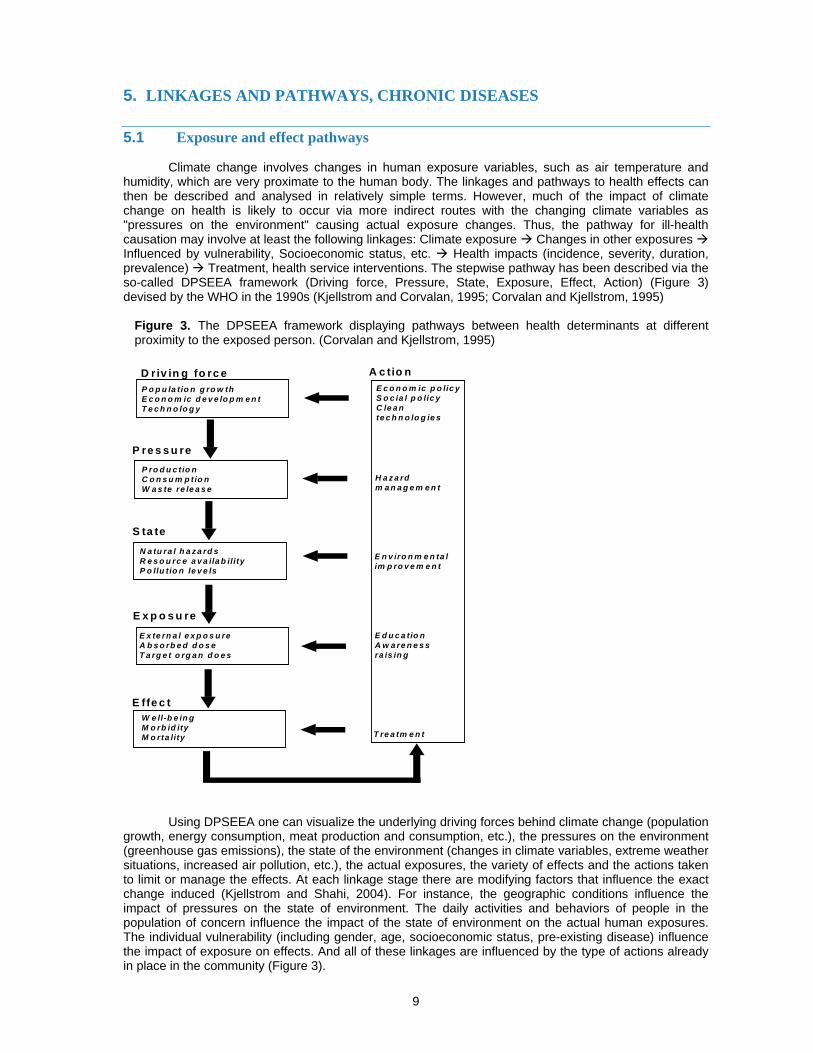
Climate change involves changes in human exposure variables, such as air temperature and humidity, which are very proximate to the human body. The linkages and pathways to health effects can then be described and analysed in relatively simple terms. However, much of the impact of climate change on health is likely to occur via more indirect routes with the changing climate variables as "pressures on the environment" causing actual exposure changes. Thus, the pathway for ill-health causation may involve at least the following linkages: Climate exposure Changes in other exposures Influenced by vulnerability, Socioeconomic status, etc. Health impacts (incidence, severity, duration, prevalence) Treatment, health service interventions. The stepwise pathway has been described via the so-called DPSEEA framework (Driving force, Pressure, State, Exposure, Effect, Action) (Figure 3) devised by the WHO in the 1990s (Kjellstrom and Corvalan, 1995; Corvalan and Kjellstrom, 1995)
Figure 3. The DPSEEA framework displaying pathways between health determinants at different proximity to the exposed person. (Corvalan and Kjellstrom, 1995)
E c o n o m ic p o lic yS o c ia l p o lic yC le a nte c h n o lo g ie s
H a z a rdm a n a g e m e n t
E n v iro n m e n ta lim p ro v e m e n t
E d u c a tio nA w a re n e s sra is in g
T re a tm e n t
A c tio nD riv in g fo rc eP o p u la tio n g ro w thE c o n o m ic d e v e lo p m e n tT e c h n o lo g y
P re s s u reP ro d u c tio nC o n s u m p tio nW a s te re le a s e
S ta te
N a tu ra l h a z a rd sR e s o u rc e a v a ila b ilityP o llu tio n le v e ls
E x p o s u re
E x te rn a l e x p o s u reA b s o rb e d d o s eT a rg e t o rg a n d o e s
E ffe c tW e ll-b e in gM o rb id ityM o rta lity
Using DPSEEA one can visualize the underlying driving forces behind climate change (population growth, energy consumption, meat production and consumption, etc.), the pressures on the environment (greenhouse gas emissions), the state of the environment (changes in climate variables, extreme weather situations, increased air pollution, etc.), the actual exposures, the variety of effects and the actions taken to limit or manage the effects. At each linkage stage there are modifying factors that influence the exact change induced (Kjellstrom and Shahi, 2004). For instance, the geographic conditions influence the impact of pressures on the state of environment. The daily activities and behaviors of people in the population of concern influence the impact of the state of environment on the actual human exposures. The individual vulnerability (including gender, age, socioeconomic status, pre-existing disease) influence the impact of exposure on effects. And all of these linkages are influenced by the type of actions already in place in the community (Figure 3).
10
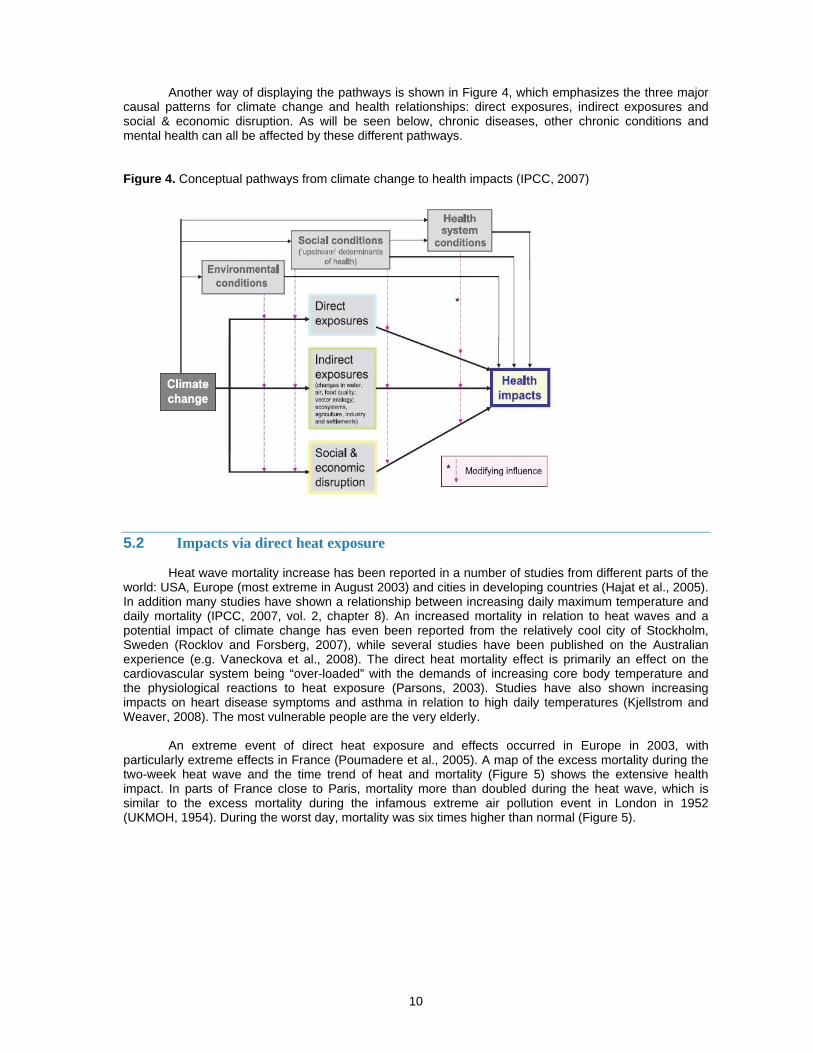
Another way of displaying the pathways is shown in Figure 4, which emphasizes the three major
causal patterns for climate change and health relationships: direct exposures, indirect exposures and social & economic disruption. As will be seen below, chronic diseases, other chronic conditions and mental health can all be affected by these different pathways. Figure 4. Conceptual pathways from climate change to health impacts (IPCC, 2007)
5.2 Impacts via direct heat exposure
Heat wave mortality increase has been reported in a number of studies from different parts of the world: USA, Europe (most extreme in August 2003) and cities in developing countries (Hajat et al., 2005). In addition many studies have shown a relationship between increasing daily maximum temperature and daily mortality (IPCC, 2007, vol. 2, chapter 8). An increased mortality in relation to heat waves and a potential impact of climate change has even been reported from the relatively cool city of Stockholm, Sweden (Rocklov and Forsberg, 2007), while several studies have been published on the Australian experience (e.g. Vaneckova et al., 2008). The direct heat mortality effect is primarily an effect on the cardiovascular system being “over-loaded” with the demands of increasing core body temperature and the physiological reactions to heat exposure (Parsons, 2003). Studies have also shown increasing impacts on heart disease symptoms and asthma in relation to high daily temperatures (Kjellstrom and Weaver, 2008). The most vulnerable people are the very elderly.
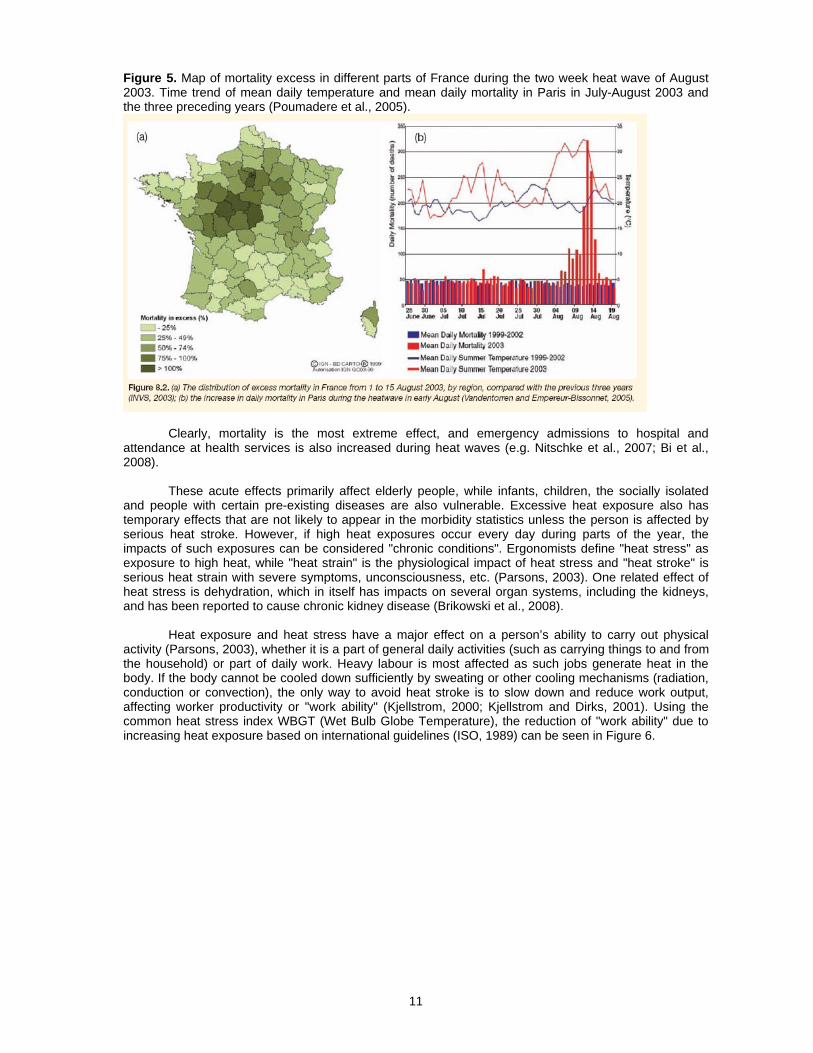
An extreme event of direct heat exposure and effects occurred in Europe in 2003, with particularly extreme effects in France (Poumadere et al., 2005). A map of the excess mortality during the two-week heat wave and the time trend of heat and mortality (Figure 5) shows the extensive health impact. In parts of France close to Paris, mortality more than doubled during the heat wave, which is similar to the excess mortality during the infamous extreme air pollution event in London in 1952 (UKMOH, 1954). During the worst day, mortality was six times higher than normal (Figure 5).
11
Figure 5. Map of mortality excess in different parts of France during the two week heat wave of August 2003. Time trend of mean daily temperature and mean daily mortality in Paris in July-August 2003 and the three preceding years (Poumadere et al., 2005).
Clearly, mortality is the most extreme effect, and emergency admissions to hospital and attendance at health services is also increased during heat waves (e.g. Nitschke et al., 2007; Bi et al., 2008).
These acute effects primarily affect elderly people, while infants, children, the socially isolated and people with certain pre-existing diseases are also vulnerable. Excessive heat exposure also has temporary effects that are not likely to appear in the morbidity statistics unless the person is affected by serious heat stroke. However, if high heat exposures occur every day during parts of the year, the impacts of such exposures can be considered "chronic conditions". Ergonomists define "heat stress" as exposure to high heat, while "heat strain" is the physiological impact of heat stress and "heat stroke" is serious heat strain with severe symptoms, unconsciousness, etc. (Parsons, 2003). One related effect of heat stress is dehydration, which in itself has impacts on several organ systems, including the kidneys, and has been reported to cause chronic kidney disease (Brikowski et al., 2008).
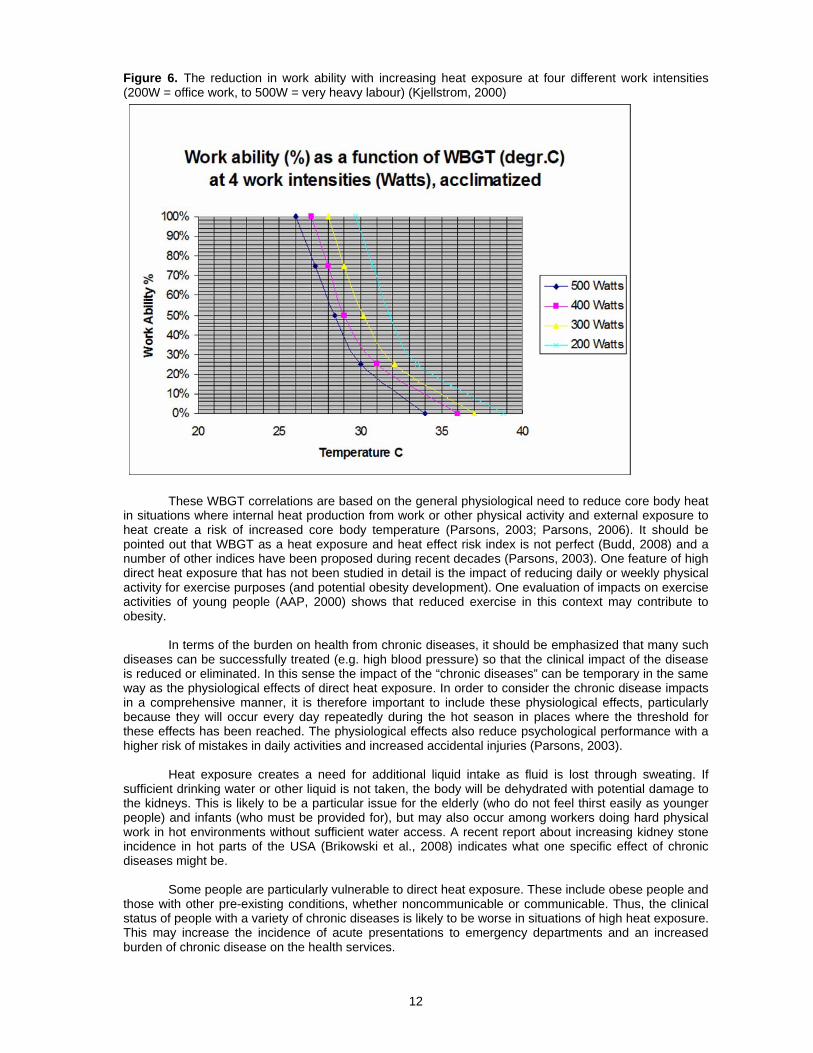
Heat exposure and heat stress have a major effect on a person’s ability to carry out physical activity (Parsons, 2003), whether it is a part of general daily activities (such as carrying things to and from the household) or part of daily work. Heavy labour is most affected as such jobs generate heat in the body. If the body cannot be cooled down sufficiently by sweating or other cooling mechanisms (radiation, conduction or convection), the only way to avoid heat stroke is to slow down and reduce work output, affecting worker productivity or "work ability" (Kjellstrom, 2000; Kjellstrom and Dirks, 2001). Using the common heat stress index WBGT (Wet Bulb Globe Temperature), the reduction of "work ability" due to increasing heat exposure based on international guidelines (ISO, 1989) can be seen in Figure 6.
12
Figure 6. The reduction in work ability with increasing heat exposure at four different work intensities (200W = office work, to 500W = very heavy labour) (Kjellstrom, 2000)
These WBGT correlations are based on the general physiological need to reduce core body heat in situations where internal heat production from work or other physical activity and external exposure to heat create a risk of increased core body temperature (Parsons, 2003; Parsons, 2006). It should be pointed out that WBGT as a heat exposure and heat effect risk index is not perfect (Budd, 2008) and a number of other indices have been proposed during recent decades (Parsons, 2003). One feature of high direct heat exposure that has not been studied in detail is the impact of reducing daily or weekly physical activity for exercise purposes (and potential obesity development). One evaluation of impacts on exercise activities of young people (AAP, 2000) shows that reduced exercise in this context may contribute to obesity.
In terms of the burden on health from chronic diseases, it should be emphasized that many such diseases can be successfully treated (e.g. high blood pressure) so that the clinical impact of the disease is reduced or eliminated. In this sense the impact of the “chronic diseases” can be temporary in the same way as the physiological effects of direct heat exposure. In order to consider the chronic disease impacts in a comprehensive manner, it is therefore important to include these physiological effects, particularly because they will occur every day repeatedly during the hot season in places where the threshold for these effects has been reached. The physiological effects also reduce psychological performance with a higher risk of mistakes in daily activities and increased accidental injuries (Parsons, 2003).
Heat exposure creates a need for additional liquid intake as fluid is lost through sweating. If sufficient drinking water or other liquid is not taken, the body will be dehydrated with potential damage to the kidneys. This is likely to be a particular issue for the elderly (who do not feel thirst easily as younger people) and infants (who must be provided for), but may also occur among workers doing hard physical work in hot environments without sufficient water access. A recent report about increasing kidney stone incidence in hot parts of the USA (Brikowski et al., 2008) indicates what one specific effect of chronic diseases might be.
Some people are particularly vulnerable to direct heat exposure. These include obese people and those with other pre-existing conditions, whether noncommunicable or communicable. Thus, the clinical status of people with a variety of chronic diseases is likely to be worse in situations of high heat exposure. This may increase the incidence of acute presentations to emergency departments and an increased burden of chronic disease on the health services.
13
5.3 Impacts via increased air pollution
One of the effects of an increasing temperature trend in cities is the increasing level of ozone in the air, assuming that motor vehicle emissions remain at current levels. Ozone is a major pollutant formed when emissions from motor vehicles and UV radiation from sunshine react in air (WHO, 2005c). Its formation is faster and greater when the air temperature increases, as happens with climate change. Ozone is one of the major air pollutants that increase the incidence and mortality of heart and lung diseases as well as causing respiratory irritation symptoms (WHO, 2006). The efforts to reduce health-damaging air pollutants as well as greenhouse gases in motor vehicle exhaust will most likely reduce emissions from new vehicles, but in many cities older vehicles will remain on the roads for a long time. In addition, the increasing number of vehicles in many cities, particularly in developing countries, will counteract the improvements in engine technology and total pollution emissions in an area will still increase. Thus, it is prudent to assume that vehicle emissions in major cities will not decrease and that climate change will lead to increasing ozone exposures for residents.
In Australia, the combined effects of heat exposure and various air pollutants has been studied (Kjellstrom et al., 2002; Ren and Tong, 2006) and it is likely that not only ozone but also other urban air pollutants can have increased effects during periods of high heat exposure. A particular type of air pollutant that affects many people is aeroallergens (Beggs, 2004), to which the annual pattern of exposure has been shown to shift as a result of climate change (Beggs, 2004).
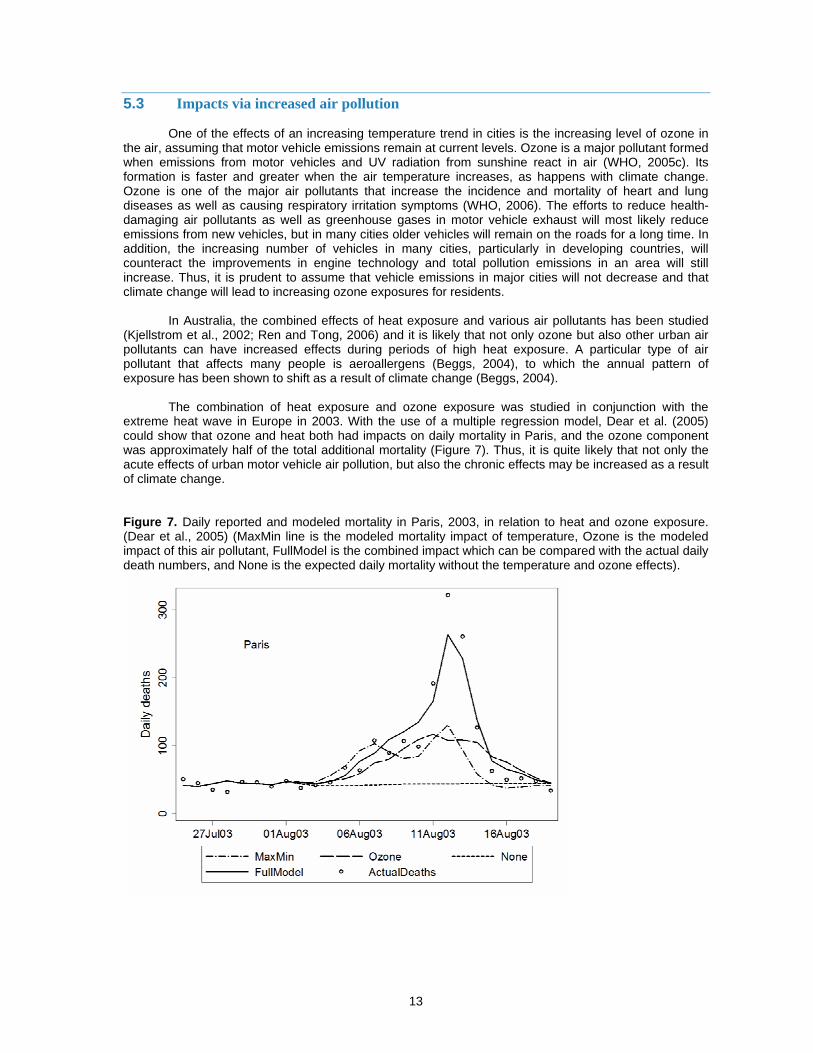
The combination of heat exposure and ozone exposure was studied in conjunction with the extreme heat wave in Europe in 2003. With the use of a multiple regression model, Dear et al. (2005) could show that ozone and heat both had impacts on daily mortality in Paris, and the ozone component was approximately half of the total additional mortality (Figure 7). Thus, it is quite likely that not only the acute effects of urban motor vehicle air pollution, but also the chronic effects may be increased as a result of climate change. Figure 7. Daily reported and modeled mortality in Paris, 2003, in relation to heat and ozone exposure. (Dear et al., 2005) (MaxMin line is the modeled mortality impact of temperature, Ozone is the modeled impact of this air pollutant, FullModel is the combined impact which can be compared with the actual daily death numbers, and None is the expected daily mortality without the temperature and ozone effects).
14
5.4 Impacts via malnutrition
Malnutrition due to climate change is expected to have the largest current impact on climate change related mortality from 1990-2000 (Table 1). This is primarily based on estimates of the impact of drought and other climate calamities on food production among subsistence farmers in rural areas of low-income countries. However, as has been seen lately (McMichael et al., 2007), an imbalance between global food production and consumption as well as shortages partly due to climate change (e.g. lower production in Australia) has created new health risks and rapidly increasing food prices around the world. The push during recent years for production of biofuels as a climate change mitigation method has also contributed to increasing food prices.
One result of the increased prices is that poor urban populations with limited or no ability to produce food themselves have less access to food. This is likely to increase malnutrition among pregnant women, their fetuses and children of poor urban families, with risk for later vulnerability to chronic diseases (see Knowledge Network on Early Childhood Development (KNECD) 2007); effects on brain, heart, kidney, liver, etc.). In addition, these families may get less access to fruit and vegetables resulting in increased risk of cancer and cardiovascular diseases.
The KNECD report deals with these issues in substantial detail and they will not be described here. Malnutrition exposures of pregnant women and young children are the most damaging, and some studies show links to chronic diseases.
5.5 Impacts via extreme weather and sea level rise
As mentioned earlier, climate change is likely to create more extreme weather variability as well as a slowly increasing global temperature (IPCC, 2007). These conditions will have serious impacts on population health in many parts of the world (Kirch et al., 2005). There is also the risk of substantial sea level rise, which may force the displacement of millions of people (McGranahan et al., 2007). At the same time, extreme weather situations will cause emergencies through floods, landslides blocking roads and damaging houses, windy typhoons or hurricanes damaging electricity supply, water supply, buildings and other infrastructure. The most vulnerable will be poor people and people with pre-existing chronic diseases or disabilities, and the greatest population impacts are likely to be in densely populated cities with large informal living quarters, also called slums(Haq et al., 2007; de Sherbinin et al., 2007). The flooding of New Orleans in 2005 and the effects on elderly rest home patients and poor people, who could not evacuate because of lack of transport, gave a striking example of what can happen in affected areas even in industrialized nations.
Injuries caused by such conditions and leading to long-term disabilities may be classified in the “chronic ill-health” category. People with pre-existing chronic diseases will be particularly vulnerable to acute deterioration of their condition. In addition, lack of access to pharmaceuticals for people with diabetes, high blood pressure, and other chronic diseases requiring continuous medication will make their condition worse, and people relying on electrical equipment for their survival are at extreme risk if there are power cuts.
5.6 Impacts via communicable or vector-borne diseases
Those with communicable diseases will suffer from excessive heat exposure and the extreme weather conditions in a similar manner to those with pre-existing chronic diseases. Their clinical condition may worsen and the health services may face increased demand for emergency treatments. Some vector-borne diseases, such as malaria, are also a recurrent problem, which can affect the same victim numerous times in a similar manner to chronic conditions. The life cycle of some of the vectors will change, possibly increasing the exposure to “chronic” levels.
5.7 Impacts via increased exposure to other environmental hazards
As mentioned in Section 4, there is the potential for increased exposure to any hazard in the air, as direct heat exposure may increase the daily respiratory volume. This may be a particular problem for people with a regular high level of physical activity, such as workers doing heavy labour. However, it

15
would also potentially affect anyone who walks or bicycles, people doing exercise, children playing, etc. Meanwhile, skin absorption of toxic chemicals is greater during high heat exposure, as mentioned. Thus, farmers, construction workers and factory workers handling toxic chemicals may be at higher risk of developing chronic diseases due to the chemicals as climate change increases heat exposure.
16
6. LINKAGES AND PATHWAYS, MENTAL HEALTH
The links between mental health conditions and climate factors have received less attention in research to date. Therefore, much of the description here is based on conjecture and future research is needed to confirm the linkages. Mental health conditions account for about one seventh of the global burden of disease (Prince et al., 2007) and it was predicted in the first global burden of disease assessment (Murray and Lopez, 1996) that by 2020 mental health problems (particularly depression among older people) could become one of the most prominent components of the global burden of disease. An updated analysis (Mathers and Loncar, 2006) indicates that the mental health burden may become number two in the ranking of global health problems by 2030.
6.1 Impacts via direct heat exposure
Mental stress through heat-related exhaustion (Hales and Richards, 1987) can be severe, particularly if the person exposed is not in a position to take action to cool down. The recorded effects in psychological tests are diminished mental task ability (Ramsey, 1995) and increased accident risk (Ramsey et al., 1983). These effects have been attributed primarily to workplace situations, but they may occur in a similar manner in other daily household situations.
A person's experience of increasing "fatigue" can be measured with objective performance tests or with subjective perception scales (Williamson et al., 2001). Perceived fatigue in relation to sleep deprivation and alcohol intake has been measured by questionnaire according to standard protocols (Williamson et al., 2001) and compared with performance tests. The questionnaire data can be validated with a range of computer-based performance tests of fatigue (e.g. Simple reaction time, unstable tracking, dual task, Mackworth clock vigilance test, symbol digit coding and sequential spatial memory; Williamson et al., 2001).
Another aspect of heat stress exposure is the isolation experienced by elderly or other sensitive people. Some people may decide to not venture outdoors during hot days while they are protected from the outdoor heat by air conditioning in the home. This will disrupt regular social activities, such as visits to friends or community activities, and can cause depressed thoughts. A study of hospital admissions in Adelaide, Australia (Nitschke et al., 2007), found an increased incidence of hospital admissions in mental health diagnosis during heat waves. At the same time, if people spend substantial time outdoors or are not protected by air conditioning while indoors, they risk heat stroke (Section 5.2).
Direct effects of heat exposure can be measured in the form of "thermal comfort" (Parsons, 2003) and several indices of comfort level and the relationships to heat exposure have been developed. Continued exposure to sub-optimal thermal comfort may become a mental stress and a mental health issue for people who feel powerless to improve their comfort level.
6.2 Impacts via malnutrition
Malnutrition during early childhood can lead to a lack of cognitive development (KNECD, 2007). Such effects may then lead to mental disadvantages and potentially, mental health problems that last for the entire life of the affected person.
6.3 Indirect impacts via extreme weather events
The link between weather disasters and mental health problems is often described in conjunction with serious disasters (Kirch et al., 2005). This is a common phenomenon in heavily-populated disaster prone areas of Asia, Africa and Latin America, and the catastrophe in New Orleans in 2005 proves that it can strike in high income countries too.
The mental stress caused by a weather calamity killing or injuring family members or friends is well-documented (Raphael, 1986). In addition, the loss of property (house, farm buildings, livestock, vehicles, etc.) can be substantial, and the resulting mental stress can be extreme (McFarlane et al., 1997). In some people this leads to chronic conditions like post-traumatic stress syndrome.
17
6.4 Indirect impacts via effects on farm production
Increased suicides among farmers affected by drought has been reported from Australia (Berry et al., 2008), and this is likely to occur in other farming areas affected by weather calamities.
6.5 Other pathways
The additional exposures to other environmental hazards and toxic chemicals mentioned earlier may also lead to mental health problems, if the specific effect of the hazard or chemical is a mental disease or deficiency.
18
7. TRENDS OF CLIMATE CHANGE AND HEAT EXPOSURES IN SELECTED CITIES
7.1 Data sources and methods
The future effects of climate change will naturally depend on the extent of change of climate variables at ground level where humans spend time and the increased health risk per unit of climate change. The health effects of climate change will also depend on interactions with other variables as described earlier such as air pollution exposure and the prevalence of pre-existing diseases in the population.
A newly developed “Population Heat Exposure Profile” (PHEP) (Kjellstrom and Lemke, in preparation) is undergoing testing in different cities and will be used here to highlight the exposure variables of interest for future analysis of health impacts. For the purposes of this report, it would seem useful to include at least one city in each WHO region, and a selection of major cities in low-income and high-income countries. Daily data since 1980 is required for our analysis of time trends during the period when global climate change has been most notable (IPCC, 2007).
The PHEP uses local data in a global database collated by the US National Oceanographic and Atmospheric Agency (NOAA) from several thousand weather stations around the world. Daily averages of a set of climate data can be downloaded free of charge from historical collections that go as far back as 1960. Hourly averages can be purchased on CD. The NOAA data and the derived heat stress estimates (WBGT) are described in Table 2. At some sites the extent of cloud cover or the number of sunshine hours are also recorded. The detailed method for calculating WBGT from weather station data will not be described here, but is available from the authors (Lemke and Kjellstrom, to be published).
WBGT (Wet Bulb Globe Temperature) is a well-established index of heat stress widely used to warn about excessive human heat exposure, particularly in occupational health (Parsons, 2003). It is a combined index of the four fundamental climate factors determining human exposure: air temperature, humidity, air movement (wind-speed) and radiated heat (e.g. solar radiation). An international standard for maximum allowable heat stress uses WBGT (ISO, 1989) and this makes it possible to estimate the loss of ability to work or ability to carry out daily household tasks due to increased heat exposure (Kjellstrom, 2000; Kjellstrom, in preparation).
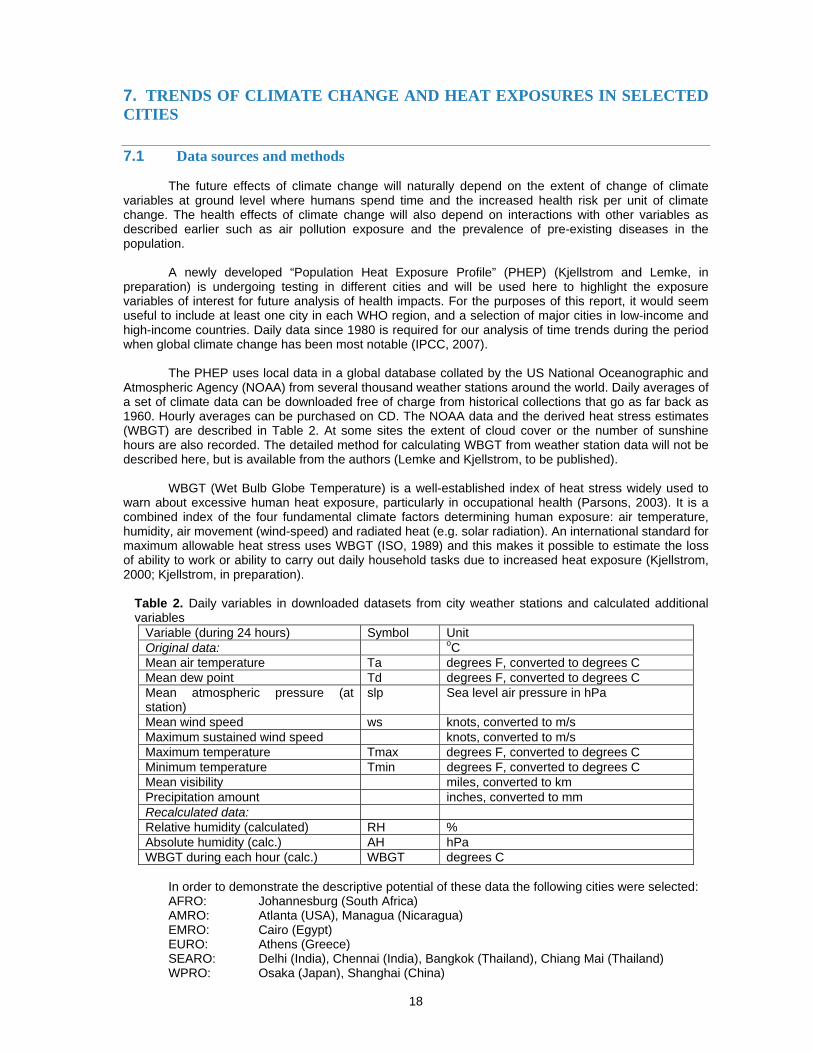
Table 2. Daily variables in downloaded datasets from city weather stations and calculated additional variables
Variable (during 24 hours) Symbol Unit Original data: oC Mean air temperature Ta degrees F, converted to degrees C Mean dew point Td degrees F, converted to degrees C Mean atmospheric pressure (at station)
slp Sea level air pressure in hPa
Mean wind speed ws knots, converted to m/s Maximum sustained wind speed knots, converted to m/s Maximum temperature Tmax degrees F, converted to degrees C Minimum temperature Tmin degrees F, converted to degrees C Mean visibility miles, converted to km Precipitation amount inches, converted to mm Recalculated data: Relative humidity (calculated) RH % Absolute humidity (calc.) AH hPa WBGT during each hour (calc.) WBGT degrees C
In order to demonstrate the descriptive potential of these data the following cities were selected:
AFRO: Johannesburg (South Africa) AMRO: Atlanta (USA), Managua (Nicaragua) EMRO: Cairo (Egypt) EURO: Athens (Greece) SEARO: Delhi (India), Chennai (India), Bangkok (Thailand), Chiang Mai (Thailand) WPRO: Osaka (Japan), Shanghai (China)
19
Descriptions of basic yearly climate trends since 1980:
The yearly averages of daily mean temperatures, daily minimum temperatures, and daily maximum temperatures are plotted and the regression lines calculated in order to show whether local temperature change has occurred. These trends display the combined impact of local "heat island" effects as well as any general atmospheric temperature trends in that location. Hourly diurnal variations of selected heat variables and the WBGT heat index by month
For the cities apart from Atlanta (for which hourly data were not yet easily accessible), data from 1999 were used as an example of a typical recent year. The PHEP produces average hourly data for each month (with 95% tolerance limits), but here we will only show examples from some cities for the coldest and hottest months. Estimates of the loss of work ability as an indication of physiological heat stress
The calculated loss of work ability is a quantifiable impact of climate variables based on a physiological model (Parsons, 2003) and the international standard for maximum heat exposure (ISO, 1989). We will show results for selected months. It is possible that the impacts of population heat exposure on chronic diseases and mental health can be quantified in a similar manner in the future once new research has documented the dose-response relationships. In the meantime, the impacts on work ability can be considered as one of the chronic conditions with a quantifiable link to climate change.
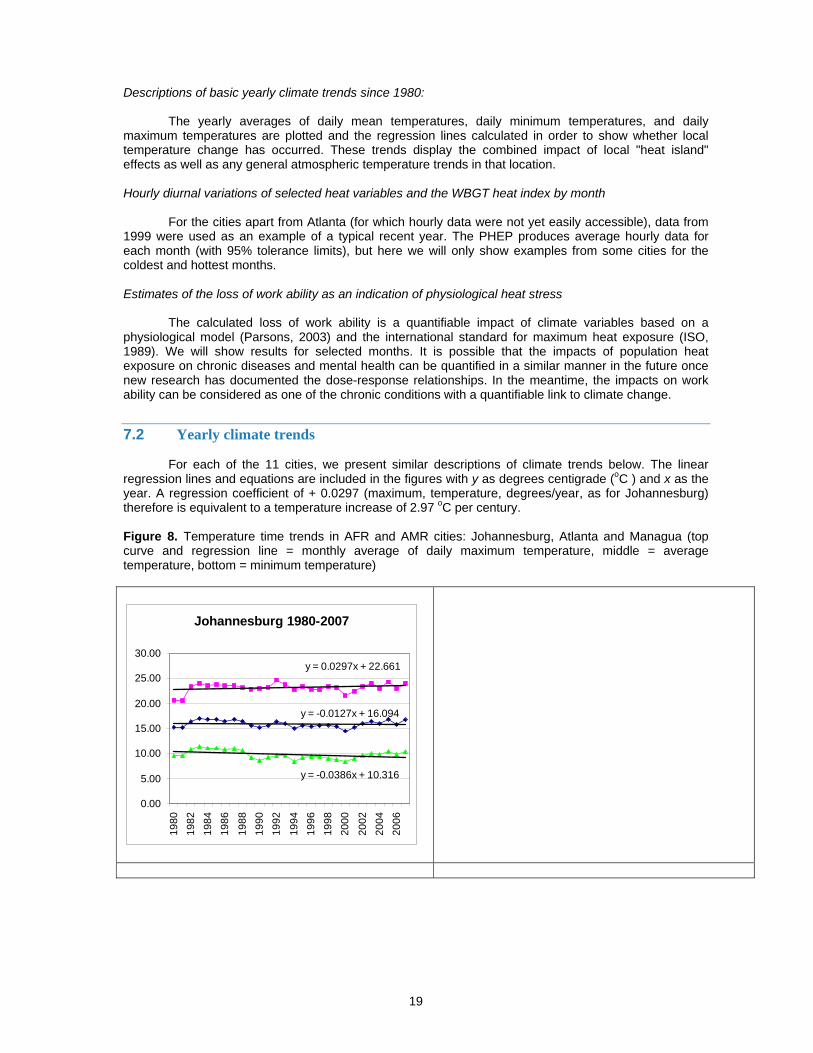
7.2 Yearly climate trends
For each of the 11 cities, we present similar descriptions of climate trends below. The linear regression lines and equations are included in the figures with y as degrees centigrade (oC ) and x as the year. A regression coefficient of + 0.0297 (maximum, temperature, degrees/year, as for Johannesburg) therefore is equivalent to a temperature increase of 2.97 oC per century. Figure 8. Temperature time trends in AFR and AMR cities: Johannesburg, Atlanta and Managua (top curve and regression line = monthly average of daily maximum temperature, middle = average temperature, bottom = minimum temperature)
Johannesburg 1980-2007
y = 0.0297x + 22.661
y = -0.0127x + 16.094
y = -0.0386x + 10.316
0.00
5.00
10.00
15.00
20.00
25.00
30.00
1980
1982
1984
1986
1988
1990
1992
1994
1996
1998
2000
2002
2004
2006
20
Atlanta 1980-2007
y = -0.0089x + 23.553
y = 0.0185x + 16.578
y = 0.0377x + 10.551
0.00
5.00
10.00
15.00
20.00
25.00
30.00
1980
1982
1984
1986
1988
1990
1992
1994
1996
1998
2000
2002
2004
2006
Managua - 1980-2007
y = 0.0351x + 22.031
y = 0.0129x + 27.378
y = 0.0027x + 32.805
15.0017.0019.0021.0023.0025.0027.0029.0031.0033.0035.0037.00
1980
1982
1984
1986
1988
1990
1992
1994
1996
1998
2000
2002
2004
2006
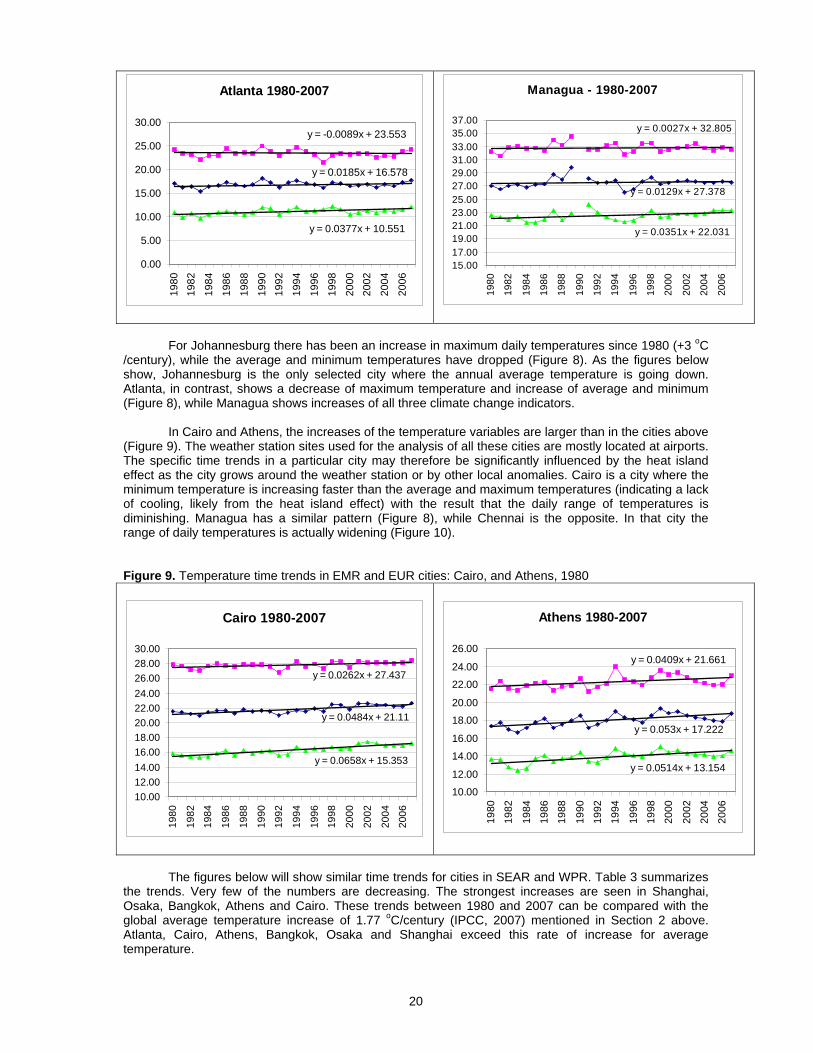
For Johannesburg there has been an increase in maximum daily temperatures since 1980 (+3 oC
/century), while the average and minimum temperatures have dropped (Figure 8). As the figures below show, Johannesburg is the only selected city where the annual average temperature is going down. Atlanta, in contrast, shows a decrease of maximum temperature and increase of average and minimum (Figure 8), while Managua shows increases of all three climate change indicators.
In Cairo and Athens, the increases of the temperature variables are larger than in the cities above (Figure 9). The weather station sites used for the analysis of all these cities are mostly located at airports. The specific time trends in a particular city may therefore be significantly influenced by the heat island effect as the city grows around the weather station or by other local anomalies. Cairo is a city where the minimum temperature is increasing faster than the average and maximum temperatures (indicating a lack of cooling, likely from the heat island effect) with the result that the daily range of temperatures is diminishing. Managua has a similar pattern (Figure 8), while Chennai is the opposite. In that city the range of daily temperatures is actually widening (Figure 10). Figure 9. Temperature time trends in EMR and EUR cities: Cairo, and Athens, 1980
Cairo 1980-2007
y = 0.0262x + 27.437
y = 0.0484x + 21.11
y = 0.0658x + 15.353
10.0012.0014.0016.0018.0020.0022.0024.0026.0028.0030.00
1980
1982
1984
1986
1988
1990
1992
1994
1996
1998
2000
2002
2004
2006
Athens 1980-2007
y = 0.0409x + 21.661
y = 0.053x + 17.222
y = 0.0514x + 13.154
10.00
12.00
14.00
16.00
18.00
20.00
22.00
24.00
26.00
1980
1982
1984
1986
1988
1990
1992
1994
1996
1998
2000
2002
2004
2006
The figures below will show similar time trends for cities in SEAR and WPR. Table 3 summarizes
the trends. Very few of the numbers are decreasing. The strongest increases are seen in Shanghai, Osaka, Bangkok, Athens and Cairo. These trends between 1980 and 2007 can be compared with the global average temperature increase of 1.77 oC/century (IPCC, 2007) mentioned in Section 2 above. Atlanta, Cairo, Athens, Bangkok, Osaka and Shanghai exceed this rate of increase for average temperature.
21
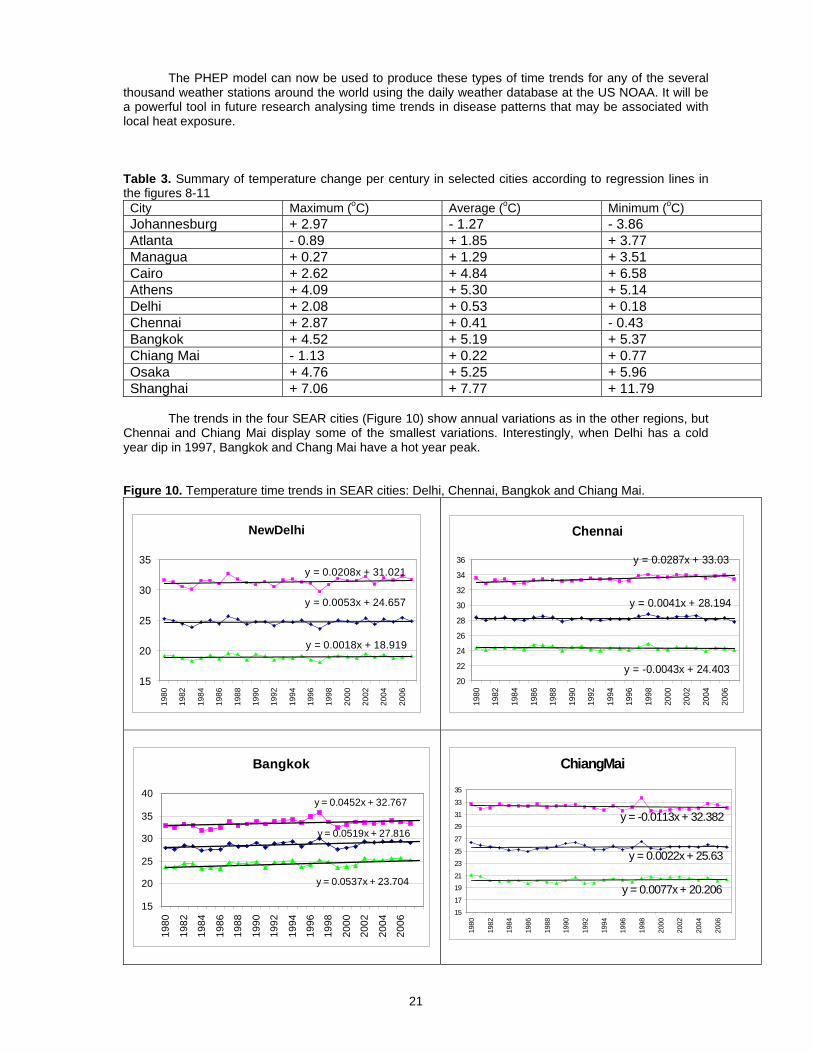
The PHEP model can now be used to produce these types of time trends for any of the several thousand weather stations around the world using the daily weather database at the US NOAA. It will be a powerful tool in future research analysing time trends in disease patterns that may be associated with local heat exposure. Table 3. Summary of temperature change per century in selected cities according to regression lines in the figures 8-11 City Maximum (oC) Average (oC) Minimum (oC) Johannesburg + 2.97 - 1.27 - 3.86 Atlanta - 0.89 + 1.85 + 3.77 Managua + 0.27 + 1.29 + 3.51 Cairo + 2.62 + 4.84 + 6.58 Athens + 4.09 + 5.30 + 5.14 Delhi + 2.08 + 0.53 + 0.18 Chennai + 2.87 + 0.41 - 0.43 Bangkok + 4.52 + 5.19 + 5.37 Chiang Mai - 1.13 + 0.22 + 0.77 Osaka + 4.76 + 5.25 + 5.96 Shanghai + 7.06 + 7.77 + 11.79
The trends in the four SEAR cities (Figure 10) show annual variations as in the other regions, but
Chennai and Chiang Mai display some of the smallest variations. Interestingly, when Delhi has a cold year dip in 1997, Bangkok and Chang Mai have a hot year peak. Figure 10. Temperature time trends in SEAR cities: Delhi, Chennai, Bangkok and Chiang Mai.
NewDelhi
y = 0.0208x + 31.021
y = 0.0018x + 18.919
y = 0.0053x + 24.657
15
20
25
30
35
1980
1982
1984
1986
1988
1990
1992
1994
1996
1998
2000
2002
2004
2006
Chennai
y = -0.0043x + 24.403
y = 0.0287x + 33.03
y = 0.0041x + 28.194
20
22
24
26
28
30
32
34
36
1980
1982
1984
1986
1988
1990
1992
1994
1996
1998
2000
2002
2004
2006
Bangkok
y = 0.0452x + 32.767
y = 0.0519x + 27.816
y = 0.0537x + 23.704
15
20
25
30
35
40
1980
1982
1984
1986
1988
1990
1992
1994
1996
1998
2000
2002
2004
2006
ChiangMai
y = 0.0077x + 20.206
y = 0.0022x + 25.63
y = -0.0113x + 32.382
15
17
19
21
23
25
27
29
31
33
35
1980
1982
1984
1986
1988
1990
1992
1994
1996
1998
2000
2002
2004
2006
22
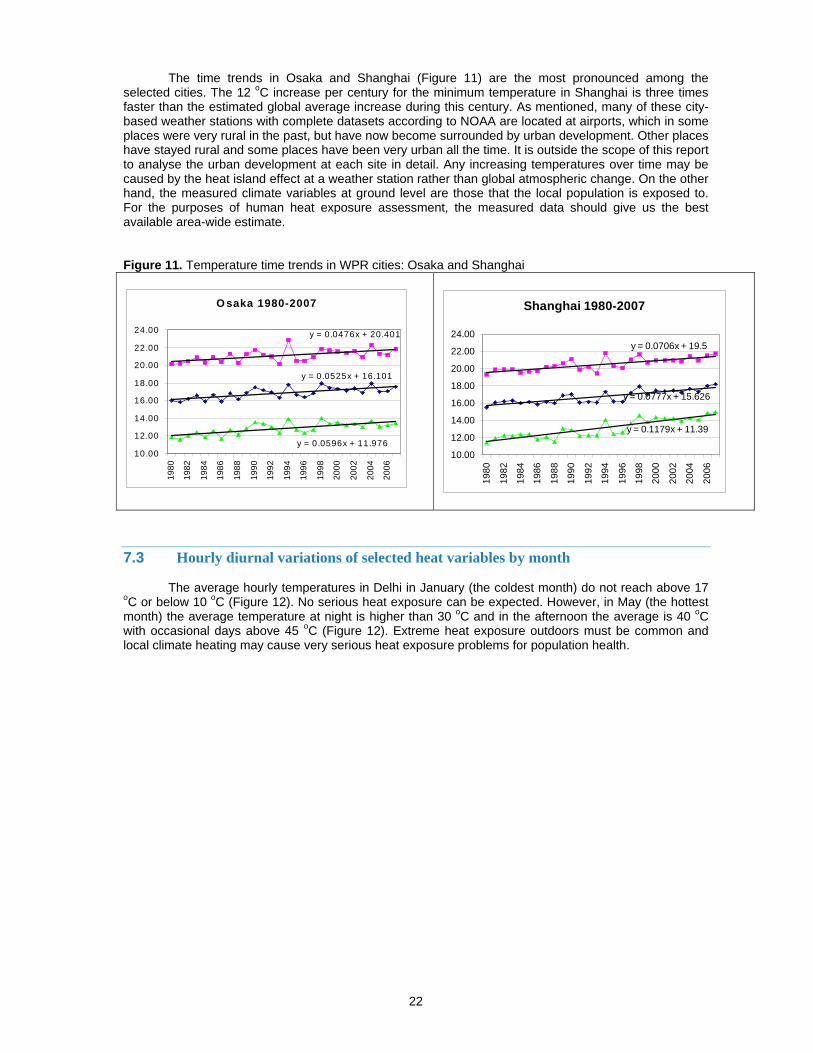
The time trends in Osaka and Shanghai (Figure 11) are the most pronounced among the selected cities. The 12 oC increase per century for the minimum temperature in Shanghai is three times faster than the estimated global average increase during this century. As mentioned, many of these city-based weather stations with complete datasets according to NOAA are located at airports, which in some places were very rural in the past, but have now become surrounded by urban development. Other places have stayed rural and some places have been very urban all the time. It is outside the scope of this report to analyse the urban development at each site in detail. Any increasing temperatures over time may be caused by the heat island effect at a weather station rather than global atmospheric change. On the other hand, the measured climate variables at ground level are those that the local population is exposed to. For the purposes of human heat exposure assessment, the measured data should give us the best available area-wide estimate. Figure 11. Temperature time trends in WPR cities: Osaka and Shanghai
O saka 1980-2007
y = 0.0476x + 20.401
y = 0.0525x + 16.101
y = 0.0596x + 11.97610.00
12.00
14.00
16.00
18.00
20.00
22.00
24.00
1980
1982
1984
1986
1988
1990
1992
1994
1996
1998
2000
2002
2004
2006
Shanghai 1980-2007
y = 0.0706x + 19.5
y = 0.0777x + 15.626
y = 0.1179x + 11.39
10.00
12.00
14.00
16.00
18.00
20.00
22.00
24.00
1980
1982
1984
1986
1988
1990
1992
1994
1996
1998
2000
2002
2004
2006
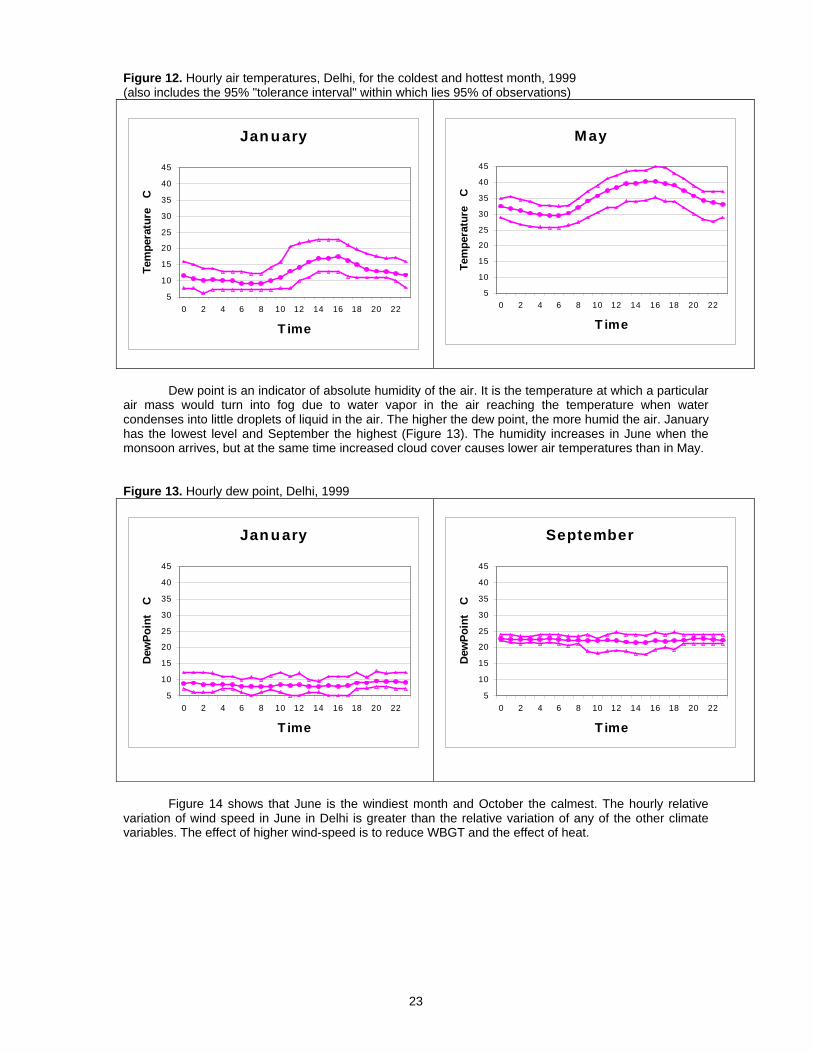
7.3 Hourly diurnal variations of selected heat variables by month The average hourly temperatures in Delhi in January (the coldest month) do not reach above 17
oC or below 10 oC (Figure 12). No serious heat exposure can be expected. However, in May (the hottest month) the average temperature at night is higher than 30 oC and in the afternoon the average is 40 oC with occasional days above 45 oC (Figure 12). Extreme heat exposure outdoors must be common and local climate heating may cause very serious heat exposure problems for population health.
23
Figure 12. Hourly air temperatures, Delhi, for the coldest and hottest month, 1999 (also includes the 95% "tolerance interval" within which lies 95% of observations)
Jan u ary
5
10
15
20
25
30
35
40
45
0 2 4 6 8 10 12 14 16 18 20 22
T ime
Tem
pera
ture
C
May
5
10
15
20
25
30
35
40
45
0 2 4 6 8 10 12 14 16 18 20 22
T ime
Tem
pera
ture
C
Dew point is an indicator of absolute humidity of the air. It is the temperature at which a particular
air mass would turn into fog due to water vapor in the air reaching the temperature when water condenses into little droplets of liquid in the air. The higher the dew point, the more humid the air. January has the lowest level and September the highest (Figure 13). The humidity increases in June when the monsoon arrives, but at the same time increased cloud cover causes lower air temperatures than in May. Figure 13. Hourly dew point, Delhi, 1999
Jan u ary
5
10
15
20
25
30
35
40
45
0 2 4 6 8 10 12 14 16 18 20 22
T ime
Dew
Poin
t C
September
5
10
15
20
25
30
35
40
45
0 2 4 6 8 10 12 14 16 18 20 22
T ime
Dew
Poin
t C
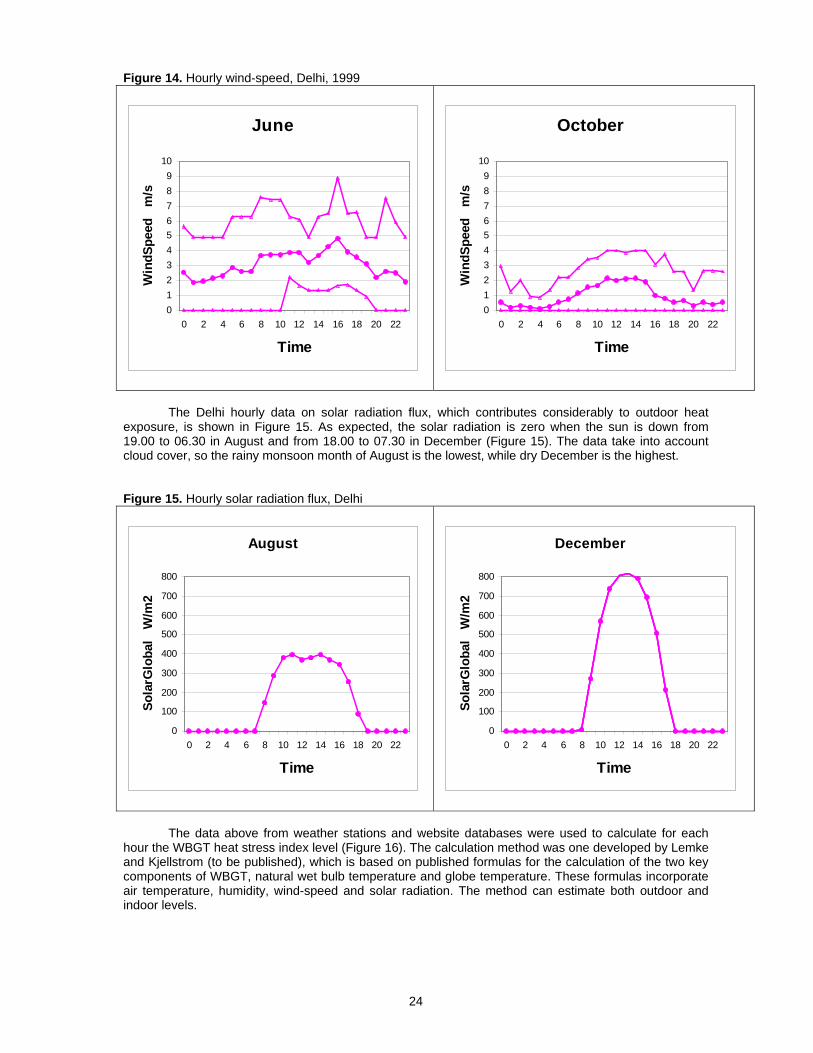
Figure 14 shows that June is the windiest month and October the calmest. The hourly relative
variation of wind speed in June in Delhi is greater than the relative variation of any of the other climate variables. The effect of higher wind-speed is to reduce WBGT and the effect of heat.
24
Figure 14. Hourly wind-speed, Delhi, 1999
June
0123456789
10
0 2 4 6 8 10 12 14 16 18 20 22
Time
Win
dSpe
ed
m/s
October
0123456789
10
0 2 4 6 8 10 12 14 16 18 20 22
Time
Win
dSpe
ed
m/s
The Delhi hourly data on solar radiation flux, which contributes considerably to outdoor heat
exposure, is shown in Figure 15. As expected, the solar radiation is zero when the sun is down from 19.00 to 06.30 in August and from 18.00 to 07.30 in December (Figure 15). The data take into account cloud cover, so the rainy monsoon month of August is the lowest, while dry December is the highest. Figure 15. Hourly solar radiation flux, Delhi
August
0
100
200
300
400
500
600
700
800
0 2 4 6 8 10 12 14 16 18 20 22
Time
Sola
rGlo
bal
W/m
2
December
0
100
200
300
400
500
600
700
800
0 2 4 6 8 10 12 14 16 18 20 22
Time
Sola
rGlo
bal
W/m
2
The data above from weather stations and website databases were used to calculate for each
hour the WBGT heat stress index level (Figure 16). The calculation method was one developed by Lemke and Kjellstrom (to be published), which is based on published formulas for the calculation of the two key components of WBGT, natural wet bulb temperature and globe temperature. These formulas incorporate air temperature, humidity, wind-speed and solar radiation. The method can estimate both outdoor and indoor levels.
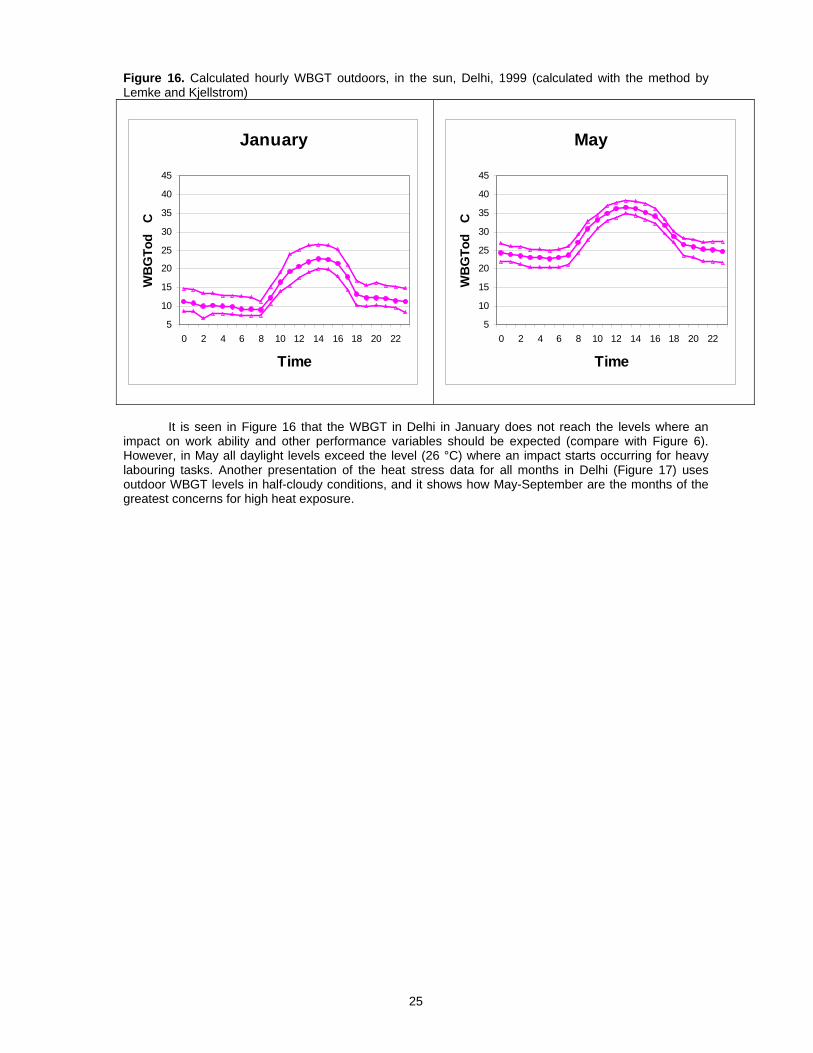
25
Figure 16. Calculated hourly WBGT outdoors, in the sun, Delhi, 1999 (calculated with the method by Lemke and Kjellstrom)
January
5
10
15
20
25
30
35
40
45
0 2 4 6 8 10 12 14 16 18 20 22
Time
WB
GTo
d C
May
5
10
15
20
25
30
35
40
45
0 2 4 6 8 10 12 14 16 18 20 22
Time
WB
GTo
d C
It is seen in Figure 16 that the WBGT in Delhi in January does not reach the levels where an
impact on work ability and other performance variables should be expected (compare with Figure 6). However, in May all daylight levels exceed the level (26 °C) where an impact starts occurring for heavy labouring tasks. Another presentation of the heat stress data for all months in Delhi (Figure 17) uses outdoor WBGT levels in half-cloudy conditions, and it shows how May-September are the months of the greatest concerns for high heat exposure.
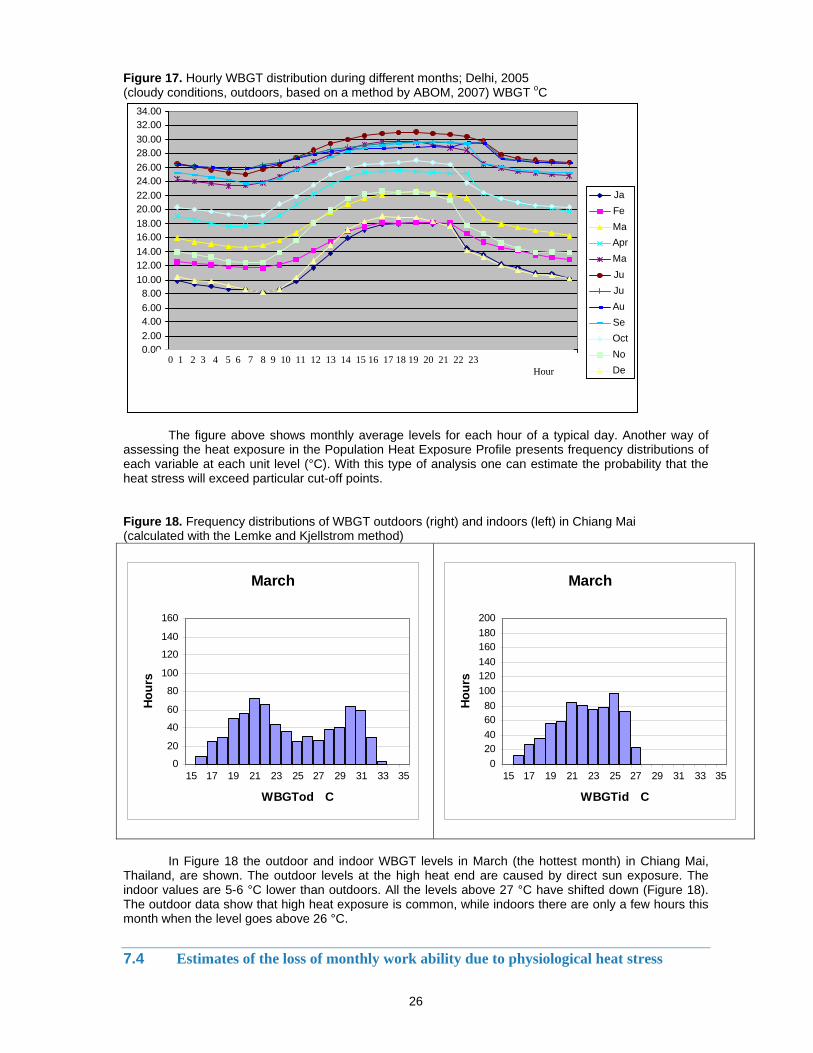
26
Figure 17. Hourly WBGT distribution during different months; Delhi, 2005 (cloudy conditions, outdoors, based on a method by ABOM, 2007) WBGT oC
The figure above shows monthly average levels for each hour of a typical day. Another way of assessing the heat exposure in the Population Heat Exposure Profile presents frequency distributions of each variable at each unit level (°C). With this type of analysis one can estimate the probability that the heat stress will exceed particular cut-off points. Figure 18. Frequency distributions of WBGT outdoors (right) and indoors (left) in Chiang Mai (calculated with the Lemke and Kjellstrom method)
March
0
20
40
60
80
100
120
140
160
15 17 19 21 23 25 27 29 31 33 35
WBGTod C
Hou
rs
March
020406080
100120140160180200
15 17 19 21 23 25 27 29 31 33 35
WBGTid C
Hou
rs
In Figure 18 the outdoor and indoor WBGT levels in March (the hottest month) in Chiang Mai,
Thailand, are shown. The outdoor levels at the high heat end are caused by direct sun exposure. The indoor values are 5-6 °C lower than outdoors. All the levels above 27 °C have shifted down (Figure 18). The outdoor data show that high heat exposure is common, while indoors there are only a few hours this month when the level goes above 26 °C.
7.4 Estimates of the loss of monthly work ability due to physiological heat stress
0.00 2.00 4.00 6.00 8.00
10.00 12.00 14.00 16.00 18.00 20.00 22.00 24.00 26.00 28.00 30.00 32.00 34.00
JaFeMaApr MaJuJuAuSeOct NoDe
0 1 2 3 4 5 6 7 8 9 10 11 12 13 14 15 16 17 18 19 20 21 22 23 Hour
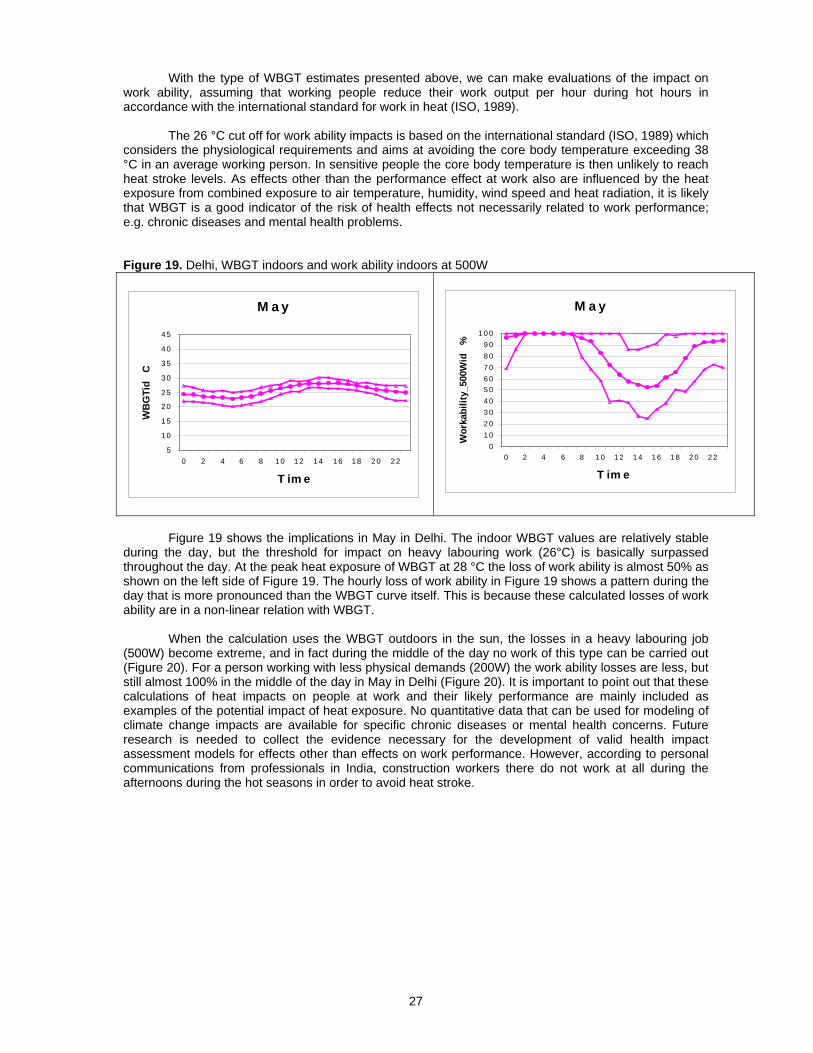
27
With the type of WBGT estimates presented above, we can make evaluations of the impact on work ability, assuming that working people reduce their work output per hour during hot hours in accordance with the international standard for work in heat (ISO, 1989).
The 26 °C cut off for work ability impacts is based on the international standard (ISO, 1989) which considers the physiological requirements and aims at avoiding the core body temperature exceeding 38 °C in an average working person. In sensitive people the core body temperature is then unlikely to reach heat stroke levels. As effects other than the performance effect at work also are influenced by the heat exposure from combined exposure to air temperature, humidity, wind speed and heat radiation, it is likely that WBGT is a good indicator of the risk of health effects not necessarily related to work performance; e.g. chronic diseases and mental health problems. Figure 19. Delhi, WBGT indoors and work ability indoors at 500W
M a y
5
1 0
1 5
2 0
2 5
3 0
3 5
4 0
4 5
0 2 4 6 8 1 0 1 2 1 4 1 6 18 2 0 2 2
T im e
WB
GTi
d C
M a y
01 02 03 04 05 06 07 08 09 0
1 0 0
0 2 4 6 8 1 0 1 2 1 4 1 6 1 8 2 0 2 2
T im eW
orka
bilit
y_50
0Wid
%
Figure 19 shows the implications in May in Delhi. The indoor WBGT values are relatively stable
during the day, but the threshold for impact on heavy labouring work (26°C) is basically surpassed throughout the day. At the peak heat exposure of WBGT at 28 °C the loss of work ability is almost 50% as shown on the left side of Figure 19. The hourly loss of work ability in Figure 19 shows a pattern during the day that is more pronounced than the WBGT curve itself. This is because these calculated losses of work ability are in a non-linear relation with WBGT.
When the calculation uses the WBGT outdoors in the sun, the losses in a heavy labouring job (500W) become extreme, and in fact during the middle of the day no work of this type can be carried out (Figure 20). For a person working with less physical demands (200W) the work ability losses are less, but still almost 100% in the middle of the day in May in Delhi (Figure 20). It is important to point out that these calculations of heat impacts on people at work and their likely performance are mainly included as examples of the potential impact of heat exposure. No quantitative data that can be used for modeling of climate change impacts are available for specific chronic diseases or mental health concerns. Future research is needed to collect the evidence necessary for the development of valid health impact assessment models for effects other than effects on work performance. However, according to personal communications from professionals in India, construction workers there do not work at all during the afternoons during the hot seasons in order to avoid heat stroke.
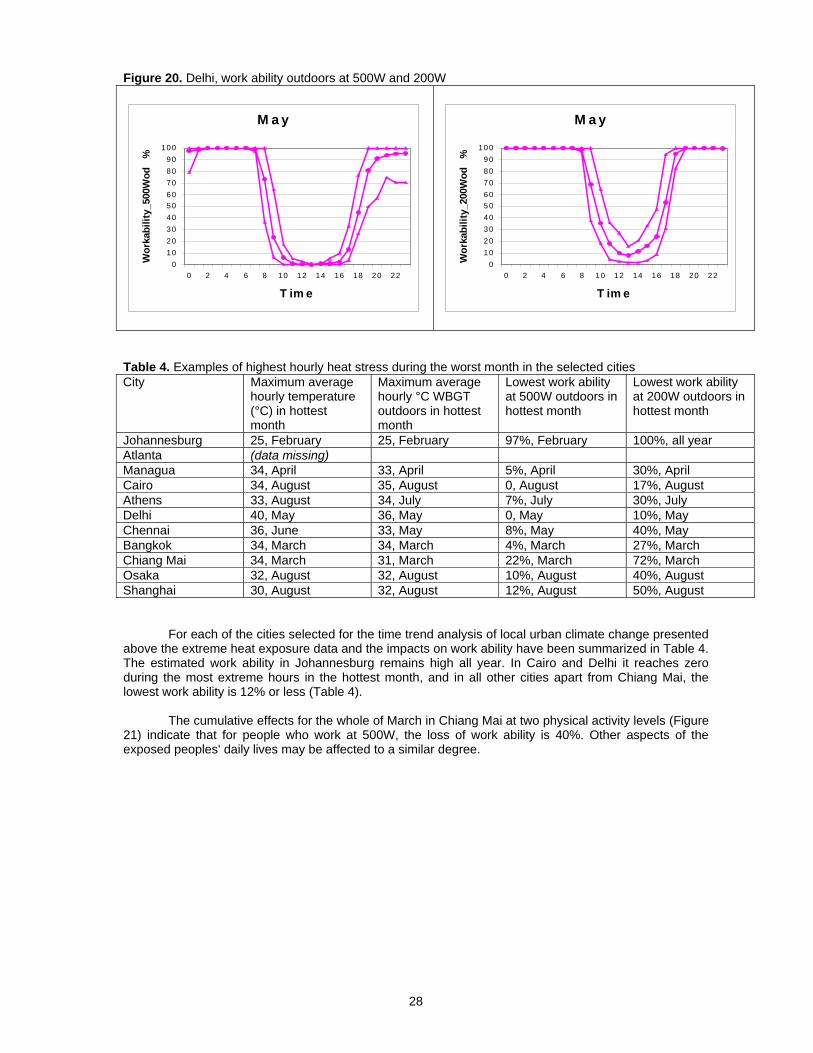
28
Figure 20. Delhi, work ability outdoors at 500W and 200W
M a y
0102030405060708090
100
0 2 4 6 8 10 12 14 16 18 20 22
T im e
Wor
kabi
lity_
500W
od
%
M a y
0102030405060708090
100
0 2 4 6 8 10 12 14 16 18 20 22
T im e
Wor
kabi
lity_
200W
od
%
Table 4. Examples of highest hourly heat stress during the worst month in the selected cities City Maximum average
hourly temperature (°C) in hottest month
Maximum average hourly °C WBGT outdoors in hottest month
Lowest work ability at 500W outdoors in hottest month
Lowest work ability at 200W outdoors in hottest month
Johannesburg 25, February 25, February 97%, February 100%, all year Atlanta (data missing) Managua 34, April 33, April 5%, April 30%, April Cairo 34, August 35, August 0, August 17%, August Athens 33, August 34, July 7%, July 30%, July Delhi 40, May 36, May 0, May 10%, May Chennai 36, June 33, May 8%, May 40%, May Bangkok 34, March 34, March 4%, March 27%, March Chiang Mai 34, March 31, March 22%, March 72%, March Osaka 32, August 32, August 10%, August 40%, August Shanghai 30, August 32, August 12%, August 50%, August
For each of the cities selected for the time trend analysis of local urban climate change presented above the extreme heat exposure data and the impacts on work ability have been summarized in Table 4. The estimated work ability in Johannesburg remains high all year. In Cairo and Delhi it reaches zero during the most extreme hours in the hottest month, and in all other cities apart from Chiang Mai, the lowest work ability is 12% or less (Table 4).
The cumulative effects for the whole of March in Chiang Mai at two physical activity levels (Figure 21) indicate that for people who work at 500W, the loss of work ability is 40%. Other aspects of the exposed peoples' daily lives may be affected to a similar degree.
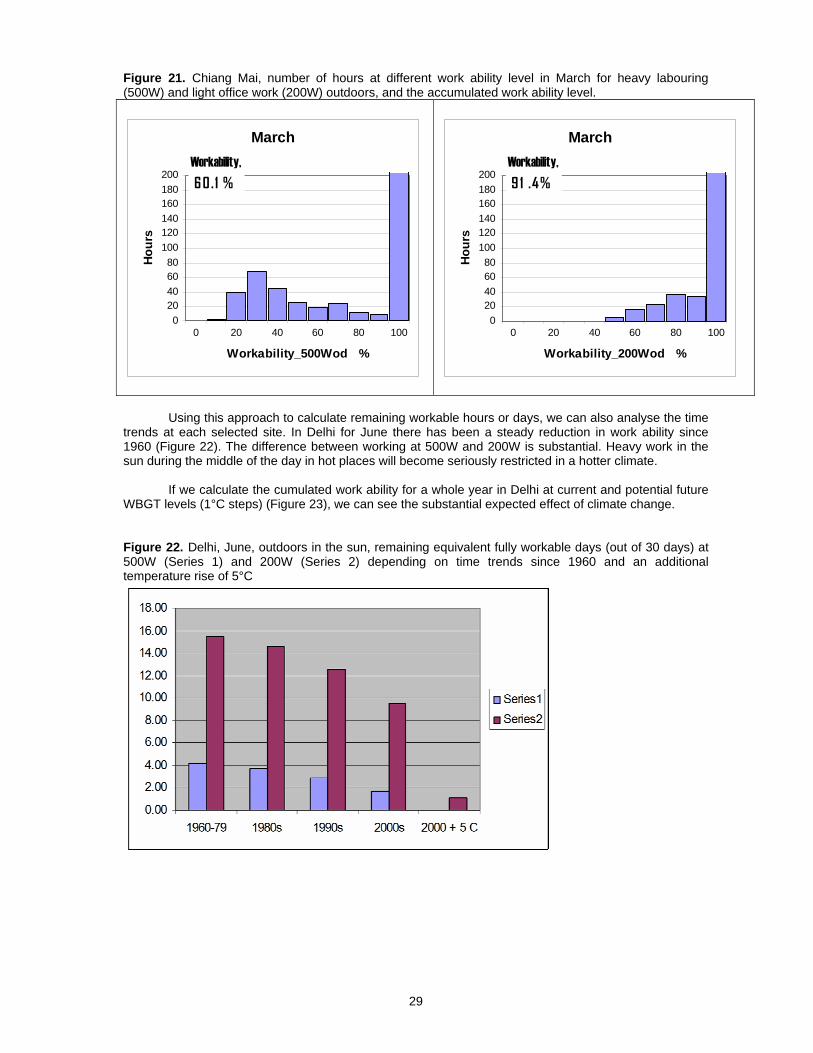
29
Figure 21. Chiang Mai, number of hours at different work ability level in March for heavy labouring (500W) and light office work (200W) outdoors, and the accumulated work ability level.
MarchWorkability, 60.1 %
020406080
100120140160180200
0 20 40 60 80 100
Workability_500Wod %
Hour
s
MarchWorkability, 91 .4%
020406080
100120140160180200
0 20 40 60 80 100
Workability_200Wod %
Hou
rs
Using this approach to calculate remaining workable hours or days, we can also analyse the time
trends at each selected site. In Delhi for June there has been a steady reduction in work ability since 1960 (Figure 22). The difference between working at 500W and 200W is substantial. Heavy work in the sun during the middle of the day in hot places will become seriously restricted in a hotter climate.
If we calculate the cumulated work ability for a whole year in Delhi at current and potential future WBGT levels (1°C steps) (Figure 23), we can see the substantial expected effect of climate change. Figure 22. Delhi, June, outdoors in the sun, remaining equivalent fully workable days (out of 30 days) at 500W (Series 1) and 200W (Series 2) depending on time trends since 1960 and an additional temperature rise of 5°C
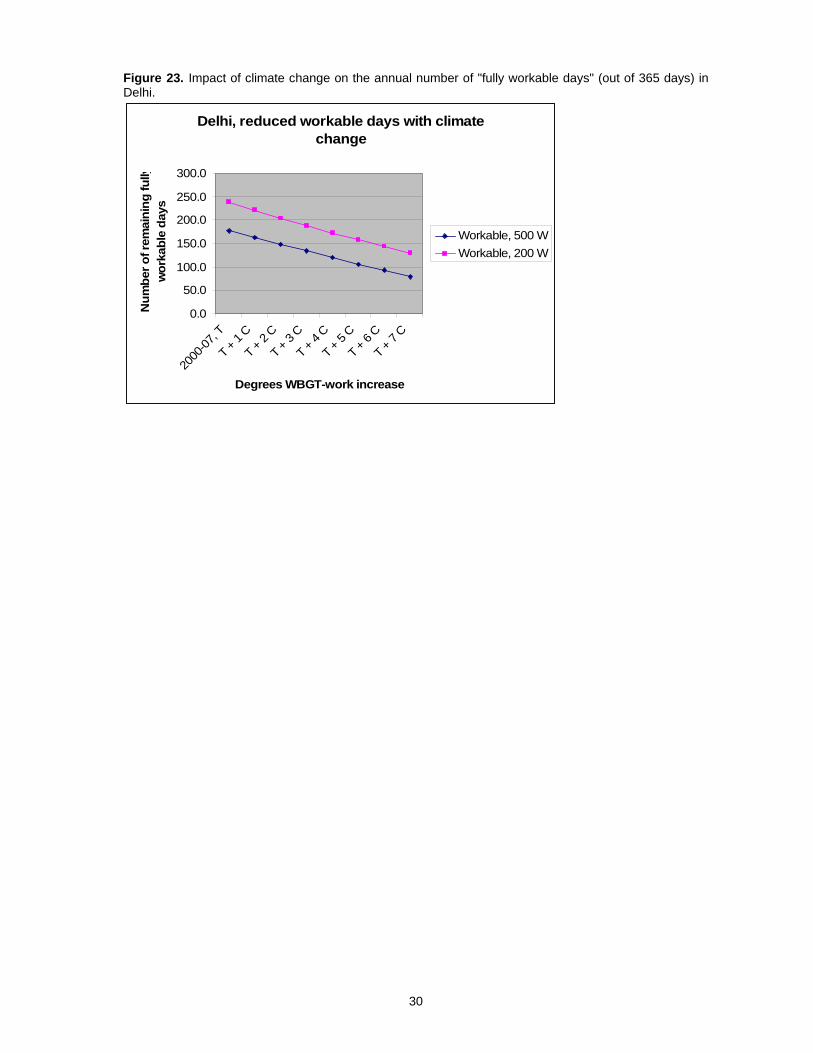
30
Figure 23. Impact of climate change on the annual number of "fully workable days" (out of 365 days) in Delhi.
Delhi, reduced workable days with climate change
0.0
50.0
100.0
150.0
200.0
250.0
300.0
2000
-07, T
T + 1
C
T + 2 C
T + 3
C
T + 4
C
T + 5 C
T + 6
C
T + 7 C
Degrees WBGT-work increase
Num
ber o
f rem
aini
ng fu
llyw
orka
ble
days
Workable, 500 WWorkable, 200 W
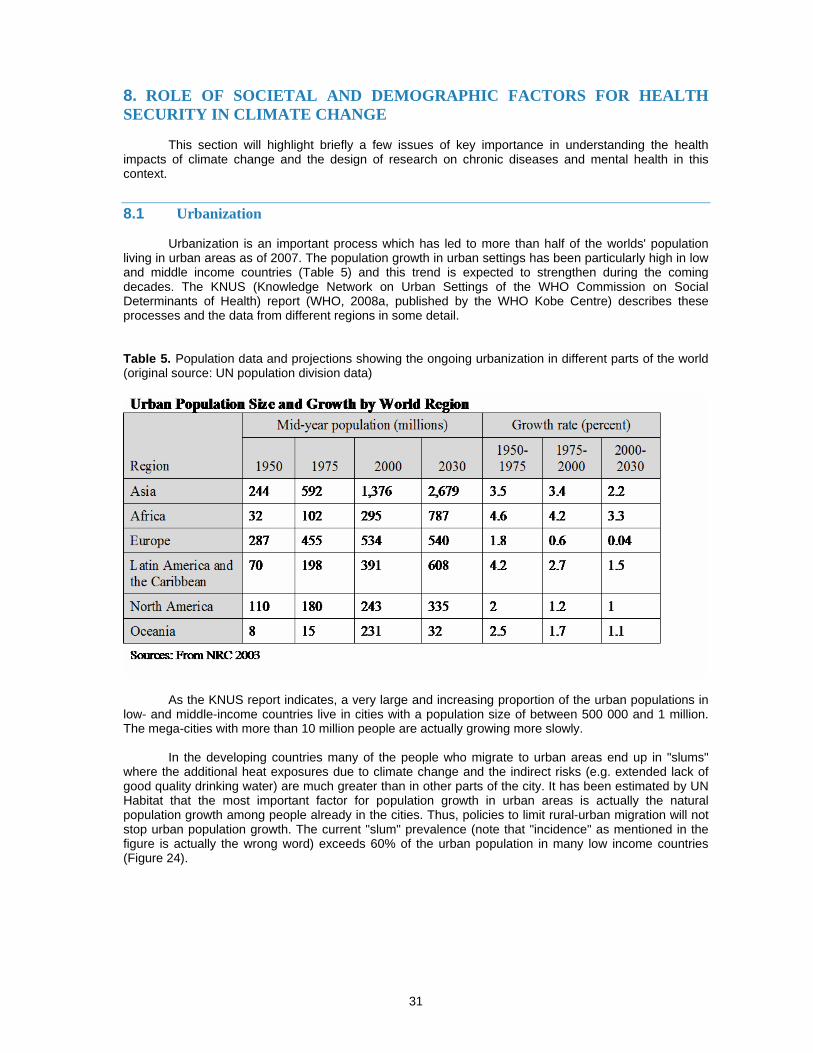
31
8. ROLE OF SOCIETAL AND DEMOGRAPHIC FACTORS FOR HEALTH SECURITY IN CLIMATE CHANGE
This section will highlight briefly a few issues of key importance in understanding the health impacts of climate change and the design of research on chronic diseases and mental health in this context.
8.1 Urbanization
Urbanization is an important process which has led to more than half of the worlds' population living in urban areas as of 2007. The population growth in urban settings has been particularly high in low and middle income countries (Table 5) and this trend is expected to strengthen during the coming decades. The KNUS (Knowledge Network on Urban Settings of the WHO Commission on Social Determinants of Health) report (WHO, 2008a, published by the WHO Kobe Centre) describes these processes and the data from different regions in some detail. Table 5. Population data and projections showing the ongoing urbanization in different parts of the world (original source: UN population division data)
As the KNUS report indicates, a very large and increasing proportion of the urban populations in low- and middle-income countries live in cities with a population size of between 500 000 and 1 million. The mega-cities with more than 10 million people are actually growing more slowly.
In the developing countries many of the people who migrate to urban areas end up in "slums" where the additional heat exposures due to climate change and the indirect risks (e.g. extended lack of good quality drinking water) are much greater than in other parts of the city. It has been estimated by UN Habitat that the most important factor for population growth in urban areas is actually the natural population growth among people already in the cities. Thus, policies to limit rural-urban migration will not stop urban population growth. The current "slum" prevalence (note that "incidence" as mentioned in the figure is actually the wrong word) exceeds 60% of the urban population in many low income countries (Figure 24).
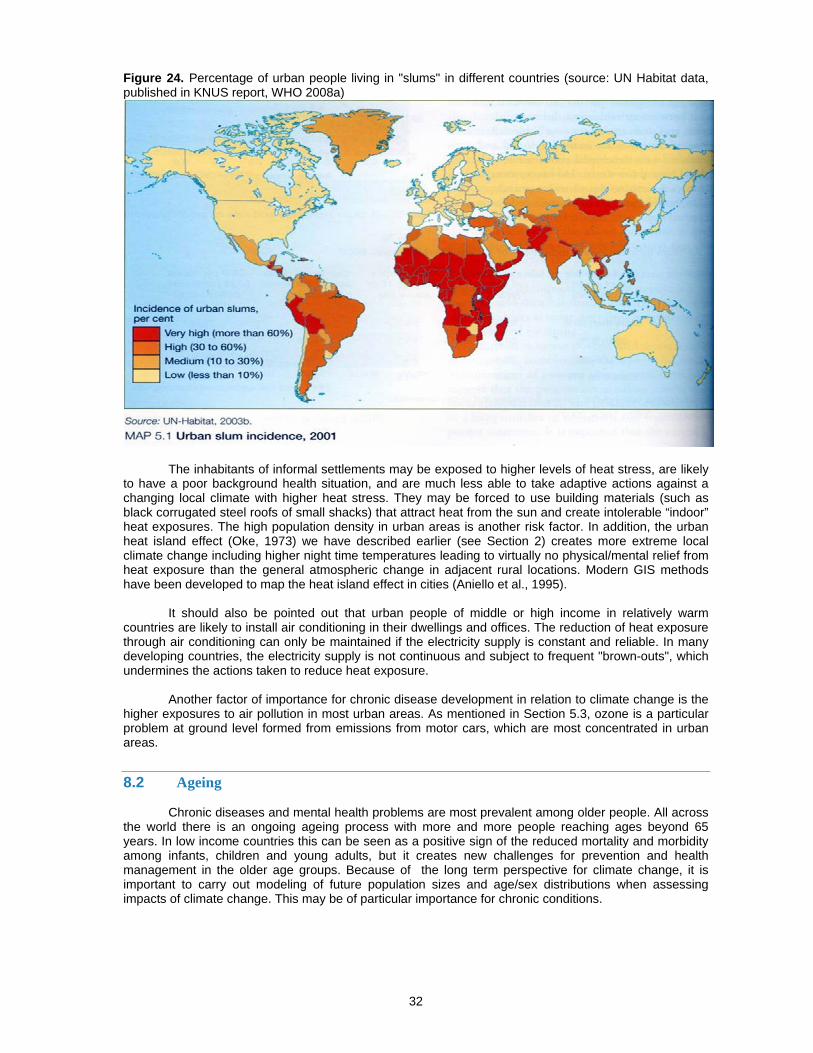
32
Figure 24. Percentage of urban people living in "slums" in different countries (source: UN Habitat data, published in KNUS report, WHO 2008a)
The inhabitants of informal settlements may be exposed to higher levels of heat stress, are likely to have a poor background health situation, and are much less able to take adaptive actions against a changing local climate with higher heat stress. They may be forced to use building materials (such as black corrugated steel roofs of small shacks) that attract heat from the sun and create intolerable “indoor” heat exposures. The high population density in urban areas is another risk factor. In addition, the urban heat island effect (Oke, 1973) we have described earlier (see Section 2) creates more extreme local climate change including higher night time temperatures leading to virtually no physical/mental relief from heat exposure than the general atmospheric change in adjacent rural locations. Modern GIS methods have been developed to map the heat island effect in cities (Aniello et al., 1995).
It should also be pointed out that urban people of middle or high income in relatively warm countries are likely to install air conditioning in their dwellings and offices. The reduction of heat exposure through air conditioning can only be maintained if the electricity supply is constant and reliable. In many developing countries, the electricity supply is not continuous and subject to frequent "brown-outs", which undermines the actions taken to reduce heat exposure.
Another factor of importance for chronic disease development in relation to climate change is the higher exposures to air pollution in most urban areas. As mentioned in Section 5.3, ozone is a particular problem at ground level formed from emissions from motor cars, which are most concentrated in urban areas.
8.2 Ageing
Chronic diseases and mental health problems are most prevalent among older people. All across the world there is an ongoing ageing process with more and more people reaching ages beyond 65 years. In low income countries this can be seen as a positive sign of the reduced mortality and morbidity among infants, children and young adults, but it creates new challenges for prevention and health management in the older age groups. Because of the long term perspective for climate change, it is important to carry out modeling of future population sizes and age/sex distributions when assessing impacts of climate change. This may be of particular importance for chronic conditions.
33
8.3 Socioeconomic factors
The description of the slum situation above highlights the importance of socioeconomic factors. Poor people are by far the most likely to be affected by climate change-related health risks (Patz et al., 2007). Section 9 will discuss this issue in more detail.
8.4 Health systems
The health system has a major role in identifying possibilities for preventive actions and in acting to deal with people whose health has been affected. WHO regional offices have already developed ideas and guidelines for health services. For instance, in one such document from the Americas Region, the role of health systems is described as focusing on "prediction" and "surveillance". Prediction included working with climate forecasts to identify potential health hazards and the types of health problems that may serve as "sentinels" of climate change impacts. The health sector would work in collaboration with meteorological and environmental services to identify changes in the environment that may trigger certain health problems.
In the "surveillance" part of the work, the health services would use monitoring systems to identify the occurrence of early cases of sentinel diseases that might be the start of epidemics caused by climate change. This approach may be particularly suited to communicable disease outbreaks due to a changing climate. However, the focus on improved prevention via forecasting and sentinel case identification would apply also to chronic conditions. The need for improved modeling programs for future health impacts has also been stressed by the recent meetings of WHO (e.g. WHO, 2008g).
It should also be emphasized, as was mentioned in Section 3, that a poorly functioning public health system resulting in poor status of population health in a community is a major factor in the currently documented health impacts of climate change. A health system that meets the requirements of WHO guidelines and achieves the Millennium Development Goals can prevent many of the current effects of climate change.
However, as the climate situation deteriorates, additional health risks will build up and additional health sector actions will be needed.
8.5 Adaptation and mitigation
Adaptation and mitigation actions alter the climate change-related health risk situation, sometimes producing negative effects themselves. For instance, adaptation to reduce heat exposure at work (without air conditioning) will require a shift to lower work output per hour and for many low paid workers a reduced income per hour (we have discussed this heat effect on work ability in detail above). To compensate for this, the workers may need to work longer hours or work more at night, which can have negative implications for individual health, child care and family life. This may cause health problems among the family's children as well as mental stress for the affected working adult.
Other adaptation options that may create health problems:
• air conditioning is associated with Legionnaires disease and "sick building syndrome";
• open windows to reduce heat inside buildings in urban areas can create substantial indoor increase of traffic noise exposure; such exposure causes reduced learning among school children, and increased blood pressure or heart attacks among older people; and
• older people stuck inside using air conditioning on hot days and with a reluctance to venture
outside during the hot period, may develop mental health problems due to lack of social interaction.
An example of mitigation is the reduced travel by car for populations that are very reliant on that
method of transportation. Reduced car travel cuts greenhouse gas emissions. However, for many people travel by alternative means, whether it is public transport or bicycling or walking in many places takes longer. Thus, the traveler will have less time to spend at work or at home. This may cause problems
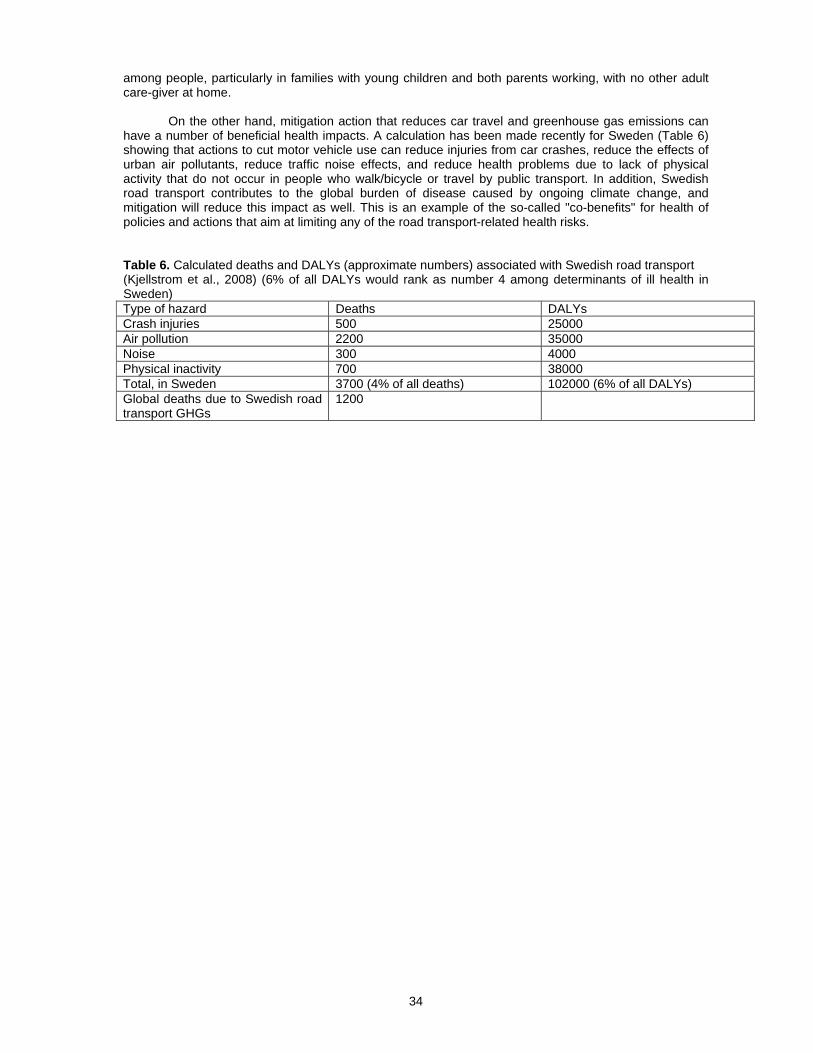
34
among people, particularly in families with young children and both parents working, with no other adult care-giver at home.
On the other hand, mitigation action that reduces car travel and greenhouse gas emissions can have a number of beneficial health impacts. A calculation has been made recently for Sweden (Table 6) showing that actions to cut motor vehicle use can reduce injuries from car crashes, reduce the effects of urban air pollutants, reduce traffic noise effects, and reduce health problems due to lack of physical activity that do not occur in people who walk/bicycle or travel by public transport. In addition, Swedish road transport contributes to the global burden of disease caused by ongoing climate change, and mitigation will reduce this impact as well. This is an example of the so-called "co-benefits" for health of policies and actions that aim at limiting any of the road transport-related health risks. Table 6. Calculated deaths and DALYs (approximate numbers) associated with Swedish road transport (Kjellstrom et al., 2008) (6% of all DALYs would rank as number 4 among determinants of ill health in Sweden) Type of hazard Deaths DALYs Crash injuries 500 25000 Air pollution 2200 35000 Noise 300 4000 Physical inactivity 700 38000 Total, in Sweden 3700 (4% of all deaths) 102000 (6% of all DALYs) Global deaths due to Swedish road transport GHGs
1200
35
9. HEALTH EQUITY ISSUES IN URBAN AREAS
The most recent detailed document that analyses these issues is the KNUS report (WHO, 2008a). Climate change was not the main focus of the report. It covered the broader social determinants of health and how they interact with environmental determinants in creating serious health inequities for billions of people. However, it pointed out that the alterations in local urban climate taking place as the global climate changes will certainly further undermine the health situation of poor people. A short version of the KNUS report was recently published in a scientific journal (Kjellstrom and Mercado, 2008).
The conclusions and recommendations of the KNUS report mention the following issues:
• the urban setting is in itself a health determinant, with both strong social and strong environmental components
• the urban health situation is not improving for many inhabitants of slums, and their numbers are
increasing rapidly
• policies for sustainable development need to integrate the aim of health equity
• global climate change is a major threat to the health of the poor in both rural and urban areas
• access to affordable health care in urban settings is a key health equity issue
• women have particular health needs and vulnerabilities
• demographic change and ageing are growing health equity challenges
• among the broad spectrum of interventions to improve health equity, social cohesion in a community is mentioned as a primary factor for success
• creating healthy housing is another priority intervention, and consideration of indoor and
neighborhood climate, now and in the future, is of great importance for health in relation to chronic diseases and mental health
• promoting physical activity and reducing urban violence are other intervention aims that have
strong climate links
• a fundamental question is, of course, the access to financial and other resources needed to improve the urban environment and the health situation for the poor and disadvantaged. Much larger transfers of resources from high income countries to low income countries are necessary. This would be in line with recommendations from the United Nations as far back as 1972, but during the current global financial crisis in 2008 it seems unlikely that the situation will improve much.
The KNUS report presented analysis and recommendations to the WHO Commission on Social
Determinants of Health, which published its report in August 2008 (WHO, 2008h). A recent paper by Friel, Marmot, McMichael, Kjellstrom and Vagero (Friel et al., 2008) has linked the health equity agenda and the climate change protection agenda and finds many arguments as to why the two should be acted upon in unison. Health has improved on average globally, but many poor people are left behind and health inequities between and within countries are growing. At the same time human technologies and activities disrupt the global climate and other life-supporting environmental factors, and create risks to health and well-being.
The underlying determinants of health inequity and of environmental change therefore overlap substantially. The situation is partly a result of an economic system that focuses on growth rather than equity and support for essential environmental and social conditions. Globalization of economies can have a positive influence on the social and economic conditions of the poor, but it can also bring the opposite. Friel et al. (2008) call for a shift of priorities in economic development, a fairer food system, more efficient and renewable energy modes, and healthier forms of urbanization. Today’s global interconnectedness and interdependence enable the social and environmental determinants of health to be addressed in ways that can increase health equity, reduce poverty, and build societies that live within

36
environmental limits. The global financial crisis of late 2008 and beyond must be resolved in a way that does not delay global development in the direction of these recommendations.
37
10. RESEARCH GAPS
Many research gaps have been identified in the IPCC (2007) assessment, in the report on the estimation of the global burden of disease as an effect of climate change (McMichael et al, 2004) and other reviews referred to below. Some of the recommendations about required research are rather general and do not deal specifically with the need to address the knowledge gaps for chronic diseases and mental health. However, this research area is rapidly evolving and new studies will undoubtedly identify major research needs. The most recent international attempt to identify gaps and recommend future work was the meeting in October 2008 organized by WHO, the United Nations Foundation, the US National Institute of Environmental Health Sciences and the Ministry of Health of Spain (WHO, 2008g). Gaps identified by IPCC (2007): WG 2, Chapter 8, section 8.8 “Key uncertainties and research priorities”
The lack of appropriate longitudinal health data makes attribution of adverse health impacts to observed climate trends difficult. Information gaps persist on trends in climate, health and environment in low-income countries. Climate change-related health impact assessments in low- and middle-income countries will be instrumental in guiding adaptation projects and investments. Considerable uncertainties surround projections of the health effects of climate change under a range of scenarios.
A better understanding is needed of the factors that convey vulnerability and the changes that need to be made in health care, emergency services, land use, urban design, and settlement patterns to protect populations against heat waves, floods and storms.
Key research priorities: • development of methods to quantify the current impacts of climate and weather on a range of
health outcomes, particularly in low-and middle-income countries • development of health impact models for projecting climate change-related impacts under
different climate and socioeconomic scenarios • investigation of the cost of the projected health impacts of climate change; effectiveness of
adaptation; and the limiting forces, major drivers and costs of adaptation.
There is also a need to strengthen institutions and mechanisms that can more systematically promote interactions among researchers, policy-makers and stakeholders. Gaps identified in report on Global Burden of Disease Due to Climate Change (McMichael et al., 2004)
This assessment highlighted the most important gaps in data and understanding that should be addressed for the next global burden of disease assessment. Marked improvements in our assessment of this risk factor would come from:
• investigation of the cost of the projected health impacts of climate change; effectiveness of adaptation; and the limiting forces, major drivers and costs of adaptation
• the use of multiple climate models • climate-health relationships derived from a greater range of climatic and socioeconomic
environments • more explicit and routine validation of the accuracy of disease models in the present or recent
past • formal analyses to aggregate uncertainty arising from multiple causes (e.g. GHG emissions
scenarios, climate models, climate-health relationships and effect modifiers) • efforts to formally model climate change effects through disease burden, rather than intermediate
indicators such as population at risk • a greater emphasis on investigating the consequences of increased climate variability, as
opposed to gradual changes in mean conditions • the development of analytical tools to assess outcomes acting through more complex causal
mechanisms. Proposed high-priority climate change and health research areas in Australia (as highlighted in several recent sources)
1. Which categories of persons, in city, town and countryside, are at greatest risk of death, serious illness or heat strain event (i.e. most “vulnerable”) from short-term extremes of heat and cold? Do
38
levels of understanding of the nature of these risks, and personal/household-level ways to ameliorate them, vary between these population sub-groups?
2. Do early warning systems for heat waves alter the population’s health outcomes (deaths,
hospitalizations, temporary disabling symptoms at work or at home)? If so, which warning systems work best? Is this a function of warning-modality, critical “trigger” temperature, or something else?
3. Can meteorological forecasts of impending seasonal weather conditions provide useful advance
warning of altered risks of vector-borne infectious disease outbreaks? Does this differ between human-only and zoonotic vector-borne diseases? Are such forecasts enhanced by inclusion of information about changes in environmental indicators (e.g. surface water, vegetation levels)?
4. What key characteristics of rural communities determine their level of resilience to the stress of
long-term changes in climatic and environmental conditions? Which types of intervention most effectively increase the level of resilience?
5. What role can the primary health-care system play in educating families and communities about
the health risks from climate change? Which activities are most effective in reducing adverse health outcomes? What additional training/education do the health-care staff require in order to fulfill this role?
6. How well-equipped/prepared is the hospital system (and associated facilities: ambulance service,
etc.) for the heightened spikes in demand that would arise from an increase in climatic variability and the occurrence of weather disasters? What improvements are needed, feasible and effective?
7. In order to reduce mental stress and anxiety about “global warming” in school-age children, what
types of information, education and discussion are most effective – and, for each, at what age-ranges? Do such interventions also lead to changes in child and family behaviours?
8. For occupational groups exposed to periodic extremes of heat in the workplace, what are the
most effective protective strategies? Are current heat strain protection guidelines sufficient, and on what basis and time-scale might they need revision in future?
Proposed climate change and health research by the recent WHO meeting (WHO, 2008g)
The report from the recent WHO meeting in Madrid (October 2008), a workshop for "Guiding research to improve health protection from climate change" (WHO, 2008g) refers to the WHA resolution 61.19, 2008, which called for further research and pilot projects on:
• health vulnerability to climate change and the scale and nature thereof;
• health protection strategies and measures relating to climate change and their effectiveness, including cost-effectiveness;
• the health impacts of potential adaptation and mitigation measures in other sectors, such as
water resources, land use and transport, in particular where these could have positive effects for health protection;
• decision-support and other tools, such as surveillance and monitoring, for assessing vulnerability
and health impacts and targeting measures appropriately;
• assessment of the likely financial costs and other resources necessary for health protection from climate change.
The meeting report (WHO, 2008g, in press) further elaborates on the research gaps and
mentions mental health consequences, occupational heat strain, heat stress and physiological function, diseases associated with dehydration, heat-sensitive diseases and allergies due to pollen/spores exposure. Each disease issue is described in a similar way to the text in previous sections, but disease-specific research gaps are addressed in a rather general sense. Major gaps are identified concerning research and assessment methods and data availability. For instance, there is substantial need to establish "baseline" climate-health relationships as well as the actual impacts of the change in climate.
39
The methods to estimate the burden of disease attributable to climate change need to be improved, as well as methods to estimate future health risks based on climate change scenarios. Much of this research is hampered by the lack of useful population based data on climate exposures and the key health concerns (WHO, 2008, in press). The report also makes a strong call for applied research that links the health assessments to analysis of the effectiveness of specific adaptation policies/actions and evaluation of the usefulness of decision-support tools.
The draft WHO workplan (WHO document in press) for implementation of WHA61.19 lists the following priority actions of direct relevance to chronic disease and mental health protection:
• development of tools, guidance, information and training packages to support countries’ awareness and advocacy campaigns to protect health from climate change at the national and regional level;
• provide the health sector with information, tools and advice in order to enhance their involvement
and active participation in national, regional and international mechanisms;
• assess the burden of disease attributable to climate change and project it to the future years using existing and new approaches;
• review and develop methodologies and guidelines on how to evaluate vulnerability to climate
change-related health effects at local, national and regional scales;
• support and monitor research to improve public health knowledge on the health risks of climate change and on the most effective interventions to manage those risks;
• assess the health impact of adaptation and mitigation policies taken in other sectors and identify
the most effective actions which have the potential to benefit health while reducing greenhouse gas emissions;
• identify and develop indicators to monitor climate change-related health outcomes within
surveillance systems;
• advocate for strengthening of primary health care services to support the capacity of local communities to become resilient to climate-related health risks.
Thus, there is a variety of specific areas of research that have been suggested and need to be
tackled in order to accumulate the essential evidence for effective prevention of the health effects of climate change.
40
11. RECOMMENDATIONS FOR SELECTED NEW RESEARCH ACTIVITIES TO SUPPORT CITY-BASED POLICIES FOR HEALTH SECURITY AND HEALTH EQUITY
The underlying premises of this report were: climate change impacts on chronic diseases and mental health in urban areas. The brief recommendations below will focus on these issues rather than other major climate change and health issues. The recommendations will also take into account the need to develop research that leads to prevention of health impacts and adaptation options and strategies that improve health and reduce health inequities.
Much of the proposed research will require new interdisciplinary efforts and will need international partnerships between high-, middle- and low-income countries. WHO Kobe Centre can play a very important role in encouraging and facilitating such collaboration. (Further development of research proposals can be an important follow-up to this report). Research examples:
1. Documenting current heat exposure in cities and likely future change As has been shown above with some examples, there are important ways to describe the exposure to climate variables that have not yet been fully utilized. Better descriptions via, for instance, systems like the PHEP (Population Heat Exposure Profile) can become a useful tool for health authorities and other sectors in analyzing and predicting chronic conditions and mental health problems and their solutions.
2. Clarifying linkages and pathways for chronic diseases and mental health There are large gaps in our knowledge about the fundamental relationships between climate exposures and the development of specific chronic diseases or conditions and mental health problems.
3. Impact of vulnerabilities on clinical status and quality of life conditions A major issue that has until now been totally overlooked in the climate change research and debate is the impact of increased heat exposure on the clinical condition of people with pre-existing chronic diseases and mental health problems. This area requires research urgently. It could include new approaches to analyse the “degree of disability” for DALY estimates.
Another area of importance is the vulnerability of specific groups in the community, the poor, women, children, elderly, disabled, etc. Studies targeting health risks and preventive approaches in relation to these groups are needed.
4. Impacts on the health system and implications for health security The role of the health system can be analysed by comparing situations with different climate exposures and describing preventive or management solutions that are particularly successful in achieving health equity. The role of primary health care in reducing impacts of climate variables and climate change should also be studied.
41
12. REFERENCES ABOM (2007) About the WBGT and Apparent temperature indices. Australian Bureau of Meteorology, Melbourne, Australia. Available free on the web: http://www.bom.gov.au/info/thermal_stress/#apparent ACGIH (1998) TLVs and BEIs. Threshold limit values for chemical substances and physical agents. American Conference of Governmental Industrial Hygienists, Cincinatti OH. AAP (2000) American Academy of Pediatrics. Climatic heat stress and the exercising child and adolescent. Pediatrics; 106: 158-159. Aniello C et al. (1995) Mapping micro-urban heat islands using Landsat Tm and a GIS. Computers and Geosciences, 21, 965. Beggs PJ. (2004) Impacts of climate change on aeroallergens: past and future. Clin & Experimental Allergy 34: 1507-1513. Berry HL, Kelly BJ, Hanigan IC, Coates JH, McMichael AJ, Welsh JA, Kjellstrom T. (2008) Rural mental health impacts of climate change. Commissioned report for the Garnaut Climate Change Review. Canberra: The Australian National University. 40 pp. Bi P, Parton KA, Wang J, Donald K. (2008) Temperature and direct effects on population health in Brisbane, 1986-1995. J Environ Health 70: 48-53. Brikowski TH, Lotan Y, Pearle MS (2008) Climate-related increase in the prevalence of urolithiasis in the United States. Proc. National Acad, Sciences website. Budd GM. (2008) Wet-bulb globe temperature (WBGT) – its history and limitations. J Science Med Sport 11: 20-32. Campbell T, Campbell A (2007) Emerging disease burdens among the poor in cities in the developing world. J Urban Helath, 84, i54-64. Corris EE, Ramirez AM, van Durme DJ (2004) Heat illness in athletes: The dangerous combination of heat, humidity and exercise. Sports Medicine, 34, 9-16. Corvalan C, Kjellstrom T. (1995) Health and environment analysis for decision-making. World Health Stats. Quarterly 48, 71-77. Dear K, Ranmuthugala G, Kjellstrom T, Skinner C, Hanigan I. (2005) Effects of temperature and ozone on daily mortality during the August 2003 heat wave in France. Arch. Environ Occup Health 60: 205-212. de Sherbinin A, Schiller A, Pulsipher A (2007) The vulnerability of global cities to climate hazards. Environ & Urbanization, 19, 39-64. Dinar A (2007) Climate change: The final blow for agriculture in Africa? Research brief, August 2007. Washington DC, The World Bank. Feachem RGA, Kjellstrom T, Murray CJL, Over MJ, Phillips MA. (1992) The health of adults in the developing world. World Bank Publication Series. Oxford University Press, Oxford. 350pp. Friel S, Marmot M, McMichael AJ, Kjellstrom T, Vagero D (2008) Global health equity and climate stabilization -- need for a common agenda. Lancet (in press) Hajat S et al., (2005) Mortality displacement of heat-related deaths: a comparison of Delhi, Sao Paulo and London. Epidemiology, 16, 313. Hales JRS and Richards DAB (1987) Heat stress - physical exertion and environment. Excerpta Medica, Amsterdam. Haq S, Kovats S, Reid H, Satterthwaite D (2007) Reducing risks to cities from disasters and climate change. Environ & Urbanization, 19, 3-15.
42
Howell WH (1896) An American textbook of physiology. London, Rebman Publishers. Hunter CH, Minyard CO (1999) Estimating wet bulb globe temperature using standard meteorological measurements. WSCR-MS-99-00757, Aiken, SC, Westinghouse Savannah River Company. IPCC (2007) Fourth Assessment Report. Geneva, Inter-governmental Panel on Climate Change. Cambridge: Cambridge University Press, 2007. Available free on the web: www.ipcc.ch ISO (1989) Hot environments - Estimation of the heat stress on working man, based on the WBGT-index (wet bulb globe temperature). ISO Standard 7243. International Standards Organization, Geneva. (NOT available on the web for free) Johanson G, Boman A (1991) Percutaneous absorption of 2-butoxyethanol vapour in human subjects. Brit J Ind Med, 48, 788-792. Kirch W, Menne B, Bertollini R. (2005) Extreme weather events and public health responses. Berlin, Springer. Kjellstrom T (2000) Climate change, heat exposure and labour productivity. Proc. ISEE 2000, 12th Conference of the International Society for Environmental Epidemiology, Buffalo, USA, August. Epidemiology, 11, S144, (2000). Kjellstrom T, Corvalan C (1995) Framework for the development of environmental health indicators. World Health Stats. Quarterly 48, 144-154. Kjellstrom T, Dirks KN. (2001) Heat stress and ability to work in the context of climate change. Proc. International Thermal Physiology Symposium, Sept. 2-6, 2001. Wollongong: University of Wollongong. Kjellstrom T, Shahi G. (2004) Technological and environmental change and health. Background discussion paper for WHO meeting in Kobe 11-13 August. Kobe, WHO Centre for Health Development. Kjellstrom T, Weaver H (2008) Climate Change and Health -- impacts, vulnerability, adaptation and mitigation. NSW Publ Health Bulletin (in press) Kjellstrom T, Mercado S (2008) Towards action on social determinants for health equity in urban settings. Environ & Urbanization, 20, 551-574. Kjellstrom T, Neller A, Simpson R. (2002) Air pollution and its health impacts: the changing panorama. Med J of Australia 177: 604-608. Kjellstrom T, Ferguson R, Taylor, A (2008) Public health impacts of road transport in Sweden -- an application of health impact assessment methods. Borlange, Swedish National Road Authority (in Swedish). KNECD (2007) Final report of the Knowledge Network on Early Childhood Development. Contribution to the WHO Commission on Social Determinants of Health. KNUS (2008) same report as WHO (2008a). Kovats RS, Hajat S. (2008) Heat stress and public health: a critical review. Annu Rev Public Health 29: 9.1-9.15. Lecocq F, Shalizi Z (2007) How might climate change affect economic growth in developing countries? Policy Research Working Papers, Nr 4315. Washington DC, The World Bank, Development Research Group. Mathers CD, Loncar D (2006) Projections of global mortality and burden fo disease from 2002 to 2030. PLoS Medicine, 3, 11. McFarlane A, Clayer J, Brookless C. (1997) Psychiatric morbidity following a natural disaster: an Australian bushfire. Soc Psychiatry Psychiatr Epidemiol 32(5): 261-268.
43
McGranahan G, Balk D, Anderson B (2007) The rising tide: assessing the risks of climate change and human settlements in low elevation coastal zones. Environ & Urbanization, 19, 17-38. McMichael et al., (1996) Climate change and human health. Geneva, World Health Organization. McMichael A, Campbell-Lendrum D, Ebi K, Githeko A, Scheraga J, Woodward A (2003) Climate change and human health: risks and responses. Geneva, World Health Organization. McMichael AJ, Campbell-Lendrum D, Kovats S, Edwards S, Wilkinson P, Wilson T, Nicholls R, Hales S, Tanser F, Le Sueur D, Schlesinger M, Andronova N (2004) Global climate change. In: Ezzati et al. Eds. Comparative quantification of health risks. Vol. 2, pp. 1543-1650. Geneva, World Health Organization. McMichael AJ, Powles JW, Butler CD, Uauy R. (2007) Food, livestock production, energy, climate change, and health. Lancet 370: 1253-1263. McMichael AJ, Berry , Butler CD, Capon AC, Dear KE, Hanigan I, Harley D, Kjellstrom T, Lucas R, Strazdins L (2008) Assessing the scale and nature of health vulnerability to climate change. Paper included in WHO report (2008 g) (in press). Murray CJL, Lopez AD (1996) The global burden of disease. Boston, Harvard School of Public Health; Washington DC, World Bank; and Geneva, World Health Organization. 990p. Niemelä R, Hannula M, Rautio S, Reijula K, Railio J (2002) The effect of indoor air temperature on labour productivity in call centres - a case study. Energy and Buildings, 34, 759-764. NIOSH (1986) Occupational exposure to hot environments. Revised criteria 1986. DHHS/NIOSH Publication 86-113. US Department of Health and Human Services, Washington DC. Nitschke M, Tucker GR, Bi, P. (2007) Morbidity and mortality during heatwaves in metropolitan Adelaide. Med J Aust 187: 662-665. Oke, TR (1973) City size and the urban heat island. Atmospheric Environment, 7, 769-779. Page LA, Hajat S, Kovats RS (2007) Relationship between daily suicide counts and temperature in England and Wales. Br J Psychiatry, 191, 106-112. Parsons K (2003) Human thermal environment. The effects of hot, moderate and cold temperatures on human health, comfort and performance. 2nd edition. New York, CRC Press. Parsons, K (2006) Heat stress standard ISO 7243 and its global application. Industrial Health, 44, 368-379. Patz JA, Gibbs HK, Foley JA, Rogers JV, Smith KR. (2007) Climate change and global health: quantifying a growing ethical crisis. EcoHealth 4: 397-405. Pilcher JJ, Nadler E, Busch C (2002) Effects of hot and cold temperature exposure on performance: a metanalytic review. Ergonomics, 45, 682-698. Poumadere M, Mays C, Le Mer S, Blong R. (2005) The 2003 heat wave in France: Dangerous climate change here and now. Risk Analysis 25: 1483-1494. Prince M, Patel V, Saxena S, Maj M, Maselko J, Phillips MR, Rahman A (2007) No health without mental health. The Lancet, 370, 859-877. Pruss-Ustun A, Corvalan C (2006) Preventing disease through healthy environments: Towards an estimate of the environmental burden of disease. Geneva, World Health Organization. Ramsey JD (1995) Task performance in heat: a review. Ergonomics, 38, 154-165. Ramsey JD et al., (1983) Effects of workplace thermal conditions on safe working behavior. J Safety Res, 14, 105-114.
44
Ramsey JD, Bernard TE (2000) Heat stress. Chapter 22. In: Harris RL (ed), Patty's Industrial Hygiene, Fifth edition. New York, John Wiley and Sons. Raphael B. (1986) When disaster strikes: How individuals and communities cope with catastrophe. New York: Basic Books. Ren C, Tong S. (2006) Temperature modifies the health effects of particulate matter in Brisbane, Australia. Int J Biometeorology 51: 87-96. Rocklöv J, Forsberg B (2007) Dödsfallen i Stockholm ökar med värmen. Läkartidningen, 104, 2163-2166. (in Swedish: Deaths in Stockholm increase with heat. Swedish Medical Journal). Tucker R, Ranch L, Harley YXR, Noakes TD (2004) Impaired exercise performance in the heat is associated with an anticipatory reduction in skeletal muscle recruitment. European J of Physiology, 448, 422-430. UKMOH (1954) Mortality and morbidity during the London Fog in December 1952. London, UK Ministry of Health. Vaneckova P, Hart MA, Beggs PJ, de Dear RJ. Synoptic analysis of heat-related mortality in Sydney, Australia, 1993-2001. Int J Biometeorol 2008; 52(6): 439-451. WHO (1989) PEP document on CC and health. Geneva, World Health Organization. WHO (2002) World Health Report 2002. Geneva, World Health Organization. WHO (2005a) Preventing chronic diseases. Preparing a health care workforce. Geneva, World Health Organization. WHO (2005b) Preventing chronic diseases -- a vital investment. Geneva, World Health Organization. WHO (2005c) Health effects of transport-related air pollution (edited by Michal Krzyzanowski et al.). Copenhagen, World Health Organization Regional Office for Europe. WHO (2006) WHO Air Quality Guidelines for particulate matter, ozone, nitrogen dioxide and sulphur dioxide. Global update 2005. Summary of risk assessment. Geneva, World Health Organization. WHO (2008a) (chair and lead writer: T Kjellstrom) Our cities, our health, our future. Acting on social determinants for health equity in urban settings. Kobe, Japan, World Health Organization, Centre for Health Development. WHO (2008b) Protecting health from climate change. World Health Day 2008. Geneva, World Health Organization. WHO (2008c) Work-plan to implement WHA resolution to protect health from climate change. Geneva, World Health Organization (in press). WHO (2008d) Toolkit for event managers. World Health Day 2008. Delhi, World Health Organization, Regional Office for South-East Asia. WHO (2008e) Poverty, health and environment. Joint Agency Paper. Poverty-Environment Partnership. Geneva, World Health Organization. WHO (2008f) Climate change and human health in Asia and the Pacific: from evidence to action. Report of the regional workshop, Bali, Indonesia, 10-12 December 2007. Report SEA-AH-555. Delhi, World Health Organization, Regional Office for South-East Asia. WHO (2008g) Guiding research to improve health protection from climate change. Geneva, World Health Organization (in press). WHO (2008h) Final report from the WHO Commission on Social Determinants of Health. Geneva, World Health Organization.

45
Williamson AM et al., (2001) Developing measures of fatigue using an alcohol comparison to validate the effects of fatigue on performance. Acc Anal and Prev, 33, 313-326.