Embed Size (px)
Citation preview
Proceedings of the Research Symposium of Uva Wellassa University, January 29-30, 2015
Technical Session – Animal Science
Table of Contents
Oral Session
Effect of different aerobic and anoxic time periods on the effluent
water quality of a sequence batch reactor in a meat processing plant1
Development of Avocado (Persea americana) Incorporated Set
Yoghurt ................................................................................................................... 4
Production characteristics and technical efficiency of buffalo
farmers in Thanamalwila veterinary division ............................................ 7
Development of drinking yoghurt by incorporating corn (Zea mays)
milk and corn seeds ........................................................................................... 10
Effect of tropical forages on growth performance and carcass quality
of rabbits ............................................................................................................... 13
Diversity and antibiotic resistance patterns of Lactobacillus species
in traditional curd in Sri Lanka .................................................................... 17
A preliminary study on Milk Urea Nitrogen values of the Ambewela
farm ........................................................................................................................ 20
Comparison of broiler chick performance in single stage incubation
and multi stage incubation .............................................................................. 23
Potential to use extracts from Lawsonia inermis (Marathondhi)
leaves and Emblica officinalis (Nelli) fruits as tannin agents in
leather manufacturing ...................................................................................... 26
Performance evaluation of different broiler strains under
environmental controlled broiler house in Sri Lanka ............................ 29
Development of Fishmeal using Knifefish Chitala ornata ..................... 32
A study on microbial contaminations, sources and preventive
measures in salted butter production in a commercial dairy plant ... 34
Proceedings of the Research Symposium of Uva Wellassa University, January 29-30, 2015
A Study on Crocodile Behavior (Crocodylus palustris) and Public
Value Orientation in Ethimale of Monaragala District ......................... 37
Development of Tomato (Solanum lycopersicum) Incorporated Fish
Nuggets .................................................................................................................. 40
Analysis of Consumer Food Safety Knowledge and Practices in
Rathnapura .......................................................................................................... 43
A study on shelf life of export oriented fresh chilled Yellowfin tuna
loins in relation to histamine content ........................................................... 46
Poster Session
Development of Finger millet (Eleusinecoracana) incorporated
symbiotic drinking yoghurt ............................................................................ 49
Development of soursop pulp (Annonamuricata) incorporated
fermented sweet cream buttermilk beverage ............................................ 53
Development of fruit (Musa spp.) puree incorporated synbiotic
stirred yoghurt .................................................................................................... 57
Quail egg consumption: patterns, preferences and perceptions
among consumers in Galle district, Sri Lanka ......................................... 61
Proceedings of the Research Symposium of Uva Wellassa University, January 29-30, 2015
1
Effect of different aerobic and anoxic time periods on the
effluent water quality of a sequence batch reactor in a meat
processing plant
K.P.W. Kahandawa, A.M.N.L. Abesinghe, A.M. Samaraweera
Faculty of Animal Science and Export Agriculture, Uva Wellassa University of Sri Lanka
and
J.K. Dissanayake
CIC Poultry Farms Pvt Ltd, Horakandawila, Badalgama, Sri Lanka
Introduction
A large amount of slaughterhouse wastewater is generated during meat product
manufacturing. It contains high concentrations of organic matter, oil and grease and
nitrogenous compounds. Hence, releasing waste water to the environment causes many
environmental problems such as contamination of groundwater and eutrophication of surface
waters (Rodriguez et al., 2010). The treatment of waste water is especially important in this
view. Treatment of wastewater by means of biological process has been widely implemented
from urban to industrial wastewater. Sequencing batch reactor (SBR) is a modification of
activated sludge process and operates by a cycle of periods consisting of fill, react
(alternatively aerobic and anoxic periods), settle, decant, and idle (Mahvi, 2008).
In the SBR process there is no standard time combination for aerobic and anoxic period. It
will depend on the effluent waste water components and vary plant to plant. Currently aerobic
and anoxic period is operated as 2 hr aerobic and 1 hour anoxic period in the waste water
treatment plant of CIC meat processing company. The present investigation was undertaken
to study best time combination of aerobic and anoxic time period for simultaneous carbon
oxidation, nitrification and denitrification performance of sequencing batch reactor to treat
slaughterhouse wastewater.
Methodology
The current study was carried out at CIC Poultry Farms Pvt Ltd (Processing Plant),
Badalgama. Laboratory analysis was done at CIC Processing Plant Laboratory and Uva
Wellassa University laboratories. Model structure of aeration tank which has the capacity of
600 L was used to conduct the research experiments. 180 mL of sludge from SBR unit in CIC
meat processing plant and 420 mL volume of wastewater was fed to tank each day of the
treatment. Air was supplied to the reactor during aerobic phase of react period with the help
of diffused aeration system and Anoxic conditions were maintained by switching off the
aerators. Eight different combinations of aerobic and anoxic periods were used. Every
sequence was operated totally for 20 hrs of react period by alternating the aerobic and anoxic
period according to selected different time combinations (Table 01).
Proceedings of the Research Symposium of Uva Wellassa University, January 29-30, 2015
2
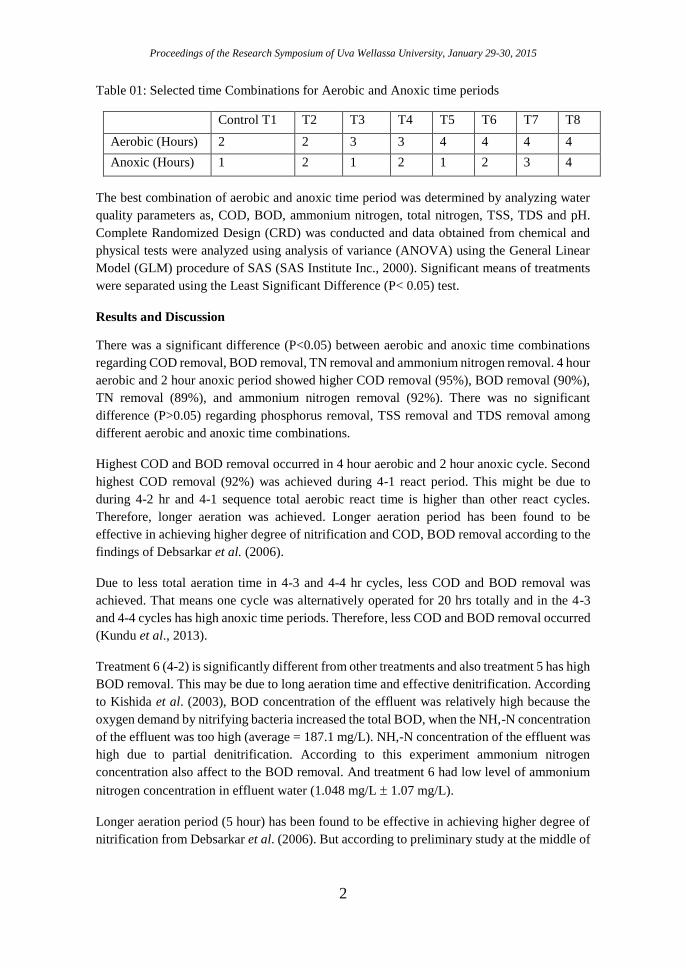
Table 01: Selected time Combinations for Aerobic and Anoxic time periods
Control T1 T2 T3 T4 T5 T6 T7 T8
Aerobic (Hours) 2 2 3 3 4 4 4 4
Anoxic (Hours) 1 2 1 2 1 2 3 4
The best combination of aerobic and anoxic time period was determined by analyzing water
quality parameters as, COD, BOD, ammonium nitrogen, total nitrogen, TSS, TDS and pH. Complete Randomized Design (CRD) was conducted and data obtained from chemical and
physical tests were analyzed using analysis of variance (ANOVA) using the General Linear
Model (GLM) procedure of SAS (SAS Institute Inc., 2000). Significant means of treatments
were separated using the Least Significant Difference (P< 0.05) test.
Results and Discussion
There was a significant difference (P<0.05) between aerobic and anoxic time combinations
regarding COD removal, BOD removal, TN removal and ammonium nitrogen removal. 4 hour
aerobic and 2 hour anoxic period showed higher COD removal (95%), BOD removal (90%),
TN removal (89%), and ammonium nitrogen removal (92%). There was no significant
difference (P>0.05) regarding phosphorus removal, TSS removal and TDS removal among
different aerobic and anoxic time combinations.
Highest COD and BOD removal occurred in 4 hour aerobic and 2 hour anoxic cycle. Second
highest COD removal (92%) was achieved during 4-1 react period. This might be due to
during 4-2 hr and 4-1 sequence total aerobic react time is higher than other react cycles.
Therefore, longer aeration was achieved. Longer aeration period has been found to be
effective in achieving higher degree of nitrification and COD, BOD removal according to the
findings of Debsarkar et al. (2006).
Due to less total aeration time in 4-3 and 4-4 hr cycles, less COD and BOD removal was
achieved. That means one cycle was alternatively operated for 20 hrs totally and in the 4-3
and 4-4 cycles has high anoxic time periods. Therefore, less COD and BOD removal occurred
(Kundu et al., 2013).
Treatment 6 (4-2) is significantly different from other treatments and also treatment 5 has high
BOD removal. This may be due to long aeration time and effective denitrification. According
to Kishida et al. (2003), BOD concentration of the effluent was relatively high because the
oxygen demand by nitrifying bacteria increased the total BOD, when the NH,-N concentration
of the effluent was too high (average = 187.1 mg/L). NH,-N concentration of the effluent was
high due to partial denitrification. According to this experiment ammonium nitrogen
concentration also affect to the BOD removal. And treatment 6 had low level of ammonium
nitrogen concentration in effluent water (1.048 mg/L 1.07 mg/L).
Longer aeration period (5 hour) has been found to be effective in achieving higher degree of
nitrification from Debsarkar et al. (2006). But according to preliminary study at the middle of
Proceedings of the Research Symposium of Uva Wellassa University, January 29-30, 2015
3
5th hour pH is reached to 6.9, but optimum pH for nitrification is 8.2. Therefore, in this
experiment longest aeration time per one cycle was selected as 4 hr.
According to the statistical analysis, there is no significant difference (P> 0.05) between
different aerobic, anoxic time combinations and total dissolved solid and total suspended
solids removal. This might be due to activated sludge treatment is not intended to remove
dissolved or suspended solids (Sustarsic, 2009).
Conclusions
The combination of 4 hours aerobic react period and 2 hours anoxic react period has been
found to be optimum from the view point of both nitrification and denitrification, and COD,
BOD removal. When total aeration time period is low, removal of COD, BOD is not efficient
in 4 hr aerobic – 4 hr anoxic and 4 hr aerobic – 3 hr anoxic time combinations.
Acknowledgment
CIC meat Processing plant, Horakandawila is acknowledged for the facilities provided.
References
Debsarkar, A., Kundu P. and Mukherjee, S. (2006). Sequencing Batch Reactor (SBR)
treatment for simultaneous organic carbon and nitrogen removal- A laboratory study. Journal
of environmental science & engineering, 48: 169-174.
Kishida, N., Kim, J.H., Chen, M., Sasaki, H. and Sud, R. (2003). Effectiveness of oxidation-
reduction potential and pH as monitoring and control parameters for nitrogen removal in
swine wastewater treatment by sequencing batch reactors. Journal of BioScience and
Bioengineering, 96:3.
Kundu P., Debsarkar, A. and Mukherjee, S. (2013). Simultaneous oxidation of organic carbon,
nitrification and denitrification in a sequential batch reactor for treatment of slaughter house
wastewater. International Journal of Environmental Engineering Research, 2: 69-80.
Mahvi, A.H. (2008). Sequencing batch reactor: A promising technology in wastewater
treatment. Iran, 5:79-90.
Rodriguez, D.C., Pino, N. and Penuela, G. (2010). Monitoring the removal of nitrogen by
applying a nitrification–denitrification process in a Sequencing Batch Reactor (SBR). 102(3):
2316-21.
SAS Institute Inc. (2000). SAS 9.1.3 Help and Documentation, SAS Institute Inc.
Sustarsic, M. (2009). Wastewater treatment: understanding the Activated sludge process,
Available at: < www.aiche.org/cep>, [viewed on 4 Aug, 2014].
Proceedings of the Research Symposium of Uva Wellassa University, January 29-30, 2015
4
Development of Avocado (Persea americana) Incorporated Set
Yoghurt
W.M.A.A. Kulasinghe, A.M.N.L. Abesinghe
Faculty of Animal Science and Export Agriculture, Uva Wellassa University of Sri Lanka
and
L.K.A. Gunawardhane
Lucky Lanka Milk Processing Company Limited, Sri Lanka
Introduction
Yoghurt is one of the best known of all cultured-milk products in the world. According to SLS
standards (1989) Streptococcus thermophillus and Lactobacillus bulgaricus are used to
convert lactose in milk in to lactic acid during yoghurt production. Fruit yoghurt is produce
by adding fruits and their nectars, jams, marmalade, fruit jellies, fruit drinks, fruit syrups and
concentrated fruit drinks to yoghurt or cultured pasteurized milk and fruit yoghurts enhances
versatility of taste, color and texture for the consumer (Chandan and Shahani, 1993).
Avocado (Persea americana) is a fruit which is having a very good nutrient profile and thus
incorporation endorses the healthy image of yoghurts. However, incorporation of avocado in
to set yoghurt is limited by enzymatic browning or formation of brown color melaniodins
from polyphenol oxidase enzyme in avocado (Bindesh, 2010). Pauker et al. (1992) have found
incorporation of avocado in to yogurt in the form of fresh avocado pulp is impossible due to
enzymatic browning. Therefore, control of enzymatic browning is essential in producing
avocado incorporated set yoghurt. Current study was carried out to develop avocado
incorporated set yoghurt that is having an adjusted solid content based on sensory properties
and controlling enzymatic browning of avocado pulp.
Methodology
Market available fresh ripened avocados (Fuerte variety) were manually peeled and crushed
in to a smooth pulp. It was divided in to seven samples with same weight and preserved using
several preserving and enzymatic browning control methods such as 1% citric acid, 1% (w/w)
ascorbic acid (Patricia et al., 1993), 1% (w/w) citric acid and 1% (w/w) ascorbic acid together
(Lopez, 2001), 0.1% (w/w) sodium benzoate (Patricia et al., 1993), 0.1% (w/w) potassium
sorbate (Singha, 2011), heat treatment at 40 ºC temperature for 30 minutes (Cantwell, 1992)
and preparation of avocado pulp as a jam (Connelly, 2013). The best avocado pulp preserving
method (least color changing treatment) was selected by conducting a sensory evaluation
using 30 untrained panelists.
The selected method of preserving avocado pulp (avocado jam) was used in preparation of
avocado incorporated set yoghurt. Yoghurt mix preparation was done according to Pande
(2010). Preliminary trials were used to select the appropriate level of ingredients (avocado
Proceedings of the Research Symposium of Uva Wellassa University, January 29-30, 2015
5
jam, sugar and gelatin). Sugar and gelatin levels were finalized after having several sensory
trials using 30 untrained panelists. Potassium sorbate 0.03% (w/w) was added to the final
mixture as preservative (SLS Standards, 1989) and homogenized using a beater (National™,
MK-H100N). Inoculation of lactic acid bacteria culture of YC 350 freeze dried (DVS) was
done at 45 °C temperature. Then mixture was poured in to 80 mL plastic yoghurt cups and
incubated at 42 ±2 ˚C for 4 hours. Each treatment consisted with three replicates.
Total plate count, coliform bacteria count, yeast and mold count, pH, titratable acidity and
peroxide value of selected avocado incorporated set yoghurt and avocado jam was tested at
1st, 3rd, 5th, 7th, 9th and 11th day under refrigerated storage. A proximate analysis was done to
determine the composition of the avocado incorporated set yoghurt.
Results and Discussion
Addition of 50% (w/w) sugar in to avocado pulp showed lowest brown color development
(P<0.05). Added sugar may have reduced the water activity of the avocado pulp. Enzymes
require certain level of water in their structures to maintain their natural conformation,
allowing them to deliver their full functionality. Therefore, presence of 50% sugar inhibits the
activity of polyphenol oxidase enzyme. Adding more than 50% of sugar, crystalize sugar in
the avocado pulp which gives undesirable consistency. Twenty percent of avocado jam
incorporation level shows the best results according to the sensory evaluation (P<0.05).
Total plate count, yeast and mold and coliform counts of the avocado incorporated set yoghurt
were not exceeding SLS standards for set yoghurt during 11 days of refrigerated storage.
Titratable acid percentage of avocado jam has increased from 1.22±0.07 to 1.4±0.07 during
day 1 to day 11 (P<0.05). It may be due to conversion of fermentable sugars in to acids by
microorganisms available in avocado jam. Further, titratable acid percentage of avocado
incorporated set yoghurt increased from 0.86±0.03 to 0.94±0.03 during 11 days storage period
(P<0.05). This is due to the presence of live lactic acid bacteria in culture which ferment
lactose in milk to lactic acid with the time (Chandan and Kilara, 2013). pH of avocado jam
and pH of avocado incorporated set yoghurt was reduced from 3.52±0.06 to 3.35±0.06 and
from 4±0.03 to 3.91±0.03, respectively during day 1 to day11. Increasing acidity results in
decreasing pH level in the product.
No fatty acid oxidation was detected in the avocado jam during storage period of 11 days.
Avocado incorporated set yoghurt started free radicle formation and rancidity development
7th day of storage onwards. Moreover, it shows increasing browning effect. Since, avocado is
a fruit with high fat and it contains considerable level of fatty acids, there is a potential to
observe oxidation in this product. Statistical analysis showed that enzymatic browning has an
influence on the increment of changing rapidity of titratable acidity, pH and peroxide value.
Further, it showed fatty acid oxidation and pH are not related. In the view of avocado
incorporated set yoghurt and avocado jam, avocado jam is having very low water activity due
to saturated sugar solution. Avocado incorporated set yoghurt is having an environment with
increasing acidity and decreasing pH with lactic acid fermentation. Water activity of avocado
incorporated set yoghurt also very high compared to avocado jam. These factors may have
influenced on the observed color change in avocado incorporated set yoghurt.
Proceedings of the Research Symposium of Uva Wellassa University, January 29-30, 2015
6
Proximate analysis of avocado incorporated set yoghurt showed that there is a significant
difference with plain yoghurt (P<0.05). Fat (3.6±0.42%), fiber (0.3±0.21%), ash (0.9±0.14%),
protein (3.5±0.07%) and total solids (16.10±1.31%) in avocado incorporated set yoghurt is
comparatively higher than available fat (3.0±0.42%), fiber (00±0.21%), ash (0.7±0.14%),
protein (3.4±0.07%) and solids (14.24±1.31%) in plain yoghurt.
Conclusion
Avocado incorporated set yoghurt is more nutritious compared to set yoghurt as it has included
with more protein, minerals and fiber. There is a relationship between enzymatic browning
and fatty acid oxidation. Further studies are required to identify how enzymatic browning and
fatty acid oxidation relates with each other and to extend the shelf life of avocado incorporated
set yoghurt.
References
Bindesh. (2010). Scientific Adventures with Food, [Online] Available at:<
http://desigrub.com/tag/enzymatic-browning-of-avocados> [Accessed 21st April 2014].
Chandan, R.C. and Kilara, A. (2013). Manufacturing Yogurt and Fermented Milks. [pdf]
Available at:<http://food5450.groupb.wikispaces.com/file/view/Manufacturing+Yogurt+and
+Fermented+Milks.pdf> [Accessed on 31st May 2014].
Chandan, R.C. and Shahani, K.M. (1993). Dairy Science and Technology Handbook: Product
Manufacturing, Vol. 2.
Lopez, V.M.G. (2011). Inhibition of Surface Browning, Cut Avocado.[pdf] Available at:
<http://www.aseanfood.info/Articles/11025015.pdf> [Accessed on 7th May 2014].
Pande, G. (2010). Yogurt/Yoghurt. [pdf] Available at: <http://server.fst.uga.edu/
kerr/DWBrooks/Food%20Stucture%20Projects/Yogurt.pdf> [Accessed on 2nd June 2014].
Patricia, G., Gonzalez, L.D., Barrett, D.M., Wrolstad, R.E. and Durst, R.W. (1993). Enzymatic
Browning Inhibited in Fresh and Dried Apple Rings by Pineapple Juice. [pdf] Available at: <
http://ucanr.edu/datastoreFiles/234-390.pdf>[Accessed on 15th May 2014].
Pauker, R., Bernstein, S., Popelf, G. and Rosenthalf, T. (1992). An assessment of processing
potential of avocado fruit. [pdf] Available at: <http://www. avocadosource.com/CAS
_Yearbooks/CAS_76_1992/CAS_1992_PG_137-144.pdf> [Accessed on 15th May 2014].
Singha, R. (2011). How to Use Potassium Sorbate. [Online] Available at: <http://www.
buzzle.com/articles/how-to-use-potassium-sorbate.html> [Accessed 0n 31st May 2014].
Sri Lanka Standards. (1989). Specification for fermented milk products 824: Part 2. Sri Lanka
Standards Institution, Colombo.
Proceedings of the Research Symposium of Uva Wellassa University, January 29-30, 2015
7
Production characteristics and technical efficiency of buffalo
farmers in Thanamalwila veterinary division
M.B.J.G.R. Malcolm, A.M. Samaraweera, R.M.S.D. Rathnayake
Faculty of Animal Science and Export Agriculture, Uva Wellassa University of Sri Lanka
Introduction
At present milk production from large ruminants only meet 17% of the countries requirements
(Ministry of livestock and rural community development, 2012). According to Department of
animal production and health (2012) Thanamalwila Veterinary division (VD) in Moneragala
district has the highest buffalo population in Uva province which is well established over
cattle rearing and plays an important role in income generation of rural farm households.
Therefore, this study was conducted to identify the important socio-economic determinants of
milk production and to estimate the technical efficiency of dairy production in Thanamalwila
VD.
Materials and methods
Study was conducted in Thanamalwila VD. Fifty buffalo farmers were selected using multi
stage sampling technique. Random numbers of buffalo farms were selected from each Grama
Niladhari division to field survey based on buffalo farm population. Rearing buffalo as
primary and secondary income source was the selected criteria for buffalo farmers. Primary
data were collected using pre tested structured questionnaire and following models were used
in the analysis of stochastic production function and inefficiency model. Then, data were
analyzed using Minitab 14 and STATA 11 software packages.
Model 1: Cobb-Douglas model
𝒍𝒏 𝒀𝒊 = 𝜷𝟎 + 𝜷𝟏𝒍𝒏𝑿𝟏𝒊 + 𝜷𝟐𝒍𝒏𝑿𝟐𝒊 + 𝜷𝟑𝒍𝒏𝑿𝟑𝒊 + 𝜷𝟒𝒍𝒏𝑿𝟒𝒊 + 𝜷𝟓𝒍𝒏𝑿𝟓𝒊 + 𝜷𝟔𝒍𝒏𝑿𝟔𝒊
+ 𝜷𝟕𝒍𝒏𝑿𝟕𝒊 + 𝜷𝟖𝒍𝒏𝑿𝟖𝒊 + (𝑽𝒊 − 𝑼𝒊)
Where “ln” denotes logarithms to base e, while, Yi= Milk yield (L animal-1 day-1), X1= Breed,
X2= Average birth weight (kg), X3= Condition of the shed , X4= Grazing duration (hours day-
1), X5= Labor allocation (hour animal-1 day-1), X6= Frequency of water given (number of times
per day), X7= Cost of buffalo farming (LKR per month), X8= Value of feed, Vi= Random
variable, Ui= Non negative random variables.
Model 2: The inefficiency model specification (Battese and Coelli, 1995),
𝑼𝒊 = 𝜹𝟎 + 𝜹𝟏𝒁𝟏 + 𝜹𝟐𝒁𝟐 + 𝜹𝟑𝒁𝟑 + 𝜹𝟒𝒁𝟒 + 𝑾𝒊
Where, Z1 = Age of the farmer (Year), Z2 = Education level (Year), Z3 = Monthly income level
(LKR), Z4 = Experience of the farmer (Year), Wi = Unobservable random variables
Result and discussion
Proceedings of the Research Symposium of Uva Wellassa University, January 29-30, 2015
8
All the buffalo farmers in the sample were male and majority was belonged to 21-30 age
category (30%) and a high proportion (62%) of buffalo farmers had education up to grade 10.
Only 6% of respondents had the education level beyond GCE ordinary level.
Most of the villages (98%) reared both local as well as exotic river type buffalo breeds and
the preferable breed combination was local buffalo and Murrah or Niliravi cross breds. Only
2% of farmers reared solely local buffaloes. Herd size ranged between 2-185 animals and
majority of respondents (38%) had a herd size of 21-40. Moreover, the predominant
management system (94%) was the extensive management system. Interestingly, one farmer
(2%) has practiced the intensive management system. Moreover, 6% of farmers practiced
artificial inseminations (AI) in their breeding program. Feed availability, water availability,
changes in rainfall pattern, and land availability were the most serious constraints faced by
respondents. Elephant attack and illegal smuggling were also critical problems in buffalo
farming in the area.
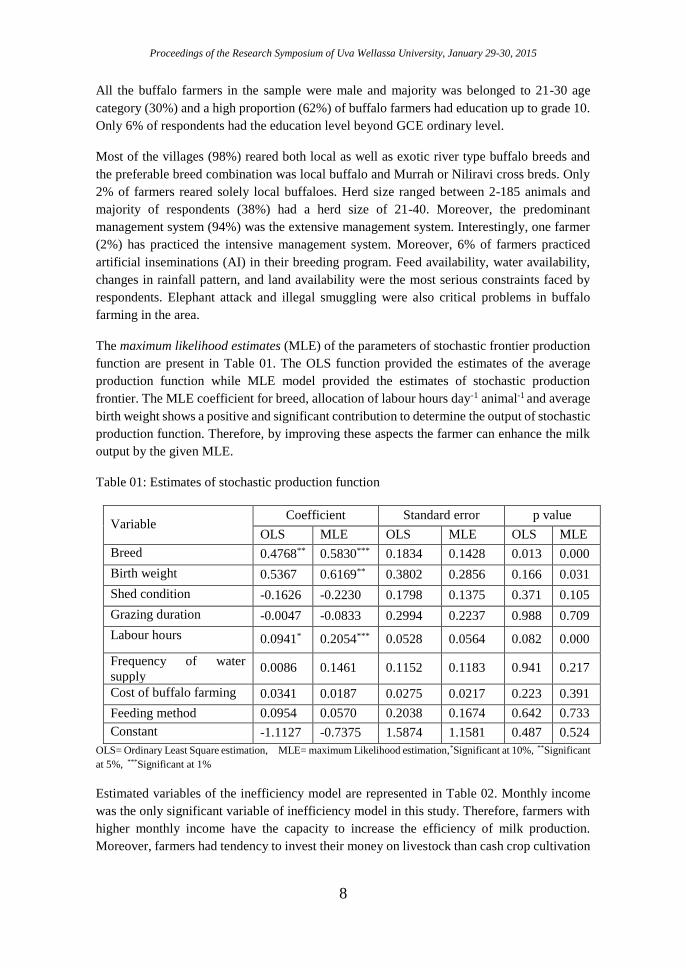
The maximum likelihood estimates (MLE) of the parameters of stochastic frontier production
function are present in Table 01. The OLS function provided the estimates of the average
production function while MLE model provided the estimates of stochastic production
frontier. The MLE coefficient for breed, allocation of labour hours day-1 animal-1 and average
birth weight shows a positive and significant contribution to determine the output of stochastic
production function. Therefore, by improving these aspects the farmer can enhance the milk
output by the given MLE.
Table 01: Estimates of stochastic production function
Variable Coefficient Standard error p value
OLS MLE OLS MLE OLS MLE
Breed 0.4768** 0.5830*** 0.1834 0.1428 0.013 0.000
Birth weight 0.5367 0.6169** 0.3802 0.2856 0.166 0.031
Shed condition -0.1626 -0.2230 0.1798 0.1375 0.371 0.105
Grazing duration -0.0047 -0.0833 0.2994 0.2237 0.988 0.709
Labour hours 0.0941* 0.2054*** 0.0528 0.0564 0.082 0.000
Frequency of water
supply 0.0086 0.1461 0.1152 0.1183 0.941 0.217
Cost of buffalo farming 0.0341 0.0187 0.0275 0.0217 0.223 0.391
Feeding method 0.0954 0.0570 0.2038 0.1674 0.642 0.733
Constant -1.1127 -0.7375 1.5874 1.1581 0.487 0.524
OLS= Ordinary Least Square estimation, MLE= maximum Likelihood estimation,*Significant at 10%, **Significant
at 5%, ***Significant at 1%
Estimated variables of the inefficiency model are represented in Table 02. Monthly income
was the only significant variable of inefficiency model in this study. Therefore, farmers with
higher monthly income have the capacity to increase the efficiency of milk production.
Moreover, farmers had tendency to invest their money on livestock than cash crop cultivation
Proceedings of the Research Symposium of Uva Wellassa University, January 29-30, 2015
9
because they considered cash crop cultivation as relatively risky business due to dry climatic
condition in the area.
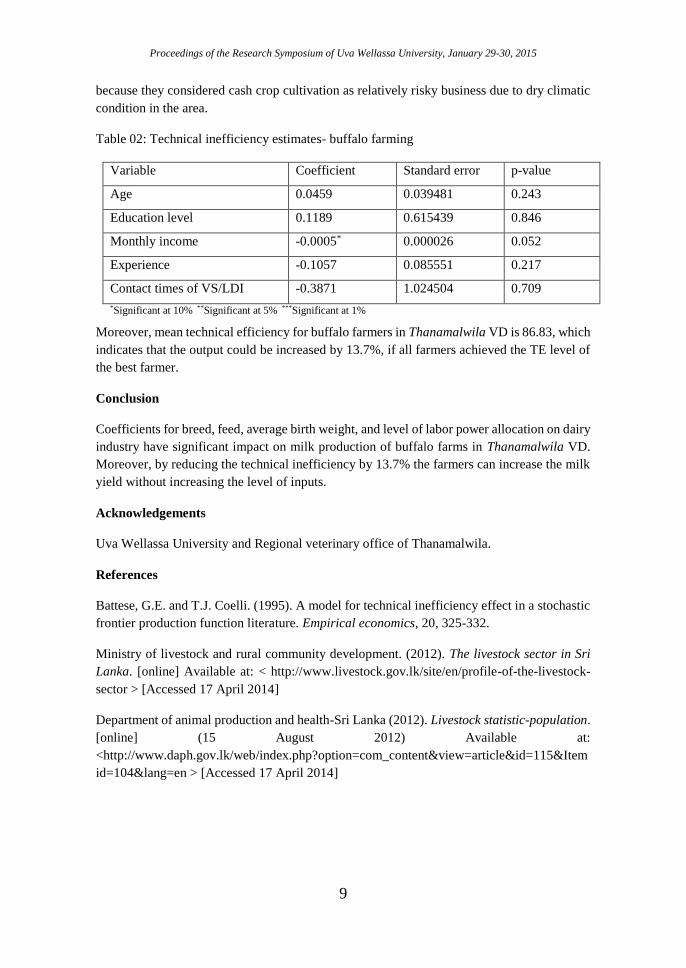
Table 02: Technical inefficiency estimates- buffalo farming
Variable Coefficient Standard error p-value
Age 0.0459 0.039481 0.243
Education level 0.1189 0.615439 0.846
Monthly income -0.0005* 0.000026 0.052
Experience -0.1057 0.085551 0.217
Contact times of VS/LDI -0.3871 1.024504 0.709
*Significant at 10% **Significant at 5% ***Significant at 1%
Moreover, mean technical efficiency for buffalo farmers in Thanamalwila VD is 86.83, which
indicates that the output could be increased by 13.7%, if all farmers achieved the TE level of
the best farmer.
Conclusion
Coefficients for breed, feed, average birth weight, and level of labor power allocation on dairy
industry have significant impact on milk production of buffalo farms in Thanamalwila VD.
Moreover, by reducing the technical inefficiency by 13.7% the farmers can increase the milk
yield without increasing the level of inputs.
Acknowledgements
Uva Wellassa University and Regional veterinary office of Thanamalwila.
References
Battese, G.E. and T.J. Coelli. (1995). A model for technical inefficiency effect in a stochastic
frontier production function literature. Empirical economics, 20, 325-332.
Ministry of livestock and rural community development. (2012). The livestock sector in Sri
Lanka. [online] Available at: < http://www.livestock.gov.lk/site/en/profile-of-the-livestock-
sector > [Accessed 17 April 2014]
Department of animal production and health-Sri Lanka (2012). Livestock statistic-population.
[online] (15 August 2012) Available at:
<http://www.daph.gov.lk/web/index.php?option=com_content&view=article&id=115&Item
id=104&lang=en > [Accessed 17 April 2014]
Proceedings of the Research Symposium of Uva Wellassa University, January 29-30, 2015
10
Development of drinking yoghurt by incorporating corn (Zea
mays) milk and corn seeds
R.I.W. Mendis, A.M.N.L. Abesinghe, A.M. Samaraweera
Faculty of Animal Science and Export Agriculture, Uva Wellassa University of Sri Lanka
and
L.K.A. Gunawardhane
Lucky Lanka Milk Processing Company Limited, Sri Lanka
Introduction
Cereal grains are considered as important sources of dietary proteins, carbohydrates, vitamins,
minerals and fiber for people all over the world (Chavan and Kadam, 1989). Corn (Zea mays)
is locally grown cereal that can be purchased at low price from several areas in Sri Lanka.
Corn milk is considered as a new innovation, especially in making yoghurt based products.
Vegetable based corn milk yoghurt is an alternative to substitute the cow milk based yoghurt.
Drinking yogurt is the fastest growing food and beverage category in worldwide (Yasni and
Maulidya, 2013). However, still value added drinking yoghurts are rare in Sri Lankan market.
Adding cereal grains is a perfect way to upgrade a drink to a nutritious breakfast. Therefore,
this study was conducted to develop yoghurt by incorporating corn (Zea mays) milk and corn
seed to cow milk.
Methodology
The study was carried out at Lucky Lanka Milk Processing Com. Ltd (LLMP), Matara and
Uva Wellassa University. Six experimental trials with different treatments were conducted. In
trial I, mature fresh corn seeds, mature boiled corn seeds and germinated corn seeds were
separately used to extract corn milk and the best extract of corn milk was evaluated by sensory
properties (odor, taste, color and mouth feel) using untrained panelist. In trial II the most
compatible sugar (8%, 9% and 10% w/v) and gelatin (0%, 0.2% and 0.4% w/v) levels for
different corn milk percentages (5%, 10%, 15% and 20% w/v) were identified. After selection
of appropriate combinations of sugar and gelatin levels, trial III was done to select the best
corn milk incorporation level by narrow downing the corn milk percentages (6%, 8%, 10%,
12% and 14%). Preserved in sugar syrup and boiled corn seeds were crushed into two sizes
(> 3.15 mm and 2 mm –3. 15 mm) to prepare different types of corn seeds. Trial IV was
carried out to select best corn seeds particles on the textural basis and trial V was done to
assess the consumer acceptability for the presence of corn seeds in the corn milk incorporated
drinking yoghurt. Finally three treatments (trial VI) were prepared and evaluated on sensory,
chemical and microbiological properties. The sensory evaluation was done using 35 untrained
panelists. In chemical analysis, proximate analysis (moisture content, crude fat, total solid,
crude protein, ash and crude fiber content) was conducted. pH value and titratable acidity were
evaluated and microbiological analysis was done for Yeast and Moulds, and Escherichia coli
for three weeks in one day interval. The sensory data were analyzed using Friedman
Proceedings of the Research Symposium of Uva Wellassa University, January 29-30, 2015
11
nonparametric test. Complete Randomized Design was conducted and data obtained from
chemical and microbiological tests were analyzed by Analysis of Variance using the General
Linear Model procedure of SAS. Significant means of treatments were separated using the
Least Significant Difference test (P< 0.05).
Result and Discussion
In trial I, boiled corn seeds (mature) based method was selected to extract corn milk. Other
two methods were rejected due to the unpleasant odour and taste which may be due to the
activation of various food enzymes and breaking down the higher molecular components to
simple molecules during germination.
Eight per cent sugar (w/v) for 5% corn milk (w/v) and 10% sugar (w/v) for other 10%, 15%
and 20% corn milk (w/v) incorporation levels were selected due to desirable sweetness. The
gelatin level (w/v) was selected as 0% due to the presence of appropriate drinking yoghurt
properties including texture, mouth feel, appearance and viscosity. The whey separation has
been prevented by stabilizing effect of corn starch in corn milk.
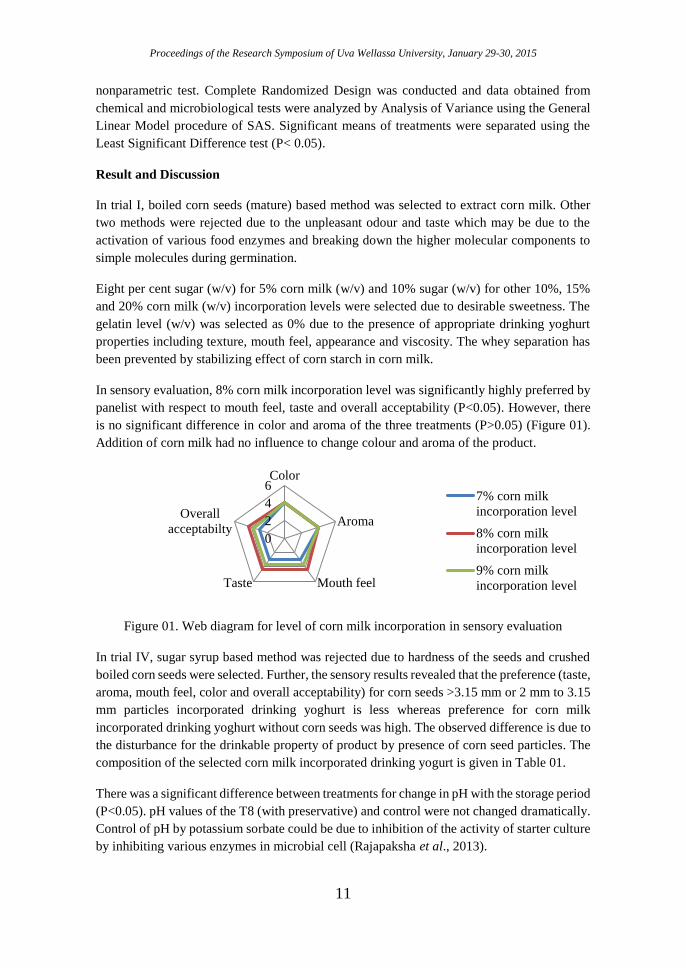
In sensory evaluation, 8% corn milk incorporation level was significantly highly preferred by
panelist with respect to mouth feel, taste and overall acceptability (P<0.05). However, there
is no significant difference in color and aroma of the three treatments (P>0.05) (Figure 01).
Addition of corn milk had no influence to change colour and aroma of the product.
Figure 01. Web diagram for level of corn milk incorporation in sensory evaluation
In trial IV, sugar syrup based method was rejected due to hardness of the seeds and crushed
boiled corn seeds were selected. Further, the sensory results revealed that the preference (taste,
aroma, mouth feel, color and overall acceptability) for corn seeds >3.15 mm or 2 mm to 3.15
mm particles incorporated drinking yoghurt is less whereas preference for corn milk
incorporated drinking yoghurt without corn seeds was high. The observed difference is due to
the disturbance for the drinkable property of product by presence of corn seed particles. The
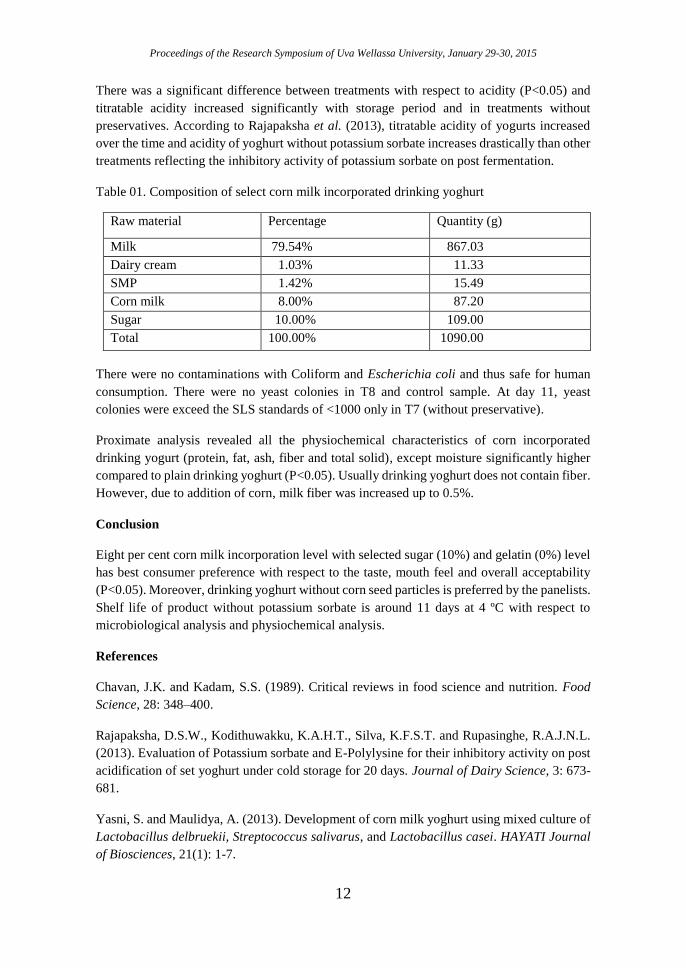
composition of the selected corn milk incorporated drinking yogurt is given in Table 01.
There was a significant difference between treatments for change in pH with the storage period
(P<0.05). pH values of the T8 (with preservative) and control were not changed dramatically.
Control of pH by potassium sorbate could be due to inhibition of the activity of starter culture
by inhibiting various enzymes in microbial cell (Rajapaksha et al., 2013).
0
2
4
6Color
Aroma
Mouth feelTaste
Overall
acceptabilty
7% corn milk
incorporation level
8% corn milk
incorporation level
9% corn milk
incorporation level
Proceedings of the Research Symposium of Uva Wellassa University, January 29-30, 2015
12
There was a significant difference between treatments with respect to acidity (P<0.05) and
titratable acidity increased significantly with storage period and in treatments without
preservatives. According to Rajapaksha et al. (2013), titratable acidity of yogurts increased
over the time and acidity of yoghurt without potassium sorbate increases drastically than other
treatments reflecting the inhibitory activity of potassium sorbate on post fermentation.
Table 01. Composition of select corn milk incorporated drinking yoghurt
Raw material Percentage Quantity (g)
Milk 79.54% 867.03
Dairy cream 1.03% 11.33
SMP 1.42% 15.49
Corn milk 8.00% 87.20
Sugar 10.00% 109.00
Total 100.00% 1090.00
There were no contaminations with Coliform and Escherichia coli and thus safe for human
consumption. There were no yeast colonies in T8 and control sample. At day 11, yeast
colonies were exceed the SLS standards of <1000 only in T7 (without preservative).
Proximate analysis revealed all the physiochemical characteristics of corn incorporated
drinking yogurt (protein, fat, ash, fiber and total solid), except moisture significantly higher
compared to plain drinking yoghurt (P<0.05). Usually drinking yoghurt does not contain fiber.
However, due to addition of corn, milk fiber was increased up to 0.5%.
Conclusion
Eight per cent corn milk incorporation level with selected sugar (10%) and gelatin (0%) level
has best consumer preference with respect to the taste, mouth feel and overall acceptability
(P<0.05). Moreover, drinking yoghurt without corn seed particles is preferred by the panelists.
Shelf life of product without potassium sorbate is around 11 days at 4 ºC with respect to
microbiological analysis and physiochemical analysis.
References
Chavan, J.K. and Kadam, S.S. (1989). Critical reviews in food science and nutrition. Food
Science, 28: 348–400.
Rajapaksha, D.S.W., Kodithuwakku, K.A.H.T., Silva, K.F.S.T. and Rupasinghe, R.A.J.N.L.
(2013). Evaluation of Potassium sorbate and E-Polylysine for their inhibitory activity on post
acidification of set yoghurt under cold storage for 20 days. Journal of Dairy Science, 3: 673-
681.
Yasni, S. and Maulidya, A. (2013). Development of corn milk yoghurt using mixed culture of
Lactobacillus delbruekii, Streptococcus salivarus, and Lactobacillus casei. HAYATI Journal
of Biosciences, 21(1): 1-7.
Proceedings of the Research Symposium of Uva Wellassa University, January 29-30, 2015
13
Effect of tropical forages on growth performance and carcass
quality of rabbits
F.S. Mohamed, E.D.N.S. Abeyrathne
Uva Wellassa University, Badulla, Sri lanka
Introduction
Rabbit (Oryctolagus cuniculus) is a small mono-gastric animal which has a very small body
size and an efficient reproductive ability. Backyard rabbit keeping supplies additional protein
with low investment and labor inputs. Rabbit meat has many nutritional benefits which include
high protein, low cholesterol and high palatability (Samkol and Lukefahr, 2008).The major
problem with rabbit production is high feeding cost (Lebas et al., 1997). Feeding cost for
rabbits account more than 75% of total cost of production. At present there is a competition
for protein sources between man and animals (Jiya et al., 2011). Rabbits are herbivores and
can be successfully raised on diets with low in grains and high in roughage. Therefore tropical
legumes can be used as an alternative for fed rabbits. The objective of this study was to
determine the growth performance, carcass quality of weaner rabbits with diet containing
forage supplements and commercial layer pellet.
Methodology
The experiment was carried out at Uva Wellassa University, Badulla. Sixteen (16) weaned
cross bred rabbits, mixed sexes were used for the feeding trial which conducted for 45-days.
All rabbits selected which were born on same day,a few from same litter. Rabbits were
grouped according to Complete Randomized Block Design (CRBD) with four replicates, 2
males and 2 females for each diet group. Ration for all the diets were formulated according
to the nutritional requirement of grower rabbit. Maximum inclusion levels for the selected
leaves also considered. All animals were kept for an adaptation period during the adaptation
period rabbits were fed with only the control diet (Prima layer pellet) with fresh guinea grass
(Panicum maximum). The experimental diet was introduced gradually for 8 days. Water was
supplied ad-libitum for each rabbit. Guinea grass (Panicum maximum), Erythrina leaves
(Erythrina indica), Cassava leaves (Manihot esculenta Crantz) and Leucaena leaves
(Leucaena leucocephala) were harvested from the surrounding environment of the university
premises. Guinea grass was harvested one week before feeding to the animals and hay was
made by keeping under sun. Erythrina leaves, Cassava leaves and Leucaena leaves were
harvested three to four days before feeding rabbits. Those harvested leaves were chopped and
wilted until constant weight was gained. Wilted leaves and dried grass were stored under dry
condition. Diet 1 = Only layer pellet 100% (control), Diet 2 = Layer pellet 70%, Erythrina
indica 20%, Panicum maximum 10%, Diet 3 = Layer pellet 65%, Manihot esculenta Crantz
20%, Panicum maximum 15% and Diet 4 = Layer pellet 92%, Leucaena leucocephala 7%,
Panicum maximum 1%. Data were collected on body weight and weight gains, feed intake
and Feed Conversion Ratio (FCR).
Proceedings of the Research Symposium of Uva Wellassa University, January 29-30, 2015
14
Two rabbits (one male and one female) from each group were slaughtered for carcass quality
evaluation. After 45 days of feeding trial two rabbits (one male and one female) from each
treatment group was slaughtered. Hot carcass weight, pH, Length of carcass, dressing
percentage was evaluated under carcass quality parameters. Chemical composition of
carcasses was analyzed for proximate constituents according to AOAC, 2002 method. Sensory
evaluation of boiled meat samples were evaluated using 15 semi trained panelists.
Collected data was analyzed using Analysis of variance (one way ANOVA and two way
ANOVA) - Minitab 16 statistical software package. Analysis of variance fallowed by a mean
separation procedure using Tukey’s test. Sensory analysis was done by using non parametric
analysis of Friedman test.
Result and discussion
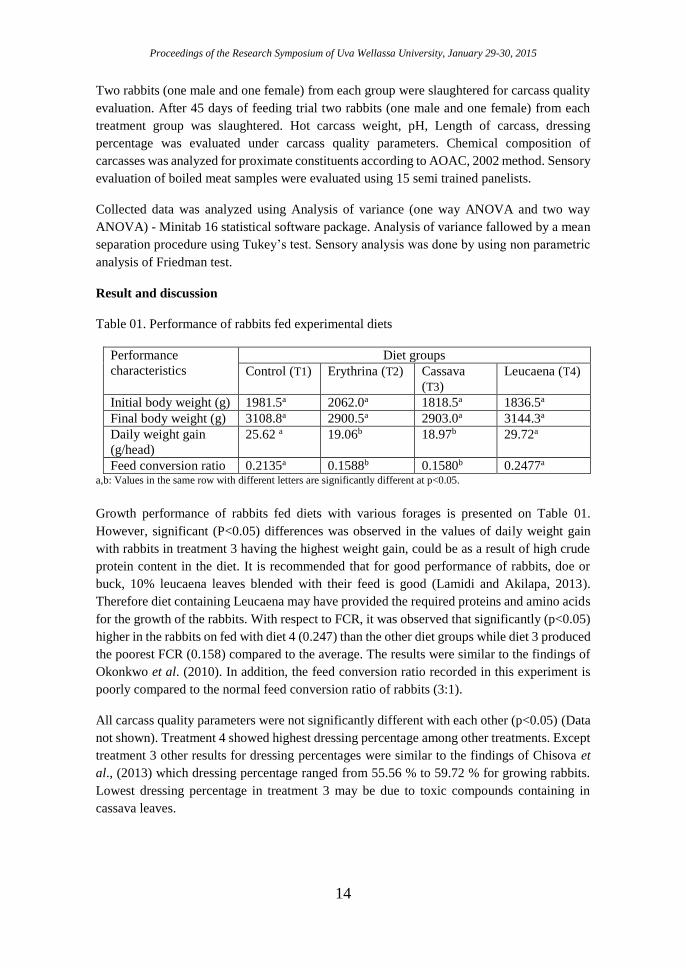
Table 01. Performance of rabbits fed experimental diets
Performance
characteristics
Diet groups
Control (T1) Erythrina (T2) Cassava
(T3)
Leucaena (T4)
Initial body weight (g) 1981.5a 2062.0a 1818.5a 1836.5a
Final body weight (g) 3108.8a 2900.5a 2903.0a 3144.3a
Daily weight gain
(g/head)
25.62 a 19.06b 18.97b 29.72a
Feed conversion ratio 0.2135a 0.1588b 0.1580b 0.2477a a,b: Values in the same row with different letters are significantly different at p<0.05.
Growth performance of rabbits fed diets with various forages is presented on Table 01.
However, significant (P<0.05) differences was observed in the values of daily weight gain
with rabbits in treatment 3 having the highest weight gain, could be as a result of high crude
protein content in the diet. It is recommended that for good performance of rabbits, doe or
buck, 10% leucaena leaves blended with their feed is good (Lamidi and Akilapa, 2013).
Therefore diet containing Leucaena may have provided the required proteins and amino acids
for the growth of the rabbits. With respect to FCR, it was observed that significantly (p<0.05)
higher in the rabbits on fed with diet 4 (0.247) than the other diet groups while diet 3 produced
the poorest FCR (0.158) compared to the average. The results were similar to the findings of
Okonkwo et al. (2010). In addition, the feed conversion ratio recorded in this experiment is
poorly compared to the normal feed conversion ratio of rabbits (3:1).
All carcass quality parameters were not significantly different with each other (p<0.05) (Data
not shown). Treatment 4 showed highest dressing percentage among other treatments. Except
treatment 3 other results for dressing percentages were similar to the findings of Chisova et
al., (2013) which dressing percentage ranged from 55.56 % to 59.72 % for growing rabbits.
Lowest dressing percentage in treatment 3 may be due to toxic compounds containing in
cassava leaves.
Proceedings of the Research Symposium of Uva Wellassa University, January 29-30, 2015
15
Sensory results showed that Erythrina indica incorporated diet fed rabbits meat was much
preferred than others. Results of sensory evaluation were same for both male and female
rabbits.
When consider proximate composition of rabbit meat, Crude protein content was varying
between 81.2 to 88.3 % (dry matter basis). Results were differ when consider male and female
animals. There is a less variation in fat content of both male and female animals regarding
four diets (6.2% - 7.1%). Results of fat and moisture content were similar to the findings of
Zotte (2002).
Conclusion
Smaller herbivores can persist on small quantities of food on the condition that the plants are
of high nutritional quality. Supplementation of concentrate with forage in the diet of rabbits
is cost effective. Leucaena leucocephala, Manihot esculenta Crantz and Erythrina indica
forages can be included in rabbit’s diet with recommended levels without any adverse effect.
Sensory results showed that Erythrina indica incorporated diet fed rabbits meat was much
preferred than others.
Carcass quality evaluation proved that Leucaena leucocephala incorporated diet fed rabbits
had highest dressing percentage which showed high weight gain. But proximate composition
of rabbit meat was not showed a high variation regarding four diets.
References
Chisowa, D.M, Mtimuni, J.P, Phoya, R.K.D. and Chagunda, M.G.G. (2013). Evaluation of
carcass quality of growing rabbits (Oryctolagus cunniculus) fed Soybean (Glycine max),
Cowpea (Vigna unguiculata) and Pigeon Pea (Cajanus cajan). Europian Academic Research
(E journal) 1.
Coudert, P, Lebas, F, Rochambeau de, H. and Thebault, R.G. (1997). The rabbit Husbandry,
health and production. Food and Agriculture Organization of the United Nations. Rome.
Jiya, EZ, Ijaiya, A.T, Oguche, K.O, Afolayan, F.O., Abdulkadi, B and Shehu, B.M. (2011).
Growth performance and nutrient utilization of weaned rabbits fed with diets in which palm
kernel cake (PKC) was replaced with cooked tallow (Detarium microcarpum) seed meal.
Animal and Veterinary Research, 3:7 – 10.
Lamidi, W.A. and Akilapa, T.P. (2013). Performance characteristics of rabbits fed with
Leucaena leaf meal based diet in natural housing system. Agricultural Science Research
Journal, 3(5):144- 151.
Okonkwo, J.C., Okonkwo, I.F. and Umerie, S.C. (2010). Replacement of feed concentrate
with graded levels of cassava leaf meal in the diet of growing rabbits: effect on feed and
growth parameters. Pakistan Journal of Nutrition, 9 (2):116-119.

Proceedings of the Research Symposium of Uva Wellassa University, January 29-30, 2015
16
Samkol, P. and Lukefahr, S.D. (2008). A challenging role for organic rabbit production
towards poverty alleviation in South East Asia. 9th World Rabbit Congress. Verona, Italy.
Zotte, A.D. (2002). Perception of rabbit meat quality and major factors influencing the rabbit
carcass and meat quality. Livestock production sciences, 11-32.
Proceedings of the Research Symposium of Uva Wellassa University, January 29-30, 2015
17
Diversity and antibiotic resistance patterns of Lactobacillus
species in traditional curd in Sri Lanka
T. Paranagama, C.P. Kodikara, G.D.D.K. Gunasena
Department of Microbiology, Faculty of Science, University of Kelaniya, Sri Lanka.
Introduction
Lactobacillus is a genus which comprises of more than 50 species as described in the Bergey’s
Manual of Systematic Bacteriology (2009) Lactobacilli are Gram-positive, non-spore-
forming rods or coccobacilli. They are generally considered as apathogenic, fastidious
bacteria and one of their main habitats is fermented dairy products.
In their fermentative pathways, main metabolic end product is Lactic acid. The fermentation
process of Lactobacillus increases the shelf-life of the fermented dairy product, as well as
adds the taste and improves the digestibility of milk. There are adequate evidences to prove
that traditionally fermented milk products have been produced for a long time in different
countries. Curd (Sri Lanka and India), Kefer (Russia), Yakult, Yogurt, Kumisss (Russia),
Tarhana (Turkey) are some examples.
There are Lactobacillus species that have achieved GRAS (Generally Recognized as Safe) or
QPS (Qualified Presumption of Safety) status. However, during the past few decades there
has been an emerging concern on spreading the antibiotic resistance in the environment. Due
to the increasing use of antibiotics and disposing them in to the environment in a considerably
inappropriate manner, concerns have arisen on the possibility and probability of spreading the
antibiotic resistance genes to Lactobacillus in fermented food (Farthing, 2004). The main
threat associated with these bacteria is that they can transfer resistance genes to pathogenic
bacteria as well as to the commensal flora in the intestinal tract. A number of initiatives have
been recently launched across the globe to address the biosafety concerns of starter cultures
and probiotic microorganisms. The European Food safety Authority (2007) considers
transferable antibiotic resistances as a safety concern. Many studies have detected the acquired
antibiotic resistance in fermented food products. Nevertheless, the tetracycline resistance was
shown to be able to transferred in vitro to Enterococcous faecalis from Lactobacillus species
isolated from fermented sausages (Gevers et al., 2003).
The objective of this study was to find out the diversity of Lactobacillus species in curd
prepared by small and medium scale producers in Sri Lanka and to detect their antibiotic
resistances.
Methodology
Total number of 32 curd samples representing different areas of the country were collected
from small and medium scale produces (SMS) who do not use starter cultures directly for the
process. Samples were enriched in modified Man Rogosa Sharpe broth at 370C at room
temperature for 24 h, under anaerobic conditions and plated on modified MRS agar medium
Proceedings of the Research Symposium of Uva Wellassa University, January 29-30, 2015
18
using agar overlay technique and incubated at 370C, for 24-36 h under anaerobic conditions.
Lactobacillus delbrueckii subsp. bulgaricus was used as the positive control. Morphologically
different colonies were isolated. Identification of the different strains were carried out using
morphological and biochemical tests according to the Bergey’s Manual of Systematic
Bacteriology. For the detection of antibiotic resistances, agar overlay disc diffusion method
(Charteris et al., 1998 ) was followed. The bacterial cultures used for this test were grown
overnight in modified MRS broth and the densities were adjusted to OD590nm = 0.1 using
spectrophotometer in order to obtain consistent growth. Penicillin G(P10),Tetracycline
(TE30), Erythromycin (E15), Bacitracin (B10), Rifampicin (RD30) Nalidixic Acid (NA30),
Vancomycin (VA30) and Polymixine B (PB300) were selected as the test antibiotics.
Results
For morphological characteristics, shape and colour of the colonies, Gram’s reaction, shape
and arrangement of cells, motility and endospore formation were observed. For the
biochemical characteristics, reaction in the Gibson’s medium, oxidase test, catalase test,
Arginine utilization, sugar fermentation tests (Arabinose, Cellobioose , Esculin, Galactose,
Maltose, Mannose, Melibiose, Raffinose, Ribose, Sucrose, Trehalose, Xylose, Salicin,
Sorbitol, Mannitol, Rhamnose, Lactose ) were detected.
A total Number of 51 Lactobacillus isolates were obtained in this study and all the 51 isolates
were comprised with 16 different bacterial species. Lactobacillus fermentum (35%)
Lactobacillus acidophilus (11.11%), Lactobacillus plantarum (5.55%) and Lactobacillus
amylolyticus (8.33%) represented majority. When compare the antibiotic resistance patterns
(Table 01), Polymixine B was reported to have 94.44% overall resistance. All the 51 isolates
were reported to score 100% of overall resistance for both Vancomycin and Nalidixic Acid.
Minimum percentages of antibiotic resistances were observed for Tetracycline (22.22%) and
Erythromycin (27.78%).
Discussion
Considering the prevalence of different Lactobacillus species, the results obtained in this
study correlate to a significant extent to some research carried out on traditional fermented
dairy products (Yu, 2011). Conversely, several research studies have been disclosed that L.
delbrueckii subsp. bulgaricus is the most abundant Lactobacilli in traditionally fermented
milk products (Tendakyi et al., 2001) and this species was not identified in this study.
Though the present study reveals less abundance of Tetracycline and Erythromycin resistance
compared to that of most other countries it can be considered as an important finding.
Correlate with the Tet- resistant species identified in this study, R-plasmids encoding Tet-
resistance have been reported in L. fermentum L. planatarum and L. amylolyticus. Because
the Tet-resistance has been transferred from Lactobacillus to E. faecalis in vitro it shows the
possibility of in vivo process. Further studies can be aimed at determining the transferability
of the Tet-resistance from Lactobacillus to commensal flora in vitro.
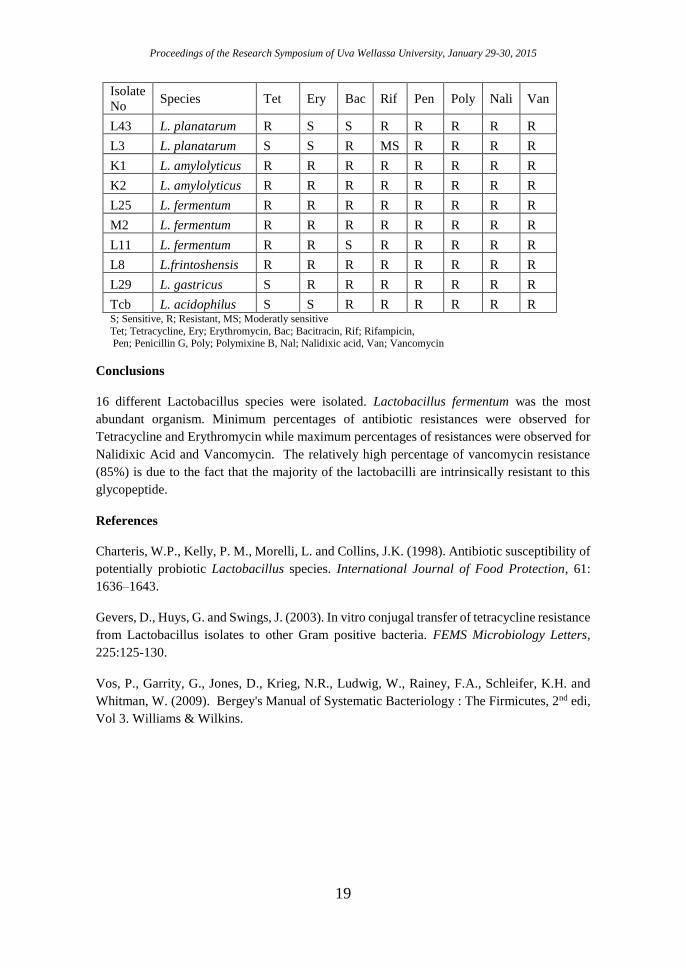
Table 01: Antibiotic resistance patterns of some selected Lactobacillus isolates.
Proceedings of the Research Symposium of Uva Wellassa University, January 29-30, 2015
19
Isolate
No Species Tet Ery Bac Rif Pen Poly Nali Van
L43 L. planatarum R S S R R R R R
L3 L. planatarum S S R MS R R R R
K1 L. amylolyticus R R R R R R R R
K2 L. amylolyticus R R R R R R R R
L25 L. fermentum R R R R R R R R
M2 L. fermentum R R R R R R R R
L11 L. fermentum R R S R R R R R
L8 L.frintoshensis R R R R R R R R
L29 L. gastricus S R R R R R R R
Tcb L. acidophilus S S R R R R R R S; Sensitive, R; Resistant, MS; Moderatly sensitive
Tet; Tetracycline, Ery; Erythromycin, Bac; Bacitracin, Rif; Rifampicin, Pen; Penicillin G, Poly; Polymixine B, Nal; Nalidixic acid, Van; Vancomycin
Conclusions
16 different Lactobacillus species were isolated. Lactobacillus fermentum was the most
abundant organism. Minimum percentages of antibiotic resistances were observed for
Tetracycline and Erythromycin while maximum percentages of resistances were observed for
Nalidixic Acid and Vancomycin. The relatively high percentage of vancomycin resistance
(85%) is due to the fact that the majority of the lactobacilli are intrinsically resistant to this
glycopeptide.
References
Charteris, W.P., Kelly, P. M., Morelli, L. and Collins, J.K. (1998). Antibiotic susceptibility of
potentially probiotic Lactobacillus species. International Journal of Food Protection, 61:
1636–1643.
Gevers, D., Huys, G. and Swings, J. (2003). In vitro conjugal transfer of tetracycline resistance
from Lactobacillus isolates to other Gram positive bacteria. FEMS Microbiology Letters,
225:125-130.
Vos, P., Garrity, G., Jones, D., Krieg, N.R., Ludwig, W., Rainey, F.A., Schleifer, K.H. and
Whitman, W. (2009). Bergey's Manual of Systematic Bacteriology : The Firmicutes, 2nd edi,
Vol 3. Williams & Wilkins.
Proceedings of the Research Symposium of Uva Wellassa University, January 29-30, 2015
20
A preliminary study on Milk Urea Nitrogen values of the
Ambewela farm
K.K.T.N. Ranaweera, Maheshika S. Kurukulasuriya, A.M. Samaraweera
Faculty of Animal Science and Export Agriculture, Uva Wellassa University of Sri Lanka
and
N. Priyankarage, and U.P.L. Mangalika
Veterinary Research Institute, Peradeniya, Sri Lanka
Introduction
Feeding management is a key factor in profit maximizing of a dairy farm. Milk Urea Nitrogen
(MUN) is a tool that measures the efficiency of protein and carbohydrate feeding to milking
cows (Jonker et al., 1999). Implementing routine use of MUN on dairy farms could reduce
nutrient loading to natural environments and improve farm profitability (Jonker et al., 2002).
According to Kohn (2007) dairy herds should have MUN concentrations between 8 to 12 mg
dL-1. However, the MUN values could be affected by many factors such as environment,
breed, feed, season, etc. (Godden et al., 2001). Hence the use of 8 to 12 mg dL-1 MUN values
to evaluate the dairy herds in the Sri Lanka would be inappropriate, since there were no studies
carried out in to determine the baselines of MUN values in Sri Lanka. Therefore, this study
has been carried out as a preliminary study, to study about the prevailing MUN values of one
of the commercial dairy farm in Sri Lanka.
Methodology
The study was conducted at Ambewela farm and Veterinary Research Institute, Sri Lanka.
Four groups of the milking herd in the Ambewela farm (treatments) which have been made
based on the production levels of the cows were used to collect milk samples. Samples from
each group were taken once in fortnight during three months’ experimental period. During
each sample collection, 15 cows were selected randomly from each group and 50 mL of milk
from each cow was obtained after complete milking. Milk from five cows belonging to each
group was pooled. Hence, each treatment consisted with three replicates. Milk fat was
analyzed using the Gerber method. Solids-non-fat (SNF), protein, salts and lactose contents
were measured using a portable ultrasonic milk analyzer (Lactoscan MCC, Milkotronic Ltd.,
Bulgaria). Lacto meter was used to measure the milk specific gravity. The urea content in milk
was estimated according to the method described by Malik and Sirohi (1998) and the optical
density of the sample was measured at 450 nm using the spectrophotometer (Cary 50 Conc -
10069600, Agilent Technologies, Australia). In the statistical analysis, according to the
normality of the sample data test by Anderson-Darling test, the relationships were evaluated
using multiple regression analysis or Spearman Rank Correlation Coefficient. STATA® S/E
11.2 and Minitab® 17 software were used in statistical analysis of the data. The MUN levels
were interpreted based on the current recommended levels of Kohn (2007).
Proceedings of the Research Symposium of Uva Wellassa University, January 29-30, 2015
21
Results and Discussion
The results revealed that the milk fat%, SNF%, protein%, lactose%, and specific gravity does
not have a significant relationship with MUN (P>0.05). Similarly Godden et al. (2001) have
stated that there is no association between MUN and either milk fat or true protein
percentages. Broderick and Clayton (1997) also confirm that there is no significant
relationship between milk SNF% and MUN values. Therefore, it can be stated that MUN
values are not related with fat%, SNF%, and protein% in dairy cow milk.
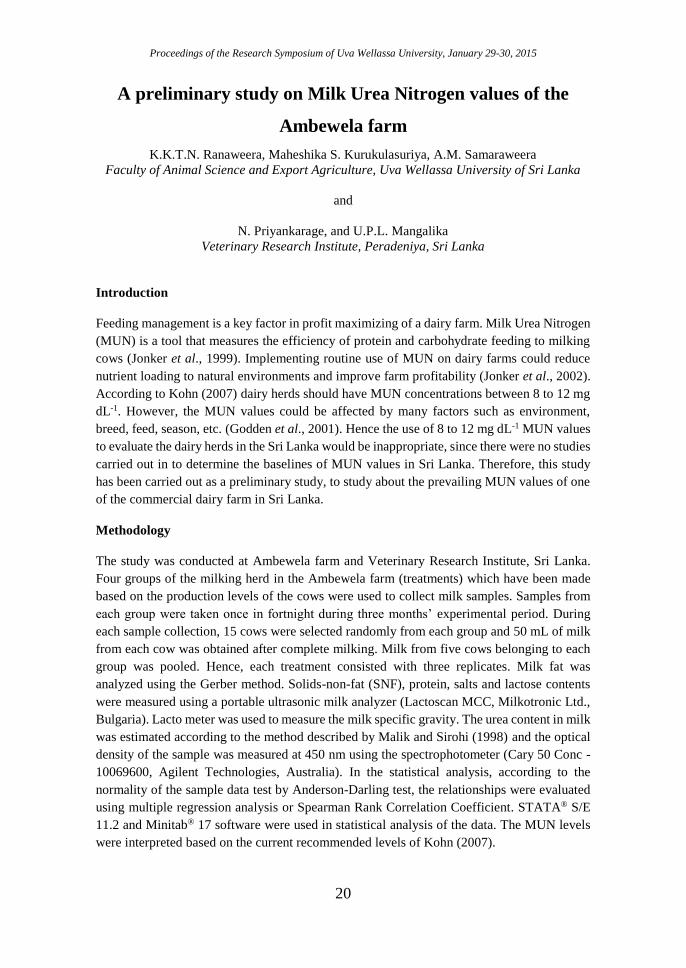
The variation of MUN values of each group in the selected weeks of experimental period are
shown in Figure 01.
Figure 01: Average MUN concentrations of different groups during the experimental period
All the groups showed higher MUN values during the experimental period except in 3rd and
11th weeks. On the 3rd week, all groups and on the 11th week, group P1 and P2 showed MUN
values close to the upper limit of Kohn (2007). However, on 11th week also group S and A
showed higher MUN values than the reference range. Moreover, the analysis of mean MUN
values of each group during the experimental period also revealed mean MUN values of each
group is higher than the recommended levels of Kohn (2007) (Table 01).
The highest mean MUN value is recorded in Group S consisting highest producing cows. High
levels of MUN are generally interpreted as an indication of inefficient utilization of protein,
which is economically unfavorable. However, high MUN values could be found in high
producing cows due to high protein provided with their rations. (Godden et al., 2001).
Feed formulation records of the farm did not indicated any higher deviations from the standard
NRC recommendations for dairy cattle feeding. Therefore, the higher mean MUN values
cannot be strictly interpreted along with inefficient utilization of protein. Hence, establishment
of MUN reference range for Sri Lankan dairy herds for evaluation of efficient dietary nutrient
utilization is an essential.
Proceedings of the Research Symposium of Uva Wellassa University, January 29-30, 2015
22
Table 01: Mean MUN values of different groups during the experimental period
Group Mean MUN SEM
(mg dL-1) Standard deviation Max (mg dL-1) Min (mg dL-1)
S 16.75 1.17 2.87 20.24 12.25
A 14.53 0.89 2.17 16.43 10.59
P1 14.77 1.23 3.01 17.72 11.04
P2 15.46 1.49 3.64 19.02 10.24 SEM- Standard Error of Mean
Conclusion
The mean MUN values of each milking cow group were higher than the recommended range
indicating the inefficient utilization of protein in the ration given to these groups. However,
the feed formulation records did not indicated higher deviations from the recommended
nutritional requirements of these animals. Therefore, further research is needed to make the
baseline levels of MUN to farms of Sri Lanka.
Acknowledgement
All the staff members of the Ambewela farm are gratefully acknowledged.
References
Broderick, G.A. and Clayton, M.K. (1997). A statistical evaluation of animal and nutritional
factors influencing concentrations of milk urea nitrogen, Journal of Dairy Science [e-journal]
8o(11).
Godden, S.M., Lissemore, K.D., Kelton, D.F., Leslie, K.E., Walton, J.S. and Lumsden, J.H.
(2001). Relationships between milk urea concentrations and nutritional management,
production, and economic variables in Ontario dairy herds, Journal of Dairy Science [e-
journal] 84(5).
Jonker, J.S., Kohn, R.A. and Erdman, R.A. (1999). Milk urea nitrogen target concentrations
for lactating dairy cows fed according to national research council recommendations, Journal
of Dairy Science [e-journal] 82(6).
Jonker, J.S., Kohn, R.A., High, J. (2002). Use of milk urea nitrogen to improve dairy cow
diets, Journal of Dairy Science [e-journal] 85(4).
Kohn, R. 2007. Use of milk or blood urea nitrogen to identify feed management inefficiencies
and estimate nitrogen excretion by dairy cattle and other animals. [pdf] Gainesville: Florida
Ruminant Nutrition Symposium. Available at:< http://dairy.ifas.ufl.edu/rns/2007/Kohn.pdf>
[Accessed 10 April 2014].
Malik, R. and Sirohi, S.K. (1998). Applied animal nutrition research techniques. Dairy cattle
Nutrition division, Dairy cattle Research Institute, KARNAL-132001. Haryana, India.
Proceedings of the Research Symposium of Uva Wellassa University, January 29-30, 2015
23
Comparison of broiler chick performance in single stage
incubation and multi stage incubation
H.W.P. Samarawickrama, R.M.H. Tharangani Faculty of Animal Science and Export Agriculture, Uva Wellassa University of Sri Lanka
and
G.A.S.N. Gamlath
Bairaha Farms PLC, Ellakkala, Pasyala, Sri Lanka
Introduction
Among livestock industries, poultry sector is widely spread throughout Sri Lanka. Chickens
raised for meat purpose are broilers. In current broiler market, the competition is high. To face
this competition, companies need to have strong production line with the companies. The main
input of the broiler industry is day old chicks. The commercial operations depend on the
hatcheries for the supplying of day old chicks. Hence, the hatchery should have considerable
capacity to produce required amount of chicks to fulfill the demand using artificial incubation.
Currently, the commercial markets have Single Stage (SS) and Multi Stage (MS) incubators.
According to the specialists in the industry, the SS machines are more effective and efficient
than the MS machine. To meet the competition successfully company need to establish an
efficient machine type in incubation procedure. Therefore, the primary objective of this
research is to compare the performance of broilers incubate in SS and MS incubators and to
investigate the effect of SS and MS incubation on chick quality.
Methodology
The hatching eggs were obtained from Cobb 500 female × Cobb 500 male broiler breeders at
54 and 64 week old age. The collected eggs were graded using egg grading machine. The eggs
weighing 63 g – 80 g were selected in present study. The setter trays were taken from top,
middle and bottom positions from both SS and MS machines. Setter trolleys were set in the
Petersime® SS setter machine and Petersime® MS setter machine. After 18 days, incubated
eggs were transferred to the hatcher baskets. At the transferring, the weight was measured and
recorded. Weight loss was calculated. The hatcher trolleys were placed in Petersime® hatcher
machines.
Chick pullout (hatch-out) was obtained at the 21 day of incubation. Live hatched chicks were
counted and recorded separately. Thirty newly hatched chicks were selected randomly from
the hatcher baskets. The hatch residuals were collected separately, stocks in egg trays and
tagged them for break out analysis. Death chicks were recorded separately. Chick weight was
measures separately in the replications by using weighing scale and recorded. Chick length
was measured using standard chick ruler and recorded in centimetres. Pasgar© scoring method
was done to analysis chick quality. Breakout analysis was done using hatch residuals. Then
chicks were sent through the chick grading and counting machine. Chicks were packed in
Proceedings of the Research Symposium of Uva Wellassa University, January 29-30, 2015
24
paper laid plastic chick boxes as 50 sets and 100 sets.
Chicks were vaccinated with IB, ND and IBD vaccines. Chick boxes were stock in chick room
separately as SS and MS. Then chicks were transported to the boiler farm. Chicks were
brooded at the closed housed using gas brooder. All chicks were given similar environmental
condition, same floor space, feed, and water. Brooding, feeding and watering were automated.
Weekly body weight gain, Feed conversion ratio (FCR) and weekly mortality data were
collected at the broiler farm level. At the farm level, data were collected from SS - close house
and MS - close house.
Results and Discussion
There was no significant difference between initial eggs set for the two machine types. The
eggs set for the SS were had 69.73± 4.26a g of weight and 69.59± 3.93a g of eggs were set for
the MS machine. Hence, there was no significant effect of machine type to the results obtained
throughout the experiment. Yet, there was a significant relationship between machine type
and weight loss. The highest weight loss was shown in eggs set in MS machine. Weight loss
in SS machine was 9.1± 3.7b and MS was 11.5± 3.5a. The results obtained for the weight losses
can be between 9 – 11% (Metzer, n.d.). The weight loss from SS and MS machines were lined
within 9 – 11%. There was a significant different between two means (P < 0.05) of the chick
weight. The MS incubated Day old chicks were shown a higher chick weight of 48.4± 3.5b g
than SS incubated chicks (Table 01).
According to a study, the chicks have divided in to three groups and they were 18.0 – 18.3 cm
as middle group, higher than 18.3 cm as large group and less than 18 cm as small group (Table
01). A positive correlation between chick Length and chick weight was observed at day zero
of age (Petek, et al., 2010). The SS incubated chicks have lower FCR with compared to the
MS incubated chicks in days 7 and days 14. There was a similar mortality percentage (1.3%)
in SS and MS incubated chicks in the first week and no mortality in the second week at the
brooding. Table 1 showed there was no significant difference between hatchability and
fertility.
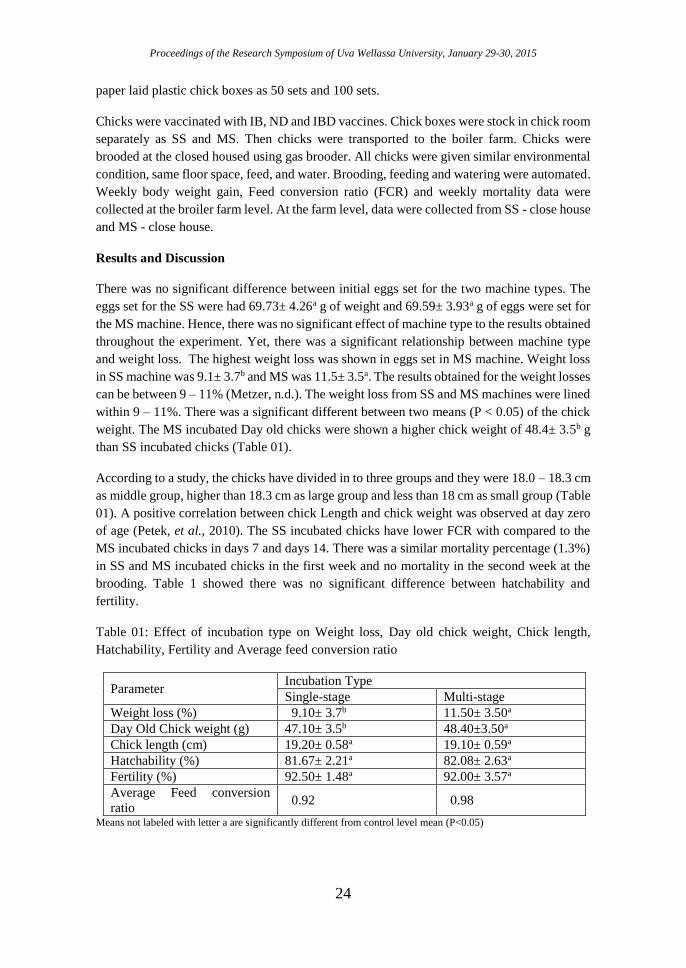
Table 01: Effect of incubation type on Weight loss, Day old chick weight, Chick length,
Hatchability, Fertility and Average feed conversion ratio
Parameter Incubation Type
Single-stage Multi-stage
Weight loss (%) 9.10± 3.7b 11.50± 3.50a
Day Old Chick weight (g) 47.10± 3.5b 48.40±3.50a
Chick length (cm) 19.20± 0.58a 19.10± 0.59a
Hatchability (%) 81.67± 2.21a 82.08± 2.63a
Fertility (%) 92.50± 1.48a 92.00± 3.57a
Average Feed conversion
ratio 0.92 0.98
Means not labeled with letter a are significantly different from control level mean (P<0.05)
Proceedings of the Research Symposium of Uva Wellassa University, January 29-30, 2015
25
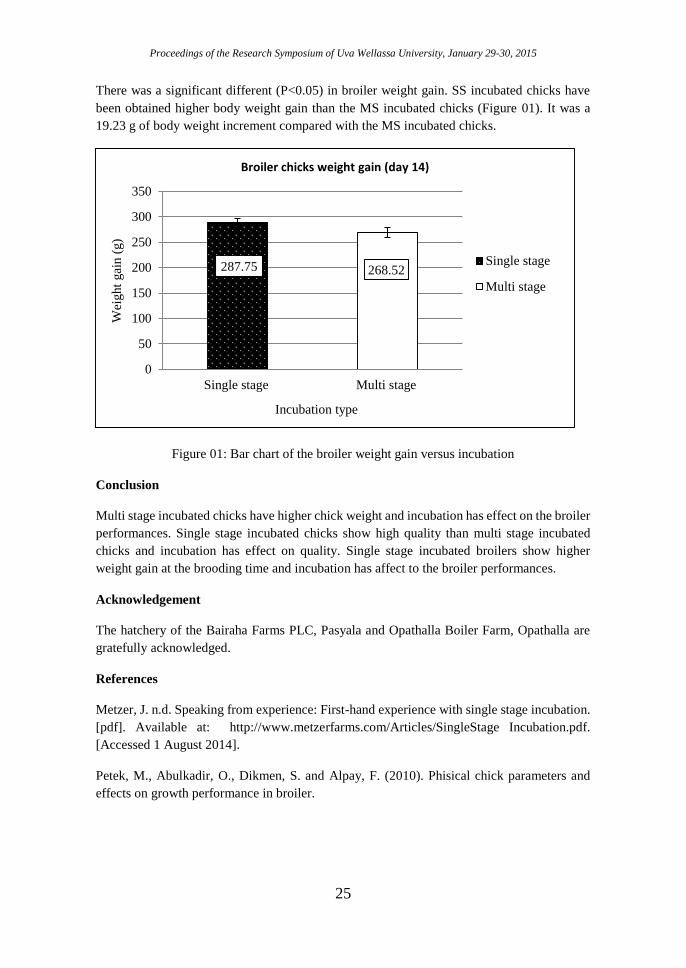
There was a significant different (P<0.05) in broiler weight gain. SS incubated chicks have
been obtained higher body weight gain than the MS incubated chicks (Figure 01). It was a
19.23 g of body weight increment compared with the MS incubated chicks.
Figure 01: Bar chart of the broiler weight gain versus incubation
Conclusion
Multi stage incubated chicks have higher chick weight and incubation has effect on the broiler
performances. Single stage incubated chicks show high quality than multi stage incubated
chicks and incubation has effect on quality. Single stage incubated broilers show higher
weight gain at the brooding time and incubation has affect to the broiler performances.
Acknowledgement
The hatchery of the Bairaha Farms PLC, Pasyala and Opathalla Boiler Farm, Opathalla are
gratefully acknowledged.
References
Metzer, J. n.d. Speaking from experience: First-hand experience with single stage incubation.
[pdf]. Available at: http://www.metzerfarms.com/Articles/SingleStage Incubation.pdf.
[Accessed 1 August 2014].
Petek, M., Abulkadir, O., Dikmen, S. and Alpay, F. (2010). Phisical chick parameters and
effects on growth performance in broiler.
287.75 268.52
0
50
100
150
200
250
300
350
Single stage Multi stage
Wei
ght
gai
n (
g)
Incubation type
Broiler chicks weight gain (day 14)
Single stage
Multi stage
Proceedings of the Research Symposium of Uva Wellassa University, January 29-30, 2015
26
Potential to use extracts from Lawsonia inermis
(Marathondhi) leaves and Emblica officinalis (Nelli) fruits as
tannin agents in leather manufacturing
S.M.D.S.C. Senaratne, A.M. Samaraweera
Faculty of Animal Science and Export Agriculture, Uva Wellassa University of Sri Lanka
and
A.W. Wickramasingha
Ceylon Leather Products,115/1,Kelaniganga Mill Rd, Colombo 15.
Introduction
In Sri Lanka mainly mimosa bark powder and chesnut powder are used to produce vegetable
tanned leather. However, these tannin agents can produce limited number of colors and are
imported to Sri Lanka with high import cost. As a result, final vegetable tanned leather
products become high in price. Thus, it is necessary to find out locally available, low cost
tannin agents to produce vegetable tanned leathers. Emblica officinalis (Nelli) fruits and
Lawsonia inermis (Marathondi) leaves are two such locally available tannin agents with
considerably high tannin content (nelli fruits-18-35 % (Pushpakumara and Heenkenda, 2012)
and Marathondi leaves- 11.12% (Musa, 2012). Therefore, the objective of the present study
was to assess the quality of leather prepared using locally available tanning agents,
Marathondhi leaves and Nelli fruit extracts.
Methodology
3.6 kg of marathondi leaves and 1.2 kg of nelli fruits were first crushed and ground separately.
Then it was mixed with 3 L of water and was filtered into separate containers. Same tannin
concentration (5 backometer value) was maintained in all containers. Further, a mimosa
solution with same concentration was prepared as the control.
Then, the buffalo hides were, soaked, dehaired and delimed and partial pickling was also done
prior to the tanning according to the leather manufacturing procedure of Ceylon Leather
Products PLC. Then, nine hide pieces with 6 x 7 inch was selected from same area of these
buffalo hides. Weight and thicknesses of each piece was measured and recorded. After that,
solutions were added into separate containers and three pieces of hide were dipped in each
container.
After hides were dipped, concentration of each solution was increased by 5 backo every four
days up to four weeks. Tannin penetration was also measured until it obtains 3 mm. After
finishing process, physical parameters, mean penetration rate (mm/day), thickness, mean yield
of the leather (%) and mean tensile strength was measured in all treatments and was compared
with control. Completely Randomized Design (CRD) was used to allocate treatments and data
Proceedings of the Research Symposium of Uva Wellassa University, January 29-30, 2015
27
analysis was done using Minitab 15 software. Analysis of Variance (ANOVA) was used for
comparison of data at (significance level of 95%) and. Dunnet’s procedure was used for mean
separation. Sensory evaluation was conducted to select the best tannin agent based on the
appearance, hardness, fullness and overall acceptability of finished leather using 10 trained
panelists and results of the sensory evaluation after analysis by Friedman test.
Result and Discussion
During tanning of hides Nelli tannin media was seen as light cream color whereas control
(Mimosa) and Marathondi media were darker in color. Though, Nelli and Mimosa media had
pleasant smell, Marathondi had an unpleasant smell. Nelli was more acidic (pH 3.2) and pH
values of Mimosa and Marathondi were pH- 4.6 and pH 4.3, respectively. After the tannin
process, loose grain was observed on the Nelli treated hides. Mean penetration rate, yield,
thickness reduction and tensile strength were measured as physical parameters (Table 01).
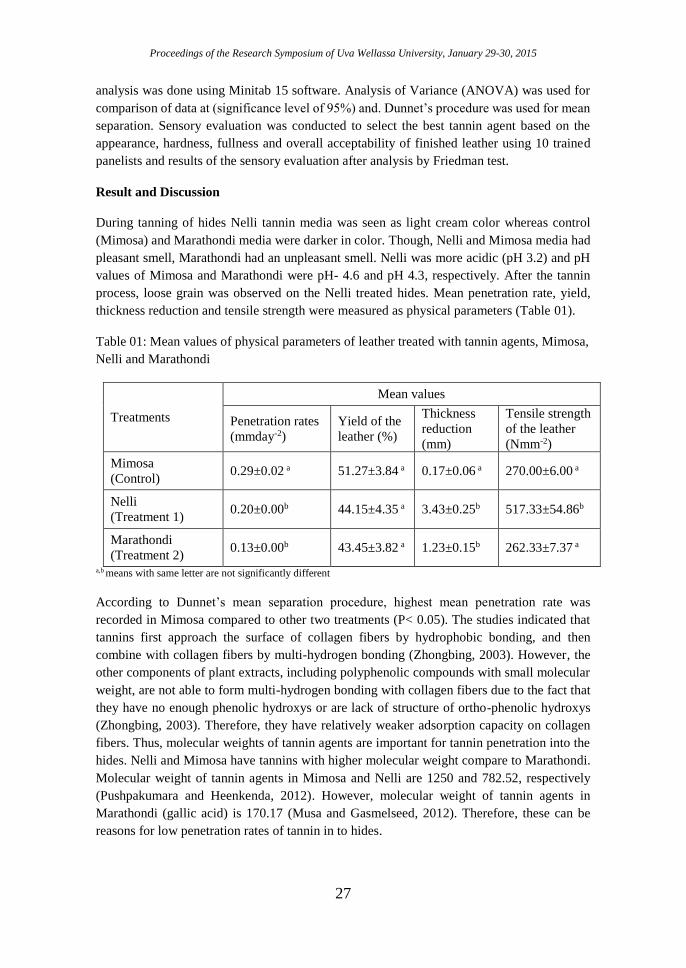
Table 01: Mean values of physical parameters of leather treated with tannin agents, Mimosa,
Nelli and Marathondi
Treatments
Mean values
Penetration rates
(mmday-2)
Yield of the
leather (%)
Thickness
reduction
(mm)
Tensile strength
of the leather
(Nmm-2)
Mimosa
(Control) 0.29±0.02 a 51.27±3.84 a 0.17±0.06 a 270.00±6.00 a
Nelli
(Treatment 1) 0.20±0.00b 44.15±4.35 a 3.43±0.25b 517.33±54.86b
Marathondi
(Treatment 2) 0.13±0.00b 43.45±3.82 a 1.23±0.15b 262.33±7.37 a
a,b means with same letter are not significantly different
According to Dunnet’s mean separation procedure, highest mean penetration rate was
recorded in Mimosa compared to other two treatments (P< 0.05). The studies indicated that
tannins first approach the surface of collagen fibers by hydrophobic bonding, and then
combine with collagen fibers by multi-hydrogen bonding (Zhongbing, 2003). However, the
other components of plant extracts, including polyphenolic compounds with small molecular
weight, are not able to form multi-hydrogen bonding with collagen fibers due to the fact that
they have no enough phenolic hydroxys or are lack of structure of ortho-phenolic hydroxys
(Zhongbing, 2003). Therefore, they have relatively weaker adsorption capacity on collagen
fibers. Thus, molecular weights of tannin agents are important for tannin penetration into the
hides. Nelli and Mimosa have tannins with higher molecular weight compare to Marathondi.
Molecular weight of tannin agents in Mimosa and Nelli are 1250 and 782.52, respectively
(Pushpakumara and Heenkenda, 2012). However, molecular weight of tannin agents in
Marathondi (gallic acid) is 170.17 (Musa and Gasmelseed, 2012). Therefore, these can be
reasons for low penetration rates of tannin in to hides.
Proceedings of the Research Symposium of Uva Wellassa University, January 29-30, 2015
28
Yield of the vegetable tanned leathers is important since it determines the price of the leather.
However, there is no any significant difference (P>0.05) between mean yields of the leather.
Thickness of the hide needs to be lowered after drying. Lowest mean thickness reduction was
observed in Mimosa (P< 0.05).
Highest mean tensile strength was observed in Nelli followed by Mimosa and Marathondi.
According to these results, mean tensile strength of Nelli is significantly different (P<0.05)
from other two treatments. Nelli contains hydrolysable tannins whereas Mimosa and
Marathondi mainly contain condensed tannins (Pushpakumara and Henkenda, 2012). Since,
hydrolysable tannin agents give more strength to leather compare to condense tannin type of
tannin agent present in Nelli can be the main reason for the results obtained.
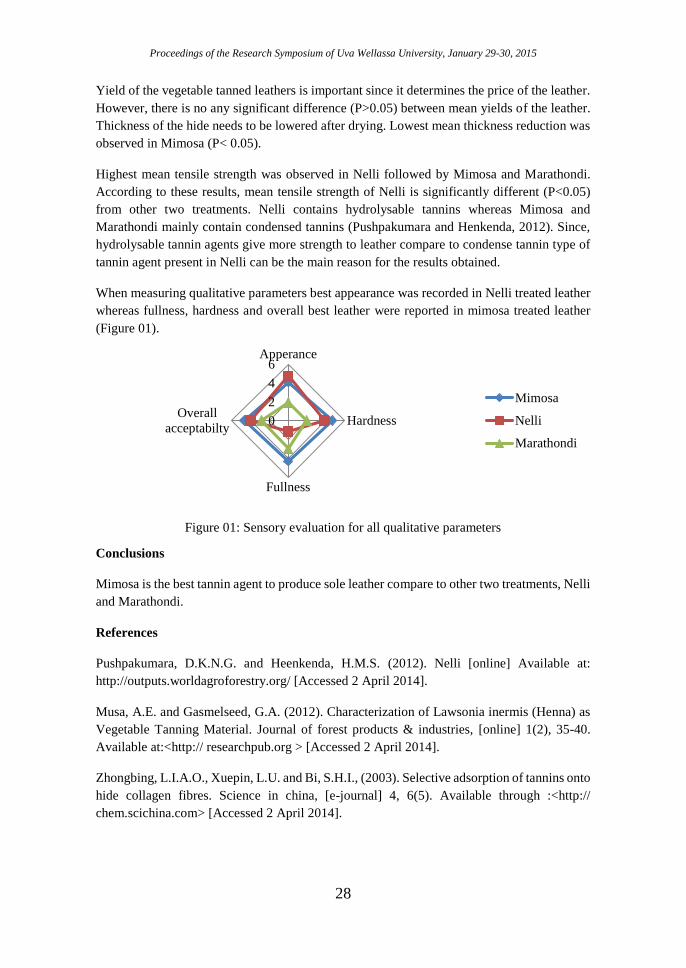
When measuring qualitative parameters best appearance was recorded in Nelli treated leather
whereas fullness, hardness and overall best leather were reported in mimosa treated leather
(Figure 01).
Figure 01: Sensory evaluation for all qualitative parameters
Conclusions
Mimosa is the best tannin agent to produce sole leather compare to other two treatments, Nelli
and Marathondi.
References
Pushpakumara, D.K.N.G. and Heenkenda, H.M.S. (2012). Nelli [online] Available at:
http://outputs.worldagroforestry.org/ [Accessed 2 April 2014].
Musa, A.E. and Gasmelseed, G.A. (2012). Characterization of Lawsonia inermis (Henna) as
Vegetable Tanning Material. Journal of forest products & industries, [online] 1(2), 35-40.
Available at:<http:// researchpub.org > [Accessed 2 April 2014].
Zhongbing, L.I.A.O., Xuepin, L.U. and Bi, S.H.I., (2003). Selective adsorption of tannins onto
hide collagen fibres. Science in china, [e-journal] 4, 6(5). Available through :<http://
chem.scichina.com> [Accessed 2 April 2014].
0
2
4
6Apperance
Hardness
Fullness
Overall
acceptabilty
Mimosa
Nelli
Marathondi
Proceedings of the Research Symposium of Uva Wellassa University, January 29-30, 2015
29
Performance evaluation of different broiler strains under
environmental controlled broiler house in Sri Lanka
S. Abiramy, R.M.H. Tharangani
Faculty of Animal Science and Export Agriculture, Uva Wellassa University of Sri Lanka
and
S. Chandana
CIC poultry farms PLC, Molahena Estate, Alugola, Sri Lanka
Introduction
Broilers are bred and rose specifically for meat production. Hubbard breed is mainly used to
produce meat in large scale farms. They are imported from Europe. CIC farm is one of the
large scale farms in Sri Lanka and they are rearing two different strains; Hubbard Flex and F
15 under environmental controlled broiler house system. The aim of this study is to compare
and find the best strain in assessment of body weight, growth rate, mortality and feed
conversion ratio between Hubbard Flex and F 15.
Methodology
The experiment was conducted in closed house at C.I.C. poultry farms (Pvt.) during 2nd May
to 14th June 2014. Five hundred day old broiler chicks (Hubbard Flex and F 15) from hatchery
were used in the total experiment. Each (250 Flex + 250 F 15) were considered as two
treatments. Each treatment was divided into 5 subgroups as replicates as fifty birds per each.
Separation was made without including automated feeder line by using plastic boxes.
Before placing, initial weight of the premium category birds were recorded and then adequate
amount of feed was given separately. According to the space requirement feeders and waters
were used to each separation. Unlimited feeding was done throughout the study period (42
days). All the birds were vaccinated through drinking water against Newcastle disease and
Gumboro disease. Same conditions and feed were maintained for each group.
Group feed intake, Average body weight were measured daily until slaughtered at 42nd day.
Average weight gain and Feed Conversion Ratio (FCR) of bird was calculated during period
of growing birds. Mortality, if any, during the rearing period was recorded. Feed intake was
calculated as the difference between the amount of feed supplied and the amount of feed that
remained at the end of each feeding period. Feed conversion (feed: gain ratio) was calculated
as the ratio between feed intake and body weight gain every day. The experimental data were
processed and analyzed using Microsoft Office Excel (2007) and Minitab16 software.
Performances of two groups were compared using two sample t tests. Mean comparison was
used to find the best strain in performance.
Result and Discussion
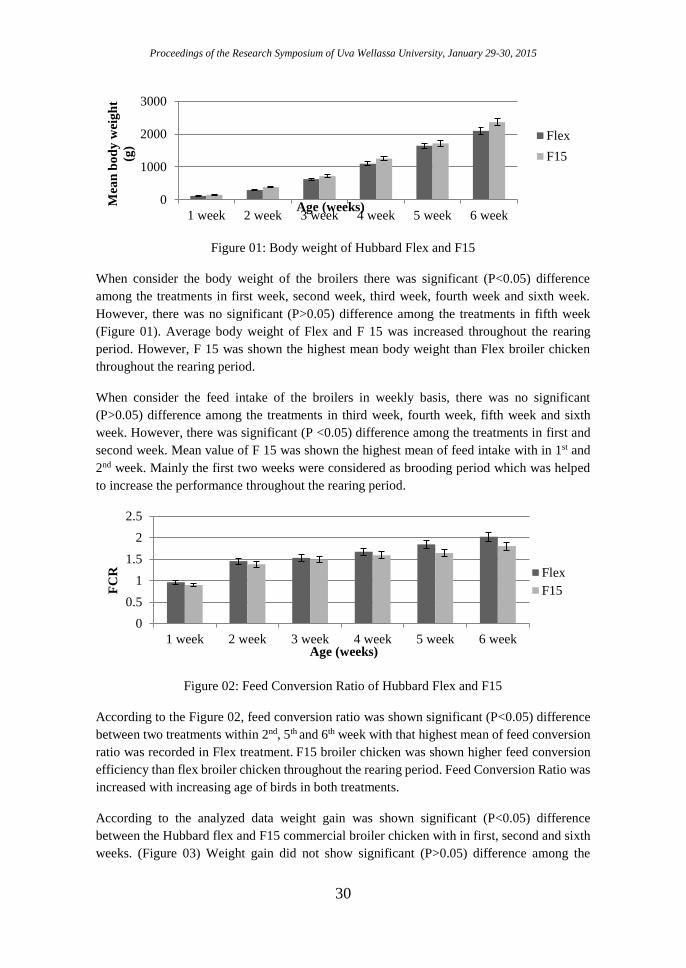
Proceedings of the Research Symposium of Uva Wellassa University, January 29-30, 2015
30
Figure 01: Body weight of Hubbard Flex and F15
When consider the body weight of the broilers there was significant (P<0.05) difference
among the treatments in first week, second week, third week, fourth week and sixth week.
However, there was no significant (P>0.05) difference among the treatments in fifth week
(Figure 01). Average body weight of Flex and F 15 was increased throughout the rearing
period. However, F 15 was shown the highest mean body weight than Flex broiler chicken
throughout the rearing period.
When consider the feed intake of the broilers in weekly basis, there was no significant
(P>0.05) difference among the treatments in third week, fourth week, fifth week and sixth
week. However, there was significant (P <0.05) difference among the treatments in first and
second week. Mean value of F 15 was shown the highest mean of feed intake with in 1st and
2nd week. Mainly the first two weeks were considered as brooding period which was helped
to increase the performance throughout the rearing period.
Figure 02: Feed Conversion Ratio of Hubbard Flex and F15
According to the Figure 02, feed conversion ratio was shown significant (P<0.05) difference
between two treatments within 2nd, 5th and 6th week with that highest mean of feed conversion
ratio was recorded in Flex treatment. F15 broiler chicken was shown higher feed conversion
efficiency than flex broiler chicken throughout the rearing period. Feed Conversion Ratio was
increased with increasing age of birds in both treatments.
According to the analyzed data weight gain was shown significant (P<0.05) difference
between the Hubbard flex and F15 commercial broiler chicken with in first, second and sixth
weeks. (Figure 03) Weight gain did not show significant (P>0.05) difference among the
0
1000
2000
3000
1 week 2 week 3 week 4 week 5 week 6 week
Mea
n b
od
y w
eig
ht
(g)
Age (weeks)
Flex
F15
0
0.5
1
1.5
2
2.5
1 week 2 week 3 week 4 week 5 week 6 week
FC
R
Age (weeks)
Flex
F15
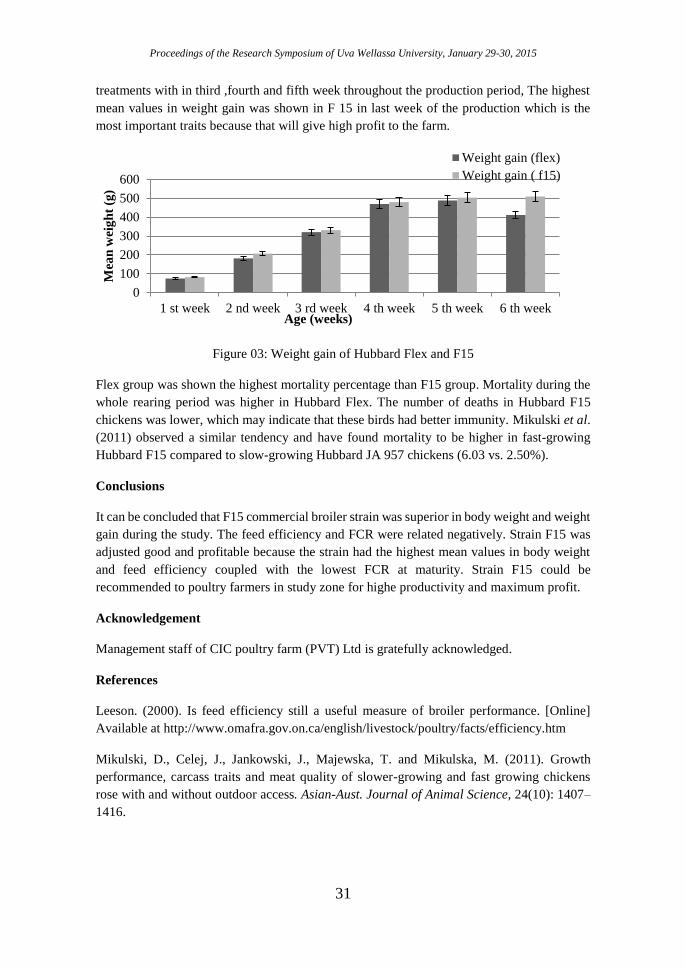
Proceedings of the Research Symposium of Uva Wellassa University, January 29-30, 2015
31
treatments with in third ,fourth and fifth week throughout the production period, The highest
mean values in weight gain was shown in F 15 in last week of the production which is the
most important traits because that will give high profit to the farm.
Figure 03: Weight gain of Hubbard Flex and F15
Flex group was shown the highest mortality percentage than F15 group. Mortality during the
whole rearing period was higher in Hubbard Flex. The number of deaths in Hubbard F15
chickens was lower, which may indicate that these birds had better immunity. Mikulski et al.
(2011) observed a similar tendency and have found mortality to be higher in fast-growing
Hubbard F15 compared to slow-growing Hubbard JA 957 chickens (6.03 vs. 2.50%).
Conclusions
It can be concluded that F15 commercial broiler strain was superior in body weight and weight
gain during the study. The feed efficiency and FCR were related negatively. Strain F15 was
adjusted good and profitable because the strain had the highest mean values in body weight
and feed efficiency coupled with the lowest FCR at maturity. Strain F15 could be
recommended to poultry farmers in study zone for highe productivity and maximum profit.
Acknowledgement
Management staff of CIC poultry farm (PVT) Ltd is gratefully acknowledged.
References
Leeson. (2000). Is feed efficiency still a useful measure of broiler performance. [Online]
Available at http://www.omafra.gov.on.ca/english/livestock/poultry/facts/efficiency.htm
Mikulski, D., Celej, J., Jankowski, J., Majewska, T. and Mikulska, M. (2011). Growth
performance, carcass traits and meat quality of slower-growing and fast growing chickens
rose with and without outdoor access. Asian-Aust. Journal of Animal Science, 24(10): 1407–
1416.
0
100
200
300
400
500
600
1 st week 2 nd week 3 rd week 4 th week 5 th week 6 th week
Mea
n w
eig
ht
(g)
Age (weeks)
Weight gain (flex)
Weight gain ( f15)
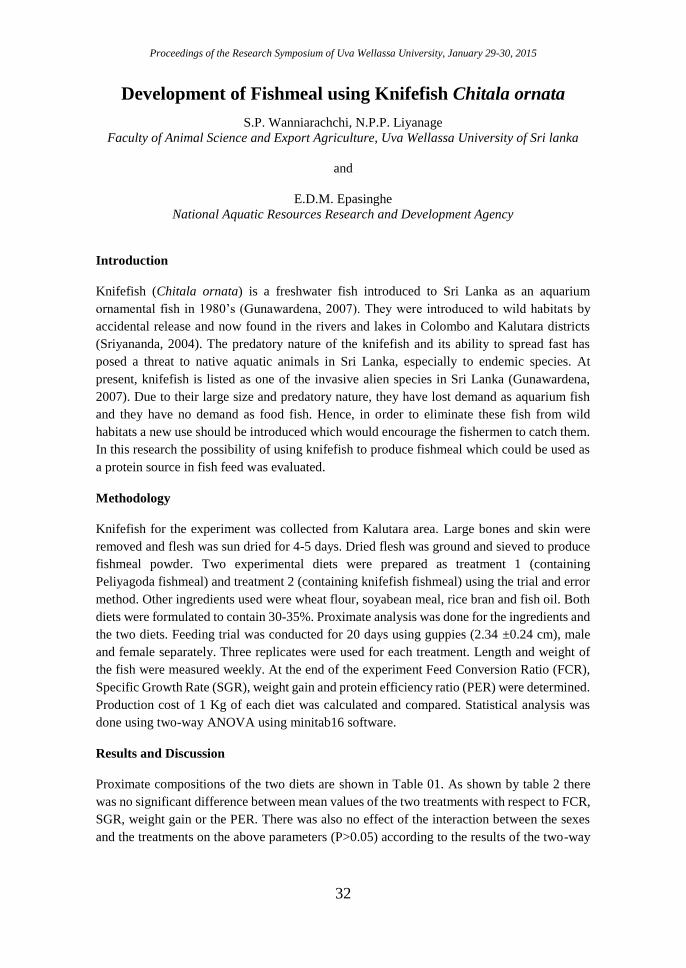
Proceedings of the Research Symposium of Uva Wellassa University, January 29-30, 2015
32
Development of Fishmeal using Knifefish Chitala ornata
S.P. Wanniarachchi, N.P.P. Liyanage
Faculty of Animal Science and Export Agriculture, Uva Wellassa University of Sri lanka
and
E.D.M. Epasinghe
National Aquatic Resources Research and Development Agency
Introduction
Knifefish (Chitala ornata) is a freshwater fish introduced to Sri Lanka as an aquarium
ornamental fish in 1980’s (Gunawardena, 2007). They were introduced to wild habitats by
accidental release and now found in the rivers and lakes in Colombo and Kalutara districts
(Sriyananda, 2004). The predatory nature of the knifefish and its ability to spread fast has
posed a threat to native aquatic animals in Sri Lanka, especially to endemic species. At
present, knifefish is listed as one of the invasive alien species in Sri Lanka (Gunawardena,
2007). Due to their large size and predatory nature, they have lost demand as aquarium fish
and they have no demand as food fish. Hence, in order to eliminate these fish from wild
habitats a new use should be introduced which would encourage the fishermen to catch them.
In this research the possibility of using knifefish to produce fishmeal which could be used as
a protein source in fish feed was evaluated.
Methodology
Knifefish for the experiment was collected from Kalutara area. Large bones and skin were
removed and flesh was sun dried for 4-5 days. Dried flesh was ground and sieved to produce
fishmeal powder. Two experimental diets were prepared as treatment 1 (containing
Peliyagoda fishmeal) and treatment 2 (containing knifefish fishmeal) using the trial and error
method. Other ingredients used were wheat flour, soyabean meal, rice bran and fish oil. Both
diets were formulated to contain 30-35%. Proximate analysis was done for the ingredients and
the two diets. Feeding trial was conducted for 20 days using guppies (2.34 ±0.24 cm), male
and female separately. Three replicates were used for each treatment. Length and weight of
the fish were measured weekly. At the end of the experiment Feed Conversion Ratio (FCR),
Specific Growth Rate (SGR), weight gain and protein efficiency ratio (PER) were determined.
Production cost of 1 Kg of each diet was calculated and compared. Statistical analysis was
done using two-way ANOVA using minitab16 software.
Results and Discussion
Proximate compositions of the two diets are shown in Table 01. As shown by table 2 there
was no significant difference between mean values of the two treatments with respect to FCR,
SGR, weight gain or the PER. There was also no effect of the interaction between the sexes
and the treatments on the above parameters (P>0.05) according to the results of the two-way
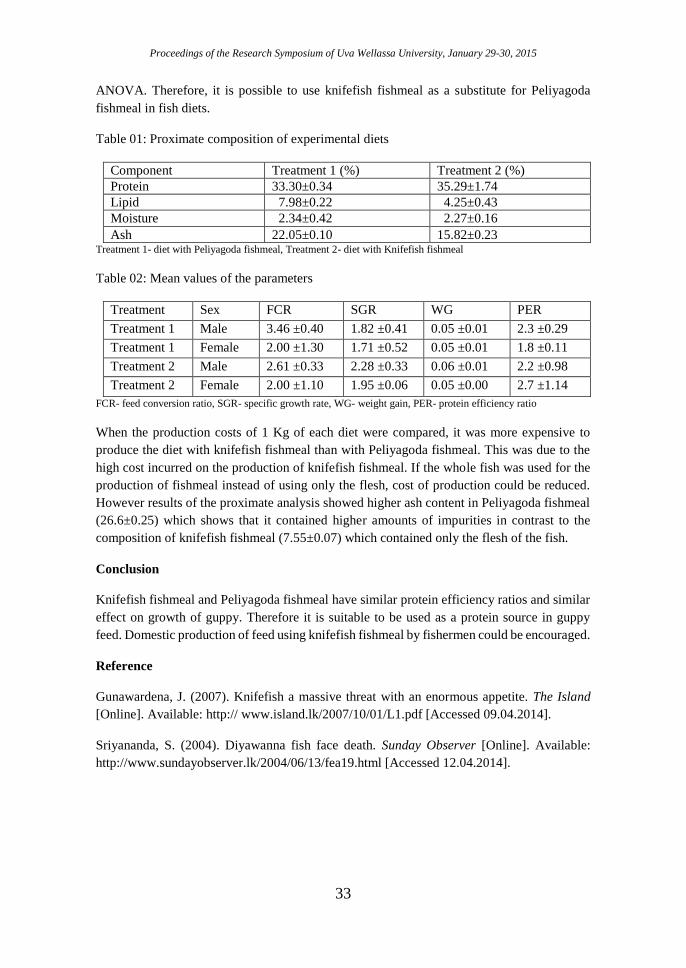
Proceedings of the Research Symposium of Uva Wellassa University, January 29-30, 2015
33
ANOVA. Therefore, it is possible to use knifefish fishmeal as a substitute for Peliyagoda
fishmeal in fish diets.
Table 01: Proximate composition of experimental diets
Component Treatment 1 (%) Treatment 2 (%)
Protein 33.30±0.34 35.29±1.74
Lipid 7.98±0.22 4.25±0.43
Moisture 2.34±0.42 2.27±0.16
Ash 22.05±0.10 15.82±0.23 Treatment 1- diet with Peliyagoda fishmeal, Treatment 2- diet with Knifefish fishmeal
Table 02: Mean values of the parameters
Treatment Sex FCR SGR WG PER
Treatment 1 Male 3.46 ±0.40 1.82 ±0.41 0.05 ±0.01 2.3 ±0.29
Treatment 1 Female 2.00 ±1.30 1.71 ±0.52 0.05 ±0.01 1.8 ±0.11
Treatment 2 Male 2.61 ±0.33 2.28 ±0.33 0.06 ±0.01 2.2 ±0.98
Treatment 2 Female 2.00 ±1.10 1.95 ±0.06 0.05 ±0.00 2.7 ±1.14
FCR- feed conversion ratio, SGR- specific growth rate, WG- weight gain, PER- protein efficiency ratio
When the production costs of 1 Kg of each diet were compared, it was more expensive to
produce the diet with knifefish fishmeal than with Peliyagoda fishmeal. This was due to the
high cost incurred on the production of knifefish fishmeal. If the whole fish was used for the
production of fishmeal instead of using only the flesh, cost of production could be reduced.
However results of the proximate analysis showed higher ash content in Peliyagoda fishmeal
(26.6±0.25) which shows that it contained higher amounts of impurities in contrast to the
composition of knifefish fishmeal (7.55±0.07) which contained only the flesh of the fish.
Conclusion
Knifefish fishmeal and Peliyagoda fishmeal have similar protein efficiency ratios and similar
effect on growth of guppy. Therefore it is suitable to be used as a protein source in guppy
feed. Domestic production of feed using knifefish fishmeal by fishermen could be encouraged.
Reference
Gunawardena, J. (2007). Knifefish a massive threat with an enormous appetite. The Island
[Online]. Available: http:// www.island.lk/2007/10/01/L1.pdf [Accessed 09.04.2014].
Sriyananda, S. (2004). Diyawanna fish face death. Sunday Observer [Online]. Available:
http://www.sundayobserver.lk/2004/06/13/fea19.html [Accessed 12.04.2014].
Proceedings of the Research Symposium of Uva Wellassa University, January 29-30, 2015
34
A study on microbial contaminations, sources and preventive
measures in salted butter production in a commercial dairy plant
T.D.G. Wickramanayaka, E.D.N.S. Abeyrathne
Faculty of Animal Science and Export Agriculture, Uva Wellassa University of Sri Lanka
Introduction
Dairy fat spreads are milk products relatively rich in fat in the form of a spreadable emulsion
principally of the type of water-in-milk fat that remains in solid phase at a temperature of 20
°C (Codex Standard for Dairy Fat Spreads, 2006). There are two kinds of butter as sweet
cream and ripened-cream. Sweet cream butter may or may not contain salt (Fernandes, 2008).
To overcome the high demand of butter, a reputed dairy company in Sri Lanka engages in
manufacturing salted butter. However, finish product frequently contain high microbial load
before releasing to the packing which leads to quick rancidity. Consequently, it has become a
problem to the company to obtain a profit. Therefore, this research was carried out to assess
microbiological quality at different production steps to determine the sources of microbial
contamination in salted butter production.
Methodology
A preliminary study was carried out to identify possible sample collection points including
swab sampling points during production process. Samples were collected from raw cream,
before and after pasteurization, after aging, during churning, final product, and wash water of
butter granules and the churner. Swab samples were collected from cream and aging vats,
hands of permanent workers (randomly), and inside and outside of the churner. Time and
temperature during storage of cream in the cream vat, pasteurization and aging were recorded.
Sample collection procedure was repeated for every batch up to identification of the
contamination points. Quality of samples was evaluated by performing microbiological tests
(total colony count, Coliform and fecal Coliform). According to the test results, contamination
points were identified and microbiological (E. coli, yeast, and moulds), chemical (free fatty
acid level of the final products) and physical (foreign matter observed from naked eye)
properties were further analyzed. Entire tests were conducted in triplicate according to the
analytical testing procedure of company. Data were finally analyzed by mean value
comparison using Microsoft Excel 2013. Further, analyzed data were compared with the
standards (SLS 279:1988).
Results and Discussion
According to the preliminary analysis, raw cream was stored for 4-5 hours at 7-8 °C in a cream
vat. Mean total colony count in raw cream of seven batches was ranged from 110×106 to
127×106 cfu/g and Coliform and fecal Coliform bacteria were detected in all samples tested.
After pasteurization (95 °C, 20 minutes), mean total colony count of all samples were lower
than 104 cfu ⁄g and after aging (5-7 °C, 12 hours) (Table 01). Coliform and fecal Coliform
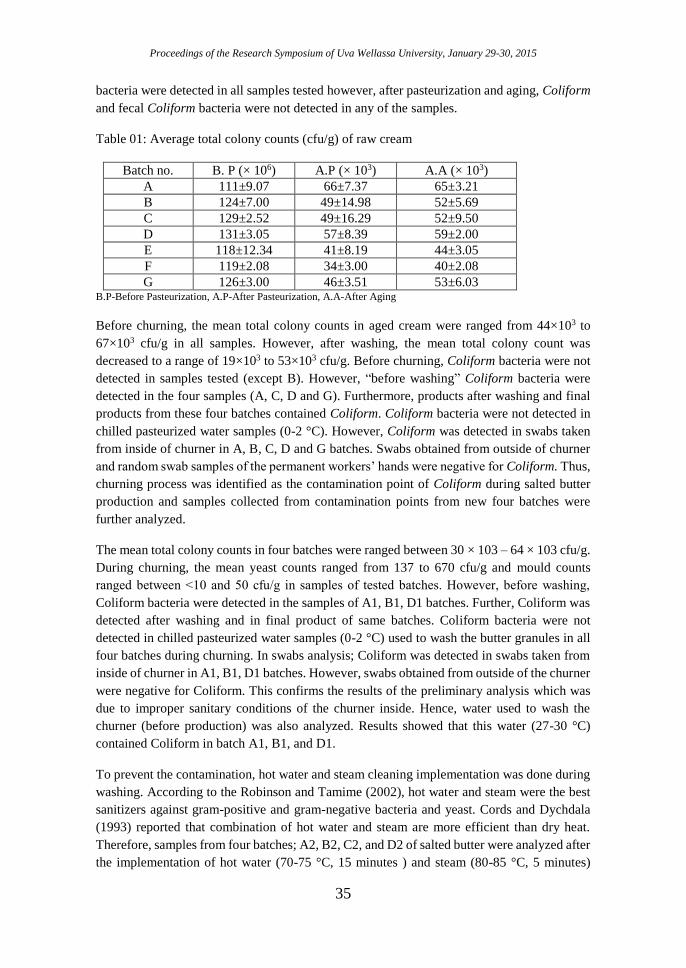
Proceedings of the Research Symposium of Uva Wellassa University, January 29-30, 2015
35
bacteria were detected in all samples tested however, after pasteurization and aging, Coliform
and fecal Coliform bacteria were not detected in any of the samples.
Table 01: Average total colony counts (cfu/g) of raw cream
Batch no. B. P (× 106) A.P (× 103) A.A (× 103)
A 111±9.07 66±7.37 65±3.21
B 124±7.00 49±14.98 52±5.69
C 129±2.52 49±16.29 52±9.50
D 131±3.05 57±8.39 59±2.00
E 118±12.34 41±8.19 44±3.05
F 119±2.08 34±3.00 40±2.08
G 126±3.00 46±3.51 53±6.03 B.P-Before Pasteurization, A.P-After Pasteurization, A.A-After Aging
Before churning, the mean total colony counts in aged cream were ranged from 44×103 to
67×103 cfu/g in all samples. However, after washing, the mean total colony count was
decreased to a range of 19×103 to 53×103 cfu/g. Before churning, Coliform bacteria were not
detected in samples tested (except B). However, “before washing” Coliform bacteria were
detected in the four samples (A, C, D and G). Furthermore, products after washing and final
products from these four batches contained Coliform. Coliform bacteria were not detected in
chilled pasteurized water samples (0-2 °C). However, Coliform was detected in swabs taken
from inside of churner in A, B, C, D and G batches. Swabs obtained from outside of churner
and random swab samples of the permanent workers’ hands were negative for Coliform. Thus,
churning process was identified as the contamination point of Coliform during salted butter
production and samples collected from contamination points from new four batches were
further analyzed.
The mean total colony counts in four batches were ranged between 30 × 103 – 64 × 103 cfu/g.
During churning, the mean yeast counts ranged from 137 to 670 cfu/g and mould counts
ranged between ˂10 and 50 cfu/g in samples of tested batches. However, before washing,
Coliform bacteria were detected in the samples of A1, B1, D1 batches. Further, Coliform was
detected after washing and in final product of same batches. Coliform bacteria were not
detected in chilled pasteurized water samples (0-2 °C) used to wash the butter granules in all
four batches during churning. In swabs analysis; Coliform was detected in swabs taken from
inside of churner in A1, B1, D1 batches. However, swabs obtained from outside of the churner
were negative for Coliform. This confirms the results of the preliminary analysis which was
due to improper sanitary conditions of the churner inside. Hence, water used to wash the
churner (before production) was also analyzed. Results showed that this water (27-30 °C)
contained Coliform in batch A1, B1, and D1.
To prevent the contamination, hot water and steam cleaning implementation was done during
washing. According to the Robinson and Tamime (2002), hot water and steam were the best
sanitizers against gram-positive and gram-negative bacteria and yeast. Cords and Dychdala
(1993) reported that combination of hot water and steam are more efficient than dry heat.
Therefore, samples from four batches; A2, B2, C2, and D2 of salted butter were analyzed after
the implementation of hot water (70-75 °C, 15 minutes ) and steam (80-85 °C, 5 minutes)
Proceedings of the Research Symposium of Uva Wellassa University, January 29-30, 2015
36
cleaning. Further, samples from six batches; A3, B3, C3, D3, E3, and F3 of salted butter were
analyzed after implementation of hot water and steam treatment as above. In wash water
analysis; Coliform bacteria was not detected in both samples. In swabs analysis; Coliform
bacteria was not detected in swabs taken from the inside and outside of churner. With the
increasing water temperature, the mean total colony count was reduced in both tested batches.
Yeast and moulds counts were within the standard level except B2. After implementation of
hot water and steam treatments, samples of tested batches were within the standard level.
Coliform were not detected in all samples tested. White (1996) stated that, Coliforms were
destroyed by pasteurization therefore according to the analysis; product had not been
contaminated after pasteurization, due to implementation of hot water and steam.
In chemical analysis; before implementation of the hot water and steam, the mean free fatty
acid level of the final products were ranged between 0.22 and 0.52 and only one batch was
within the standard level among the tested batches. After implementation of hot water (70-75
°C) and steam, it was ranged between 0.29 and 0.40 and after implementation of 75-80 °C hot
water and steam; it was ranged between 0.24 and 0.30. Accordingly eight batches (among ten
batches) were within the standard level. Moreover, with the temperature increment of the wash
water, free fatty acid level of the final product was lower than the previous. Furthermore, no
physical contaminants were observed in all tested batches.
Conclusion
Water used to wash churner was the main contamination source of Coliform in salted butter
production. Microbiological and chemical quality of salted butter can be improved by using
hot water (75-80 °C, 15 minutes) and steam (80-85 °C, 5 minutes) for cleaning the churner.
References
Codex Standards 253 (2006). Codex Standard for Dairy Fat Spreads. Codex Standards
Institution, Rome.
Cords, B.R., Dychdala, G.R. and Richter, F.L. (2001). Cleaning and Sanitizing in Milk
Production and Processing, in Marth, E. H., Steele, J. L. (ed.) Applied Dairy Microbiology.
New York: Marcel Dekker, pp. 127–150.
Fernandes, R. (2008). Butter and dairy spreads, in Fernandes, R. (ed.) Microbiology
Handbook Dairy Products. Surrey: Leatherhead Publishing, pp. 49-57.
Robinson, R.K., and Tamime, A.Y. (2002). Maintaining A Clean Working Environment, in
Robinson, R.K. (ed.) Dairy Microbiology.Vol 2. London: Elsevier, pp. 561-586.
Sri Lanka Standards 279 (1988). Butter. Sri Lanka Standards Institution, Colombo.
White, C.H. (1996). Microbiological testing in the dairy industry, Food Testing Anal 2(Aug–
Sept), 22.
Proceedings of the Research Symposium of Uva Wellassa University, January 29-30, 2015
37
A Study on Crocodile Behavior (Crocodylus palustris) and
Public Value Orientation in Ethimale of Monaragala District
W.G.R.I. Wijethilaka, A.M. Samaraweera, A.M.N.L. Abesinghe
Faculty of Animal Science and Export Agriculture, Uva Wellassa University of Sri Lanka
Introduction
Mugger crocodile (Crocodylus palustris) is principally restricted to Indian subcontinent and
the highest number is recorded in Sri Lanka (Da Silva and Lenin, 2010). Crocodylus palustris
is categorized as a vulnerable species in IUCN red list (2011). Furthermore, due to destruction
of their natural habitats, illegal hunting, fishing activities and crocodile attacks during sand
mining, bathing and washing, there is an emergence of this interaction as a human-crocodile
conflict. Though the existence of considerable number of C. palustris is recorded in Uva less
literature is available on their status in Uva Province of Sri Lanka. Therefore, this study was
conducted to understand people’s attitudes, risks, believes and practices towards human
crocodile conflict and to study the behavior of crocodile in Ethimale area.
Methodology
The study was conducted in villages surrounding eight perennial and seasonal tanks (Doser
tank, Wattarama tank, Kotiyagala tank, Heekaduwa tank 1 and 2, Karadandara tank,
Karakolagaswewa tank and Vila oya) at Ethimale of Monaragala district from May to August
2014. Ninety four individuals were interviewed using a pre-tested structured questionnaire
including farmers, fishermen and villagers to determine their awareness, knowledge,
practices, believes and attitudes regarding C. palustris. The information on purpose, frequency
and duration of water body usage by the villages, crocodile population, their approximate
size, migration and their availability throughout the year in the area was gathered through the
questionnaire. Moreover, the practices of the people and attitudes regarding crocodiles were
identified by gathering information on crocodile attacks, financial damages, people’s reaction
when seen crocodiles, offending actions, benefits/uses of crocodiles and threats face by
crocodiles. Presence of fecal pellets, footprints, smashed vegetation and cleared basking areas
were observed to study the migration and basking behavior. Data analysis was carried out by
Microsoft Excel and map was created using ArcGIS software including crocodile migration
paths.
Results and Discussion
Awareness of the people
The main water sources of Ethimale were tanks and Vila oya. Therefore, around 97% of the
respondents used tanks for their needs daily. Moreover, most of households are by or close to
the tanks which explains their close relation with the crocodiles.
Knowledge of the people regarding crocodiles
Proceedings of the Research Symposium of Uva Wellassa University, January 29-30, 2015
38
Sixty eight percent of the respondents considered that crocodiles were useful and 32% of
respondents believed that crocodiles were not useful or did not know the ecological roles
played by the crocodiles. According to them, consumption of crocodile meat and egg are the
major uses. Around 53% of the respondents have eaten crocodile meat while 5.3% have
consumed crocodile eggs. Though few had heard the uses of crocodile hide they have not done
any hide processing.
Though the respondents have seen crocodiles throughout the day, crocodiles were common
on tank sides especially in the morning (6.00 to 8.00 a.m.) and evening (5.30 to 7.00 p.m.). Based on the observations of the respondents, highest crocodile number was reported from
Kotiyagala tank (20 to 25), followed by Heekaduwa tank-1 (15 to 20) and Heekaduwa tank-2
(10 to 15). Regarding the approximate length of the largest crocodile seen by the respondents,
majority (62%) of has seen largest crocodile in between 2-3 m in length.
Nesting season, i.e., from June to August of Crocodylus palustris coincides with the dry
season in Monaragala (June to September) (Department of meteorology statistics, 2014).
Therefore, the hatching of eggs takes place with the beginning of the rainy season. Around
45% of the respondents have seen crocodile nesting sites at tank bunds, Vila oya sides, canal
sides, Vila oya anicut and jungle area which close to tanks.However, 11% of respondents have
seen Water Monitors (Varanus salvator) and Land Monitor (Varanus bengalensis) as main
predators of crocodile eggs.
Among the crocodile deaths observed by the respondents, most of the recorded crocodile
deaths were due to human actions such as shooting and hitting when the crocodiles attack to
the fishing nets (Specially for hatchlings). Two crocodile attacks to the fishermen while
fishing were reported. However, 37% of the respondents have faced some financial damages
from the crocodiles as damage to livestock (especially to calves) (37%), loss of fish yield
(29%), fish net damage and damage to pet animals. Among them damage to livestock and
damage to net and loss of fish yield were common. Moreover, threat from crocodiles was
reported as one reason to refrain youngsters from fishery.
Attitudes regarding crocodiles
Though 77% of the respondents have agreed that the crocodiles have become threat to fishery
or daily uses of the water body, 73% of the respondents still believe that conservation
programs for crocodiles are essential, since they believe that the number of crocodiles are
depleting annually. Moreover, they have suggested translocation of crocodiles (to large tanks,
national parks and zoo) and ecotourism to minimize the human crocodile conflict may be due
to the ethical reasons since all the respondents are Buddhists.
Crocodile migration and basking behavior
Crocodiles were migrated during the dry season and they were returned to their original
habitats at the beginning of the rainy season. Therefore, crocodile migration was highest
during August where all most all the seasonal tanks were dried and low water level was
observed in perennial tanks. With the beginning of rainy season in September, crocodiles were
returned to their original habitats.
Proceedings of the Research Symposium of Uva Wellassa University, January 29-30, 2015
39
Crocodiles were basked commonly during 6.00 am to 9.30 am under direct sun light (average
33°C daily temperature) in open areas such as dead trees in water, on the Vila oya river bank,
tank sides/bund and surrounding rocks. With the high day time temperature, they were moved
to the tank bottom and come to the top only for breathing meanwhile some crocodiles were
moved to burrows.
Recommendations to solve human crocodile conflict and conservation
To minimize human-crocodile conflict conducting awareness program to villagers including
conservation and laws related, installation and maintenance of crocodile excluding areas at
bathing places, installing warning sign boards and translocation of crocodiles which trap to
fish nets can be done. The crocodile conservation can be done to some extent by sharing
conservation and management responsibility among local community. The crocodiles can be
an attraction of visitors and create employment opportunities for the local community. Eco-
tourism may be a good solution for involving people with their traditional knowledge about
crocodile conservation and will be helpful to uplift the local socio-economic conditions. Other
than eco-tourism, protection of nesting habitats, initiation of crocodile parks or sanctuary,
conservation education and public awareness also can be practiced.
Conclusion
Majority of the villagers have sound knowledge regarding crocodile population, behavior,
migration patterns and availability. Since almost all the people were engaged with the tanks
for their daily needs and majority was farmers and fishermen. Though there are several
livestock attacks and economic losses from crocodiles no fatal attacks recorded to people.
Therefore, majority of the people in Ethimale was having a positive attitudes regarding
conservation of crocodiles.
References
De Silva, A. (2013). The Crocodiles of Sri Lanka. A.M.P. print shop, Gampaha, Sri Lank.
Da Silva, A. and Lenin, J. (2010). Mugger Crocodile-Crocodylus palustris. Pp. 94-98. In:
Manolis, S.C. and Stevenson, C. (Eds.), Crocodiles: Status Survey and Conservation Action
Plan, Crocodile Specialist Group: Darwin.
IUCN Red List of Threatened Species. (2007). Available at: https://www.iucnredlist.org
[Accessed 3rd April 2014].
IUCN Red List of Threatened Species. (2011). Available at: https://www.iucnredlist.org
[Accessed 3rd April 2014].
Ross, J.P. (1998). Crocodiles: Status Survey and Conservation Action Plan. IUCN/SSC
Crocodile Specialist Group, IUCN, Gland, Switzerland and Cambridge, Information Press,
Oxford, UK.
Proceedings of the Research Symposium of Uva Wellassa University, January 29-30, 2015
40
Development of Tomato (Solanum lycopersicum) Incorporated
Fish Nuggets
R.W.M.E.D. Perera, E.D.N.S. Abeyrathne
Faculty of Animal Science and Export Agriculture, Uva Wellassa University of Sri Lanka
and
N. Lalantha
Keells Food Products PLC, Minuwangoda Road, Ekala, Ja-Ela, Sri Lanka
Introduction
Modern consumers prefer processed foods and the changes in consumer life styles have
resulted in increasing demands for ready-to-eat and ready-to-cook seafood products
(Venugopal, 2005). But due to high post-harvest losses and busy life style fish consumption
has reduced gradually in Sri Lanka. Therefore value added fish products have become familiar
among most consumers (Sri Lanka Fisheries Year Book, 2009). Fish nuggets are formed meat
product in ready-to-cook form and it is a good substitute for above situations.
Most of the people nowadays concern more about their health and prefer to have healthier
diets. Tomato is considered as one of the healthiest vegetable and fruit in the world (American
Cancer Society, 2014). Tomato contains carbohydrates and several vitamins such as Vitamin
A, Thiamine, Niacin, Vitamin B6, Vitamin C and Vitamin E. In addition, tomatoes possess
one of the most powerful antioxidants, lycopene (Choski and Joshi 2007; Kavanaugh et al.,
2007). It has shown a wide variety of positive health benefits, including a reduced risk of
cancer (American Cancer Society, 2014). Therefore tomato incorporated fish nuggets contain
more health benefits and deliciousness due to incorporation of tomato. On the other hand, the
production of value added fish products using locally available resources is important for the
wide range of consumers and manufactures and it is also important to fulfill the market gap
by production of healthier fish based formed meat product in ready-to-cook or ready-to-eat
forms. The objective of this research is to develop a tomato (Solanum lycopersicum)
incorporated fish nugget with higher levels of antioxidants.
Methodology
Initially, the basic composition of fish nuggets was determined. The ingredients for fish
nuggets were identified and new recipes were formulated based on different fish percentages
(30%, 35%, 40% and 45%). After production fish nuggets, a sensory evaluation was carried
out using 10 trained panelists to find the best combination. For selection of the best heat
treatment for tomatoes, keeping qualities (pH, titratable acidity, moisture content and salt
content) and sensory qualities of different heat treated tomato pastes were evaluated. Boiling
(10 min, 100 oC), microwave-cooking (50 s, 800 W) and steaming (10 min) were selected as
the best heat treatments (Kamiloglu et al., 2013). After selecting the best heat treatment for
tomatoes, the best level of tomato paste to be incorporated in to the selected fish nugget recipe
Proceedings of the Research Symposium of Uva Wellassa University, January 29-30, 2015
41
was determined by a sensory evaluation. Tomato paste was incorporated at 5%, 8%, 12% and
15% (w/w) (Deda et al., 2007).
Tomato incorporated fish nugget and fish nugget without tomato incorporation (control) were
further analyzed for its physicochemical properties and microbiological quality. Proximate
composition, pH value and water holding capacity of the final product were determined.
Microbiological analysis was done for Escherichia coli, Staphylococcus aureus, Total Plate
Count (TPC) and Yeast and Moulds. Sensory data were analyzed according to the Friedman
test using MINITAB 15 software package. Data obtained from melting tests were analyzed
by analysis of variance using MINITAB 15 software package.
Results and Discussion
45% fish incorporated fish nugget sample was selected as the best sample. According to the
sensory evaluation, there was significant difference (p˂0.05) among treatments. Then 45%
fish incorporated fish nugget sample was used as the control. According to another sensory
evaluation and keeping quality evaluation, boiling (10 min, 100 oC) was selected as the best
heat treatment for tomato paste. The results of the above mentioned sensory evaluation
showed that there was significant difference between different heat treatments of tomato paste
related to the quality parameters such as appearance/ color, aroma flavor/ taste and mouth feel
(p<0.05). According to the results (Figure 01), there was significant difference between fish
nugget samples with different tomato incorporation levels related to the organoleptic
properties such as appearance, color, taste, texture and overall acceptability (p<0.05). Finally
12% tomato incorporated fish nugget sample was selected as the best.
Figure 01: Web diagram of sensory evaluation on different levels of tomato incorporation in
fish nugget
The composition of tomato incorporated fish nuggets is given in Table 01. The total solid,
organic non-fat, moisture, crude protein and ash contents of the samples were significantly
different (P<0.05). But crude fat content of the samples were not significantly different
(P>0.05). Tomato incorporated fish nugget sample was contain high amount of crude protein
and moisture. This may be due to the incorporation of tomato paste in the fish nuggets.
01234
Apperance
Colour
TasteTexture
Overall
Acceptability
165
437
392
708
526
165- Control fish nugget sample
392- 5% tomato incorporated
fish nugget sample
437- 8% tomato incorporated
fish nugget sample
708- 12% tomato incorporated
fish nugget sample
526- 15% tomato incorporated
fish nugget sample
Proceedings of the Research Symposium of Uva Wellassa University, January 29-30, 2015
42
Table 01: Proximate composition of the samples
Test Parameters % Fish nugget
sample
Tomato incorporated fish
nugget sample
Standard Limits
Total Solids 49.01+0.05 45.96+0.1 45% (min)
Crude Fat 10.05+0.14 9.70+0.16 15% (max)
Organic Non Fat 36.30+0.21 33.79+0.12 32.5% (min)
Ash 2.66+0.06 2.47+0.04 2.7% (max)
Moisture 30.99+0.05 34.04+1.0 40% (max)
Crude Protein 27.37+0.14 27.71+0.04 25% (min)
Microbiological analysis revealed, though the microbial count was increased with the time,
microbe count of tomato incorporated fish nuggets were within the SLSI requirements. There
was a positive effect on reduction of microbial count by frying of fish nuggets. Cost analysis
indicated that cost of 1 kg of tomato incorporated fish nuggets is Rs.325.00.
Conclusion
12% (w/w) is the best level for the incorporation of tomato in to fish nuggets. The analysis of
the chemical composition in tomato incorporated fish nuggets showed high values for total
solids, crude fat, organic non-fat and ash. Boiling is the best heat treatment for tomato paste
to retain the sensory qualities, keeping qualities and nutritional value.
References
American Cancer Society. (2014). Lycopene. [ONLINE] Available at: http://www.cancer.
org/treatment/treatmentsandsideeffects/complementaryandalternativemedicine/dietandnutriti
on/lycopene. [Accessed 31 May 14].
Choski, P.M. and Joshi, V.Y. (2007). A review on lycopene –Extraction, purification, stability
and applications. Int Journal of Food Properties, 10:289–298
Deda, M.S., Bloukas, J.G. and Fista G.A. (2007). Effect of tomato paste and nitrite level on
processing and quality characteristics of frankfurters
Kamiloglu, S., Boyacioglu, D. and Capanoglu, E. (2013) 'The effect of food processing on
bioavailability of tomato antioxidants', Journal of Berry Research.
Kavanaugh, C.J., Trumbo, P.R. and Ellwood, K.C. (2007). The US food and drug
administration’s evidence-based review for qualified health claims: tomatoes, lycopene and
cancer. Journal of the National Cancer Institutes, 99:1074–1085.
Sri Lanka Fisheries Year Book, (2009). National Aquatic Resources Agency, Colombo 5, Sri
Lanka. Retrieved May 20, 2014 from http://www.nara.lk.
Venugopal, V. (2005). Seafood Processing Adding Value Through Quick Freezing,
Retortable Packaging and Cook-Chilling, CRC Press, Taylor & Francis Group, Boca Raton.
Proceedings of the Research Symposium of Uva Wellassa University, January 29-30, 2015
43
Analysis of Consumer Food Safety Knowledge and Practices
in Rathnapura
G.D.H.P. Dharmasiri, P. Sivashankar, I.C. Hettiarachchi, R.P. Mahaliyanaarachchi
Faculty of Agricultural Sciences, Sabaragamuwa university of Sri Lanka
Introduction
Food safety is a scientific discipline describing handling, preparation, and storage of food in
ways that prevent food borne illness. Unsafe food is the likely vector of multiple biological,
chemical or physical hazards and certainly of several nutritional problems. Consumers are
the end-users of food chain. With their attitudes, knowledge, age, sex, income level and social
status food safety knowledge and practices are different. According to the World Health
Organization (WHO), up to 30% of the population of developed countries are affected by food
borne illness each year; more than 75 million people get sick from food related illnesses in
the USA resulting in 325,000 hospitalizations and 5,000 deaths annually (WHO, 2007). The
problem is expected to be even more severe in developing countries.
Now Sri Lanka is more concern about food safety and handling practices. There are many
rules and regulations. Food Act No. 26 of 1980: This Act controls, manufacture, importation,
transport, sale, distribution, advertisement labeling of food. Sri Lankan food & beverage
products comply with international standards such as ISO 9000, ISO 22000, HACCP, Halal,
Kosher, Organic etc. In Sri Lanka also have many of food borne diseases, but they are not
reported often. But mainly diarrhoeal diseases are the prominent. This study assesses the
consumer food safety knowledge and the practices among the Rathnapura households.
Methodology
A survey strategy was used in the research. Target population was the entire household in
Rathnapura district 301,876 .Thought it was large to do an investigation within limited time
period and inadequate financial budget, multi stage random sampling technique was employed
to select appropriate sample to evaluate the objectives of this study. Eventually 120 household
were selected as the sample size where can meet 95% confidential level.
Five key principles of Food safety by WHO, are used to find out consumer knowledge level
in food safety. The association between socio economic characteristics and knowledge on
food safety was revealed by applying chi-square test. Prevailing food safety measures were
identified by using significant measures like smell, appearance, special package, and price and
quality certificates. Consumer food safety knowledge was evaluated with household
experiences of physical symptoms associate with food borne illness. And also food
preparation, purchasing and storage practices were used to identify food safety knowledge and
practices of consumers. Analysis was done by using Minitab 14.0 software package and
Microsoft Excel.
Results and Discussion
Proceedings of the Research Symposium of Uva Wellassa University, January 29-30, 2015
44
Descriptive statistics for the sample were produced using descriptive statistical analysis. The
purpose of generating descriptive statistics was to describe the demographic characteristics of
the sample.56% females and 44% males are in the sample. To prevent contamination of food
with pathogens spreading from people, pets and pests, separate raw and cooked foods to
prevent contaminating the cooked foods, cook foods for the appropriate length of time and at
the appropriate temperature to kill pathogens, store food at the proper temperature, do use safe
water and cooked materials. Majority of consumer’s (58%) food safety knowledge level was
low. 30% of consumers were had high food safety knowledge level.12% had medium level
knowledge on food safety.
Food safety measures were identified by the study as smell, appearance, special package, and
price and quality certificates. Among them 12% considered price, appearance and smell as
important factors.7% were merely concern about one factor of them. Smell, package and
special offer were identified by 10% of consumers. And also 10% of them were concerned
about all measures. Among respondents 63% selected food items without considering about
quality certification. The association between socio economic characteristics and knowledge
on food safety was analyzed by using chi-square analysis. Income level had significant
association with food safety knowledge of consumers. Education level did not show any
association on food safety knowledge.
95% of respondents had experienced with any of the food borne illnesses. This shows that
consumers have low confident on food safety and how to protect their family from food borne
illnesses. Daniels (1998) verified that consumers who considered themselves knowledgeable
make food handling errors.
By considering food safety practices on storage and preparation, 53% of consumers agreed
that peeled and chopped fruits and vegetables kept in open air for long time cause
contamination. But 23% strongly agreed that before using vegetables and fruits, they should
be soaked in salt water. Only 10% kept cooled vegetables and fruits in open air more than one
hour. In purchasing fish, 8% of consumers observed red color gills, discoloration and
brightness of eyes. Majority were concerned on one factor. And also 48% were concerned
about cleanliness of preparation and operator. Storage period of fish and usage were not
concerned by consumers of 36%.some consumers never keep cooked meat and raw meat at
the same place in refrigerator (34%). Cleaning of food preparation area with soap and water
was practiced by only 6%. Washing the cutting board with water, used to chop vegetables or
cut raw meat was practiced by 8% of consumers (Table 01).
Lack of knowledge is likely to lead to inappropriate food handling behaviors. Generally,
consumer’s knowledge has been found to be inadequate to ensure that food preparation in the
home minimizes the risk of food borne illness. Personal hygiene and cleanliness of surfaces
where food is prepared were identified as practices that have to be developed. Nearly 48%
consumers were concern on personal hygiene highly,
Table 01: Descriptive on Food preparation practices
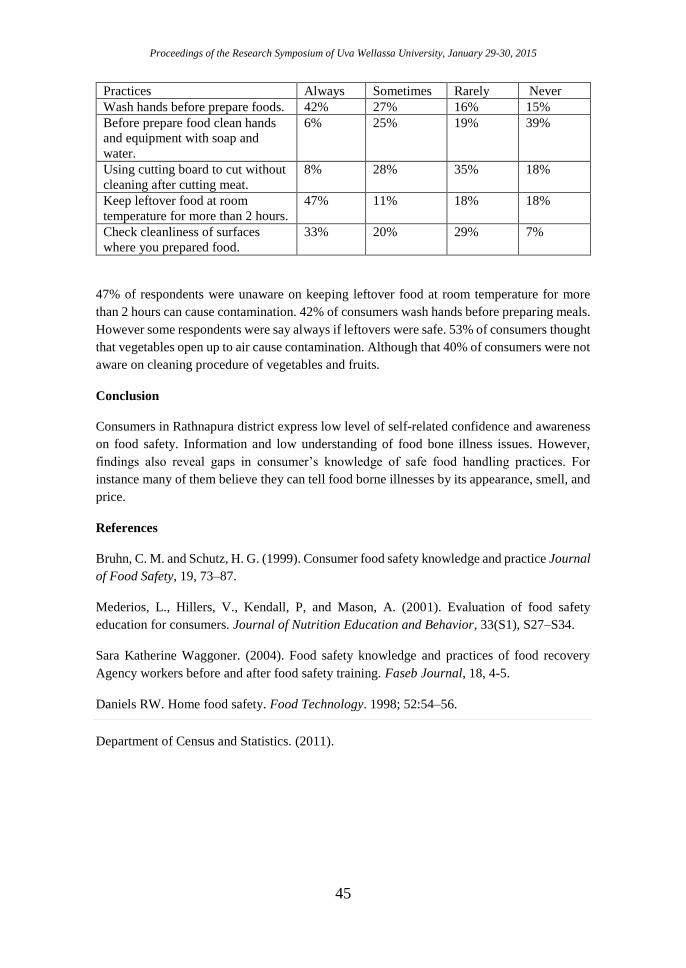
Proceedings of the Research Symposium of Uva Wellassa University, January 29-30, 2015
45
Practices Always Sometimes Rarely Never
Wash hands before prepare foods. 42% 27% 16% 15%
Before prepare food clean hands
and equipment with soap and
water.
6% 25% 19% 39%
Using cutting board to cut without
cleaning after cutting meat.
8% 28% 35% 18%
Keep leftover food at room
temperature for more than 2 hours.
47% 11% 18% 18%
Check cleanliness of surfaces
where you prepared food.
33% 20% 29% 7%
47% of respondents were unaware on keeping leftover food at room temperature for more
than 2 hours can cause contamination. 42% of consumers wash hands before preparing meals.
However some respondents were say always if leftovers were safe. 53% of consumers thought
that vegetables open up to air cause contamination. Although that 40% of consumers were not
aware on cleaning procedure of vegetables and fruits.
Conclusion
Consumers in Rathnapura district express low level of self-related confidence and awareness
on food safety. Information and low understanding of food bone illness issues. However,
findings also reveal gaps in consumer’s knowledge of safe food handling practices. For
instance many of them believe they can tell food borne illnesses by its appearance, smell, and
price.
References
Bruhn, C. M. and Schutz, H. G. (1999). Consumer food safety knowledge and practice Journal
of Food Safety, 19, 73–87.
Mederios, L., Hillers, V., Kendall, P, and Mason, A. (2001). Evaluation of food safety
education for consumers. Journal of Nutrition Education and Behavior, 33(S1), S27–S34.
Sara Katherine Waggoner. (2004). Food safety knowledge and practices of food recovery
Agency workers before and after food safety training. Faseb Journal, 18, 4-5.
Daniels RW. Home food safety. Food Technology. 1998; 52:54–56.
Department of Census and Statistics. (2011).
Proceedings of the Research Symposium of Uva Wellassa University, January 29-30, 2015
46
A study on shelf life of export oriented fresh chilled Yellowfin
tuna loins in relation to histamine content
T.R. Kapugama Arachchige, S.C. Jayamanne
Faculty of Animal Science and Export Agriculture, Uva Wellassa University of Sri Lanka
and
K. Amarasinghe
SGS Lanka (Pvt) Limited, Colombo, Sri Lanka
Introduction
Sri Lanka has become a leading country which produces Yellowfin tuna (Thunnus albacores)
and other large pelagic species in the Indian Ocean. (Indian Ocean Tuna Commission, 2011).
To meet export market, maximum histamine content of the product should not exceed 50 ppm
(Food and Drug Administration, 1998). Seafood processing factories guarantee a shelf life of
14 days for the product fresh chilled Yellowfin tuna loin, even though shelf life of different
Yellowfin tuna loin batches is varied. Shelf life can be exceeded or not exceeded 14 days in
different batches. These batches represent Yellowfin tuna received from different fishing
harbors in different proportions. According to the fishing harbor environmental factors and
practices followed by fishermen can be varied. There is evident that depending on the nature
of the environment, different proportions of decarboxylase positive bacteria would be present
in water and external fish tissue, and therefore the level of histamine and other toxigenic
amines formed in fish tissue would not be uniform (Yoshinga and Frank, 1982). This research
is to identify whether these fishing harbors have an effect on the shelf life of fresh chilled
Yellowfin tuna loin in relation to histamine content.
Methodology
The study was carried out at SGS Lanka (Pvt) Limited, Colombo 02. The sample collection
and background study of fresh chilled Yellowfin tuna loin exportation was done at Global
Seafoods (Pvt) Limited. Three repeated experimental trials on histamine analysis of Yellowfin
tuna loin samples were conducted during a time period of 42 days. Storage time period of each
set of samples for an experimental trial was 14 days. Selected fishing harbors were Beruwala,
Tangalle, Chilaw, and Trincomalee. Yellowfin tuna loins of Grade A and B were selected
from each fishing harbor. All collected samples had an on-broad freezing time period, which
was varied between 18 - 22 days. Labeled and vacuum packed samples were stored at 0 0C,
in the fresh chilled condition. Histamine analysis was carried out from the time period of zero
day of storage to 14 days of storage. Histamine was analysed using flurometric method
according to the AOAC official methods of analysis. Data collected from the three
experimental trials were analysed using Minitab 14 statistical software. Descriptive statistics
of means, Standard deviation, two-way ANOVA and one way ANOVA with tukey’s pairwise
comparison was applied in analysing the results. A significance level of 5 % was used.
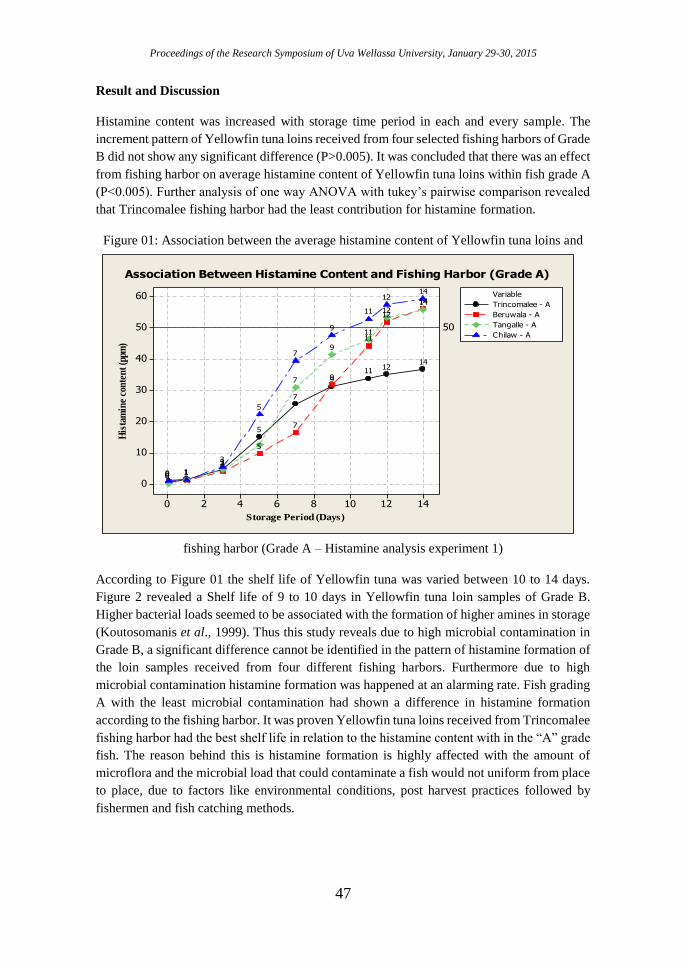
Proceedings of the Research Symposium of Uva Wellassa University, January 29-30, 2015
47
Result and Discussion
Histamine content was increased with storage time period in each and every sample. The
increment pattern of Yellowfin tuna loins received from four selected fishing harbors of Grade
B did not show any significant difference (P>0.005). It was concluded that there was an effect
from fishing harbor on average histamine content of Yellowfin tuna loins within fish grade A
(P<0.005). Further analysis of one way ANOVA with tukey’s pairwise comparison revealed
that Trincomalee fishing harbor had the least contribution for histamine formation.
Figure 01: Association between the average histamine content of Yellowfin tuna loins and
fishing harbor (Grade A – Histamine analysis experiment 1)
According to Figure 01 the shelf life of Yellowfin tuna was varied between 10 to 14 days.
Figure 2 revealed a Shelf life of 9 to 10 days in Yellowfin tuna loin samples of Grade B.
Higher bacterial loads seemed to be associated with the formation of higher amines in storage
(Koutosomanis et al., 1999). Thus this study reveals due to high microbial contamination in
Grade B, a significant difference cannot be identified in the pattern of histamine formation of
the loin samples received from four different fishing harbors. Furthermore due to high
microbial contamination histamine formation was happened at an alarming rate. Fish grading
A with the least microbial contamination had shown a difference in histamine formation
according to the fishing harbor. It was proven Yellowfin tuna loins received from Trincomalee
fishing harbor had the best shelf life in relation to the histamine content with in the “A” grade
fish. The reason behind this is histamine formation is highly affected with the amount of
microflora and the microbial load that could contaminate a fish would not uniform from place
to place, due to factors like environmental conditions, post harvest practices followed by
fishermen and fish catching methods.
Storage Period (Days)
His
tam
ine
con
ten
t (p
pm)
14121086420
60
50
40
30
20
10
0
50
Variable
Tangalle - A
Chilaw - A
Trincomalee - A
Beruwala - A
1412
119
7
5
3
10
14
12
11
9
7
5
310
1412
11
9
7
5
3
10
1412
11
9
7
5
3
10
Association Between Histamine Content and Fishing Harbor (Grade A)
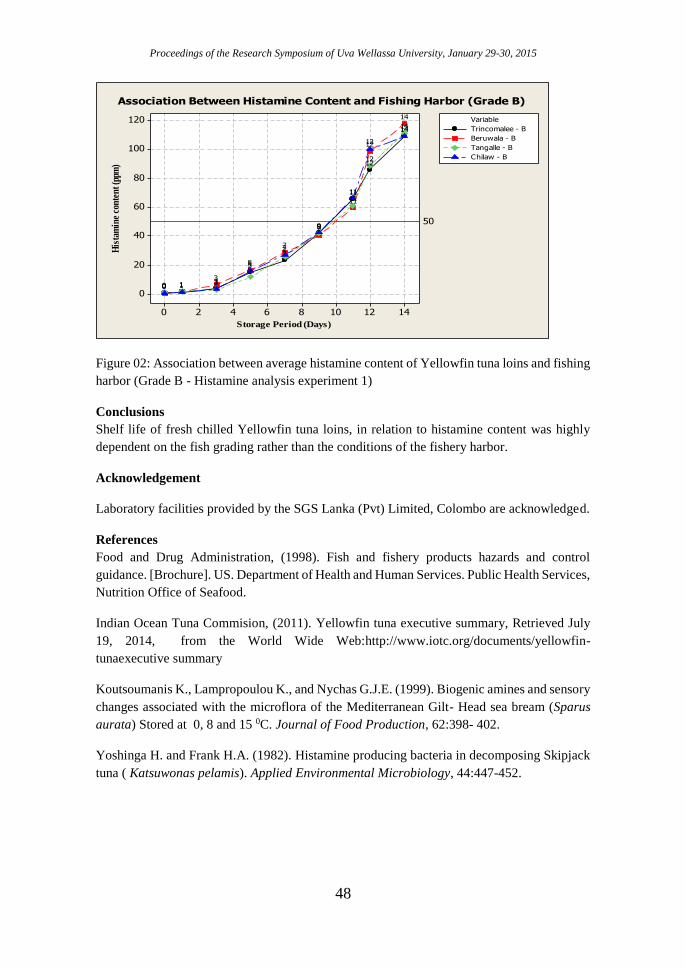
Proceedings of the Research Symposium of Uva Wellassa University, January 29-30, 2015
48
Storage Period (Days)
His
tam
ine
con
ten
t (p
pm)
14121086420
120
100
80
60
40
20
0
50
Variable
Tangalle - B
Chilaw - B
Trincomalee - B
Beruwala - B
14
12
11
9
7
5
310
14
12
11
9
7
5
310
14
12
11
9
7
5
310
14
12
11
9
7
5
310
Association Between Histamine Content and Fishing Harbor (Grade B)
Figure 02: Association between average histamine content of Yellowfin tuna loins and fishing
harbor (Grade B - Histamine analysis experiment 1)
Conclusions
Shelf life of fresh chilled Yellowfin tuna loins, in relation to histamine content was highly
dependent on the fish grading rather than the conditions of the fishery harbor.
Acknowledgement
Laboratory facilities provided by the SGS Lanka (Pvt) Limited, Colombo are acknowledged.
References
Food and Drug Administration, (1998). Fish and fishery products hazards and control
guidance. [Brochure]. US. Department of Health and Human Services. Public Health Services,
Nutrition Office of Seafood.
Indian Ocean Tuna Commision, (2011). Yellowfin tuna executive summary, Retrieved July
19, 2014, from the World Wide Web:http://www.iotc.org/documents/yellowfin-
tunaexecutive summary
Koutsoumanis K., Lampropoulou K., and Nychas G.J.E. (1999). Biogenic amines and sensory
changes associated with the microflora of the Mediterranean Gilt- Head sea bream (Sparus
aurata) Stored at 0, 8 and 15 0C. Journal of Food Production, 62:398- 402.
Yoshinga H. and Frank H.A. (1982). Histamine producing bacteria in decomposing Skipjack
tuna ( Katsuwonas pelamis). Applied Environmental Microbiology, 44:447-452.
Proceedings of the Research Symposium of Uva Wellassa University, January 29-30, 2015
49
Development of Finger millet (Eleusinecoracana)
incorporated symbiotic drinking yoghurt
H.K.T. Awanthika, A.M.N.L. Abesinghe
Faculty of Animal Science and Export Agriculture, UvaWellassa University of Sri Lanka
and
U. De Silva
Ceylon cold stores PLC, Samadaragahawatta ,Ranala, Sri Lanka
Introduction
Sri Lankan yogurt market is characterized by intense competition prompting leading players
to differentiate themselves by focusing on health benefits, branding, and incorporation of
different ingredients. Yoghurt is a popular fermented dairy product due to its health benefits
as a functional food in addition to its nutritional benefits (Robinson and Tamime, 1999). High
calorie yogurt drink that contains any kind of a cereal powder is completely a new product
concept to the Sri Lankan market. Therefore, the objective of the current study was to develop
a health beneficial probiotic drinking yoghurt by incorporating finger millet as a cereal which
can be used as a breakfast food, sport supplement and also as a weaned food for toddlers.
Nutritionally, finger millet is used as a whole grain, it is higher in protein and minerals in
comparison to all other cereals and millets. Accroding to previous studies, finger millet is also
known for several health benefits such as anti-diabetic, antitumerogenic, atherosclerogenic
effects, antioxidant and antimicrobial properties which are mainly attributed due to its
polyphenol and dietary fiber contents (Dykes and Rooney, 2007; Chethan, 2008). Therefore
this study was conducted to develop a cereal based probiotic yoghurt drink which can be
promoted as a natural source of high calorie that can be consumed as an alternative for the
imported, artificial and expensive sport nutrition’s and weaned foods.
Methodology
The study was conducted at the research and development and quality assurance laboratories
in Ceylon cold stores PLC, Ranala, Kaduwela. In the preliminary trial 1 most compatible sugar
percentages for different incorporation levels of finger millet flour from the three experimental
forms (roasted flour, germinated flour and raw slurry) were selected. Then preliminary trial 2
was carried out using ranking method to select the best finger millet incorporation levels (4
%, 5 %, 6%, 7% and 8 % (w/w)) for each incorporation form. The best sugar percentages and
incorporation levels of finger millet from preliminary trials were used in next steps of
Proceedings of the Research Symposium of Uva Wellassa University, January 29-30, 2015
50
experiments. Sensory evaluation 1 was carried out to select the best form/type of finger millet
flour to incorporate out of three forms. In second sensory evaluation, the most suitable stage
for finger millet incorporation was determined by using two treatments. Each sensory
evaluation was conducted with 30 untrained panellists and color, taste, aroma, mouth feel and
overall acceptability were considered as sensory properties. Finally proximate analysis,
physico- chemical and microbial analysis were conducted for the selected final probiotic
drinking yoghurt by comparing with a control sample. Probiotc lactic acid bacteria
enumeration was carried out using the selected final product by pour plating on MRS media
to find out the effect of finger millet incorporation on the viability of probiotic lactobacilli.
Selected final product was compared with a control sample and enumeration was done at 1, 7
and 14 days interval.
The sensory data were analyzed using Friedman non-parametric test with 95% significance
by using Minitab 16 software. Complete Randomized Design (CRD) was conducted and data
obtained from chemical and microbiological tests were analyzed using analysis of variance
(ANOVA) using the SAS 9.0 software. Significant means of treatments were separated using
the Least Significant Difference test (LSD) (P< 0.05).
Results and Discussion
According to the results of the series of preliminary trials 5% (w/w) was selected as the best
incorporation level from each three finger millet forms and 8 % (w/w) sugar as the compatible
sugar percentage. In the first sensory evaluation for selecting best form/type of incorporation
out of three experimental forms, germinated /malted flour incorporated yoghurt was selected
as the best due to higher preference than other two. There was a significant difference (P<0.05)
between treatments regarding and overall acceptability. Second sensory evaluation revealed,
5 % (w/w) germinated (malted) finger millet flour incorporated (Addition before
fermentation) drinking yoghurt have the higher preference compared to the other treatment
with respect toall the sensory parameters considered (p<0.05). The selected composition of
synbiotic drinking yoghurt is given in Table 01.
Table 01. Composition of the selected final product
Ingredient Percentage (w/w)
Raw milk 84.54 %
Sugar 8 %
Stabilizer 0.25 %
Finger millet (Germinated flour ) 5 %
Skim milk powder 0.83 %
Dairy cream 1.37 %
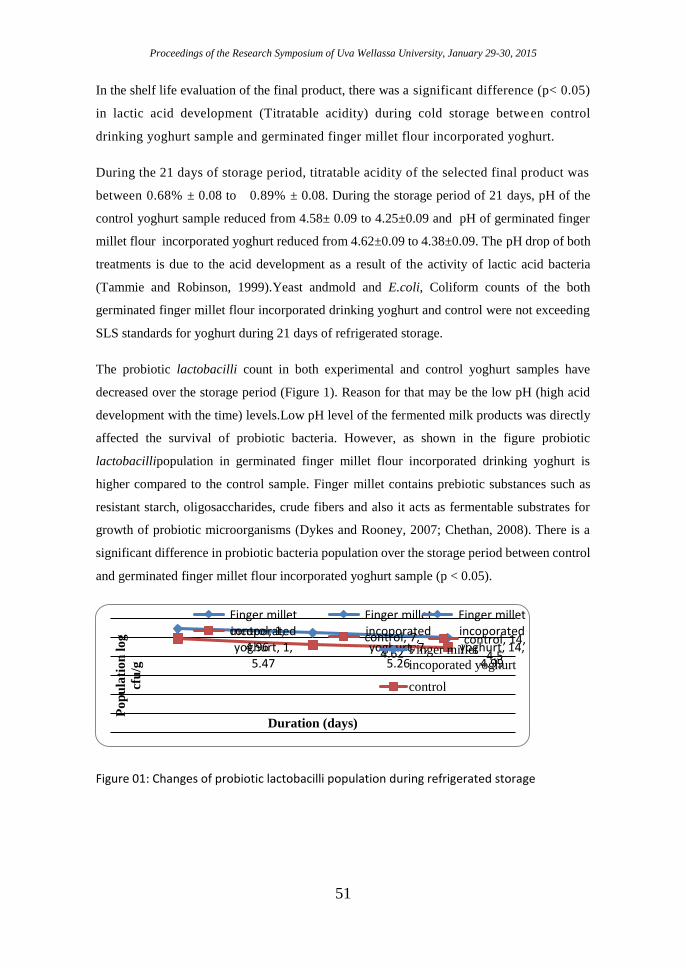
Proceedings of the Research Symposium of Uva Wellassa University, January 29-30, 2015
51
In the shelf life evaluation of the final product, there was a significant difference (p< 0.05)
in lactic acid development (Titratable acidity) during cold storage between control
drinking yoghurt sample and germinated finger millet flour incorporated yoghurt.
During the 21 days of storage period, titratable acidity of the selected final product was
between 0.68% ± 0.08 to 0.89% ± 0.08. During the storage period of 21 days, pH of the
control yoghurt sample reduced from 4.58± 0.09 to 4.25±0.09 and pH of germinated finger
millet flour incorporated yoghurt reduced from 4.62±0.09 to 4.38±0.09. The pH drop of both
treatments is due to the acid development as a result of the activity of lactic acid bacteria
(Tammie and Robinson, 1999).Yeast andmold and E.coli, Coliform counts of the both
germinated finger millet flour incorporated drinking yoghurt and control were not exceeding
SLS standards for yoghurt during 21 days of refrigerated storage.
The probiotic lactobacilli count in both experimental and control yoghurt samples have
decreased over the storage period (Figure 1). Reason for that may be the low pH (high acid
development with the time) levels.Low pH level of the fermented milk products was directly
affected the survival of probiotic bacteria. However, as shown in the figure probiotic
lactobacillipopulation in germinated finger millet flour incorporated drinking yoghurt is
higher compared to the control sample. Finger millet contains prebiotic substances such as
resistant starch, oligosaccharides, crude fibers and also it acts as fermentable substrates for
growth of probiotic microorganisms (Dykes and Rooney, 2007; Chethan, 2008). There is a
significant difference in probiotic bacteria population over the storage period between control
and germinated finger millet flour incorporated yoghurt sample (p < 0.05).
Figure 01: Changes of probiotic lactobacilli population during refrigerated storage
Finger millet incoporated yoghurt, 1,
5.47
Finger millet incoporated yoghurt, 7,
5.26
Finger millet incoporated yoghurt, 14,
4.99
control, 1, 4.96
control, 7, 4.62
control, 14, 4.5
Po
pu
lati
on
lo
g
cfu
/g
Duration (days)
Finger millet
incoporated yoghurt
control
Proceedings of the Research Symposium of Uva Wellassa University, January 29-30, 2015
52
Conclusions
5 % (w/w) finger millet flour incorporation level was selected as the best and
germinated/malted flour was selected as the best form of incorporation while addition of
finger millet before fermentation was determined as the most suitable stage of incorporation.
Further, the incorporation of finger millet into the yoghurt has enhanced the survival of
probiotic lactobacilli during refrigerated storage.
References
Chethan, S.(2008). Finger millet (Eleusinecoracana) seed polyphenols and their nutraceutical
potential. Ph.D. Thesis. University of Mysore, Mysore, India
Dykes, L., and Rooney, L. W. (2007). Phenolic compounds in cereal grains and their health
benefits. Cereal Foods World, 52(3):105–111.
Tamime, A.Y. and Robinson, R.K..(1999). Chapter 1 Historical background. In Tamime and
Robinson’s Yogurt: Science and Technology, 3rd ed.; Woodhead Publishing LTD:
Cambridge, UK, pp. 1–10.
Proceedings of the Research Symposium of Uva Wellassa University, January 29-30, 2015
53
Development of soursop pulp (Annonamuricata) incorporated
fermented sweet cream buttermilk beverage
K. Buddhadasa, A.M.N.L. Abesinghe
Faculty of Animal Science and Export Agriculture, UvaWellassa University of Sri Lanka
and
R.A.J.N.Luxman
Pellwatte Dairy Industies Limited, Buththala, Sri Lanka
Introduction
In Sri Lankan context buttermilk removed from the dairy processing plants considered as a
dairy waste and utilization of dairy by product is considerably low compared to other
countries. Sri Lankan market is still having a market gap for locally produce fermented
flavored milk base beverages. Buttermilk could be used to produce fermented milk beverages
replacing milk which would result in differentiated products. Buttermilk is also considered a
nutritious dairy ingredient that is saturated in milk fat globule membrane (MFGM)
components (Sodini et al., 2006). Addition of fruit juices or pulps is an attractive avenue for
the utilization of buttermilk. Soursop is one of the fruit spp. which can be incorporated to
manufacture beverages with good consumer demand. The fruit is rich in vitamin B, potassium,
fructose and vitamin C (Pamplona-Roger, 2005 cited in Ekaluo et al., 2013). Soursop fruit
is a proven cancer remedy for cancers of all types and broad spectrum antimicrobial agent for
both bacterial and fungal infections, antiparasitic activity, lower high blood pressure and is
used for depression and stress (Camiel et al., 2008).
Methodology
The current study was carried out at Pelwatte Dairy Industries Limited, Pelwette and
laboratory analysis was done at Pelwatte Dairy Indusries Limited and Uva Wellassa
University laboratories. Soursop pulp was prepared by flowing method. Fresh fully ripped
Soursop fruit was washed by chlorinated water and disinfected by using 70% of ethanol. Then
fruit was cut it to halves by using a sharp knife and seeds and blemishes were removed. After
that, flesh was scooped out using a clean stainless steel spoon and blended it using an electric
blender. Initially incubation time was standardized for the buttermilk base by incorporating
different levels of Skim Milk Powder. Several preliminary studies were done to select the best
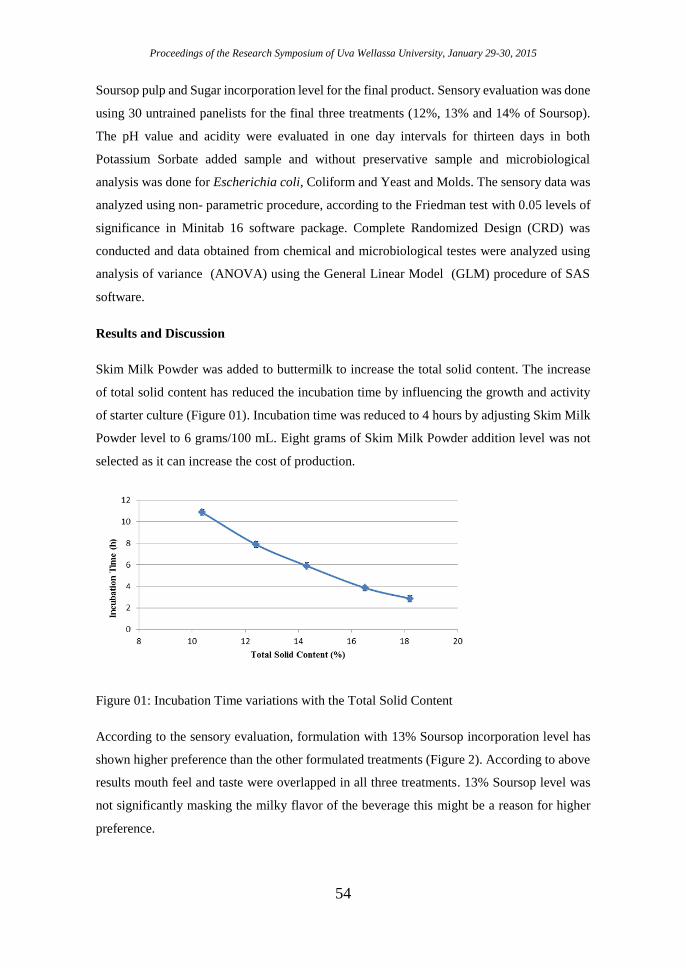
Proceedings of the Research Symposium of Uva Wellassa University, January 29-30, 2015
54
Soursop pulp and Sugar incorporation level for the final product. Sensory evaluation was done
using 30 untrained panelists for the final three treatments (12%, 13% and 14% of Soursop).
The pH value and acidity were evaluated in one day intervals for thirteen days in both
Potassium Sorbate added sample and without preservative sample and microbiological
analysis was done for Escherichia coli, Coliform and Yeast and Molds. The sensory data was
analyzed using non- parametric procedure, according to the Friedman test with 0.05 levels of
significance in Minitab 16 software package. Complete Randomized Design (CRD) was
conducted and data obtained from chemical and microbiological testes were analyzed using
analysis of variance (ANOVA) using the General Linear Model (GLM) procedure of SAS
software.
Results and Discussion
Skim Milk Powder was added to buttermilk to increase the total solid content. The increase
of total solid content has reduced the incubation time by influencing the growth and activity
of starter culture (Figure 01). Incubation time was reduced to 4 hours by adjusting Skim Milk
Powder level to 6 grams/100 mL. Eight grams of Skim Milk Powder addition level was not
selected as it can increase the cost of production.
Figure 01: Incubation Time variations with the Total Solid Content
According to the sensory evaluation, formulation with 13% Soursop incorporation level has
shown higher preference than the other formulated treatments (Figure 2). According to above
results mouth feel and taste were overlapped in all three treatments. 13% Soursop level was
not significantly masking the milky flavor of the beverage this might be a reason for higher
preference.
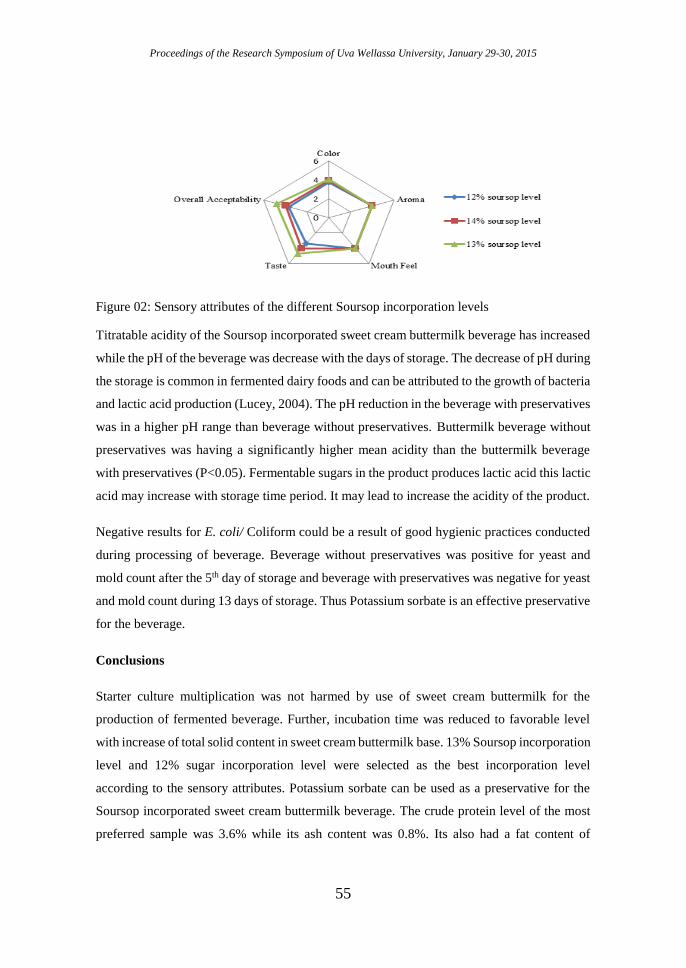
Proceedings of the Research Symposium of Uva Wellassa University, January 29-30, 2015
55
Figure 02: Sensory attributes of the different Soursop incorporation levels
Titratable acidity of the Soursop incorporated sweet cream buttermilk beverage has increased
while the pH of the beverage was decrease with the days of storage. The decrease of pH during
the storage is common in fermented dairy foods and can be attributed to the growth of bacteria
and lactic acid production (Lucey, 2004). The pH reduction in the beverage with preservatives
was in a higher pH range than beverage without preservatives. Buttermilk beverage without
preservatives was having a significantly higher mean acidity than the buttermilk beverage
with preservatives (P<0.05). Fermentable sugars in the product produces lactic acid this lactic
acid may increase with storage time period. It may lead to increase the acidity of the product.
Negative results for E. coli/ Coliform could be a result of good hygienic practices conducted
during processing of beverage. Beverage without preservatives was positive for yeast and
mold count after the 5th day of storage and beverage with preservatives was negative for yeast
and mold count during 13 days of storage. Thus Potassium sorbate is an effective preservative
for the beverage.
Conclusions
Starter culture multiplication was not harmed by use of sweet cream buttermilk for the
production of fermented beverage. Further, incubation time was reduced to favorable level
with increase of total solid content in sweet cream buttermilk base. 13% Soursop incorporation
level and 12% sugar incorporation level were selected as the best incorporation level
according to the sensory attributes. Potassium sorbate can be used as a preservative for the
Soursop incorporated sweet cream buttermilk beverage. The crude protein level of the most
preferred sample was 3.6% while its ash content was 0.8%. Its also had a fat content of
Proceedings of the Research Symposium of Uva Wellassa University, January 29-30, 2015
56
0.6%.Further studies should be done on the shelf stability of the Soursop incorporated sweet
cream buttermilk beverage.
References
Camiel, L.D. and Whelan, J.S. (2008). Tropical American plants in treatment of infectious
diseases. Journal of Dietary Supplements, 5(4), 349-72.
Ekaluo, U.B., Ikpeme, E.V., Ibiang, Y.B. and Omordia, F.O. (2013). Effect of Soursop
(Annona muricata L.) Fruit Extract on Sperm Toxicity Induced by Caffeine in Albino
Rats. Journal of Medical Sciences, 13, 67-71.
Lucey JA.2004. Cultured dairy products: An overview of their gelation and texture properties.
International Journal of Dairy Technology, 57, 77-84.
Sodini I., Morin P., Olabi A. and Jimenez-Flores, R. (2006). Compositional and functional
properties of buttermilk: a comparison between sweet, sour and whey buttermilk. Journal of
Dairy Science, 89, 525–536.
Proceedings of the Research Symposium of Uva Wellassa University, January 29-30, 2015
57
Development of fruit (Musa spp.) puree incorporated
synbiotic stirred yoghurt
G.H. Nanayakkara, A.M.N.L. Abesinghe
Faculty of Animal Science and Export Agriculture, UvaWellassa University of Sri Lanka
and
U. De Silva
Ceylon cold stores PLC, Samadaragahawatta ,Ranala, Sri Lanka
Introduction
Yoghurt is one of the most nutritious fermented milk products that can be used to enhance the
nutrition condition of people. It is obtained by introducing specific strains of Lactic acid
bacteria. The Lactic acid micro flora reduce risk of colon cancer (Foissy, 1983 cited in Huma,
2003), reduce the serum cholesterol level (Anderson and Gilliland, 1999 cited in Huma, 2003)
and also maintain the intestinal ecosystem (Saarela et al., 2002 cited in Huma, 2003).
Prebiotics are non-digestible food ingredients that improve the host health by selectively
stimulating the growth of certain beneficial microorganisms. Fructo-oligosaccharide is
prebiotic source that can be found in ripe banana around 2 mg/g. By incorporating banana
with yoghurt is best way to improve the health benefits and taste of the yoghurt. Stirred type
fruit yoghurt is one of the best products that can be used to gain consumer preference.
Therefore, this study was conducted to develop a Banana puree incorporated symbiotic stirred
yogurt.
Methodology
The current study was carried out at Ceylon Cold Stores PLC (CCS), Ranala, Kaduwela.
Laboratory analysis was done at CCS and laboratories in University of Kelaniya. First,
yoghurt base and the banana puree were prepared according to the predetermined recipe after
various preliminary trials. For final sensory evaluation, three treatments were used with three
replicates. The incorporation levels of fruit puree with yogurt base is given in table 01.
Table 01: Incorporation levels of fruit puree with yoghurt base
Treatment Yoghurt % (w/w) Fruit puree % (w/w)
1 86 14
2 85 15
3 84 16
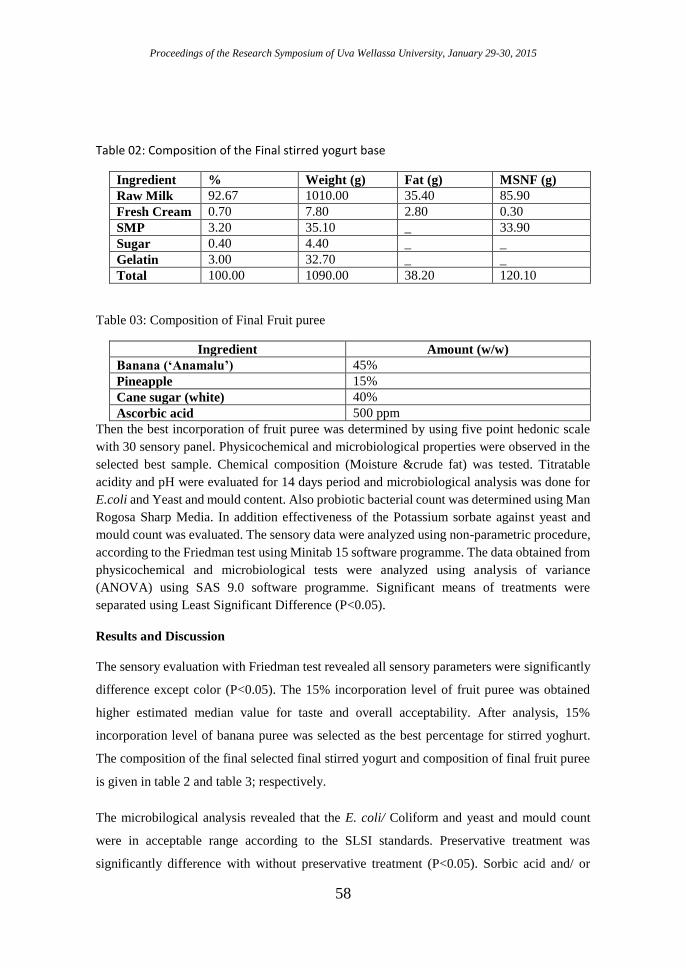
Proceedings of the Research Symposium of Uva Wellassa University, January 29-30, 2015
58
Table 02: Composition of the Final stirred yogurt base
Ingredient % Weight (g) Fat (g) MSNF (g)
Raw Milk 92.67 1010.00 35.40 85.90
Fresh Cream 0.70 7.80 2.80 0.30
SMP 3.20 35.10 _ 33.90
Sugar 0.40 4.40 _ _
Gelatin 3.00 32.70 _ _
Total 100.00 1090.00 38.20 120.10
Table 03: Composition of Final Fruit puree
Ingredient Amount (w/w)
Banana (‘Anamalu’) 45%
Pineapple 15%
Cane sugar (white) 40%
Ascorbic acid 500 ppm
Then the best incorporation of fruit puree was determined by using five point hedonic scale
with 30 sensory panel. Physicochemical and microbiological properties were observed in the
selected best sample. Chemical composition (Moisture &crude fat) was tested. Titratable
acidity and pH were evaluated for 14 days period and microbiological analysis was done for
E.coli and Yeast and mould content. Also probiotic bacterial count was determined using Man
Rogosa Sharp Media. In addition effectiveness of the Potassium sorbate against yeast and
mould count was evaluated. The sensory data were analyzed using non-parametric procedure,
according to the Friedman test using Minitab 15 software programme. The data obtained from
physicochemical and microbiological tests were analyzed using analysis of variance
(ANOVA) using SAS 9.0 software programme. Significant means of treatments were
separated using Least Significant Difference (P<0.05).
Results and Discussion
The sensory evaluation with Friedman test revealed all sensory parameters were significantly
difference except color (P<0.05). The 15% incorporation level of fruit puree was obtained
higher estimated median value for taste and overall acceptability. After analysis, 15%
incorporation level of banana puree was selected as the best percentage for stirred yoghurt.
The composition of the final selected final stirred yogurt and composition of final fruit puree
is given in table 2 and table 3; respectively.
The microbilogical analysis revealed that the E. coli/ Coliform and yeast and mould count
were in acceptable range according to the SLSI standards. Preservative treatment was
significantly difference with without preservative treatment (P<0.05). Sorbic acid and/ or
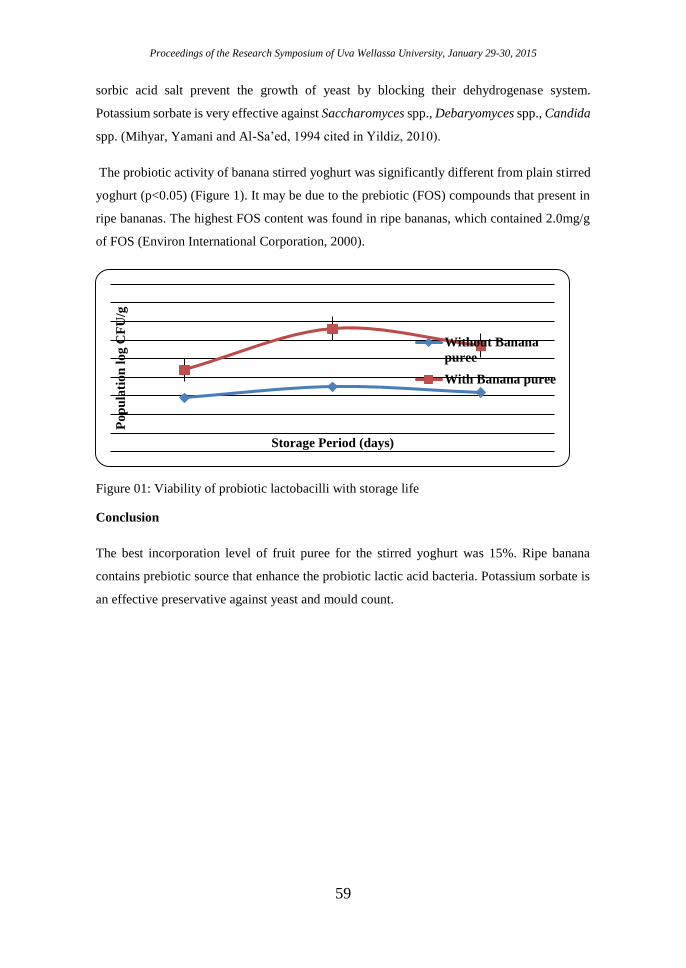
Proceedings of the Research Symposium of Uva Wellassa University, January 29-30, 2015
59
sorbic acid salt prevent the growth of yeast by blocking their dehydrogenase system.
Potassium sorbate is very effective against Saccharomyces spp., Debaryomyces spp., Candida
spp. (Mihyar, Yamani and Al-Sa’ed, 1994 cited in Yildiz, 2010).
The probiotic activity of banana stirred yoghurt was significantly different from plain stirred
yoghurt (p<0.05) (Figure 1). It may be due to the prebiotic (FOS) compounds that present in
ripe bananas. The highest FOS content was found in ripe bananas, which contained 2.0mg/g
of FOS (Environ International Corporation, 2000).
Figure 01: Viability of probiotic lactobacilli with storage life
Conclusion
The best incorporation level of fruit puree for the stirred yoghurt was 15%. Ripe banana
contains prebiotic source that enhance the probiotic lactic acid bacteria. Potassium sorbate is
an effective preservative against yeast and mould count.
Po
pu
lati
on
lo
g C
FU
/g
Storage Period (days)
Without Banana
puree
With Banana puree
Proceedings of the Research Symposium of Uva Wellassa University, January 29-30, 2015
60
References
Environ International Corporation (2000). Generally recognized as safenotification for short
chain fructooligosaccharide. Virginia: Kruger, C.L., <http://www.fda.gov/
ucm/groups/fdagovpublic/@fdagov-foodsgen/documents/document/ucm261587.pdf>
[Accessed 19 June 2014].
Huma, N., Hafeez, K. and Ahmad, I. (2003). Preparation and evaluation of apple stirred
yogurt. Pakistan Journal of Food Science, 13(3-4): 5-9.
Yildiz, F., (2010). Development and Manufacture of yogurt and Other Functional Dairy
Products, 6000 Broken Sound Parkway NW, Suite 300, Boca Raton, FL 33487-2742, CRC
Press.
Proceedings of the Research Symposium of Uva Wellassa University, January 29-30, 2015
61
Quail egg consumption: patterns, preferences and perceptions
among consumers in Galle district, Sri Lanka
H.M.W.N. Abeyrathna
Galle Advanced Technological Institute, Labuduwa, Akmeemana.
Introduction
Owing to the changing life style and food availability, Quail egg is being used as analternate
potential and acceptable egg source in many parts of the world. Regular consumption of quail
eggs helps fight against some diseases such as digestive tract disorders, tuberculosis, asthma,
diabetes and stomach ulcers, strengthen the immune system, promote memory health, increase
brain activity and stabilize the nervous system. Nutritional value of quail eggs is higher than
those offered by other eggs and contain high amount of antioxidants, minerals, and vitamins
and less amount of cholesterol (Tanasornet al.,2013).Compared to chicken eggs, there is a
limited body of scholarly literature in related to consumer behavior of quail eggs. Most
literature to do with quails and their eggs has focused on production and processing issues,
not consumer market studies. Therefore, present study was aimed to determine the quail egg
consumption patterns, preferences and perception among consumers in Galle district, Sri
Lanka.
Methodology
Ten Divisional secretariats (Akmeemana, Ambalangoda, Baddegama, Balapitiya, Bope-
poddala, Elpitiya, Galle four gravates, Habaraduwa, Thawalama and Yakkalamulla) in Galle
districts were purposively selected as the research area. 200 consumers, who toured to local
markets and supermarkets in those areas were purposively selected and
interviewed.Information related to consumers’ age, sex, education, occupation, income,
consumption pattern and attitude towards quail eggs were collected using a pre-tested
questionnaire with havingboth open and closed form questions. Primary data were processed
and analyzed using the Microsoft Office Excel (2003) and SPSS 20 package. The association
between demographic data and egg consumption pattern was tested using chi square, with a
p-value of less than 0.05 considered statistically significant.
Result and Discussion
As to present study produced data it is revealed that majority of the respondents (57%) did not
consumed quail eggs, while 43% consumed. Table 01, shows the relationship between
Proceedings of the Research Symposium of Uva Wellassa University, January 29-30, 2015
62
demographic data with the quail egg consumption. These demographic indices did not
significantly (p>0.05) influence the quail egg consumption, except gender, with female
respondents consuming less eggs. Findings of the study is revealed that purchasing frequency
is not satisfied, because most of the respondents who consume quail eggs (81%) rarely
purchasedeggs every month. Most of them had purchased quail eggs once or twice during the
past year. Findings revealed, quail eggs were not a regular food item in their diet.
Boiled eggs were most preferred (61%) as egg serving method than any other preparations
(Figure 01). This can be expected because of the small size of quail eggs,it is inconvenient to
prepared comparing withother poultry eggs especially chicken eggs. Consumers had
purchased quail eggs from Food Cities (34%), from Farm shops (30%), from grocery stores
(20%) and directly from farms (11%). 5% of consumers had supplied quail eggs by home
production.
When the quail egg consumers were asked about the major factors that limit their consumption
of quail eggs, it was found out that the most common limiting factor was the low of availability
of quail eggs (54%) in the accessible markets, the high price of the quail eggs became the
second factor (23.3%) and less preference of other family members was the third factor
(16.3%).
Variable Frequenc
y
Percentage (%) 2 p-value
Gender (n=200)
Male 119 59.5 9.929 0.002*
Female 81 40.5
Age (Years)(n=200)
Less than 30 47 23.5 0.166 0.920
30-50 121 60.5
>50 32 16
Religion (n=200)
Buddhist 179 89.5 0.998 0.607
Catholic 5 2.5
Islam 16 8
Educational level (n=200)
Below secondary 68 34 5.475 0.065
Secondary 81 40.5
Tertiary 51 25.5
Income (per month) (Rs.)
<20,000 62 31 4.231 0.124
20,000-50,000 102 51
>50,000 36 18
Proceedings of the Research Symposium of Uva Wellassa University, January 29-30, 2015
63
Table 01:Demography and egg consumption among respondents *Relationship with the egg consumption is significant at 0.05 level.
Table 02 revealed that, awareness on the nutritional and health benefits of quail eggs among
the people had significant influenced on egg consumption. Majority of egg consumers had
knowledge that quail eggs are better for asthma and have a low level of cholesterol.
Respondents who did not consume quail eggs mentioned their reasons as follows: a) they are
not used to eat quail eggs as a food (50%), b) do not like the appearance of the egg (17.5%),
c) not available where they usually shop (14.9%) and d) do not like taste and odour of eggs.
Figure 01: Way of preparation of quail eggs for consumption
Table 02: Awareness of nutritional and health benefits of quail eggs among respondents
Consumption of
quail eggs
Awareness about the qualities of
quail eggs 2 p-value
Yes No
Yes 74 12 45.626 <0.0001
No 44 70
It is recommended to keep cholesterol level below 200 mg per day for whom with
cardiovascular diseases, diabetic patients, those with hypercholesterolemia and serious risk
factors and those with a history of familial early atherosclerosis (Cengizhan, 2012). Hence,
there is a potential to increase the quail egg consumption within the society due to its low
level of low density lipoprotein cholesterol ((Polatetet al., 2013; Tanasornet al., 2013).
Egg consumption (n=200)
Yes 86 43
No 114 57
61%
10% 7%0%
22%
0
20
40
60
80
Boiled Half boiled Omlet Bull's eye No exact
Rat
e o
f re
spo
nd
ents
Egg preparation method
Proceedings of the Research Symposium of Uva Wellassa University, January 29-30, 2015
64
Conclusions
Quail egg consumption is low in the society. But there is a potential to enhance it as an
alternative egg source among the people. Effective promotion and advertising campaign about
the nutritional and health benefits for a healthy society should be organized to create well-
informed consumers. As well as quail egg production should be promote to increase the
availability of them.
Acknowledgement
I would like express my thanks to Director General of Sri Lanka Institute of Advanced
Technological Education for approving the research allowance to conduct this study.
References
Cengizhan, M., Ismail, D., Serdar, K. and Sahnur, E.D. (2012).Determination of egg
consumption and consumer habits in Turkey.Turkey journal of Veterinary and Animal
science, 36 (6):592-601.
Polat. E.S., Ozean. BC and garip.M. (2013). Fatty acid composition of yolk of nine poultry
species kept in their natural environment. Animal science papers and reports.3:363-368.
Tanasorn, T., Tungjaroenchai, W and Siriwong.(2013). Nutrient benefits of quail
(CoturnixCoturnix Japonica).International journal of science and research publications,3(5).