Embed Size (px)
Citation preview
C. Cowherd Midwest Research Institute January 9, 2009
Technical Support Document for Mobile Monitoring Technologies
Prepared By: Chatten Cowherd, Ph.D.
Midwest Research Institute (MRI) 425 Volker Boulevard, Kansas City, Missouri 64110-2241
Prepared For: Rodney Langston and Russell S. Merle, Jr.
Clark County Department of Air Quality and Environmental Management (DAQEM) 500 S Grand Central Parkway P.O. Box 555210
Las Vegas, Nevada 89155-5210
January 9, 2009

This page intentionally left blank
C. Cowherd Midwest Research Institute January 9, 2009
1
Technical Support Document for Mobile Monitoring Technologies
In recent years, there has been increasing dissatisfaction with the traditional AP-42 methodology for estimating re-entrained dust emissions from paved road networks for emissions inventory purposes. The AP-42 equation requires on-site characterization of road surface parameters related to dustiness characteristics. Road surface sampling is time-consuming and potentially hazardous because of the need to block traffic lanes. In addition there are serious issues related to the large number of samples required to represent spatial and temporal variations across roadway networks. The Clark County Department of Air Quality and Environmental Management has undertaken a series of field studies to investigate alternative ways of estimating PM10 emissions in the form of surface dust entrained from paved and unpaved roads. A new series of vehicle-mounted monitoring technologies has emerged that provides for much easier representation of spatially distributed roadway emission characteristics, while eliminating the need to divert traffic. A peer review process has been conducted to determine whether the mobile monitoring method (as represented in the current technologies) is a suitable alternative to the traditional AP-42 method for developing road dust emission factors. Seven peer reviewers evaluated the series of Clark County test reports and used their expertise to judge the value of mobile monitoring technologies in relation to the traditional approach for determining paved road dust emission factors. Objective The primary objectives of this technical support document are to demonstrate that: (a) mobile monitoring technologies are equivalent or even superior to the traditional AP-42 methodology for paved road dust emission characterization and (b) the mobile monitoring method should be accepted as an alternative standard method for roadway emission characterization. The items addressed in this document include the following:
• Road dust entrainment dynamics • Current test methods and their limitations
o Road surface characterization coupled with AP-42 emission factor equations
o Roadside plume (exposure) profiling, which was used as the reference method to develop the AP-42 emission factor equations
C. Cowherd Midwest Research Institute January 9, 2009
2
• Demonstrated mobile monitoring technologies o Desert Research Institute (DRI) version o CE-CERT version
• Discussion of the test method evaluation process Dynamics of Road Dust Entrainment
Dust emissions occur whenever vehicles travel over a paved or unpaved surface such as a road or parking lot. Dust emissions consist primarily of entrained surface material from the roadway, although brake and tire wear particles are additional components. On unpaved roads, the entrained dust dominates over the other sources including vehicle exhaust. The remainder of this discussion, however, will focus on paved roads.
In general terms, entrained dust from paved surfaces originates from, and results
in the lift-off of the loose material present on the surface (i.e., the surface loading expressed in terms of mass per area). In turn, the surface loading is continuously replenished by other sources. In industrial areas, surface loading is replenished by spillage of material and track-out from unpaved roads and staging areas. Other contributors to paved road surface loading include granular abrasives for snow and ice control, mud/dirt carryout from construction activities in the area, and deposition from wind and/or water erosion of surrounding unstabilized soils or other aggregate materials.
In the absence of continuous addition of fresh material (through localized track-out or application of antiskid material), the paved road surface loading at a particular location should reach an equilibrium value, such that the amount of material entrained matches the amount replenished. For roads with freely flowing traffic at higher speeds, the equilibrium surface loading is lower than for local roads with lower traffic speeds. In other words, there is an inter-correlation between equilibrium surface loading and average vehicle speed on a given paved road segment.
Whenever the surface dust loading on a paved road is suddenly increased above the equilibrium value, the emission rate also increases sharply. An example would be after spillage of material onto the road surface. Visible dust emissions are often observed when these situations occur. It may take hours to days for the increased loading to return to the equilibrium condition. Similarly, the loading on a paved road may be suddenly decreased by street sweeping, and there is a sharp decrease in emission rate followed by a gradual return to equilibrium. Emission Factor Test Method Summaries The traditional AP-42 method uses emission factor equations with correction parameters that relate to road conditions, as published in USEPA’s “Compilation of Air Pollutant Emission Factors” (AP-42). These emission factor equations were developed
C. Cowherd Midwest Research Institute January 9, 2009
3
from roadside plume profiling of paved roadways in the various standard roadway categories: local, collector, arterial, and freeway. Road surface dust samples were also collected at each profiling test site by edge-to-edge vacuuming of travel lanes. In addition, traffic counts and vehicle categorization data were obtained. The road surface samples were dry sieved to determine the silt (fines) content, to be used as a surrogate for the fine particle dust emission potential of the roadway. Silt, which is defined as particles that pass a 200-mesh screen, is the finest particle size segment that can be separated reliably by conventional dry sieving. The emission factor equations were developed through step-wise regression analysis of the test data. In this process, correction parameters were identified in order of importance, so that emission factors could be adjusted to specific road and traffic conditions. The regression analyses of test data showed that paved road dust emissions depend on the following road and traffic conditions:
• Road surface silt loading o Strong inter-correlation with vehicle speed
• Vehicle weight (fleet average for mixed traffic)
o Inter-correlation with vehicle speed In the AP-42 emission factor equations for paved roadways, the primary correction parameters are the silt loading (mass per pavement area) and the fleet average vehicle weight. Vehicle speed does not appear, because of its inter-correlation with the other two parameters. If vehicle speed were to be used as a correction parameter, there would be no way of accounting for the strong effects of non-equilibrium silt loading conditions which are unrelated to vehicle speed. A good example is track-out from construction sites onto public paved roads, which can produce large increases in road dust emissions. Default values of the silt loading correction parameter for paved roads have been developed for the four identified road categories. The loadings are inversely related to the average daily traffic (ADT) range as represented by the category. For example, local roads have the lowest traffic but the highest loadings. Most inventories are dominated by arterial and collector categories because of relatively large combinations of traffic and loadings. In most efforts to inventory emissions from paved roadway systems, default silt loading values are used in place of actual measurements of silt loading, because of the costs and technical difficulties of silt loading surveys. Road vacuuming to measure actual silt loadings is time consuming, labor intensive, and hazardous. These measurements require road lane blockage and manual vacuuming of full-width lane sections at multiple locations across a road network to assure representativeness. There are obvious safety issues in doing this work, especially on busy roads.
C. Cowherd Midwest Research Institute January 9, 2009
4
Use of default silt loadings in place of a local survey of silt loading values reduces the accuracy of the traditional AP-42 method. Clark County has documented that the rating of the traditional AP-42 method decreases from “A” to “C” when default silt loadings are used. Mobile monitoring is a new alternative emission characterization method for determining road dust emission factors on either paved or unpaved roads. It utilizes a test vehicle that generates and monitors its own dust plume concentration (mass basis) at a fixed sampling probe location. The basic premise is that emission intensity of any given portion of roadway is proportional to the intensity of the dust concentration that is monitored. Typically the dust plume concentration is measured at 1-sec intervals, which correspond to approximately 50 ft of travel at a speed of 35 mph. By traveling over the entire road network in a test vehicle with 1-sec dust plume concentrations and GPS readings, a map of relative emission intensity is generated. Interferences with mobile monitoring can occur as a result of strong ambient winds or along congested roads with a high background dust levels. Ideally the ambient wind speed should be no more than half of the speed of the test vehicle, so that the plume configuration around the test vehicle is relatively stable. In any case, mobile monitoring should not be conducted when ambient wind speeds exceed 15 mph. The interference of background concentrations in the roadway air environment is removed by subtracting the monitored concentration in front of the test vehicle. A calibration factor is needed for each mobile monitoring configuration (test vehicle and sampling system), to convert the relative dust emission intensity to an equivalent emission factor. The type and operating characteristics of the continuous monitor for fine particle concentration (normally PM-10) must be specified. In most reported applications of mobile monitoring, a portable laser photometer (light-scattering device) has been used. It is typically the case that portable continuous particle concentration monitors do not comply with Federal Reference Method (FRM) standards for the specified particle size range (e.g., PM-10). Therefore, a controlled study in a well-mixed chamber must be performed to develop a conversion factor that can be used to adjust the monitor reading to the true particle concentration for the applicable particle size range. Calibration of a mobile monitoring configuration is accomplished by establishing a relationship between the mobile monitor concentration and the equivalent emission rate. Roadside plume flux profiling (traditionally referred to as exposure profiling) is the recognized standard method for calibrating mobile monitoring systems. Three or more test sites (or independent sets of test conditions) should be used for the calibration program, so that a range of road and traffic conditions are represented. At each test site, the paved road should be blocked to normal traffic so that only test vehicle passes are occurring during the calibration procedure.
C. Cowherd Midwest Research Institute January 9, 2009
5
The test roads should have moderate to heavy silt loadings so that a significant concentration increments above ambient background are measured at all plume impact heights on the roadside profiling tower. Ambient wind speeds in the 5 to 10 mph range are ideal because they tend to result in stable wind direction without excessive dilution of the dust plumes. In the calibration tests, multiple test vehicle passes should be accumulated in the calibration factors in order to average for differences in single-pass plume variations that occur because of momentary wind variations. If continuous monitors are used on the roadside profiling tower to provide more measurement sensitivity, it is important that the relationship between the continuous monitor reading and the true concentration is determined. This is best accomplished using a well-mixed environmental chamber where representative test dust is entrained and exposed to the continuous monitor and to FRM samplers for the particle size range of interest. The calibration factor changes with the location of the sampling probe on the outside of the test vehicle. This reflects differences in intensity of the dust plume generated by the test vehicle. For example, the dust plume intensity in the wheel well of a test vehicle is greater than the intensity in the mixed plume behind the vehicle. It is important that the test vehicle body design and weight be specified (vehicle manufacturer, year and model) along with the precise location of the sampling probe(s). Two separate sets of calibration factors have been reported by DRI and CE-CERT. In the DRI mobile monitoring technology, separate probes are located in the front wheel wells of the test vehicle, while in the CE-CERT technology, a single probe is located on a trailer towed behind the test vehicle. In both cases, a background probe is located on the front of the test vehicle. Because the mobile monitor response has been shown to vary directly with the speed of the test vehicle, it is important to perform the calibration tests at documented test vehicle speeds. The calibration factor can incorporate a range of test vehicle speeds that are representative of the paved roadway system in the locality of interest. For example, the calibration factors developed for the DRI and CE-CERT mobile monitors represent a normal speed range for paved roads (25 to 45 mph), excluding periods of traffic congestion. It should be noted that 10 mph is regarded as the threshold vehicle speed below which traffic-entrained dust emissions are negligible. To the extent possible, the speed of the calibrated mobile monitoring test vehicle should be restricted to the value or range of values for which the calibration was developed. However, mobile monitoring data may be collected outside of the calibrated speed range but with somewhat less reliability unless supplementary data on speed applicability of a calibration can be used to demonstrate that the full reliability applies. For example, in the case of the mobile monitoring technologies demonstrated in the Clark County study, the monitors were calibrated over a speed range of 25 mph to 45 mph, but monitoring over a speed range of 10 mph (the effective dust entrainment threshold) to 60 mph will still provide useful data.
C. Cowherd Midwest Research Institute January 9, 2009
6
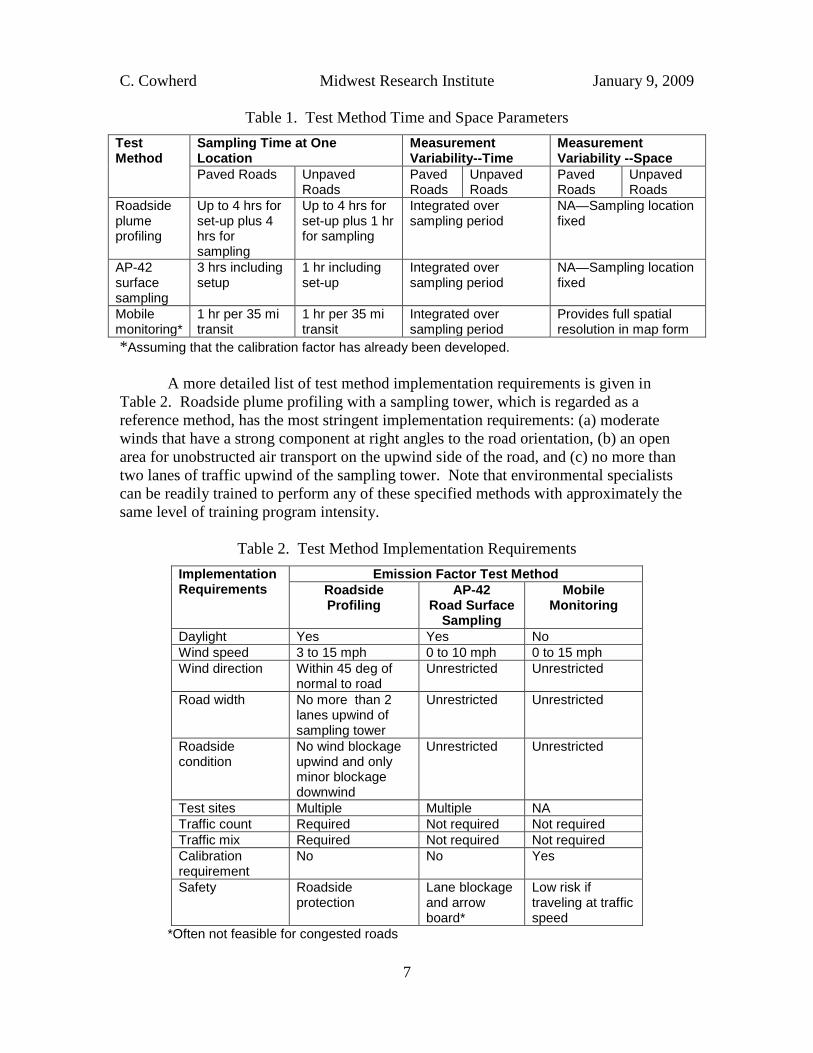
Because the paved road dust emissions are also dependent on the fleet average vehicle weight, it is important that the weight of the test vehicle correspond closely to the fleet average vehicle weight for the application locality. For example, in the Clark County study, the average weight of the test vehicles (2.8 tons) closely matched the fleet average weight for traffic on paved roads (2.3 tons) in the Las Vegas area study location, so no weight correction factor was needed. It should be noted that 2.3 ton fleet average weight is fairly representative of most localities, except for roads such as rural interstate highways heavily traveled by tractor trailers. Any calibration factor developed for a specific test vehicle/sampling configuration should remain valid in different regions of the country, unless (a) the road dust characteristics are markedly different, or (b) the fleet average weight for traffic on paved roads in the study location is different. In either case, a new calibration factor must be developed, unless prior studies have generated test data that can be used to make reliable adjustments to the original calibration factor. A well-mixed dust entrainment chamber can be used to determine whether entrained dust from a new roadway study area is comparable to entrained dust from the locality where the mobile monitor calibration was performed. The chamber should be equipped with approved reference particulate samplers along with the continuous monitor used in the specific mobile monitoring system. When equal amounts of test dust from the original source and the new source are suspended, similar reference concentrations should be obtained and the ratio between the integrated particle monitor reading and the reference method sampler should be consistent. Emission Factor Test Method Comparisons A comparison of method implementation factors (including those that apply to roadside plume flux profiling) is given in Table 1 below. This includes both paved road and unpaved road applications. Mobile monitoring provides for efficient roadway system representation without dealing with difficult issues of selecting fixed point sampling sites. Although mobile monitoring method does require calibration against the roadside profiling reference method, there is no need to repeat the calibration if the mobile monitoring configuration (test vehicle, on-board monitoring system and probe location) remains intact. Exceptions would occur (a) if the road dust characteristics in the study area are significantly different from those where the calibration factor was determined, or (b) if the fleet average vehicle weight in the study area is significantly different from the weight of the test vehicle.
C. Cowherd Midwest Research Institute January 9, 2009
7
Table 1. Test Method Time and Space Parameters Test Method
Sampling Time at One Location
Measurement Variability--Time
Measurement Variability --Space
Paved Roads Unpaved Roads
Paved Roads
Unpaved Roads
Paved Roads
Unpaved Roads
Roadside plume profiling
Up to 4 hrs for set-up plus 4 hrs for sampling
Up to 4 hrs for set-up plus 1 hr for sampling
Integrated over sampling period
NA—Sampling location fixed
AP-42 surface sampling
3 hrs including setup
1 hr including set-up
Integrated over sampling period
NA—Sampling location fixed
Mobile monitoring*
1 hr per 35 mi transit
1 hr per 35 mi transit
Integrated over sampling period
Provides full spatial resolution in map form
*Assuming that the calibration factor has already been developed. A more detailed list of test method implementation requirements is given in Table 2. Roadside plume profiling with a sampling tower, which is regarded as a reference method, has the most stringent implementation requirements: (a) moderate winds that have a strong component at right angles to the road orientation, (b) an open area for unobstructed air transport on the upwind side of the road, and (c) no more than two lanes of traffic upwind of the sampling tower. Note that environmental specialists can be readily trained to perform any of these specified methods with approximately the same level of training program intensity.
Table 2. Test Method Implementation Requirements Implementation Requirements
Emission Factor Test Method Roadside Profiling
AP-42 Road Surface
Sampling
Mobile Monitoring
Daylight Yes Yes No Wind speed 3 to 15 mph 0 to 10 mph 0 to 15 mph Wind direction Within 45 deg of
normal to road Unrestricted Unrestricted
Road width No more than 2 lanes upwind of sampling tower
Unrestricted Unrestricted
Roadside condition
No wind blockage upwind and only minor blockage downwind
Unrestricted Unrestricted
Test sites Multiple Multiple NA Traffic count Required Not required Not required Traffic mix Required Not required Not required Calibration requirement
No No
Yes
Safety Roadside protection
Lane blockage and arrow board*
Low risk if traveling at traffic speed
*Often not feasible for congested roads
C. Cowherd Midwest Research Institute January 9, 2009
8
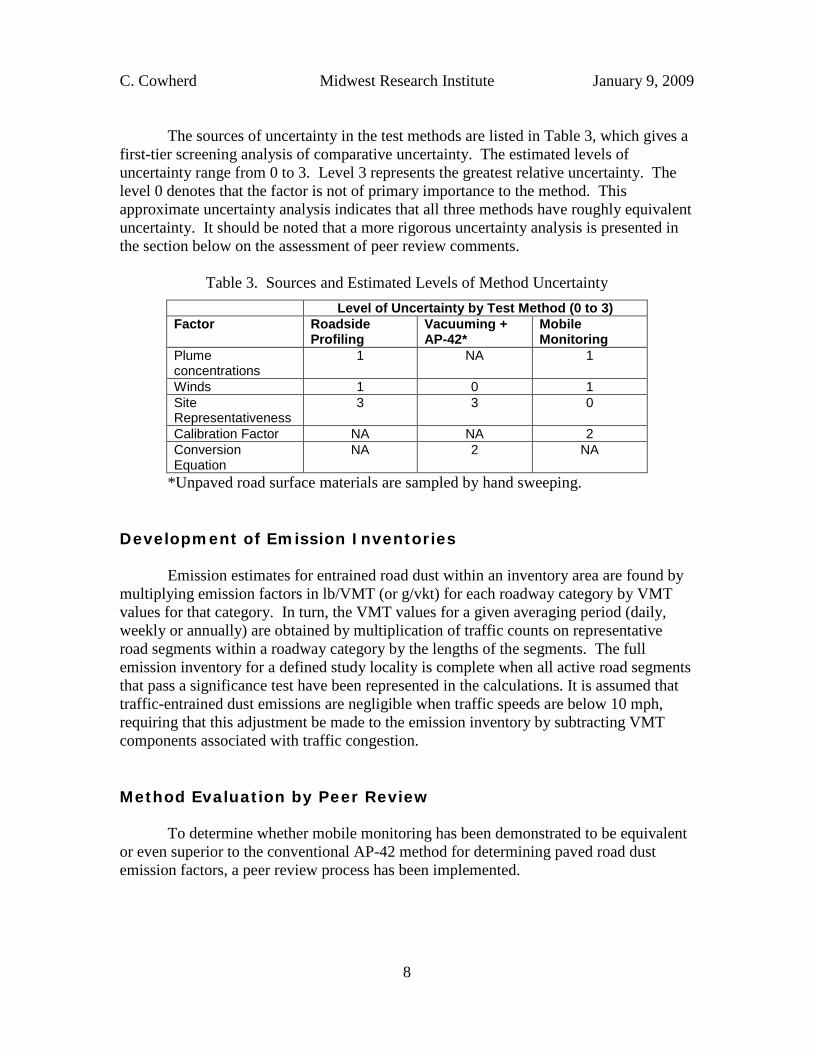
The sources of uncertainty in the test methods are listed in Table 3, which gives a first-tier screening analysis of comparative uncertainty. The estimated levels of uncertainty range from 0 to 3. Level 3 represents the greatest relative uncertainty. The level 0 denotes that the factor is not of primary importance to the method. This approximate uncertainty analysis indicates that all three methods have roughly equivalent uncertainty. It should be noted that a more rigorous uncertainty analysis is presented in the section below on the assessment of peer review comments.
Table 3. Sources and Estimated Levels of Method Uncertainty Level of Uncertainty by Test Method (0 to 3) Factor Roadside
Profiling Vacuuming + AP-42*
Mobile Monitoring
Plume concentrations
1 NA 1
Winds 1 0 1 Site Representativeness
3 3 0
Calibration Factor NA NA 2 Conversion Equation
NA 2 NA
*Unpaved road surface materials are sampled by hand sweeping. Development of Emission Inventories
Emission estimates for entrained road dust within an inventory area are found by multiplying emission factors in lb/VMT (or g/vkt) for each roadway category by VMT values for that category. In turn, the VMT values for a given averaging period (daily, weekly or annually) are obtained by multiplication of traffic counts on representative road segments within a roadway category by the lengths of the segments. The full emission inventory for a defined study locality is complete when all active road segments that pass a significance test have been represented in the calculations. It is assumed that traffic-entrained dust emissions are negligible when traffic speeds are below 10 mph, requiring that this adjustment be made to the emission inventory by subtracting VMT components associated with traffic congestion. Method Evaluation by Peer Review
To determine whether mobile monitoring has been demonstrated to be equivalent
or even superior to the conventional AP-42 method for determining paved road dust emission factors, a peer review process has been implemented.

C. Cowherd Midwest Research Institute January 9, 2009
9
Name Affiliation Arthur, Cathy Maricopa AG Fransioli, Paul J3AQM Goss, Tracy Laybourn, Mike
South Coast AQMD
Inouye, Daniel Washoe Co. Health Dist.
Ono, Duane Great Basin UAPCD
Pienta, Walter NY DEC Withycombe, Earl CARB
The most important aspect of this peer review was the evaluation of mobile
monitoring technologies in terms of the requirements for method standardization. In considering whether mobile monitoring has the potential for approval as a standard method, the peer reviewers were asked to consider its characteristics in three specific areas:
• Physical description • Performance specifications • Measurement comparisons
EPA uses the following specific criteria when evaluating a new method, so the peer reviewers were asked these questions:
• Is there a need for the intended scope and application of the method? • Will the submitted method generate data consistent with the intended scope and
application of the method? • Have appropriate quality control procedures been developed for this method? • Is the method described in sufficient detail for an independent investigator to
implement it? • Has this method been shown to be equivalent to a standard reference method? • How is this method superior/inferior to the established reference method?
The peer reviewers were asked to consider the following specific factors in evaluating mobile monitoring in comparison with the traditional AP-42 method:
o Scope of application (required labor, training, equipment, materials) o Mitigation of safety hazards o Weather restrictions on testing (winds, temperature) o Site restrictions on testing o Measurement system availability in terms of off-the-shelf components o Interferences (background concentrations in relation to plume concentrations) o Measurement repeatability o Data analysis requirements o Quality control requirements
C. Cowherd Midwest Research Institute January 9, 2009
10
The ultimate objective of the review was to determine whether mobile monitoring technologies are suitable as an alternative to the standard AP-42 method for determining
PM10 emission factors for paved roads.
In each assessment, the reviewer was asked to evaluate the following aspects of the specified mobile monitoring technologies in relation to the standard AP-42 method (road surface sampling plus emission factor equation application):
• Equivalency in determining road dust PM10 emission factors at specific locations within a roadway system
• Capability to represent distributed roadway types and traffic conditions that dominate emissions within an air quality control area
• Ease of use/safety considerations • Executability with commercial off-the-shelf components
An ftp site at Midwest Research Institute was set up to provide the peer reviewers access to the study documents. The following documents were accessible through the ftp site.
• Main Report (Phase IV of the Clark County Test Series) o Executive Summary o Main body of Report o Glossary
• Appendix A: Data Tables • Appendix B: Study Design • Appendix C: Phase II Report • Appendix D: Phase III Report • Appendix E: Example Calculations
The form to be completed for the method evaluation by peer reviewers is included
as Attachment A. Dr. Chatten Cowherd of Midwest Research Institute administered the peer review process as an independent investigator with experience in this field. Assessment of Peer Review Comments
The results of the peer review process in terms of the completed method evaluation forms are presented in Appendix B. The reviewers generally agreed that the mobile monitoring method is superior to the traditional AP-42 method. However, there were some concerns about (a) clearly specifying the method implementation procedures and (b) evaluating method uncertainties.
Several of the review comments called for greater specification of method requirements going forward, indicating how the mobile monitoring method can be implemented in a study area where the method had not previously been used. In anticipation of these concerns, plans had already been made to prepare a separate
C. Cowherd Midwest Research Institute January 9, 2009
11
document on Mobile Monitoring Method Specifications
The method specifications document will address the following items mentioned in the peer reviews:
as a final step in the desired standardization process.
• Provide a protocol summarizing how the method should be implemented in an area that has not been previously tested against tower flux measurements.
• Address the applicability limits of the calibration factor assigned to each specific test vehicle configuration regarding future use.
• Provide criteria for deciding the need to adjust calibration factors to local road dust particle size characteristics that may differ significantly from those found in the locations where the original calibrations were performed.
• Specify the acceptable test vehicle speed range in relation to value or range of values for which the calibration was developed.
• Discuss roadway traffic speed as a function of roadway class, which is commonly used to differentiate road dust emission factors.
• Define a specific upper limit to wind speed under which mobile monitoring can be implemented.
• Address the general availability of commercial PM samplers that meet the necessary requirements.
• Provide a general description of the data acquisition software that is needed to implement the method.
• Provide general descriptions of the qualifications of persons who might develop new configurations for mobile monitoring.
• Include recommended QA procedures in a final test method description. • Provide a more rigorous data validation procedure for calibrating and
implementing the mobile monitoring method. • Describe step-by-step method implementation and expected outcomes in
comparison with traditional methods, including uncertainty analysis. • Identify the weather and traffic conditions under which mobile monitoring should
not be performed. • Address the potential variations of fleet average vehicle weight across roadway
classifications. • Explain the relationship between the mobile monitoring method and the
traditional AP-42 silt-based method for calculating road dust emission factors, recognizing that both methods are tied to plume flux profiling as a reference standard.
The other major area of concern was the uncertainty of the mobile monitoring method, in comparison the traditional AP-42 method.
The Clark County field tests of mobile monitoring focused around two mobile monitoring systems. The two systems used in evaluating the method were the TRAKER (Testing Re-entrained Aerosol Kinetic Emissions from Roads) system developed by Desert
C. Cowherd Midwest Research Institute January 9, 2009
12
Research Institute and the SCAMPER (System of Continuous Aerosol Monitoring of Particulate Emissions from Roadways) developed by University of California-Riverside.
The primary source of uncertainty in the mobile monitoring method is the calibration factor for the specific test vehicle/sampling system configuration. In the case of the TRAKER and SCAMPER units, the linear relationships between mobile monitor concentrations and the roadside emission factors had R2 values in the range of 0.5 to 0.75, where R is the correlation coefficient and.R2 is a measure of the portion of the variance that is explained by the relationship.
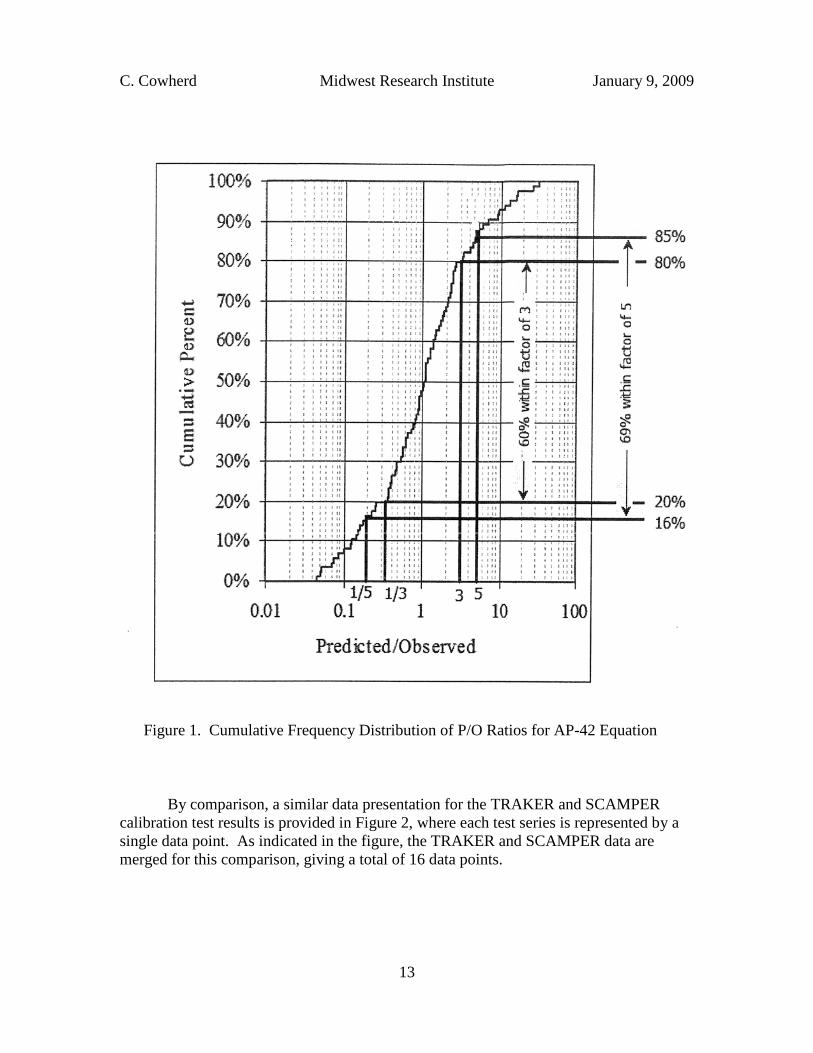
In order to compare the uncertainties in the traditional AP-42 method and the mobile monitoring method as implemented in the Las Vegas Valley, the scatter of the test points about the predictive relationship was evaluated. Figure 1 gives the cumulative frequency distribution of the ratios of predicted to observed (P/O) emission factors from the 86-point field test data set used in developing the AP-42 emission factor equation for paved roads. For example, the figure shows that for 60 % of field tests, predicted emission factors lie within a factor of 3 of the observed (measured) values.
C. Cowherd Midwest Research Institute January 9, 2009
13
Figure 1. Cumulative Frequency Distribution of P/O Ratios for AP-42 Equation
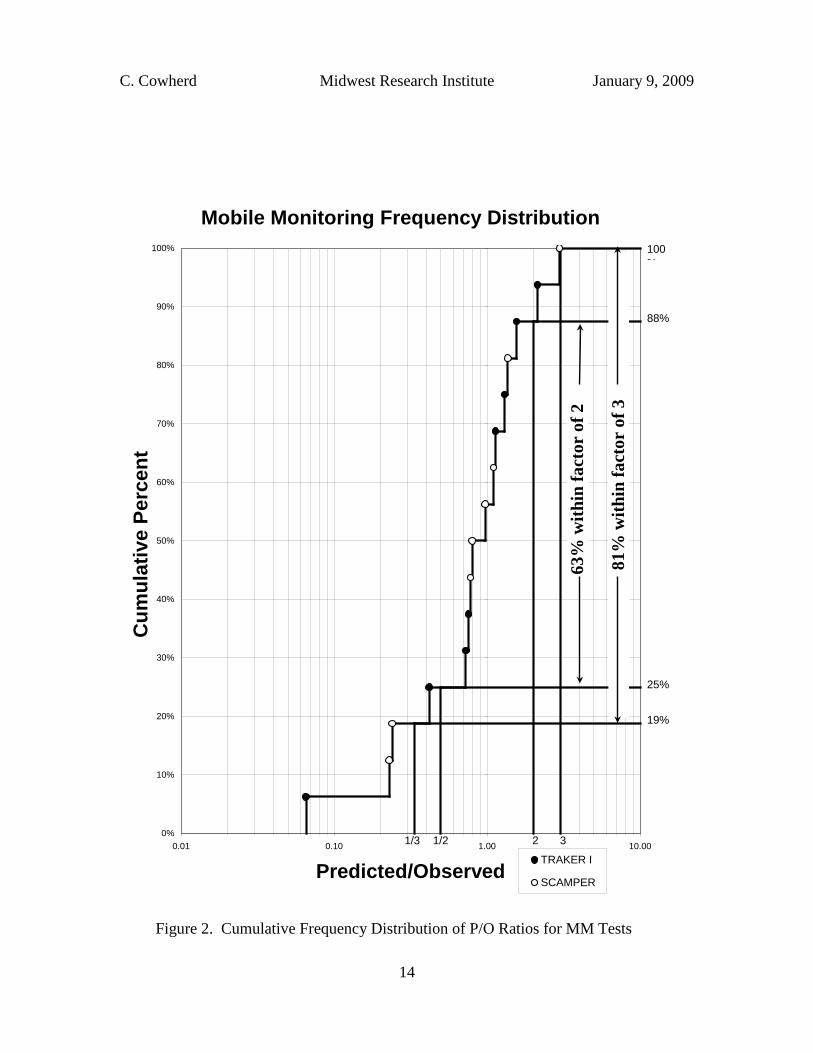
By comparison, a similar data presentation for the TRAKER and SCAMPER calibration test results is provided in Figure 2, where each test series is represented by a single data point. As indicated in the figure, the TRAKER and SCAMPER data are merged for this comparison, giving a total of 16 data points.
C. Cowherd Midwest Research Institute January 9, 2009
14
Mobile Monitoring Frequency Distribution
0%
10%
20%
30%
40%
50%
60%
70%
80%
90%
100%
0.01 0.10 1.00 10.00
Predicted/Observed
Cum
ulat
ive
Perc
ent
TRAKER I
SCAMPER
1/3 1/2 2 3
100%
88%
25%
19%
63%
with
in fa
ctor
of 2
81%
with
in fa
ctor
of 3
Figure 2. Cumulative Frequency Distribution of P/O Ratios for MM Tests
C. Cowherd Midwest Research Institute January 9, 2009
15
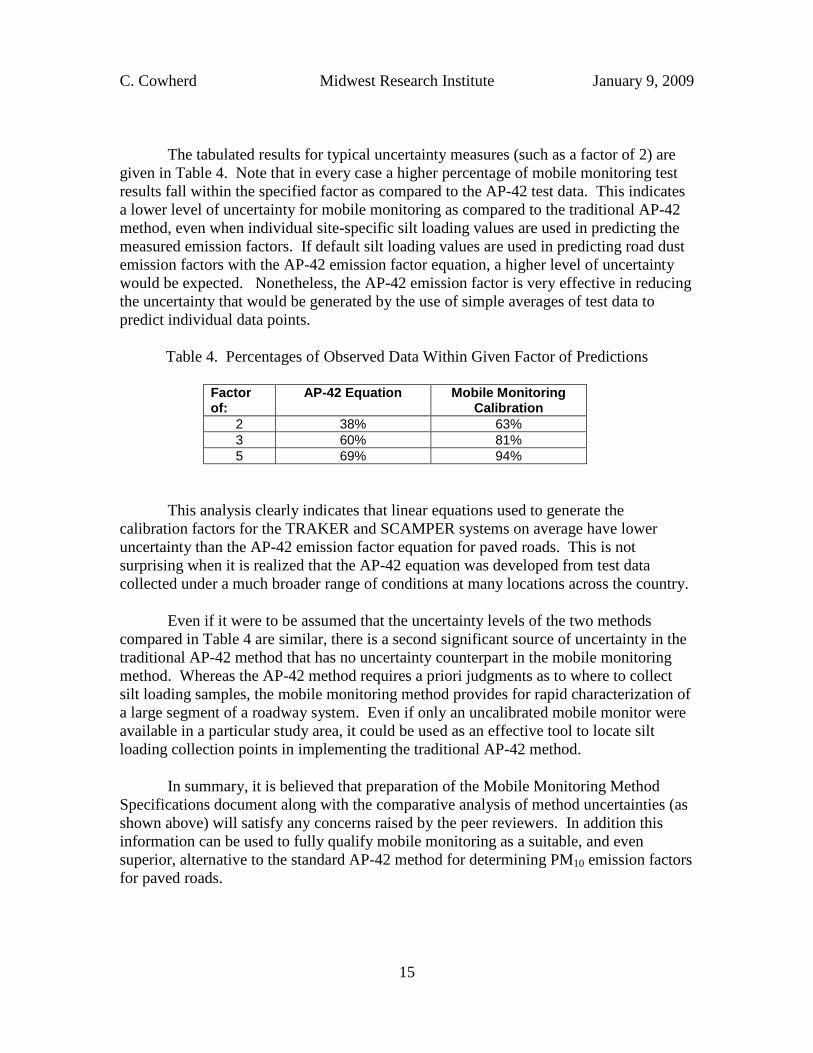
The tabulated results for typical uncertainty measures (such as a factor of 2) are given in Table 4. Note that in every case a higher percentage of mobile monitoring test results fall within the specified factor as compared to the AP-42 test data. This indicates a lower level of uncertainty for mobile monitoring as compared to the traditional AP-42 method, even when individual site-specific silt loading values are used in predicting the measured emission factors. If default silt loading values are used in predicting road dust emission factors with the AP-42 emission factor equation, a higher level of uncertainty would be expected. Nonetheless, the AP-42 emission factor is very effective in reducing the uncertainty that would be generated by the use of simple averages of test data to predict individual data points.
Table 4. Percentages of Observed Data Within Given Factor of Predictions
Factor of:
AP-42 Equation Mobile Monitoring Calibration
2 38% 63% 3 60% 81% 5 69% 94%
This analysis clearly indicates that linear equations used to generate the calibration factors for the TRAKER and SCAMPER systems on average have lower uncertainty than the AP-42 emission factor equation for paved roads. This is not surprising when it is realized that the AP-42 equation was developed from test data collected under a much broader range of conditions at many locations across the country.
Even if it were to be assumed that the uncertainty levels of the two methods compared in Table 4 are similar, there is a second significant source of uncertainty in the traditional AP-42 method that has no uncertainty counterpart in the mobile monitoring method. Whereas the AP-42 method requires a priori judgments as to where to collect silt loading samples, the mobile monitoring method provides for rapid characterization of a large segment of a roadway system. Even if only an uncalibrated mobile monitor were available in a particular study area, it could be used as an effective tool to locate silt loading collection points in implementing the traditional AP-42 method.
In summary, it is believed that preparation of the Mobile Monitoring Method Specifications document along with the comparative analysis of method uncertainties (as shown above) will satisfy any concerns raised by the peer reviewers. In addition this information can be used to fully qualify mobile monitoring as a suitable, and even superior, alternative to the standard AP-42 method for determining PM10 emission factors for paved roads.
C. Cowherd Midwest Research Institute January 9, 2009
16
Bibliography 1. Countess Environmental, 2006. WRAP Fugitive Dust Handbook. WGA Contract No.
30204-111. 2. USEPA, 2006. Compilation of Air Pollutant Emission Factors, Volume I: Stationary and
Area Sources, Research Triangle Park, NC. 3. Guidance for Mobile 6.2: http://www.epa.gov/EPA-AIR/2004/May/Day-19/a11340.htm
4. Teng, H., Kwigizile, V., Moses, K., James, D., Etyemezian, V., 2008. Investigation of the
AP-42 Sampling Method. Journal of the Air & Waste Management Association, Vol. 58, 6/2008.
5. Assessment and Standards Division; Office of Transportation and Air Quality; U.S. EPA,
2005. EPA’s National Mobile Inventory Model (NMIM), A Consolidated Emissions Modeling System for MOBILE6 and NONROAD. EPA420-R-05-024.
6. Langston, R., Merle, R. Jr., Etyemezian, V., Kuhns, H., Gillies, J., Dongzi, Z., Fitz, D.,
Bumiller, K., James, D., Teng, H., 2008. Clark County (Nevada) Paved Road Dust Emission Studies in Support of Mobile Monitoring Technologies. Final Report. December 2008.
7. Nevada Department of Transportation. “Total AVMTs by County and Functional Class,”
2006. http://www.nevadadot.com/reports_pubs/miles_of_travel/pdfs/2006/2006_page3_6.pdf
8. California Air Resources Board Emission Inventory Methodology:
http://www.arb.ca.gov/ei/ei.htm 9. Teng, H., Kwigizile, V., James, D., Merle, R., 2007. Identifying Influencing Factors on
Paved Roads Silt Loading. Journal of the Air & Waste Management Association, Vol. 57, 7/2007. 778-784.
10. Cowherd, C. Jr., 2008. Mobile Versus Fixed Point Monitoring of Dust Emissions from
Paved Road Networks. Presented at the Annual Meeting of the Air and Waste Management Association, Portland OR.
11. Fitz, Dennis R (2005). Draft Final Report, Measurements of PM10 Emission Factors
from Paved Roads in Clark County, NV, Prepared for Clark County Department of Air Quality Management’s Roadway Dust Sampling Evaluation Phase II.
12. C. Cowherd, Jr., et al., Improved Activity Levels for National Emission Inventories of
Fugitive Dust from Paved and Unpaved Roads, Presented at the 11th International Emission Inventory Conference, Atlanta, Georgia, April 2002
C. Cowherd Midwest Research Institute January 9, 2009
A-1
Attachment A: Method Evaluation Form
Evaluation of Mobile Monitoring Technologies in Comparison with the Traditional AP-42 Methodology for Paved Road Emission Inventories
Submitted by _______________________________ Date____________ Qualifications attached (initial): ________________ Please address the following questions in performing your evaluation of the mobile monitoring method. Add as much space as necessary in presenting your response to each question.
1. Identify your impression of the intended scope and application of the proposed mobile monitoring method. (What is the method supposed to accomplish?)
2. Is there a regulatory need for the intended scope and application of the method?
3. Will the submitted method generate data consistent with the intended scope and application of the method?
4. Is the method described in sufficient detail for an independent investigator to implement it?

C. Cowherd Midwest Research Institute January 9, 2009
A-2
5. Can the method be implemented with commercially available off-the-shelf components?
6. Have appropriate quality control procedures been developed for this method?
7. Has this method been shown to be equivalent to a standard reference method? If so, what are the limits of applicability of the calibration factors that have been developed for the mobile monitoring method?
8. How is this method superior/inferior to the traditional AP-42 emission factor test method? What are the limits of applicability of the mobile monitoring method?
9. Other comments:
C. Cowherd Midwest Research Institute January 9, 2009
B-1
Attachment B: Comment/Response Log for Peer Review of Clark County’s Road Dust Emission Studies in Support of Mobile Monitoring Technologies
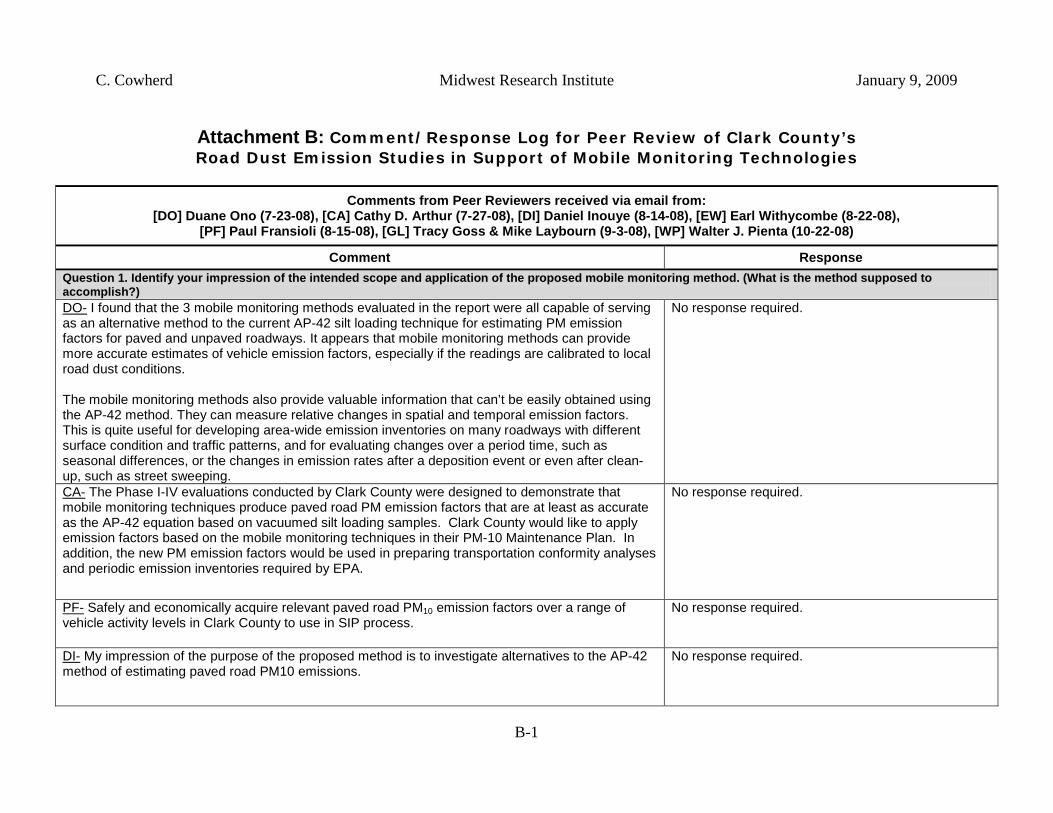
Comments from Peer Reviewers received via email from:
[DO] Duane Ono (7-23-08), [CA] Cathy D. Arthur (7-27-08), [DI] Daniel Inouye (8-14-08), [EW] Earl Withycombe (8-22-08), [PF] Paul Fransioli (8-15-08), [GL] Tracy Goss & Mike Laybourn (9-3-08), [WP] Walter J. Pienta (10-22-08)
Comment Response Question 1. Identify your impression of the intended scope and application of the proposed mobile monitoring method. (What is the method supposed to accomplish?) DO-
I found that the 3 mobile monitoring methods evaluated in the report were all capable of serving as an alternative method to the current AP-42 silt loading technique for estimating PM emission factors for paved and unpaved roadways. It appears that mobile monitoring methods can provide more accurate estimates of vehicle emission factors, especially if the readings are calibrated to local road dust conditions.
The mobile monitoring methods also provide valuable information that can’t be easily obtained using the AP-42 method. They can measure relative changes in spatial and temporal emission factors. This is quite useful for developing area-wide emission inventories on many roadways with different surface condition and traffic patterns, and for evaluating changes over a period time, such as seasonal differences, or the changes in emission rates after a deposition event or even after clean-up, such as street sweeping.
No response required.
CA- No response required. The Phase I-IV evaluations conducted by Clark County were designed to demonstrate that mobile monitoring techniques produce paved road PM emission factors that are at least as accurate as the AP-42 equation based on vacuumed silt loading samples. Clark County would like to apply emission factors based on the mobile monitoring techniques in their PM-10 Maintenance Plan. In addition, the new PM emission factors would be used in preparing transportation conformity analyses and periodic emission inventories required by EPA.
PF- No response required. Safely and economically acquire relevant paved road PM10 emission factors over a range of vehicle activity levels in Clark County to use in SIP process.
DI- No response required. My impression of the purpose of the proposed method is to investigate alternatives to the AP-42 method of estimating paved road PM10 emissions.
C. Cowherd Midwest Research Institute January 9, 2009
B-2
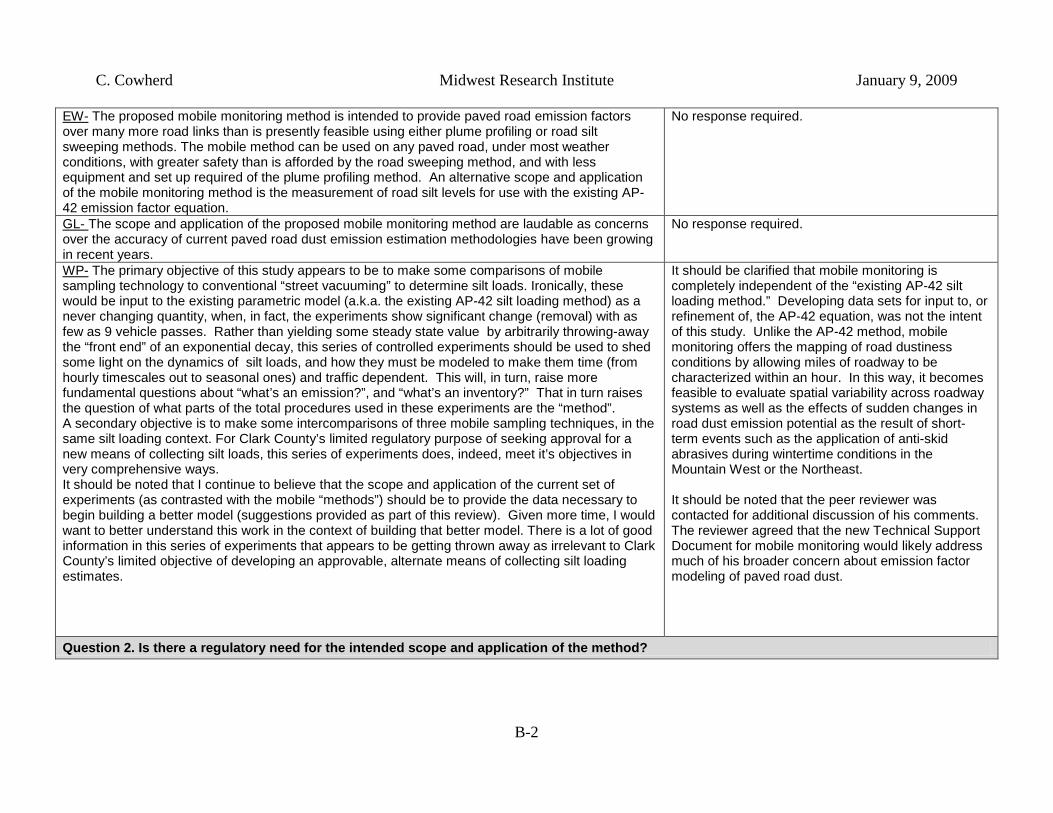
EW- No response required. The proposed mobile monitoring method is intended to provide paved road emission factors over many more road links than is presently feasible using either plume profiling or road silt sweeping methods. The mobile method can be used on any paved road, under most weather conditions, with greater safety than is afforded by the road sweeping method, and with less equipment and set up required of the plume profiling method. An alternative scope and application of the mobile monitoring method is the measurement of road silt levels for use with the existing AP-42 emission factor equation. GL- No response required. The scope and application of the proposed mobile monitoring method are laudable as concerns over the accuracy of current paved road dust emission estimation methodologies have been growing in recent years. WP-
A secondary objective is to make some intercomparisons of three mobile sampling techniques, in the same silt loading context. For Clark County’s limited regulatory purpose of seeking approval for a new means of collecting silt loads, this series of experiments does, indeed, meet it’s objectives in very comprehensive ways.
The primary objective of this study appears to be to make some comparisons of mobile sampling technology to conventional “street vacuuming” to determine silt loads. Ironically, these would be input to the existing parametric model (a.k.a. the existing AP-42 silt loading method) as a never changing quantity, when, in fact, the experiments show significant change (removal) with as few as 9 vehicle passes. Rather than yielding some steady state value by arbitrarily throwing-away the “front end” of an exponential decay, this series of controlled experiments should be used to shed some light on the dynamics of silt loads, and how they must be modeled to make them time (from hourly timescales out to seasonal ones) and traffic dependent. This will, in turn, raise more fundamental questions about “what’s an emission?”, and “what’s an inventory?” That in turn raises the question of what parts of the total procedures used in these experiments are the “method”.
It should be noted that I continue to believe that the scope and application of the current set of experiments (as contrasted with the mobile “methods”) should be to provide the data necessary to begin building a better model (suggestions provided as part of this review). Given more time, I would want to better understand this work in the context of building that better model. There is a lot of good information in this series of experiments that appears to be getting thrown away as irrelevant to Clark County’s limited objective of developing an approvable, alternate means of collecting silt loading estimates.
It should be clarified that mobile monitoring is completely independent of the “existing AP-42 silt loading method.” Developing data sets for input to, or refinement of, the AP-42 equation, was not the intent of this study. Unlike the AP-42 method, mobile monitoring offers the mapping of road dustiness conditions by allowing miles of roadway to be characterized within an hour. In this way, it becomes feasible to evaluate spatial variability across roadway systems as well as the effects of sudden changes in road dust emission potential as the result of short-term events such as the application of anti-skid abrasives during wintertime conditions in the Mountain West or the Northeast. It should be noted that the peer reviewer was contacted for additional discussion of his comments. The reviewer agreed that the new Technical Support Document for mobile monitoring would likely address much of his broader concern about emission factor modeling of paved road dust.
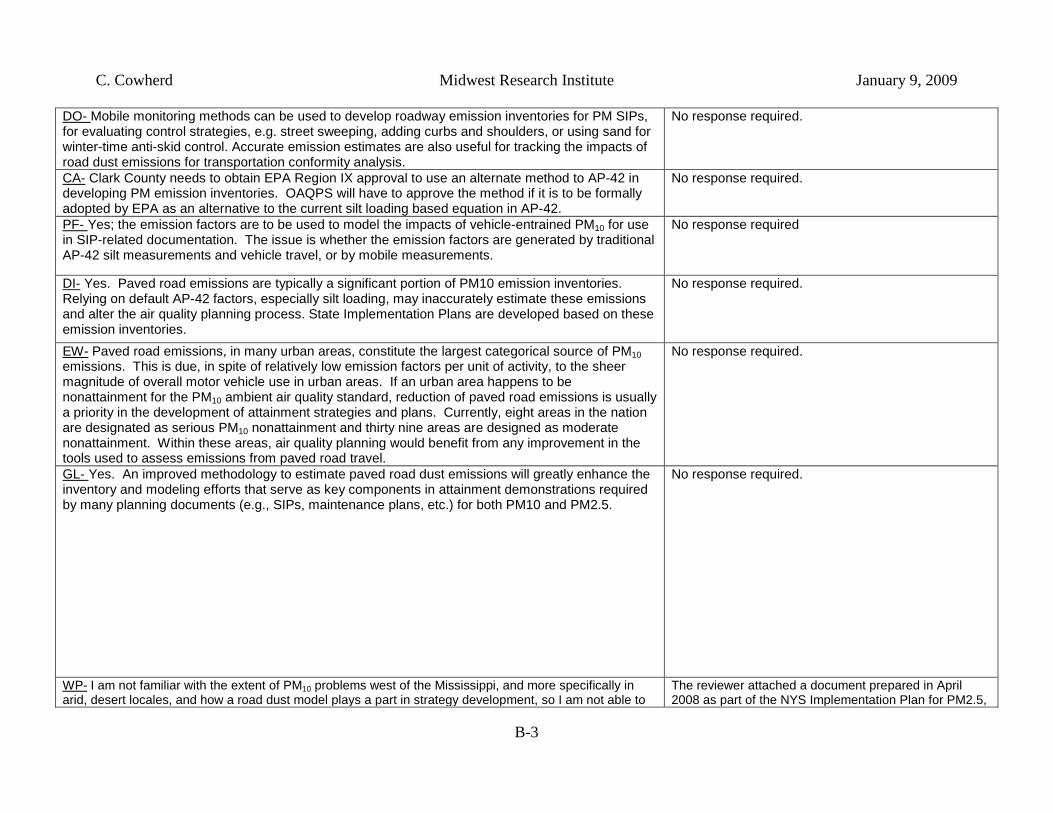
Question 2. Is there a regulatory need for the intended scope and application of the method?
C. Cowherd Midwest Research Institute January 9, 2009
B-3
DO- No response required. Mobile monitoring methods can be used to develop roadway emission inventories for PM SIPs, for evaluating control strategies, e.g. street sweeping, adding curbs and shoulders, or using sand for winter-time anti-skid control. Accurate emission estimates are also useful for tracking the impacts of road dust emissions for transportation conformity analysis. CA- No response required. Clark County needs to obtain EPA Region IX approval to use an alternate method to AP-42 in developing PM emission inventories. OAQPS will have to approve the method if it is to be formally adopted by EPA as an alternative to the current silt loading based equation in AP-42. PF- No response required Yes; the emission factors are to be used to model the impacts of vehicle-entrained PM10 for use in SIP-related documentation. The issue is whether the emission factors are generated by traditional AP-42 silt measurements and vehicle travel, or by mobile measurements.
DI- No response required. Yes. Paved road emissions are typically a significant portion of PM10 emission inventories. Relying on default AP-42 factors, especially silt loading, may inaccurately estimate these emissions and alter the air quality planning process. State Implementation Plans are developed based on these emission inventories. EW- No response required. Paved road emissions, in many urban areas, constitute the largest categorical source of PM10 emissions. This is due, in spite of relatively low emission factors per unit of activity, to the sheer magnitude of overall motor vehicle use in urban areas. If an urban area happens to be nonattainment for the PM10 ambient air quality standard, reduction of paved road emissions is usually a priority in the development of attainment strategies and plans. Currently, eight areas in the nation are designated as serious PM10 nonattainment and thirty nine areas are designed as moderate nonattainment. Within these areas, air quality planning would benefit from any improvement in the tools used to assess emissions from paved road travel. GL- No response required. Yes. An improved methodology to estimate paved road dust emissions will greatly enhance the inventory and modeling efforts that serve as key components in attainment demonstrations required by many planning documents (e.g., SIPs, maintenance plans, etc.) for both PM10 and PM2.5.
WP- The reviewer attached a document prepared in April 2008 as part of the NYS Implementation Plan for PM2.5,
I am not familiar with the extent of PM10 problems west of the Mississippi, and more specifically in arid, desert locales, and how a road dust model plays a part in strategy development, so I am not able to
C. Cowherd Midwest Research Institute January 9, 2009
B-4
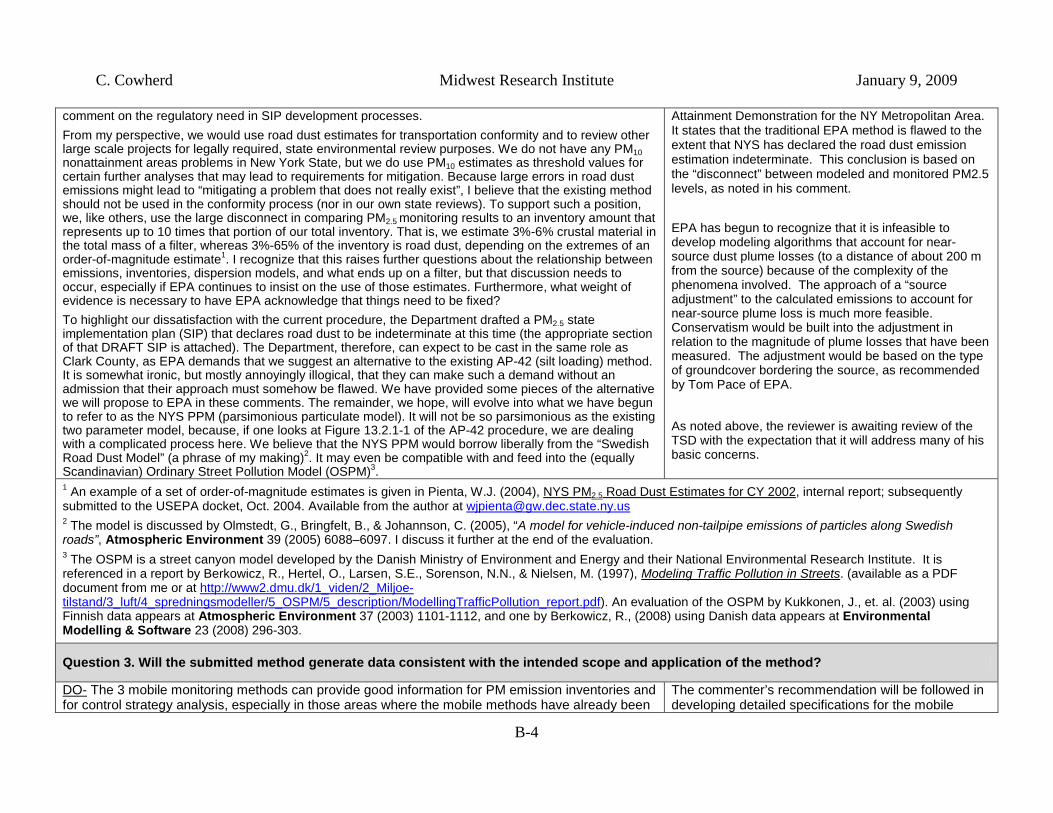
comment on the regulatory need in SIP development processes. From my perspective, we would use road dust estimates for transportation conformity and to review other large scale projects for legally required, state environmental review purposes. We do not have any PM10 nonattainment areas problems in New York State, but we do use PM10 estimates as threshold values for certain further analyses that may lead to requirements for mitigation. Because large errors in road dust emissions might lead to “mitigating a problem that does not really exist”, I believe that the existing method should not be used in the conformity process (nor in our own state reviews). To support such a position, we, like others, use the large disconnect in comparing PM2.5 monitoring results to an inventory amount that represents up to 10 times that portion of our total inventory. That is, we estimate 3%-6% crustal material in the total mass of a filter, whereas 3%-65% of the inventory is road dust, depending on the extremes of an order-of-magnitude estimate1. I recognize that this raises further questions about the relationship between emissions, inventories, dispersion models, and what ends up on a filter, but that discussion needs to occur, especially if EPA continues to insist on the use of those estimates. Furthermore, what weight of evidence is necessary to have EPA acknowledge that things need to be fixed? To highlight our dissatisfaction with the current procedure, the Department drafted a PM2.5 state implementation plan (SIP) that declares road dust to be indeterminate at this time (the appropriate section of that DRAFT SIP is attached). The Department, therefore, can expect to be cast in the same role as Clark County, as EPA demands that we suggest an alternative to the existing AP-42 (silt loading) method. It is somewhat ironic, but mostly annoyingly illogical, that they can make such a demand without an admission that their approach must somehow be flawed. We have provided some pieces of the alternative we will propose to EPA in these comments. The remainder, we hope, will evolve into what we have begun to refer to as the NYS PPM (parsimonious particulate model). It will not be so parsimonious as the existing two parameter model, because, if one looks at Figure 13.2.1-1 of the AP-42 procedure, we are dealing with a complicated process here. We believe that the NYS PPM would borrow liberally from the “Swedish Road Dust Model” (a phrase of my making)2. It may even be compatible with and feed into the (equally Scandinavian) Ordinary Street Pollution Model (OSPM)3.
Attainment Demonstration for the NY Metropolitan Area. It states that the traditional EPA method is flawed to the extent that NYS has declared the road dust emission estimation indeterminate. This conclusion is based on the “disconnect” between modeled and monitored PM2.5 levels, as noted in his comment. EPA has begun to recognize that it is infeasible to develop modeling algorithms that account for near-source dust plume losses (to a distance of about 200 m from the source) because of the complexity of the phenomena involved. The approach of a “source adjustment” to the calculated emissions to account for near-source plume loss is much more feasible. Conservatism would be built into the adjustment in relation to the magnitude of plume losses that have been measured. The adjustment would be based on the type of groundcover bordering the source, as recommended by Tom Pace of EPA.
As noted above, the reviewer is awaiting review of the TSD with the expectation that it will address many of his basic concerns.
1 An example of a set of order-of-magnitude estimates is given in Pienta, W.J. (2004), NYS PM2.5 Road Dust Estimates for CY [email protected]
, internal report; subsequently submitted to the USEPA docket, Oct. 2004. Available from the author at 2 The model is discussed by Olmstedt, G., Bringfelt, B., & Johannson, C. (2005), “A model for vehicle-induced non-tailpipe emissions of particles along Swedish roads”, Atmospheric Environment 39 (2005) 6088–6097. I discuss it further at the end of the evaluation. 3 The OSPM is a street canyon model developed by the Danish Ministry of Environment and Energy and their National Environmental Research Institute. It is referenced in a report by Berkowicz, R., Hertel, O., Larsen, S.E., Sorenson, N.N., & Nielsen, M. (1997), Modeling Traffic Pollution in Streets
http://www2.dmu.dk/1_viden/2_Miljoe- tilstand/3_luft/4_spredningsmodeller/5_OSPM/5_description/ModellingTrafficPollution_report.pdf
. (available as a PDF document from me or at
). An evaluation of the OSPM by Kukkonen, J., et. al. (2003) using Finnish data appears at Atmospheric Environment 37 (2003) 1101-1112, and one by Berkowicz, R., (2008) using Danish data appears at Environmental Modelling & Software 23 (2008) 296-303.
Question 3. Will the submitted method generate data consistent with the intended scope and application of the method?
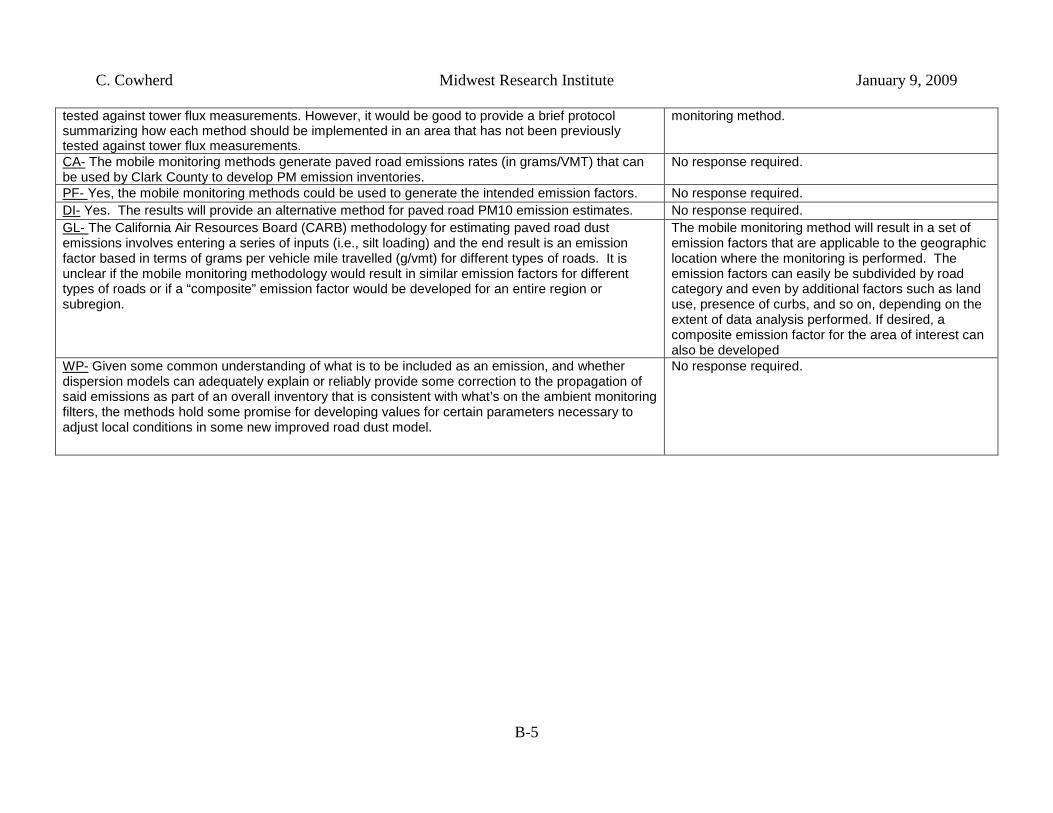
DO- The commenter’s recommendation will be followed in developing detailed specifications for the mobile
The 3 mobile monitoring methods can provide good information for PM emission inventories and for control strategy analysis, especially in those areas where the mobile methods have already been
C. Cowherd Midwest Research Institute January 9, 2009
B-5
tested against tower flux measurements. However, it would be good to provide a brief protocol summarizing how each method should be implemented in an area that has not been previously tested against tower flux measurements.
monitoring method.
CA- No response required. The mobile monitoring methods generate paved road emissions rates (in grams/VMT) that can be used by Clark County to develop PM emission inventories. PF- No response required. Yes, the mobile monitoring methods could be used to generate the intended emission factors. DI- No response required. Yes. The results will provide an alternative method for paved road PM10 emission estimates. GL- The mobile monitoring method will result in a set of
emission factors that are applicable to the geographic location where the monitoring is performed. The emission factors can easily be subdivided by road category and even by additional factors such as land use, presence of curbs, and so on, depending on the extent of data analysis performed. If desired, a composite emission factor for the area of interest can also be developed
The California Air Resources Board (CARB) methodology for estimating paved road dust emissions involves entering a series of inputs (i.e., silt loading) and the end result is an emission factor based in terms of grams per vehicle mile travelled (g/vmt) for different types of roads. It is unclear if the mobile monitoring methodology would result in similar emission factors for different types of roads or if a “composite” emission factor would be developed for an entire region or subregion.
WP- No response required. Given some common understanding of what is to be included as an emission, and whether dispersion models can adequately explain or reliably provide some correction to the propagation of said emissions as part of an overall inventory that is consistent with what’s on the ambient monitoring filters, the methods hold some promise for developing values for certain parameters necessary to adjust local conditions in some new improved road dust model.
C. Cowherd Midwest Research Institute January 9, 2009
B-6
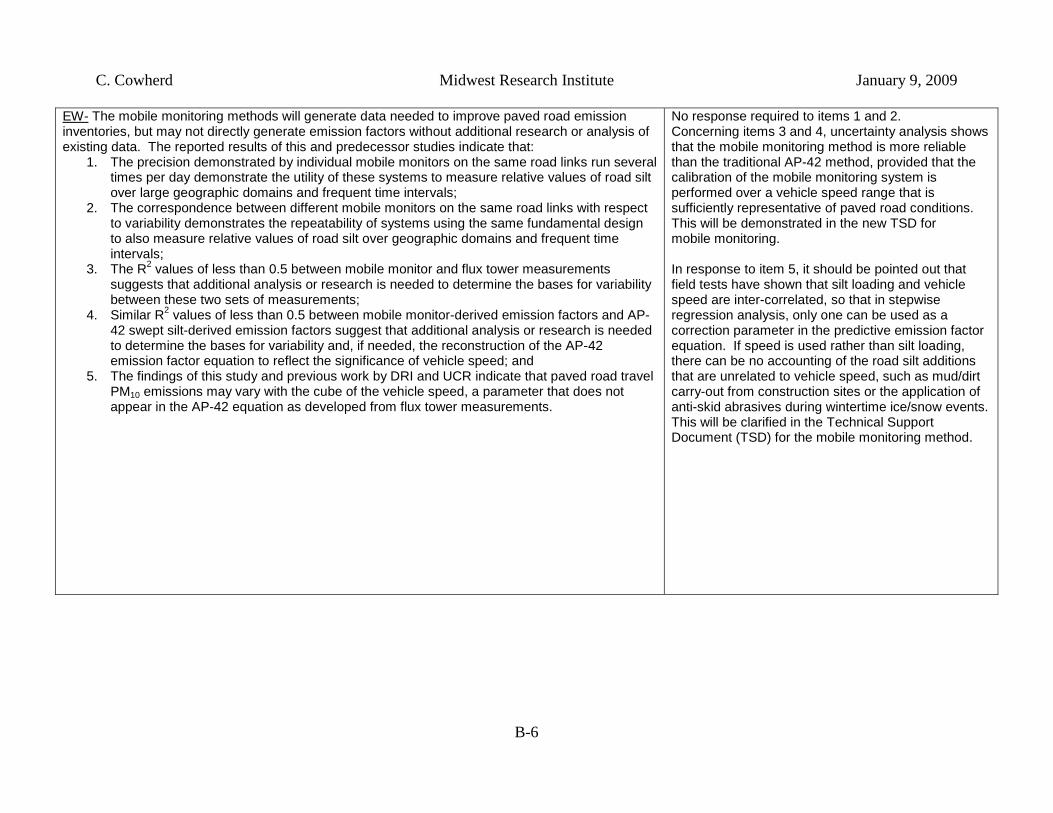
EW-
1. The precision demonstrated by individual mobile monitors on the same road links run several times per day demonstrate the utility of these systems to measure relative values of road silt over large geographic domains and frequent time intervals;
The mobile monitoring methods will generate data needed to improve paved road emission inventories, but may not directly generate emission factors without additional research or analysis of existing data. The reported results of this and predecessor studies indicate that:
2. The correspondence between different mobile monitors on the same road links with respect to variability demonstrates the repeatability of systems using the same fundamental design to also measure relative values of road silt over geographic domains and frequent time intervals;
3. The R2 values of less than 0.5 between mobile monitor and flux tower measurements suggests that additional analysis or research is needed to determine the bases for variability between these two sets of measurements;
4. Similar R2 values of less than 0.5 between mobile monitor-derived emission factors and AP-42 swept silt-derived emission factors suggest that additional analysis or research is needed to determine the bases for variability and, if needed, the reconstruction of the AP-42 emission factor equation to reflect the significance of vehicle speed; and
5. The findings of this study and previous work by DRI and UCR indicate that paved road travel PM10 emissions may vary with the cube of the vehicle speed, a parameter that does not appear in the AP-42 equation as developed from flux tower measurements.
No response required to items 1 and 2. Concerning items 3 and 4, uncertainty analysis shows that the mobile monitoring method is more reliable than the traditional AP-42 method, provided that the calibration of the mobile monitoring system is performed over a vehicle speed range that is sufficiently representative of paved road conditions. This will be demonstrated in the new TSD for mobile monitoring. In response to item 5, it should be pointed out that field tests have shown that silt loading and vehicle speed are inter-correlated, so that in stepwise regression analysis, only one can be used as a correction parameter in the predictive emission factor equation. If speed is used rather than silt loading, there can be no accounting of the road silt additions that are unrelated to vehicle speed, such as mud/dirt carry-out from construction sites or the application of anti-skid abrasives during wintertime ice/snow events. This will be clarified in the Technical Support Document (TSD) for the mobile monitoring method.
C. Cowherd Midwest Research Institute January 9, 2009
B-7
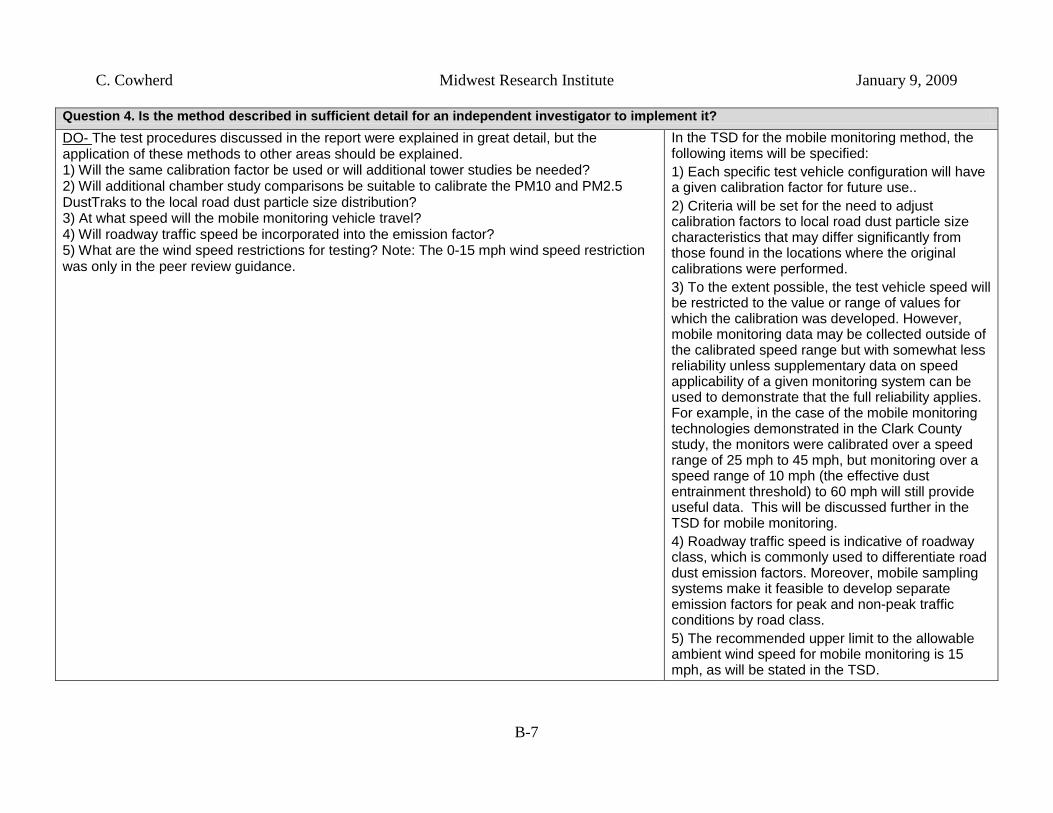
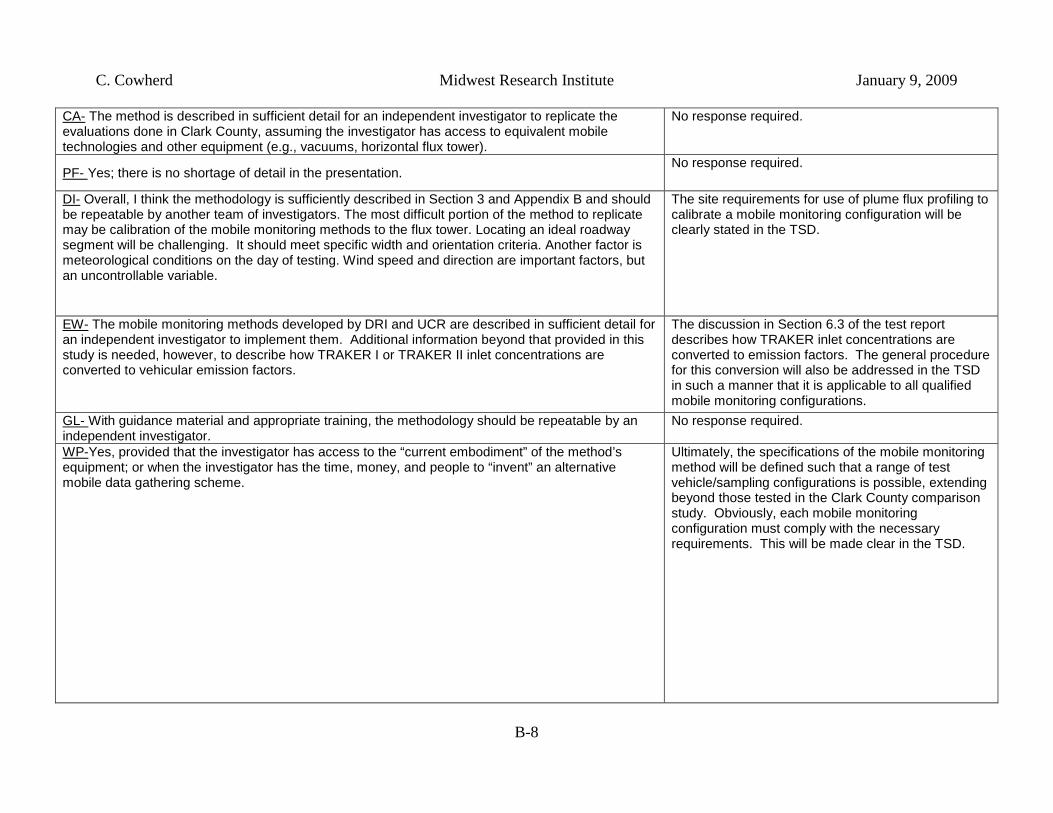
Question 4. Is the method described in sufficient detail for an independent investigator to implement it? DO-
1) Will the same calibration factor be used or will additional tower studies be needed?
The test procedures discussed in the report were explained in great detail, but the application of these methods to other areas should be explained.
2) Will additional chamber study comparisons be suitable to calibrate the PM10 and PM2.5 DustTraks to the local road dust particle size distribution? 3) At what speed will the mobile monitoring vehicle travel? 4) Will roadway traffic speed be incorporated into the emission factor? 5) What are the wind speed restrictions for testing? Note: The 0-15 mph wind speed restriction was only in the peer review guidance.
In the TSD for the mobile monitoring method, the following items will be specified: 1) Each specific test vehicle configuration will have a given calibration factor for future use.. 2) Criteria will be set for the need to adjust calibration factors to local road dust particle size characteristics that may differ significantly from those found in the locations where the original calibrations were performed. 3) To the extent possible, the test vehicle speed will be restricted to the value or range of values for which the calibration was developed. However, mobile monitoring data may be collected outside of the calibrated speed range but with somewhat less reliability unless supplementary data on speed applicability of a given monitoring system can be used to demonstrate that the full reliability applies. For example, in the case of the mobile monitoring technologies demonstrated in the Clark County study, the monitors were calibrated over a speed range of 25 mph to 45 mph, but monitoring over a speed range of 10 mph (the effective dust entrainment threshold) to 60 mph will still provide useful data. This will be discussed further in the TSD for mobile monitoring. 4) Roadway traffic speed is indicative of roadway class, which is commonly used to differentiate road dust emission factors. Moreover, mobile sampling systems make it feasible to develop separate emission factors for peak and non-peak traffic conditions by road class. 5) The recommended upper limit to the allowable ambient wind speed for mobile monitoring is 15 mph, as will be stated in the TSD.
C. Cowherd Midwest Research Institute January 9, 2009
B-8
CA- No response required. The method is described in sufficient detail for an independent investigator to replicate the evaluations done in Clark County, assuming the investigator has access to equivalent mobile technologies and other equipment (e.g., vacuums, horizontal flux tower).
PF- No response required.
Yes; there is no shortage of detail in the presentation.
DI- The site requirements for use of plume flux profiling to calibrate a mobile monitoring configuration will be clearly stated in the TSD.
Overall, I think the methodology is sufficiently described in Section 3 and Appendix B and should be repeatable by another team of investigators. The most difficult portion of the method to replicate may be calibration of the mobile monitoring methods to the flux tower. Locating an ideal roadway segment will be challenging. It should meet specific width and orientation criteria. Another factor is meteorological conditions on the day of testing. Wind speed and direction are important factors, but an uncontrollable variable.
EW- The discussion in Section 6.3 of the test report describes how TRAKER inlet concentrations are converted to emission factors. The general procedure for this conversion will also be addressed in the TSD in such a manner that it is applicable to all qualified mobile monitoring configurations.
The mobile monitoring methods developed by DRI and UCR are described in sufficient detail for an independent investigator to implement them. Additional information beyond that provided in this study is needed, however, to describe how TRAKER I or TRAKER II inlet concentrations are converted to vehicular emission factors.
GL- No response required. With guidance material and appropriate training, the methodology should be repeatable by an independent investigator. WP- Ultimately, the specifications of the mobile monitoring
method will be defined such that a range of test vehicle/sampling configurations is possible, extending beyond those tested in the Clark County comparison study. Obviously, each mobile monitoring configuration must comply with the necessary requirements. This will be made clear in the TSD.
Yes, provided that the investigator has access to the “current embodiment” of the method’s equipment; or when the investigator has the time, money, and people to “invent” an alternative mobile data gathering scheme.
C. Cowherd Midwest Research Institute January 9, 2009
B-9
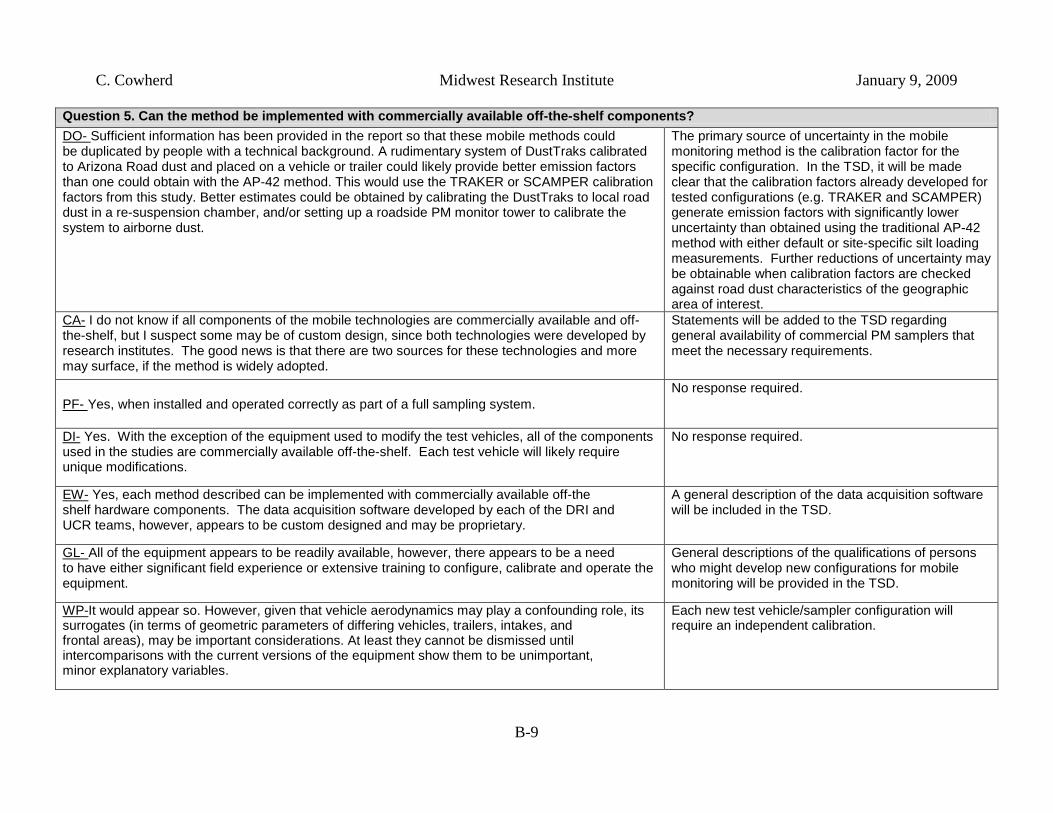
Question 5. Can the method be implemented with commercially available off-the-shelf components? DO- The primary source of uncertainty in the mobile
monitoring method is the calibration factor for the specific configuration. In the TSD, it will be made clear that the calibration factors already developed for tested configurations (e.g. TRAKER and SCAMPER) generate emission factors with significantly lower uncertainty than obtained using the traditional AP-42 method with either default or site-specific silt loading measurements. Further reductions of uncertainty may be obtainable when calibration factors are checked against road dust characteristics of the geographic area of interest.
Sufficient information has been provided in the report so that these mobile methods could be duplicated by people with a technical background. A rudimentary system of DustTraks calibrated to Arizona Road dust and placed on a vehicle or trailer could likely provide better emission factors than one could obtain with the AP-42 method. This would use the TRAKER or SCAMPER calibration factors from this study. Better estimates could be obtained by calibrating the DustTraks to local road dust in a re-suspension chamber, and/or setting up a roadside PM monitor tower to calibrate the system to airborne dust.
CA- Statements will be added to the TSD regarding general availability of commercial PM samplers that meet the necessary requirements.
I do not know if all components of the mobile technologies are commercially available and off-the-shelf, but I suspect some may be of custom design, since both technologies were developed by research institutes. The good news is that there are two sources for these technologies and more may surface, if the method is widely adopted.
PF- No response required.
Yes, when installed and operated correctly as part of a full sampling system.
DI- No response required. Yes. With the exception of the equipment used to modify the test vehicles, all of the components used in the studies are commercially available off-the-shelf. Each test vehicle will likely require unique modifications.
EW- A general description of the data acquisition software will be included in the TSD.
Yes, each method described can be implemented with commercially available off-the shelf hardware components. The data acquisition software developed by each of the DRI and UCR teams, however, appears to be custom designed and may be proprietary.
GL- General descriptions of the qualifications of persons who might develop new configurations for mobile monitoring will be provided in the TSD.
All of the equipment appears to be readily available, however, there appears to be a need to have either significant field experience or extensive training to configure, calibrate and operate the equipment.
WP- Each new test vehicle/sampler configuration will require an independent calibration.
It would appear so. However, given that vehicle aerodynamics may play a confounding role, its surrogates (in terms of geometric parameters of differing vehicles, trailers, intakes, and frontal areas), may be important considerations. At least they cannot be dismissed until intercomparisons with the current versions of the equipment show them to be unimportant, minor explanatory variables.
C. Cowherd Midwest Research Institute January 9, 2009
B-10
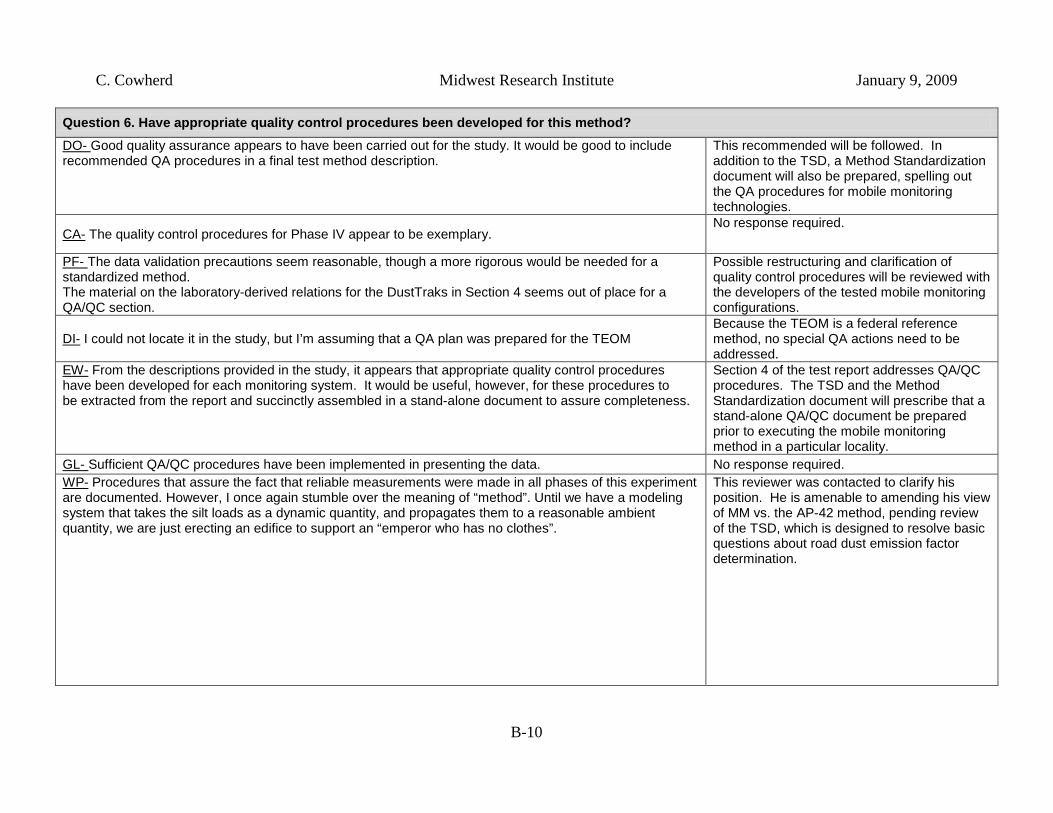
Question 6. Have appropriate quality control procedures been developed for this method? DO- This recommended will be followed. In
addition to the TSD, a Method Standardization document will also be prepared, spelling out the QA procedures for mobile monitoring technologies.
Good quality assurance appears to have been carried out for the study. It would be good to include recommended QA procedures in a final test method description.
CA-No response required.
The quality control procedures for Phase IV appear to be exemplary.
PF-
The material on the laboratory-derived relations for the DustTraks in Section 4 seems out of place for a QA/QC section.
The data validation precautions seem reasonable, though a more rigorous would be needed for a standardized method.
Possible restructuring and clarification of quality control procedures will be reviewed with the developers of the tested mobile monitoring configurations.
DI-Because the TEOM is a federal reference method, no special QA actions need to be addressed.
I could not locate it in the study, but I’m assuming that a QA plan was prepared for the TEOM
EW- Section 4 of the test report addresses QA/QC procedures. The TSD and the Method Standardization document will prescribe that a stand-alone QA/QC document be prepared prior to executing the mobile monitoring method in a particular locality.
From the descriptions provided in the study, it appears that appropriate quality control procedures have been developed for each monitoring system. It would be useful, however, for these procedures to be extracted from the report and succinctly assembled in a stand-alone document to assure completeness.
GL- No response required. Sufficient QA/QC procedures have been implemented in presenting the data. WP- This reviewer was contacted to clarify his
position. He is amenable to amending his view of MM vs. the AP-42 method, pending review of the TSD, which is designed to resolve basic questions about road dust emission factor determination.
Procedures that assure the fact that reliable measurements were made in all phases of this experiment are documented. However, I once again stumble over the meaning of “method”. Until we have a modeling system that takes the silt loads as a dynamic quantity, and propagates them to a reasonable ambient quantity, we are just erecting an edifice to support an “emperor who has no clothes”.
C. Cowherd Midwest Research Institute January 9, 2009
B-11
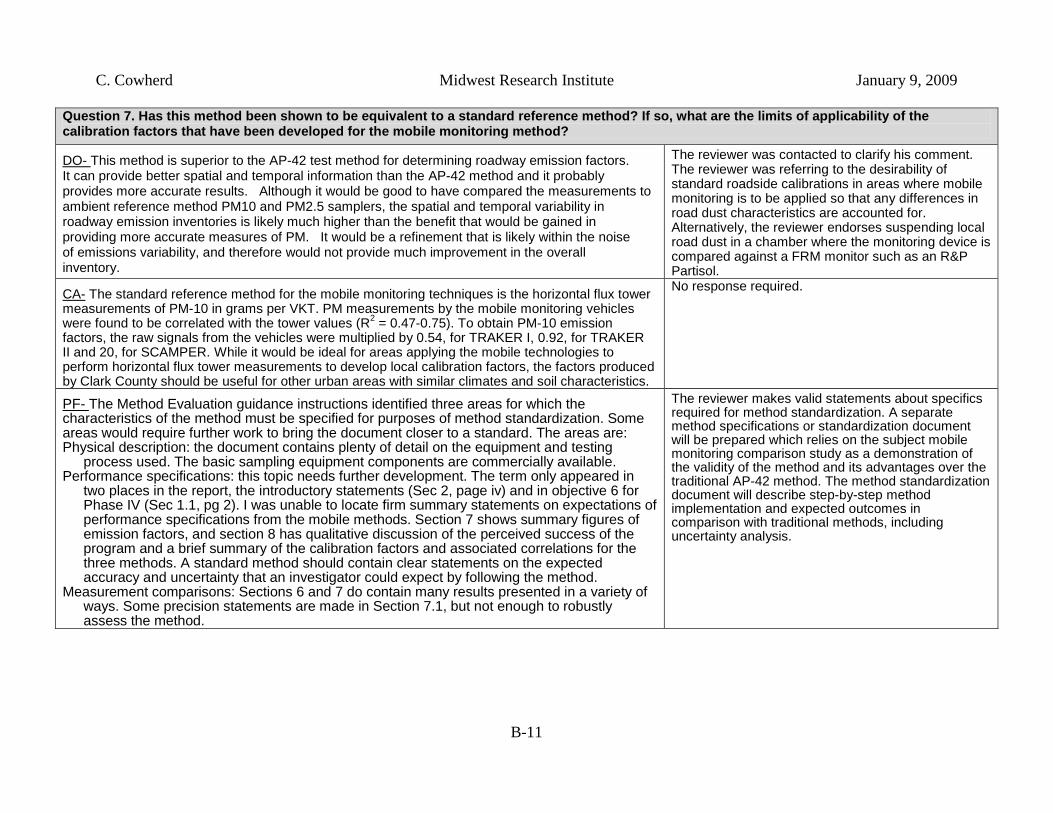
Question 7. Has this method been shown to be equivalent to a standard reference method? If so, what are the limits of applicability of the calibration factors that have been developed for the mobile monitoring method?
DO- The reviewer was contacted to clarify his comment. The reviewer was referring to the desirability of standard roadside calibrations in areas where mobile monitoring is to be applied so that any differences in road dust characteristics are accounted for. Alternatively, the reviewer endorses suspending local road dust in a chamber where the monitoring device is compared against a FRM monitor such as an R&P Partisol.
This method is superior to the AP-42 test method for determining roadway emission factors. It can provide better spatial and temporal information than the AP-42 method and it probably provides more accurate results. Although it would be good to have compared the measurements to ambient reference method PM10 and PM2.5 samplers, the spatial and temporal variability in roadway emission inventories is likely much higher than the benefit that would be gained in providing more accurate measures of PM. It would be a refinement that is likely within the noise of emissions variability, and therefore would not provide much improvement in the overall inventory.
CA- No response required. The standard reference method for the mobile monitoring techniques is the horizontal flux tower measurements of PM-10 in grams per VKT. PM measurements by the mobile monitoring vehicles were found to be correlated with the tower values (R2 = 0.47-0.75). To obtain PM-10 emission factors, the raw signals from the vehicles were multiplied by 0.54, for TRAKER I, 0.92, for TRAKER II and 20, for SCAMPER. While it would be ideal for areas applying the mobile technologies to perform horizontal flux tower measurements to develop local calibration factors, the factors produced by Clark County should be useful for other urban areas with similar climates and soil characteristics.
PF-
Physical description: the document contains plenty of detail on the equipment and testing process used. The basic sampling equipment components are commercially available.
The Method Evaluation guidance instructions identified three areas for which the characteristics of the method must be specified for purposes of method standardization. Some areas would require further work to bring the document closer to a standard. The areas are:
Performance specifications: this topic needs further development. The term only appeared in two places in the report, the introductory statements (Sec 2, page iv) and in objective 6 for Phase IV (Sec 1.1, pg 2). I was unable to locate firm summary statements on expectations of performance specifications from the mobile methods. Section 7 shows summary figures of emission factors, and section 8 has qualitative discussion of the perceived success of the program and a brief summary of the calibration factors and associated correlations for the three methods. A standard method should contain clear statements on the expected accuracy and uncertainty that an investigator could expect by following the method.
Measurement comparisons: Sections 6 and 7 do contain many results presented in a variety of ways. Some precision statements are made in Section 7.1, but not enough to robustly assess the method.
The reviewer makes valid statements about specifics required for method standardization. A separate method specifications or standardization document will be prepared which relies on the subject mobile monitoring comparison study as a demonstration of the validity of the method and its advantages over the traditional AP-42 method. The method standardization document will describe step-by-step method implementation and expected outcomes in comparison with traditional methods, including uncertainty analysis.
C. Cowherd Midwest Research Institute January 9, 2009
B-12
DI- Upon followup contact, the reviewer is questioning whether a downwind tower is sufficient in the calibration process. Other studies have shown that under light traffic conditions, background concentration can be reliability determined from the downwind tower monitors during periods when no vehicles are passing the tower.
The mobile monitoring methods were validated by the instrumentation on the flux tower. Although variability in wind speed and direction may have introduced uncertainty in the results, I think the QA/QC procedures address this factor. Also, have studies been conducted that support the equivalency of upwind/downwind vs. downwind methods?
EW-
The mobile monitoring method used in this study has been shown to be generally equivalent to the flux tower method. Because the AP-42 emission factor equation is based on the flux tower method, emission factors based on the mobile monitoring method has also been shown to be generally equivalent to the road silt/vehicle weight-based emission factors. The absence of vehicle speed in the AP-42 equation, and the findings of this study and others regarding the significance of vehicle speed on emission rates, suggests that an emission factor equation based on the mobile monitoring studies may be an improvement over the AP-42 equation that is based on the flux tower method for measuring PM10 entrained from paved road travel. This work, however, should be delayed until further analysis or research into the variability between mobile method and flux tower measurements can be completed.
The calibration factors that have been developed for the mobile monitoring method, as shown in Table 6-4 of the study, should not be used outside the range of vehicle speeds used in this study. This conclusion is based on the study findings regarding the significance of vehicular speed on emission measurements.
As stated in response to an earlier comment, uncertainty analysis shows that the mobile monitoring method is more reliable than the traditional AP-42 method, provided that the calibration of the mobile monitoring system is performed over a vehicle speed range that is sufficiently representative of paved road conditions. This will be demonstrated in the new TSD for mobile monitoring. Also in response to an earlier comment, it was stated that to the extent possible, the test vehicle speed will be restricted to the value or range of values for which the calibration was developed. However, mobile monitoring data may be collected outside of the calibrated speed range but with somewhat less reliability unless supplementary data on speed applicability of a given monitoring system can be used to demonstrate that the full reliability applies. For example, in the case of the mobile monitoring technologies demonstrated in the Clark County study, the monitors were calibrated over a speed range of 25 mph to 45 mph, but monitoring over a speed range of 10 mph (the effective dust entrainment threshold) to 60 mph will still provide useful data. This will be discussed further in the TSD for mobile monitoring.
C. Cowherd Midwest Research Institute January 9, 2009
B-13
EW- In an earlier study, the frontal area of the SCAMPER test vehicle was used to derive an independent calibration factor of 12, as compared to value of 20 derived from standard roadside calibration in the current study.
There may be an error in the conversion factor reported in Table 6-4 for the SCAMPER. Equation 6.4, p. 77, shows that the ratio of silt-based calculated emissions to SCAMPER calibrated measurements is 12, not 20 shown in Table 6-4. If the value of 20 in Table 6-4 is correct, then the text needs to be expanded to explain this difference.
GL- Any calibration factor developed for a specific test vehicle/sampling configuration should remain valid in different regions of the country, unless the road dust characteristics are markedly different. This point will be clarified in the TSD.
It appears the calibration factors are specific to the study area and new calibration factors would need to be developed for each new area. This may be an issue until such a time that sufficient data was collected that demonstrates factors were determined to be fully representative for a greater region, such as the South Coast Air Basin.
WP- As stated in response to an earlier comment, mobile monitoring is completely independent of the “existing AP-42 silt loading method.” It is intended to be a preferred alternative to the traditional method and its associated difficulties of “street vacuuming.”
I have a large philosophical problem with this question. The question assumes the existing AP-42 (silt loading) method to be a standard reference method, and that the purpose of the Clark County experiments is to improve the ease of generating some parameters that will serve to “calibrate” to the standard reference method of “street vacuuming”. It further assumes that the existing AP-42 (silt loading) method stands on the pedestal of inviolable first principles of physics and chemistry, and is, therefore, fundamentally correct, and thus useful in making estimates for all applications (beyond its original utility as a two-parameter estimate of track-out emissions). Those assumptions are, unfortunately, incorrect.
C. Cowherd Midwest Research Institute January 9, 2009
B-14
Question 8. How is this method superior/inferior to the traditional AP-42 emission factor test method? What are the limits of applicability of the mobile monitoring method? DO- The issues of variations in the local road dust
particle size distribution will be addressed in the TSD and the method standardization document.
The superiority of the mobile monitoring methods is in their ability to easily measure changes in spatial and temporal road dust emission factors. Even the simplest application of this method could be used to find relative differences in higher or lower roadway emissions. Control efficiency estimates can be fairly accurate, even with minimally calibrated equipment. The relative effects of vehicle speed, roadway surface types and other characteristics can be tested by simple measurements. The accuracy of the overall emission estimates can be improved if an effort is made to calibrate the monitoring equipment to the local road dust particle size distribution. CA-
The mobile monitoring technologies should be applied under typical meteorological conditions (not when it is raining or high winds have deposited soil on the roads.) In addition, the mobile monitoring emission rates should not be applied to VMT that is operating at speeds less than 10 mph.
The mobile monitoring technologies are superior to the AP-42 emission factor method, because they collect PM data from a larger and more diverse sample of roads than can be measured by vacuuming techniques. It is difficult to identify representative locations for the limited number of vacuum samples that can be collected. As noted in the Phase IV report, vacuum samples can not be performed on major arterials and freeways, due to safety concerns. So mobile monitoring is the only practical way to measure paved road emission rates on high-traffic facilities.
The TSD and the method standardization document will identify the weather and traffic conditions under which mobile monitoring should not be performed.
PF-
The limits of applicability seem to be the uncertainty associated with the calibration factors needed to translate mobile system data to mass emission factors.
The mobile methods are superior to AP-42 when emission factors are wanted for a variety of paved roads, potentially under changing conditions and for roads where manual surface sampling is impractical or unsafe.
No response required.
DI-
I think the greatest benefit with the proposed method is the ability to obtain more detailed PM10 emission factors by roadway classifications. The current AP-42 method only distinguishes two types of roadways - low ADT and high ADT. The proposed method can improve the spatial and temporal resolution of paved road emission inventories.
Another advantage with the mobile monitoring method is the frequency in which roadway characteristics can be updated. Monitoring key roadway segments can provide air quality planners additional timely information to evaluate control measure effectiveness. The studies used test vehicles representing approximate vehicle weights of the vehicle fleet in the Las Vegas Valley. Average vehicle weights will probably be different for each roadway classification. This may be a limiting factor, but can be overcome.
The issue of potential variations of fleet average vehicle weight across roadway classifications will be addressed briefly in the TSD and the method standardization document.
C. Cowherd Midwest Research Institute January 9, 2009
B-15
EW-
Generally, our understanding of paved road emission dynamics will improve as we expand the database of silt measurements. Mobile monitoring methods have the potential of increasing the rate by which we collect data by three to four orders of magnitude. This benefit alone warrants that we encourage the use of this method now to collect data that will expand and improve upon our understanding of paved road silt dynamics.
The mobile monitoring method of data collection is superior to the traditional AP-42 road silt sampling method for all of the reasons stated in the study. A mobile monitoring method can measure silt levels every 100 feet on tens of miles of roads per day, whereas the silt sweeping method – with the same personnel allocation – can collect silt level data at only 5 to 10 segments 100 feet long per day. Additionally, the mobile monitoring method can be safely used 24 hours per day on all types of roadways. The silt sweeping method suffers from safety problems that prohibit its use on freeways and during the night.
The mobile monitoring method is currently an excellent approach for collecting road silt data in a relative sense. At constant speed, a mobile monitor should do well in mapping geographical and temporal fluctuations in silt levels. This data is vitally needed to identify hot spots and their sources, and to quantify the benefits of control strategies that prevent or remove silt from roadway surfaces. Until the variability between mobile monitor measurements and silt-based AP-42 factors are explained, however, mobile monitor measurements should not be used to compute emission inventories but instead can be used to compute silt levels on road links traversed by mobile monitors from the correspondence between silt sweeping values and mobile monitored values simultaneously measured on the same road links. Care should be taken, however, to conduct all of the mobile monitoring in such a program at a uniform speed so as to eliminate the influences of speed in extrapolating from a few road links to many.
In response to an earlier comment, it was stated that to the extent possible, the test vehicle speed will be restricted to the value or range of values for which the calibration was developed. However, mobile monitoring data may be collected outside of the calibrated speed range but with somewhat less reliability unless supplementary data on speed applicability of a given monitoring system can be used to demonstrate that the full reliability applies. For example, in the case of the mobile monitoring technologies demonstrated in the Clark County study, the monitors were calibrated over a speed range of 25 mph to 45 mph, but monitoring over a speed range of 10 mph (the effective dust entrainment threshold) to 60 mph will still provide useful data. This will be discussed further in the TSD for mobile monitoring. Finally, the TSD will explain the relationship between the mobile monitoring method and the traditional AP-42 silt-based method for calculating road dust emission factors, recognizing that both methods are tied to plume flux profiling as a reference standard.
GL- No response required. The methodology is superior in that information on various types of roads under varying conditions could be collected without the need to obtain paved road silt samples. The methodology could also be used to obtain data on seasonal variabilities which may allow agencies to develop targeted control measures.
WP- The mobile monitoring method is independent of the traditional silt-based method. This will be clarified in the TSD.
The mobile technology method is no better or worse than the existing street vacuum method in providing silt loads. I note that taking the resultant numbers and applying them to what we perceive to be an ill-fitting model, is a much larger problem that needs to be solved.
C. Cowherd Midwest Research Institute January 9, 2009
B-16
Question 9. Do you have any other comments?
CA- No response required. I recommend that EPA Region IX approve Clark County’s use of mobile monitoring methods to develop a paved road dust emission inventory for their PM-10 Maintenance Plan, as discussed in Section 7.4 of the Phase IV report.
PF- The test report will be clarified to make the point that without local silt loading data, EPA’s rating of the emission factor drops from A to C (based on a reference supplied by Clark County).
Section 7.4, 3rd paragraph - Use of default silt loading values in AP-42 in lieu of acquiring local silt measurements does not necessarily degrade quality and confidence of AP-42 emission estimates. Using locally-based loading information could improve the modeled estimates, but the confidence in AP-42 for its intended purposes is not degraded.
PF- No response required. Section 7.4 – limitations on utilization of refined emission estimates exist in that transportation models are not currently able to address sub-classifications of functional road class. While plans exist to improve the models, the current situation does place an upper limit on the value of the refined space and time resolution provided by mobile technology. Improvements in measurements and modeling continue to drive each other forward to improved performance, so this should not be a severe limitation on developing the mobile methods.
PF- Both the traditional AP-42 silt-based method and the mobile monitoring method are “calibrated” against the plume flux profiling method as a standard.
Section 8.1, 1st paragraph – I am concerned that the tower measurements are considered as the standard for comparisons. EPA will ask if the new method is shown to be equivalent to a standard method, which is the AP-42 silt method. The tower could still be the basis of calibrating the mobile sensors. It would take revising some discussion and information presentations.
PF- The test report gives several references to studies where mobile monitoring technologies were applied to unpaved roads, with similar advantages over the traditional AP-42 method for unpaved roads.
Section 8.2 – The studies were focused on paved road estimates. Thus the statements on mobile having similar advantages for unpaved roads and being a preeminent method for road dust at stationary sources are stretching the optimism too far.
PF- No response required. “Bottom line” – are the mobile technologies a suitable alternative to AP-42 for PM10 emission factors for paved roads? My qualitative response is a cautious yes, when the scope and application are based on reasonable assurance in the acceptable levels of uncertainty in the calibration factors being applicable to the conditions being tested.
C. Cowherd Midwest Research Institute January 9, 2009
B-17
PF- The TSD and the method standardization document will build a case for standardization of the mobile monitoring method. EPA has been tracking this activity and is likely to recognize mobile monitoring as a standard method.
Could the mobile methods become a standard method? There is good foundation work laid to this point, but it’s a long way to an ASTM standard method, and probably as far to a method widely recognized by EPA.
DI-No response required.
My experience with these studies has been more as an end user.
EW- No response required. Because paved road travel constitutes the largest categorical source of PM10 emissions in urban areas, the dynamics of paved road travel emission factors warrant significant additional research. Temporal studies of silt level variability over hours, days, and seasons need to be undertaken to determine how these levels vary with fluctuations in traffic levels and what constitutes equilibrium silt conditions. Pathways for depositing soils onto roadways need to be better characterized and understood. The temporal benefits of street sweeping, using both conventional and PM10-efficient sweepers, need to be studied. These studies can be efficiently and cost-effectively completed using mobile monitoring methods.
GL- The proposed demonstration project brings into play the validity of transport modeling of road dust emissions, which has its separate technical problems. These models tend to over-predict dust impacts significantly, by not accounting for particle removal mechanisms that occur between the roadway source and the receptor point.
The validity of the data would be greatly improved by conducting a demonstration project based on data collected via the mobile monitoring technologies. Specifically, a modeling effort could be completed to determine if the data collected coincided with speciated ambient data in a specific area. With this, the methodology is a viable alternative for estimating paved road PM10 emissions. Given the history of the AP-42 method, that is not accounting for the eventual stability of emissions versus loadings on paved roads, this method is superior.
C. Cowherd Midwest Research Institute January 9, 2009
B-18
WP-
As indicated earlier, the notion of an exponential decay of the roadway silt is clearly presented in the discussions accompanying Figures 5-7 to 5-9. It should not have been dismissed as quickly as it was. It may be important in the context of the removal of depositions by trackout, spillage, and deliberate addition of sand and salt for wintertime traction control. These depositions are mechanisms by which silt loading increases. All of which points to the silt load being a dynamic quantity that continues to be treated as a fixed parameter.
Clearly the study report is a disappointment to those of us who were expecting a broader review of an alternative method that would have looked at the shortcomings of the two-parameter existing AP-42 approach. Perhaps it is unfair to second-guess objectives and approaches after the fact, but I share some of the frustration of A. Venkatram (2001), who was concerned that “ … disproportionately large resources continue to be spent on collecting useless “silt loadings”, required by the model, because incorrect estimates from the model suggest that a large fraction of the total PM10 emissions originate from paved roads!”1.
The apparent dependence of reentrainment upon speed, even on paved roads, is shown in Figure 5-11. The unpaved road has an infinite supply of silt, and visible dust serves a tracer, but shouldn’t the tire/roadway dynamics be similar in the paved case as well. I would suggest that the speed-dependent unpaved road equation with an appropriate decay rate applied to it might be a candidate for the long needed correction to the constant silt load approach. Wind speed and direction is a constantly varying confounding effect, involved in both the deposition and removal processes. It would be interesting to look at horizontal flux tower data, if it was collected into an archive for additional study, for in-between vehicle passes and the less than ideal (wind speed and direction) cases to shed some light on these complex aeolian processes. As I indicated earlier, it may be time to start all over, at the beginning, and define an emission, an inventory, and how to propagate a dispersed result that allows a comparison to filter estimates. It requires a return to fundamentals. While I had hoped to include some discussion of that here, it would have severely delayed this review. It is also beyond the scope of this review. I do however, hope to produce a discussion white paper in the next several weeks, as the Department prepares to meet with EPA to further discuss the development of a road dust inventory and how to apply it to the sometimes wet, humid, “north eastern territories” of the US. 1 See “Response to comments by Nicholson”, at: Atmospheric Environment 35 (2001) 187.
There are many issues raised by this series of comments, some of which have been addressed in responses given above. Needless to say, much confusion exists about the role and validity of the traditional AP-42 silt-based method and how effectively it addresses the dynamics of the paved road dust entrainment. The commenter is correct in stating that decay rate data from the Clark County comparison study provides useful information to be evaluated in gaining a better understanding of the effects of trackout, spillage and wintertime abrasives application for snow/ice control. Clear background statements on these issues will be included in the TSD. As noted above, the reviewer is awaiting review of the TSD with the expectation that it will address many of his basic concerns.