Embed Size (px)
Citation preview

Technical User Guide
Updated April 2, 2018
1
--------------------------------------------------------------------------------------- Since 2006, the Minnesota Departments of Health and Human Services, collaborating with the
University of Minnesota, have offered a Nursing Home Report Card website. The Report Card
lets consumers compare nursing homes across areas that matter to them:
Resident quality of life interviews and family satisfaction surveys
Clinical outcomes on ten key quality of care topics
Health and safety inspections
Measures of the amount, stability and consistency of the workforce
Availability of single-bed rooms
Price per day, including any extra charges for private rooms
Wherever possible, the Report Card risk-adjusts, audits and uses professional third-parties to
collect this information.
Please click the Questions and Feedback links at the top of each page to ask questions or offer
suggestions about the Report Card.
---------------------------------------------------------------------------------------------------------------------
This guide defines the Report Card quality measures and describes how they are scored. It also
provides statewide results on each measure. Additional information may be found in the Nursing
Home Report Card Fact Sheet at http://nhreportcard.dhs.mn.gov/nhreportcardfactsheet.pdf.
The Report Card shows how Minnesota nursing homes that are Medicaid-certified score on eight
quality measures. For each nursing home, each quality measure is scored on a five-star
scale, with one star representing the lowest possible rating and five stars representing the
highest possible rating.
Five of the eight measures assign stars based on the distribution of the results for all Minnesota
nursing facilities, including:
Resident quality of life risk-adjusted ratings
Family satisfaction risk-adjusted ratings
Minnesota risk-adjusted clinical quality indicators
Direct care staff hours per day
Direct care staff retention
The data sets for these measures generally represent a normal distribution. A normal distribution
means that most of the results in a set of data are close to the “average,” with a few outliers both

Technical User Guide
Updated April 2, 2018
2
higher and lower than the average. If the data were graphed for these five measures, the graphs
would look like a bell-shaped curve.
For each of these measures, the mean (average) is determined for the data set. The standard
deviation for the data set is then calculated. The standard deviation is a statistic that tells how
tightly the results are clustered around the average. When the results are tightly bunched
together around the average, the standard deviation is small. When the results are more
widespread, the standard deviation becomes larger. A standard deviation may be thought of as
the average of the differences from the mean. The thresholds for assigning stars to each
facility’s performance are as follows:
5 Stars Mean plus 1½ standard deviations
4 Stars Mean plus ½ to 1½ standard deviations
3 Stars Mean plus or minus ½ standard deviations
2 Stars Mean minus ½ to 1½ standard deviations
1 Star Mean minus 1½ standard deviations
RESIDENT QUALITY OF LIFE SURVEYS
Each year, trained staff employed by an independent contractor of the State interview long-stay
residents in every nursing home about their quality of life. Interviewers offer a random sample of
residents the opportunity to participate, unless they are severely cognitively impaired, ill or their
guardian refuses on their behalf.
The interviewers use a standardized questionnaire that measures resident quality of life over a
variety of topics or domains. These include meaningful activities, food enjoyment, environment,
dignity, autonomy, relationships, caregiving and mood. The State revised the survey in 2016
with input from survey experts, quality of life experts, residents, families and providers to better
reflect life in facilities today. Visit https://vitalresearch.com/mnsurvey2017/resources/index.html
to view the survey.
Minnesota also mails an annual short-stay experience survey to residents discharged after 30
days. This survey asks questions more relevant to them, with a special focus on their admission,
physical therapy, clinical care, and discharge. The Report Card will include these scores in the
future. Visit https://vitalresearch.com/mnshortstay2017/resources/ to see the short-stay survey.
A QOL summary score is constructed by calculating an average score for each domain, then
finding the average of these domain scores. The summary score is then risk-adjusted to level the
playing field among all providers, controlling for resident and facility characteristics that are
generally not a result of provider performance. The QOL score uses five risk adjusters, four for
Technical User Guide
Updated April 2, 2018
3
residents — age, gender, cognitive performance (Cognitive Performance Scale or Brief Interview
for Mental Status) and Activities of Daily Living score (ADL Long-Form) — and one for
facilities — located in the Twin Cities metropolitan area versus elsewhere. The average QOL
scores of residents who are older, female, and/or more cognitively impaired tend to be higher;
whereas, for residents with more ADL dependencies they tend to be lower. In addition, average
QOL scores tend to be lower for residents in facilities located in the Twin Cities.
The variation in the number of interviews per facility presents a challenge in deriving statistically
valid estimates of facility QOL rates. Facilities with fewer surveyed residents are more likely
than facilities with many surveyed residents to have very high or very low QOL scores due to
statistical error rather than real differences in resident quality of life. To deal with this issue, a
statistical approach called hierarchical linear modeling was used to develop empirical Bayes
(EB) estimated QOL scores. Experts contend that the EB approach results in more accurate
estimates when comparing facilities. EB estimation is viewed as more “fair” for facilities with
fewer surveyed residents than comparing facilities just on their observed (so-called unadjusted)
rates.
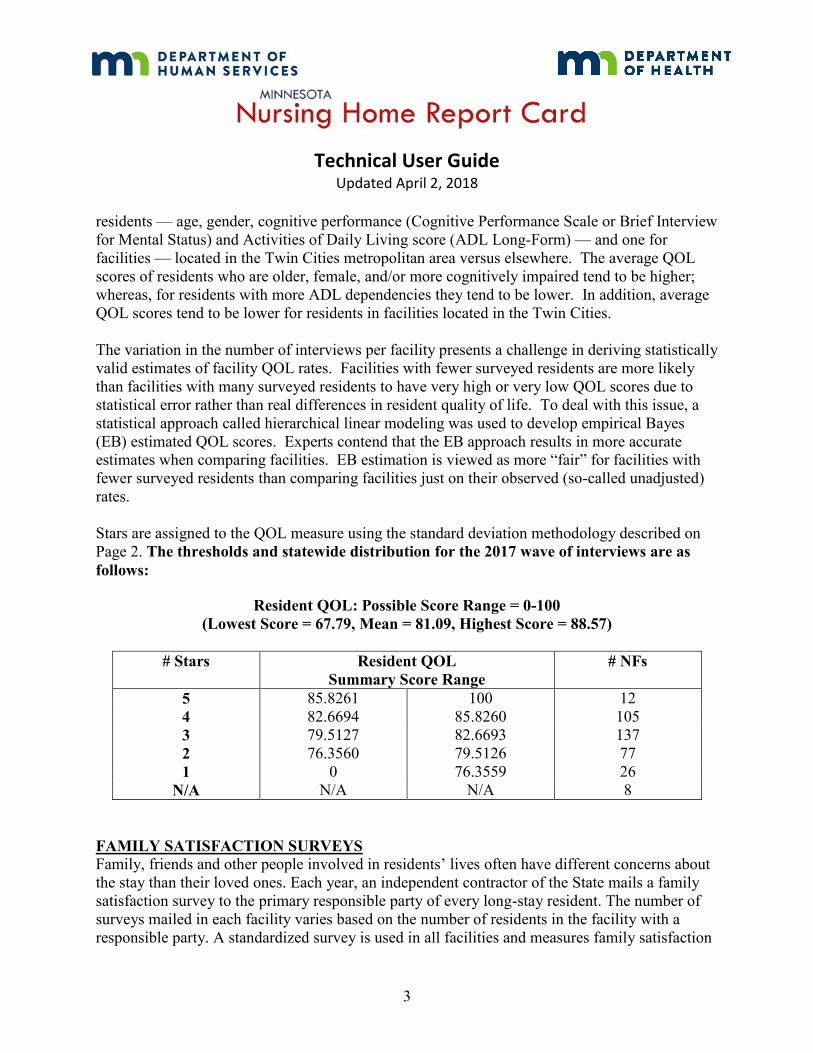
Stars are assigned to the QOL measure using the standard deviation methodology described on
Page 2. The thresholds and statewide distribution for the 2017 wave of interviews are as
follows:
Resident QOL: Possible Score Range = 0-100
(Lowest Score = 67.79, Mean = 81.09, Highest Score = 88.57)
# Stars Resident QOL
Summary Score Range
# NFs
5 85.8261 100 12
4 82.6694 85.8260 105
3 79.5127 82.6693 137
2 76.3560 79.5126 77
1 0 76.3559 26
N/A N/A N/A 8
FAMILY SATISFACTION SURVEYS
Family, friends and other people involved in residents’ lives often have different concerns about
the stay than their loved ones. Each year, an independent contractor of the State mails a family
satisfaction survey to the primary responsible party of every long-stay resident. The number of
surveys mailed in each facility varies based on the number of residents in the facility with a
responsible party. A standardized survey is used in all facilities and measures family satisfaction

Technical User Guide
Updated April 2, 2018
4
over four topics or domains. These include staff, care, environment and food. To view the family
survey, visit https://vitalresearch.com/mnsurvey2017/resources/index.html .
A family satisfaction summary score is constructed by calculating an average score for each
domain, then finding the average of these domain scores. The summary score is then risk-
adjusted to level the playing field among all providers, controlling for resident and facility
characteristics that are generally not a result of provider performance. The family satisfaction
scores use six risk adjusters, five for respondents (relationship to the resident, gender, frequency
of visits and other communication with the resident, and survey format) and one for nursing
homes (Twin Cities metropolitan vs. greater Minnesota).
Respondents who are male, in a less intimate relationship with the resident (e.g. professional
guardian vs. spouse), have less frequent contact with the resident, and/or complete the survey on
the phone vs. on paper or online tend to be more satisfied. In addition, average family
satisfaction scores tend to be higher for nursing homes located in greater Minnesota.
The variation in the number of surveys per facility presents a challenge in deriving statistically
valid estimates of family satisfaction. Facilities with fewer surveys are more likely than facilities
with many surveys to have very high or very low satisfaction scores due to statistical error rather
than real differences in family opinion. To deal with this issue, a statistical approach called
hierarchical linear modeling is used to develop empirical Bayes (EB) estimated satisfaction
scores. Experts contend that the EB approach results in more accurate estimates when
comparing facilities. EB estimation is viewed as more “fair” for facilities with fewer surveys
than comparing facilities just on their observed (so-called unadjusted) rates.
Stars are assigned to the family satisfaction measure using the standard deviation methodology
described on Page 2. The thresholds and statewide distribution for the 2017 wave of surveys
are as follows:
Family Satisfaction: Possible Score Range = 0-100
(Lowest Score = 56.60, Mean = 75.50, Highest Score = 92.22)
# Stars Family Satisfaction
Summary Score Range
# NFs
5 83.507 100 16
4 78.107 83.506 93
3 72.707 78.106 148
2 67.306 72.706 64
1 0 67.305 33
N/A N/A N/A 11

Technical User Guide
Updated April 2, 2018
5
MN RISK-ADJUSTED MDS QUALITY INDICATORS
During their stay in a nursing home, residents are assessed by the facility staff. This is called a
Minimum Data Set assessment (MDS) and is performed at admission, quarterly, annually and
whenever the resident experiences a significant change in health status. This extensive
assessment includes many items such as: diagnoses; the ability to do activities of daily living
(ADL) such as getting in and out of bed, walking, eating, bathing, toileting, etc; clinical
conditions; use of certain types of medications; dehydration; mental functioning; and certain
treatments provided to the resident.
Selected items from the MDS have been identified as potential indicators of the quality of care
provided to the resident. The Report Card uses 21 quality indicators, listed in Table 1, to
calculate the Quality Indicator score. These quality indicators have been risk adjusted to account
for differences between the types of residents served in nursing homes. Examples of the
adjustors used are, but are not limited to: age, gender, cognitive performance (mental
functioning), Alzheimer’s disease, stroke, and ADL ability. For MDS items not available on
quarterly assessments, the system automatically looks back to the most-recent available data.
Table 1. Quality Indicators from the MDS Included in Score
Domain Name Description
Psychosocial
Incidence of Worsening
or Serious Resident
Behavior Problems
(Long Stay)
This is the percent of residents with verbal, physical, or other
disruptive behavior symptoms that have worsened or have stayed at
the most serious level since the last assessment.
Prevalence of
Depressive Symptoms
(Long Stay)
This is the percent of long-stay residents who are exhibiting signs of
depression. This is determined by a standardized resident mood
interview or if interview is not possible, by staff assessment.
Quality of
Life
Prevalence of Physical
Restraints (Long Stay)
This is the percent of long-stay residents who were physically
restrained. A physical restraint is any device, material or equipment
attached or adjacent to a resident’s body, that a resident can’t
remove easily, which keeps a resident from moving freely or
prevents them normal access to their body. Side rails on beds are not
included in this calculation.
Continence
Incidence of Worsening
or Serious Bowel
Incontinence (Long
Stay)
This is the percent of long-stay residents whose ability to control
their bowel has gotten worse or stayed at the most serious level
since the last assessment. Residents who need an appliance such as
an ostomy for bowel movements are not included in the calculation
of this measure.

Technical User Guide
Updated April 2, 2018
6
Table 1. Quality Indicators from the MDS Included in Score
Domain Name Description
Incidence of Worsening
or Serious Bladder
Incontinence (Long
Stay)
This is the percent of long stay-residents whose ability to control
their bladder has gotten worse or stayed at the most serious level
since the last assessment. Residents who need an appliance such as
catheter for urination are not included in the calculation of this
measure.
Prevalence of
Occasional to Full
Bladder Incontinence
Without a Toileting Plan
(Long Stay)
This is the percent of long-stay residents who lose control of their
bladder and are not on a documented individualized bladder
toileting program.
Prevalence of
Occasional to Full
Bowel Incontinence
Without a Toileting Plan
(Long Stay)
This is the percent of long-stay residents who lose control of their
bowel and are not on a documented individualized bladder toileting
program.
Prevalence of
Indwelling Catheters
(Long Stay)
This is the percent of long-stay residents who had a catheter inserted
and left in their bladder for a period of time.
Infections
Prevalence of Urinary
Tract Infections (Long
Stay)
This is the percent of long-stay residents who had an infection in
their urinary tract.
Prevalence of Infections
(Long Stay)
This is the percent of long-stay residents who have had an infection.
This may include drug-resistant infections, some wound infections,
pneumonia, viral hepatitis, and septicemia.
Accidents
Prevalence of Falls with
Major Injury (Long
Stay)
This is the percent of long-stay residents who have experienced one
or more falls with major injury (e.g. bone fractures, joint
dislocations, closed head injuries with altered consciousness,
subdural hematoma).
Nutrition
Prevalence of
Unexplained Weight
Loss (Long Stay)
This is the percent of long-stay residents who have lost too much
weight and are not on a physician-prescribed weight loss regimen.
Skin Care
Prevalence of New or
Worsening Pressure
Sores (Short Stay)
This is the percent of short-stay residents (recently admitted to the
nursing home after a hospitalization) who have developed pressure
sores or who had pressure sores that got worse since admission.
Prevalence of Pressure
Sores in High-Risk
Residents (Long Stay)
This is the percent of long-stay residents with a high risk for getting
pressure sores that have one or more pressure sores. Residents are
defined as high risk if they are comatose, malnourished , or have an
impaired ability to move themselves in bed or transfer from bed to
chair, etc.

Technical User Guide
Updated April 2, 2018
7
Table 1. Quality Indicators from the MDS Included in Score
Domain Name Description
Psychotropic
Medications
Prevalence of
Antipsychotics Without
a Diagnosis of
Psychosis (Long Stay)
This is the percent of long-stay residents who receive an
antipsychotic medication. Some residents with a serious mental
illness diagnosis such as Schizophrenia are not included in the
calculation of this measure.
Physical
Functioning
Incidence of Worsening
or Serious Functional
Dependence (Long
Stay)
This is the percent of long-stay residents whose need for help doing
basic tasks has increased or stayed at the highest level since the last
assessment. These tasks include feeding oneself, moving from one
chair to another, changing positions in bed and/or going to the
bathroom. Residents with quadriplegia are not included in the
calculation of this measure.
Incidence of Walking as
Well or Better than
Previous Assessment
(Long Stay)
This is the percent of long-stay residents who have the same or
improved independence in walking ability since the last assessment.
Incidence of Worsening
or Serious Mobility
Dependence (Long
Stay)
This is the percent of long-stay residents whose need for help
moving in and around their room has increased or stayed at the
highest level since the last assessment. Residents with quadriplegia
are not included in the calculation of this measure.
Incidence of Worsening
or Serious Range of
Motion Limitation
(Long Stay)
This is the percent of long-stay residents whose ability to move the
joints of their upper or lower extremities has declined or stayed at
the lowest level since the last assessment. Residents with
quadriplegia are not included in the calculation of this measure.
Pain
Prevalence of Residents
who Report Moderate to
Severe Pain (Short Stay)
This is the percent of short-stay residents (recently admitted to the
nursing home following a hospital stay) who report having moderate
to severe pain. Although pain is common during recovery and
rehabilitation from a major illness or injury, it is still important to
identify and treat pain.
Prevalence of Residents
who Report Moderate to
Severe Pain (Long Stay)
This is the percent of long-stay residents who reported having
moderate to severe pain.
The facility QI scores are based on facility rates for the 21 QIs divided into 10 domains. Each
domain is assigned 10 points and within each domain the points are distributed equally. The
risk-adjusted total points for each facility are converted from a 100- to a 40-point scale. For
additional details regarding the calculation of the QIs visit https://nfportal.dhs.state.mn.us/ or
contact Teresa Lewis at [email protected].
Beginning in 2018, nursing homes are grouped into those specializing in only short-stay, post-
acute care and those who provide some or all long-stay, residential care. Short stay nursing
homes are then rated with only the short-stay indicators given in the table above. Stars are

Technical User Guide
Updated April 2, 2018
8
assigned to the 40-point QI measure for these two peer groups using the standard deviation
methodology described on Page 2 of this user guide. The thresholds and statewide distribution
for the period January 1, 2017 through December 31, 2017 are as follows:
MDS Quality Indicators - Short Stay Peer Group
(Lowest = 12.3690, Mean = 20.9307, Highest = 34.1072)
# Stars QI Score Range # NFs
5 34.6874 40 0
4 25.5163 34.6873 3
3 16.3452 25.5162 1
2 7.1741 16.3451 4
1 0 7.1740 0
N/A N/A N/A 0
MDS Quality Indicators - Standard Peer Group
(Lowest = 12.5119, Mean = 25.4282, Highest = 36.3517)
# Stars QI Score Range # NFs
5 32.5615 40 24
4 27.8060 32.5614 96
3 23.0505 27.8059 126
2 18.2950 23.0504 86
1 0 18.2949 25
N/A N/A N/A 0
DIRECT CARE STAFF HOURS PER RESIDENT DAY
The source of the data to compute the facility average direct care hours per resident day is
the annual statistical report filed with DHS for the 12-month period ending September 30,
2016.
The following list describes the steps taken to determine the facility average staffing levels.
1) Figures are for Nursing Facility (NF) days and Nursing Facility-II (NFII) days (Report
lines 5001 to 5100).

Technical User Guide
Updated April 2, 2018
9
2) Both regular and pool productive hours are included (Report lines 0301 to 0320).
3) Productive hours are converted into Hours per Resident Day figures: RN hours / resident
days, LPN hours / resident days, etc.
4) Hours per Resident Day are weighted for relative cost per staff type (statewide average
salary ratios):
Staff type Ratio
DON/Nurse administrator 2.14
RN 1.95
LPN 1.50
Certified Nursing Assistant 1.00
TMA 1.11
Mental health worker 1.25
Social worker 1.45
Activity staff 1.05
Other direct care worker 1.41
5) Sum of cost weighted hours = (DON hrs paid * DON cost wt) + (RN hrs paid * RN cost
wt) + (LPN hrs paid * LPN cost wt) + (CNA hrs paid * CNA cost wt) + (TMA hrs paid *
TMA cost wt) + (MH hrs paid * MH cost wt) + (SW hrs paid * SW cost wt) + (ACT hrs
paid * ACT cost wt) + (OTH hrs paid * OTH cost wt).
6) Sum of cost-weighted hours is adjusted for facility acuity: Adjusted Hrs paid = (Sum of
cost weighted hours) / Facility average case-mix index.
For purposes of comparing staffing levels, all nursing homes in the state are grouped into three
types of facilities:
1) Hospital peer group: hospital-attached, Rule 80 and facilities with three or more
admissions per bed per year.
2) Nursing facility-II peer group: facilities with more than 50 percent of their beds
licensed as boarding care homes.
3) Standard peer group: all other facilities.
The mean staffing level and associated standard deviation are calculated separately for each of
these three peer groups. Thresholds have been determined for each peer group as follows:

Technical User Guide
Updated April 2, 2018
10
Staffing Levels – Hospital Peer Group
(Lowest Reported = 4.3132, Mean = 5.8898, Highest Reported = 15.027)
# Stars Staffing Level – Hrs. Per Day Range # NFs
5 7.1292 Highest 15
4 6.3056 7.1291 22
3 5.4820 6.3055 57
2 4.6593 5.4819 31
1 2.0000 4.6592 7
N/A N/A N/A 0
Staffing Levels – NFII Peer Group
(Lowest Reported = 4.009, Mean = 5.227, Highest Reported = 6.0569)
# Stars Staffing Level – Hrs. Per Day Range # NFs
5 6.1665 Highest 0
4 5.5299 6. 1664 4
3 4.8933 5.5298 3
2 4.2567 4.8932 2
1 2.0000 4.2566 1
N/A N/A N/A 0
Staffing Levels – Standard Peer Group
(Lowest Reported = 4.2157, Mean = 5.4397, Highest Reported = 9.082)
# Stars Staffing Level – Hrs. Per Day Range # NFs
5 6.39125 Highest 22
4 5.75305 6.39124 46
3 5.10945 5.75304 82
2 4.46855 5.10944 60
1 2.000 4.46854 10
N/A N/A N/A 3
Technical User Guide
Updated April 2, 2018
11
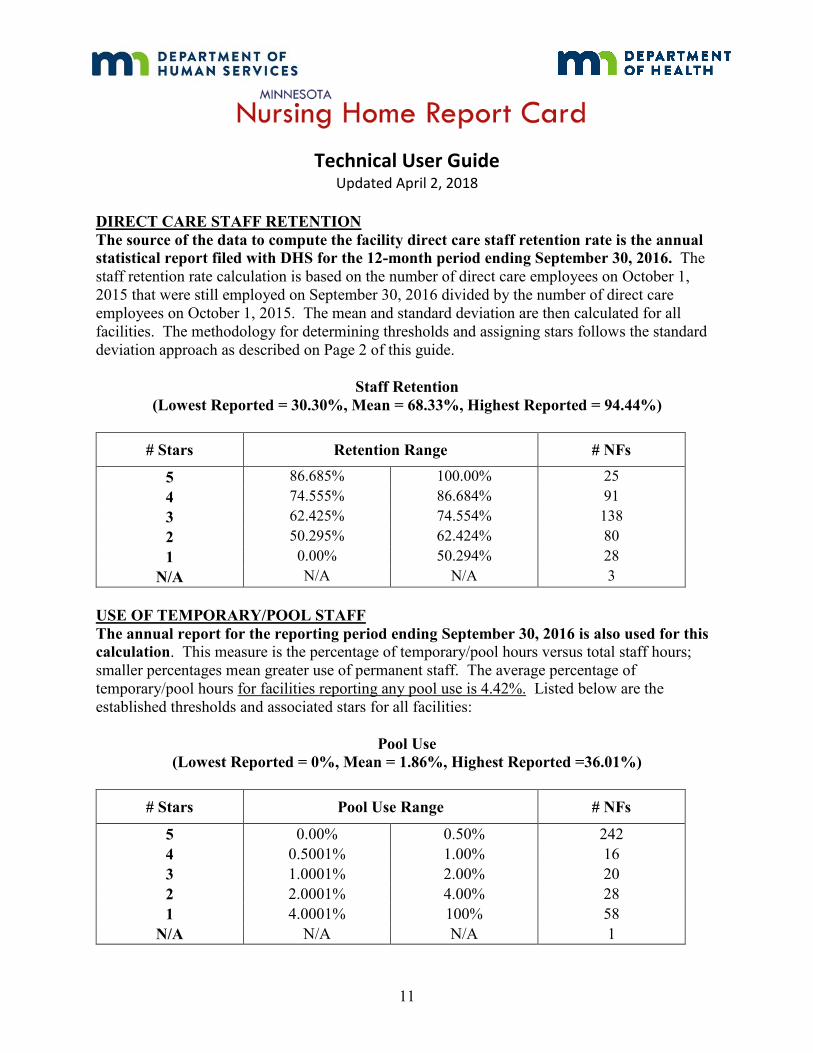
DIRECT CARE STAFF RETENTION
The source of the data to compute the facility direct care staff retention rate is the annual
statistical report filed with DHS for the 12-month period ending September 30, 2016. The
staff retention rate calculation is based on the number of direct care employees on October 1,
2015 that were still employed on September 30, 2016 divided by the number of direct care
employees on October 1, 2015. The mean and standard deviation are then calculated for all
facilities. The methodology for determining thresholds and assigning stars follows the standard
deviation approach as described on Page 2 of this guide.
Staff Retention
(Lowest Reported = 30.30%, Mean = 68.33%, Highest Reported = 94.44%)
# Stars Retention Range # NFs
5 86.685% 100.00% 25
4 74.555% 86.684% 91
3 62.425% 74.554% 138
2 50.295% 62.424% 80
1 0.00% 50.294% 28
N/A N/A N/A 3
USE OF TEMPORARY/POOL STAFF
The annual report for the reporting period ending September 30, 2016 is also used for this
calculation. This measure is the percentage of temporary/pool hours versus total staff hours;
smaller percentages mean greater use of permanent staff. The average percentage of
temporary/pool hours for facilities reporting any pool use is 4.42%. Listed below are the
established thresholds and associated stars for all facilities:
Pool Use
(Lowest Reported = 0%, Mean = 1.86%, Highest Reported =36.01%)
# Stars Pool Use Range # NFs
5 0.00% 0.50% 242
4 0.5001% 1.00% 16
3 1.0001% 2.00% 20
2 2.0001% 4.00% 28
1 4.0001% 100% 58
N/A N/A N/A 1

Technical User Guide
Updated April 2, 2018
12
PROPORTION OF SINGLE BED ROOMS
The number of NF and NFII beds in private and single bed rooms on March 30, 2018 is
divided by the number of active licensed and certified beds on March 30, 2018. Thresholds
and stars are assigned as follows:
Single Bed Rooms
(Low = 0% , Mean = 56.92%, High = 100%)
# Stars Single Bed Rooms Range # NFs
5 90% 100% 75
4 45.01% 89.99% 148
3 30.01% 45.00% 53
2 15.01% 30.00% 54
1
N/A
0%
N/A
15%
N/A
35
0
MDH SURVEY FINDINGS
At least every 15 months, the Minnesota Department of Health (MDH) conducts a health survey
of health care and resident safety and the Minnesota Department of Public Safety conducts a life-
safety code survey of the physical plant at each nursing home in the State. If necessary,
inspectors revisit facilities to ensure that any deficiencies cited during a survey are corrected.
Facilities also may be inspected at any time if a resident or advocate makes a complaint, or if
facility staff report suspected resident abuse or neglect as required by state law.
On November 28, 2017, the Centers for Medicare & Medicaid Services, the federal agency that
determines oversight of nursing homes, updated its inspection process. The Minnesota
Department of Health and the Department of Human Services are currently revising the MDH
Survey Findings star rating to include results of these inspections. Therefore, the star ratings
shown may not reflect the most recent assessment of compliance and quality that exists in a
given facility. Nursing homes’ most recent inspection reports are available at the “More Facility
Information” link under each nursing home’s star table. Please contact the Department of Health
at 651-201-4101 or [email protected] with questions about the new inspection
process.
The statewide distribution of health and safety survey results as of November 16, 2017 is as
follows:

Technical User Guide
Updated April 2, 2018
13
MDH Survey
# Stars Survey
# Points Earned # NFs
5 10 229
4 7.5 60
3 5 13
2 2.5 59
1 0 3
N/A N/A 1
Click the “More Facility Information - Including Health Survey Inspection Findings” link under
a facility’s Report Card star table to access their two most-recent survey reports.
All deficiencies cited are issued with reference to a scope and severity (see Table 2 below).
Scope refers to how widespread the problem is, and can be isolated, patterned, or widespread.
Severity ranges from no actual harm with a potential for minimal harm to situations of actual
harm and immediate jeopardy to resident health or safety.
Table 2. Scope and Severity Levels for Health Inspection Deficiency Citations
Severity
Scope & Severity = J
Isolated Immediate jeopardy to
resident health or safety.
Scope & Severity = K
Patterned – Immediate
jeopardy to resident health or
safety.
Scope & Severity = L
Widespread – Immediate
jeopardy to resident health or
safety.
Scope & Severity = G
Isolated – Actual Harm that is not
immediate jeopardy.
Scope & Severity = H
Patterned – Actual Harm that
is not immediate jeopardy.
Scope & Severity = I
Widespread – Actual Harm
that is not immediate
jeopardy.
Scope & Severity = D
Isolated - No actual harm with
potential for more than minimal
harm that is not immediate
jeopardy.
Scope & Severity = E
Patterned - No actual harm
with potential for more than
minimal harm that is not
immediate jeopardy.
Scope & Severity = F
Widespread - No actual harm
with potential for more than
minimal harm that is not
immediate jeopardy.
Scope & Severity = A
Isolated - No actual harm with
potential for minimal harm.
Scope & Severity = B
Patterned - No actual harm
with potential for minimal
harm.
Scope & Severity = C
Widespread - No actual harm
with potential for minimal
harm.
Scope
Technical User Guide
Updated April 2, 2018
14
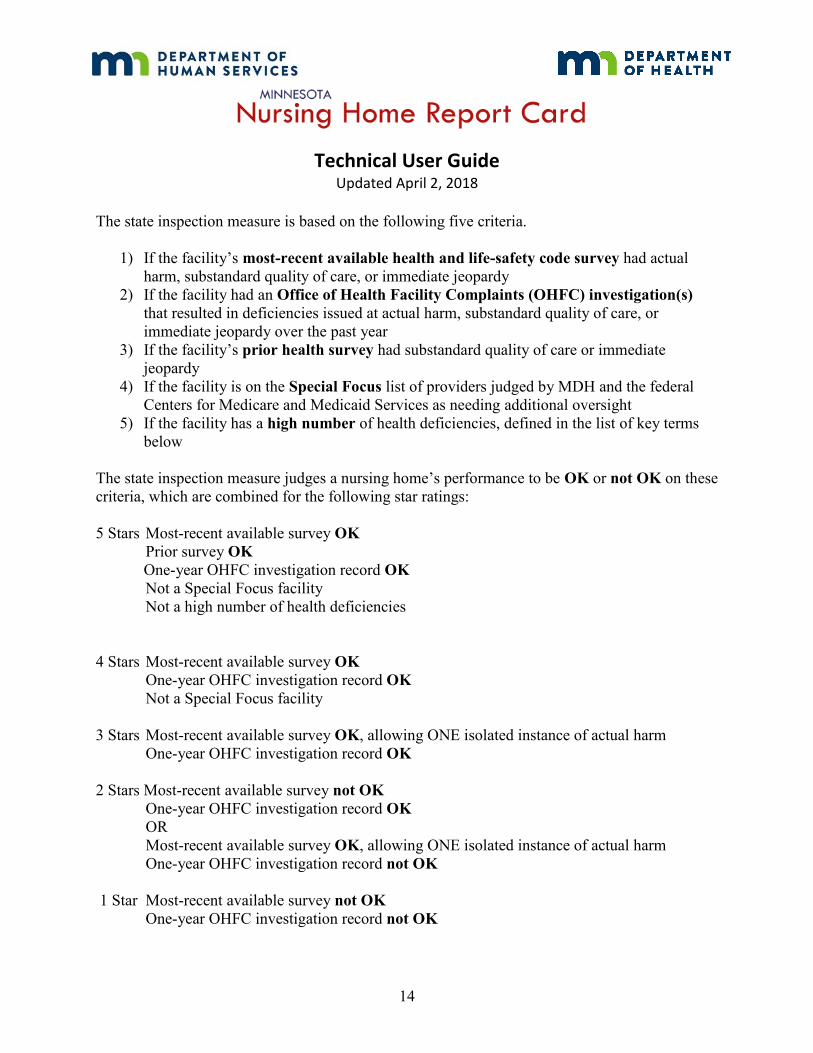
The state inspection measure is based on the following five criteria.
1) If the facility’s most-recent available health and life-safety code survey had actual
harm, substandard quality of care, or immediate jeopardy
2) If the facility had an Office of Health Facility Complaints (OHFC) investigation(s)
that resulted in deficiencies issued at actual harm, substandard quality of care, or
immediate jeopardy over the past year
3) If the facility’s prior health survey had substandard quality of care or immediate
jeopardy
4) If the facility is on the Special Focus list of providers judged by MDH and the federal
Centers for Medicare and Medicaid Services as needing additional oversight
5) If the facility has a high number of health deficiencies, defined in the list of key terms
below
The state inspection measure judges a nursing home’s performance to be OK or not OK on these
criteria, which are combined for the following star ratings:
5 Stars Most-recent available survey OK
Prior survey OK
One-year OHFC investigation record OK
Not a Special Focus facility
Not a high number of health deficiencies
4 Stars Most-recent available survey OK
One-year OHFC investigation record OK
Not a Special Focus facility
3 Stars Most-recent available survey OK, allowing ONE isolated instance of actual harm
One-year OHFC investigation record OK
2 Stars Most-recent available survey not OK
One-year OHFC investigation record OK
OR
Most-recent available survey OK, allowing ONE isolated instance of actual harm
One-year OHFC investigation record not OK
1 Star Most-recent available survey not OK
One-year OHFC investigation record not OK

Technical User Guide
Updated April 2, 2018
15
Here are some key terms used in this measure:
Actual harm includes any deficiency citation where actual physical or emotional harm to a
resident has been identified. Harm can occur in any citation with a scope and severity level “G”
through “L.” (Guidance on scope and severity determination is provided in Appendix P; section
IV.B and IV.C of the CMS state operations manual).
Substandard quality of care means one or more deficiencies related to participation
requirements under 42 CFR 483.13, resident behavior and facility practices, 42 CFR 483.15,
quality of life, or 42 CFR 483.25, quality of care, that constitutes either immediate jeopardy to
resident health or safety, a pattern of or widespread actual harm that is not immediate jeopardy,
or a widespread potential for more than minimal harm, but less than immediate jeopardy, with no
actual harm (Defined in the CMS state operations manual chapter 7, section 7001).
Substandard quality of care includes any health deficiency (called F-tags) in Table 3 below that
is of a scope and severity of “F” or higher but not equal to “G” (as “G” represents isolated and
not patterned harm).
Table 3. Deficiencies that Indicate Substandard Quality of Care
Resident Behavior and Facility Practices Quality of Care
F0221 Physical Restraints F0309 Quality of Care
F0222 Chemical Restraints F0310 Activities of Daily Living (ADL) Maintenance
F0223 Abuse F0311 Appropriate ADL Treatment
F0224 Staff Treatment of Residents F0312 ADL Services
F0225 Unemployable Individuals F0314 Pressure Sores
F0226 Policy and Procedures for Staff F0315 Catheter Prevention
Quality of Life F0317 Range of Motion Maintenance
F0240 F0318 Limited Range of Motion Services
F0241 Quality of Life F0319 Mental and Psychosocial Services
F0242 Dignity F0320 Maintenance of Psychosocial Functioning
F0243 Self-Determination/Participation F0321 Nasogastric Tubes (Tube Feeding)
F0244 Resident and Family Groups F0322 Nasogastric Care
F0245 Listen to Group F0323 Accident Environment
F0246 Participate in Other Activities F0324 Accident Prevention
F0247 Accommodate Needs F0325 Nutrition
F0248 Notice Before Room Change F0326 Therapeutic Diet
F0249 Activities Program F0327 Hydration

Technical User Guide
Updated April 2, 2018
16
F0250 Activities Director F0328 Special Needs
F0251 Social Services F0329 Unnecessary Drugs
F0252 Social Work Qualification F0330 Antipsychotic Drugs
F0253 Environment F0331 Drug Reduction
F0254 Housekeeping F0332 Medication Errors
F0255 Clean Linens F0333 Significant Medication Errors
F0256 Private Closet F0334 Influenza and Pneumococcal Immunizations
F0257 Adequate Lighting
F0258 Comfortable Temperatures
Immediate jeopardy means a situation in which the facility’s noncompliance with one or more
requirements of participation has caused, or is likely to cause, serious injury, harm, impairment,
or death to a resident (Defined in the CMS state operations manual chapter 7, section 7001).
Special Focus Provider is a nursing home deemed by the Department of Health and the Centers
for Medicare and Medicaid Services to be performing at a level where additional oversight is
needed to assure compliance with government regulations.
High number of deficiencies means that the total number of deficiency citations issued to a
facility on the most-recent available health survey is greater than the average of high statewide
and high survey district deficiencies, determined by the following formula:
= [(Minnesota’s average deficiencies plus ½ standard deviation for previous calendar year) +
(survey district’s average deficiencies plus ½ standard deviation for previous calendar year)] / 2
Since actual survey results can be technically or medically complex and sometimes difficult to
interpret, we have provided some background on the survey process.
State Survey Process
1. Surveys are unannounced and usually conducted during weekdays. However, survey
teams can and do conduct inspections at night, on weekends and on holidays.
2. Surveyors are trained health care professionals in nursing, nutrition, social work,
pharmacy and sanitation.
3. A Life Safety Code component of the survey focuses on safety to life from fire in
buildings and structures.
4. A report is sent to the facility following each survey.

Technical User Guide
Updated April 2, 2018
17
5. When regulatory requirements have not been met, the nursing facility may be fined for
each violation cited and must submit a plan of correction to MDH. MDH must find the
plan acceptable before the facility is found to be back in compliance.
6. Survey results must be made available to residents, families and other interested parties.
Deficiency Categories
1. Administration - A facility must be run in a manner that enables it to use its resources
effectively and efficiently to attain and maintain the highest practicable level of well-
being for each resident. The administration category addresses how well the overall
administration and management of a nursing home is carried out.
2. Quality of Care - The quality of care category addresses how well the facility renders
services provided and supervised by nursing staff. It includes the assessment of the
resident, development of plan for care, following plan of care and evaluating the results
of care. This category evaluates issues such as nutrition, hydration, pressure sores,
activities of daily living, infection control practices, range of motion, vision, hearing,
urinary incontinence, medications, psychosocial functioning, and ability to care for
residents with specialized conditions or treatments such as tube feedings, ostomy care
and respiratory care.
3. Resident Rights - The resident rights category addresses how well the facility succeeds
in ensuring the rights of residents are respected, recognized and upheld. Requirements
evaluated in this section include, but are not limited to, the following: dignity and respect
and a comfortable living environment; quality care and treatment without discrimination;
freedom of choice to make independent decisions; safeguarding residents’ property and
money; safeguards associated with admission, discharge and transfer; privacy in
communication; participation in organizations and activities of choice; an easy to use and
responsive complaint procedure; freedom from physical, verbal, sexual and mental abuse,
corporal punishment and involuntary seclusion; reasonable accommodation of individual
needs; and freedom from restraints.
4. Dietary Services - This category addresses how well resident meals are prepared and
served. It is concerned with the storage, preparation and serving of food under sanitary
conditions. It is also concerned with residents being served meals that meet nutritional
needs and are appetizing for residents.
5. Physical Environment - This category addresses how well the facility maintains the
resident environment to protect the health and safety of its residents, personnel and the
public.
6. Other Services - Specialized Rehabilitative Services, Dental Services, Pharmacy
Services
![PROPOSED 2018 - floridadep.gov Region - DRAFT... · Docme COLL!qoL COLL!qoL luJ go COLL!q L nouucello -OLLI neao 00 L CCGC!I COLL!qoL IVX Lorue COLL!qoL ash 01] q so LL!qoL u BIAq](https://img.pdfslide.net/doc/110x75/5aa619db7f8b9ae7438e63bc/proposed-2018-region-draftdocme-collqol-collqol-luj-go-collq-l-nouucello.jpg)