Embed Size (px)
Citation preview
Multi-Disciplinary Senior Design ConferenceKate Gleason College of Engineering
Rochester Institute of TechnologyRochester, New York 14623
Project Number: P13222
FORMULA SAE TURBOCHARGER INTEGRATIONPhillip Vars: ME Kevin Ferraro: ME Brian Guenther: ME
Aaron League: ME Tyler Peterson: MET Ian McCune: ME
ABSTRACTThe Turbocharger Integration project focuses on the implementation of a turbocharger and necessary peripherals into the existing Yamaha WR450F engine package of RIT’s Formula SAE competition vehicle. The integration of the turbocharger (a turbine driven by exhaust gases that drives a compressor to compress air before it enters the combustion chamber of the engine) was decided upon to provide an increase in power without an excessive fuel economy penalty to improve the overall scoring potential of the car. To ensure success, a complex engine simulation was developed, and iterative analyses within the simulation model were used to design the necessary intake, exhaust, and cooling system components. Electronic boost control is used to improve the scoring potential of the car by allowing the balance of power and fuel efficiency to be tuned for different events of the FSAE competition. The components were packaged into the vehicle according to Formula SAE rules, and 3D CAD software was utilized to ensure fitment within the car. In addition, the components were designed to be mounted within the car robustly to withstand the extreme vibrations and heat that the racecar endures. These components were then manufactured and installed on the Formula team's DC engine dynamometer for tuning and verification of simulation results. Multiple engine maps will be developed to maximize the scoring potential in each of the competition events.
INTRODUCTIONThe RIT Formula SAE Team is a group of students that design and build a small open wheeled racecar to compete in the Formula SAE and Formula Student series. The rules for these competitions are written to allow freedom of design while providing a strong emphasis on safety, performance, reliability, cost, and fuel efficiency. The competition is separated into several events each with its own scoring weight and method. The weight of the fuel efficiency score as well as the method of calculating the score has been changed over the last several years to put a larger emphasis on fuel economy while maintaining performance. The fuel efficiency score is now worth 10% of the overall competition score and depends on both the amount of fuel used during the endurance event as well as the overall endurance time. This has forced teams to improve their efficiency while maintaining performance.
The team has developed a lap time simulator that allows a variety of vehicle parameters to be varied to help determine what combination will yield the greatest overall scoring potential. This led to a significant redesign for the 2012 car where weight, fuel efficiency, and down force were heavily favored over peak power output. As a result a much smaller and lighter car was developed with a single cylinder engine as opposed to the 4 cylinder engines used previously. This change meant that there was a power reduction of approximately 45% between the 2011 (F19) and 2012 (F20) cars. However, F20 won the endurance event at the Formula Student Germany competition and took second place in fuel efficiency which showed that the lighter, fuel efficient formula the team had come up with was a success.
Internal combustion engine efficiency has become the primary focus of the powertrain industry within the past decade. Both production and racing applications have relied heavily on forced induction gains to increase not only overall fuel efficiency, but also specific power output. Turbo charging an engine has the potential to significantly increase the peak power with minimal weight gains while maintaining engine efficiency. The lap time simulator showed that the performance gains of turbocharging the engine outweighed the weight, fuel efficiency, and cost
Copyright © 2013 Rochester Institute of Technology
Proceedings of the Multi-Disciplinary Senior Design Conference Page 2
penalties. The use of electronic boost control allows for control of the power versus fuel efficiency trade off, so that the scoring potential can be optimized for each event.
PROCESSIn order to optimize the performance of the powertrain the turbocharger had to be sized correctly for the application, the 450cc single cylinder Yamaha WR450F engine. The complete package had to comply with all of the rules of the Formula SAE series, most notably the need to have a 20mm diameter restrictor after the throttle and before the compressor side of the turbocharger. In addition, the package also had to meet FSAE noise regulations, which require all cars to maintain a level of less than 110dB at a specified RPM (7500 RPM). The turbocharger package also needed to fit within the existing chassis design and keep any intake components that are outside of the crash structure at least 13.8” above the vehicle ground plane. The second priority after rules compliance was reliability and the ability to access components for regular maintenance or in the event of a failure. The primary goals of the turbocharger integration are overall horsepower and torque gains, optimized engine control unit (ECU) maps, and consistent engine performance (verified via dynamometer testing). The entire package needed to be tuned properly since a poor tune could result in less than ideal fuel economy and poor reliability. The increased performance as a result of the turbo charger has the potential to stress the engine more heavily and reduce reliability. Reliability also had to be addressed as part of the integration. In addition the cooling system must be able to support the increased performance. It was important to have quick and linear throttle response to make the car as easy to drive as possible for the drivers to extract the most out of the car’s performance. Weight gain must be kept to a minimum, with a goal of less than ten pounds of added overall weight compared to the naturally aspirated version of the powertrain. The use of off-the-shelf parts regarding turbocharger components was preferred to ensure that replacement parts would be readily available, as well as to keep cost and development time to a minimum, with sponsorship key to making the system affordable to the team.
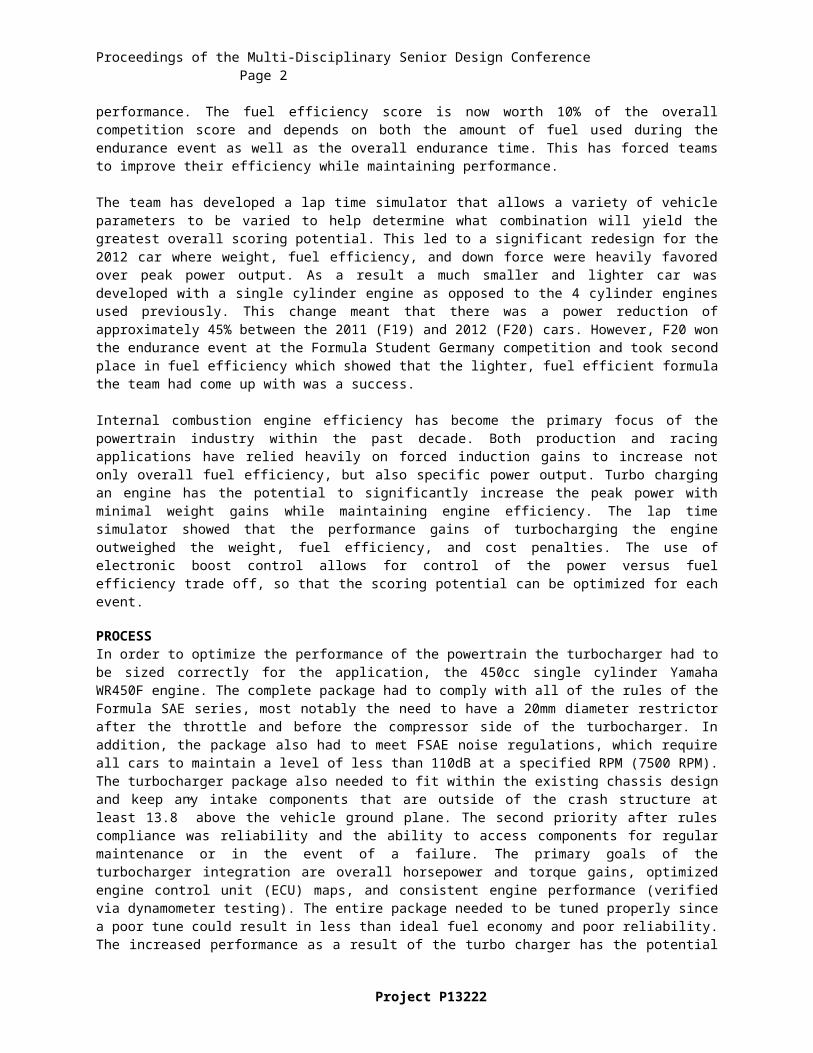
SIMULATIONRIT’s custom Lap-Time-Simulator was used to compare the scoring potential of different levels of power, fuel usage, weight, and aerodynamic downforce of the car. These initial simulations led to the decision of implementing a turbocharger system onto the vehicle, as it would lead to the maximum number of points gained at FSAE competitions, and as a result would give us the best chances of winning the competition overall. Below are some results of the lap time simulator. The first three rows of the simulation, seen below in Figure 1, are results using parameters of last year’s car with minor variations of weight and downforce. The next three are possibilities of this year’s car with the turbocharger where the same engine map is utilized for the autocross and endurance events in the competition. The last three use a detuned engine map for endurance to save fuel. The points show that the trade-off between fuel consumption and peak power will depend heavily on the time and fuel usage of the fastest car in the endurance event. To finalize the engine map for the endurance event, models of other teams’ cars will be included to determine optimal power and fuel usage levels.
Figure 1: Tabulated Lap-Time-Simulator Results
The selection of the turbocharger for our application is primarily based on engine simulation using the software package "GT Power". This is a 1-D simulation of the performance of an engine and its associated flow system. The simulation was used to compare the performance of 2 different models of turbochargers offered by Honeywell, the GT1238 and GT0632.
Project P13222
Proceedings of the Multi-Disciplinary Senior Design Conference Page 3
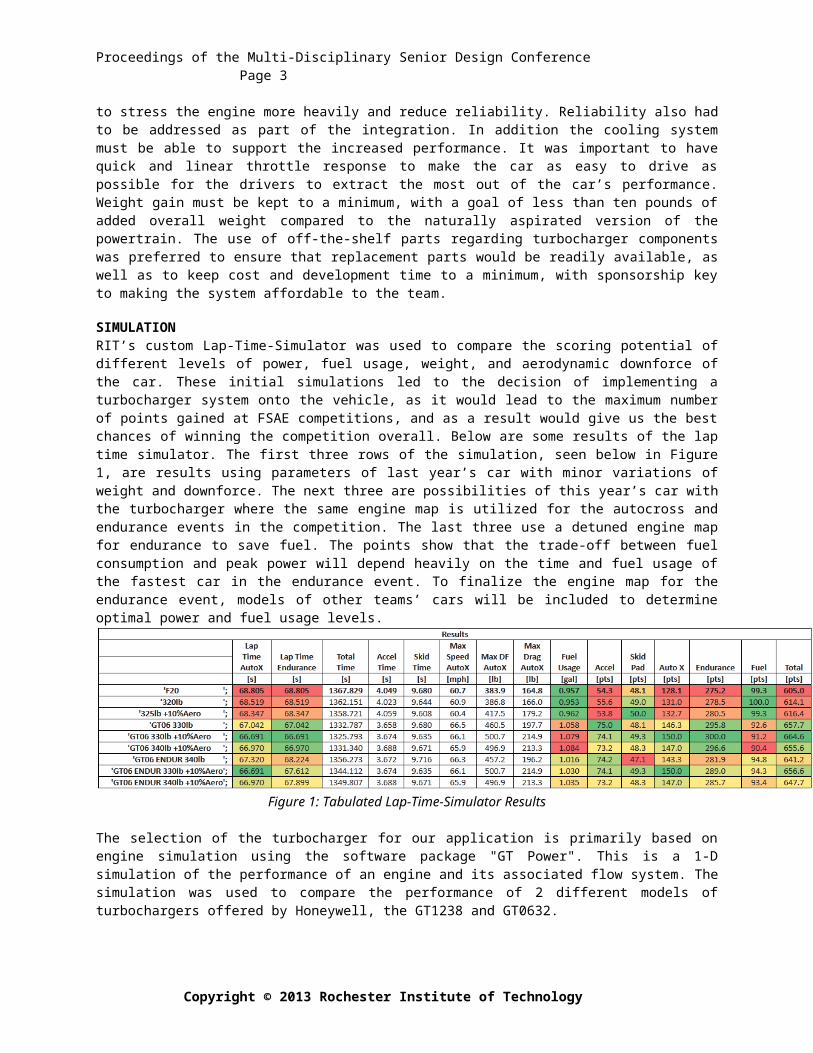
Figure 2: GT Power Simulation SchematicEach flow component of the engine system is represented through its own module. The schematic follows the flow through each component and shows connections between them. The software simulates engine performance at several discrete operating conditions and can show a variety of performance characteristics. Nearly every operating parameter can be varied allowing for a very detailed analysis.
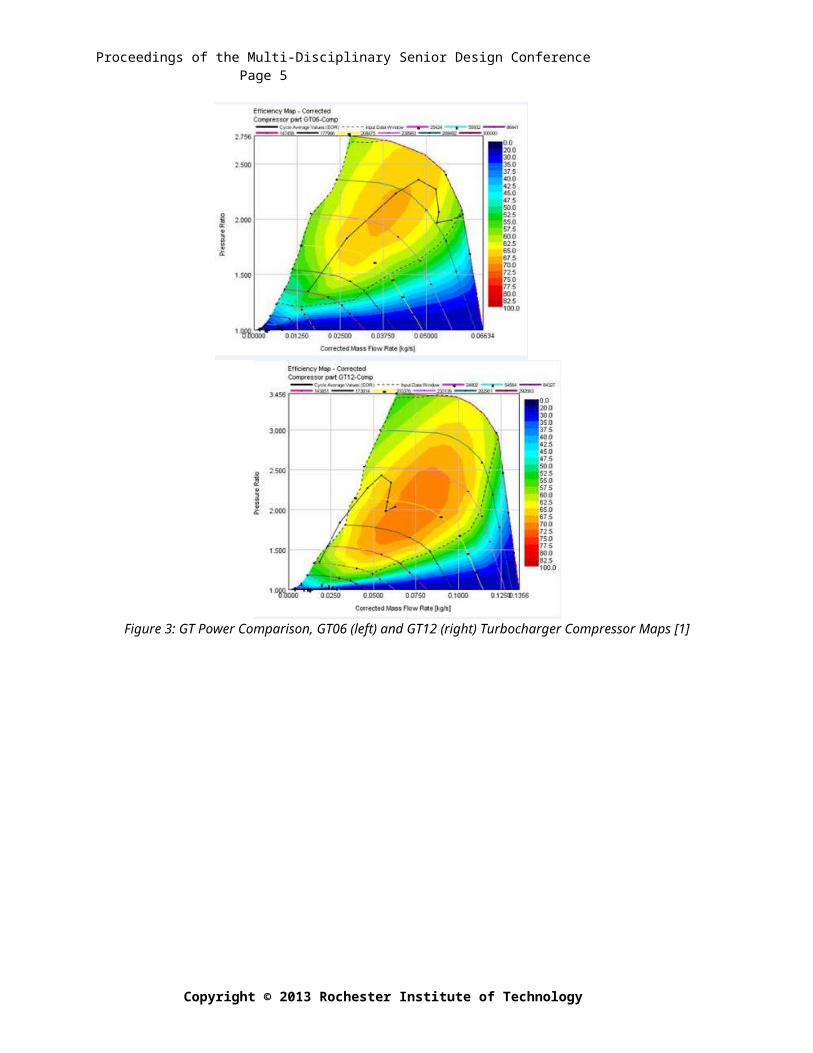
When comparing turbochargers it is very useful to compare their efficiency map (shown by the islands of colors seen below in Figure 3) and to make sure that during operation the load points of the engine do not cross the surge line (the left side boundary of the map) or the choke line (the right side of the map). If the turbo operates past the surge line, the flow within the turbo will be unstable, and extended operation in that part of the map can lead to premature turbo failure due to heavy thrust loading [1]. If the turbo operates to the right of the choke line, efficiency of the compressor is extremely low and the speed of the turbo will be approaching or exceeding the allowable limit. Using these criteria it is clear that the GT06 is a better fit for the given application. In addition, the simulation was used to size many of the components of the new engine package.
Copyright © 2013 Rochester Institute of Technology
Proceedings of the Multi-Disciplinary Senior Design Conference Page 4
Figure 3: GT Power Comparison, GT06 (left) and GT12 (right) Turbocharger Compressor Maps [1]
Project P13222
Proceedings of the Multi-Disciplinary Senior Design Conference Page 5
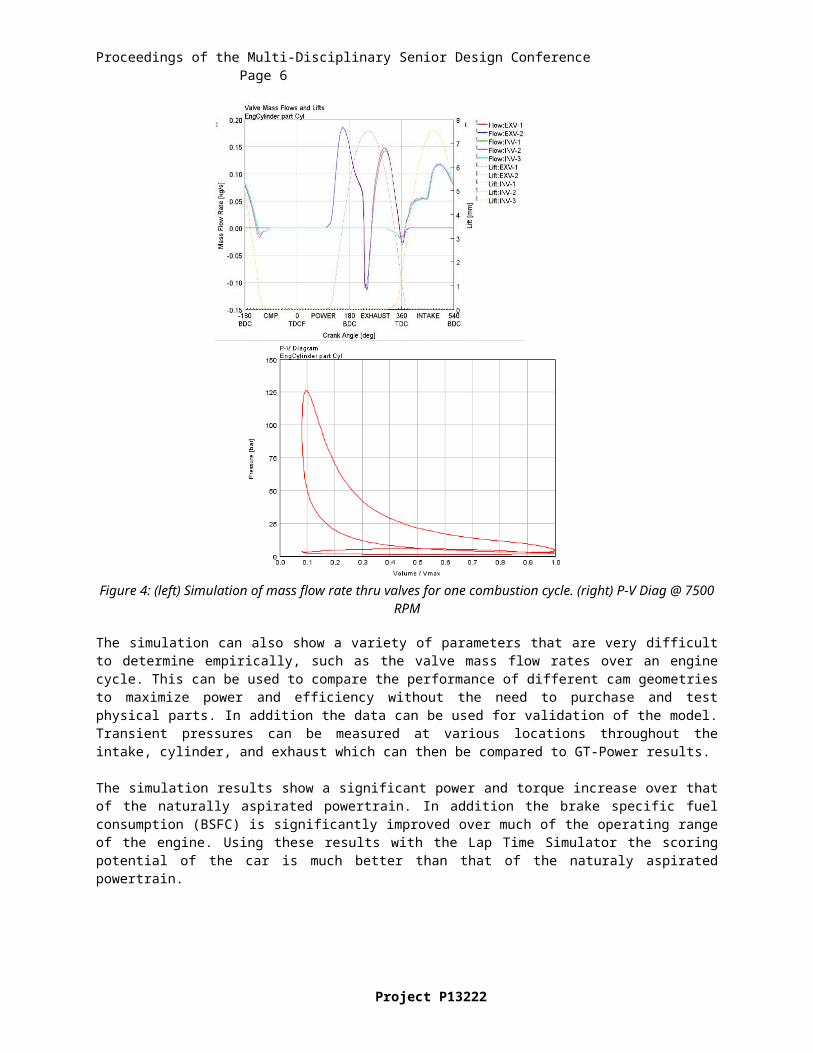
Figure 4: (left) Simulation of mass flow rate thru valves for one combustion cycle. (right) P-V Diag @ 7500 RPM
The simulation can also show a variety of parameters that are very difficult to determine empirically, such as the valve mass flow rates over an engine cycle. This can be used to compare the performance of different cam geometries to maximize power and efficiency without the need to purchase and test physical parts. In addition the data can be used for validation of the model. Transient pressures can be measured at various locations throughout the intake, cylinder, and exhaust which can then be compared to GT-Power results.
The simulation results show a significant power and torque increase over that of the naturally aspirated powertrain. In addition the brake specific fuel consumption (BSFC) is significantly improved over much of the operating range of the engine. Using these results with the Lap Time Simulator the scoring potential of the car is much better than that of the naturaly aspirated powertrain.
Copyright © 2013 Rochester Institute of Technology
Proceedings of the Multi-Disciplinary Senior Design Conference Page 6
Project P13222

Proceedings of the Multi-Disciplinary Senior Design Conference Page 7
Figure 5: Comparison of Turbocharged and Naturally Aspirated WR450 Engine Over Full Operating Range
SYSTEM LAYOUTThe system layout is akin to a typical turbocharged engine package, albeit with a few differences to ensure maximum performance and adherence to the FSAE rules. The components that are not typical include the 20mm intake restrictor, the boost control solenoid, and intercooler.
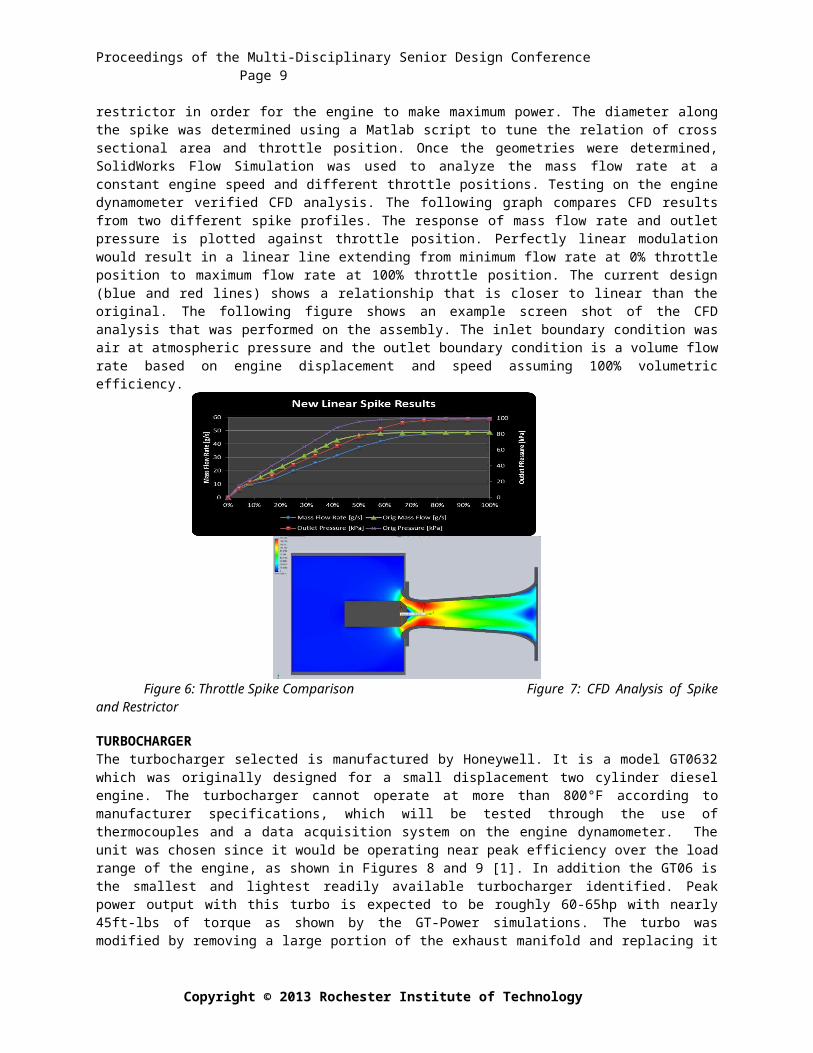
THROTTLE AND RESTRICTORThe throttle modulates the airflow into the engine and consists of a spike-shaped plug, similar to a needle valve, which controls the size of the opening into the mandated 20mm restrictor. A cable connected to the throttle pedal of the car pulls the spike away from the opening to increase the flow rate of air. A spring returns the spike to the rest position close to the opening of the restrictor, where the engine idles. The spike geometry has significant influence on the nature of the throttle modulation and response. One method of improving the drivability of the car is to have accurate and predictable throttle modulation which can be achieved through a linear response between the throttle position and the flow rate of air into the engine. In addition, the throttle/spike assembly must allow for proper pressure recovery after the restrictor in order for the engine to make maximum power. The diameter along the spike was determined using a Matlab script to tune the relation of cross sectional area and throttle position. Once the geometries were determined, SolidWorks Flow Simulation was used to analyze the mass flow rate at a constant engine speed and different throttle positions. Testing on the engine dynamometer verified CFD analysis. The following graph compares CFD results from two different spike profiles. The response of mass flow rate and outlet pressure is plotted against throttle position. Perfectly linear modulation would result in a linear line extending from minimum flow rate at 0% throttle position to maximum flow rate at 100% throttle position. The current design (blue and red lines) shows a relationship that is closer to linear than the original. The following figure shows an example screen shot of the CFD analysis that was performed on the assembly. The inlet boundary condition was air at
Copyright © 2013 Rochester Institute of Technology

Proceedings of the Multi-Disciplinary Senior Design Conference Page 8
atmospheric pressure and the outlet boundary condition is a volume flow rate based on engine displacement and speed assuming 100% volumetric efficiency.
Figure 6: Throttle Spike Comparison Figure 7: CFD Analysis of Spike and Restrictor
TURBOCHARGERThe turbocharger selected is manufactured by Honeywell. It is a model GT0632 which was originally designed for a small displacement two cylinder diesel engine. The turbocharger cannot operate at more than 800°F according to manufacturer specifications, which will be tested through the use of thermocouples and a data acquisition system on the engine dynamometer. The unit was chosen since it would be operating near peak efficiency over the load range of the engine, as shown in Figures 8 and 9 [1]. In addition the GT06 is the smallest and lightest readily available turbocharger identified. Peak power output with this turbo is expected to be roughly 60-65hp with nearly 45ft-lbs of torque as shown by the GT-Power simulations. The turbo was modified by removing a large portion of the exhaust manifold and replacing it with a much smaller and lighter version. This was done to shed unnecessary weight and make it possible to mount the turbo to the single cylinder engine instead of the two cylinder engine that it was designed for.
Figure 8 (left): Compressor Efficiency Map vs. Corrected Mass Flow Rate and Pressure Ratio
Figure 9 (right): Turbine Efficiency Map vs.
Pressure Ratio and Reduced Speed
MOUNTINGThe turbocharger assembly must be held firmly in place, constrained in all axes of rotation and translation. Mounting must also allow for thermal expansion and be isolated from vibration as much as possible. In addition, the specifications of the turbocharger must be adhered to in order to ensure longevity and proper performance. To meet this requirement, the axis of revolution must be plus/minus 10 degrees to the ground plane, and its oil outlet direction must be parallel to the ground plane plus/minus 35 degrees. This is in order for gravity to assist in the lubrication of the journal bearings in the turbo. Using the car’s main roll hoop as a base, standoff tubes were welded to nodes that already support engine and chassis loads to maintain stiffness. Structural analysis and modal (vibration) analysis will be used initially to prove the effectiveness of the mounting system pending dynamometer testing and verification of inertial loads/vibrations. Mounting may be modified to accommodate stiffness and
Project P13222
Proceedings of the Multi-Disciplinary Senior Design Conference Page 9
strength requirements if experimental results are not akin to the simulated values. In that case, alternative options such as mounting the turbocharger assembly to the chassis may be presented, as well as a combination of support from the roll hoop and chassis.
Figure 10: CAD of Mounting Solution Figure 11: Modified Turbine Housing Figure 12: Stock Turbocharger [1]
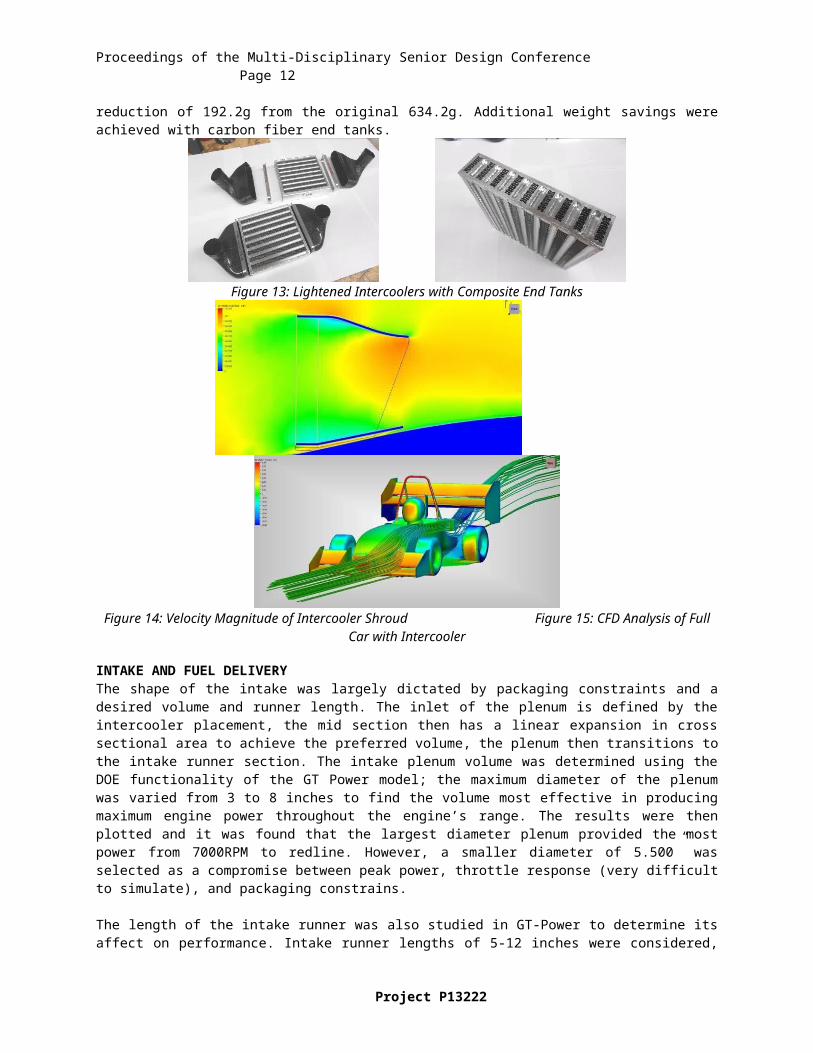
INTERCOOLERAn intercooler (an air-air heat exchanger used to remove the heat from the compressed air exiting the compressor before it enters the plenum and combustion chamber), although not necessary for operation of the system, was added to extract more efficiency from the new engine package and thus more power. This is a result of lowering the temperature and increasing the density of the intake charge into the combustion chamber to allow for more fuel and air to be burned per combustion event. In addition, it allows for increased boost to be run with less risk of detonation within the combustion chamber, which occurs most often as a result of excessive heat within the cylinder [2]. The intercooler width and thickness dimensions affect the restriction to the induction stream which passes through it, while the cooling stream of ambient temperature air passes through the plane made by the length and width dimensions. The length of the intercooler affects the amount of cooling that occurs, and was maximized while remaining within packaging constraints. The intercooler was added to the GT Power model to simulate its effect on the overall system, however the results will not be accurate until verified with test data. The model of the intercooler was then placed in the full car model to determine the location best suited for it, as well as to design a shroud to maximize the cold stream efficiency. The shroud design is a diverging nozzle, used to reduce the speed of the flow to increase the pressure drop through the intercooler. The speed of the air in the model was chosen to be 60mph as the highest speed commonly analyzed. Material was removed from the intercooler core to save weight on the top, bottom and sides, with slots made with a ball end mill on each face and both ends. This resulted in an overall weight reduction of 192.2g from the original 634.2g. Additional weight savings were achieved with carbon fiber end tanks.
Figure 13: Lightened Intercoolers with Composite End Tanks
Copyright © 2013 Rochester Institute of Technology

Proceedings of the Multi-Disciplinary Senior Design Conference Page 10
Figure 14: Velocity Magnitude of Intercooler Shroud Figure 15: CFD Analysis of Full Car with Intercooler
INTAKE AND FUEL DELIVERYThe shape of the intake was largely dictated by packaging constraints and a desired volume and runner length. The inlet of the plenum is defined by the intercooler placement, the mid section then has a linear expansion in cross sectional area to achieve the preferred volume, the plenum then transitions to the intake runner section. The intake plenum volume was determined using the DOE functionality of the GT Power model; the maximum diameter of the plenum was varied from 3 to 8 inches to find the volume most effective in producing maximum engine power throughout the engine’s range. The results were then plotted and it was found that the largest diameter plenum provided the most power from 7000RPM to redline. However, a smaller diameter of 5.500” was selected as a compromise between peak power, throttle response (very difficult to simulate), and packaging constrains.
The length of the intake runner was also studied in GT-Power to determine its affect on performance. Intake runner lengths of 5-12 inches were considered, and based on the simulations the longest runner length of 12 inches provided the most power from 5500RPM to 8000RPM. A 9” length runner was chosen to package better than the marginally better 12” length. CFD analysis of the proposed design was used to verify that no unusual flow patterns existed that would make the 1-D simulation invalid.
Figure 16: CFD Analysis of Intake Plenum, Runner, and IntercoolerThe cone geometry of the fuel injector spray was modeled with injector spray pattern data supplied by Delphi. This was used in conjunction with a model of the intake port geometry and plenum geometry to place injectors for a 2 stage injection system. The primary injector is placed as close to the intake ports as possible and aligned to the direction of flow, this will help with starting and low speed operation. The secondary injector was placed in the plenum aimed toward the runner inlet to minimize wall wetting and maximize atomization at higher engine speeds. The engine will be tuned and characterized on each injector individually to determine the crossover point where the
Project P13222

Proceedings of the Multi-Disciplinary Senior Design Conference Page 11
best performance trades from one injector to the other. A mold was made and the intake was manufactured out of two halves of carbon fiber which were then bonded together.
Figure 17 (left): View of Overall Engine Package
Figure 18 (center): Top View of Intake Showing Loc of Fuel Inj.
Figure 19 (right): Carbon Fiber Intake Plenum after Mold Release
BOOST CONTROLThe level of boost needed from the turbocharger to make the power curve desired from the engine package is derived from the GT Power simulation. Control of the boost level to ensure maximum efficiency and reliability is achieved via the internal wastegate (a valve held closed by a spring force that opens under a specified pressure from the plenum to allow exhaust gas to bypass the turbine of the turbocharger). The boost level is electronically controlled by positioning a three-way solenoid in-line between the plenum pressure and the diaphragm of the wastegate with a vent to atmosphere. To increase the boost level, the solenoid will open so that pressure is routed away from the diaphragm and vented to atmosphere. To decrease the boost pressure, the solenoid closes so that pressure is routed to the diaphragm, and the wastegate is forced open to allow the exhaust gasses to bypass the turbine. The ECU (Engine Control Unit) will use a PID control algorithm along with pulse width modulation to achieve the desired boost level.
EXHAUSTThe shape of the exhaust system is essential to optimize the efficiency of the turbine and improve overall engine performance. Design challenges include dealing with the non-steady, highly pulsed flow of the exhaust, packaging, manufacturability (bend radius could not be tighter than 3 inches due to the .020” wall thickness of the tubing) and ensuring the extreme heat would not damage any components. Several iterations of exhaust design were modeled in Creo and simulated in GT-Power. The lengths of the straight section of the exhaust immediately after exiting the head of the engine (“header length”) and immediately after the turbine (“exhaust length”) were varied and compared in GT Power to find the best geometry. The header length was varied from .5 inches to close to 3.5 inches, with the 3.5 inch length providing the most power in the operating range. However, due to packaging constraints the length had to be reduced to just over 2.5 inches. The exhaust length was varied from .5 inch to 8 inches, with minimal effect on the overall performance of the engine. A header “bomb” (a wider section of the exhaust tubing that allows for expansion and contraction of exhaust pressure pulses through the system to theoretically increase flow [3]) was also simulated in GT Power, but it did not make any significant change in performance and therefore has not been adopted into the system. The tubing chosen for the exhaust was thin-walled Commercially Pure Grade 2 Titanium, for its high working temperature and low density. The titanium was CNC bent prior to welding. It had to be welded in an oxygen free environment, so a fish tank was modified so it could be purged with Argon as the tubing was welded inside.
Copyright © 2013 Rochester Institute of Technology
Proceedings of the Multi-Disciplinary Senior Design Conference Page 12
Figure 20: Effect of various header lengths on power Figure 21: Effect of various exhaust lengths on power
Project P13222

Proceedings of the Multi-Disciplinary Senior Design Conference Page 13
ENGINESome of the engine components needed to be modified to improve reliability and to increase efficiency. Swaintech coatings on the piston face, combustion chamber, intake and exhaust ports, and valves will be applied with
specifically designed materials to improve engine performance, cooling, and reliability. Along with these coatings, the connecting rod of the engine needed to be replaced with an aftermarket Carrillo connecting rod (requiring a full engine tear down and rebuild). The flywheel is modified to incorporate a timing ring for accurate timing.
The engine calibration will be speed density based, using manifold air pressure measurements as well as additional compensations. This will result in a more reliable and consistent calibration on a forced induction engine than a throttle position based calibration will allow. Finally, an aluminum sheet fuel tank was manufactured with the volume determined by the simulated fuel consumption during the endurance event of the competition.
Figure 22: CAD of Finalized Exhaust Design
RESULTS AND DISCUSSIONThe final design of the engine package has yet to be validated with testing. With the exception of testing and tuning the engine package remaining specifications have been met. The package is sized appropriately for the current chassis, and abides by all FSAE rules (noise level has not been verified yet- it will be measured once the car is completed). The accessibility of the turbocharger components is on par with the rest of the components within the chassis. Once the firewall is removed the turbocharger will be able to be maintained and removed relatively easily. Weight gain has been kept to a minimum as well, with all of the components modified to remove material or manufactured out of lightweight material, including titanium, aluminum and carbon fiber. Additionally, weight has been pulled out of nearly all of the other systems of the car. Finally, easily sourced components were used. Sponsorship of a turbocharger from Honeywell along with solenoid valves from MAC valves was secured.
In terms of testing, a DC motor dynamometer will be used to verify simulation results and to tune the ECU as soon as the remaining components are manufactured. The current DC dynamometer setup needed to be modified to accommodate the intake and exhaust systems. Testing and tuning the engine with the actual on car components has delayed the start of testing but will save manufacturing time and will lead to a more accurate calibration and validation. Measurements will include: torque, engine speed, crank angle, and cylinder pressure. In addition, temperature and pressure measurements will be taken at the intake before the intercooler, intake after the intercooler, intake plenum, exhaust near the exhaust port, and at the exhaust after the turbine. Data logging will occur once per degree of crank angle to verify transient results of GT-Power analysis.
CONCLUSIONS AND RECOMMENDATIONSAssuming that the testing verifies simulated results, the project has been a success. The goals of improving the scoring potential of the car have been met, the weight penalty has been minimized, and potential reliability problems have been addressed. The engine simulation developed has allowed for a single iteration of component manufacturing, resulting in significant time and resources saved. The combination of the Lap Time Simulation and the GT-Power model has shown a significant performance improvement and will help to find a balance between fuel economy and performance for the endurance map. Once the manufacturing is complete testing on the dynamometer will allow for verification of the engine simulation and accurate calibration of the engine maps.
REFERENCES[1] Turbo Efficiency Maps, Stock Photo of GT06. Web. <www.turbobygarrett.com>.[2] Intercooling Removes Heat. Web. <www.procharger.com>.[3] MX/44 Header Bomb. Web. <www.fmfracing.com>.[4] Race Coatings. Web. <www.swaintech.com>.
Copyright © 2013 Rochester Institute of Technology

Proceedings of the Multi-Disciplinary Senior Design Conference Page 14
ACKNOWLEDGMENTSOur Senior Design Team would like to thank the following individuals for their contributions to our project: The RIT FSAE Racing Team, Dave Hathaway, Honeywell, Swain Tech, Yamaha, Kulite, Woolf Aircraft, MAC Valves, and D&W Diesel
Project P13222