Embed Size (px)
Citation preview
Techniques for efficient, real-time, 3D visualization of multi-modality
cardiac data using consumer graphics hardware
David Levina, Usaf Aladlb, Guido Germanoc,d, Piotr Slomkac,d,*
aDepartment of Medical Biophysics, University of Western Ontario, London, Ontario, CanadabDepartment of Diagnostic Radiology and Nuclear Medicine, University of Western, Ontario, London, Ontario, Canada
cDepartment of Imaging and Medicine, Cedars-Sinai Medical Center, Los Angeles, CA, USAdDepartment of Medicine, David Geffen School of Medicine, UCLA, Los Angeles, CA, USA
Received 15 September 2004; revised 22 February 2005; accepted 22 February 2005
Abstract
We exploit consumer graphics hardware to perform real-time processing and visualization of high-resolution, 4D cardiac data. We have
implemented real-time, realistic volume rendering, interactive 4D motion segmentation of cardiac data, visualization of multi-modality
cardiac data and 3D display of multiple series cardiac MRI. We show that an ATI Radeon 9700 Pro can render a 512!512!128 cardiac
Computed Tomography (CT) study at 0.9 to 60 frames per second (fps) depending on rendering parameters and that 4D motion based
segmentation can be performed in real-time. We conclude that real-time rendering and processing of cardiac data can be implemented on
consumer graphics cards.
q 2005 Elsevier Ltd. All rights reserved.
Keywords: 3D; Hardware-accelerated; Volume rendering; Segmentation; Multi-modality; Real-time
1. Introduction
In clinical practice, detection and evaluation of coronary
artery disease can be performed using several imaging
modalities such as Single Photon Emission Tomography
(SPECT) [1,2], Positron Emission Tomography (PET) [3],
cardiac Computed Tomography (CT) [4,5], cardiac Mag-
netic Resonance Imaging (cMRI) [6] or echocardiography
[7]. Patient examinations often involve multiple combi-
nations of these modalities [8]. Such information can be
presented in the form of dynamic 3D displays (4D displays).
However, efficient, interactive visualization of such cardiac
information in a uniform fashion is challenging because of
the dynamic, multi-frame character of the data,
distinct character of the images obtained by different
modalities, presence of extra cardiac structures and often
0895-6111/$ - see front matter q 2005 Elsevier Ltd. All rights reserved.
doi:10.1016/j.compmedimag.2005.02.007
* Corresponding author. Address: AIM Program, Department of Imaging
#A047, Cedars-Sinai Medical Center, 8700 Beverly Boulevard, Los
Angeles, CA 90048, USA. Tel.: C1 310 423 4348; fax: C1 310 412 0173.
E-mail address: [email protected] (P. Slomka).
large (O100 Mb, 512!512 matrix size) datasets. Pre-
viously such dynamic volume rendering abilities were
limited to high-end, expensive 3D graphics workstations [9]
but new consumer graphics processors, such as the Radeon
9700 Pro from ATI and the Geforce FX from Nvidia can
provide similar rendering power on desktop PCs [10,11].
This computational power is already leveraged for such
professional 3D graphics applications as computer anima-
tion and special effects [12] in order to provide real-time
feedback to artists [13]. The processing power of these cards
should also be well suited for the intensive task of
processing and visualizing medical imaging data.
In this study we have explored the newly developed
programmable rendering capabilities (OpenGL vertex and
texture shaders) of these cards to implement volume
rendering as well as other methods for the visualization of
cardiac anatomy and function in real-time. We demon-
strate the implementation of accelerated, high-quality
techniques for interactive 4D volume visualization of
16-bit data, coronary angiography, MRI cine data, fused
multi-modality data and functional (SPECT and PET)
data. We utilize 3D textures with hardware-accelerated
trilinear interpolation and texture shaders to implement
the presented techniques. These techniques allow
Computerized Medical Imaging and Graphics 29 (2005) 463–475
www.elsevier.com/locate/compmedimag
D. Levin et al. / Computerized Medical Imaging and Graphics 29 (2005) 463–475464
physicians to efficiently visualize multi-modality 4D
cardiac scans in real-time using an inexpensive PC
platform with the latest 3D graphics cards.
2. Methods
All the presented algorithms were implemented using
Microsoft Visual CCC6.0. The visualization algorithms
were implemented using the OpenGL application program-
ming interface (API) [14]. Dynamic volume rendering,
fusion of volumes with surfaces, vessels and slices as well as
multi-planar display of multi-series cMRI were combined in
a single software package (Volviz) providing a unified
platform for real-time visualization of multi-modality
cardiac data.
2.1. Volume rendering
Volume rendering is the direct rendering of data
represented as 3D scalar fields [15]. Displaying 3D medical
imaging volumes is traditionally done using complicated
software algorithms [9,16]. In contrast, we have
implemented three hardware-accelerated algorithms
(volume rendering with axis-aligned slices, volume render-
ing with view-aligned slices and pre-integrated volume
rendering) that allow real-time performance. The presented
volume rendering methods exploit the hardware-accelerated
texturing capabilities of OpenGL [17]. Volume rendering
can be implemented using either 2D or 3D texture mapping
[11,18].
2.1.1. Volume rendering with axis-aligned slices
A baseline volume rendering algorithm using 2D textures
[18] was implemented to ensure our software would run on
older or lower-end graphics hardware such as that found in
many laptops. This algorithm has been described previously
[10,19] and was implemented for compatibility reasons. The
2D texture-based algorithm has several drawbacks. The first
is that it requires three individual sets of volume data to be
stored in texture memory for each imaging volume.
Secondly, it requires axis-aligned slicing of the volume
data during rendering and this can cause artifacts in the final
display.
2.1.2. Volume rendering with view-aligned slices
This algorithm requires the GL_TEXTURE_3D_EXT
OpenGL extension. This extension adds 3D texture support
to OpenGL. Instead of storing a volume as multiple stacks
of 2D textures, the dataset is stored as a single 3D texture
using the glTexImage3D() OpenGL method [20]. The
advantage of this approach is that it requires only one
copy of the volume data to be stored (as opposed to three
copies in the axis-aligned algorithm) and it takes advantage
of hardware-accelerated trilinear interpolation to allow 3D
interpolation between adjacent slices.
In order to render the volume, view-aligned slices are
used. A stack of uniformly spaced slices (polygons, but not
necessarily rectangular) is created by intersecting the
viewing ray (the ray perpendicular to the view-plane) with
the volume. This creates a stack of slices that is parallel to
the view-plane but not necessarily aligned with one of the
three major coordinate axes. These slices are drawn in a
back-to-front order and blended as described by Eq. (1). The
spacing between the slices determines the quality of the
resulting image.
I Z ð1 KaÞIb KaIf (1)
where a is the transparency of the voxel being drawn, Ibis
the intensity of the background voxel, initially set to 0 and If
is the intensity of the voxel being drawn.
The blending can be done in hardware by using the
OpenGL GL_SRC_ALPHA, GL_ONE_MINUS_SRC_AL-
PHA blending option. The spacing between the slices
determines the quality of the image.
2.1.3. Pre-integrated volume rendering using view-aligned
slices and texture shaders
One of the newest advances in consumer level graphics
cards is the addition of programmable shaders. Shaders are
small programs which can be used to replace a graphics
card’s fixed rendering pipeline with specialized operations
[21]. This volume rendering algorithm uses shaders to
evaluate the volume rendering integral and achieve even
higher volume rendering quality. Texture shaders are
accessed using the ARB_fragment_program [14] extension
for OpenGL.
The pre-integrated volume rendering algorithm [11] is
similar to the one described in Section 2.1.2. The volume is
stored as a 3D texture and view-aligned slices are used to
render the volume on the screen. The difference is in how
the texture is applied to each slice. In the standard algorithm
the intensity of each slice is read directly from the texture
and drawn to the screen. Pre-integrated volume rendering
renders slabs of volume instead of slices. It does this by
integrating the intensities between adjacent slices and
drawing such composite intensity values to the screen [11].
This approach requires the creation of an additional 2D
texture (integral lookup texture), which stores the integrals
obtained from the volume’s color transfer function (the
integrals for the Red, Green, Blue and Alpha transfer
functions can be stored in a single RGBA pixel) such that
Integral Lookup Textureðx;yÞZ
ðy
xColor Transfer Function
(2)
where x and y are the bounds of the integration and also the
position (x,y) where the integrated value will be stored in the
integral lookup texture.
The algorithm’s name is derived from the fact that the
integral lookup texture is pre-computed when the volume is
D. Levin et al. / Computerized Medical Imaging and Graphics 29 (2005) 463–475 465
loaded; hence the color transfer function has been pre-
integrated.
In order to save texture memory, a 256!256 2D texture
was used for the integral lookup texture, allowing us to use a
256-color (8-bit) color table for each volume. We created
this texture according to the following formulas for the
opacity (a) and color (C) values stored in the 2D texture
aðx; yÞz1 Kexp Kd
y KxðTðxÞKTðyÞÞ
� �(3)
where x and y are the texture coordinates of the 2D texture, d
is the distance between the slices intersected with the
volume and
TðxÞ Z
ðx
0tðsÞds
where t(s) is the opacity component of the color table.
Cðx; yÞzd
y KxðKðyÞKKðxÞÞ (4)
where x and y are the texture coordinates of the 2D texture, d
is the distance between the slices intersected with the
volume and
KðxÞ Z
ðx
0tðsÞcðsÞds
where t(s) is the opacity component of the color table and
c(s) is the color component.
When the volume is rendered, a stack of view-aligned
slices is calculated but instead of calculating one texture
coordinate for each vertex, two are calculated. A ‘front’
texture coordinate is calculated at the point of intersection
with the volume and a ‘back’ coordinate is derived by
adding a distance d to the ‘front’ coordinate in a direction
perpendicular to the view-plane. Eq. (2) is calculated by
performing a dependent texture lookup using an OpenGL
texture shader. The intensities of the front and back voxels
are used to look up the corresponding integrated value in the
integral lookup texture. This effectively renders the volume
using a series of slabs with an arbitrary thickness d. Higher
image quality is achieved because instead of only allowing
voxels to be one of 256 colors, there is a palette of 2562
available.
2.1.4. Real-time diffuse and specular lighting of volume
rendered data
OpenGL texture shaders can also be used to perform real-
time lighting calculations thus providing accurate shading
of volume data [11]. This technique can be applied to all the
described volume rendering algorithms provided the appro-
priate hardware features are available. The normal vector at
each voxel is computed using a three dimensional Sobel
filer, applied at that (x,y,z) point. If RGBA textures are used
to store the volume, the R component of the texture can be
used to store intensity of each voxel while the GBA
components can be used to store the voxel’s normal vector.
A texture shader can then be used to calculate the lighting
equation (Eq. (5)).
I Z IaC C IdCðn,lÞC IsCðn,hÞx (5)
Where
I is the final intensity of the voxel,
Ia is the ambient light intensity,
Id is the diffuse light intensity,
Is is the specular light intensity,
C is the color of the voxel,
n is the voxel’s normal vector,
l is the light source vector,
h is the vector half way between the light source vector
and the view point vector
x is the specular exponential value.
2.1.5. Virtual reality rendering of CT data
Recent volume rendering workstations provide a
special virtual reality (VR) rendering mode [22] using
software volume rendering techniques. This mode uses
special color tables to enhance the appearance of
volumetric data and is used primarily for CT data due
to the predictable intensity values of specific tissues in
Hounsfield Units (HU). Because each tissue in the body
belongs to a particular HU range, colors can be assigned
to specific HU values and thus specific tissues. Such VR
volume rendering can be used with all three presented
hardware-based rendering techniques. Linearly interpolat-
ing between color ranges provides accurate color transfer
functions for volume rendering. In order to enhance the
appearance of the volume we also perform a 3!3!3
averaging of voxel normal vectors. This gives the
rendered volume a smoother appearance when shading
is applied.
2.1.6. Volume clipping
Due to the 3D nature of a volume rendered display,
extraneous parts of the volume often obscure more
important features. Often, interactive, real-time 3D clipping
is required to display images at a given cross-section. We
have implemented two methods to clip 3D volume data in
real-time, using graphics hardware support.
The first method uses OpenGL clip planes [23]. By
supplying OpenGL with a plane normal and a point in 3D
space, a clipping plane can be created. Any section of a
polygon in front of this plane will not be rendered. As an
enhancement to this basic OpenGL functionality, we also
render a polygon along the clipping plane, textured with the
slice of the volume in the orientation of the intersecting
plane. This allows us to change the color table of the
clipping plane independently of the color table of the rest
of the volume and avoids unnecessary shading effects at
the clipped boundaries.
D. Levin et al. / Computerized Medical Imaging and Graphics 29 (2005) 463–475466
In the second approach, we allow the selection of a cubic
volume-of-interest (VOI) in real-time. The amount of
visible volume depends on the texture coordinates calcu-
lated at the vertices of each slice intersecting the volume.
For view-aligned slices, each slice is composed of at most
six vertices. This means that this texture coordinate
calculation can be done rapidly enough to allow user
adjustment of the VOI in real-time. By clipping the texture
coordinates against an arbitrarily aligned box, the VOI can
be aligned separately from the volume. Clipping provides a
performance advantage as well. Since clipped pixels are not
rasterized, a frame rate increase can be achieved be
visualizing only the critical portions of large datasets.
2.1.7. Hardware-accelerated 16-bit window and level
adjustment
OpenGL texture shaders may also be exploited to allow
interactive adjustment of the 16-bit window and level
display parameters for the 3D volume thus using the
volume’s full intensity range at the expense of some
performance.
The technique to achieve 16-bit window and level
capability requires the creation of a second RGB 3D texture.
In this texture the red component stores the lowest 8-bits of
the voxels 0 intensities and the green component stores the
highest 8-bits, thus allowing us to encode 16-bit voxel
intensity values. Additionally, we prepare a second 256!256, 2D texture to use as a lookup table. This texture is used
to store the window and level color table for the volume. We
use a 2D texture instead of a 1D texture because 1D textures
are of limited size in OpenGL and cannot store the 65,536
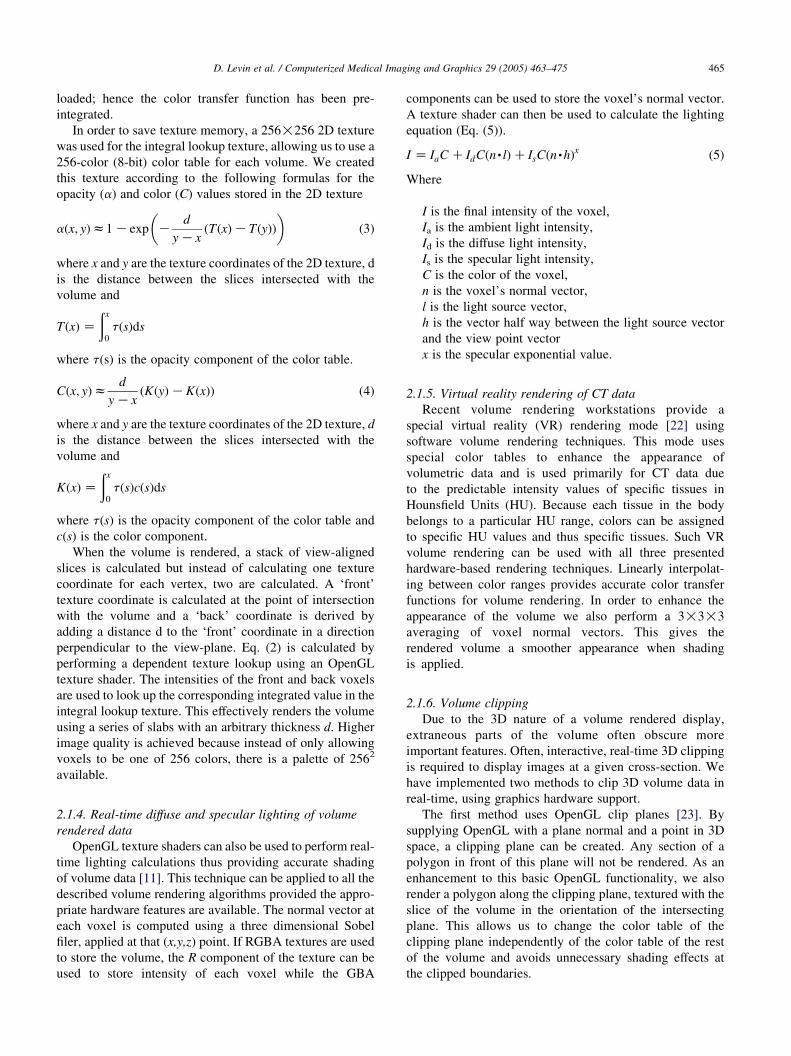
values required for true 16-bit window and level (Fig. 1).
One problem with this approach is that trilinear
interpolation cannot be used on the 16-bit 3D texture.
This is because there is no mechanism to force OpenGL to
interpolate the two 8-bit components of the texture as a
single value.
Under normal circumstances the volume is rendered
using any of the algorithms described above. When the user
adjusts the window and level we render the full-range 3D
First Byte Second Byte 0
Dependent 2DTexture
(8 bit Intensity)
3D RGBA256 x 2562D lookup texture
Fig. 1. The implementation of the 16-bit window and level algorithm using
graphics hardware. A full range 256!256 2D lookup texture is used to map
the 16-bit values stored in a 3D RGBA texture to 8-bit intensities for final
display.
texture by rendering the intensity in the 2D texture indexed
by the high and low order bytes of the 16-bit voxel intensity
(Fig. 1). As window and level are adjusted, the 2D texture’s
values are altered allowing the user to view the changes in
real-time. Since the window and level operation fits the
selected range of intensities into the displayable range of
the software, the original 3D texture can be reloaded with
the new 8-bit, user defined voxel intensities. This allows
trilinear interpolation to be used on the displayed 8-bit
values.
2.1.8. Cine volume rendering
In order to display the time-varying 3D data often
encountered in cardiac imaging, we store each volume of
the study as a separate 3D texture. For 3D texture-based
rendering methods, it is sufficient to bind each texture in a
cyclic manner. This provides excellent visual quality and
frame rate. However, for 2D texture-based rendering
methods a slightly different approach must be taken. This
is because in this rendering mode, three sets of textures must
be stored in memory. Storing numerous volumes in texture
memory would not be possible on current consumer video
cards. For example, a 512!512!100!6 study (the typical
size of a gated cardiac CT dataset) would require 1.89 Gb
when including the normal vectors for lighting. This is far
beyond the storage capabilities of today’s consumer
graphics cards, which typically provide 128–256 Mb of
total memory on the graphics card and can access up to
256 Mb of system memory for fast texture storage. There-
fore, for 2D texture based rendering, we load each set of
textures from main memory during the process of cinematic
3D display. This can provide interactive frame rates for
small to medium sized studies but large studies can strain
the interface between main memory and the video card. For
studies with larger matrix sizes than 256!256, sub-
sampling of cine studies was implemented.
In order to generate clinically acceptable frame rates
(O20 fps) regardless of volume size or technique used,
we need to cache each rendered frame in a series of 2D
textures. This allows fast cyclic rendering of quadrilateral
polygons textured with these images. Such textures are
prepared every time the appearance or orientation of the
rendered volume is altered.
2.1.9. Multi-modality fusion and volume rendering
Clinically useful fusion display of functional and
anatomical data can be implemented in the following
manner: an initial dataset is displayed using one of the
discussed volume rendering algorithms and the second
dataset is rendered as a set of fused slices on the sides of the
clipping box and clipping planes. This allows the useful
combination of anatomical (volume rendered) and func-
tional (slice) data. Rendering the second dataset on the sides
of the VOI and clipping planes is done to avoid rendering
obscured sections of the second volume and is accomplished
by rendering multi-textured polygons at these surfaces.
D. Levin et al. / Computerized Medical Imaging and Graphics 29 (2005) 463–475 467
2.2. Surface rendering of perfusion information
Often, results of cardiac segmentation and quantification
need to be presented as color-coded surfaces [24]. OpenGL
provides standard facilities for rendering and lighting surface
data and we have combined these with the described volume
rendering tools. Surface rendering techniques can be
combined with volume rendering efficiently using OpenGL.
2.3. 3D rendering of coronary arteries
Coronary arteries can be represented as a sequence of 3D
coordinates. Each artery is defined as a line of points with a
radius at each point. For visualization, we reconstructed
vessel data as a series of cylinders using the Parallel
Transport Frame algorithm [25]. The Parallel Transport
Frame works by translating a coordinate frame along a
curve and rotating the frame so it remains parallel with the
tangent of the curve. To reconstruct the arteries, we used a
circle as our frame and translated it along the artery paths
defined in each file. The position of the frame is calculated
by rotating it by an angle a around and an axis A where
A Z T1 !T2 (7)
a Z ArcCosðT1$T2Þ
ðjT1jjT2jÞ
� �(8)
where T1 is the tangent at the initial position of the frame
and T2 is the tangent at the translated position of the frame.
0.9 0.9 0.9
8.14.8 4.8
0.0
10.0
20.0
30.0
40.0
50.0
60.0
Fram
es P
er S
econ
d
Unclipped Clipped
512 Slices
3.5 1.85 1.8
33.1
19.0 19.0
0.0
10.0
20.0
30.0
40.0
50.0
60.0
Fram
es P
er S
econ
d
Unclipped Clipped
128 Slices
3D PI
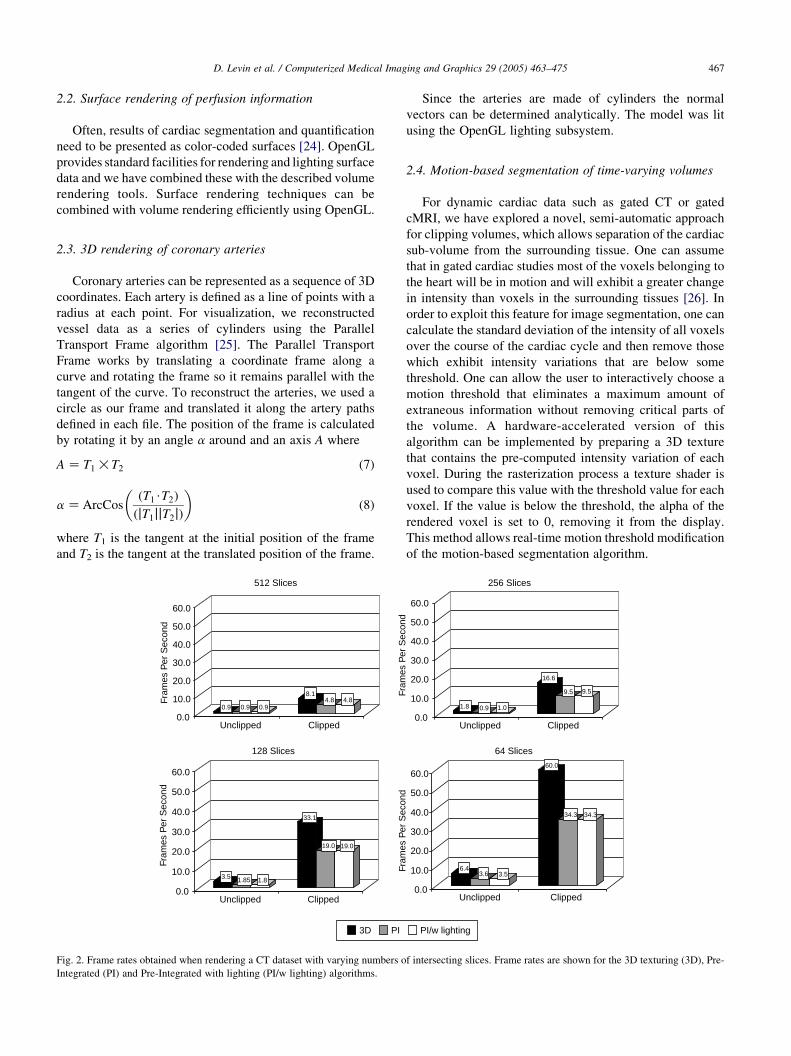
Fig. 2. Frame rates obtained when rendering a CT dataset with varying numbers o
Integrated (PI) and Pre-Integrated with lighting (PI/w lighting) algorithms.
Since the arteries are made of cylinders the normal
vectors can be determined analytically. The model was lit
using the OpenGL lighting subsystem.
2.4. Motion-based segmentation of time-varying volumes
For dynamic cardiac data such as gated CT or gated
cMRI, we have explored a novel, semi-automatic approach
for clipping volumes, which allows separation of the cardiac
sub-volume from the surrounding tissue. One can assume
that in gated cardiac studies most of the voxels belonging to
the heart will be in motion and will exhibit a greater change
in intensity than voxels in the surrounding tissues [26]. In
order to exploit this feature for image segmentation, one can
calculate the standard deviation of the intensity of all voxels
over the course of the cardiac cycle and then remove those
which exhibit intensity variations that are below some
threshold. One can allow the user to interactively choose a
motion threshold that eliminates a maximum amount of
extraneous information without removing critical parts of
the volume. A hardware-accelerated version of this
algorithm can be implemented by preparing a 3D texture
that contains the pre-computed intensity variation of each
voxel. During the rasterization process a texture shader is
used to compare this value with the threshold value for each
voxel. If the value is below the threshold, the alpha of the
rendered voxel is set to 0, removing it from the display.
This method allows real-time motion threshold modification
of the motion-based segmentation algorithm.
1.8 0.9 1.0
16.6
9.5 9.5
0.0
10.0
20.0
30.0
40.0
50.0
60.0
Fram
es P
er S
econ
d
Unclipped Clipped
256 Slices
6.43.6 3.5
60.0
34.3 34.3
0.0
10.0
20.0
30.0
40.0
50.0
60.0
Fram
es P
er S
econ
d
Unclipped Clipped
64 Slices
PI/w lighting
f intersecting slices. Frame rates are shown for the 3D texturing (3D), Pre-
D. Levin et al. / Computerized Medical Imaging and Graphics 29 (2005) 463–475468
2.5. Multi-planar display of cardiac MRI
cMRI exams often contain multiple 2D cine images
acquired from the same subject, at different orientations
and positions (for example short-axis, two-chamber and
four-chamber). To facilitate better visualization and data
analysis such multi-planar 2D views can be combined in
an integrated 3D display using the original 3D position and
orientation of each acquired slice, as recorded in the
DICOM headers of the dataset. The DICOM image
orientation specifies the direction cosines of the first row
rZr(rx,ry,rz) and the first column cZc(cx,cy,cz) of an
image. The position, pZp(px,py,pz)with respect to the
patient, is defined as two unit vectors in the patient
coordinate system. To map the image to 3D space using
OpenGL, we first generate a 2D texture with the image
data and subsequently compute the 3D coordinates
Normal
Zoomed
3D Textures
0 50 100 150 200 2500
20
40
60
80
100
120
140
160
180
Histogram
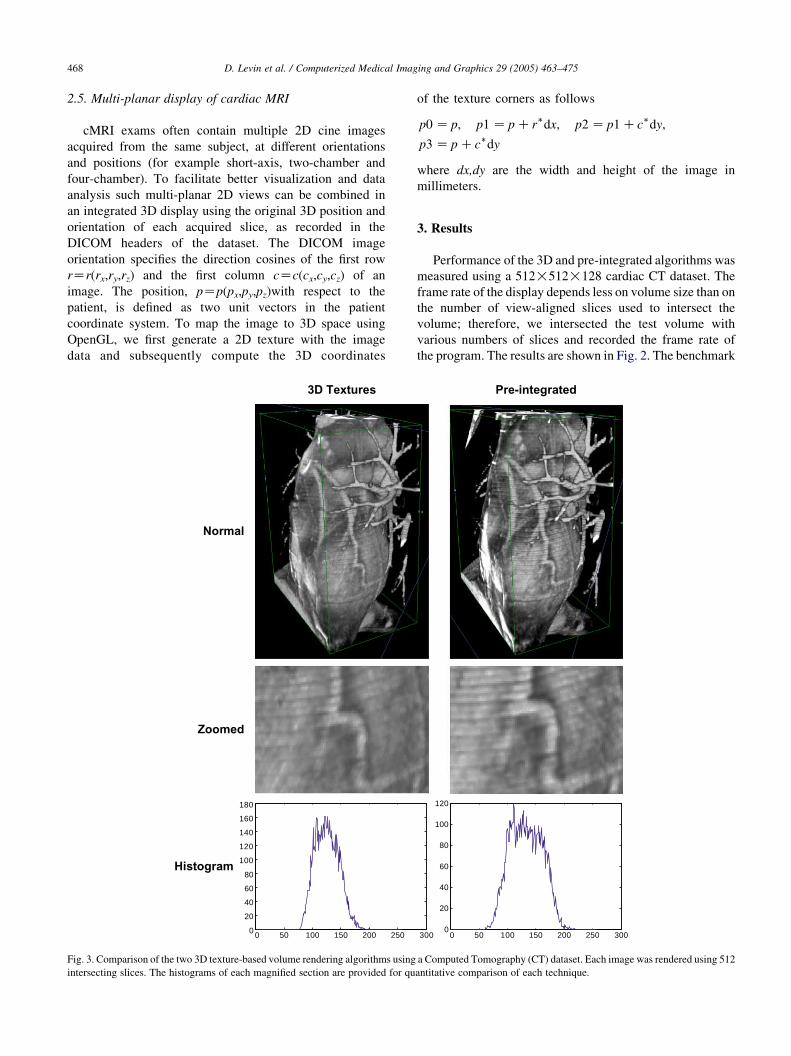
Fig. 3. Comparison of the two 3D texture-based volume rendering algorithms using
intersecting slices. The histograms of each magnified section are provided for qu
of the texture corners as follows
p0 Z p; p1 Z p Cr�dx; p2 Z p1 Cc�dy;
p3 Z p Cc�dy
where dx,dy are the width and height of the image in
millimeters.
3. Results
Performance of the 3D and pre-integrated algorithms was
measured using a 512!512!128 cardiac CT dataset. The
frame rate of the display depends less on volume size than on
the number of view-aligned slices used to intersect the
volume; therefore, we intersected the test volume with
various numbers of slices and recorded the frame rate of
the program. The results are shown in Fig. 2. The benchmark
Pre-integrated
0 50 100 150 200 250 3000
20
40
60
80
100
120
300
a Computed Tomography (CT) dataset. Each image was rendered using 512
antitative comparison of each technique.
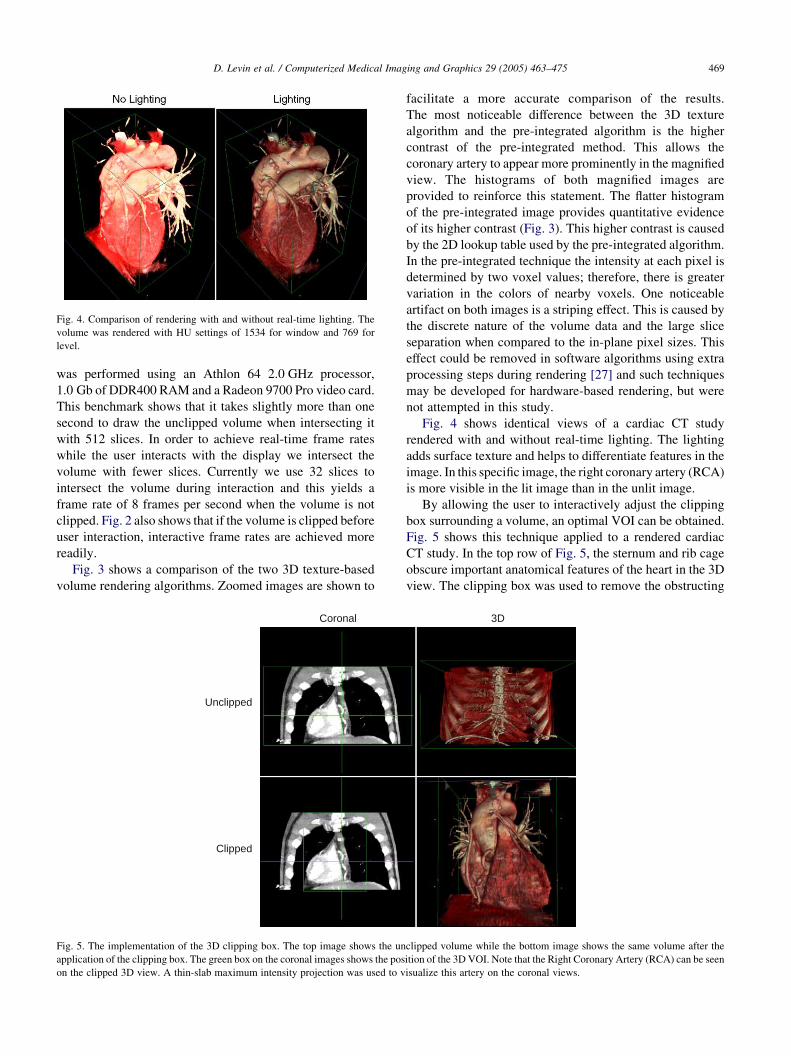
Fig. 4. Comparison of rendering with and without real-time lighting. The
volume was rendered with HU settings of 1534 for window and 769 for
level.
D. Levin et al. / Computerized Medical Imaging and Graphics 29 (2005) 463–475 469
was performed using an Athlon 64 2.0 GHz processor,
1.0 Gb of DDR400 RAM and a Radeon 9700 Pro video card.
This benchmark shows that it takes slightly more than one
second to draw the unclipped volume when intersecting it
with 512 slices. In order to achieve real-time frame rates
while the user interacts with the display we intersect the
volume with fewer slices. Currently we use 32 slices to
intersect the volume during interaction and this yields a
frame rate of 8 frames per second when the volume is not
clipped. Fig. 2 also shows that if the volume is clipped before
user interaction, interactive frame rates are achieved more
readily.
Fig. 3 shows a comparison of the two 3D texture-based
volume rendering algorithms. Zoomed images are shown to
Unclipped
Clipped
Coronal
Fig. 5. The implementation of the 3D clipping box. The top image shows the un
application of the clipping box. The green box on the coronal images shows the pos
on the clipped 3D view. A thin-slab maximum intensity projection was used to v
facilitate a more accurate comparison of the results.
The most noticeable difference between the 3D texture
algorithm and the pre-integrated algorithm is the higher
contrast of the pre-integrated method. This allows the
coronary artery to appear more prominently in the magnified
view. The histograms of both magnified images are
provided to reinforce this statement. The flatter histogram
of the pre-integrated image provides quantitative evidence
of its higher contrast (Fig. 3). This higher contrast is caused
by the 2D lookup table used by the pre-integrated algorithm.
In the pre-integrated technique the intensity at each pixel is
determined by two voxel values; therefore, there is greater
variation in the colors of nearby voxels. One noticeable
artifact on both images is a striping effect. This is caused by
the discrete nature of the volume data and the large slice
separation when compared to the in-plane pixel sizes. This
effect could be removed in software algorithms using extra
processing steps during rendering [27] and such techniques
may be developed for hardware-based rendering, but were
not attempted in this study.
Fig. 4 shows identical views of a cardiac CT study
rendered with and without real-time lighting. The lighting
adds surface texture and helps to differentiate features in the
image. In this specific image, the right coronary artery (RCA)
is more visible in the lit image than in the unlit image.
By allowing the user to interactively adjust the clipping
box surrounding a volume, an optimal VOI can be obtained.
Fig. 5 shows this technique applied to a rendered cardiac
CT study. In the top row of Fig. 5, the sternum and rib cage
obscure important anatomical features of the heart in the 3D
view. The clipping box was used to remove the obstructing
3D
clipped volume while the bottom image shows the same volume after the
ition of the 3D VOI. Note that the Right Coronary Artery (RCA) can be seen
isualize this artery on the coronal views.
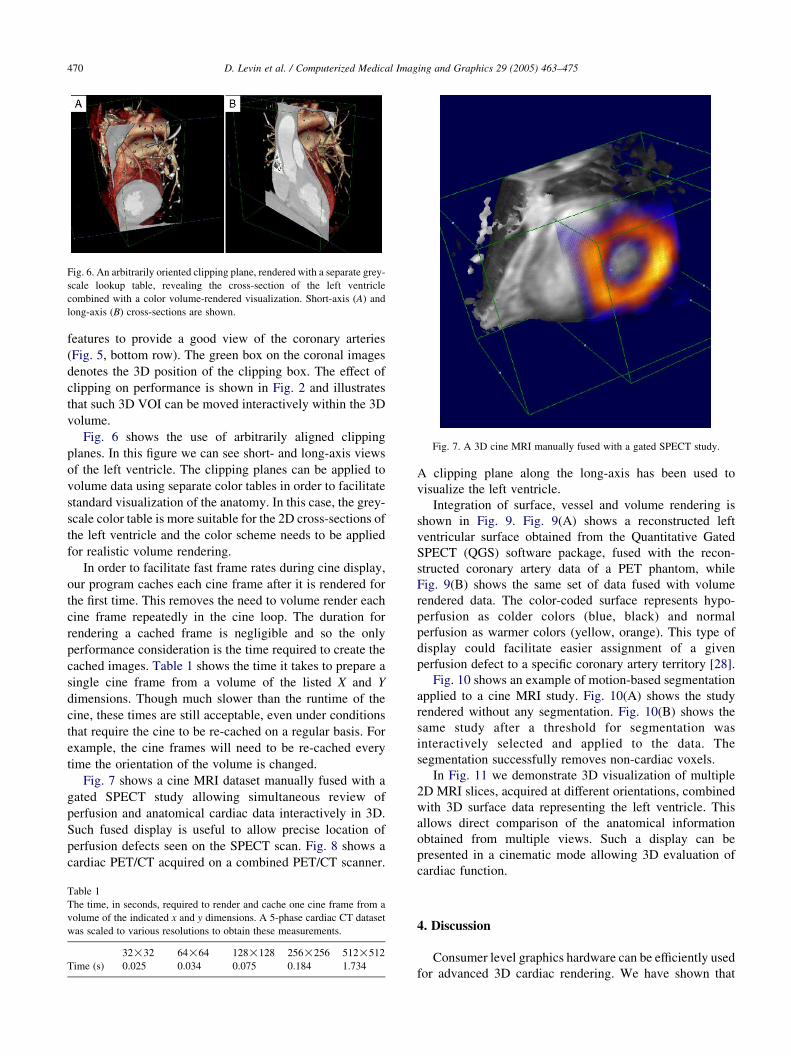
Fig. 6. An arbitrarily oriented clipping plane, rendered with a separate grey-
scale lookup table, revealing the cross-section of the left ventricle
combined with a color volume-rendered visualization. Short-axis (A) and
long-axis (B) cross-sections are shown.
Fig. 7. A 3D cine MRI manually fused with a gated SPECT study.
D. Levin et al. / Computerized Medical Imaging and Graphics 29 (2005) 463–475470
features to provide a good view of the coronary arteries
(Fig. 5, bottom row). The green box on the coronal images
denotes the 3D position of the clipping box. The effect of
clipping on performance is shown in Fig. 2 and illustrates
that such 3D VOI can be moved interactively within the 3D
volume.
Fig. 6 shows the use of arbitrarily aligned clipping
planes. In this figure we can see short- and long-axis views
of the left ventricle. The clipping planes can be applied to
volume data using separate color tables in order to facilitate
standard visualization of the anatomy. In this case, the grey-
scale color table is more suitable for the 2D cross-sections of
the left ventricle and the color scheme needs to be applied
for realistic volume rendering.
In order to facilitate fast frame rates during cine display,
our program caches each cine frame after it is rendered for
the first time. This removes the need to volume render each
cine frame repeatedly in the cine loop. The duration for
rendering a cached frame is negligible and so the only
performance consideration is the time required to create the
cached images. Table 1 shows the time it takes to prepare a
single cine frame from a volume of the listed X and Y
dimensions. Though much slower than the runtime of the
cine, these times are still acceptable, even under conditions
that require the cine to be re-cached on a regular basis. For
example, the cine frames will need to be re-cached every
time the orientation of the volume is changed.
Fig. 7 shows a cine MRI dataset manually fused with a
gated SPECT study allowing simultaneous review of
perfusion and anatomical cardiac data interactively in 3D.
Such fused display is useful to allow precise location of
perfusion defects seen on the SPECT scan. Fig. 8 shows a
cardiac PET/CT acquired on a combined PET/CT scanner.
Table 1
The time, in seconds, required to render and cache one cine frame from a
volume of the indicated x and y dimensions. A 5-phase cardiac CT dataset
was scaled to various resolutions to obtain these measurements.
32!32 64!64 128!128 256!256 512!512
Time (s) 0.025 0.034 0.075 0.184 1.734
A clipping plane along the long-axis has been used to
visualize the left ventricle.
Integration of surface, vessel and volume rendering is
shown in Fig. 9. Fig. 9(A) shows a reconstructed left
ventricular surface obtained from the Quantitative Gated
SPECT (QGS) software package, fused with the recon-
structed coronary artery data of a PET phantom, while
Fig. 9(B) shows the same set of data fused with volume
rendered data. The color-coded surface represents hypo-
perfusion as colder colors (blue, black) and normal
perfusion as warmer colors (yellow, orange). This type of
display could facilitate easier assignment of a given
perfusion defect to a specific coronary artery territory [28].
Fig. 10 shows an example of motion-based segmentation
applied to a cine MRI study. Fig. 10(A) shows the study
rendered without any segmentation. Fig. 10(B) shows the
same study after a threshold for segmentation was
interactively selected and applied to the data. The
segmentation successfully removes non-cardiac voxels.
In Fig. 11 we demonstrate 3D visualization of multiple
2D MRI slices, acquired at different orientations, combined
with 3D surface data representing the left ventricle. This
allows direct comparison of the anatomical information
obtained from multiple views. Such a display can be
presented in a cinematic mode allowing 3D evaluation of
cardiac function.
4. Discussion
Consumer level graphics hardware can be efficiently used
for advanced 3D cardiac rendering. We have shown that
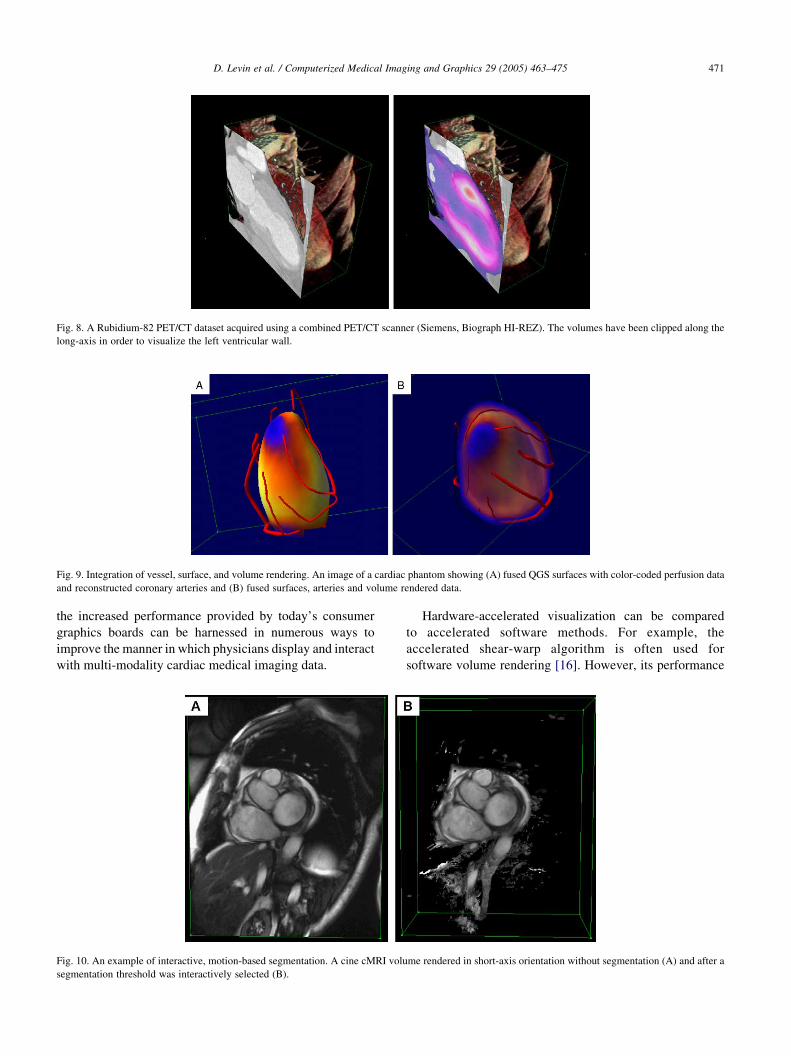
Fig. 8. A Rubidium-82 PET/CT dataset acquired using a combined PET/CT scanner (Siemens, Biograph HI-REZ). The volumes have been clipped along the
long-axis in order to visualize the left ventricular wall.
Fig. 9. Integration of vessel, surface, and volume rendering. An image of a cardiac phantom showing (A) fused QGS surfaces with color-coded perfusion data
and reconstructed coronary arteries and (B) fused surfaces, arteries and volume rendered data.
D. Levin et al. / Computerized Medical Imaging and Graphics 29 (2005) 463–475 471
the increased performance provided by today’s consumer
graphics boards can be harnessed in numerous ways to
improve the manner in which physicians display and interact
with multi-modality cardiac medical imaging data.
Fig. 10. An example of interactive, motion-based segmentation. A cine cMRI volu
segmentation threshold was interactively selected (B).
Hardware-accelerated visualization can be compared
to accelerated software methods. For example, the
accelerated shear-warp algorithm is often used for
software volume rendering [16]. However, its performance
me rendered in short-axis orientation without segmentation (A) and after a
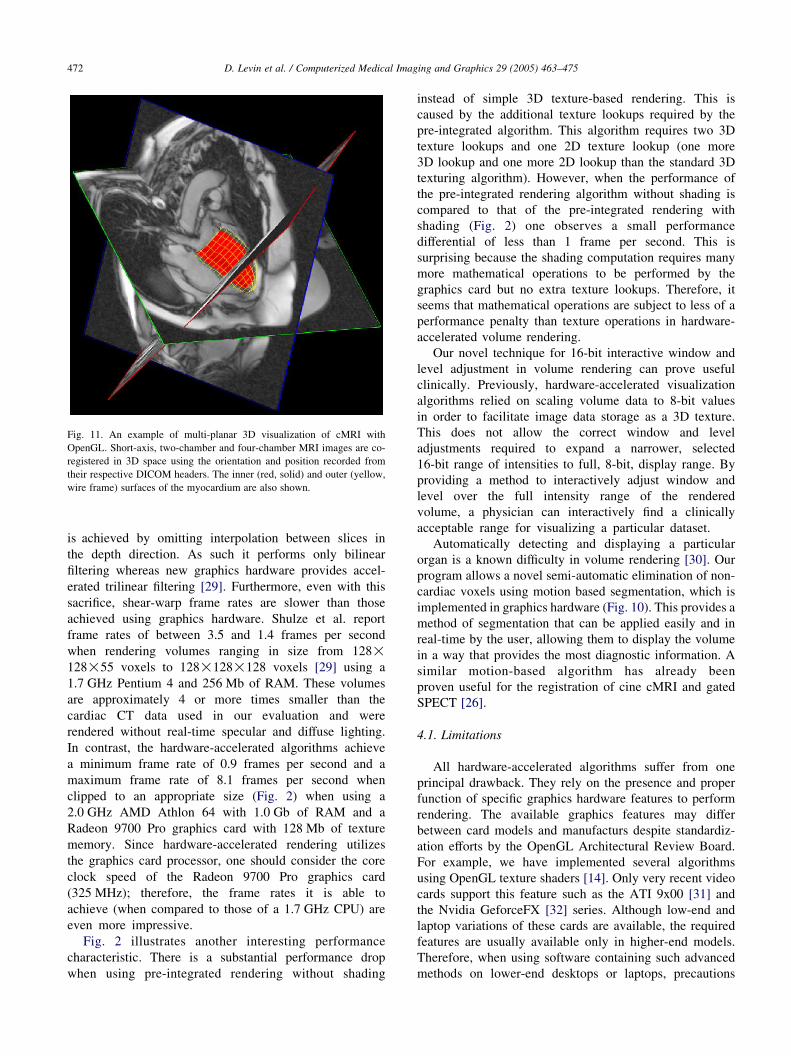
Fig. 11. An example of multi-planar 3D visualization of cMRI with
OpenGL. Short-axis, two-chamber and four-chamber MRI images are co-
registered in 3D space using the orientation and position recorded from
their respective DICOM headers. The inner (red, solid) and outer (yellow,
wire frame) surfaces of the myocardium are also shown.
D. Levin et al. / Computerized Medical Imaging and Graphics 29 (2005) 463–475472
is achieved by omitting interpolation between slices in
the depth direction. As such it performs only bilinear
filtering whereas new graphics hardware provides accel-
erated trilinear filtering [29]. Furthermore, even with this
sacrifice, shear-warp frame rates are slower than those
achieved using graphics hardware. Shulze et al. report
frame rates of between 3.5 and 1.4 frames per second
when rendering volumes ranging in size from 128!128!55 voxels to 128!128!128 voxels [29] using a
1.7 GHz Pentium 4 and 256 Mb of RAM. These volumes
are approximately 4 or more times smaller than the
cardiac CT data used in our evaluation and were
rendered without real-time specular and diffuse lighting.
In contrast, the hardware-accelerated algorithms achieve
a minimum frame rate of 0.9 frames per second and a
maximum frame rate of 8.1 frames per second when
clipped to an appropriate size (Fig. 2) when using a
2.0 GHz AMD Athlon 64 with 1.0 Gb of RAM and a
Radeon 9700 Pro graphics card with 128 Mb of texture
memory. Since hardware-accelerated rendering utilizes
the graphics card processor, one should consider the core
clock speed of the Radeon 9700 Pro graphics card
(325 MHz); therefore, the frame rates it is able to
achieve (when compared to those of a 1.7 GHz CPU) are
even more impressive.
Fig. 2 illustrates another interesting performance
characteristic. There is a substantial performance drop
when using pre-integrated rendering without shading
instead of simple 3D texture-based rendering. This is
caused by the additional texture lookups required by the
pre-integrated algorithm. This algorithm requires two 3D
texture lookups and one 2D texture lookup (one more
3D lookup and one more 2D lookup than the standard 3D
texturing algorithm). However, when the performance of
the pre-integrated rendering algorithm without shading is
compared to that of the pre-integrated rendering with
shading (Fig. 2) one observes a small performance
differential of less than 1 frame per second. This is
surprising because the shading computation requires many
more mathematical operations to be performed by the
graphics card but no extra texture lookups. Therefore, it
seems that mathematical operations are subject to less of a
performance penalty than texture operations in hardware-
accelerated volume rendering.
Our novel technique for 16-bit interactive window and
level adjustment in volume rendering can prove useful
clinically. Previously, hardware-accelerated visualization
algorithms relied on scaling volume data to 8-bit values
in order to facilitate image data storage as a 3D texture.
This does not allow the correct window and level
adjustments required to expand a narrower, selected
16-bit range of intensities to full, 8-bit, display range. By
providing a method to interactively adjust window and
level over the full intensity range of the rendered
volume, a physician can interactively find a clinically
acceptable range for visualizing a particular dataset.
Automatically detecting and displaying a particular
organ is a known difficulty in volume rendering [30]. Our
program allows a novel semi-automatic elimination of non-
cardiac voxels using motion based segmentation, which is
implemented in graphics hardware (Fig. 10). This provides a
method of segmentation that can be applied easily and in
real-time by the user, allowing them to display the volume
in a way that provides the most diagnostic information. A
similar motion-based algorithm has already been
proven useful for the registration of cine cMRI and gated
SPECT [26].
4.1. Limitations
All hardware-accelerated algorithms suffer from one
principal drawback. They rely on the presence and proper
function of specific graphics hardware features to perform
rendering. The available graphics features may differ
between card models and manufacturs despite standardiz-
ation efforts by the OpenGL Architectural Review Board.
For example, we have implemented several algorithms
using OpenGL texture shaders [14]. Only very recent video
cards support this feature such as the ATI 9x00 [31] and
the Nvidia GeforceFX [32] series. Although low-end and
laptop variations of these cards are available, the required
features are usually available only in higher-end models.
Therefore, when using software containing such advanced
methods on lower-end desktops or laptops, precautions
D. Levin et al. / Computerized Medical Imaging and Graphics 29 (2005) 463–475 473
need to be taken to ensure fail-safe operation and fallback
algorithms need to be implemented to ensure software
portability.
Another difficulty in using graphics cards is their
currently limited texture memory. Current graphics cards
have 64–256 Mb of graphics memory. Some of the latest
cardiac CT data can have sizes greater than 100 Mb (512!512!80!5). This can stress the memory subsystems of
these cards, especially if the need to load multiple volumes
arises. It can also affect the cine performance, as swapping
the data from system memory might be required, causing
performance degradation. New technologies such as PCI
Express, a high-performance interface between system
memory and the graphics card, may eliminate or reduce
the impact of this issue [33].
Another limitation of all the volume rendering algor-
ithms based on graphics hardware is that they can only
render 8-bit voxels (voxels with 256 discrete intensity
values). This is due to inherent hardware limitations of
current consumer graphics cards. Current consumer
OpenGL graphics hardware supports 32-bit color (8-bits
for each red, blue, green, and alpha component of a voxel).
Since most medical imaging data only has one channel
(intensity), we can only use one 8-bit value to store the
voxel intensities. However, we have circumvented this
limitation using a novel 16-bit window and level technique
allowing the user to interactively select an 8-bit range from
the full 16-bit intensity range of the volume interactively.
We also implemented color volume rendering which
allows realistic 32-bit color mapping of the pre-selected
16-bit intensity range.
The algorithms presented in this study were
implemented using standard OpenGL features. Recent
graphics cards from Nvidia and ATI support all the
features required for these techniques. As discussed in the
preceding paragraphs, volume rendering algorithms are
limited by the features of the cards they are running on and
future cards will remove several of these limitations. For
instance, because of memory constraints we store our
volumes using 8-bit intensities. However, floating point
texture formats are now available on most graphics cards.
Once texture memory sizes are acceptable, RGBA floating
point textures could be used to store unaltered voxel
intensities. Graphics card fill rates, which increase each
generation, will also increase the speed at which the
volume rendering takes place.
Most importantly, the increase in the programmability
of consumer graphics cards could allow significant
improvement in the techniques presented. Many of our
algorithms rely on texture shaders to allow the graphics
card to process information. New cards support even more
programming structures allowing for an increase in the
complexity of the calculations performed. This could allow
even more robust implementations of the presented
techniques.
5. Conclusion
Current consumer graphics hardware can be used to
implement a comprehensive multi-modality 4D cardiac
imaging toolkit for rendering data with high quality and at
real-time speeds.
6. Summary
In this study we explore the capabilities of consumer 3D
graphics cards for use in the processing and visualization of
high-resolution, multi-modality cardiac medical imaging
data. We exploit hardware-accelerated trilinear filtering, 2D
and 3D texturing along with the programmable capabilities
(texture and vertex shaders) of recent 3D graphics cards to
implement a real-time processing and visualization plat-
form, Volviz. We implement two volume rendering
algorithms: volume rendering using view-aligned slices
and 3D textures and pre-integrated volume rendering.
OpenGL texture shaders are used to perform real-time
specular and diffuse lighting and this is combined with
virtual reality (VR) color tables to produce realistic, 3D,
volume rendered images of cardiac Computed Tomography
(CT) datasets. A novel 16-bit window and level algorithm is
implemented using texture shaders to circumvent hardware
limitations that allow only 8-bits of voxel intensity to be
stored in OpenGL 3D textures and to improve image
quality. Furthermore we perform multi-modality visualiza-
tion of volume data, surface data and reconstructed coronary
artery tree data. We also implement a motion-based
segmentation algorithm that allows the user to interactively
(O1 frame per second) select a motion-threshold and semi-
automatically segment cine cardiac 3D datasets in real-time.
A novel multi-planar display for multiple series of cine
cardiac MRI, acquired at different orientations, is also
discussed. We show that an ATI Radeon 9700 Pro video
card with 128 Mb of texture memory can render a 512!512!128 cardiac CT scan at 0.9–60 frames per second
depending on the size of the volume-of-interest (VOI)
displayed and the detail the volume is rendered at.
Furthermore, it takes 0.03 to 1.73 s to prepare a cached
cine frame of volumes with matrix sizes ranging from 32!32 to 512!512 for real-time cine display. We conclude that
real-time rendering and processing of 16-bit multi-modality,
3D, cardiac data, with matrix sizes up to 512!512 can be
performed efficiently using current consumer 3D graphics
cards.
Acknowledgements
We thank the Siemens Nuclear Group for providing us
with the PET/CT data and Dr Rob De Kemp from the
Ottawa Heart Institute for providing us with the phantom
data of PET and 3D coronary angiography.
D. Levin et al. / Computerized Medical Imaging and Graphics 29 (2005) 463–475474
References
[1] Germano G, Kiat H, Kavanagh PB, Moriel M, Mazzanti M, Su HT,
et al. Automatic quantification of ejection fraction from gated
myocardial perfusion SPECT. J Nucl Med 1995;36(11):2138–47.
[2] Slomka PJ, Hurwitz GA, Clement G, Stephenson J. Three-
dimensional demarcation of perfusion zones corresponding to specific
coronary arteries: application for automated interpretation of
myocardial SPECT. J Nucl Med 1995;36(11):2120–6.
[3] Pirich C, Schwaiger M. The clinical role of positron emission
tomography in management of the cardiac patient. Rev Port Cardiol
2000;19(Suppl 1):89–100.
[4] Desjardins B, Kazerooni EA. ECG-gated cardiac CT. AJR Am J
Roentgenol 2004;182(4):993–1010.
[5] Rensing BJ, Bongaerts AH, van Geuns RJ, van Ooijen PM,
Oudkerk M, de Feyter PJ. Intravenous coronary angiography using
electron beam computed tomography. Prog Cardiovasc Dis 1999;
42(2):139–48.
[6] Smith HJ. Use of MR imaging in the diagnosis of cardiac disease.
Tidsskr Nor Laegeforen 2004;124(4):497–9.
[7] DeMaria A, Blanchard DG., The echocardiogram: ischemic heart
disease. In: Fuster V, Alexander RW, O’Rourke RA, editors. Hurst’s
The heart. 11 ed. 2004. p 423–30.
[8] Beier J, Oellinger H, Richter CS, Fleck E, Felix R. Registered image
subtraction for CT-, MR- and coronary angiography. Eur Radiol 1997;
7(1):82–9.
[9] Stytz MR, Frieder G, Frieder O. Three-dimensional medical imaging:
algorithms and computer systems. ACM Comput Surv 1991;23(4):
421–99.
[10] Cabral B, Cam N, Foran J. Accelerated volume rendering and
tomographic reconstruction using texture mapping hardware. Pro-
ceedings of the symposium on volume visualization. Tysons Corner,
Virginia, USA: ACM Press; 1994 p. 91–8.
[11] Engel K, Kraus M, Ertl T. High-quality pre-integrated volume
rendering using hardware-accelerated pixel shading. Proceedings of
the ACM SIGGRAPH/EUROGRAPHICS workshop on graphics
hardware. New York, NY: ACM Press; 2001 p. 9–16.
[12] Nvidia., NVIDIA Gelato 1.0 GPU-Accelerated final-frame renderer.,
film.nvidia.com. 2004. 8-18-2004. Ref type: electronic citation.
[13] ATI., Rendermonkey Toolsuite., www.ati.com., 2004. 8-16-2004. Ref
type: electronic citation.
[14] Segal M, Akeley K. The openGL graphics system: a specification
(version 1.5). www.opengl.org. 2003. Silicon graphics Inc. 9-27-
2003. ref type: electronic citation.
[15] Foley JD, van Dam A, Feiner SK, Hughes JF. Computer graphics:
principles and practice. 2nd ed. New York, NY: Addison-Wesley;
1997 p. 741.
[16] Lacroute P, Levoy M. Fast volume rendering using a shear-warp
factorization of the viewing transformation. Proceedings of the 21st
annual conference on computer graphics and interactive techniques.
New York, NY: ACM Press; 1994 p. 451–8.
[17] OpenGL Architecture Review Board (ARB). The OpenGL reference
manual. 3rd ed. New York: Addison Wesley; 1999.
[18] Westermann R, Sevenich B. Accelerated volume ray-casting using
texture mapping. Proceedings of the conference on visualization 001.
San Diego, CA: IEEE Computer Society; 2001 p. 271–8.
[19] Enders F, Strengert M, Iserhardt-Bauer S, Aladl UE, Slomka PJ.
Interactive volume rendering of multimodality 4D cardiac data with the
use of consumer graphics hardware. SPIE Medical Imaging 2003:
visualization, image-guided procedures, and display 2003;5029:119–28.
[20] Ertl T, Westermann R. Efficiently using graphics hardware in volume
rendering applications. Proceedings of the 25th annual conference on
computer graphics and interactive techniques. New York, NY: ACM
Press; 1998 p. 169–77.
[21] Proudfoot K, Mark WR, Svetoslav T, Hanrahan P. A real-time
procedural shading system for programmable graphics hardware.
Proceedings of the 28th annual conference on computer graphics
and interactive techniques. New York, NY: ACM Press; 2001
[159–70].
[22] GE Medical Systems., Computed tomography, CT application option:
volume rendering. www.gemedicalsystsmseurope.com. 2004. 7-29-
2004. Ref Type: Electronic Citation.
[23] OpenGL Architecture Review Board (ARB). OpenGL programming
guide. 2nd ed. New York: Addison Wesley; 1997.
[24] Germano G, Erel J, Kiat H, Kavanagh PB, Berman DS. Quantitative
LVEF and qualitative regional function from gated thallium-201
perfusion SPECT. J Nucl Med 1997;38(5):749–54.
[25] Dougan C. The parallel transport frame. In: Deloura M, editor. Game
programming gems 2, 2. Hingham, MA: Charles River Media; 2001.
p. 215–9.
[26] Aladl UE, Hurwitz GA, Dey D, Levin D, Drangova M, Slomka PJ.
Automated image registration of gated cardiac single-photon emission
computed tomography and magnetic resonance imaging. J Magn
Reson Imaging 2004;19(3):283–90.
[27] Sweeney J, Mueller K. Shear-warp deluxe: the shear-Warp algorithm
revisited. Proceedings of the symposium on data visualisation 2002.
Aire-la-Ville, Switzerland: Eurographics Association; 2002. 95 ff.
[28] Faber TL, Santana CA, Garcia EV, Candell-Riera J, Folks RD,
Peifer JW, et al. Three-dimensional fusion of coronary arteries with
myocardial perfusion distributions: clinical validation. J Nucl Med
2004;45(5):745–53.
[29] Schulze JP, Kraus M, Lang U, Ertl T. Integrating pre-integration into
the shear-warp algorithm. Proceedings of the eurographics/IEEE
TVCG workshop on volume graphics. 2003. New York: ACM Press;
2003 p. 109–18].
[30] Meissner M, Lorensen B, Zuiderveld K, Simha V, Wegenkittl R.
Volume rendering in medical applications: we’ve got pretty images,
what’s left to do. Proceedings of the conference on visualization 002.
Boston, MA: IEEE Computer Society; 2002 p. 575–8].
[31] ATI. Radeon 9500/9600/9700/9800 OpenGL Programming and
Optimization Guide. www.ati.com. 2004. ATI. 2-2-2004. Ref Type:
Electronic Citation.
[32] Spitzer J. Nvidia OpenGL Performance FAQ. www.nvidia.com. 2002.
Nvidia. 9-12-2003. Ref Type: Electronic Citation.
[33] Reed D. PCI express graphics performance optimizations. www.nvidia.
com. 2004. NVIDIA. 8-19-2004. Ref Type: Electronic Citation.
David Levin received his BSc in Computer Science and Biology from
the University of Western Ontario, Canada in 2002. After a 2 year
hiatus, during which he spent his time programming medical imaging
software, he returned to his alma mater to complete a 4th year of
Medical Biophysics. Currently, he is studying for his MSc in Medical
Biophysics which is focused on real-time surgical simulation. His
main interests are interactive 3D graphics, image processing and
analysis.
Usaf E. Aladl is a Post-doctoral fellow in the Department of Diagnostic
Radiology and Nuclear Medicine at the University of Western Ontario,
Canada. He received his BSc degree from the Mathematics Department
of Al-Fateh University, Tripoli, Libya in 1985, his MSc degree from the
Department of Mathematics of the Middle East Technical University,
Ankara, Turkey in 1992, and his PhD degree from the Department of
Applied Mathematics at the University of Western Ontario, London,
Ontario, Canada in 2001. His research interests include Numerical
analysis, scattering wave problems in unbounded domain, visualization
and analysis of medical images, and Multi-modality medical image
registration and segmentation.
D. Levin et al. / Computerized Medical Imaging and Graphics 29 (2005) 463–475 475
Guido Germano, PhD, FACC, After receiving a BS degree in
Electrical Engineering from the University of Naples, Italy, and an
MBA in Marketing and International Relations from the Italian
government, he came to the United States on a Fulbright scholarship
and obtained a MS and a PhD in Biomedical Physics from the
University of California at Los Angeles in 1991. He is the Director of
the Artificial Intelligence in Medicine (AIM) Program at Cedars-Sinai
Medical Center, and a Professor of Medicine at the David Geffen
School of Medicine at the University of California at Los Angeles. He
is also a fellow of the American College of Cardiology. Dr Germano
has written more than 140 original manuscripts and book chapters and
received numerous awards for excellence in research in the fields of
heart research, medical physics and nuclear medicine. He is widely
recognized as an expert in the field of cardiovascular nuclear medicine.
His current research interests focus on the automatic processing,
quantification and reporting of nuclear medicine, magnetic resonance
and computed tomography images using artificial intelligence
techniques.
Piotr Slomka, PhD, FCCPM, received his MASc in Computer
Engineering from the Warsaw University of Technology, Poland, in
1989 and his PhD in Medical Physics from the University of Western
Ontario, Canada in 1995. He was a faculty member in the Department
of Diagnostic Radiology and Nuclear Medicine as well as Medical
Biophysics at the University of Western Ontario, London, Canada
between 1995 and 2003. He is currently a faculty scientist with the
Cedars Sinai Medical Center, Los Angeles, CA and is an Associate
Professor of Medicine at the University of California Los Angeles. He
is also a fellow of the Canadian College of Physicists in Medicine. He is
widely recognized as an expert in the filed of multi-modality image
registration and fusion. His principal research areas are image
registration, image fusion, and automated medical image analysis and
quantification of PET/CT SPECT, CTA and MRI images. He has
authored, or co-authored over 60 original manuscripts and book
chapters.