Embed Size (px)
Citation preview

ibm.com/redbooks
Techniques for Managing LargeWebSphere Installations
Byron BraswellDebasish Banerjee
Reto HirtBatchazi Kaayou
Kevin KeprosAjay KrishnaKarel Michek
Nanditha Siram
High availability manager and core groups
Tuning recommendations
Configuration best practices
Front cover

Techniques for Managing Large WebSphere Installations
March 2008
International Technical Support Organization
SG24-7536-00

© Copyright International Business Machines Corporation 2008. All rights reserved.Note to U.S. Government Users Restricted Rights -- Use, duplication or disclosure restricted by GSA ADPSchedule Contract with IBM Corp.
First Edition (March 2008)
This edition applies to Version 6, Release 1, Modification 09 of WebSphere Application Server Network Deployment.
Note: Before using this information and the product it supports, read the information in “Notices” on page ix.

Contents
Notices . . . . . . . . . . . . . . . . . . . . . . . . . . . . . . . . . . . . . . . . . . . . . . . . . . . . . . . ixTrademarks . . . . . . . . . . . . . . . . . . . . . . . . . . . . . . . . . . . . . . . . . . . . . . . . . . . . x
Preface . . . . . . . . . . . . . . . . . . . . . . . . . . . . . . . . . . . . . . . . . . . . . . . . . . . . . . . xiThe team that wrote this book . . . . . . . . . . . . . . . . . . . . . . . . . . . . . . . . . . . . . xiiBecome a published author . . . . . . . . . . . . . . . . . . . . . . . . . . . . . . . . . . . . . . . xvComments welcome. . . . . . . . . . . . . . . . . . . . . . . . . . . . . . . . . . . . . . . . . . . . . xv
Chapter 1. Introduction . . . . . . . . . . . . . . . . . . . . . . . . . . . . . . . . . . . . . . . . . . 11.1 Large WebSphere installations - the issues . . . . . . . . . . . . . . . . . . . . . . . . 2
1.1.1 Typical large WebSphere Application Server topologies . . . . . . . . . . 21.1.2 Large cell technical challenges . . . . . . . . . . . . . . . . . . . . . . . . . . . . . . 3
1.2 Topics covered in this book. . . . . . . . . . . . . . . . . . . . . . . . . . . . . . . . . . . . . 41.2.1 Part 1. Technical concepts . . . . . . . . . . . . . . . . . . . . . . . . . . . . . . . . . 41.2.2 Part 2. Planning and design . . . . . . . . . . . . . . . . . . . . . . . . . . . . . . . . 41.2.3 Part 3. Administration and problem determination . . . . . . . . . . . . . . . 41.2.4 Part 4. Sample scenarios . . . . . . . . . . . . . . . . . . . . . . . . . . . . . . . . . . 51.2.5 Additional material. . . . . . . . . . . . . . . . . . . . . . . . . . . . . . . . . . . . . . . . 5
1.3 WebSphere Extended Deployment V6.1. . . . . . . . . . . . . . . . . . . . . . . . . . . 51.3.1 Operations optimization . . . . . . . . . . . . . . . . . . . . . . . . . . . . . . . . . . . 6
Part 1. Technical concepts . . . . . . . . . . . . . . . . . . . . . . . . . . . . . . . . . . . . . . . . . . . . . . . . . . . 11
Chapter 2. High availability manager. . . . . . . . . . . . . . . . . . . . . . . . . . . . . . 132.1 High availability manager main services . . . . . . . . . . . . . . . . . . . . . . . . . . 14
2.1.1 HA manager components . . . . . . . . . . . . . . . . . . . . . . . . . . . . . . . . . 152.1.2 HA manager service usage. . . . . . . . . . . . . . . . . . . . . . . . . . . . . . . . 162.1.3 Other users of services in stack products . . . . . . . . . . . . . . . . . . . . . 20
Chapter 3. Core groups. . . . . . . . . . . . . . . . . . . . . . . . . . . . . . . . . . . . . . . . . 213.1 Core group formation rules . . . . . . . . . . . . . . . . . . . . . . . . . . . . . . . . . . . . 22
3.1.1 Example of a well-formed core group . . . . . . . . . . . . . . . . . . . . . . . . 233.2 Core group communication . . . . . . . . . . . . . . . . . . . . . . . . . . . . . . . . . . . . 23
3.2.1 HA manager layers . . . . . . . . . . . . . . . . . . . . . . . . . . . . . . . . . . . . . . 243.2.2 HA manager protocols . . . . . . . . . . . . . . . . . . . . . . . . . . . . . . . . . . . 263.2.3 Transport type . . . . . . . . . . . . . . . . . . . . . . . . . . . . . . . . . . . . . . . . . . 323.2.4 HA manager resource consumption . . . . . . . . . . . . . . . . . . . . . . . . . 33
3.3 HA coordinator . . . . . . . . . . . . . . . . . . . . . . . . . . . . . . . . . . . . . . . . . . . . . 353.3.1 Main coordinator activities. . . . . . . . . . . . . . . . . . . . . . . . . . . . . . . . . 35
© Copyright IBM Corp. 2008. All rights reserved. iii

3.3.2 Election of the coordinator(s) . . . . . . . . . . . . . . . . . . . . . . . . . . . . . . 393.3.3 Preferred coordinators . . . . . . . . . . . . . . . . . . . . . . . . . . . . . . . . . . . 403.3.4 How many coordinators are required? . . . . . . . . . . . . . . . . . . . . . . . 413.3.5 Coordinator failure. . . . . . . . . . . . . . . . . . . . . . . . . . . . . . . . . . . . . . . 41
3.4 Disabling the HA manager . . . . . . . . . . . . . . . . . . . . . . . . . . . . . . . . . . . . 423.4.1 Effect of disabling the HA manager. . . . . . . . . . . . . . . . . . . . . . . . . . 42
Chapter 4. Core group bridging . . . . . . . . . . . . . . . . . . . . . . . . . . . . . . . . . . 454.1 Introduction . . . . . . . . . . . . . . . . . . . . . . . . . . . . . . . . . . . . . . . . . . . . . . . . 46
4.1.1 Core Group Bridge Service . . . . . . . . . . . . . . . . . . . . . . . . . . . . . . . . 464.2 Intra-cell bridging. . . . . . . . . . . . . . . . . . . . . . . . . . . . . . . . . . . . . . . . . . . . 46
4.2.1 When is bridging needed in a single cell?. . . . . . . . . . . . . . . . . . . . . 474.2.2 Core group access point . . . . . . . . . . . . . . . . . . . . . . . . . . . . . . . . . . 504.2.3 Bridge interface . . . . . . . . . . . . . . . . . . . . . . . . . . . . . . . . . . . . . . . . . 514.2.4 Access point group . . . . . . . . . . . . . . . . . . . . . . . . . . . . . . . . . . . . . . 52
4.3 Core group bridging topologies . . . . . . . . . . . . . . . . . . . . . . . . . . . . . . . . . 524.3.1 Mesh topology. . . . . . . . . . . . . . . . . . . . . . . . . . . . . . . . . . . . . . . . . . 534.3.2 Chain topology . . . . . . . . . . . . . . . . . . . . . . . . . . . . . . . . . . . . . . . . . 54
4.4 Inter-cell bridging. . . . . . . . . . . . . . . . . . . . . . . . . . . . . . . . . . . . . . . . . . . . 564.4.1 When is bridging needed between cells? . . . . . . . . . . . . . . . . . . . . . 564.4.2 Inter-cell bridging topologies . . . . . . . . . . . . . . . . . . . . . . . . . . . . . . . 57
Part 2. Planning and design . . . . . . . . . . . . . . . . . . . . . . . . . . . . . . . . . . . . . . . . . . . . . . . . . . 59
Chapter 5. Design considerations for large environments . . . . . . . . . . . . 615.1 Defining large topologies. . . . . . . . . . . . . . . . . . . . . . . . . . . . . . . . . . . . . . 62
5.1.1 Typical larger topologies . . . . . . . . . . . . . . . . . . . . . . . . . . . . . . . . . . 625.2 Cell size limits . . . . . . . . . . . . . . . . . . . . . . . . . . . . . . . . . . . . . . . . . . . . . . 62
5.2.1 Cell structure review . . . . . . . . . . . . . . . . . . . . . . . . . . . . . . . . . . . . . 635.2.2 Number of nodes per cell . . . . . . . . . . . . . . . . . . . . . . . . . . . . . . . . . 645.2.3 Number of application servers per node . . . . . . . . . . . . . . . . . . . . . . 645.2.4 Number of applications per application server . . . . . . . . . . . . . . . . . 665.2.5 Number of core groups per cell . . . . . . . . . . . . . . . . . . . . . . . . . . . . . 66
5.3 WebSphere Application Server cell size design considerations . . . . . . . . 675.4 WebSphere Application Server scalability by component . . . . . . . . . . . . . 68
5.4.1 HA manager . . . . . . . . . . . . . . . . . . . . . . . . . . . . . . . . . . . . . . . . . . . 695.4.2 Core groups . . . . . . . . . . . . . . . . . . . . . . . . . . . . . . . . . . . . . . . . . . . 705.4.3 Core group bridging . . . . . . . . . . . . . . . . . . . . . . . . . . . . . . . . . . . . . 725.4.4 System management components . . . . . . . . . . . . . . . . . . . . . . . . . . 735.4.5 Security components. . . . . . . . . . . . . . . . . . . . . . . . . . . . . . . . . . . . . 76
iv Techniques for Managing Large WebSphere Installations

5.5 High availability using WebSphere Application Server for z/OS . . . . . . . . 76
Chapter 6. Planning for large environments . . . . . . . . . . . . . . . . . . . . . . . . 796.1 Classification of topologies . . . . . . . . . . . . . . . . . . . . . . . . . . . . . . . . . . . . 806.2 Selecting the appropriate topology . . . . . . . . . . . . . . . . . . . . . . . . . . . . . . 83
6.2.1 Decision factors affecting the topology selection . . . . . . . . . . . . . . . 836.3 Overview of topologies . . . . . . . . . . . . . . . . . . . . . . . . . . . . . . . . . . . . . . . 86
6.3.1 Nonpartitioned cell (single core group) topology. . . . . . . . . . . . . . . . 866.3.2 Partitioned cell (multicore group) topology . . . . . . . . . . . . . . . . . . . . 886.3.3 Partitioned cell with HA manager-disabled core group topology. . . . 906.3.4 Intra-cell bridging topology . . . . . . . . . . . . . . . . . . . . . . . . . . . . . . . . 946.3.5 Inter-cell bridging topology . . . . . . . . . . . . . . . . . . . . . . . . . . . . . . . 101
Chapter 7. Best practices and tuning recommendations for large environments. . . . . . . . . . . . . . . . . . . . . . . . . . . . . . . . . . . . . . . 105
7.1 Components requiring tuning in large environments. . . . . . . . . . . . . . . . 1067.2 Recommendations for the HA manager . . . . . . . . . . . . . . . . . . . . . . . . . 106
7.2.1 Tuning the HA manager protocols . . . . . . . . . . . . . . . . . . . . . . . . . 1077.2.2 Tuning the HA manager memory buffers . . . . . . . . . . . . . . . . . . . . 1117.2.3 Tuning the HA coordinator . . . . . . . . . . . . . . . . . . . . . . . . . . . . . . . 113
7.3 Recommendations for core groups . . . . . . . . . . . . . . . . . . . . . . . . . . . . . 1167.3.1 Multiple core groups . . . . . . . . . . . . . . . . . . . . . . . . . . . . . . . . . . . . 1167.3.2 Core group formation rules . . . . . . . . . . . . . . . . . . . . . . . . . . . . . . . 1177.3.3 Core group tuning options. . . . . . . . . . . . . . . . . . . . . . . . . . . . . . . . 1187.3.4 IBM_CS_WIRE_FORMAT_VERSION . . . . . . . . . . . . . . . . . . . . . . 119
7.4 Recommendations for intra-cell core group bridging. . . . . . . . . . . . . . . . 1207.4.1 Bridging configuration . . . . . . . . . . . . . . . . . . . . . . . . . . . . . . . . . . . 1207.4.2 Selecting bridge interfaces . . . . . . . . . . . . . . . . . . . . . . . . . . . . . . . 1217.4.3 Bridging topologies . . . . . . . . . . . . . . . . . . . . . . . . . . . . . . . . . . . . . 1217.4.4 Core Group Bridge Service custom properties . . . . . . . . . . . . . . . . 122
7.5 Recommendations for inter-cell core group bridging. . . . . . . . . . . . . . . . 1247.5.1 Inter-cell bridging configuration rules . . . . . . . . . . . . . . . . . . . . . . . 1247.5.2 Inter-cell bridging configuration . . . . . . . . . . . . . . . . . . . . . . . . . . . . 1257.5.3 Core Group Bridge Service custom properties . . . . . . . . . . . . . . . . 1277.5.4 Core Group Bridge Service security . . . . . . . . . . . . . . . . . . . . . . . . 128
7.6 Recommendations for system management components . . . . . . . . . . . 1297.7 Recommendations for security components . . . . . . . . . . . . . . . . . . . . . . 130
7.7.1 Performance fixes . . . . . . . . . . . . . . . . . . . . . . . . . . . . . . . . . . . . . . 1307.7.2 Java 2 security . . . . . . . . . . . . . . . . . . . . . . . . . . . . . . . . . . . . . . . . 1307.7.3 Authentication . . . . . . . . . . . . . . . . . . . . . . . . . . . . . . . . . . . . . . . . . 1307.7.4 Authorization . . . . . . . . . . . . . . . . . . . . . . . . . . . . . . . . . . . . . . . . . . 1327.7.5 SSL . . . . . . . . . . . . . . . . . . . . . . . . . . . . . . . . . . . . . . . . . . . . . . . . . 133
Contents v

Chapter 8. Planning for a large cell migration . . . . . . . . . . . . . . . . . . . . . 1358.1 Core group migration considerations . . . . . . . . . . . . . . . . . . . . . . . . . . . 1368.2 Default core group-related migration activities . . . . . . . . . . . . . . . . . . . . 1368.3 Planning the core group topology . . . . . . . . . . . . . . . . . . . . . . . . . . . . . . 137
8.3.1 Core group size. . . . . . . . . . . . . . . . . . . . . . . . . . . . . . . . . . . . . . . . 1378.3.2 Core group transport . . . . . . . . . . . . . . . . . . . . . . . . . . . . . . . . . . . . 1388.3.3 Custom property configuration overrides . . . . . . . . . . . . . . . . . . . . 1388.3.4 Core group coordinator . . . . . . . . . . . . . . . . . . . . . . . . . . . . . . . . . . 138
8.4 Example: A large cell migration. . . . . . . . . . . . . . . . . . . . . . . . . . . . . . . . 1388.4.1 Large cell migration plan . . . . . . . . . . . . . . . . . . . . . . . . . . . . . . . . . 1448.4.2 Other planning considerations . . . . . . . . . . . . . . . . . . . . . . . . . . . . 1468.4.3 Migration flow . . . . . . . . . . . . . . . . . . . . . . . . . . . . . . . . . . . . . . . . . 146
Part 3. Administration and problem determination . . . . . . . . . . . . . . . . . . . . . . . . . . . . . . 165
Chapter 9. System management and configuration . . . . . . . . . . . . . . . . 1679.1 Introduction . . . . . . . . . . . . . . . . . . . . . . . . . . . . . . . . . . . . . . . . . . . . . . . 1689.2 Areas of administration . . . . . . . . . . . . . . . . . . . . . . . . . . . . . . . . . . . . . . 168
9.2.1 Product installation and maintenance . . . . . . . . . . . . . . . . . . . . . . . 1699.2.2 Profile management . . . . . . . . . . . . . . . . . . . . . . . . . . . . . . . . . . . . 1759.2.3 Configuration management. . . . . . . . . . . . . . . . . . . . . . . . . . . . . . . 1779.2.4 Application deployment . . . . . . . . . . . . . . . . . . . . . . . . . . . . . . . . . . 198
9.3 Scripting and tooling . . . . . . . . . . . . . . . . . . . . . . . . . . . . . . . . . . . . . . . . 2029.3.1 Working with the Application Server Toolkit . . . . . . . . . . . . . . . . . . 2039.3.2 Getting help with scripting from ISC . . . . . . . . . . . . . . . . . . . . . . . . 2069.3.3 Working with wsadmin objects . . . . . . . . . . . . . . . . . . . . . . . . . . . . 2079.3.4 Introducing a scripting project . . . . . . . . . . . . . . . . . . . . . . . . . . . . . 2099.3.5 Further reading . . . . . . . . . . . . . . . . . . . . . . . . . . . . . . . . . . . . . . . . 220
Chapter 10. Problem determination. . . . . . . . . . . . . . . . . . . . . . . . . . . . . . 22110.1 Troubleshooting large environments . . . . . . . . . . . . . . . . . . . . . . . . . . . 22210.2 Configuration issues in large topologies . . . . . . . . . . . . . . . . . . . . . . . . 22210.3 Runtime issues in large topologies . . . . . . . . . . . . . . . . . . . . . . . . . . . . 223
10.3.1 Troubleshooting the HA manager and core groups . . . . . . . . . . . 22310.3.2 Troubleshooting Core Group Bridge Service . . . . . . . . . . . . . . . . 233
10.4 Tools for problem analysis . . . . . . . . . . . . . . . . . . . . . . . . . . . . . . . . . . 24010.4.1 Detecting and analyzing runtime problems . . . . . . . . . . . . . . . . . . 24010.4.2 Logging Common Base Events. . . . . . . . . . . . . . . . . . . . . . . . . . . 243
vi Techniques for Managing Large WebSphere Installations

Part 4. Sample scenarios . . . . . . . . . . . . . . . . . . . . . . . . . . . . . . . . . . . . . . . . . . . . . . . . . . . 247
Chapter 11. Large installation scenarios . . . . . . . . . . . . . . . . . . . . . . . . . 24911.1 Introduction . . . . . . . . . . . . . . . . . . . . . . . . . . . . . . . . . . . . . . . . . . . . . . 25011.2 Tools and techniques . . . . . . . . . . . . . . . . . . . . . . . . . . . . . . . . . . . . . . 251
11.2.1 Jython . . . . . . . . . . . . . . . . . . . . . . . . . . . . . . . . . . . . . . . . . . . . . . 25111.2.2 JMeter . . . . . . . . . . . . . . . . . . . . . . . . . . . . . . . . . . . . . . . . . . . . . . 25211.2.3 Test applications . . . . . . . . . . . . . . . . . . . . . . . . . . . . . . . . . . . . . . 25711.2.4 Other tools. . . . . . . . . . . . . . . . . . . . . . . . . . . . . . . . . . . . . . . . . . . 258
11.3 Topology scenarios . . . . . . . . . . . . . . . . . . . . . . . . . . . . . . . . . . . . . . . . 25911.3.1 Infrastructure for topology scenarios. . . . . . . . . . . . . . . . . . . . . . . 26011.3.2 Setting up a test topology scenario . . . . . . . . . . . . . . . . . . . . . . . . 26211.3.3 Planning scenario tests . . . . . . . . . . . . . . . . . . . . . . . . . . . . . . . . . 26311.3.4 Tuning the topology. . . . . . . . . . . . . . . . . . . . . . . . . . . . . . . . . . . . 26411.3.5 Setting up the server topology . . . . . . . . . . . . . . . . . . . . . . . . . . . 26711.3.6 Steps for setting up JMeter clients . . . . . . . . . . . . . . . . . . . . . . . . 272
11.4 Scenario 1 topology. . . . . . . . . . . . . . . . . . . . . . . . . . . . . . . . . . . . . . . . 27311.4.1 Scenario 1 topology setup. . . . . . . . . . . . . . . . . . . . . . . . . . . . . . . 27411.4.2 Scenario 1 tests planning . . . . . . . . . . . . . . . . . . . . . . . . . . . . . . . 27611.4.3 Scenario1-44 topology . . . . . . . . . . . . . . . . . . . . . . . . . . . . . . . . . 27711.4.4 Scenario1-80 topology . . . . . . . . . . . . . . . . . . . . . . . . . . . . . . . . . 281
11.5 Scenario 2 topology. . . . . . . . . . . . . . . . . . . . . . . . . . . . . . . . . . . . . . . . 28511.5.1 Scenario 2 topology setup. . . . . . . . . . . . . . . . . . . . . . . . . . . . . . . 28611.5.2 Scenario 2 topology tests planning . . . . . . . . . . . . . . . . . . . . . . . . 28711.5.3 Scenario2 topology-No bridge. . . . . . . . . . . . . . . . . . . . . . . . . . . . 28811.5.4 Scenario2-Bridge topology . . . . . . . . . . . . . . . . . . . . . . . . . . . . . . 29311.5.5 Scenario2-Bridge cross topology . . . . . . . . . . . . . . . . . . . . . . . . . 297
11.6 Scenario 3 topology. . . . . . . . . . . . . . . . . . . . . . . . . . . . . . . . . . . . . . . . 30111.6.1 Scenario 3 topology tests planning . . . . . . . . . . . . . . . . . . . . . . . . 30211.6.2 Scenario3-Mesh topology . . . . . . . . . . . . . . . . . . . . . . . . . . . . . . . 30211.6.3 Scenario3-Chain topology. . . . . . . . . . . . . . . . . . . . . . . . . . . . . . . 308
Contents vii

Part 5. Appendixes . . . . . . . . . . . . . . . . . . . . . . . . . . . . . . . . . . . . . . . . . . . . . . . . . . . . . . . . 313
Appendix A. Additional material . . . . . . . . . . . . . . . . . . . . . . . . . . . . . . . . 315Locating the Web material . . . . . . . . . . . . . . . . . . . . . . . . . . . . . . . . . . . . . . . 315Using the Web material . . . . . . . . . . . . . . . . . . . . . . . . . . . . . . . . . . . . . . . . . 316
Glossary . . . . . . . . . . . . . . . . . . . . . . . . . . . . . . . . . . . . . . . . . . . . . . . . . . . . 317
Abbreviations and acronyms . . . . . . . . . . . . . . . . . . . . . . . . . . . . . . . . . . . 319
Related publications . . . . . . . . . . . . . . . . . . . . . . . . . . . . . . . . . . . . . . . . . . 321IBM Redbooks . . . . . . . . . . . . . . . . . . . . . . . . . . . . . . . . . . . . . . . . . . . . . . . . 321Online resources . . . . . . . . . . . . . . . . . . . . . . . . . . . . . . . . . . . . . . . . . . . . . . 321How to get Redbooks . . . . . . . . . . . . . . . . . . . . . . . . . . . . . . . . . . . . . . . . . . . 322Help from IBM . . . . . . . . . . . . . . . . . . . . . . . . . . . . . . . . . . . . . . . . . . . . . . . . 323
Index . . . . . . . . . . . . . . . . . . . . . . . . . . . . . . . . . . . . . . . . . . . . . . . . . . . . . . . 325
viii Techniques for Managing Large WebSphere Installations

Notices
This information was developed for products and services offered in the U.S.A.
IBM may not offer the products, services, or features discussed in this document in other countries. Consult your local IBM representative for information on the products and services currently available in your area. Any reference to an IBM product, program, or service is not intended to state or imply that only that IBM product, program, or service may be used. Any functionally equivalent product, program, or service that does not infringe any IBM intellectual property right may be used instead. However, it is the user's responsibility to evaluate and verify the operation of any non-IBM product, program, or service.
IBM may have patents or pending patent applications covering subject matter described in this document. The furnishing of this document does not give you any license to these patents. You can send license inquiries, in writing, to: IBM Director of Licensing, IBM Corporation, North Castle Drive, Armonk, NY 10504-1785 U.S.A.
The following paragraph does not apply to the United Kingdom or any other country where such provisions are inconsistent with local law: INTERNATIONAL BUSINESS MACHINES CORPORATION PROVIDES THIS PUBLICATION "AS IS" WITHOUT WARRANTY OF ANY KIND, EITHER EXPRESS OR IMPLIED, INCLUDING, BUT NOT LIMITED TO, THE IMPLIED WARRANTIES OF NON-INFRINGEMENT, MERCHANTABILITY OR FITNESS FOR A PARTICULAR PURPOSE. Some states do not allow disclaimer of express or implied warranties in certain transactions, therefore, this statement may not apply to you.
This information could include technical inaccuracies or typographical errors. Changes are periodically made to the information herein; these changes will be incorporated in new editions of the publication. IBM may make improvements and/or changes in the product(s) and/or the program(s) described in this publication at any time without notice.
Any references in this information to non-IBM Web sites are provided for convenience only and do not in any manner serve as an endorsement of those Web sites. The materials at those Web sites are not part of the materials for this IBM product and use of those Web sites is at your own risk.
IBM may use or distribute any of the information you supply in any way it believes appropriate without incurring any obligation to you.
Information concerning non-IBM products was obtained from the suppliers of those products, their published announcements or other publicly available sources. IBM has not tested those products and cannot confirm the accuracy of performance, compatibility or any other claims related to non-IBM products. Questions on the capabilities of non-IBM products should be addressed to the suppliers of those products.
This information contains examples of data and reports used in daily business operations. To illustrate them as completely as possible, the examples include the names of individuals, companies, brands, and products. All of these names are fictitious and any similarity to the names and addresses used by an actual business enterprise is entirely coincidental.
COPYRIGHT LICENSE:
This information contains sample application programs in source language, which illustrate programming techniques on various operating platforms. You may copy, modify, and distribute these sample programs in any form without payment to IBM, for the purposes of developing, using, marketing or distributing application programs conforming to the application programming interface for the operating platform for which the sample programs are written. These examples have not been thoroughly tested under all conditions. IBM, therefore, cannot guarantee or imply reliability, serviceability, or function of these programs.
© Copyright IBM Corp. 2008. All rights reserved. ix

Trademarks
The following terms are trademarks of the International Business Machines Corporation in the United States, other countries, or both:
Redbooks (logo) ®developerWorks®z/OS®AIX®DB2®
Geographically Dispersed Parallel Sysplex™
GDPS®IBM®Parallel Sysplex®
Rational®Redbooks®Tivoli®WebSphere®
The following terms are trademarks of other companies:
SAP, and SAP logos are trademarks or registered trademarks of SAP AG in Germany and in several other countries.
Enterprise JavaBeans, EJB, Java, Java Naming and Directory Interface, JavaBeans, JavaServer, JavaServer Pages, JMX, JSP, JVM, J2EE, Sun, Sun Java, and all Java-based trademarks are trademarks of Sun Microsystems, Inc. in the United States, other countries, or both.
Excel, Internet Explorer, Microsoft, Windows, and the Windows logo are trademarks of Microsoft Corporation in the United States, other countries, or both.
UNIX is a registered trademark of The Open Group in the United States and other countries.
Linux is a trademark of Linus Torvalds in the United States, other countries, or both.
Other company, product, or service names may be trademarks or service marks of others.
x Techniques for Managing Large WebSphere Installations

Preface
As WebSphere® Application Server installations grow to accommodate the growth of business processing, the question “How large can a WebSphere Application Server cell be?” is being asked more often. This IBM® Redbook discusses large WebSphere Application Server installations, and as you will see, the answer to the question is not straightforward. Numerous variables play a part in supporting or constraining the size of a WebSphere environment. These variables are most likely different in each WebSphere Application Server installation, resulting in a different answer for each environment.
This Redbook discusses large WebSphere Application Server topologies, focusing specifically on best practices when planning and configuring the high availability manager, core groups, and core group bridging. A review of high availability, core groups, and core group bridging features is followed by extensive coverage of planning, designing, and implementing a large cell migration. The book then covers detailed scenarios of configuring single and multiple core group topologies.
In addition, the scripts, applications, and batch files used to set up and test the scenarios are included as additional material that can be downloaded and modified as required for your specific environment.
This Redbook is intended for WebSphere Application Server administrators and planners who are considering migrating their small to midsize installations to larger topologies.
© Copyright IBM Corp. 2008. All rights reserved. xi

The team that wrote this book
This book was produced by a team of specialists from around the world working at the International Technical Support Organization, Raleigh Center.
The team Reto, Nanditha, Byron, Karel, Batchazi, Ajay
Byron Braswell is a is a Networking Professional at the ITSO, Raleigh Center. He received a Bachelor of Science degree in Physics and a Master of Computer Science degree in Computer Sciences from Texas A&M University. He writes extensively in the areas of networking, application integration middleware, and personal computer software. Before joining the ITSO, Byron worked in IBM Learning Services Development in networking education development.
Debasish Banerjee is presently a WebSphere consultant in IBM Software Services. He started his WebSphere products career as a WebSphere Internationalization Architect. Workload management, high availability, and disaster recovery of WebSphere environments are his special areas of interest. Debasish received his Ph.D. in the field of combinator-based Functional Programming languages.
Reto Hirt is an independent software consultant at schlag&rahm gmbh, his own company based in Winterthur, Switzerland. He has 10 years of experience in Java™ technology and worked as an SSO for IBM on various WebSphere-based projects as well as for other customers. His expertise lies in development,
xii Techniques for Managing Large WebSphere Installations

performance tuning, troubleshooting, and engineering - specifically for distributed platforms. He holds a degree in electrical engineering from ETH Zurich.
Batchazi Kaayou is an IT consultant in WebSphere Application Server at Gam Consult, Luxembourg. Since 2001, he has performed a variety of analysis, design, and J2EE™ development activities, and has served as team technical leader and coach as well. His expertise includes IBM WebSphere Application Server and middleware systems and management and troubleshooting of distributed platforms. He received a Ph.D. in Mechanics, Speciality “Engineering”: “Modelization of multi-materials behavior and damage, tested in torsion” at the University of Franche-Comté, and a Master's degree in Software Engineering and Networks at Saint-Etienne Mining Engineering School (EMSE – Saint Etienne). Prior to working in IT and on WebSphere products, he worked as a research engineer and published scientific papers related to torsional behavior, characterization, and local approach of damage of multimaterials loaded in warping torsion.
Kevin Kepros is an advisory software engineer at the IBM Software Development Lab in Rochester, Minnesota. Kevin is a lead developer on the WebSphere high availability manager component, which includes the distribution and consistency services (DCS). Previously Kevin worked as a developer on the Workload Management (WLM) component of WebSphere Application Server.
Ajay Krishna is a Software Engineer at the IBM Software Group in India. He has four years of experience at IBM on WebSphere Application Server functional verification testing. His areas of expertise include WebSphere Application Server, Java programming, J2EE, and related technologies. He holds a Bachelor’s degree in engineering from the Visweswaraiah Technological University in Karnataka, India. He has professional certifications in WebSphere products, Sun™ Java™ technology, and DB2®.
Karel Michek is an IT Architect at IBM Czech Republic. His areas of expertise include object-oriented analysis and design, enterprise Java development, and database design. Karel has been focusing on the WebSphere family of products primarily in the business integration area. He holds a Master’s degree in Computer Science from the Czech Technical University in Prague, and a number of IBM WebSphere products and Sun Java technology certifications.
Nanditha Siram is the co-founder of Amatra Technologies, Inc., a software solutions company based in the United States that aims to provide comprehensive and integrated solutions to business enterprises. She has nine years of experience in infrastructure and application architecture, J2EE software development, and system administration for WebSphere Application Server on distributed platforms. Her areas of expertise include SOA, application integration with a focus on the WebSphere suite of products and J2EE architecture. She holds a Bachelor’s degree in Mechanical Engineering from Andhra University,
Preface xiii

India and a Master’s degree in Computer Science from Purdue University, Indiana. More information can be found in her blog: http://nanditha.blogs.amatra.com
Thanks to the following people for their contributions to this project:
Carolyn BriscoeNickolas PellegreneCarla SadtlerMargaret TicknorDavid WattsInternational Technical Support Organization, Raleigh Center
Ueli WahliInternational Technical Support Organization, San Jose Center
John DillerAndrew HansJacquelle LeggettShekar MaramrajuBrian K. MartinAlexandre PolozoffJeffrey SmithJhared SmithTimothy VanderhamIBM RTP, North Carolina
Mei-Hsiang ChangMichael ChengBill MorrisonIBM Austin, Texas
Tim ForsBarry SearleIBM Canada
Dana DuffieldLi-Fang LeeJim StopyroMatt WeaverIBM Rochester, Minnesota
Graham WallisIBM United Kingdom
xiv Techniques for Managing Large WebSphere Installations

Benjamin MandlerIBM Israel
Become a published author
Join us for a two- to six-week residency program! Help write a book dealing with specific products or solutions, while getting hands-on experience with leading-edge technologies. You will have the opportunity to team with IBM technical professionals, Business Partners, and Clients.
Your efforts will help increase product acceptance and customer satisfaction. As a bonus, you will develop a network of contacts in IBM development labs, and increase your productivity and marketability.
Find out more about the residency program, browse the residency index, and apply online at:
ibm.com/redbooks/residencies.html
Comments welcome
Your comments are important to us!
We want our books to be as helpful as possible. Send us your comments about this book or other IBM Redbooks® in one of the following ways:
� Use the online Contact us review Redbooks form found at:
ibm.com/redbooks
� Send your comments in an e-mail to:
� Mail your comments to:
IBM Corporation, International Technical Support OrganizationDept. HYTD Mail Station P0992455 South RoadPoughkeepsie, NY 12601-5400
Preface xv

xvi Techniques for Managing Large WebSphere Installations

Chapter 1. Introduction
As WebSphere Application Server installations grow to accommodate the growth of business processing, the question of “How large can a WebSphere Application Server cell be?” is being asked more often. Numerous variables play a part in supporting or constraining the size of a WebSphere environment. These variables are most likely different in each WebSphere installation, resulting in a different answer for each environment.
In this chapter, we introduce the issues that must be addressed as healthy business growth expands your WebSphere Application Server infrastructure needs beyond your small and intermediate IT environment.
1
© Copyright IBM Corp. 2008. All rights reserved. 1

1.1 Large WebSphere installations - the issues
No one number defines the maximum number of applications in a cell. In fact, a decision must be made to determine what measurement to use to describe the size of a cell. It could be the number of Java virtual machines in a cell, or the number of WebSphere Application Server nodes, or the maximum number of applications that can be deployed in a cell. All these measurements, and more, can contribute to the limits of cell size. Keep in mind, however, that WebSphere Application Server is a product that is composed of many components, not all of which have an impact on cell size. This IBM Redbook publication focuses on considerations for those components that do have an impact on cell size.
1.1.1 Typical large WebSphere Application Server topologies
As a result of the vertical scaling growth (more application servers on fewer physical machines) or horizontal scaling growth (fewer application servers per machine on more physical machines) of a WebSphere environment, the large topologies discussed in the following sections can be the outcome.
Topology 1This topology consists of a balanced mix of nodes and application servers per node.
� One deployment manager on a dedicated machine
� Thirty nodes, each one a dedicated machine
� On each node, at least 40 application servers
� Total application servers in the cell, approximately 1200
Topology 2This topology involves more nodes with fewer application servers per node - horizontal scaling.
� One deployment manager on a dedicated machine
� Sixty nodes, each one a dedicated machine
� On each node, at least 20 application servers
� Total application servers in the cell, about 1200
2 Techniques for Managing Large WebSphere Installations

Topology 3This topology involves fewer nodes with more application servers per node - vertical scaling.
� One deployment manager on a dedicated machine
� Two nodes, each one a dedicated machine
� On each node, 400+ servers
1.1.2 Large cell technical challenges
No matter what type of topology or usage pattern exists in your environment, one of the the primary mechanisms that limits the size of a WebSphere Application Server cell is the need to support shared information across all or a large set of WebSphere processes (other limiting factors include network capacity and memory or CPU constraints). The breadth and currency requirements for shared information (something that must be known by all or many Java virtual machines - JVMs - within the cell) present a challenge for any distributed computing system. Various components of the WebSphere product have made trade-offs in the design of the mechanisms for communication and coordination of shared information. The issue is not whether a large topology can successfully be configured; the issue is whether a large topology will function properly when all JVMs are running and serving application requests.
Which WebSphere Application Server components can have an impact on the size of a cell? Any component – all components have the potential to implement logic that can block scaling up a cell. Hosted applications can also be implemented in such a way that they restrict the cell size. The components discussed in this book represent some of the ones that deal with shared information, and therefore can become an issue as the size of the cell grows. In particular, these components include the high availability manager (HA manager) and any component that uses it for shared information, systems administration, and security.
Important: The numbers listed in the typical large WebSphere topologies are based on Best Practices for Large WebSphere Topologies, a Quarterly Report from the WebSphere Large Topology Task Force. This document is available at:
http://www.ibm.com/developerworks/websphere/library/techarticles/0710_largetopologies/0710_largetopologies.html
Chapter 1. Introduction 3

1.2 Topics covered in this book
This book covers techniques for planning, designing, and managing large WebSphere environments using WebSphere Application Server Network Deployment V6.1 on Microsoft® Windows® 2003 Enterprise Edition (64 bit) and Red Hat Enterprise Linux® 5 (64 bit) operating system platforms and WebSphere Application Server for z/OS®.
1.2.1 Part 1. Technical concepts
In Part 1, we introduce some key components in WebSphere Application Server Network Deployment V6.1 that address configuring WebSphere to support large environments. The following components are discussed:
� Chapter 2, “High availability manager” on page 13
� Chapter 3, “Core groups” on page 21
� Chapter 4, “Core group bridging” on page 45
1.2.2 Part 2. Planning and design
Part 2 covers issues to keep in mind when planning, designing, tuning, and migrating to large WebSphere environments. The following topics are covered:
� Chapter 5, “Design considerations for large environments” on page 61
� Chapter 6, “Planning for large environments” on page 79
� Chapter 7, “Best practices and tuning recommendations for large environments” on page 105
� Chapter 8, “Planning for a large cell migration” on page 135
1.2.3 Part 3. Administration and problem determination
Part 3 addresses issues such as using scripts to automate the administration and management of a large environment. In addition, it briefly discusses problem determination and resolution suggestions.
� Chapter 9, “System management and configuration” on page 167
� Chapter 10, “Problem determination” on page 221
4 Techniques for Managing Large WebSphere Installations

1.2.4 Part 4. Sample scenarios
In Part 4, we document our lab environment and the test scenarios we used to set up, measure, tune, and migrate WebSphere Application Server in various large systems configurations.
� Chapter 11, “Large installation scenarios” on page 249
1.2.5 Additional material
Appendix A, “Additional material” on page 315 gives instructions on how to download the batch command files, scripts, and applications we used in our lab and test scenario environment. You can then use these samples as a basis to create your own customized automation and control. These scripts and commands are discussed in Chapter 9, “System management and configuration” on page 167, and Chapter 11, “Large installation scenarios” on page 249.
1.3 WebSphere Extended Deployment V6.1
WebSphere Extended Deployment provides an IT infrastructure that dynamically and reliably adapts to changing business demands. WebSphere Extended Deployment extends the capabilities of WebSphere Application Server Network Deployment and other middleware to help you optimize the utilization and management of your deployments and enhance the quality of service of your business-critical applications.
WebSphere Extended Deployment V6.1 offers three distinct areas of capabilities. You can get all capabilities or select a subset from the following packaging options:
� WebSphere Extended Deployment Operations Optimization
Operations Optimization provides dynamic operations, runtime operations monitoring, and extended management features for WebSphere Application Server Network Deployment environments, as well as support for non-WebSphere application servers.
� WebSphere Extended Deployment Data Grid
The Data Grid option provides high-end caching and transaction partitioning capabilities. The data-intensive workload extenders of Data Grid improve the
Chapter 1. Introduction 5

interaction between application services and underlying data sources, resulting in the following:
– Dramatically increased application performance – Improved application scalability – Increased developer efficiency
� WebSphere Extended Deployment Compute Grid
Compute Grid features provide flexible support for mixed application types. Features of Compute Grid include the following:
– Batch workload services– Compute-intensive workload services– Long-running workload scheduler
Long-running workload extenders support the scheduling and execution of long-running workloads in a standards-based WebSphere environment, resulting in improved application consistency and maintainability. It provides common development, administration, and management models for multiple workload types.
1.3.1 Operations optimization
When it comes to large WebSphere topologies, the operations optimization features of WebSphere Extended Deployment become key to managing the resources, performance, and health of the WebSphere environment.
This publication does not cover the use of WebSphere Extended Deployment; however, we want to provide a brief introduction here. For more information about how to use the operations optimization feature to manage large WebSphere topologies, see Optimizing Operations with WebSphere Extended Deployment V6.1, SG24-7422.
The features operations optimization include the following:
� Policy-based request prioritization and flow control for HTTP, SOAP, Internet Inter-ORB Protocol (IIOP), and Java Message Service (JMS) traffic
� Dynamic feedback-based workload management
� Visualization features to help you manage complex environments
� Virtualization and resource sharing
� Application placement for optimal service goal achievement
� Health management of application servers
� Application edition management
6 Techniques for Managing Large WebSphere Installations

A traditional WebSphere Application Server environment is static in nature. It is comprised of a set number of servers and clusters that serve specific applications. Resources are dedicated to applications to ensure that they operate at capacity during peak loads. Because different applications often have varying needs for resources (high at times, low at others), this resource dedication often leads to an excess of physical capacity in terms of CPU and memory during off-peak periods.
The characteristic of these static environments is that they are not making best use of the overall capacity and the configuration in terms of numbers of servers. Additionally these environments cannot quickly respond to unexpected changes in workload. For example, if an application has a dramatic increase in load, sufficient capacity in the servers may not be set aside for that application to meet the demand. However, other servers running other applications may have sufficient capacity that cannot be used.
With the dynamic operations features of Operations Optimization, you can change the way a typical WebSphere environment is configured today, to one that has the following features:
� Improves the utilization of available resources such as CPU and memory
� Classifies and monitors the workload
� Provides a business-centric view of the workload and how it is performing
� Can respond in real time to changes in the workload mix (without human intervention if so desired), using business guidelines that the organization specifies
WebSphere Extended Deployment implements a virtualized environment by creating pools of resources that can be shared among applications, thereby optimizing utilization and simplifying overall deployment. As resources are needed for expected (or unexpected) spikes in workload demand, resources can be allocated where they are needed most.
User-defined policies based on business requirements specify performance goals for each application. WebSphere Extended Deployment dynamically allocates resources to each application aiming to meet these performance goals.
Optimization of the computing resources that you already own might enable you to run more applications on the machines that you already have in place.
Following are the key elements and functions of Operations Optimization V6.1:
� On Demand Router (ODR)
The ODR is an intelligent proxy that acts as the entry point for traffic coming into an Extended Development cell, performing request prioritization, flow
Chapter 1. Introduction 7

control, and dynamic workload management for HTTP requests and SOAP over HTTP requests.
� Dynamic application placement
The dynamic application placement feature uses dynamic clusters to virtualize the application deployment targets, enabling provisioning of resources to help meet your stated performance goals.
Each node within a dynamic cluster has an instance of an application server running that cluster’s applications that can be started dynamically as traffic for that application increases.
� Autonomic managers
Autonomic managers make decisions for the environment, including health management, traffic shaping, and application placement.
� Traffic-shaping features
Traffic-shaping features classify requests and manage the flow of requests into the application servers. HTTP, SOAP, and Session Initiation Protocol (SIP) requests are classified and controlled in the ODR. JMS, and IIOP traffic is classified and controlled at the application server level.
� Health management
The health monitoring and management subsystem continuously monitors the operation of servers against user-defined health policies to detect functional degradation that is related to user application malfunctions.
� Runtime operation monitoring
With the new complexities of dynamic operations, the need arises for tools that extend monitoring and manageability capabilities. The visualization components of WebSphere Extended Deployment enhance the administration console to provide live data on the performance and health characteristics of the entire cell.
� Application edition management
Loss of service to users means loss of business to you. The application edition management feature helps you ensure that the users of your application experience no loss of service when you install an application update in your environment.
8 Techniques for Managing Large WebSphere Installations

� Support for heterogeneous environments
Operations Optimization provides traffic-shaping and management support for WebSphere application servers as well as a number of non-WebSphere application servers.
– Full life cycle support for WebSphere application servers and PHP servers.
– Assisted life cycle support for Apache HTTP Server, Apache Tomcat, Apache Geronimo, JBoss, BEA WebLogic Server, WebSphere Application Server Community Edition.
– Generic life cycle support for custom HTTP servers.
� Centralized installation manager
This feature allows you to install code packages to new or existing systems from a centralized location (the Deployment Manager), simplifying the management of multiple installations.
Chapter 1. Introduction 9

10 Techniques for Managing Large WebSphere Installations

Part 1 Technical concepts
Part 1
© Copyright IBM Corp. 2008. All rights reserved. 11

12 Techniques for Managing Large WebSphere Installations

Chapter 2. High availability manager
IBM WebSphere Application Server Network Deployment V6 introduces a new feature called high availability manager (HA manager). The high availability manager (HA manager) is designed to provide an infrastructure for making selected WebSphere services highly available. As such, it runs as a service in each Java virtual machine (JVM™) in a WebSphere cell. This means that the HA manager is running in the following services:
� All application servers (clustered and standalone)
� All proxy servers
� All node agents
� Deployment Manager
The HA manager is running in these services unless you explicitly turn it off for individual processes, which should be considered carefully (see 3.4, “Disabling the HA manager” on page 42).
2
© Copyright IBM Corp. 2008. All rights reserved. 13
2.1 High availability manager main services
The HA manager provides a set of frameworks and facilities that other WebSphere services use to make themselves highly available. HA manager is present in all JVMs including the Deployment Manager and node agents.
The four main services provided by HA manager include:
� Bulletin board: A mechanism that allows processes to make aspects of their current state available to other processes that are interested in it. This mechanism is used in WebSphere Application Server Network Deployment by Workload Manager (WLM) and on demand configuration (ODC) to make routing information both highly available and available where needed.
� HA group: A runtime construct for policy-controlled failover. Most prominent is the One-of-N policy, which enables highly available singleton services. This facility is used to provide a high availability option for the default IBM JMS provider (messaging engine) and transaction logs. It is also used internally (often invisibly) by other WebSphere services.
� Agent framework: A low-level replication abstraction that combines elements of the highly available s with a reliable, high-speed interprocess messaging fabric. The memory-to-memory feature of Data Replication Service (DRS) is built using this abstraction.
� Partitioned managed group: A distributed state manager, including the ability to consolidate state in overviews.
14 Techniques for Managing Large WebSphere Installations
2.1.1 HA manager components
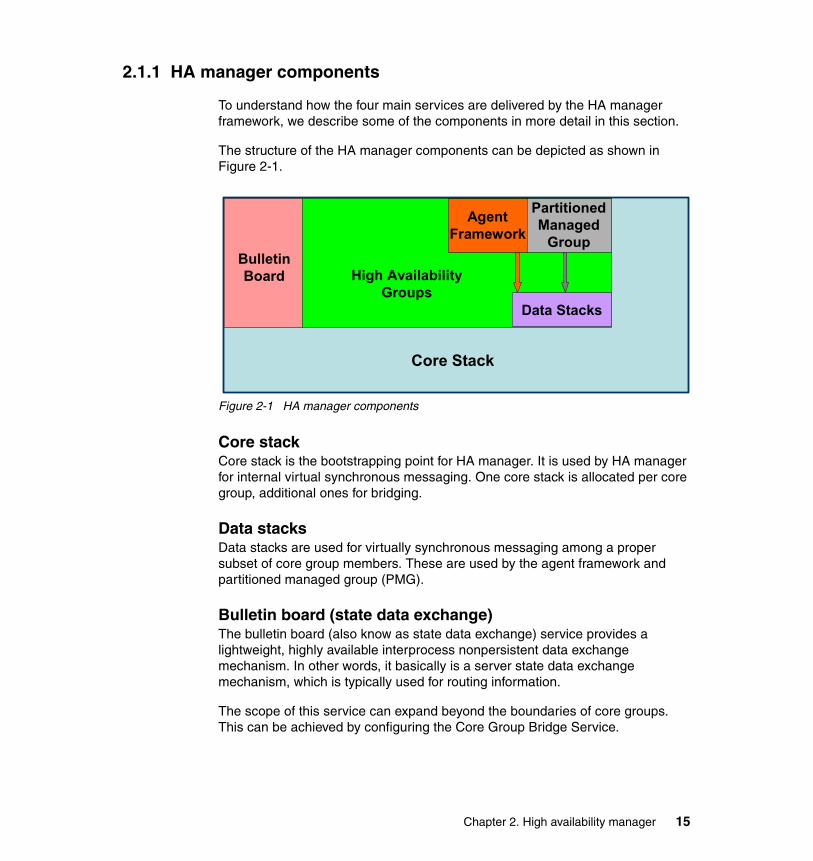
To understand how the four main services are delivered by the HA manager framework, we describe some of the components in more detail in this section.
The structure of the HA manager components can be depicted as shown in Figure 2-1.
Figure 2-1 HA manager components
Core stackCore stack is the bootstrapping point for HA manager. It is used by HA manager for internal virtual synchronous messaging. One core stack is allocated per core group, additional ones for bridging.
Data stacksData stacks are used for virtually synchronous messaging among a proper subset of core group members. These are used by the agent framework and partitioned managed group (PMG).
Bulletin board (state data exchange)The bulletin board (also know as state data exchange) service provides a lightweight, highly available interprocess nonpersistent data exchange mechanism. In other words, it basically is a server state data exchange mechanism, which is typically used for routing information.
The scope of this service can expand beyond the boundaries of core groups. This can be achieved by configuring the Core Group Bridge Service.
BulletinBoard High Availability
Groups
AgentFramework
PartitionedManaged
Group
Data Stacks
Core Stack
Chapter 2. High availability manager 15

Agent frameworkThe agent framework provides a hot failover mechanism along with a high throughput communication subsystem. Note that this service is very specific; it is only used by Data Replication Service (DRS).
Partitioned managed groupPartitioned managed group (PMG) can be viewed as a distributed cache or as a distributed state manager. This service is also very specific; it is only used by the core group bridging service.
The basic distributed pattern of this component is the following:
1. Each server holds the master copy of its own state.
2. Managers are elected and collect the local states from all members.
3. Managers then push the consolidated state back out to the servers.
4. If a server crashes, its state and contribution to the global state are irrecoverably lost.
5. The global state must be rebuilt on each manager when the set of managers change.
This pattern is similar to the pattern the HA coordinator uses to keep track of the state inside a core group. For more information about the HA coordinator, see 3.3, “HA coordinator” on page 35.
HA groupHigh availability (HA) groups are used for policy-based failover for relevant WebSphere components. This service is probably the most visible one, especially if the underlying policy is One-of-N. In that case, it provides high availability for singleton services.
The scope of a high availability group can never extend beyond core group boundaries. That means a failing singleton component in a core group can never be picked up by a component in another process running in a different core group. Even more, most HA groups do not extend beyond cluster scope (for example, transaction manager and messaging engine).
2.1.2 HA manager service usage
As all products of the WebSphere Application Server (including stack products such as the WebSphere Process Server and WebSphere Extended Deployment evolve over time, the usage of the HA manager framework increases steadily. Already now in WebSphere Application Server Network Deployment V6.1, a
16 Techniques for Managing Large WebSphere Installations
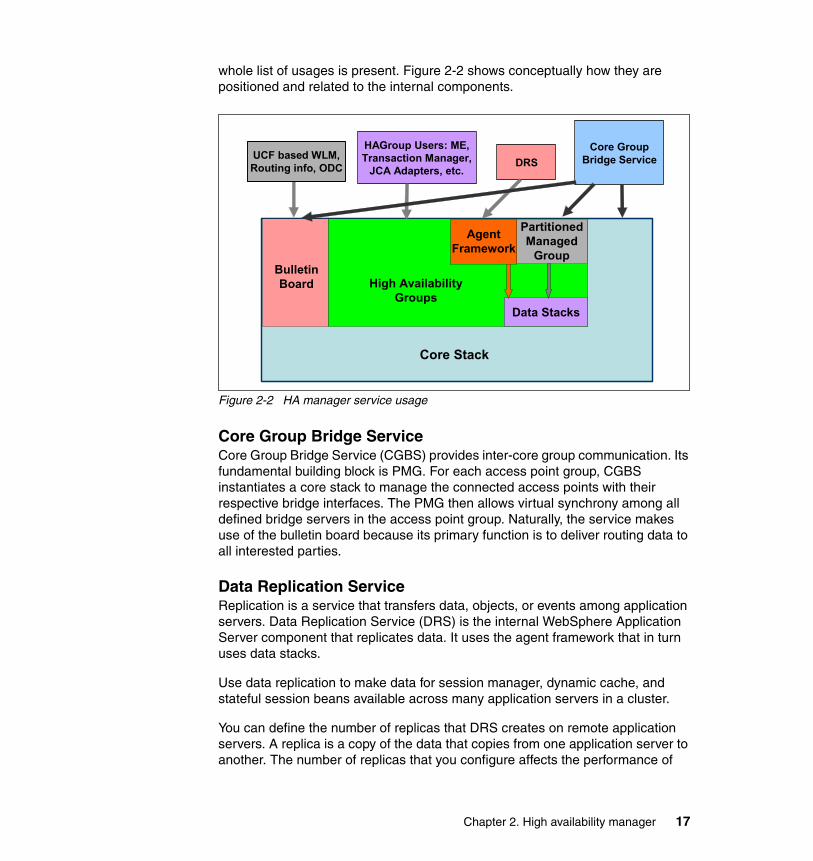
whole list of usages is present. Figure 2-2 shows conceptually how they are positioned and related to the internal components.
Figure 2-2 HA manager service usage
Core Group Bridge ServiceCore Group Bridge Service (CGBS) provides inter-core group communication. Its fundamental building block is PMG. For each access point group, CGBS instantiates a core stack to manage the connected access points with their respective bridge interfaces. The PMG then allows virtual synchrony among all defined bridge servers in the access point group. Naturally, the service makes use of the bulletin board because its primary function is to deliver routing data to all interested parties.
Data Replication ServiceReplication is a service that transfers data, objects, or events among application servers. Data Replication Service (DRS) is the internal WebSphere Application Server component that replicates data. It uses the agent framework that in turn uses data stacks.
Use data replication to make data for session manager, dynamic cache, and stateful session beans available across many application servers in a cluster.
You can define the number of replicas that DRS creates on remote application servers. A replica is a copy of the data that copies from one application server to another. The number of replicas that you configure affects the performance of
BulletinBoard High Availability
Groups
AgentFramework
PartitionedManaged
Group
Data Stacks
Core Stack
UCF based WLM,Routing info, ODC
HAGroup Users: ME,Transaction Manager,
JCA Adapters, etc.DRS
Core GroupBridge Service
Chapter 2. High availability manager 17

your configuration. Smaller numbers of replicas result in better performance because the data does not have to copy many times. When you create more replicas, you have more redundancy in your system. By configuring more replicas, your system becomes more tolerant to possible failures of application servers in the system because the data is backed up in several locations.
HTTP session replicationSession manager uses the DRS when configured for memory-to-memory replication. When memory-to-memory replication is configured, session manager maintains data about sessions across multiple application servers, preventing the loss of session data if a single application server fails. Sessions are replicated according to the configuration of the associated replication domain.
DynacacheDynamic cache uses DRS to further improve performance by copying cache information across application servers in the cluster, preventing the need to repeatedly perform the same tasks and queries in different application servers.
Stateful session bean failoverStateful session beans use the replication service so that applications using stateful session beans are not limited by unexpected server failures.
HA group usersUsers of the HA group service such as the messaging engine, transaction manager (transaction log recovery), JCA adapters, and so on can be configured by using a core group policy. Most familiar is the One-of-N policy, the high availability feature for singleton services.
Refer to “HA group management” on page 37 for more information about how HA manager takes care of ensuring the policy.
Messaging engineThe default messaging provider from WebSphere V6 makes use of HA groups to provide high availability and relies on Workload Management (WLM) for messaging engines running in clusters to another member via the singleton service. The messaging engine relies absolutely on WLM for discovery and routing. Also the messaging engine's use of WLM is not just for engines running in WebSphere Application Server clusters. The messaging engines use WLM for discovery of othermessaging engines in the bus, discovery of destination locations, and information about how to route to destinations.
For more information, consult the Redbook WebSphere Application Server Network Deployment V6: High Availability Solutions, SG24-6688.
18 Techniques for Managing Large WebSphere Installations

Transaction log recoveryTransaction log recovery as provided through the HA manager enables WebSphere Application Server to recover in-doubt transactions in a cluster. This means even when an application server fails in the middle of a transaction, another member of the cluster can pick up that transaction and commit it properly. No external HA software is necessary, and no server restart for pending locks of in-flight transactions and fast recovery i necessary.
For more information consult the online article, “Automate peer recovery for transactions and messages in WebSphere Application Server V6.0.x,” at:
http://www.ibm.com/developerworks/websphere/techjournal/0509_lee/0509_lee.html
and see section 6.7 of the Redbook WebSphere Application Server Network Deployment V6: High Availability Solutions, SG24-6688.
Bulletin board usersServices based on bulletin board include WLM and on demand configuration (ODC). Additionally the bulletin board is in use by CGBS, to transmit routing data over a core group bridge.
The following are some of the features in WebSphere Application Server Network Deployment that make use of these services.
HTTP through the WebSphere proxy serverA proxy server is a specific type of application server that routes HTTP requests to application servers that host applications. The proxy server is the initial point of entry for requests into the enterprise. The proxy server can be configured with rules to route to and load balance the clusters of application servers.
At runtime, the ODC is used to provide the correct routing information to the proxy server, and WLM is used to manage the work load over multiple application servers.
SIP Workload ManagementThe Session Initiation Protocol (SIP) servlet container can employ a SIP proxy server to route, load balance, and improve response times between SIP requests and back-end SIP container resources. A SIP container is a Web application server component that invokes the SIP action servlet and interacts with the action servlet to process SIP requests.
At runtime, ODC is used to provide the correct routing information to the proxy server, and WLM is used to manage the workload over multiple SIP containers.
Chapter 2. High availability manager 19

EJB Workload ManagementWhenever an EJB™ is deployed to a cluster and does not have only co-located clients that reside in the same cluster members, WLM is used to locate EJBs.
Default messagingWorkload Management is required when multiple messaging engines are present in a cluster.
2.1.3 Other users of services in stack products
Following is a listing of HA manager usages in stack products.
WebSphere Process Server� Highly available inbound JCA resource adapter provides the infrastructure for
reliable arrival time-based sequential processing of inbound messages in a WebSphere Process Server cluster.
� Event sequencing component provides a similar capability for all relevant Service Component Architecture (SCA) components in a WebSphere Process Server cluster.
Both capabilities are based on the singleton service of the HA manager to provide guaranteed sequential processing.
WebSphere Extended Deployment� On demand configuration (also present in WebSphere Application Server
Network Deployment)
� Partitioning facility
� Object grid
20 Techniques for Managing Large WebSphere Installations

Chapter 3. Core groups
A cell can be divided into multiple high availability domains known as core groups. A core group is the administrative domain of the HA manager. To achieve short failover time, the number of processes that participate in a common fabric of group communications system for virtually synchronous messaging is limited. Or, in other words, core groups limit the number of processes that talk to each other synchronously as a group.
The following topics are covered in this chapter:
� 3.1, “Core group formation rules” on page 22� 3.2, “Core group communication” on page 23� 3.3, “HA coordinator” on page 35� 3.4, “Disabling the HA manager” on page 42
3
Attention: Do not confuse core groups with HA groups. The latter are transient, runtime constructs that act for a specific component based on a given policy. Core groups, however, are persistent in a configuration file and can be changed at runtime.
© Copyright IBM Corp. 2008. All rights reserved. 21

3.1 Core group formation rules
A core group must comply with several rules - the formation rules.
To blend former administrative and organizational concepts of WebSphere Application Server into the newly adopted group communication design, some stricter formation rules had to be put in place than those the underlying distribution and consistency services (DCS) design implies.
� A core group can contain zero or more WebSphere Application Server processes (JVMs).
� A core group containing enabled members must contain at least one administrative process (Deployment Manager or node agent). This is currently required to support dynamic configuration changes. These changes are supported only by processes that manage configuration files, and therefore contain event listeners for such changes concerning the HA manager.
� A WebSphere process (JVM) must belong to one and only one core group.
� A core group cannot span cells. All the members of a core group must belong to the same cell.
– A cell can contain more than one core group.
� A cluster cannot span core groups.
– All of the cluster members must belong to the same core group.
– A core group can contain more than one cluster.
Note: Future product releases may no longer have this restriction.
22 Techniques for Managing Large WebSphere Installations
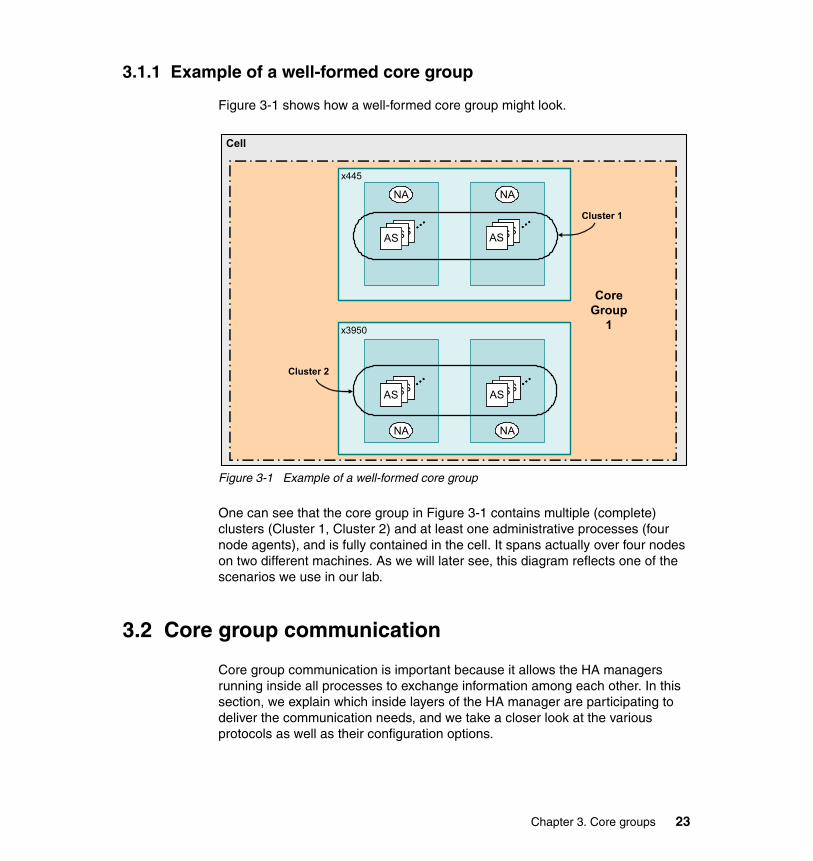
3.1.1 Example of a well-formed core group
Figure 3-1 shows how a well-formed core group might look.
Figure 3-1 Example of a well-formed core group
One can see that the core group in Figure 3-1 contains multiple (complete) clusters (Cluster 1, Cluster 2) and at least one administrative processes (four node agents), and is fully contained in the cell. It spans actually over four nodes on two different machines. As we will later see, this diagram reflects one of the scenarios we use in our lab.
3.2 Core group communication
Core group communication is important because it allows the HA managers running inside all processes to exchange information among each other. In this section, we explain which inside layers of the HA manager are participating to deliver the communication needs, and we take a closer look at the various protocols as well as their configuration options.
x445
x3950
NANANANA
NANANANA
Cluster 2
Cluster 1
Cell
Core Group
1
ASASAS…ASASASASASAS… ASASAS
…ASASASASASAS…
ASASAS…ASASASASASAS… ASASAS
…ASASASASASAS…
Chapter 3. Core groups 23

3.2.1 HA manager layers
The main functionality of the HA manager is delivered through a layered stack of components (see Figure 3-2). Even though the top layer component is equally named HAM, the stack as a whole is commonly referred to as the HA manager.
Figure 3-2 HA manager: layered stack of components
The layered stack pictured in Figure 3-2 includes the following components:
� HA manager (HAM)
� Distribution and Consistency Services (DCS)
� Reliable Multicast Messaging (RMM)
HA managerThis layer provides the abstractions that are directly used by other WebSphere services. These abstractions are generally based on a set of fine-grained group services that provide intra-group communications and group policies.
Distribution and consistency servicesThe DCS layer provides coarse-grained group services including reliable one-to-many messaging capabilities between processes.
RMM
DCS
HAM
Virtual Synchrony
24 Techniques for Managing Large WebSphere Installations

Reliable Multicast MessagingThe RMM layer provides transport layer network functionality, including a multicast messaging abstraction over TCP connections.
Virtual synchronyVirtual synchrony means that either all members or no members of a group receive a message (similar to the concept of two-phase commit for transactions, either all or nothing). From the viewpoint of the HA manager, DCS and RMM together can be abstracted as the virtual synchronous messaging infrastructure.
Virtual synchrony also allows all processes within the same core group to reach distributed consensus, enabling the HA manger to implement highly available policies. For example, the 1 of N policy enables the implementation of the singleton service. A singleton service is a service that runs only in one process. If the process where it runs fails, the service is automatically relocated to another process. Virtual synchrony and 1 of N policy guarantee that the service is only active in one process. Many WebSphere components that make use of high availability groups (see 2.1.1, “HA manager components” on page 15) also use the singleton service to support failover. For example, the transaction manager uses it to complete in-doubt transactions on a different server during failover.
Underlying conceptsThe solution implemented in WebSphere Application Server is based on group communications system (GCS) technology. For more information, consult the Web site of Professor Kenneth B. Birman at the following URL:
http://www.cs.cornell.edu/ken/book/
Refer to Reliable Distributed Systems: Technologies, Web Services, and Applications by Kenneth B. Birman. The referenced material provides more definitions and concepts of group communications, Reliable Group Messaging, view synchrony, and more.
Note: In WebSphere Application Server, the default transport type for the HA manager is channel framework. See “Channel framework” on page 33.
Chapter 3. Core groups 25

3.2.2 HA manager protocols
Three different protocols are used in an HA domain to ensure proper functioning of the core group. The protocols can be classified into two categories, which are:
� Membership protocols
– Discovery protocol: Tries to detect newly running JVMs in the same core group. Keeps trying if a JVM stays down. See “Discovery protocol” on page 27.
– Failure detection protocol: Detects whether a once-detected JVM stays alive. See “Failure detection protocol” on page 29.
� Messaging protocol
– View synchrony protocol: Maintains virtual synchrony in the core group. See “View synchrony protocol” on page 31.
Connectivity among core group membersAll HA manager protocols connect to each other over the distribution and consistency services assigned ports on each JVM. With the growth of the number of JVMs in the core group, the required number of connections grows geometrically. The number of ports needed can be determined using the following formula:
# Sockets = n + (n x (n-1)) / 2 = (n x (n+1))/2
26 Techniques for Managing Large WebSphere Installations

That is, every process has its server socket (DCS port), and for each point-to-point connection, an additional socket is used on the client side. For a depiction of this, see Figure 3-3.
Figure 3-3 Sockets used by DCS protocols in a view
For example, in a core group with 50 members, the number of ports used by the protocols needed by the HA manager calculates to be 1275 ((50 x 51)/2). This is manageable; however, imagine a core group size of 250. It would end up with 31,375 ports being in use.
Discovery protocolWhen a core group member starts, no connections to other core group members exist. The task that runs the discovery protocol for this core group member starts as part of the core group members startup procedure. The discovery protocol establishes network connectivity with the other members of the core group. This
Note: The number of ports will span all the participating machines.
Attention: When running a large number of JVMs on a single box, the operating system might require tuning to prevent running out of ephemeral ports. Consult your operating system documentation for details.
Server Port
Client PortJVM 3
JVM 1
JVM 2 JVM 4
Chapter 3. Core groups 27

task runs at regularly scheduled intervals as long as the core group member is active.
The discovery protocol retrieves the list of core group members and the associated network information from the WebSphere Application Server configuration settings. The discovery protocol then attempts to open network connections to all of the other core group members. At periodic intervals, the discovery protocol recalculates the set of unconnected members and attempts to open connections to those members.
A JVM starting in a core group goes through the following stages before joining the group:
1. Not connected
The JVM has not established network connectivity with other group members. It sends a single announcement message if the multicast transport mode is used. Or it attempts to open a connection to each member of the group if unicast is used. The connections used between every two processes are always bidirectional rather than having two unidirectional connections.
2. Connected
The JVM has already opened a stream to all current members of the installed view. The coordinator considers this JVM as a candidate to join the view. A view is the set of online JVMs ready for running in a HA domain.
3. In a view
The JVM is a full participant in a core group at this stage. The view is updated and installed in all members.
NotificationsWhen a connection is made to another core group member, the discovery protocol notifies the view synchrony protocol and logs this event as an informational message in the SystemOut.log file.
MessagesImportant messages originating from the discovery protocol that are printed in the SystemOut.log file are:
� DCSV1032I: Connected a defined member.
� DCSV8104W: Removed a defined member.
28 Techniques for Managing Large WebSphere Installations

ConfigurationExactly one custom property affects the behavior of the discovery protocol:
� IBM_CS_UNICAST_DISCOVERY_INTERVAL: Defines the interval in seconds at which a discovery attempt is made (default value: 60s). This value most likely will never have to be tuned.
Optimizations in placeOne optimization for the discovery protocol is in place. When Server A discovers Server B first, the HA manager helps Server B discover Server A without having to issue connection attempts.
Failure detection protocolWhen a core group member starts, a task running the failure detection protocol also starts. This task runs as long as the member is active. The failure detection protocol monitors the core group network connections that the discovery protocol establishes.
The failure detection protocol uses two distinct mechanisms to determine the health of core group members:
� It looks for connections that are closed because the underlying socket was closed (typically machine or process failures are detected that way).
� It listens for active heartbeats from the connected members (typically network devices such as switch, cables, and routers; failures are detected by missing heartbeats).
Sockets closingWhen a core group member normally stops in response to an administration command, the core group transport for that member also stops, and the socket that is associated with the transport closes. If a core group member terminates abnormally, the underlying operating system normally closes the sockets that the process opened, and the socket associated with the core group transport is closed.
For either type of termination, core group members that have an open connection to the terminated member are notified that the connection is no longer usable. The core group member that receives the socket closed notification considers the terminated member a failed member.
The closed socket mechanism is the way that failed members are typically discovered. TCP settings in the underlying operating system, such as FIN_WAIT, affect how quickly socket closing events are received.
Chapter 3. Core groups 29

Active heartbeatThe active heartbeat mechanism is analogous to the TCP KeepAlive function. At regularly scheduled intervals, each core group member sends a ping packet on every open core group connection. If the packet is acknowledged, all is assumed to be all right. If no response is received from a given member for a certain number of consecutive pings, the member is marked as failed. Active heartbeats are most useful for detecting core group members that are unreachable because the network is stopped.
NotificationsWhen the failure detection protocol detects a failed network connection, it reports the failure to the view synchrony protocol and the discovery protocol. The view synchrony protocol adjusts the view to exclude the failed member. The discovery protocol attempts to reestablish a network connection with the failed member.
MessagesWhen a failed member is detected because of the socket-closing mechanism, one or more of the following messages are logged in the SystemOut.log file for the surviving members:
� For WebSphere Application Server V6.0.2:
– DCSV1113W: Socket closed on outgoing connection to the other member.
– DCSV1111W: Socket closed on outgoing connection from the other member.
� For WebSphere Application Server V6.1:
– DCSV1115W: Socket closed.
When a member is marked as failed because of missing heartbeats, the following message is logged:
� DCSV1112W: Member marked down due to a heartbeat timeout.
ConfigurationActive heartbeats consume CPU usage. The amount of CPU usage consumed is proportional to the number of active members in the core group. The default configuration for active heartbeats is a balance of CPU usage and timely failed member detection. Two custom properties affect the behavior of the failure detection protocol:
� IBM_CS_FD_PERIOD_SECS: Defines the interval in seconds at which heartbeats are sent out (default value: 30s).
� IBM_CS_FD_CONSECUTIVE_MISSED: Defines the number of missed heartbeats until a fellow member is marked down (default value: 6).
30 Techniques for Managing Large WebSphere Installations

Depending on the needs and observations for a specific installation, these values might have to be changed. Refer to 7.2.1, “Tuning the HA manager protocols” on page 107 for more information.
Optimizations in placeHeartbeats can conceptually be piggybacked on regular messages. Therefore in a busy system (with at least data replication or bulletin board traffic), a heartbeat-only message is hardly ever transmitted. If all these services are not used, only heartbeat traffic is seen.
View synchrony protocolThe view synchrony protocol is established over the set of core group members that can communicate with each other. This protocol provides guaranteed, in-order message delivery for message streams that involve one sender and potentially multiple receivers. This guarantee is similar to the guarantees that TCP/IP provides for point-to-point message streams.
The set of core group members for which the view synchrony protocol is established is commonly referred to as a view. Views are unique in time and space. The act of adding or removing members from the view is called a view change. A view change is an important and relatively expensive synchronization point. It is also the point where synchronization, consistency, and network issues are detected.
The view synchrony protocol is transparent to components using both the high availability manager framework and WebSphere Application Server administrators. However, disruptions in the view synchrony protocol might become visible, most notably when a boundary condition known as a view change occurs.
View changesWhen a core group member starts, the core group transport and the associated discovery protocol, failure detection protocol, and view synchrony protocol also start. The view synchrony protocol establishes an initial view that contains only the local member. The view synchrony protocol is notified when the discovery protocol establishes connections with other core group members. The view synchrony layers of the newly connected members then exchange state information. This information is used to determine if a new view can be formed. For example, if a newly started member discovers an existing view, it negotiates with the members of the existing view to establish a new view.
Before a new view is established, activities that are related to the current view must be completed. All messages that are sent in the current view must be received and acknowledged by all intended recipients that are still alive. The
Chapter 3. Core groups 31

current members must exchange a nontrivial amount of state information regarding messages sent and received. These members then perform the activities required to complete the pending message activity, which might include the retransmission of messages that seem to be lost.
Installing a new view might result in significant, temporary spikes in the amount of CPU consumed and the network bandwidth used.
MessagesImportant messages printed in the SystemOut.log file are:
� DCSV8054I: Indicates when a view change in progress.
� HMGR0218I/DCSV8050I: When a new view is installed, this message also prints the name of the view and details about the number of members.
� DCSV1033I: Provides confirmation that all new members are in the new view.
� DCSV2004I: Indicates when all messages in the current view are completed and acknowledged.
� DCSV8050I: Provides extended status information about connected, total, and bad members in the view.
ConfigurationThere are no specific custom properties to configure the view synchrony protocol. However, the size of the core group most directly influences how much the view synchrony protocol can hurt the system (the reason is the geometrical growth of effort needed with an increasing number of members).
Optimizations in placeNo special optimizations are in place.
3.2.3 Transport type
A transport type is the type of network communication a core group uses to communicate to its members. The following types of transports are available:
� Channel framework (default)
� Unicast
� Multicast
No matter which transport type is used, the underlying TCP/IP connectivity shown in “Connectivity among core group members” on page 26 stays the same. So all JVMs are connected to each other to establish point-to-point messaging.
32 Techniques for Managing Large WebSphere Installations

Channel frameworkThe channel framework transport is the most flexible and scalable of the transport options and is the best option for most topologies. Due to the advanced features of the channel framework transport, this option comes at the cost of slightly lower performance.
UnicastThe communication mechanism of the unicast transport is similar to that of the channel framework transport. The major difference is that a standard network connection is established. This signifies that no advanced features such as security options or transport chains can be used. The gain is slightly better performance than provided by the channel framework. However, this performance gain is achieved at the cost of using additional ephemeral ports.
MulticastMulticast is a high-performance protocol, and the HA manager is designed to perform best in multicast mode. It is best suited when a lot of members of the core group need to share the same information.
SummaryMultiple reasons speak for the channel framework to be the right choice for the core group transport. We stayed with the channel framework throughout all our lab work.
For more detailed information about the transport options, consult the WebSphere Application Server, V6.1 Information Center at:
http://publib.boulder.ibm.com/infocenter/wasinfo/v6r1/index.jsp
3.2.4 HA manager resource consumption
Resources consumed by the HA manager include CPU cycles, memory (static and dynamic), and network bandwidth. Basically these resources are used by the three protocols described in 3.2.2, “HA manager protocols” on page 26. Over time, depending on the overall state of a core group, the usage distribution varies. Conceptually let us have a look at the consumption behavior of each of these protocols.
Tip: It is fair to say that the HA manager protocols themselves do not consume a large amount of resources, definitely not over time. However, depending on the services being enabled on top of the HA manager, the consumption has to be carefully monitored and managed.
Chapter 3. Core groups 33
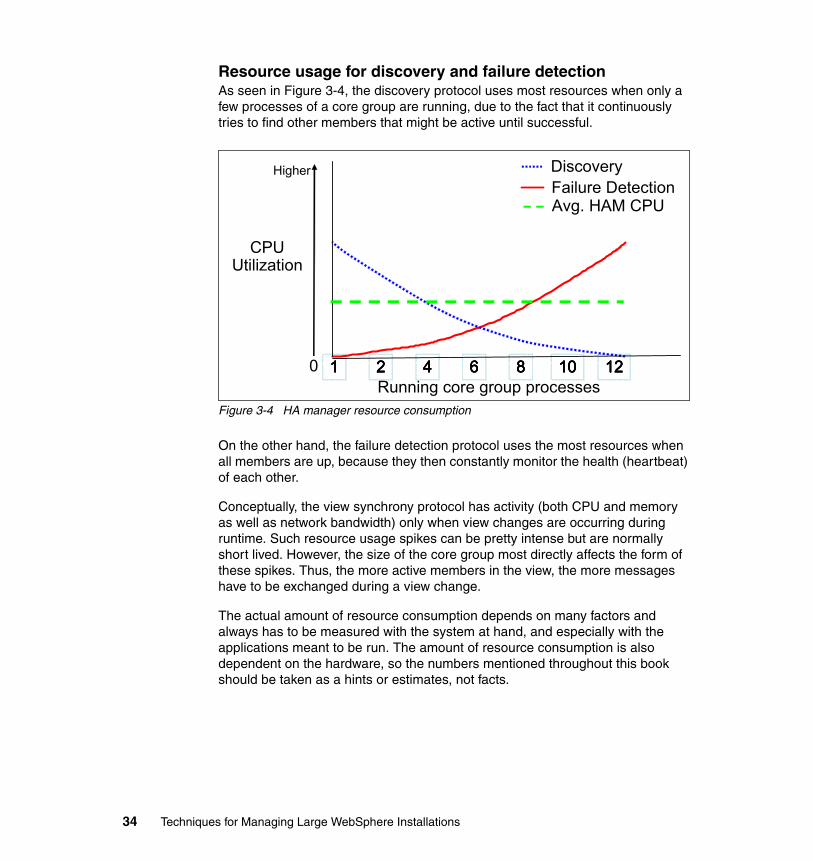
Resource usage for discovery and failure detectionAs seen in Figure 3-4, the discovery protocol uses most resources when only a few processes of a core group are running, due to the fact that it continuously tries to find other members that might be active until successful.
Figure 3-4 HA manager resource consumption
On the other hand, the failure detection protocol uses the most resources when all members are up, because they then constantly monitor the health (heartbeat) of each other.
Conceptually, the view synchrony protocol has activity (both CPU and memory as well as network bandwidth) only when view changes are occurring during runtime. Such resource usage spikes can be pretty intense but are normally short lived. However, the size of the core group most directly affects the form of these spikes. Thus, the more active members in the view, the more messages have to be exchanged during a view change.
The actual amount of resource consumption depends on many factors and always has to be measured with the system at hand, and especially with the applications meant to be run. The amount of resource consumption is also dependent on the hardware, so the numbers mentioned throughout this book should be taken as a hints or estimates, not facts.
1 2 4 6 8 10 121 2 4 6 8 10 12
DiscoveryFailure DetectionAvg. HAM CPU
Running core group processes
CPUUtilization
1 2 4 6 8 10 121 2 4 6 8 10 120
Higher
34 Techniques for Managing Large WebSphere Installations

Estimates for core groups with recommended size� CPU usage should be minimal with a proper setup; spikes occur for view
changes. Idle per process CPU is typically < 1%.
� Memory footprint depends on the configured transmit buffer size. Refer to “Tuning the HA manager memory buffers” on page 111 for more detail about the memory buffers.
� Network bandwidth will be visible during view changes; however, the amount of traffic should not be a limiting factor on a system with gigabit Ethernet - at least not from the HA manager protocols themselves. Network bandwidth really depends on the applications running on top of the infrastructure.
3.3 HA coordinator
Within a core group, HA manager instances are elected to coordinate high availability activities. An instance that is elected is known as a core group coordinator. The coordinator is highly available, such that if a process serving as a coordinator stops or fails, another instance is elected to assume the coordinator role, without loss of continuity.
3.3.1 Main coordinator activities
A running core group with multiple members must contain at least one active coordinator. It is responsible for
� View change: Keeping track of the states of core group members as they start, stop, or fail and communicating that information to every member.
� HA group management: Maintaining all HA group information, including the group names, group members, and group policies.
� Assigning service execution: Assigning service execution to group members and handling failover of services based on core group policies.
Let us have a detailed look at these three activities of an active coordinator.
View changeProbably the most important activity of the coordinator is to handle a view change. Such a view change is a multiple step process, comprised of the following:
1. Coordinator notifies all members to report their individual state.
2. All members send their state to the active coordinator.
Chapter 3. Core groups 35

3. Coordinator consolidates individual states into global state.
4. Coordinator sends out completed view to all members.
See Figure 3-5 for the steps involved during the view change.
Figure 3-5 Managing view change
Every time a JVM joins or leaves the view, such a view change process takes place.
JVM1
JVM3 JVM2
1 1
2
4
ActiveCoordinator
View
2
3
36 Techniques for Managing Large WebSphere Installations

HA group managementThe second important activity of the coordinator is HA group management.
In short, HA groups are runtime constructs derived from the core group policies being defined. So let us see with an example how the coordinator works with HA groups.
By default, every core group has two policies defined; both have cluster-scope. On one hand, the Clustered TM Policy, which handles the activation of the transaction manager instance being active. Second, the Clustered ME Policy takes care of running a messaging engine instance in a cluster. All messaging
Note: High availability groups are part of the high availability manager framework. A high availability group provides the mechanism for building a highly available component and enables the component to run in one of several different processes. A high availability group cannot extend beyond the boundaries of a core group.
For detailed information about high availability groups and core group policies, refer to the Redbooks WebSphere Application Server Network Deployment V6: High Availability Solutions, SG24-6688, and WebSphere Application Server V6 Scalability and Performance Handbook, SG24-6392, as well as to the WebSphere Application Server, V6.1 Information Center at
http://publib.boulder.ibm.com/infocenter/wasinfo/v6r1/index.jsp
Chapter 3. Core groups 37

engines, whether or not in a cluster, use a policy. The following illustration (Figure 3-6) shows how the coordinator manages HA groups.
Figure 3-6 Coordinator and HA groups
Basically the coordinator keeps track of all the HA groups and holds state for each of them, monitoring to ensure that instances are run according to the underlying policy.
Assigning service executionLast but not least, the coordinator actually handles activation (and optionally failback) of policy-controlled components. It does that by detecting when an instance is no longer available. Once such a state is detected, the coordinator starts another instance in one of the available processes, by sending it an activation event.
Tip: This being said, the number of HA groups affects the number of coordinators required. With hundreds of groups, one can imagine the workload on a single process might be too much.
Cluster 1
Core Group CG1
Clustered TM Policy 1
Clustered ME Policy 1
JVMActive
Coordinator
JVMJVMActive
Coordinator
Cluster 2
Clustered TM Policy 2
Clustered ME Policy 2
ServerA ServerB ServerC ServerD
38 Techniques for Managing Large WebSphere Installations
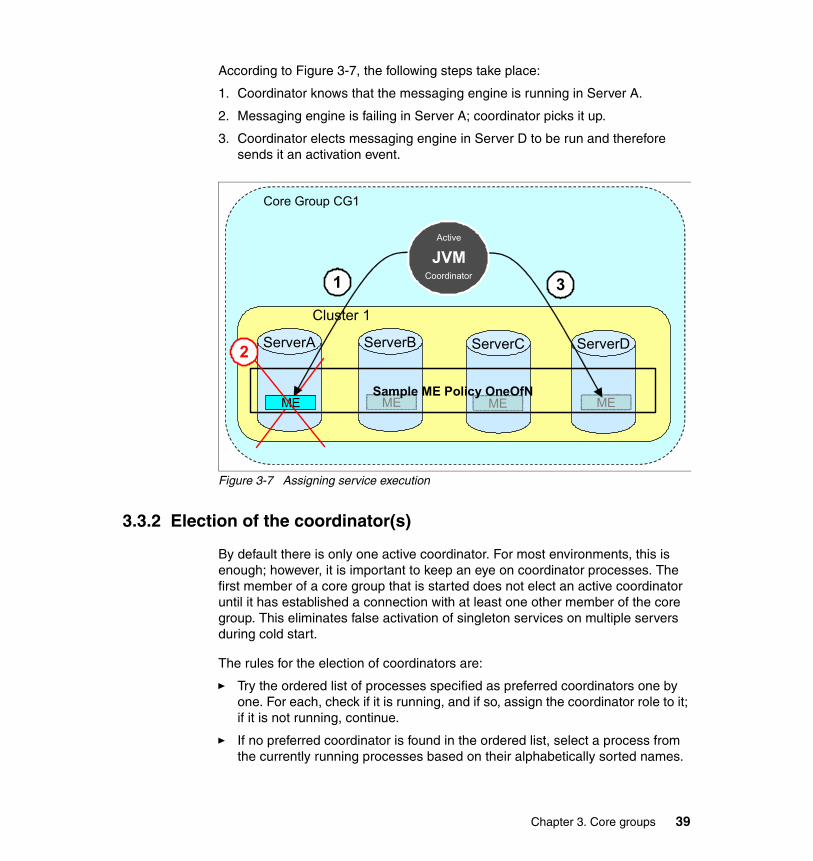
According to Figure 3-7, the following steps take place:
1. Coordinator knows that the messaging engine is running in Server A.
2. Messaging engine is failing in Server A; coordinator picks it up.
3. Coordinator elects messaging engine in Server D to be run and therefore sends it an activation event.
Figure 3-7 Assigning service execution
3.3.2 Election of the coordinator(s)
By default there is only one active coordinator. For most environments, this is enough; however, it is important to keep an eye on coordinator processes. The first member of a core group that is started does not elect an active coordinator until it has established a connection with at least one other member of the core group. This eliminates false activation of singleton services on multiple servers during cold start.
The rules for the election of coordinators are:
� Try the ordered list of processes specified as preferred coordinators one by one. For each, check if it is running, and if so, assign the coordinator role to it; if it is not running, continue.
� If no preferred coordinator is found in the ordered list, select a process from the currently running processes based on their alphabetically sorted names.
Cluster 1
Core Group CG1
ME MESample ME Policy OneOfN
JVMActive
Coordinator
JVMJVMActive
Coordinator
ME ME
1
2
3
ServerDServerCServerBServerA
Chapter 3. Core groups 39

These rules lead to the conclusion that having only one active coordinator does not introduce a single point of failure because the coordinator role can be placed on any process.
Important messagesTo identify which process is currently an active coordinator, the following messages can be searched for:
� HMGR0206I: The process is an active coordinator.
� HMGR0228I: The process is not an active coordinator.
� HMGR0207I: The process was an active coordinator but is not anymore.
3.3.3 Preferred coordinators
By default, the HA manager selects a core group process to be the coordinator based on its alphabetically sorted name. This is practical for setting up any out-of-the-box installation but is impractical in production environments, especially in large environments. Because a change of active coordinator can imply sudden bursts of high-traffic volume, it implies that special care has to be taken when operating the coordinator servers. It also means that no core group should have the chance to turn to an arbitrary process for coordination, because this might hurt the production throughput and performance. It could even throw such a system off balance.
Therefore recognized best practices for the selection of preferred coordinators are:
� Create dedicated standalone application servers as candidates (at least two per core group for high availability to be exact).
� Expand the heap size of these processes to a high value such as 1024 MB. (To shape the server, turn on verbose garbage collection to determine the real size needed during operation.)
� Make the application servers reside on at least two different nodes, best on at least two different machines.
Tip: Remember that coordinator election occurs whenever the view changes. Electing a new coordinator uses a lot of resources because this process causes increased network traffic and CPU consumption. Specifying a preferred coordinator server, whenever practical, helps eliminate the need to make frequent coordinator changes.
40 Techniques for Managing Large WebSphere Installations
� Use machines for the coordinators that are not under constant heavy workload; even better, plan extra capacity and enable quick reaction when needed.
� Set up the servers in the list of ordered preferred coordinator servers for the core group.
� Leave these processes running whenever possible.
� Never take down all these servers at the same time.
We will later see that the coordinator processes can be used as bridge interfaces also, therefore gaining back some of the extra investment of creating dedicated application servers.
If more than one coordinator is configured to be active at the same time, be sure to define a spare coordinator for cases when one of the servers has to be stopped. Otherwise, the process with the lowest name (sorted alphabetically) in the core group is selected to fill the gap.
With multiple coordinators, the HA manager global state is simply distributed among all active coordinators. GCS provides a splitter pattern to support this scenario, based on the concept of virtual synchrony with FIFO ordering, which keeps the state consistent.
3.3.4 How many coordinators are required?
In practice, you typically run into the maximum recommended number of core group members before the need for multiple coordinators becomes evident. However, when encountering the following scenarios, you might think about configuring more than one active coordinator:
� Heavy heap usage found in the verbose garbage collection log of the JVM acting as the active coordinator.
� High CPU usage by the active coordinator process, not only when a newly elected coordinator becomes active.
3.3.5 Coordinator failure
When a JVM process with the active coordinator is no longer active (because it is stopped or crashes), the HA manager elects the first inactive server in the preferred coordinator servers list. If none is available, it simply elects the server with the lowest name (sorted alphabetically). If fewer JVMs are running than the number of coordinators in the core group settings, all running JVMs are used as coordinators.
Chapter 3. Core groups 41

The newly elected coordinator initiates a state rebuild, sending a message to all JVMs in the core group to report their states. This is the most processor-intensive operation of a coordinator.
3.4 Disabling the HA manager
At some points in time, it might seem promising to simply turn off the HA manager to gain performance. However, as more internal WebSphere components rely on the HA manager and its services, it is increasingly unlikely that you will have to build an environment where HA manager is not needed and not desired. Rather than disabling the HA manager itself, you should think about enabling and disabling the various services on top of it. One example is on demand configuration (ODC). If no proxy server is installed in a WebSphere Application Server Network Deployment installation, you might as well turn that one off. See Chapter 4, “Core group bridging” on page 45 for more information on the recommended configurations for the various services.
However, if you prefer to disable HA manager, we recommend creating a special core group (for example, cg_noHAM). Move all the servers you want to disable HA manager on to that core group. Do not worry about the size of that core group because no activity will be occurring in this part. Also, no administrative process is needed in that core group. Under no circumstances, run with a mixed core group, containing HAM-enabled and HAM-disabled members. Restart the servers after disabling the HA manager (or enabling it).
Note that from WebSphere Application Server V6.1, the enabling and disabling of the HA manager for a server process can also be performed on the Integrated Solutions Console (ISC), but not in V6.0.
3.4.1 Effect of disabling the HA manager
When disabling the HA manager, it behaves identical to the highly optimized version that is present in WebSphere Application Server base and Express editions. The following holds true when disabling the HA manager:
� The HA manager classes do not support DCS or RMM; however, the classes are still present at runtime.
� No heartbeat checking on the DCS level.
� No cross process messages.
� No bulletin board traffic.
42 Techniques for Managing Large WebSphere Installations

� All resources associated with the HA manager or services on it are released.
� Log message after restart:
– HMGR0005I: The Single Server DCS Core Stack transport has been started for core group.
Chapter 3. Core groups 43

44 Techniques for Managing Large WebSphere Installations

Chapter 4. Core group bridging
The previous chapter showed that multiple core groups have to be defined, especially for large environments. Once they are defined, the question arises if applications in different core groups can share information, even over the boundaries of core groups. The answer is yes. This chapter explains when to define multiple core groups and provides more detail about how to do it. Furthermore, we introduce various bridging topologies and discuss the advantages and disadvantages of each.
In addition, we briefly introduce additional concepts and constraints that are needed once multiple cells have to share information.
� 4.1, “Introduction” on page 46� 4.2, “Intra-cell bridging” on page 46� 4.3, “Core group bridging topologies” on page 52� 4.4, “Inter-cell bridging” on page 56
4
© Copyright IBM Corp. 2008. All rights reserved. 45

4.1 Introduction
When the use of multiple core groups is considered for managing growth within large cells, the use of core group bridging must also be considered. Even though most HA manager services remain at the scope of clusters or core groups, information also must be shared across core group boundaries.
The primary reasons for having multiple core groups are reviewed here:
� Core groups do not scale to the same degree as cells.
� Large core groups affect performance heavily.
� Firewall exists inside the cell, between cell members (application servers, node agents, the Deployment Manager).
� Geographically separated cell members.
� To separate HA manager-enabled cell members from those cell members with HA managers turned off.
4.1.1 Core Group Bridge Service
The Core Group Bridge Service (CGBS) is the component that enables communication across core groups. It supports bridging core groups within the same cell, as well as bridging core groups in different cells.
Bulletin board traffic is the only type of information that the service can transfer. This implies that neither singleton services nor replication data can be shared over the bridge. However, both Workload Manager (WLM) and on demand configuration (ODC) are services that allow and need bridging.
4.2 Intra-cell bridging
For large environments, you definitely have to think about intra-cell bridging because you will most likely end up with more than one core group.
First we introduce the concepts used when forming intra-cell bridging (bridges that connect core groups of the same cell).
46 Techniques for Managing Large WebSphere Installations

4.2.1 When is bridging needed in a single cell?
In a single cell, the following scenarios require bridging to be set up:
� Application requests from a member of one core group to a member of another core group (see “Example 1” that follows)
� EJB request received by cluster members with node agents in different core groups (see “Example 2” on page 49)
� JMS client and target able to discover and connect if they are in different core groups
� Proxy server forwarding requests - that is, when the proxy server forwards requests from a member in one core group to a member in another group
� WebSphere Application Server V5 and V6 mixed cell - when the Deployment Manager is not in the same core group as V6 cluster members
� WebSphere Extended Deployment - always needed, if multiple core groups exist
If you are unsure, it is better to bridge core groups. Bridging core groups is preferred unless you can ensure that applications on different core groups do not depend on each other, and that the node agent and its application servers are configured to be in the same core group.
Tip: Bridging is generally needed as a rule of thumb. An exception is the siloed approach, where a strong isolation of different clusters is known and does not change.
Chapter 4. Core group bridging 47

Example 1A Web application in Core Group 1 is calling EJBs in Core Group 2 as shown in Figure 4-1. In this example, calling an EJB running in a cluster in a different core group makes bridging necessary.
Figure 4-1 Bridging: Web application calling EJB in different core group
x445
x3950
NANANANA
NANANANA
EJBCluster
Web AppCluster
CoreGroup
1
CoreGroup
2
Cell
ASASAS…ASASASASASAS… ASASAS
…ASASASASASAS…
ASASAS…ASASASASASAS… ASASAS
…ASASASASASAS…
48 Techniques for Managing Large WebSphere Installations
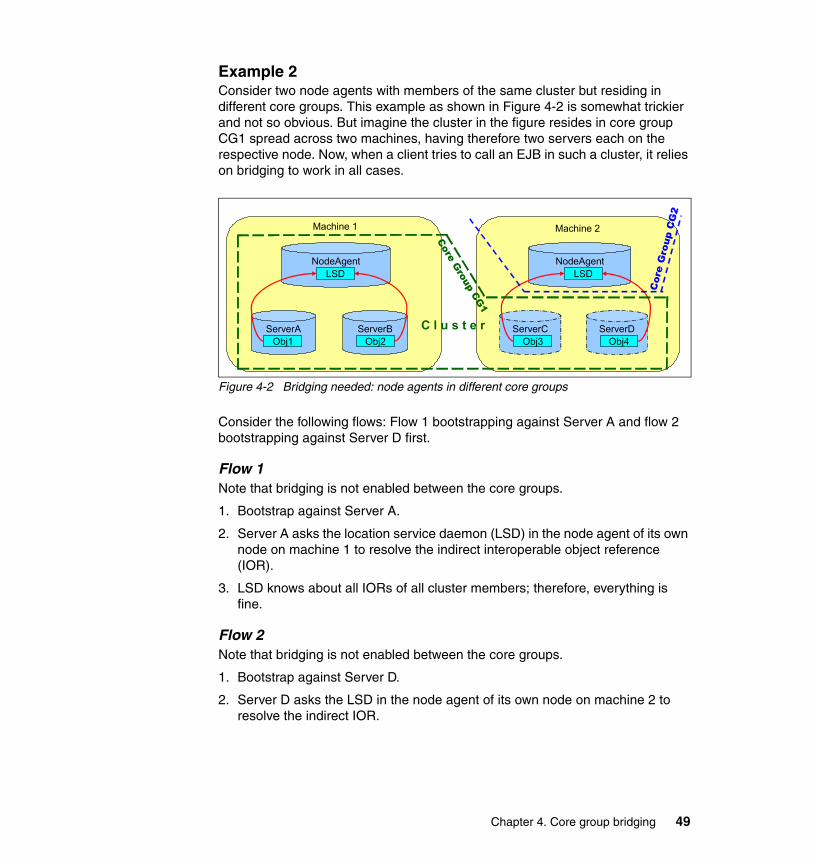
Example 2Consider two node agents with members of the same cluster but residing in different core groups. This example as shown in Figure 4-2 is somewhat trickier and not so obvious. But imagine the cluster in the figure resides in core group CG1 spread across two machines, having therefore two servers each on the respective node. Now, when a client tries to call an EJB in such a cluster, it relies on bridging to work in all cases.
Figure 4-2 Bridging needed: node agents in different core groups
Consider the following flows: Flow 1 bootstrapping against Server A and flow 2 bootstrapping against Server D first.
Flow 1Note that bridging is not enabled between the core groups.
1. Bootstrap against Server A.
2. Server A asks the location service daemon (LSD) in the node agent of its own node on machine 1 to resolve the indirect interoperable object reference (IOR).
3. LSD knows about all IORs of all cluster members; therefore, everything is fine.
Flow 2Note that bridging is not enabled between the core groups.
1. Bootstrap against Server D.
2. Server D asks the LSD in the node agent of its own node on machine 2 to resolve the indirect IOR.
ServerA ServerB
NodeAgent
ServerC ServerD
NodeAgent
Obj1
LSD
Obj2 Obj3 Obj4
LSD
Core Group CG
1
Cor
eG
roup
CG
2
Machine 1 Machine 2
C l u s t e r
Chapter 4. Core group bridging 49
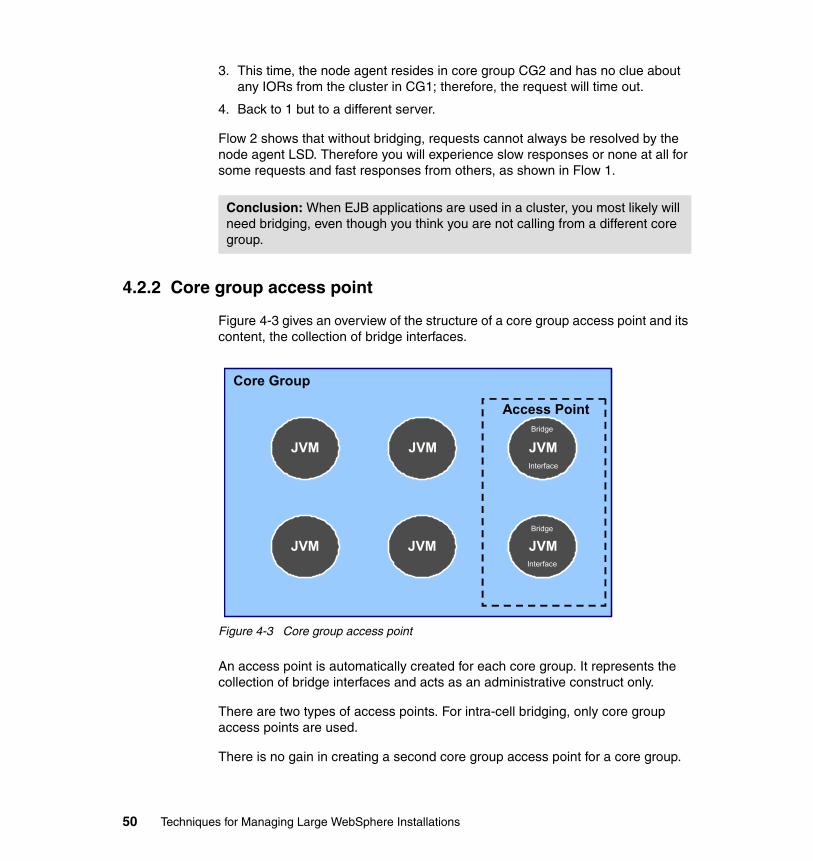
3. This time, the node agent resides in core group CG2 and has no clue about any IORs from the cluster in CG1; therefore, the request will time out.
4. Back to 1 but to a different server.
Flow 2 shows that without bridging, requests cannot always be resolved by the node agent LSD. Therefore you will experience slow responses or none at all for some requests and fast responses from others, as shown in Flow 1.
4.2.2 Core group access point
Figure 4-3 gives an overview of the structure of a core group access point and its content, the collection of bridge interfaces.
Figure 4-3 Core group access point
An access point is automatically created for each core group. It represents the collection of bridge interfaces and acts as an administrative construct only.
There are two types of access points. For intra-cell bridging, only core group access points are used.
There is no gain in creating a second core group access point for a core group.
Conclusion: When EJB applications are used in a cluster, you most likely will need bridging, even though you think you are not calling from a different core group.
Core Group
JVM
JVM
JVM
JVM
Access Point
JVMJVMBridge
Interface
JVMJVMBridge
Interface
50 Techniques for Managing Large WebSphere Installations

4.2.3 Bridge interface
By default, no bridge interfaces are defined; you have to appoint them. Thus, by default, bridging is not enabled when you create multiple core groups.
To be precise, the selection process also involves the selection of the transport chain on a server. The identified processes (called core group bridge servers) take over the workload induced by the bulletin board information to be passed to other core groups.
Contrary to the selection process for preferred coordinators, the selection of bridge interfaces is done strictly by configuration. So no failover of bridge interfaces to any other available processes in a core group occurs, once all defined interfaces are down. All the configured bridge interfaces share the workload among them.
The following best practices should be considered when selecting and handling bridge interfaces:
� Each access point should contain at least two bridge interfaces.
� Each bridge interface should be located on a different node, on a different machine.
� Size the selected bridge servers with plenty of resources. (Increase the maximum heap size; do not use fully loaded machines.)
� It is best to use two dedicated standalone processes (optionally, you can also select them as preferred coordinators).
� The transport channel chain for the selected bridge interface must match the transport channel chain configured for the core group (for example, DCS or DCS_SECURE).
Tip: If a core group never previously had any CGBS configuration, the following steps will activate it:
1. For the core group, configure the bridge interfaces; then save and synchronize your changes.
2. Start or restart the newly configured bridge servers.
3. Restart all preferred coordinators to make sure they pick up the changes (do make sure you have specified preferred coordinators).
Chapter 4. Core group bridging 51

4.2.4 Access point group
Figure 4-4 shows the structure of an access point group and its contained collection of access points.
Figure 4-4 Access point group with two core groups
An access point group is a collection of access points. It serves as the actual bridge by letting the involved bridge interfaces establish communication among themselves.
For possible configurations of access point groups, see our hands-on section in Chapter 11, “Large installation scenarios” on page 249.
4.3 Core group bridging topologies
Two basic types of topologies can be achieved with bridging. One is a mesh topology, and the other one is a chain topology. All other topologies are mere permutations of these basic two.
Core Group Access Point
Core GroupAccess Point
Access Point Group
JVM
JVM
JVM
JVM
JVM
JVM
JVM
JVMJVMBridge
Interface
JVMBridge
Interface
JVMBridge
Interface
JVMBridge
Interface
52 Techniques for Managing Large WebSphere Installations

4.3.1 Mesh topology
In the mesh topology, every core group is bridged directly with every other core group. On the other hand, the mesh topology has only one access point group, as Figure 4-5 illustrates.
Figure 4-5 Mesh topology
NANA
NANA
Core Group 2
Core Group 4
ASASAS
…
ASASAS
…ASASAS
…
ASASAS
…
ASASAS
…
ASASAS
…ASASAS
…
ASASAS
…
NANA
Core Group 1
ASASAS
…
ASASAS
…ASASAS
…
ASASAS
…
NANA
Core Group 3
ASASAS
…
ASASAS
…ASASAS
…
ASASAS
…
CGAP2 BIBI
CGAP4BI BI
APG1
CGAP1 BIBI
CGAP3BI BI
Chapter 4. Core group bridging 53

Advantages of mesh topologyThe following list describes the advantages of a mesh topology:
� Fast communication path: Because every core group can directly talk to every other core group, the exchange of data is the fastest possible, and the amount of deserialization is minimal.
� Fault tolerant: A failure between any two core groups does not affect communication overall; all information is still available.
Disadvantages of mesh topologyThe mesh topology has one disadvantage:
� Scalability: Because the number of direct communications grows geometrically with the number of core groups, this setup does not scale indefinitely.
4.3.2 Chain topology
A chain topology offers one path to a peer core group and relies solely on having multiple bridges in each core group for high availability of the chain.
Doubly linked chain topologyIn a doubly linked chain, each core group has two access point groups that it can use to communicate with a peer core group. If all of the bridges in one access point group are unavailable, a core group can use the other access point group to communicate with peer core groups. A doubly linked chain results in core groups receiving more redundant messages (which expends extra CPU and memory)
54 Techniques for Managing Large WebSphere Installations

when compared to a regular chain. For every message sent by a bridge, one message is sent to a core group unnecessarily (see Figure 4-6).
Figure 4-6 Doubly linked chain topology
Figure 4-6 shows the closed chain variant, meaning that Core Group 4 is connected back to Core Group 1 via the access point group APG41. An open chain variant of this scenario exists, but using it means one broken link would break whole sections apart, so we do not consider it here.
NANA
NANA
Core Group 2
Core Group 4
ASASAS
…
ASASAS
…ASASAS
…
ASASAS
…
ASASAS
…
ASASAS
…ASASAS
…
ASASAS
…
NANA
Core Group 1
ASASAS
…
ASASAS
…ASASAS
…
ASASAS
…
NANA
Core Group 3
ASASAS
…
ASASAS
…ASASAS
…
ASASAS
…
CGAP2 BIBICGAP1 BIBI
CGAP4BI BI CGAP3BI BI
APG12
APG34
APG23APG41
Chapter 4. Core group bridging 55

Advantages of doubly linked chain topologyThe doubly linked chain topology has one advantage:
� Scalability: In a chain, the communication grows, but the number of links grows linear to the number of core groups. Therefore the bridging does not prevent the cell to grow indefinitely. However, other practical limits may exist.
Disadvantages of doubly linked chain topologyThese are the disadvantages of the doubly linked chain topology:
� Potentially slow communication path: Since not every core group can directly talk to every other core group, the exchange of data can take several hops. The time required for data exchange and the number of CPU cycles for deserialization on each hop increases.
� N-2 fault tolerant: As long as less than two core group access points are failing, this topology is still able to route all information. However, the disconnected ends need the maximum number of hops to exchange information. As soon as two core group access points are down, the chain partitions, which can lead to unpredictable runtime behavior.
4.4 Inter-cell bridging
In general the concepts for inter-cell bridging follow similar rules to those for intra-cell bridging, but we point out subtle differences in the following sections.
4.4.1 When is bridging needed between cells?
In a multiple cell environment, the following scenarios require bridging:
� Proxy server forwarding requests to a foreign cell.
� JMS requests: Client forwards requests to a foreign cell.
� EJB backup cluster located in foreign cell.
� WebSphere Extended Deployment: On Demand Router sending requests to a foreign cell.
So the real difference is that the application requests of a foreign cell do not necessarily imply that inter-cell bridging must be used. However, intra-cell bridging still must be set up properly in the foreign cell.
56 Techniques for Managing Large WebSphere Installations

4.4.2 Inter-cell bridging topologies
The following rules apply when cells are to be bridged together:
� Cell names must be unique.
� The access point group used for the cross-cell bridge has to be named the same in each cell (conceptually, a single cross-cell access point group).
� A cross-cell access point group does contain multiple access points, one for each foreign cell for the cross-cell bridge (peer access point or proxy peer access point) and one for the local core group.
� Always configure intra-cell bridging first, then configure inter-cell bridging.
� We recommend using mesh topology for intra-cell bridging (see 4.3, “Core group bridging topologies” on page 52 for more information).
Chapter 4. Core group bridging 57

58 Techniques for Managing Large WebSphere Installations

Part 2 Planning and design
Part 2
© Copyright IBM Corp. 2008. All rights reserved. 59

60 Techniques for Managing Large WebSphere Installations

Chapter 5. Design considerations for large environments
This chapter discusses the design considerations for large WebSphere installations. The goal of this chapter is to understand aspects of WebSphere Application Server that relate to the size of the cell and be able to plan for cell growth.
In addition, different limiting criteria for cell size are explored and the considerations for each is documented.
The goal is to provide the most accurate information about WebSphere product behavior and scaling constraints so that you can develop plans for your large topology based on the functional and operational priorities most relevant to your organization.
In this chapter, the following topics are discussed:
� 5.1, “Defining large topologies” on page 62� 5.2, “Cell size limits” on page 62� 5.3, “WebSphere Application Server cell size design considerations” on
page 67� 5.4, “WebSphere Application Server scalability by component” on page 68
5
© Copyright IBM Corp. 2008. All rights reserved. 61

5.1 Defining large topologies
Numerous factors play a part in allowing or constraining the size of your WebSphere environment. The quantitative definition of the word “large” is likely to be different for each customer. No one number is the simple outer limit for WebSphere Application Server cell size.
WebSphere Application Server is a product composed of many components. Not all of these components have an impact on cell size. This chapter addresses considerations related to some of the components that determine how large a cell can be configured.
Through understanding how the application server components are designed and how they behave, it is possible to tune the WebSphere Application Server Network Deployment product so that large topologies containing hundreds of application servers can be created and supported. The WebSphere development labs, as well as many WebSphere customers, have gone through this process of tuning the configuration to support a large cell.
5.1.1 Typical larger topologies
See 1.1.1, “Typical large WebSphere Application Server topologies” on page 2 for a review of typical large WebSphere topologies.
5.2 Cell size limits
A cell is the boundary for administration, configuration, and control. The “size” of a cell can be measured by any of the following parameters:
� Maximum number of application server instances or JVMs in the cell
� Number of WebSphere Application Server nodes
� Maximum number of applications that can be deployed to a cell
� Largest number of workload balanced clusters of application servers
Each measurement can contribute to the limits of cell size and has relationships with, as well as, impacts on the others. The following subsections discuss the different measurement parameters for cell size and their limiting criteria.
62 Techniques for Managing Large WebSphere Installations

5.2.1 Cell structure review
A cell is a grouping of nodes in a single administrative domain. The configuration and application files for all nodes in the cell are centralized in a master configuration repository that is managed by the Deployment Manager and synchronized with local copies that are held on each of the nodes. Figure 5-1 reviews the cell structure.
Figure 5-1 Cell structure review
Node B
Node A(App Server)
CommandsConfiguration
Cell-wideconfigurationrepository
ServerA
ServerB
(App Server)
Server B cfg
Node A cfg
Cell cfg
Extract/update
Config Sync
Config Sync
ServerC
ServerD
Cell cfg
(App Server)
(App Server)Node Agent
Server A cfg
Deployment Mgr
Server D cfg
Node B cfg
Server C cfg
Node Agent
Chapter 5. Design considerations for large environments 63

5.2.2 Number of nodes per cell
In a distributed server configuration, a cell can consist of multiple nodes, which are all administered from a single point (the Deployment Manager), as shown in Figure 5-2. There are no designed limits to the number of nodes in a cell. However, there are practical limits.
Figure 5-2 Nodes per cell
The following factors must be considered when creating cells with a large number of nodes:
� Latency of interaction between the Deployment Manager and node agents.
� The time for configuration synchronization increases with the number of nodes.
� Event notification flows back to the Deployment Manager. Consider turning off event listeners.
5.2.3 Number of application servers per node
When creating multiple application servers on a node, ensure that the sum of all the application server heaps is lower than the available physical memory on the node (the general recommendation is a limit of not more than 75% of available memory on the server machine). The application server process itself requires some memory for execution. This overhead also must be taken into account while planning the memory requirements. If an application server gets swapped
Deployment Manager
Manager
Server
ServerServer
ServerServer
ServerServer
ServerServer
ServerServer
ServerServer
ServerServer
ServerServer
ServerServer
ServerServer
ServerServer
Server
ServerServer
ServerServer
Server
ServerServer
ServerServer
Server
Server
Server
Server
Server
ServerServer
ServerServer
ServerServer
ServerServer
ServerServer
ServerServerServerServer
ServerServerServerServer
ServerServerServerServer
ServerServerServerServer
ServerServer
ServerServer
ServerServer
ServerServer
ServerServerServerServer
ServerServerServerServer
ServerServerServerServer
ServerServerServerServer
ServerServerServerServer
ServerServerServerServer
ServerServerServerServer
ServerServer
ServerServer
ServerServer
Server
ServerServerServerServer
ServerServerServerServer
ServerServer
ServerServerServerServer
ServerServerServerServer
ServerServer
ServerServer
ServerServer
ServerServer
ServerServer
64 Techniques for Managing Large WebSphere Installations

out, add more memory to the server machine or remove the application server from the node. Figure 5-3 illustrates the number of application servers per node.
Figure 5-3 Application servers per node
App Server
OperatingSystem
App Server
App Server
App Server
App Server App Server
AvailablePhysicalMemory
onNode
Chapter 5. Design considerations for large environments 65

5.2.4 Number of applications per application server
Multiple applications can be deployed into a single application server so that the cost of application server runtime is amortized across multiple applications. Refer to Figure 5-4, which depicts applications per application server.
Figure 5-4 Applications per application server
When deploying multiple applications into an application server, we generally recommend you ensure that the aggregate of the applications’ memory footprints does not exceed 70% of the maximum heap size of the application server. The application’s memory footprint can be determined by the amount of memory the application requires to execute under peak load. We generally recommend tuning the application server heap settings to ensure that the total memory utilization of the application server is under 70% of the maximum heap settings.
For optimal performance tuning of application servers, collocate similar applications: for example, group all EJB applications into one JVM and all JMS applications into another JVM.
A disadvantage to collocating multiple applications in an application server is that a single malfunctioning application (for example, due to a memory leak) can affect the application server and all the applications deployed in it.
5.2.5 Number of core groups per cell
Core groups and the high availability manager (HAM) were introduced in WebSphere Application Server V6.0. A core group is a collection of
JVM & Process Overhead
Runtime Components
Application #1
Application #2
Application #3
Application #4
JVM & Process Overhead
Runtime Components
Application #3
JVM & Process Overhead
Runtime Components
Application #2
66 Techniques for Managing Large WebSphere Installations

processes/application server JVMs that have a common fabric of group communications system (GCS). We recommend partitioning a cell into multiple smaller core groups with no more than 50 JVMs per core group instead of having a single large core group. Core groups can be bridged for intra-cell and inter-cell communication. Current core group formation rules require having at least one administrative JVM (node agent or Deployment Manager) in each HA manager-enabled core group. This limits the number of core groups per cell to the number of nodes. A solution for creating additional core groups in the cell is to create “phantom” nodes to host additional node agents that can be added to new core groups. The administrative process per core group requirement does not apply to HA manager-disabled core groups. An alternative implementation that does not require an administrative JVM per HA manager-enabled core group is being developed for future release to remove this restriction.
5.3 WebSphere Application Server cell size design considerations
In designing large cell topologies, the following considerations must be kept in mind because they can pose limitations to scaling up or scaling out the cell.
� The need to support shared information across all or a large set of WebSphere processes. The breadth and currency requirements for shared information (something that must be known by all or many JVMs within the cell) present a challenge for any distributed computing system.
� The mechanisms for communication and coordination of shared information.
The product components that can impact the size of a cell are:
� Any component – all components have the potential to implement logic that can block scaling up a cell. Hosted applications can also be implemented in such a way that they restrict the cell size.
� High Availability manager (HA manager) and any component that uses it for shared information like WLM, proxy server, and HTTP Session Replication
� Systems administration components.
� Security components.
Chapter 5. Design considerations for large environments 67

Figure 5-5 shows the product components within WebSphere Application Server that can impact scalability. Subsequent sections of this chapter address the tuning requirements for these product components in order to achieve maximum scalability.
Figure 5-5 Determining factors for WebSphere scalability
5.4 WebSphere Application Server scalability by component
This section examines the specific components within WebSphere (shown in Figure 5-5) and the issues those components currently pose for support of large topologies.
WebSphereScalability
Factors
HA Manager(HAM)
Core Groups(CG)
System ManagementComponents
SecurityComponents
Core GroupBridges
CG ConfigurationHardware & NetworkCG HAM Algorithms
Applications DeployedQuality of Service (QoS)
CG ConfigurationHardware & NetworkCG HAM Algorithms
Applications DeployedQuality of Service (QoS)
Bridge ConfigurationFailover & StartupTimes
Bridge InterfacesBridge Topology
Bridge ConfigurationFailover & StartupTimes
Bridge InterfacesBridge Topology
Configuration ManagementOperational Management
Configuration ManagementOperational Management
Java 2 SecurityAuthenticationAuthorization
SSL
Java 2 SecurityAuthenticationAuthorization
SSL
HAM Memory BuffersHAM Protocols
HA (Active) CoordinatorHAM Memory Buffers
HAM Protocols
HA (Active) Coordinator
68 Techniques for Managing Large WebSphere Installations

5.4.1 HA manager
The administrative domain of the HA manager is a core group. HA manager services are available only between JVMs that are part of the same core group. Routing information can be shared across core groups over a core group bridge.
The HA manager has certain constraints based on its design and implementation. In the following sections, we discuss the scalability constraints introduced by HA manager protocols, HA manager memory buffers, and the HA (active) coordinator. Components that exploit the HA manager inherit these constraints and then add considerations for scalability of their own.
HA manager protocolsThree different protocols are used in an HA domain to ensure proper functioning of the core group. The protocols can be classified into two categories, which are:
� Membership protocols
– Discovery protocol: Tries to detect newly running JVMs in the same core group. Keeps trying if a JVM stays down. See “Discovery protocol” on page 27.
– Failure detection protocol: Detects whether a once-detected JVM stays alive. See “Failure detection protocol” on page 29.
� Messaging protocol
– View synchrony protocol: Maintains virtual synchrony in the core group. See “View synchrony protocol” on page 31.
HA manager uses resources (CPU, memory, and network bandwidth) for discovery, failure detection, and view synchrony. The base HA manager component uses resources only for discovery and failure detection. Typically, this is minimal in a core group of 50 members or less.
Refer to 3.2.4, “HA manager resource consumption” on page 33 for guidance on minimizing resource consumption by the HA manager.
Refer to 7.2, “Recommendations for the HA manager” on page 106 for details on tuning HA manager for greater scalability.
HA manager memory buffersThe out-of-the-box settings constrain the amount of memory the HA manager can dynamically allocate to handle network messages. Generally, the default buffer settings are adequate for small topologies. However, if you are using Data Replication Service (DRS), such as HTTP session replication, stateful session bean failover, dynacache, the default settings should be changed. In addition, in
Chapter 5. Design considerations for large environments 69

large topologies, these values should also be adjusted. Failure to adjust these values can result in DCS congestion messages that indicate problems transferring large amounts of message data. Refer to 7.2, “Recommendations for the HA manager” on page 106 for details on tuning HA manager for greater scalability.
HA active coordinatorThe HA active coordinator of HA manager aggregates all the distributed state information from all the individual processes. Every core group contains an HA coordinator. The coordinator consumes extra memory and CPU cycles. An active coordinator can potentially get overloaded if there are too many HA groups or too many bulletin board posts and lead to out-of-memory conditions and CPU starvation messages. Refer to 7.2.3, “Tuning the HA coordinator” on page 113 for best practices on configuring and tuning the HA coordinator.
5.4.2 Core groups
A core group is a collection of firmly coupled, cooperating processes, all from the same cell, over which group services are established. The set of processes in a core group can directly form HA relationships. A core group is different from an HA group. An HA group is transient and runtime, whereas core group information is persistent in a configuration file.
Core groups do not scale to the same extent as cells. A cell containing more than 50 processes may have to be partitioned into multiple core groups. If routing information must be shared between the core groups, a core group bridge is used to interconnect the core groups.
A number of factors determine how large a single core group can become. These include the hardware used, network, number and types of applications deployed into the cell, configuration settings, quality of services required, and internal core group HA algorithms. These factors are explained in the sections that follow.
Core group configurationThe out-of-the-box settings do not work well for large core groups, or for any topology that is configured to use memory-to-memory replication. Refer to “Summary of the HA manager recommendations” on page 114 in 7.2, “Recommendations for the HA manager” on page 106 for recommendations on the configuration parameters that must be tuned for large topologies.
Hardware and networkAll members of a core group must be located on machines connected by a high-speed LAN. Members of the same core group must not be located on
70 Techniques for Managing Large WebSphere Installations

machines connected by a WAN. A core group cannot have its members located on opposite sides of a firewall. Core groups can be connected through a firewall via a core group bridge. On fast (gigabit), reliable networks, core groups up to 100 members have been run without any issues.
Internal core group HA algorithms The core group messaging system is based on the HA manager synchronization and control protocol that requires all running core group members to be fully connected via the network to all other running core group members. As the number of members (JVMs) increase, the algorithms become geometrically more expensive.
Optimizations to reduce message frequency and size are available in WebSphere Application Server V6.1. As a rule of thumb, cells with 50 or more processes should be considered for partitioning.
More information about optimizing core group connectivity can be found in 3.2.2, “HA manager protocols” on page 26.
Number and types of applications deployed in the cellRouting data is made highly available via the HA manager. Depending on the number and types of applications (EJB, JMS, HTTP through proxy server, HTTP session failover using DRS) the size of the routing data can become significant. In large topologies, the amount of routing data, especially ODC routing data, can be in the order of tens of megabytes. Propagation of routing data can consume significant amounts of CPU, memory, and network bandwidth.
Quality of service (QoS) requiredThe following QoS requirements can affect core group scalability:
� Guaranteed fast singleton failover: The HA manager monitors the health of all active processes in a core group by a combination of passive and active heartbeat mechanisms. If guaranteed fast failover is required, it may be necessary to set the heart beat interval to a smaller period. This increases the amount of background CPU used for heartbeat as well as increasing the probability of false positives. If low heartbeat intervals are required, smaller core groups are recommended.
� Memory-to-memory replication: When replication is used, it is possible to configure the number of cluster members to which data is replicated. If a large amount of data is replicated to all members of a cluster, it can result in significant load being placed in the network and CPU.
Chapter 5. Design considerations for large environments 71

5.4.3 Core group bridging
In cases where it is necessary to share routing information across core groups, core group bridging provides the capability to extend the HA manager’s bulletin board across core group boundaries. The Core Group Bridge Service can be enabled on any WebSphere Application Server process (node agent, Deployment Manager, or application server).
Bridges are typically required in a topology for one of the following reasons:
� Intra-cell communication: Multiple core groups within the same cell need to share routing information.
� Inter-cell communication: Multiple cells contain components that need to share bulletin board information across cell boundaries.
For example, a Web application located in core group 1 may call an EJB or a JMS application located in core group 2. The core groups that need to share routing data can be in the same cell or they can be in different cells. When core groups are bridged together, they can share routing data.
The factors discussed in the following sections must be taken into consideration during bridge setup for scalability.
Bridging configurationFor high availability, each core group should have two bridges per core group. Though any WebSphere Application Server process can be a bridge, a standalone application server that does not host any production applications should be created to operate as a bridge. This is due to the high CPU and memory requirements of a bridge in a large topology. If resource limitations prevent creating standalone servers as bridges, node agents can also be used as bridges. In small topologies, node agents are the recommended process to use as bridges. However, in large topologies, the large amount of bulletin board traffic handled by a bridge makes it more susceptible to failure (out-of-memory errors or thread starvation). Therefore, it is best for the bridge to have a dedicated process.
Bridge failover and startup times Bridge failover and startup are the most resource-intensive times for a bridge. During bridge failover, the remaining bridge receives state information from the other bridges in its access point group and has to process every bulletin board subscription previously handled by the failed bridge. In a large topology, it can take five minutes or more for state information to be recovered, and this delay can be problematic for the proxy server and On Demand Router (the latter available only with WebSphere Extended Deployment), which depend on the
72 Techniques for Managing Large WebSphere Installations

bulletin board for their routing information. During startup, bridges handle subscriptions from every process in their local core group and any resulting bulletin board posts. In tests, it has taken 20 to 30 minutes to start a 10-core group topology with ~350 servers total. Startup times are worse if a coordinator is not assigned in each local core group.
Bridging topologiesThe viable topology options are the mesh topology and the doubly linked chain topology:
� Mesh:
The advantage of a mesh topology is that all bridge Interfaces can directly intercommunicate. Therefore, this topology offers the lowest propagation latency. The disadvantage of this topology is that it does not scale indefinitely. The number of bridge interfaces in a single access point group should not exceed 50.
� Doubly linked chain:
The advantage of a doubly linked chain topology is that it scales indefinitely. There are two major disadvantages to this topology. The first is the variable and increased delay for propagating routing data from one core group to another. The second is that if the bridge interfaces in two core groups go down, the bridge topology will partition. Under normal conditions, the mesh topology is preferred.
More information about these topologies can be found in 4.3, “Core group bridging topologies” on page 52.
5.4.4 System management components
WebSphere System Management has gone to great lengths to keep configuration management and operations management separate. Configuration management is based on the WebSphere Common Configuration Model (WCCM) stored in XML files on the file system, whereas the operations management model utilizes the Java Management Extensions (JMX™) framework.
Configuration managementIn a WebSphere Application Server Network Deployment cell, the Deployment Manager holds the master repository. As the master repository, the Deployment Manager holds the authoritative copy of every configuration document for every node in the cell. Each node does not replicate the entire configuration but rather holds a sparse tree that contains only its own node and the serverindex.xml of every other node. In a process called NodeSync, each node’s node agent
Chapter 5. Design considerations for large environments 73

contacts the Deployment Manager on a periodic basis and checks to see whether any files have changed. If files have changed, the updated files are downloaded and placed in the node’s sparse tree. While NodeSync is enabled by default, it can be disabled by the customer. As the cell grows, more configuration data is stored in the master repository, which includes growth in applications, nodes, and application servers.
Operational managementWebSphere operations are based on the Java Management Extensions (JMX) framework. A WebSphere Application Server cell is organized in a tree-like structure (refer to Figure 5-6). An Network Deployment cell has the Deployment Manager at the root, and every node has a branch to the Deployment Manager. From each node agent, every server hosted on that node is a branch from the node agent. As a result, a JMX request from the Deployment Manager to a single application server flows through the Deployment Manager, the node agent on the same node where the server resides, and finally the application server itself. This design is intended for high scalability, where the Deployment Manager only has to talk to a node agent, and the node agent only has to talk to its respective application servers. If an invocation is made to all servers on a node, the Deployment Manager uses one invocation to the node agent, and the node agent in turn broadcasts it out to every server on the node.
Figure 5-6 System administration - JMX query traverses the WebSphere cell
Consider the following JMX queries issued on the Deployment Manager (presented in Jacl for simplicity):
$AdminControl queryNames type=Application,*
This query searches for every Mbean of type Application in the cell. For this query to be fulfilled, every running server must be checked and returned.
$AdminControl queryNames type=Application,node=SampleNode1,*
DM
NANA
ASAS
AS
AS
AS
AS
AS
NA
AS
AS
AS
AS
NA
AS
AS
AS
AS
NA
AS
AS
AS
AS
74 Techniques for Managing Large WebSphere Installations

This query searches for every Mbean of type Application on a specific node within the cell - specifically, node SampleNode1. No other node agent is sent the query.
$AdminControl queryNames type=Application,node=SampleNode1,process=server1,*
This query searches for every Mbean of type Application on a specific node and server within the cell - specifically, node SampleNode1 and Server server1. The node agent on SampleNode1 forwards the query directly to the server. No other server on SampleNode1, nor any node agent or server in any other node, is contacted.
$AdminControl queryNames,node=SampleNode1,process=server1,*
This query returns all Mbeans on node SampleNode1 and server1, regardless of type. This query shows that any attribute in the query can contain wildcard characters.
$AdminControl queryNames *
To fulfill this query, the Deployment Manager must query every server in the cell and return every Mbean from them. This query is expensive and requires time to complete.
To fulfill a query, every server that matches the query must be checked. The JMX code is designed to walk the tree in a depth-first search pattern, which means if a node matches, all of its servers must be checked before the node can return control back to the Deployment Manager. Then the Deployment Manager moves to the next node. In an environment with 500 servers, a wide query can require 500 times longer to return than a query that targets a specific process.
A problem occurs if any node or application server on a node accepts a query but does not return an answer in a reasonable amount of time. A common cause of this problem is a server that is out of memory but that out-of-memory condition has not taken down the server or caused the server to be stopped and restarted by monitoring logic.
To avoid a scenario where queries get stuck, the best approach is to use narrow queries that target only the servers or nodes you really need information from. Queries that touch every server can considerably bog down a cell.
This bogging down of queries can be an extreme bottleneck and will turn into failures as cell sizes grow and grow. With more servers in a cell, a wide query can get stuck in more points and places, blocking not only that query but possibly any queries behind it.
Chapter 5. Design considerations for large environments 75

5.4.5 Security components
The main components of security are: Java 2 security, authentication, authorization, and Secure Sockets Layer (SSL). Some of the issues facing a large topology from a security standpoint are:
� The most significant impact to a large topology from a security standpoint is how frequently the user registry is accessed during a login. Actions can be taken to reduce or eliminate registry accesses after the initial login by using security attribute propagation, authentication cache, hashtable attribute assertion, and so on.
� Another major issue is related to thread contention. This is not purely a security issue but has a major impact when security is enabled. When too many threads execute in a single JVM, it is a better practice to create additional JVMs to more evenly spread the workload. During our performance analysis, we found this improves throughput tremendously.
� Another issue is the number of SSL handshakes, which tends to be SSL’s most significant overhead.
Section 7.7, “Recommendations for security components” on page 130 discusses various recommendations and best practices for the security components to enhance scalability.
For more information about these security issues and to get background on the authentication capabilities, see the article “Advanced authentication in WebSphere Application Server” on the developerWorks® Web site at:
http://www.ibm.com/developerworks/websphere/techjournal/0508_benantar/0508_benantar.html
5.5 High availability using WebSphere Application Server for z/OS
WebSphere Application Server for z/OS leverages a number of availability and scaling features that are inherited in z/OS, using a number of tightly coupled components. The z/OS operating system leverages the self-healing attributes from the hardware and extends them by adding functions such as recovery services, address space isolation, and storage key protections. Functions such as z/OS Workload Manager (WLM), Resource Recovery Services (RRS), and automatic restart manager (ARM) assure the availability of applications. The z/OS operating system can be configured into a Parallel Sysplex®, the clustering technology for z/OS, providing continuous availability without compromising perceived client performance.
76 Techniques for Managing Large WebSphere Installations

High availability requires at least two servers providing the same services to their clients, allowing for recovery of services when a failure occurs. Leveraging z/OS Parallel Sysplex clustering technology adds value in offering continuous availability. The zWLM advanced workload technology provides balance for application workload across the systems in the Parallel Sysplex. Workloads are not simply spread, but rather workload is balanced based on current load, policy objectives, and the availability of the systems or applications.
z/OS also offers the capability of using Geographically Dispersed Parallel Sysplex™ (GDPS®) to further extend system availability for systems as far as 40 km apart by offering the ability to avoid a total sitewide disaster.
Using the z/OS Parallel Sysplex clustering architecture, you can achieve a near continuous availability of 99.999%, or five minutes of downtime a year. For more information refer to Redbook Architecting High Availability Using WebSphere V6 on z/OS, SG24-6850.
Given the capabilities already available on z/OS, WebSphere Application Server for z/OS takes full advantage of these high availability features. WebSphere Application Server leverages z/OS availability and scaling capabilities instead of leveraging similar functionality in the WebSphere HA manager.
The WebSphere HA manager still brings value to the WebSphere Application Server for z/OS environment if you require any of the following HA manager services:
� Memory-to-memory replication
� Singleton failover
� WebSphere workload management routing
� On-demand configuration routing
� Service integration bus services
See the discussion about these services in 2.1.2, “HA manager service usage” on page 16.
In terms of WebSphere Application Server for z/OS best practice recommendations for high availability and scalability, we recommend the following guidelines if you do not have the HA manager enabled:
� Keep the number of nodes per LPAR between one or two nodes with a maximum of four nodes per LPAR. Multiple nodes on an LPAR are normally used to make the service rollout easier, so that one node can be updated while the other node is active.
Chapter 5. Design considerations for large environments 77

� Keep the number of servers to a reasonable number as dictated by the amount of real memory present on the LPAR.
� Have a cell or cluster spread over at least two LPARS. Using multiple LPARs ensures hardware redundancy as well, while still allowing the cluster to be upgraded on a per node basis.
One specific large topology design scenario consists of:
� One deployment manager on a common LPAR (startable on all LPARs on which the node resides).
� Two nodes exist across two LPARS.
� At least 300 servers exist on each node, for a total of 600 servers all clustered.
� Approximately 300 applications exist in the cell.
� HA manager is not enabled in this cell.
If the HA manager is needed within the cell, follow the HA manager recommendations in 2.1, “High availability manager main services” on page 14. If the HA manager services are needed, the cell growth is somewhat limited. The general rule is you can have only 50 application servers within a core group. Since each core group must contain at least one administrative process (node agent or Deployment Manager), you are limited to the number of core groups you can create by the number of nodes within the cell. In addition, we do not recommend including the Deployment Manager in any core groups because it inhibits the Deployment Manager’s ability to perform cross-system restarts.
Consider the following cell:
� One Deployment Manager
� Two nodes
This means you can have two core groups, one for each node agent. In each of those core groups, you can have 50 application servers. Since you want all servers to be clustered across both nodes, you can have at most 50 cluster members or 50 two-member clusters in the cell. You can, however, create additional core groups with the HA manager disabled. These core groups do not have the core group size limitations.
78 Techniques for Managing Large WebSphere Installations

Chapter 6. Planning for large environments
When designing a large topology for WebSphere Application Server, you can build a topology that supports just the product components and qualities of service you need. By configuring and tuning these product components appropriately, you can achieve a highly available and scalable environment. In this chapter, we classify five topologies that can be configured for large environments and guide you through the decision-making factors for selecting a topology appropriate to your environment.
In this chapter, the following topics are discussed:
� 6.1, “Classification of topologies” on page 80� 6.2, “Selecting the appropriate topology” on page 83� 6.3, “Overview of topologies” on page 86
6
© Copyright IBM Corp. 2008. All rights reserved. 79

6.1 Classification of topologies
In this chapter, we classify five topologies that can be configured for large environments:
1. Nonpartitioned cell (single core group) topology
2. Partitioned cell (multiple core group) topology
3. Partitioned cell (multicore group) with a HA manager-disabled core group topology
4. Intra-cell bridging topology
5. Inter-cell bridging topology
These topologies differ in terms of the WebSphere components configured and quality of service (QoS) they support. Table 6-1 lists the differences in these topologies in terms of the configured WebSphere Application Server components, while Table 6-2 on page 81 lists the differences in terms of the QoS supported.
Table 6-1 WebSphere components configured for topologies
Topology Core groups HA manager Core Group Bridge Service (CGBS)
Nonpartitioned cell Single Enabled Disabled. (Can be configured to form an inter-cell bridging topology).
Partitioned cell Multiple Enabled Disabled. (Can be configured to form intra-cell and inter-cell bridging topologies).
Partitioned cell with HA manager-disabled core group
Multiple Disabled on one core group
Enabled on remaining CGs
Disabled. (Can be configured to form intra-cell and inter-cell bridging topologies).
Intra-cell bridging Multiple Enabled Enabled.
Inter-cell bridging Single or Multiple
Enabled Enabled.
80 Techniques for Managing Large WebSphere Installations
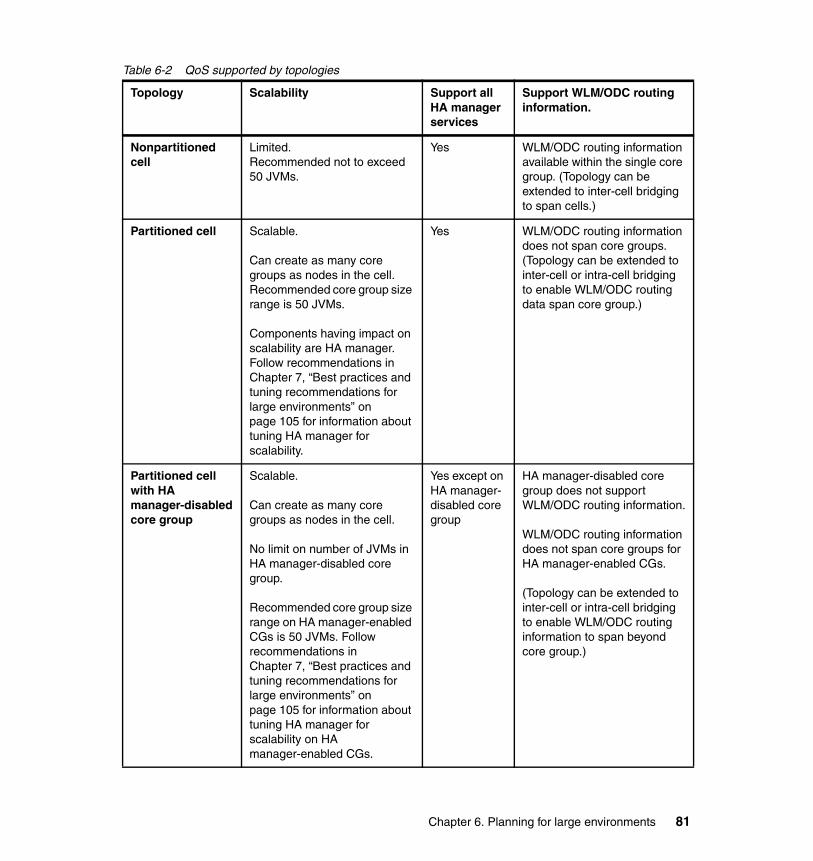
Table 6-2 QoS supported by topologies
Topology Scalability Support all HA manager services
Support WLM/ODC routing information.
Nonpartitioned cell
Limited.Recommended not to exceed 50 JVMs.
Yes WLM/ODC routing information available within the single core group. (Topology can be extended to inter-cell bridging to span cells.)
Partitioned cell Scalable.
Can create as many core groups as nodes in the cell. Recommended core group size range is 50 JVMs.
Components having impact on scalability are HA manager. Follow recommendations in Chapter 7, “Best practices and tuning recommendations for large environments” on page 105 for information about tuning HA manager for scalability.
Yes WLM/ODC routing information does not span core groups. (Topology can be extended to inter-cell or intra-cell bridging to enable WLM/ODC routing data span core group.)
Partitioned cell with HA manager-disabled core group
Scalable.
Can create as many core groups as nodes in the cell.
No limit on number of JVMs in HA manager-disabled core group.
Recommended core group size range on HA manager-enabled CGs is 50 JVMs. Follow recommendations in Chapter 7, “Best practices and tuning recommendations for large environments” on page 105 for information about tuning HA manager for scalability on HA manager-enabled CGs.
Yes except on HA manager-disabled core group
HA manager-disabled core group does not support WLM/ODC routing information.
WLM/ODC routing information does not span core groups for HA manager-enabled CGs.
(Topology can be extended to inter-cell or intra-cell bridging to enable WLM/ODC routing information to span beyond core group.)
Chapter 6. Planning for large environments 81
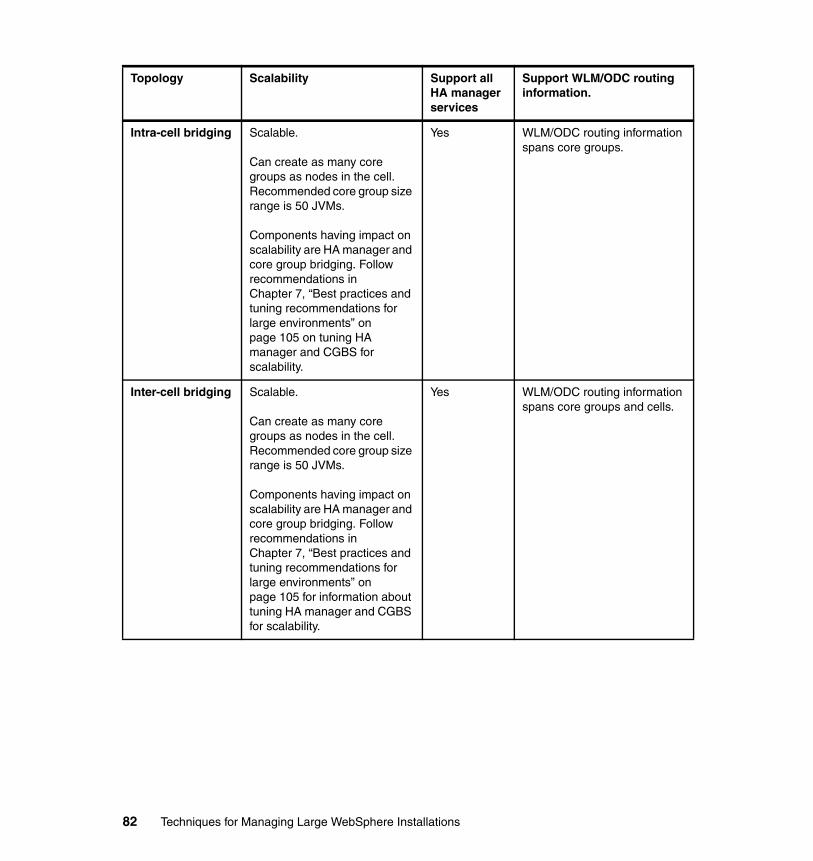
Intra-cell bridging Scalable.
Can create as many core groups as nodes in the cell. Recommended core group size range is 50 JVMs.
Components having impact on scalability are HA manager and core group bridging. Follow recommendations in Chapter 7, “Best practices and tuning recommendations for large environments” on page 105 on tuning HA manager and CGBS for scalability.
Yes WLM/ODC routing information spans core groups.
Inter-cell bridging Scalable.
Can create as many core groups as nodes in the cell. Recommended core group size range is 50 JVMs.
Components having impact on scalability are HA manager and core group bridging. Follow recommendations in Chapter 7, “Best practices and tuning recommendations for large environments” on page 105 for information about tuning HA manager and CGBS for scalability.
Yes WLM/ODC routing information spans core groups and cells.
Topology Scalability Support all HA manager services
Support WLM/ODC routing information.
82 Techniques for Managing Large WebSphere Installations
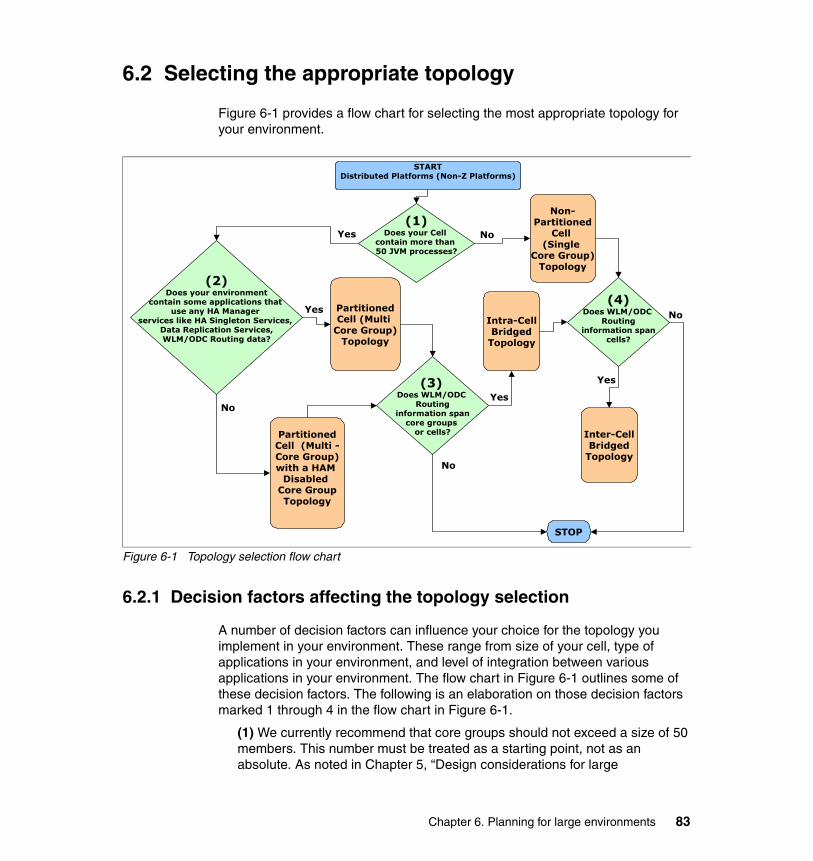
6.2 Selecting the appropriate topology
Figure 6-1 provides a flow chart for selecting the most appropriate topology for your environment.
Figure 6-1 Topology selection flow chart
6.2.1 Decision factors affecting the topology selection
A number of decision factors can influence your choice for the topology you implement in your environment. These range from size of your cell, type of applications in your environment, and level of integration between various applications in your environment. The flow chart in Figure 6-1 outlines some of these decision factors. The following is an elaboration on those decision factors marked 1 through 4 in the flow chart in Figure 6-1.
(1) We currently recommend that core groups should not exceed a size of 50 members. This number must be treated as a starting point, not as an absolute. As noted in Chapter 5, “Design considerations for large
STARTDistributed Platforms (Non-Z Platforms)
(2)Does your environment
contain some applications that use any HA Manager
services like HA Singleton Services,Data Replication Services,WLM/ODC Routing data?
PartitionedCell (Multi -Core Group)with a HAM
Disabled Core GroupTopology
(1)Does your Cell
contain more than 50 JVM processes?
Non-Partitioned
Cell (Single
Core Group)Topology
PartitionedCell (Multi
Core Group)Topology
(3)Does WLM/ODC
Routinginformation span
core groups or cells?
Intra-CellBridged
Topology
(4)Does WLM/ODC
Routinginformation span
cells?
Inter-CellBridged
Topology
STOP
Yes
No
No
No
Yes
Yes
Yes
No
Chapter 6. Planning for large environments 83

environments” on page 61, the number of variables, including hardware, application mix, and desired quality of service, can influence this. Under the proper conditions, core groups with 100 members will work. Under other conditions, a core group size of 50 is too large. No magic formula can be used to calculate optimum core group size. In V6.02, core group sizes should never exceed 100 members under any conditions. When a cell size exceeds 50 members, it is time to consider splitting the cell into multiple core groups.
(2) Depending on the type of applications deployed in your environment, you may or may not require the use of HA manager services. The following is a list of services and components using the HA manager. Use this list as a guideline while making a decision on whether your environment requires HA manager.
– Highly available singleton services like:
Default IBM JMS provider (messaging engine), transaction manager (transaction log recovery), J2EE Connector Architecture (JCA) adapters, serial HTTP session invalidation
– HA manager Unified Clustering Framework-based WLM or ODC routing data are used by:
HTTP through the proxy server, applications using Web services protocol, Session Initiation Protocol (SIP), Enterprise JavaBeans™ (EJBs), and default messaging.
– HA manager Data Replication Service (DRS) used by:
HTTP session replication, dynacache, DistributedMap, stateful session bean failover, distributed cache used by the Core Group Bridge Service (CGBS)
– WebSphere Extended Deployment:
On demand configuration (ODC) component, WebSphere Partitioning Facility (WPF), ObjectGrid, Service Component Architecture (SCA) event sequencing in WebSphere Process Server, and JCA resource adapter.
(3) Depending on the level of integration between applications deployed in your environment, you may be required to bridge core groups within a cell to allow for intra-cell communication. The following is a list of scenarios in which intra-cell bridging is required.
– Cross-core group or cluster invocation:
A Web (or a J2EE) application deployed in a cluster belonging to a core group invoking an EJB (or another J2EE) application deployed in another cluster belonging to a different core group.
84 Techniques for Managing Large WebSphere Installations

– Application request:
A client in one core group targets requests to a cluster in another core group.
� Proxy Server for WebSphere Application Server forwarding requests:
A proxy server in one core group forwards requests to a cluster in another core group.
� EJB (RMI-IIOP) requests:
EJB (IIOP) requests are received by a cluster in the core group. (For high availability, you must bridge cluster members with node agents - location service daemons (LSDs) - hosting cluster members.)
� For HA bridge cluster members with node agents (LSDs) that reside in a different core group.
� JMS (JFAP) requests:
Permits client to discover and connect to a target in a different core group.
� WebSphere Application Server V5 and V6 mixed cell:
If the V6 Deployment Manager is in a different core group than V6 cluster members.
� WebSphere Extended Deployment:
If multiple core groups exist.
� Web services requests
Use this list as a guideline while making a decision on whether your environment requires configured intra-cell bridging.
(4) Depending on the nature of routing calls made by applications deployed in your environment, you may require bridging between cells to enable inter-cell communication. The following is a list of scenarios in which inter-cell bridging is required.
– Proxy Server for WebSphere Application Server forwarding requests:
A proxy server in one cell forwards requests to a cluster in another cell.
– JMS (JFAP) requests:
A JMS client in one cell forwards requests to a cluster in another cell.
– EJB (RMI-IIOP):
EJB (IIOP) is a special case. No bridge is required for a simple EJB client request from one cell to another cell. However, if the target cell has multiple core groups, bridges are required within the target cell for HA location service daemon (LSD) support.
Chapter 6. Planning for large environments 85
– EJB backup clusters:
Backup cluster located in foreign cell.
– WebSphere Appication Server Extended Deployment:
A WebSphere Extended Deployment On Demand Router sends requests to a foreign cell.
Use this list as a guideline when making a decision on whether your environment requires inter-cell bridging to be configured.
6.3 Overview of topologies
The following sections discuss the features of the previously identified topologies and provides samples of them.
6.3.1 Nonpartitioned cell (single core group) topology
In this section we describe the features and provide a sample nonpartitioned cell (single core group) topology.
Features of a nonpartitioned cell topologyThe key features of this topology are:
� This topology is comprised of a single core group in a cell.
� This topology has limitations in scaling to a large number of processes in a single core group with HA manager enabled. The current recommendation is to limit the number of members in a HA manager-enabled single core group to not more than 50 members. Refer to Chapter 7, “Best practices and tuning recommendations for large environments” on page 105 for guidelines on tuning the HA manager for greater scalability.
� The single core group topology has no size constraint if the HA manager is disabled on all the application servers in the core group. However, several services within WebSphere Application Server depend on the HA manager being enabled to function properly. Refer to “List of services and components using the HA manager” on page 91 for a list of services that use HA manager. Customers should thoroughly validate the impact on their environment of disabling HA manager in this topology or consider using the partitioned cell with a HA manager-disabled core group topology instead.
86 Techniques for Managing Large WebSphere Installations
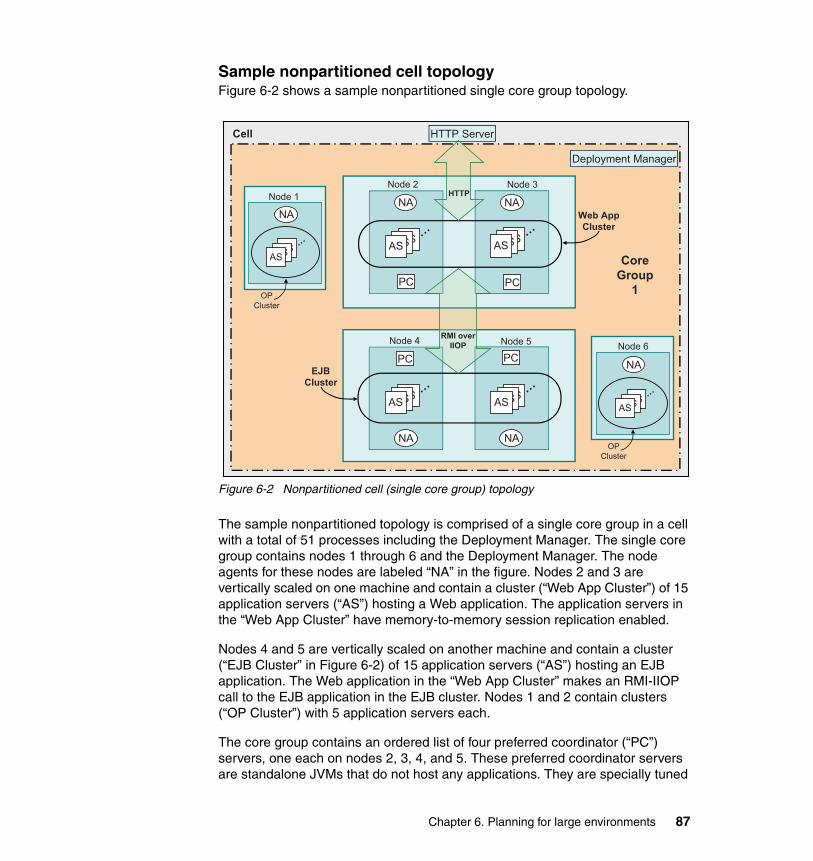
Sample nonpartitioned cell topologyFigure 6-2 shows a sample nonpartitioned single core group topology.
Figure 6-2 Nonpartitioned cell (single core group) topology
The sample nonpartitioned topology is comprised of a single core group in a cell with a total of 51 processes including the Deployment Manager. The single core group contains nodes 1 through 6 and the Deployment Manager. The node agents for these nodes are labeled “NA” in the figure. Nodes 2 and 3 are vertically scaled on one machine and contain a cluster (“Web App Cluster”) of 15 application servers (“AS”) hosting a Web application. The application servers in the “Web App Cluster” have memory-to-memory session replication enabled.
Nodes 4 and 5 are vertically scaled on another machine and contain a cluster (“EJB Cluster” in Figure 6-2) of 15 application servers (“AS”) hosting an EJB application. The Web application in the “Web App Cluster” makes an RMI-IIOP call to the EJB application in the EJB cluster. Nodes 1 and 2 contain clusters (“OP Cluster”) with 5 application servers each.
The core group contains an ordered list of four preferred coordinator (“PC”) servers, one each on nodes 2, 3, 4, and 5. These preferred coordinator servers are standalone JVMs that do not host any applications. They are specially tuned
Node 2
Node 4
PC PC
Node 1
PC PC
NANA
NANANA
Node 6
NAEJB
Cluster
Web App
Cluster
OPCluster
OPCluster
HTTP ServerCell
Core
Group
1
Deployment Manager
ASASAS… ASASAS
…
ASASAS… ASASAS
…
ASASAS…
ASASAS…
RMI over
IIOP
HTTPNode 3
Node 5
Chapter 6. Planning for large environments 87

with higher heap settings. The preferred (active) coordinator server runs on the first member of the ordered list of preferred coordinator servers. The preferred (active) coordinator manages the failover of highly available singleton services and distributes live server state data to interested core group members. In a large configuration, the amount of CPU and memory resources for the coordinator to perform the tasks is quite large. It is a good practice to select server members that do not get recycled frequently as the preferred active coordinators.
6.3.2 Partitioned cell (multicore group) topology
In this section we describe the features and provide a sample partitioned cell (multicore group) topology.
Features of a partitioned cell topologyThe key features of this topology are:
� The topology is comprised of more than one core group in a cell. The number of core groups that can be created in a cell depends on the number of nodes in the cell. This is due to the restriction in core group formation rules of having an administrative JVM in each core group. Additional core groups can be created by creating “phantom” nodes.
� Unlike the single core group topology, this topology has no limitations in scaling to a large number of processes. You can create as many core groups as there are nodes in the cell but limit each core group in the 50 JVM size range. Chapter 7, “Best practices and tuning recommendations for large environments” on page 105 provides configuration best practices and tuning guidelines for greater scalability.
� This topology does not support cross-core group routing information unless it is bridged (for example, an application in core group 1 cannot make a call that needs WLM routing to an application in core group 2 without the core groups being bridged). Use the intra-cell or inter-cell bridging topologies if routing information must span core groups or cells.
� This topology works best when dependent clusters are placed in the same core group.
� Such a topology works well for “siloed” applications where there is no integration between applications.
88 Techniques for Managing Large WebSphere Installations

Sample partitioned cell (multicore group) topologyFigure 6-3 shows a sample partitioned cell multicore group topology. The sample partitioned topology is comprised of two core groups in a cell with a total of 111 processes in the cell. Core group 1 contains 56 processes, and core group 2 contains 55 processes.
Figure 6-3 Partitioned cell (multicore group) topology
Core group 1 contains the Deployment Manager and nodes 1 through 3. The node agents for these nodes are labeled “NA”. Nodes 2 and 3 are vertically scaled on one machine and contain a cluster (“Web App Cluster 1”) of 25 application servers (“AS”) hosting a Web application. The application servers in the “Web App Cluster 1” have memory-to-memory session replication enabled. Node 1 contains a cluster (“EJB cluster 1”) of 25 applications servers hosting an EJB application. The Web application in the “Web App Cluster 1” makes a RMI-IIOP call to the EJB application in the “EJB cluster 1”.
Core group 1 contains an ordered list of two preferred coordinator (“PC”) servers, one each on nodes 2 and 3. These preferred coordinator servers are standalone JVMs that do not host any applications. They are specially tuned with higher heap settings. The preferred active coordinator runs on the first member of this ordered list of servers. The preferred active coordinator manages the failover of
Node 2
Node 4
Node 1
NANA
NANANA
Node 6
NAWeb App
Cluster 2
Web App
Cluster 1
EJB cluster 1
Web App cluster 3
HA
Enabled
Coregroup
HA
Disabled
Core Group
PC
Cell
Deployment Manager
ASASAS… ASASAS
…
ASASAS… ASASAS
…
ASASAS…
ASASAS…
Node 3
Node 5
PC
RMI/IIOP
Chapter 6. Planning for large environments 89

highly available singleton services and distributes live server state data to interested core group members. In a large configuration, the amount of CPU and memory resources for the coordinator to perform the tasks is quite large. It is a good practice to select server members that do not get recycled frequently as the preferred active coordinators.
Core group 2 contains nodes 4 through 6. The node agents for these nodes are also labeled “NA”. Nodes 4 and 5 are vertically scaled on another machine and contain a cluster (“EJB Cluster 2”) of 25 application servers (“AS”) hosting an EJB application. Node 6 contains a cluster (“Web App cluster 2”) of 25 application servers hosting a Web application. The application servers in “Web App cluster 2” have memory-to-memory session replication enabled. The Web application in “Web App cluster 2” makes an RMI-IIOP call to the EJB application in “EJB Cluster 2”.
Core group 2 contains an ordered list of two preferred coordinator (“PC”) servers, one each on nodes 4 and 5. These preferred coordinator servers are standalone JVMs that do not host any applications. They are specially tuned with higher heap settings. The preferred active coordinator for core group 2 will run on the first member in the ordered list of preferred coordinator servers.
Since core groups 1 and 2 are not bridged, the Web application in “Web App Cluster 1” cannot make an RMI-IIOP call to the EJB application in the “EJB Cluster 2” since routing information will not span core groups unless they are bridged. However, within the same core group, the Web application cluster can make a call to an EJB cluster.
6.3.3 Partitioned cell with HA manager-disabled core group topology
In this section we describe the features of the partitioned cell with a HA manager-disabled core group topology and provide a sample topology.
Features of a partitioned cell with HA manager disabledThe key features of this topology are:
� This topology is a variation of the partitioned cell topology with the difference that it supports disabling the HA manager feature on a core group that does not need the HA manager.
� The HA manager and the components that use its services consume resources - memory, CPU, and network bandwidth. The cell may contain a number of application servers that do not require use of the HA manager or the services that depend on it (for example, a Version 6 cluster hosting a Web application that does not make calls to EJB or JMS applications and is not
90 Techniques for Managing Large WebSphere Installations
using memory-to-memory replication). The HA manager can be disabled on the application servers in this type of cluster.
� As a best practice, we recommend you create a single core group (for example, HADisabledCoreGroup) and move all application servers on which the HA manager has been disabled to this core group.
� A core group that contains only HA-disabled application servers has no size constraint.
� Disabling the HA manager effectively disables all components using HA manager services. Check the “List of services and components using the HA manager” on page 91 for a list of services and components that will be affected.
� A managed process (node agent or Deployment Manager) is not needed in a disabled core group.
List of services and components using the HA managerHighly available singleton services such as:
� Default IBM JMS provider (messaging engine)
� Transaction manager (transaction log recovery)
� J2EE Connector Architecture (JCA) adapters
� Serial HTTP session invalidation
Attention: As more internal WebSphere components build function on top of HA manager services, it is becoming increasingly difficult to know whether or not the HA manager services are required. Disabling can lead to problems in the future if a new function requires the HA manager when the administrator has previously disabled it. Refer to the following “List of services and components using the HA manager.” The most current list is on the WebSphere Application Server, V6.1 Information Center, which can be accessed here:
http://publib.boulder.ibm.com/infocenter/wasinfo/v6r1/index.jsp
Chapter 6. Planning for large environments 91
HA manager unified clustering framework-based WLM or ODC routing data are used by:
� HTTP through Proxy Server for WebSphere Application Server
� Applications using Web services, SIP, EJBs, and default messaging
HA manager Data Replication Service used by:
� HTTP session replication
� Dynacache
� Distributed Map
� Stateful session bean
� Distributed cache used by the Core Group Bridge Service (CGBS)
WebSphere Extended Deployment:
� On demand configuration (ODC) component.
� Partitioning facility.
� ObjectGrid.
� Event sequencing component of WebSphere Process Server.
� Service Component Architecture (SCA) event sequencing provides arrival time-based message-processing facility for all relevant SCA components in a WebSphere Process Server cluster.
� Highly available inbound JCA resource adapter provides reliable arrival time-based sequential processing of inbound messages in a WebSphere Process Server cluster.
92 Techniques for Managing Large WebSphere Installations

Sample partitioned cell with HA manager disabledFigure 6-4 shows a sample partitioned cell with an HA manager-disabled core group topology. The sample topology is comprised of two core groups in a cell: an HA manager-enabled core group and an HA manager-disabled core group. The cell contains a total of 158 processes. The HA manager-enabled core group has 55 members, and the HA manager-disabled core group has 103 members.
Figure 6-4 Partitioned cell partially disabled HA manager topology
The HA manager-enabled core group contains the Deployment Manager and nodes 1 through 3. The node agents for these nodes are labeled “NA”. Nodes 2 and 3 are vertically scaled on one machine and contain a cluster (“Web App Cluster 1”) of 25 application servers (“AS”) hosting a Web application. The application servers in “Web App Cluster 1” have memory-to-memory session replication enabled. Node 1 contains a cluster (“EJB cluster 1”) of 25 applications servers hosting an EJB application. The Web application in “Web App Cluster 1” makes an RMI-IIOP call to the EJB application in the “EJB cluster 1”.
The HA manager-enabled core group contains an ordered list of two preferred coordinator (“PC”) servers, one each on nodes 2 and 3. These preferred coordinator server are standalone JVMs that do not host any applications. They are specially tuned with higher heap settings. The preferred active coordinator for
Node 2
Node 4
Node 1
NANA
NANANA
Node 6
NAWeb App
Cluster 2
Web App
Cluster 1
EJB cluster 1
Web App cluster 3
HA
Enabled
Coregroup
HA
Disabled
Core Group
PC
Cell
Deployment Manager
ASASAS… ASASAS
…
ASASAS… ASASAS
…
ASASAS…
ASASAS…
Node 3
Node 5
PC
RMI/IIOP
Chapter 6. Planning for large environments 93

the HA manager-enabled core group runs on the first member of this ordered list of preferred coordinator servers.
The HA manager-disabled core group contains nodes 4 through 6. The node agents for these nodes are labeled “NA”. Nodes 4 and 5 are vertically scaled on one machine and contain a cluster (“Web App Cluster 2”) of 50 application servers (“AS”) hosting a Web application. Node 6 contains a cluster (“Web App cluster 3”) of 50 application servers hosting a Web application. The application servers in the Web application cluster 2 and 3 do not have any special HA features such as memory-to-memory session replication because HA is disabled on this core group. The HA manager-disabled core group does not have preferred coordinator servers.
6.3.4 Intra-cell bridging topology
In this section we describe the features of the intra-cell bridging topology and provide sample intra-cell bridging topologies.
Features of intra-cell bridging topologyThe key features of this topology are:
� This is the partitioned cell multiple core group topology with Core Group Bridge Service (CGBS) enabled. The CGBS is the component that allows cross-core group communication by enabling the HA manager bulletin board (state data exchange) service to be configured to communicate across core groups.
� CGBS must be configured when routing information Workload Manager (WLM) or on demand configuration (ODC) must span core groups whenever the request originates in one core group but the target is located in another core group.
� This topology supports all of the following intra-cell bridge scenarios:
– Cross-core group or cluster invocation:
A Web (or a J2EE) application deployed in a cluster belonging to a core group invoking an EJB (or another J2EE) application deployed in another cluster belonging to a different core group
– Application request:
A client in one core group targets requests to a cluster in another core group.
– Proxy Server for WebSphere Application Server forwarding requests:
A proxy server in one core group forwards requests to a cluster in another core group.
94 Techniques for Managing Large WebSphere Installations

– EJB (RMI-IIOP) requests:
EJB (IIOP) requests are received by a cluster in the core group (for high availability you must bridge cluster members with node agents (location service daemons) hosting cluster members).
– Web services requests.
– For HA bridge cluster members with node agents (LSDs).
– JMS (JFAP) requests:
JMS client and target can discover and connect if they are in different core groups.
– WebSphere Application Server V5 and V6 mixed cell:
When V6 Deployment Manager is in a different core group than V6 cluster members
– WebSphere Extended Deployment:
If multiple core groups exist.
� The CGBS configuration data for intra-cell bridge comprises of the following (see Figure 6-5 on page 96 for example):
– Bridge Interfaces (bridge servers):
Designated process (JVM), which is responsible for forwarding HA manager bulletin board traffic.
– Core group access point:
Every core group has an access point. An access point is a container (collection) of bridge interfaces (bridge servers). A core group access point contains local cell Bridge Interfaces
– Access point group:
Collection of access points. Intra-cell access point group contains a collection of core group access points.
Chapter 6. Planning for large environments 95
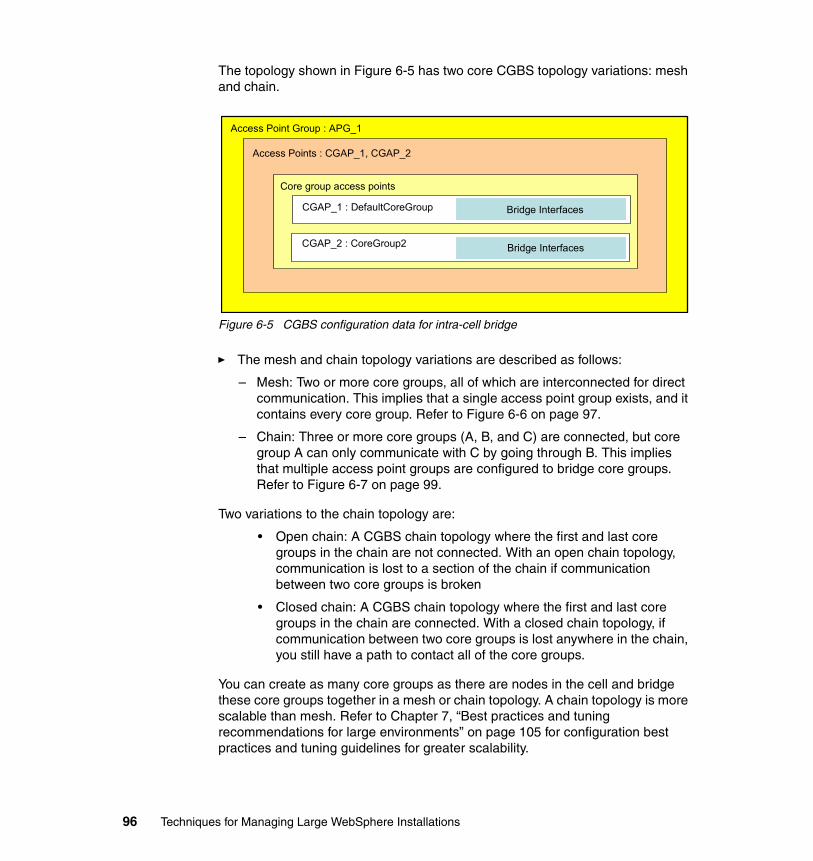
The topology shown in Figure 6-5 has two core CGBS topology variations: mesh and chain.
Figure 6-5 CGBS configuration data for intra-cell bridge
� The mesh and chain topology variations are described as follows:
– Mesh: Two or more core groups, all of which are interconnected for direct communication. This implies that a single access point group exists, and it contains every core group. Refer to Figure 6-6 on page 97.
– Chain: Three or more core groups (A, B, and C) are connected, but core group A can only communicate with C by going through B. This implies that multiple access point groups are configured to bridge core groups. Refer to Figure 6-7 on page 99.
Two variations to the chain topology are:
• Open chain: A CGBS chain topology where the first and last core groups in the chain are not connected. With an open chain topology, communication is lost to a section of the chain if communication between two core groups is broken
• Closed chain: A CGBS chain topology where the first and last core groups in the chain are connected. With a closed chain topology, if communication between two core groups is lost anywhere in the chain, you still have a path to contact all of the core groups.
You can create as many core groups as there are nodes in the cell and bridge these core groups together in a mesh or chain topology. A chain topology is more scalable than mesh. Refer to Chapter 7, “Best practices and tuning recommendations for large environments” on page 105 for configuration best practices and tuning guidelines for greater scalability.
Access Point Group : APG_1
Access Points : CGAP_1, CGAP_2
Core group access points
CGAP_1 : DefaultCoreGroup Bridge InterfacesBridge Interfaces
CGAP_2 : CoreGroup2 Bridge InterfacesBridge Interfaces
96 Techniques for Managing Large WebSphere Installations

Sample intra-cell bridging mesh topologyFigure 6-6 shows a sample intra-cell bridging mesh topology. The sample topology is comprised of a four core groups in a cell: “Core Group 1,” “Core Group 2,” “Core Group 3,” and “Core Group 4.” The cell contains a total of 217 processes including the Deployment Manager. Each core group contains 54 processes.
Figure 6-6 Intra-cell bridging mesh topology
Each of the core groups contains two nodes. The node agents for these nodes are labeled “NA”.
Each core group contains a cluster of 25 application servers hosting a Web application and another cluster of 25 application servers hosting an EJB application. The application servers in the Web application cluster have memory-to-memory session replication enabled. The Web application in this cluster in Core Group 1 makes an RMI-IIOP call to the EJB application in the cluster in Core Group 3.
NANA
NANA
Core Group 2
Core Group 4
ASASAS
…
ASASAS
…ASASAS
…
ASASAS
…
ASASAS
…
ASASAS
…ASASAS
…
ASASAS
…
NANA
Core Group 1
ASASAS
…
ASASAS
…ASASAS
…
ASASAS
…
NANA
Core Group 3
ASASAS
…
ASASAS
…ASASAS
…
ASASAS
…
CGAP2 BIBI
CGAP4BI BI
APG1
CGAP1 BIBI
CGAP3BI BI
Cell
Chapter 6. Planning for large environments 97

The Web application in “Web App cluster” in Core Group 1 makes an RMI-IIOP call to the EJB application in the “EJB Cluster” in Core Group 3. Similarly the Web application in Core Group 4 makes an RMI-IIOP call to the EJB application in Core Group 2.
The Web application Core Group 2 makes an RMI-IIOP call to the EJB application in Core Group 1, and the Web application Core Group 3 makes an RMI-IIOP call to the EJB application in Core Group 4.
For this cross-core group communication to succeed, the core groups must be bridged.
Each core group has two standalone application server JVMs on two separate nodes dedicated to be the bridge interface (“BI” as shown in Figure 6-6 on page 97) servers. The preferred coordinator server ordered list is configured on these two “BI” servers for each of the core groups. The “BI” servers are configured with higher heap settings and do not host any applications. The preferred active coordinator for each of these core groups runs on the first member of the ordered list of preferred coordinator (“BI”) servers.
Each core group has a core group access point (“CGAP”) defined with the two “BI” servers for that core group as its members. These access points are indicated by “CGAP1” in Core Group1, “CGAP2” in Core Group 2, “CGAP3” in Core Group 3, and “CGAP4” in Core Group 4.
A single access point group (“APG1”) has been defined, which contains “CGAP1,” “CGAP2,” “CGAP3,” and “CGAP4” as its members.
This form of bridging is a mesh topology where every core group is inter-connected for direct communication. This topology offers the lowest propagation latency. The disadvantage of this topology is that it does not scale indefinitely. The number of bridge interfaces in a single access point group should not exceed 50.
98 Techniques for Managing Large WebSphere Installations

Sample intra-cell bridging chain topologyFigure 6-7 shows a sample intra-cell bridging chain topology. The sample topology is comprised of four core groups in a cell: Core Group 1, Core Group 2, Core Group 3, and Core Group 4. The cell contains a total of 217 processes including the Deployment Manager. Each core group contains 54 processes.
Figure 6-7 Intra-cell bridging closed chain topology
Each of the core groups contains two nodes. The node agents for these nodes are labeled “NA”.
Each core group contains a cluster (“Web App cluster”) of 25 application servers (“AS”) hosting a Web application and another cluster (“EJB Cluster”) of 25 applications servers (“AS”) hosting an EJB application. The application servers in “Web App cluster” have memory-to-memory session replication enabled.
The Web application in “Web App Cluster” in Core Group 1 makes an RMI-IIOP call to the EJB application in the “EJB Cluster” in Core Group 3. Similarly the
NANA
NANA
Core Group 2
Core Group 4
ASASAS
…
ASASAS
…ASASAS
…
ASASAS
…
ASASAS
…
ASASAS
…ASASAS
…
ASASAS
…
NANA
Core Group 1
ASASAS
…
ASASAS
…ASASAS
…
ASASAS
…
NANA
Core Group 3
ASASAS
…
ASASAS
…ASASAS
…
ASASAS
…
CGAP2 BIBICGAP1 BIBI
CGAP4BI BI CGAP3BI BI
APG12
APG34
APG23APG41
Cell
Chapter 6. Planning for large environments 99

Web application Core Group 4 makes an RMI-IIOP call to the EJB application in Core Group 2.
The Web application in Core Group 2 makes an RMI-IIOP call to the EJB application in Core Group 1, and the Web application Core Group 3 makes an RMI-IIOP call to the EJB application in Core Group 4.
For this cross-core group communication to succeed, the core groups must be bridged.
Each core group has two standalone application server JVMs on two separate nodes dedicated to be the bridge interface (“BI”) servers. The preferred coordinator server ordered list is configured with these two “BI” servers for each of the core groups. The “BI” servers are configured with higher heap settings and do not host any applications. The preferred active coordinator for each of these core groups runs on the first member of the ordered list of preferred coordinator (“BI”) servers.
Each core group has a core group access point (“CGAP”) defined with the two “BI” servers for that core group as its members. These access points are indicated by “CGAP1” in Core Group 1, “CGAP2” in Core Group 2, “CGAP3” in Core Group 3, and “CGAP4” in Core Group 4.
In this topology, multiple access point groups have been defined to bridge the core groups. All the core groups are not directly interconnected for communication. Instead Core Group1 and Core Group 2 are bridged, Core Group2 and Core Group 3 are bridged, Core Group3 and Core Group 4 are bridged, and Core Group4 and Core Group 1 are bridged. This means that a call from Core Group 1 to Core Group 3 has to be routed via Core Group 2.
The following access point groups have been defined:
� “APG12” contains “CGAP1” and “CGAP2.”
� “APG23” contains “CGAP2” and “CGAP3.”
� “APG34” contains “CGAP3” and “CGAP4.”
� “APG41” contains “CGAP4” and “CGAP1.”
This advantage of this topology is that it scales indefinitely. However, variable and increased delay propagates routing data from one core group to another. Moreover, if the bridge interface in two core groups goes down, the bridge topology will partition.
100 Techniques for Managing Large WebSphere Installations

6.3.5 Inter-cell bridging topology
In this section we describe the features of the inter-cell bridging topology and provide a sample inter-cell bridging topology.
Features of inter-cell bridging topologyThe key features of this topology are as follows:
� This topology has CGBS enabled for inter-cell communication. In this topology, core groups across cells can be bridged, thus allowing the HA manager bulletin board (state data exchange) service to span across cells.
� This topology supports the following Inter-cell bridge scenarios:
– Proxy Server for WebSphere Application Server forwarding requests:
A proxy server in one cell forwards requests to a cluster in another cell.
– JMS (JFAP) requests:
A JMS client in one cell can discover and forward requests to a cluster in another cell.
– EJB (RMI-IIOP):
EJB (IIOP) is a special case. No bridge is required for a simple EJB client request from one cell to another cell. However, if the target cell has multiple core groups, bridges are required within the target cell for HA location service daemon (LSD) support.
– EJB backup clusters:
Backup cluster located in foreign cell.
– WebSphere Extended Deployment:
A WebSphere Extended Deployment on demand router (proxy server) sends requests to a foreign cell.
� The CGBS configuration data for an inter-cell bridge comprises the following (see Figure 6-8 on page 102 for an example):
– Bridge interfaces (bridge servers):
Designated process (JVM), which is responsible for forwarding HA manager bulletin board traffic.
– Core Group Access Point (CGAP):
A core group access point contains local cell bridge interfaces.
– Peer access point:
A peer access point contains remote cell bridge interfaces. It has two subtypes: peer access point and proxy peer access point.
Chapter 6. Planning for large environments 101
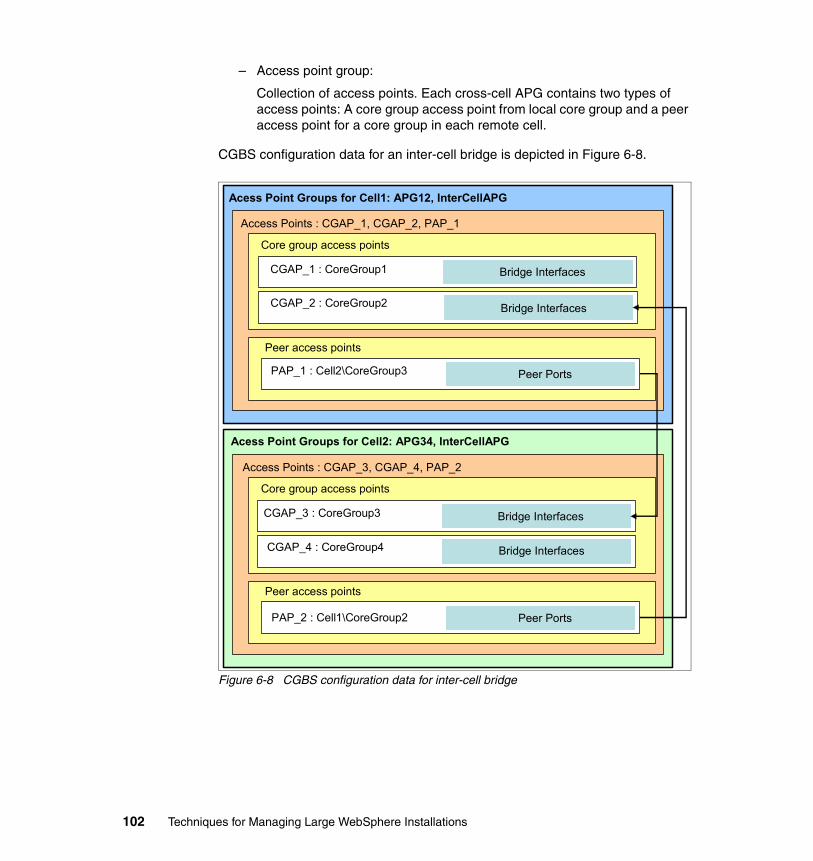
– Access point group:
Collection of access points. Each cross-cell APG contains two types of access points: A core group access point from local core group and a peer access point for a core group in each remote cell.
CGBS configuration data for an inter-cell bridge is depicted in Figure 6-8.
Figure 6-8 CGBS configuration data for inter-cell bridge
Access Points : CGAP_1, CGAP_2, PAP_1
Core group access points
CGAP_1 : CoreGroup1 Bridge InterfacesBridge Interfaces
CGAP_2 : CoreGroup2 Bridge Interfaces
Peer access points
PAP_1 : Cell2\CoreGroup3 Peer PortsPeer Ports
Acess Point Groups for Cell1: APG12, InterCellAPG
Access Points : CGAP_3, CGAP_4, PAP_2
Core group access points
CGAP_3 : CoreGroup3 Bridge InterfacesBridge Interfaces
CGAP_4 : CoreGroup4 Bridge InterfacesBridge Interfaces
Peer access points
PAP_2 : Cell1\CoreGroup2 Peer PortsPeer Ports
Acess Point Groups for Cell2: APG34, InterCellAPG
102 Techniques for Managing Large WebSphere Installations
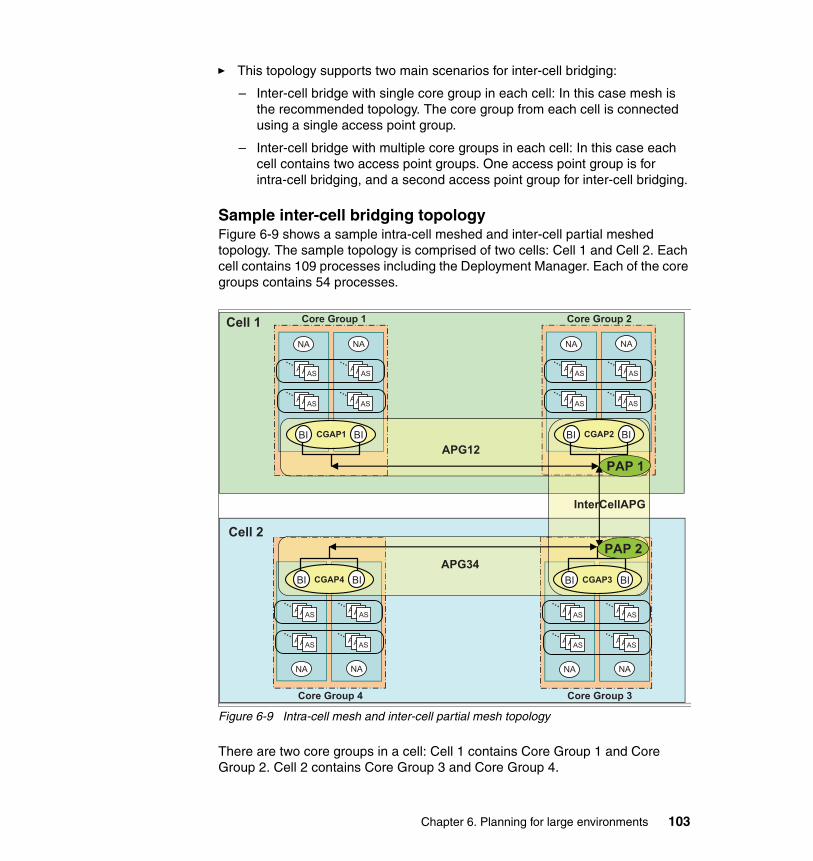
� This topology supports two main scenarios for inter-cell bridging:
– Inter-cell bridge with single core group in each cell: In this case mesh is the recommended topology. The core group from each cell is connected using a single access point group.
– Inter-cell bridge with multiple core groups in each cell: In this case each cell contains two access point groups. One access point group is for intra-cell bridging, and a second access point group for inter-cell bridging.
Sample inter-cell bridging topologyFigure 6-9 shows a sample intra-cell meshed and inter-cell partial meshed topology. The sample topology is comprised of two cells: Cell 1 and Cell 2. Each cell contains 109 processes including the Deployment Manager. Each of the core groups contains 54 processes.
Figure 6-9 Intra-cell mesh and inter-cell partial mesh topology
There are two core groups in a cell: Cell 1 contains Core Group 1 and Core Group 2. Cell 2 contains Core Group 3 and Core Group 4.
NANA
NANA
Core Group 2
Core Group 4
ASASAS
…
ASASAS
…ASASAS
…
ASASAS
…
ASASAS
…
ASASAS
…ASASAS
…
ASASAS
…
NANA
Core Group 1
ASASAS
…
ASASAS
…ASASAS
…
ASASAS
…
NANA
Core Group 3
ASASAS
…
ASASAS
…ASASAS
…
ASASAS
…
CGAP2 BIBICGAP1 BIBI
CGAP4BI BI CGAP3BI BI
APG12
APG34
InterCellAPG
Cell 2
Cell 1
PAP 1
PAP 2
Chapter 6. Planning for large environments 103

Each of the core groups contains two nodes. The node agents for these nodes are labeled “NA”.
A JMS application in Core Group 1 in Cell 1 forwards a request to a cluster in Core Group 4 in Cell 2. Similarly, another JMS application in Core Group 3 in Cell 2 forwards a request to a cluster in Core Group 2 in Cell 1.
For this cross-cell communication to succeed, the cells have to be bridged.
Each core group has two standalone application server JVMs on two separate nodes dedicated to be the bridge interface (“BI”) servers. The preferred coordinator server ordered list is configured on these two “BI” servers for each of the core groups. The “BI” servers are configured with higher heap settings and do not host any applications. The preferred active coordinator for each of the core groups runs on the first member of this ordered list of preferred coordinator (“BI”) servers.
Each core group has a core group access point defined with the two bridge interface servers for that core group as its members. These access points are indicated by “CGAP1” in Core Group1, “CGAP2” in Core Group 2, “CGAP3” in Core Group 3, and “CGAP4” in Core Group 4.
Additionally peer access points: “PAP 1” and “PAP 2” have been defined. “PAP 1” contains references pointing to the two bridge interface servers in “CGAP3” on Cell 2. “PAP 2” contains references pointing to the two bridge interface servers in “CGAP2” on Cell 1.
In this topology the core groups in each cell are bridged (intra-cell mesh), and one core group from each cell is bridged. Each cell has two access points groups: one access point group for the intra-cell mesh and one for the inter-cell mesh.
The following access point groups have been defined (see Figure 6-8 on page 102):
Cell 1
� “APG12” contains “CGAP1” and “CGAP2.”
� “InterCellAPG” contains “CGAP2” and “PAP1.”
Cell 2
� “APG34” contains “CGAP3” and “CGAP4.”
� “InterCellAPG” contains “CGAP3” and “PAP2.”
The “InterCellAPG” access point group bridges the two cells together.
104 Techniques for Managing Large WebSphere Installations

Chapter 7. Best practices and tuning recommendations for large environments
This chapter addresses the best practices for configuration and provides recommendations for tuning various WebSphere components. By configuring and tuning these product components appropriately, you can achieve a highly available and scalable environment.
In this chapter, the following topics are discussed:
� 7.1, “Components requiring tuning in large environments” on page 106� 7.2, “Recommendations for the HA manager” on page 106� 7.3, “Recommendations for core groups” on page 116� 7.4, “Recommendations for intra-cell core group bridging” on page 120� 7.5, “Recommendations for inter-cell core group bridging” on page 124� 7.6, “Recommendations for system management components” on page 129� 7.7, “Recommendations for security components” on page 130
7
© Copyright IBM Corp. 2008. All rights reserved. 105
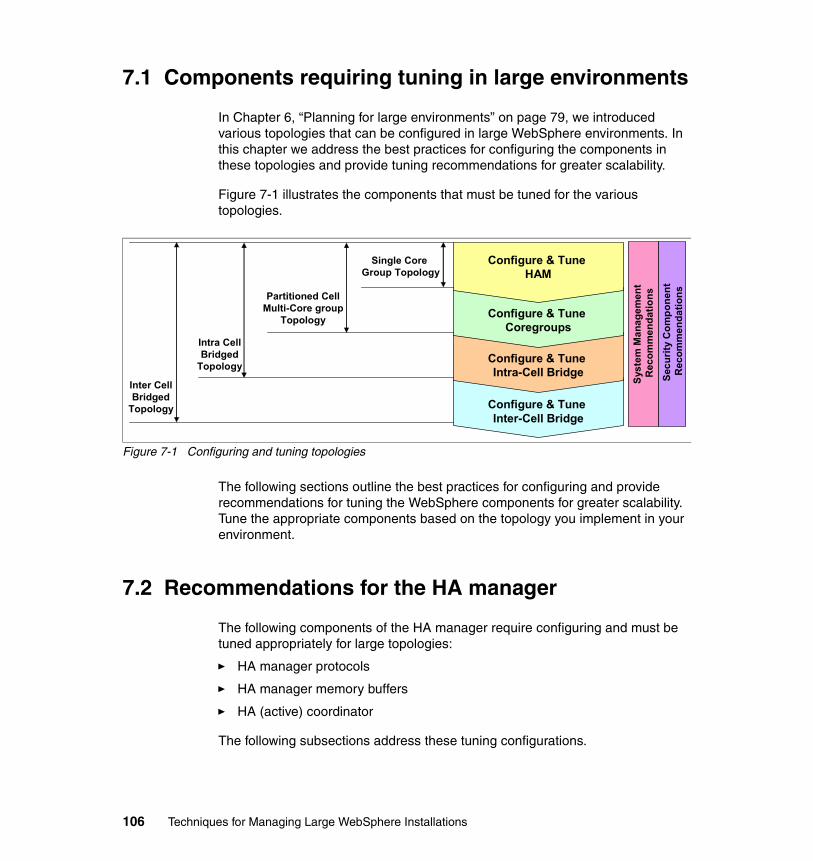
7.1 Components requiring tuning in large environments
In Chapter 6, “Planning for large environments” on page 79, we introduced various topologies that can be configured in large WebSphere environments. In this chapter we address the best practices for configuring the components in these topologies and provide tuning recommendations for greater scalability.
Figure 7-1 illustrates the components that must be tuned for the various topologies.
Figure 7-1 Configuring and tuning topologies
The following sections outline the best practices for configuring and provide recommendations for tuning the WebSphere components for greater scalability. Tune the appropriate components based on the topology you implement in your environment.
7.2 Recommendations for the HA manager
The following components of the HA manager require configuring and must be tuned appropriately for large topologies:
� HA manager protocols
� HA manager memory buffers
� HA (active) coordinator
The following subsections address these tuning configurations.
Configure & Tune Inter-Cell Bridge
Configure & Tune Intra-Cell Bridge
Configure & Tune Coregroups
Configure & Tune HAM
Single Core Group Topology
Partitioned CellMulti-Core group
Topology
Intra CellBridged
Topology
Inter CellBridged
Topology
Secu
rity
Com
pone
nt
Rec
omm
enda
tions
Syst
em M
anag
emen
t R
ecom
men
datio
ns
106 Techniques for Managing Large WebSphere Installations

7.2.1 Tuning the HA manager protocols
In a core group, the HA manager executes three protocols:
� Discovery protocol: For detecting new JVMs
� Failure detection protocol: For detecting failed or unresponsive JVMs
� View synchrony protocol: For maintaining virtual synchrony in the core group
These protocols are executed in all processes. If required, the protocols can be customized or tuned. In most topologies, the default settings are sufficient, and no tuning is required.
Tuning the HA manager discovery protocolAt startup, a core group member attempts to establish a connection with every other member of the core group. If the initial attempt is successful, no further action is taken. If the initial attempt is unsuccessful, the discovery protocol is executed. The discovery phase involves the following steps:
� Every core group member periodically attempts to connect to all healthy members in a core group.
� Every core group member calculates the number of unconnected members and attempts to open connections to them. Discovery can be accelerated in certain scenarios (A discovers B so B discovers A).
� The total number of connection establishment attempts in a core group is:
– n * (m – n) – Where m > 0. m is the number of core group members– Where 0 < n <= m. n is the number of healthy members in a view
The following can affect discovery resource usage and performance:
� A large value of unconnected JVMs (m – n) in a core group.
� For a nonzero value of the unconnected JVMs (m – n), a large number of live core group members (n).
� A small IBM_CS_UNICAST_DISCOVERY_INTERVAL. This custom property determines the discovery period. The default value is 60 seconds. This value in general needs no tuning.
� If all the JVMs of a core group are running and in view, no discovery is required.
Chapter 7. Best practices and tuning recommendations for large environments 107

Recommendations - HA manager discovery protocol We recommend the following:
1. The IBM_CS_UNICAST_DISCOVERY_INTERVAL custom property can be tuned on the core group; however, we recommend you leave it at the default of 60 seconds.
2. Minimizing the number of unstarted JVMs in a core group also minimizes the resources necessary to execute the discovery protocol. Do not leave unused servers in the configuration. If they will never be used, delete them.
3. When running a large number of JVMs on a single box, the FIN_WAIT parameter of the operating system may need to be tuned down to prevent running out of TCP ephemeral ports. Consult your OS documentation for details.
Tuning the HA manager failure detection protocolFailure detection uses two distinct mechanisms:
� It looks for connections that closed because the underlying socket was closed. Machine and process failures are typically detected by a socket closed event.
� It listens for active heartbeats from the core group members. Network (switch, router, cable) failures are typically detected by heartbeat.
Two custom properties that serve as heartbeat control parameters are:
� IBM_CS_FD_PERIOD_SECS
The default value is 30. For each active member, a heartbeat is transmitted every IBM_CS_FD_PERIOD_SECS.
� IBM_CS_FD_CONSECUTIVE_MISSED
The default value is 6. On missing IBM_CS_FD_CONSECUTIVE_MISSED heartbeats, the offending JVM is removed from the view.
The protocol is optimized not to send a heartbeat message if other inter-server messages are transmitted successfully at a periodic <=IBM_CS_FD_PERIOD_SECS interval.
At any instance, for a core group with m (m > 0) active members, (m – 1) heartbeats can get transmitted. A high value of m contributes to network chatter.
Inappropriate settings of failure detection protocol parameters can also consume more resources (CPU, memory, bandwidth) than necessary.
108 Techniques for Managing Large WebSphere Installations

The following effects can be seen with IBM_CS_FD_PERIOD_SECS settings:
� If set to a low value, the IBM_CS_FD_PERIOD_SECS setting super-sensitizes the network-level failure detection process and may increase network chatter.
� If set to a high value, the setting compromises network-level failure detection but reduces network chatter.
Effect of setting IBM_CS_FD_CONSECUTIVE_MISSED to:
� A low value: May cause detection of false failures resulting in incorrect view changes. The discovery protocol will have to bring the member into view again.
We presently recommend that you keep the value of the following expression:
IBM_CS_FD_PERIOD_SECS * IBM_CS_FD_CONSECUTIVE_MISSED > 2 seconds
Recommendations - HA manager failure detection protocol We recommend the following:
1. The custom properties can be tuned on the core group, but we recommend you leave them at the following default:
– IBM_CS_FD_PERIOD_SECS= 30 seconds– IBM_CS_FD_CONSECUTIVE_MISSED= 6 seconds
2. Keep the value of the expression IBM_CS_FD_PERIOD_SECS * IBM_CS_FD_CONSECUTIVE_MISSED > 2 seconds.
3. The TCP_KEEP_ALIVE network setting of your operating system may have to be tuned down for faster failure detection in a highly available environment. Consult your OS documentation for details.
Tuning the HA manager view synchrony protocolView changes in a core group happen in the following cases:
� A socket closes or fails to respond to a heartbeat
� Discovery of new JVM occurs during initial connection or reconnection after previous failure
A view change is a complex operation. To maintain virtual synchrony, involved messaging and bookkeeping operations are needed. The complexity is a geometric function of the number of active members. During a view change, new servers have to send their state information to the active coordinator. The active coordinator updates its internal state. View changes involving an active coordinator change are expensive processes. Rebuilding the entire state of the
Chapter 7. Best practices and tuning recommendations for large environments 109

entire core group is required. A view change involves a DCS table update, a buffer flush, and the other usual group communications activities.
Administrators may periodically restart all the servers in a strict sequential fashion – sort of a“ripple restart” (sometimes this is done to prevent application death from memory leakage). From the viewpoint of the HA manager, it is far more efficient to do a mass start because it minimizes the number of view changes.
There are no direct custom properties for tuning the HA manager view synchrony. Tuning is conducted by controlling the number of core group members. CPU spikes occur when views change. The duration of a spike is reduced for smaller core groups. The recommended core group size is <= 50.
Recommendations - HA manager view synchrony protocol
We recommend the following:
1. Control the number of core group members to control CPU spikes during view changes. Recommended core group size is <= 50.
2. It is far more efficient to do a batch start of application servers versus a ripple restart because the batchstart minimizes the number of view changes. Avoid ripple restarts of application servers.
110 Techniques for Managing Large WebSphere Installations

7.2.2 Tuning the HA manager memory buffers
Figure 7-2 illustrates the HA manager memory buffers.
Figure 7-2 HA manager memory buffers
Generally, the default buffer settings are adequate. However, if you are using the Data Replication Service (DRS) for HTTP session replication, stateful session bean failover, or dynacache, the butter settings should be changed. In addition, these values should also be adjusted in large topologies. Failure to adjust these values can result in DCS congestion messages (DCSV1051W, DCSV1052W, DCSV1054W) appearing in the SystemOut.log, which indicate problems transferring large amounts of message data.
The custom properties discussed in the following sections require tuning to address the congestion issue.
IBM_CS_DATASTACK_MEGThis property specifies the DCS memory buffer parameter. This is a per-core group configuration parameter. The default value of IBM_CS_DATASTACK_MEG core group custom property is 50. The default value of the transport buffer size (server-scoped) RMM configuration attribute is 10. Both these buffers are dynamic in nature. The values specified in the IBM_CS_DATASTACK_MEG and
DCSIBM_CS_DATASTACK_MEG
RMMTransport buffer size
Network IBM_CS_SOCKET_BUFFER_SIZE
O/S Buffers
HAManager
Chapter 7. Best practices and tuning recommendations for large environments 111
transport buffer size are the maximum memory size in megabytes that these two buffers are allowed to use if necessary.
The maximum value of IBM_CS_DATASTACK_MEG is 256. When increasing the default value of IBM_CS_DATASTACK_MEG, we recommend that you also increase the transport buffer size >= IBM_CS_DATASTACK_MEG.
Transport buffer sizeThe transport buffer size is an attribute of the HAManagerService configuration. It specifies the RMM transport buffer size. The value of the transport buffer size should be identical in all the members of a core group. The value of 100 for both IBM_CS_DATASTACK_MEG and the transport buffer size provides acceptable performance for most large WebSphere Application Server topologies or WebSphere Application Server topologies using DRS. If DCS congestion messages (DCSV1051W, DCSV1052W, DCSV1054W) show up frequently in the log files, the value of these two parameters can be bumped up to the maximum value of 256.
IBM_CS_SOCKET_BUFFER_SIZEThe valid values of the IBM_CS_SOCKET_BUFFER_SIZE core group custom property are 0, 1, 2, and 3. Theoretically speaking, the values of the two DCS PMI counters, IncomingMessageSize and OutGoingMessageSize, should be used for tuning IBM_CS_SOCKET_BUFFER_SIZE. However, the default value of this parameter generally is sufficient for most WebSphere Application Server topologies. For more information about this setting, consult the WebSphere Application Server, V6.1 Information Center at:
http://publib.boulder.ibm.com/infocenter/wasinfo/v6r1/index.jsp
It should be noted that changing a core group custom property typically requires a restart of all the core group members (exceptions include the IBM_CS_WIRE_FORMAT_VERSION property where no restart is required). Any alteration of the transport buffer size also requires a corresponding server restart.
Recommendations - HA manager memory buffers We recommend you tune the HA manager memory buffers when using replication or when administering a large topology as follows:
1. Change IBM_CS_DATASTACK_MEG, a core group custom property, to 100.
2. Change the server-scoped transport buffer size attribute to 100 for all the core group members.
3. Increase the value of IBM_CS_DATASTACK_MEG and the transport buffer size if DCS congestion messages continuously appear in SystemOut.log. The
112 Techniques for Managing Large WebSphere Installations

value of these two parameters can be bumped up to the maximum value of 256.
4. Always set the transport buffer size >= IBM_CS_DATASTACK_MEG.
5. Leave IBM_CS_SOCKET_BUFFER_SIZE=0 (default). Valid values are 0, 1, 2.
6. Set core group custom property IBM_CS_WIRE_FORMAT_VERSION = 6.1.0.
7. Restart all the members after changes to core group custom properties.
In addition, JVM heap sizes must be appropriately sized to account for potential increased memory usage by the HA manager.
7.2.3 Tuning the HA coordinator
Every core group contains an HA coordinator. By default, the coordinator functionality is assigned to a single process. The coordinator consumes extra memory and CPU cycles. If the load becomes excessive, the coordinator functionality can be shared among multiple processes. Under normal conditions, this should not be necessary.
The coordinator can be configured to run on a preferred process. An ordered list of servers can be specified on the administration console by selecting: Servers → Core groups → Core Group Settings → <Core Group Name> → Preferred coordinator servers
If a preferred process is not configured, or if the preferred process is not running, the HA manager simply chooses a running process and assigns the coordinator to run there. The HA manager chooses the process with the lowest name (sorted alphabetically) from the set of currently running core group members. As processes start and stop, the coordinator may move from one process to another. When the coordinator moves from one process to another, it must rebuild the global state for the core group in its local memory. This consumes extra CPU cycles and network bandwidth. Therefore, coordinator moves should be avoided, if practical.
It is a best practice to configure a preferred coordinator process for each core group. Ideally, in larger topologies, the process chosen should be one that is located on a machine with spare capacity that is not servicing normal applications. In a topology that contains core group bridging, it is a best practice to create standalone application server processes that do not host applications, but exist only for the purpose of functioning as bridge interfaces and the HA coordinator.
Chapter 7. Best practices and tuning recommendations for large environments 113

Multiple active coordinatorsAn active coordinator can potentially get overloaded due to too many HA groups or too many bulletin board posts. Typically a single active coordinator is sufficient, especially given that recommended core group size is less than 50 members. If high CPU or memory usage is experienced on the active coordinator process, use the preferred coordinator setting to temporarily move the active coordinator function to another server. If the high resource usage follows the active coordinator function, you may want to define two coordinators for the core group to share the workload. The HA manager global state is distributed among all the elected coordinators. One can increase the number of coordinators on the ISC: Servers → Core groups → Core Group Settings → core group name → Number of coordinators.
Recommendations - HA (active) coordinator 1. In large topologies:
– The active coordinator should be located on a stable server that is not restarted often.
– The active coordinator server should have enough memory to contain the HA group information and to carry a light processing load to react quickly to the core group membership change events.
– We recommend that specially tuned standalone servers with sufficient heap settings be created to host both the active coordinator and bridge interface functions.
– Set up a nonsingleton list of ordered preferred coordinator servers.– Set the appropriate tuning parameters - for example, heap size - in all
preferred coordinator servers.
2. In smaller topologies, the Deployment Manager, node agents, or a standalone application server can be considered for hosting coordinators.
Summary of the HA manager recommendationsThis section summarizes the recommendations described in previous sections.
Recommendations for the HA manager protocols and buffers1. Set the following custom properties to the recommended values on the core
group:
a. IBM_CS_WIRE_FORMAT_VERSION = 6.1.0.
b. IBM_CS_DATASTACK_MEG = 100 (Specifies the DCS memory buffer parameter. This is a per-core group configuration parameter.).
c. IBM_CS_FD_PERIOD_SECS = 30 seconds (default) (Specifies the time interval, in seconds, between consecutive heartbeats.)
114 Techniques for Managing Large WebSphere Installations

d. IBM_CS_FD_CONSECUTIVE_MISSED = 6 (default) (Specifies the consecutive number of heartbeats that must be missed before the core group member is considered failed.)
e. IBM_CS_UNICAST_DISCOVERY_INTERVAL = 60 (default)
f. IBM_CS_SOCKET_BUFFER_SIZE = 0 (valid values 0, 1, 2)
g. The value of IBM_CS_FD_PERIOD_SECS * IBM_CS_FD_CONSECUTIVE_MISSED > 2 seconds.
2. Set the following parameter to the recommended values on each application server JVM:
a. TransportBufferSize=100 (Specifies the RMM transport buffer size. This is a per-process configuration parameter. The transport buffer size should be set to the same value for all core group members.)
b. Always set the transport buffer size >= IBM_CS_DATASTACK_MEG. The value of these two parameters can be bumped up to the maximum value of 256.
c. In addition, JVM heap sizes must be appropriately sized to account for potential increased memory usage by the HA manager.
3. Changing to a core group custom property requires restarting all core group members. Changing to a server-scoped custom property requires restarting the server. After setting the custom properties, restart all members.
4. Decrease the OS setting for TCP_KEEP_ALIVE to speed failure detection and the OS setting for FIN_WAIT to prevent running out of ephemeral ports. Consult your OS documentation for details.
5. Minimizing the number of stopped JVMs in a core group also minimizes the resources necessary to execute the discovery protocol. Do not leave items such as unused servers in the configuration. If they will never be used, delete them.
6. Control the number of core group members to control CPU spikes during view changes. We recommend a core group size of <=50.
7. Avoid ripple restart of application servers. It is far more efficient to do batch start of application servers because it minimizes the number of view changes.
Recommendations for the HA (active) coordinator 1. On large topologies:
– The active coordinator should be located on a stable server that is not restarted often.
– The active coordinator server should have enough memory to contain the HA group information and to carry a light processing load to react quickly to the core group membership change events.
Chapter 7. Best practices and tuning recommendations for large environments 115

– We recommend that specially tuned standalone servers with sufficient heap settings be created to host both the active coordinator and bridge interface functions.
– Set up a nonsingleton list of ordered preferred coordinator servers.– Set the appropriate tuning parameters - for example, heap size - in all
preferred coordinator servers.
2. On smaller topologies, the Deployment Manager, node agents, or a standalone application server can be considered for hosting coordinators.
7.3 Recommendations for core groups
The following sections discuss the need for multiple core groups and core group formation rules, and we provide tuning recommendations for core groups.
7.3.1 Multiple core groups
Core group size has a direct affect on required resources. Core groups do not scale to the same degree as cells. The lone DefaultCoreGroup may not work in large topologies. In large WebSphere Application Server topologies, we recommend that you partition a cell into multiple core groups for the following reasons:
� Scalability: Smaller core groups lead to greater scalability due to:
– Efficient discovery protocol execution by reducing the number of unconnected JVMs
– Efficient failure detection protocol execution by reducing network chatter since members in different core groups do not perform a heartbeat check.
– Efficient view synchrony protocol (view change)
� Performance: A manageable number of active core group members results in better performance due to:
– Faster messaging infrastructure internal operations maintain virtual synchrony
– Faster HA manager internal table updating at the active coordinator(s)
� Existence of a firewall between cell members: Heartbeat and other DCS-level messages have to flow between core group members. In a single core group topology, extra holes must be punched in the firewall to enable communication between group members on opposite sides of the firewall. Partitioned cells with multiple core groups can use Core Group Bridge Service (CGBS) to connect core groups.
116 Techniques for Managing Large WebSphere Installations

� Geographically separated cell members: The failure detection protocol may frequently create network partitions if the core group members are located in separate geographic regions. This is specially true for the fast failure detection mechanism. Cells containing geographically separated cell members can be partitioned and connected via core group bridging.
� Placeholder for the HA manager-disabled core group members: If disabling the HA manager on certain cell members is necessary, these members can be moved to a separate core group for the HA manager-disabled members in a partitioned cell.
� Configuration changes: Changing the configuration of a core group requires restarting all JVMs in the core group. Starting up and settling down larger core groups is unstable.
The recommended number of active members in a core group is 50, although core groups of up to 100 members in a single geographic location have been tested to demonstrate acceptable performance levels.
7.3.2 Core group formation rules
The following are a list of core group formation rules:
� A core group may contain zero or more WebSphere Application Server servers (managed JVMs).
� A core group containing HA manager-enabled members must contain at least one administrative process (Deployment Manager or node agent).
� A WebSphere process (JVM) must belong to one and only one core group.
� A core group cannot span across cells.
� All the members of a core group must belong to same cell.
� A cell can contain more than one core group.
� A cluster cannot span across core groups.
� All of the cluster members must belong to the same core group.
� A core group can have more than one cluster.
� All members of a core group must be located on machines connected by a high-speed LAN.
� Members of the same core group must not be located on machines connected by a WAN.
Chapter 7. Best practices and tuning recommendations for large environments 117

� A core group cannot have its members located on opposite sides of a firewall. Core group bridging can be used to connect core groups on opposite sides of a firewall if routing data must be shared between the core groups.
� Core groups must be connected with a core group bridge if routing data has to be shared between core groups.
7.3.3 Core group tuning options
The following list provides options for tuning core groups:
� The requirement for an administrative JVM in each core group limits the number of groups per cell (#nodes = #groups). A solution to creating additional core groups in the cell is to create “phantom” nodes to host additional node agents that can be added to new core groups. The administrative process per core group requirement does not apply to HA manager-disabled core groups. To remove this restriction, an alternative implementation that does not require an administrative JVM per HA manager-enabled core group is being developed for future release.
� On demand configuration (ODC) enables WebSphere Application Server components, such as the proxy server, to build application deployment, availability, and accessibility information to route requests for these applications without any additional configuration at the proxy server.
The ODC component posts configuration information to the bulletin board. In very large topologies (say a cell with about 400 JVMs and 8 bridged core groups), the posts made by the ODC component can result in an out-of-memory exception during server startup. If the following conditions are true, you can disable the ODC component and prevent it from posting information:
– WebSphere Extended Deployment will not be deployed.
– The proxy server will not be used.
– Web services clients will not be used.
– Remote request dispatching will not be used.
Set “-DODC.BBEnabled=false” in the generic JVM arguments for all the JVMs before restarting.
� One possible core group tuning option is to disable the HA manager on core groups where it is not required. Determining whether the HA manager is required or in use on a core group requires through investigation. Leave the HA manager enabled unless you are absolutely sure it is not currently required.
118 Techniques for Managing Large WebSphere Installations

7.3.4 IBM_CS_WIRE_FORMAT_VERSION
New core group protocol versions contain enhancements related to core group bridge messages and scalability.
� IBM_CS_WIRE_FORMAT_VERSION = 6.0.0
The default protocol compatible with all versions of the HA manager.
� IBM_CS_WIRE_FORMAT_VERSION = 6.0.2.9
Enhance core group bridge service scalability by optimizing bulletin board posts. See the following:
http://www-1.ibm.com/support/docview.wss?rs=180&uid=swg1PK20123
� IBM_CS_WIRE_FORMAT_VERSION = 6.1.0
Enhance core group scalability in large topologies.
The protocol version changes are inclusive. To run an updated protocol version, all the core group members must be at the same (or higher) WebSphere Application Server level.
Summary of recommendations for core groupsThe following list summarizes the recommendations for core groups:
1. Avoid one large core group (DefaultCoreGroup).
2. Partition the cell into several smaller core groups. Keep core groups in the 50 JVM size range.
3. Turn off the HA services for one core group that holds JVMs that do not need the HA manager.
4. Turn off ODC if the proxy server, Web services clients, remote request dispatching, WebSphere Extended Deployment, or ODC routing are not in use.
5. Bridge between core groups rather than increasing the size on one core group.
6. Dedicate one JVM in a core group to be coordinator and bridge (not the node agent).
7. To overcome the limitation of having an administrative JVM in each HA manager-enabled core group, create “phantom” nodes to host additional node agents that can be added to new core groups.
8. Select the appropriate core group protocol version (see the following Web page:
http://publib.boulder.ibm.com/infocenter/wasinfo/v6r0/topic/com.ibm.websphere.nd.doc/info/ae/ae/crun_ha_protocol_ver.html
Chapter 7. Best practices and tuning recommendations for large environments 119

7.4 Recommendations for intra-cell core group bridging
The following sections discuss core group bridge configuration, best practices for selecting bridge interfaces, the various bridge topologies, and custom properties for Core Group Bridge Service.
7.4.1 Bridging configuration
For high availability, each core group should have two bridges per core group. Though any WebSphere Application Server process can be a bridge, a standalone application server that does not host any production applications should be created to operate as a bridge. This is due to the high CPU and memory requirements of a bridge in a large topology. If resource limitations prevent creating standalone servers as bridges, node agents can also be used as bridges. In small topologies, node agents are the recommended process to use as bridges. However, in large topologies, the large amount of bulletin board traffic handled by a bridge makes it more susceptible to failure (out-of-memory errors or thread starvation). Therefore, it is best for the bridge to have a dedicated process.
For bridging within the cell, one only needs to configure the bridge interfaces, save and sync the changes, and restart the active coordinators. Everything else happens by default. If the topology previously never had a Core Group Bridge Service (CGBS) configuration, restarting the bridge interfaces and active coordinator is sufficient to get the system working, but it is not sufficient for high availability. The reason for this is due to a CGBS function known as the “subscription router.” For the subscription router to function properly, it must be running in the same process as the HA manager active coordinator. This will happen once CGBS has been configured and the active coordinator restarted. However, if the current active coordinator fails, and some other process takes over the active coordinator function, the subscription router may not be running in the new active coordinator process (unless that process was also restarted after the CGBS configuration was saved). This problem can be avoided by configuring a list of preferred HA coordinator servers and restarting all of them along with the bridge interfaces.
120 Techniques for Managing Large WebSphere Installations
7.4.2 Selecting bridge interfaces
A number of issues should be considered when selecting processes to serve as bridge interfaces:
� First, for high availability and load sharing, it is a best practice for each core group to have two bridge interfaces. If one bridge interface goes down, the other can take over its workload.
� Second, bridge Interfaces should be processes that are not frequently stopped. If all bridge interfaces in a given core group are stopped at the same time, applications will be unable to route until one of them is restarted.
� The third consideration is the usage pattern. When the cell is in a normal operating state, the bridge interfaces should be fairly passive and performing little work. However, if a large portion of the cell is stopped or restarted at the same time, bridge interfaces will be subject to large, sudden bursts of traffic.
The recommended best practice is to create two standalone servers in each core group to serve as dedicated bridge interfaces. The bridge interfaces should be on different machines. Additionally, the bridge interfaces should be configured as the first and second most preferred servers for the HA manager coordinator. This isolates the overhead associated with the HA manager away from the normal application servers. We recommend that the heap size for the bridge interfaces initially be set to a large value. Enable verbose garbage collection (GC) on these processes, monitor the heap usage, and adjust downward as appropriate.
7.4.3 Bridging topologies
The viable topology options are mesh topology and chain topology.
Mesh topology: The advantage of a mesh topology is that all bridge Interfaces can directly intercommunicate. Therefore, this topology offers the lowest propagation latency. The disadvantage of this topology is that it does not scale indefinitely. The number of bridge interfaces in a single access point group should not exceed 50. For bridges between core groups within a cell, the mesh topology is recommended. The mesh topology is the preferred configuration because it is easier to create, and there is only one hop between any two core groups. Minimizing hops is essential to performance because it minimizes the number of points at which data has to be deserialized. Communication failures between two core groups do not impact others.
Chain topology: The advantage of a chain topology is that it scales indefinitely. This topology has two major disadvantages. The first is the variable and increased delay required to propagate routing data from one core group to another. The second is that if the bridge interfaces in two core groups go down,
Chapter 7. Best practices and tuning recommendations for large environments 121

the bridge topology will partition. Under normal conditions, the mesh topology is preferred.
7.4.4 Core Group Bridge Service custom properties
You may have to set the following custom properties in intra-cell core group bridges.
IBM_CS_LS_DATASTACK_MEGThis property is applicable to both inter-cell and intra-cell configurations. It can be configured at any of the following levels:
� Access point group: To change the memory setting for all bridge servers in the access point group
� Access point: To change the memory setting for all bridge servers in the access point
� Bridge interface: To change the memory setting for a single bridge interface process
Use this property to increase the amount of memory allocated for core group bridge communication. You typically adjust this property if you see a DCSV2005W message (see Example 7-1) in the log file of your bridge servers. Increase the value of this property until you no longer see the message in your SystemOut.log file.
Example 7-1 DCSV2005W
[9/24/04 13:28:19:497 CDT] 00000013 VSync W DCSV2005W: DCS Stack DefaultAccessPointGroup.P at Member 172.16.1.86:9353: The amount of memory available for synchronization is low.
We recommend you set the value on the access point group because that gives all bridge servers a consistent memory configuration, and because the memory is dynamically allocated, it is not used unless it is needed. Setting the property on a bridge interface overrides any setting on an access point or access point group. Setting the property on an access point overrides any setting on the access point group.
Recommendations for intra-cell bridgingWe recommend the following:
1. Each access point should contain two bridge interfaces.
2. Each bridge interface should be located on a different node.
122 Techniques for Managing Large WebSphere Installations

3. The servers selected to be bridge interfaces require more resources (memory and CPU) than non-bridge servers. Increase the maximum heap size setting on these processes.
4. The best practice for selecting bridge interface processes are as follows:
– 1st choice - select two standalone servers.– 2nd choice - select a standalone server and node agent.– 3rd choice - select two node agents (if available in same core group).– Final option - select any available process.
5. Configure the preferred coordinator list to be the bridge interfaces.
6. Use IBM_CS_WIRE_FORMAT_VERSION = 6.0.2.9 or later if possible.
7. The transport channel chain for the bridge interface must match the core group transport channel chain (for example, DCS or DCS_SECURE).
8. The advantages to following these recommendations are:
– Active coordinator and bridge server functionality are running on well-known processes.
– Active coordinator and bridge server functionality separate from application functionality.
– Process restart after CGBS configuration change is easier and minimized.– Resource configuration of primary and backup active coordinator and
bridge servers is consistent.
9. For intra-cell bridging, the mesh topology is recommended because:
– It is easier to create.– Only one hop between any two core groups minimizes points at which
data must be deserialized.– Communication failures between two core groups do not impact others.
10.The number of bridge interfaces in a single access point group should not exceed 50. Keep this in mind when configuring a mesh topology since this topology will not scale indefinitely.
Chapter 7. Best practices and tuning recommendations for large environments 123
7.5 Recommendations for inter-cell core group bridging
The following sections discuss inter-cell bridge configuration rules, inter-cell bridge configuration, Core Group Bridge Service (CGBS) custom properties, and CGBS security.
7.5.1 Inter-cell bridging configuration rules
The following configuration rules apply to inter-cell bridging:
� All bridged cells must have unique cell names.
� The access point group used for cross-cell bridging must have the same name in all cells. (Conceptually this can be thought of as a single access point group, but it must exist in the configuration of each cell.)
� The access point group for each cell contains one access point from a local core group and one peer access point for a core group located in each remote cell.
� Configure intra-cell bridging first, then inter-cell bridging.
� When bridging across cells, only one access point from a core group in each cell can be configured in the cross-cell access point group. If the cell only has one core group, the cross-cell bridge will be a mesh topology because all the core groups from each cell will be connected using a single access point group.
� If multiple core groups are within a cell, they will be bridged together internally using one access point group, and they will be bridged together across the cells using a second cross-cell access point group (see Figure 7-3 on page 125). The access point for only one core group from each cell will be included in the cross-cell access point group. This implies that when bridging cells that contain multiple core groups, only a “partial mesh” will be configured. Rather than having the access point for every core group contained in the cross-cell access point group, only one core group access point from each cell will be included in the cross-cell access point group.
124 Techniques for Managing Large WebSphere Installations

Figure 7-3 Inter-cell peer communication
7.5.2 Inter-cell bridging configuration
Typically peer access points are used for cross-cell communication. If two cells are located on different networks, a direct connection may not be possible. Proxy peer access points can be used when another cell can act as a proxy. The sections that follow list the steps for configuring peer communication and proxy peer communication.
Peer communicationThe following steps outline the configuration for bridging between cells that are on the same network.
1. For each cell bridge, all local core groups together use a mesh topology.
2. For each cell, select a single core group access point to be used for cross-cell communication and record the following information.
– Cell name– Core group name– Core group access point name– Bridge interface host name and port number for each local bridge server
Chapter 7. Best practices and tuning recommendations for large environments 125

3. The bridge servers for the selected access point is responsible for both intra-cell and inter-cell communication. Therefore, the selected processes must have adequate resources (CPU, memory, and so on) available.
4. For each cell, create a new access point group to be used for cross-cell communication. This access point group must have the same name in each cell.
5. For each cell, add the local access point (selected in step 2 previously) to the newly created cross-cell access point group.
6. The administration console does not let you save an access point group with only one access point, but you cannot create peer access points without having an access point group. We recommend you create and save an access point group with no access points (that is, empty) and then go back and create the desired access points.
7. In the cross-cell access point group, create a peer access point for each remote cell using the information gathered in step 2.
8. Save and synchronize the changes.
9. Restart the core group members in each cell. For non-bootstrap scenarios, restart the bridge interfaces and active coordinators. This step exposes a known CGBS limitation. Normally, you just restart the newly configured bridge servers and the HA manager active coordinator in each core group within each cell. However, in the bootstrap scenario where no server has been restarted since the CGBS configuration was performed, all of the servers in the cell must be restarted at least once. If the other core group servers in the topology are not restarted after the peer access point has been configured, the components on these servers will never be able to subscribe (post) to the new Remote scope that will result from the peer access point definition. Therefore, we currently recommend you stop or restart all core group members in each cell. The CGBS team is working to alleviate this limitation in the future.
Proxy peer communicationThe following steps outline the configuration for a bridge from cell_x to cell_z, going through a proxy cell_y where cell_x and cell_y are on one network and cell_y and cell_z are on another network.
� For each cell configure all your intra-cell core group bridging first.
� Configure a cross cell bridge from cell_x to cell_y.
� Configure a 2nd cross cell bridge from cell_y to cell_z.
� On cell_x create a new Proxy Peer Access point to cell_z (for communication from cell_x to cell_z via cell_y)
126 Techniques for Managing Large WebSphere Installations

� On cell_z create a new Proxy Peer Access point to cell X (for communication from cell_z to cell_x via cell_y)
� Save, synchronize, and restart newly configured bridge servers and the HA manager active coordinator in each core group
See Figure 7-4.
Figure 7-4 Inter-cell proxy peer communication
7.5.3 Core Group Bridge Service custom properties
The following custom properties are applicable to inter-cell topologies.
CGB_ENABLE_602_FEATURESThis access point custom property causes the core stack to be recreated every time a new member joins. This behavior results in severe performance problems in a large topology and should not be used in this situation.
IBM_CS_LS_DATASTACK_MEGSee “IBM_CS_LS_DATASTACK_MEG” on page 122.
Chapter 7. Best practices and tuning recommendations for large environments 127

FW_PASSIVE_MEMBER This is an access point custom property. It configures bridge interfaces within a given access point to be in listen-only mode. Use this property in a core group bridge configuration when a firewall is between the core groups, and the secure side of the firewall is configured to listen only. The existence of the property enables the function. Refer to Figure 7-5
Figure 7-5 Custom property FW_PASSIVE_MEMBER
7.5.4 Core Group Bridge Service security
When global security is enabled, bridges in a single cell do not pose a problem. However, bridges that cross cells require extra security configuration.
Security and cross-cell bridging require the following:
� Having the same user registry in both cells
� Exporting Lightweight Third Party Authentication (LTPA) keys
� Importing LTPA keys
� Enabling single sign-on (SSO)
See the following URLs for additional information:
� WebSphere Information Center - Managing LTPA keys from multiple WebSphere Application Server cells:
http://publib.boulder.ibm.com/infocenter/wasinfo/v6r1/index.jsp?topic=/com.ibm.websphere.nd.doc/info/ae/ae/tsec_sslmanagelptakeys.html
128 Techniques for Managing Large WebSphere Installations

� Section 2.8.1 in WebSphere Application Server Network Deployment V6: High Availability Solutions:
http://publib-b.boulder.ibm.com/Redbooks.nsf/RedpieceAbstracts/sg246688.html?Open
7.6 Recommendations for system management components
Section 5.4.4, “System management components” on page 73 in Chapter 5, “Design considerations for large environments” on page 61, addresses the issues posed by system management components in large environments.
The implications of the system administration design are:
� Wildcard queries (“*.*”) require sending a message to every JVM in the cell.
� Wildcard event registration results in receiving messages from every JVM in the cell.
� No constraint is currently on (any component code or user) issuing a “wide” JMX query.
– Console event notification example– User scripts– PMI initialization
� Timing issues between Deployment Manager and node agents; node agents and application servers can cause undesirable, unexpected bouncing of processes.
Recommendations for system managementWe recommend the following:
1. Always make JMX queries as narrow as possible.
2. Do not register to receive every event in the entire cell.
3. Code change to protect Deployment Manager from JMX notification overload.
4. “Retune” timing settings between processes as a cell grows.
– Node synchronization interval– Application server “ping” interval
Chapter 7. Best practices and tuning recommendations for large environments 129

7.7 Recommendations for security components
Section 5.4.5, “Security components” on page 76 in Chapter 5, “Design considerations for large environments” on page 61, discusses some of the issues facing large topologies from a security standpoint. The following sections provide security best practice recommendations for large environments.
7.7.1 Performance fixes
Significant security performance and scalability improvements have been incorporated in to WebSphere Application Server V6.0.2.17 and V6.1.0.9 fix packs. (The APAR that has these significant improvements is PK43270.) We recommend that customers upgrade to these service levels as soon as practical to obtain the security benefits of these fixes.
7.7.2 Java 2 security
When using Java 2 security, new tuning parameters are introduced in WebSphere Application Server V6.1.0.9 (APAR PK43270) that can significantly improve performance. These new parameters introduce a concept called Read-only Subject, which introduces a new cache for J2C Auth Subjects. If the J2C Auth Subject is not modified after it is created, these tuning parameters can be used to improve Java 2 security performance.
The following parameters can be added through custom properties on the security main page from administration console:
� com.ibm.websphere.security.auth.j2c.cacheReadOnlyAuthDataSubjects=true
� com.ibm.websphere.security.auth.j2c.readOnlyAuthDataSubjectCacheSize=50
This is the maximum number of subjects in the hash table of the cache. Once the cache reaches this size, some of the entries will be purged. For better performance, this size should be equal to the number of unique subjects (users).
7.7.3 Authentication
The main issues are:
� The most significant impact on a large topology from a security standpoint is how frequently the user registry is accessed during a login. You can reduce or eliminate registry accesses after the initial login by using security attribute propagation, the authentication cache, hash table attribute assertion, and so on.
130 Techniques for Managing Large WebSphere Installations

� Another major issue is related to thread contention, which is not purely a security issue but has a major impact when security is enabled. When too many threads execute in a single JVM, it is a better practice to create additional JVMs to more evenly spread the workload. This practice improves throughput tremendously from our performance analysis.
For more information, see the article “Advanced Authentication in WebSphere Application Server” at
http://www.ibm.com/developerworks/websphere/techjournal/0508_benantar/0508_benantar.html
The following recommendations can theoretically improve throughput or reduce problems in a large topology:
� When using a proxy server to perform the primary authentication of users, make sure the associated Trust Association Interceptor (TAI) asserts the user to WebSphere Application Server (via a hash table in the TAI subject) to prevent a double login for the same user request.
� We recommend you use downstream propagation to reduce registry overload. Propagation sends all the Subject attributes to downstream servers for reuse without needing to access the registry at each server hop.
� We recommend you add front-end applications servers to a common DRS replication domain to ensure subjects get propagated to other front-end servers for reuse (preventing additional user registry accesses). When running stress tests with SSO enabled, test throughput while both enabling and disabling the setting “Web inbound security attribute propagation” (horizontal propagation). In some environments, horizontal propagation can improve throughput by reducing registry access. However, in other cases, it slows it down due to the encryption and decryption costs.
� It is a best practice to increase the cache timeout if users tend to re-authenticate frequently. Make the timeout larger than the 10-minute default but not so large that the user population causes heap problems. For very high login rates, reduce the cache timeout to prevent extremely large cache growth causing heap issues.
� Be careful not to assign users to too many registry groups. This increases the size of each authenticated user Subject and causes more strain on the registry. Use registry groups, but do not overuse them.
� Ensure multiple Lightweight Directory Access Protocol (LDAP) replicas are in use either through an IP sprayer, using multiple LDAP endpoints for failover or using the logical realm property to define multiple LDAP servers to handle requests across the topology. Optionally, create a custom registry that will authenticate to multiple LDAP servers or remote DBs, which can spread the traffic around.
Chapter 7. Best practices and tuning recommendations for large environments 131

� Take advantage of the internal server ID feature to prevent administrative system outages if LDAP goes down (WebSphere Application Server V6.1 and later).
� Distributing the workload to multiple JVMs instead of a single JVM on a single machine can improve the security performance due to less contention for authorization decisions
� To improve the performance of security attribute propagation, new tuning parameters have been introduced in WebSphere Application Server V6.1.0.9 (through APAR PK43270). By using these tuning parameters, which can be set through custom properties from the security panel on the administration console, the extra overhead of security attribute propagation can be almost eliminated
– com.ibm.CSI.propagateFirstCallerOnly=true
– com.ibm.CSI.disablePropagationCallerList=true
� We recommend you use a clock synchronization service to synchronize system clocks as closely as possible. Security processing depends on time stamp validation, and clocks out of sync more than five minutes can have an impact on performance due to unnecessary reauthentication and retry processing.
� If WebSphere Application Server security is only used to protect administrative access, we recommend you disable application security so that the collaborators do not perform actions that may impact throughput.
7.7.4 Authorization
Best practice recommendations for authorization security scaling include:
� Take advantage of GROUP mappings to reduce the size of authorization tables. Associate GROUPS to ROLES rather than USERS to ROLES, whenever possible.
� Using a third-party authorization provider can simplify resource controls where large amounts of applications are managed.
132 Techniques for Managing Large WebSphere Installations
7.7.5 SSL
Secure Sockets Layer (SSL) has major improvements in WebSphere Application Server V6.1:
� We recommend you use certificates that are signed by a certificate authority (CA - preferably an internal CA for internal communications) whenever possible. This reduces the number of signers needed in a trust store and allows replacement of a personal certificate without ramifications to clients.
� SSL offload devices can be used to reduce the SSL overhead for Internet- and intranet-facing applications. Enabling KeepAlive helps reduce the number of SSL handshakes, which tends to be the most significant SSL overhead. While SSL does have an overhead, we do not recommend disabling SSL in favor of performance because of the security implications. SSL adds message confidentiality and integrity, and prevents man-in-the-middle attacks when configured properly.
� Another best practice is to manage file-based keystores in the Deployment Manager repository using the built-in administration console or scripting commands (V6.1 and later). And manage the plugin keystore using the built-in administration console or scripting commands.
For more information, see the following developerWorks article:
developerWorks: SSL, certificate, and key management enhancements for even stronger security in WebSphere Application Server V6.1
http://www.ibm.com/developerworks/websphere/techjournal/0612_birk/0612_birk.html
Recommendations for security components We recommend the following:
1. When using a proxy server to perform the primary authentication of users, make sure the associated TAI asserts the user to WebSphere Application Server to prevent a double login for the same user request
2. When WebSphere Application Server V6.1.0.9 is available, use new tuning parameters for security attribute propagation.
– com.ibm.CSI.propagateFirstCallerOnly=true– com.ibm.CSI.disablePropagationCallerList=true
3. Enabling KeepAlive helps reduce the number of SSL handshakes, which tend to be the most significant SSL overhead.
Chapter 7. Best practices and tuning recommendations for large environments 133

Note: This chapter provides recommendations and guidelines but is not intended to be a guarantee of product performance or imply any warranty for product behavior.
134 Techniques for Managing Large WebSphere Installations

Chapter 8. Planning for a large cell migration
High availability manager (HA manager) and core group functionality is provided in WebSphere Application Server Version 6 and later. This chapter discusses core group configuration and topology considerations that might impact your migration if you are migrating from a version of WebSphere Application Server, such as Version 5.x, that does not contain this functionality. This chapter walks you through a detailed migration flow of a sample large cell migration from Version 5.x to Version 6.x. The example also addresses the migration plan and various planning considerations for such a migration.
In this chapter, the following topics are discussed:
� 8.1, “Core group migration considerations” on page 136� 8.2, “Default core group-related migration activities” on page 136� 8.3, “Planning the core group topology” on page 137� 8.4, “Example: A large cell migration” on page 138
8
© Copyright IBM Corp. 2008. All rights reserved. 135
8.1 Core group migration considerations
Special planning and migration activities might be required for your environment before migrating from a version of WebSphere Application Server that does not have the HA manager to one that does. Before migration you should know the answers to the following questions:
� What is the appropriate core group configuration and topology for a cell after it is fully migrated to Version 6.x?
� In a mixed environment, is the Version 5.x cell configured to use memory-to-memory replication? If so, how is the replication environment migrated? How is the replication affected during the migration process?
� Which, if any, JMS provider is used in the Version 5.x cell?
� Which, if any, JMS provider is used in the Version 6.x cell?
� If the Version 6.x default IBM messaging provider is to be used in the Version 6.x cell, should the messaging provider be configured to be made highly available?
� Should transaction log recovery be configured in the Version 6.x cell?
8.2 Default core group-related migration activities
Core group-related activities that are automatically performed during the migration process are relatively simple and straightforward. When you migrate from a Version 5.x environment to a Version 6.x environment, the following actions occur in the indicated order:
1. The Deployment Manager is migrated to Version 6.x.
2. During the migration process, a Version 6.x Deployment Manager profile and a core group named DefaultCoreGroup is created.
3. The new Deployment Manager process is added to DefaultCoreGroup.
4. Version 5.x nodes are migrated one by one to Version 6.x. As each of the nodes is migrated, the node agent and the application servers on the migrating node are added to the DefaultCoreGroup.
When the migration finishes, all of the processes in the Version 5.x cell are members of the Version 6.x DefaultCoreGroup. Because the DefaultCoreGroup is configured with the default values for all settings, the migration process does not configure preferred coordinator servers and does not partition the coordinator across multiple servers. In addition, the migration process does not create new
136 Techniques for Managing Large WebSphere Installations

high availability policies and does not provide for any custom property configuration overrides.
8.3 Planning the core group topology
For most Version 5.x topologies, a default migration yields an appropriate and workable Version 6.x core group topology. In some cases, you might need to make minor changes to the topology, such as setting a non-default transport or configuring the core group for replication. If the Version 5.x cell is large enough to require multiple core groups in the Version 6.x topology, more planning should be done before you start the migration process to prevent application outages from occurring when you make your core group configuration changes.
Migrating a large Version 5.x cell to Version 6.x, where multiple core groups are required, can be a complex task. When the Version 6.x topology requires multiple core groups, you have a number of options as to how and when to partition the cell into multiple core groups. The approach you take should be based on such factors as the number of processes in the cell and requirements for continuous application availability. For example, while the normal recommendation is to limit core groups at around 50 members, the practical limit is somewhat higher than 50. For topologies with a small number of applications installed on high-end machines (large CPUs with a lot of memory), you might be able to have core groups of up to 100 members. If the cell contains 100 processes and application availability is not an issue, one option might be to simply migrate the entire cell to Version 6.x and then create additional core groups. If application availability is an issue, you should create additional core groups during the migration process so that you do not have to stop and restart core group members after the migration process completes.
8.3.1 Core group size
The most important planning consideration is the size of your core group. By default, there is normally one core group per cell. Because core groups do not scale to large sizes, if your Version 5.x cell is large, you might want to create additional core groups for your Version 6.x topology. You might also need to set up core group bridging if these multiple core groups need to communicate with each other.
Chapter 8. Planning for a large cell migration 137

8.3.2 Core group transport
If a change is made to the core group transport configuration, all core group members must be restarted before the change goes into affect. Therefore, planning is required to minimize the effect of changing the transport. If the transport for the DefaultCoreGroup is changed, the best time to change it is immediately after migrating the Deployment Manager, since at that point in time only the Deployment Manager has to be restarted. If other core groups are created, the transport should be configured properly as the new core groups are created.
8.3.3 Custom property configuration overrides
A number of core group configuration parameters can be changed via custom property overrides.
Whenever a custom property override is added, removed, or changed, all core group members must be restarted to pick up the change. Therefore, planning is required to minimize the effect of changing the custom properties. If the custom properties must be changed for the DefaultCoreGroup, the best time to change them is immediately after migrating the Deployment Manager. If other core groups are created, the custom properties should be changed as the new core groups are created.
8.3.4 Core group coordinator
Configuring preferred coordinator servers is a best practice. Since the HA manager can dynamically reread and apply core group coordinator configuration changes, a restart of all core group members to pick up this change is not required.
8.4 Example: A large cell migration
The example described in this section describes the issues that you should consider as you plan for and execute the migration of a large Version 5.x cell to Version 6.x, where multiple core groups are required.
138 Techniques for Managing Large WebSphere Installations
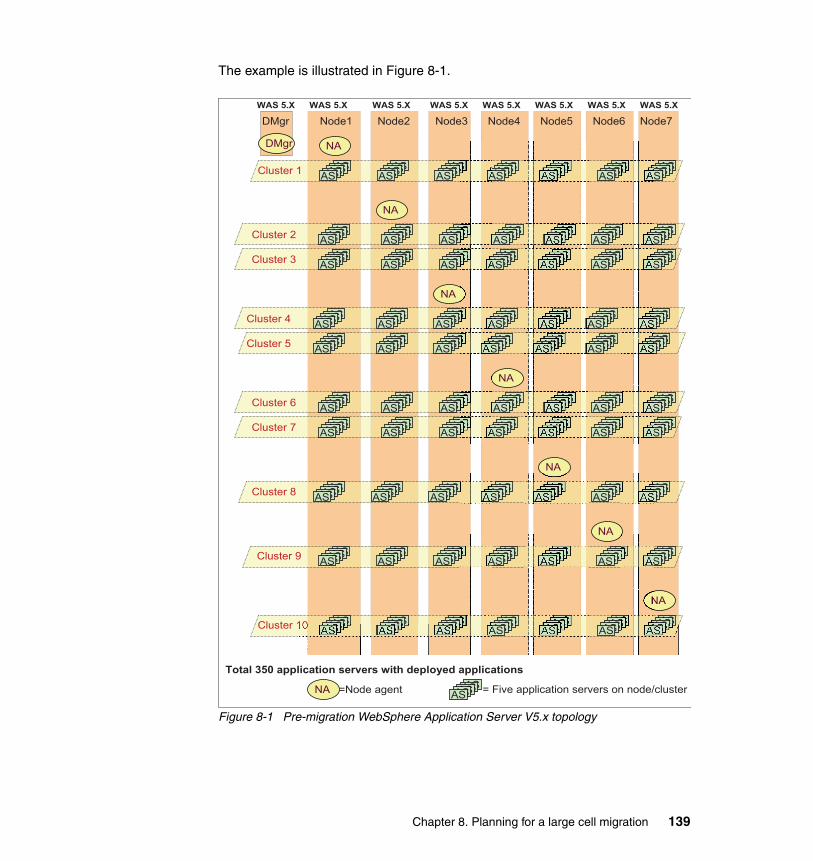
The example is illustrated in Figure 8-1.
Figure 8-1 Pre-migration WebSphere Application Server V5.x topology
Node7Node6Node5Node4Node3Node2Node1DMgr
= Five application servers on node/cluster=Node agent
Total 350 application servers with deployed applications
Cluster 9
NA
ASASASASASASASASASAS
ASASASASASASASASASAS
ASASASASASASASASASAS
ASASASASAS
Cluster 3
Cluster 2
NA
ASASASASASASASASASAS
ASASASASASASASASASAS
ASASASASASASASASASAS
ASASASASASASASASASAS
ASASASASASASASASASAS
ASASASASASASASASASAS
ASASASASASASASASASAS
Cluster 5
Cluster 4
NA
ASASASASASASASASASAS
ASASASASASASASASASAS
ASASASASASASASASASAS
ASASASASASASASASASAS
ASASASASASASASASASAS
ASASASASASASASASASAS
ASASASASASASASASASAS
Cluster 7
Cluster 6
NA
ASASASASASASASASASAS
ASASASASASASASASASAS
ASASASASASASASASASAS
ASASASASASASASASASAS
ASASASASASASASASASAS
ASASASASASASASASASAS
ASASASASASASASASASAS
Cluster 8
NA
ASASASASASASASASASAS
ASASASASASASASASASAS
ASASASASASASASASASAS
ASASASASAS
Cluster 10
NA
ASASASASASASASASASAS
ASASASASASASASASASAS
ASASASASASASASASASAS
ASASASASAS
Cluster 1
NA
ASASASASASASASASASAS
ASASASASASASASASASAS
ASASASASASASASASASAS
ASASASASAS
NA ASASASASAS
WAS 5.X WAS 5.X WAS 5.X WAS 5.X WAS 5.XWAS 5.XWAS 5.XWAS 5.X
DMgr
Chapter 8. Planning for a large cell migration 139

In this example, assume your Version 5.x cell has the following topology characteristics:
� The cell contains seven nodes that are named Node1, Node2, Node3, and so on to Node7, not including the Deployment Manager node. The Deployment Manager is on a separate node by itself.
� The cell contains ten clusters named Cluster 1, Cluster 2, Cluster 3, and so on through Cluster 10.
� Cluster 1 through Cluster 10 each contains 35 application servers. The cluster members for these clusters are distributed symmetrically, five application servers per node, across all nodes
� A total of 350 application servers, seven node agents, and a Deployment Manager are in the cell.
� Each cluster has an application deployed to it that uses EJBs. and these applications can communicate with each other. Therefore, Workload Management (WLM) routing information must be available everywhere in the cell.
� Applications must be continuously available during the migration.
� The migration is performed over a period of days or weeks.
The first consideration in planning the Version 6.x core group topology is that this cell contains 358 processes, and that continuous availability of applications is a requirement. These factors prevent us from simply migrating the entire cell and then reconfiguring the core groups. You must distribute the processes contained in the cell among multiple core groups as part of the migration process.
When determining how you want to distribute the V5.x cell processes among the new core group, make sure that each core group adheres to the following core group rules:
� Each core group must contain at least one administrative processes. Because the cell in this example has eight administrative processes, seven node agents, and the Deployment Manager, the maximum number of core groups possible in this topology is eight. Note that it is possible to increase the number of core groups by creating phantom nodes. However, we will assume it is not needed for our scenario.
Note: The material in this section is based on the paper Migrating a large cell from WebSphere Application Server Network Deployment (ND) V5.x to V6.x with HA Manager Considerations. This paper will be published in the IBM Developer Technical Journal in the near future.
140 Techniques for Managing Large WebSphere Installations

� All members of a cluster must be members of the same core group.
� The number of processes contained in each core group should not exceed the recommended size of approximately 50 members.
Follow these rules for this example:
� Three of the core groups must contain two clusters because you can only split the cell into a maximum of eight core groups, and the V5.x cell has ten clusters.
� Any of the core groups that contain multiple clusters will have more than 50 members because each cluster contains 35 application servers,
While the number of members in at least one core group will exceed the recommended limit, the number of members is well within the practical limit and should not create a problem.
Because the applications in this example require the WLM routing information for each cluster contained in the cell, core group bridging must be set up to enable communication between all of the core groups. An appropriate core group bridge topology for this example includes:
� A core group access point for each core group. Each access point contains the set of processes that provide the bridge interfaces for the core group. The bridge interfaces are the processes that actually communicate with processes in other core groups.
� Two bridge interfaces for each access point to eliminate the core group bridge as a single point of failure. These two bridge interfaces are also placed on different nodes to further ensure continual availability.
When you select processes to serve as the bridge interfaces, remember that bridge interfaces need extra memory and CPU cycles. Normally node agents are good processes to use as bridge interfaces because during normal operations, a node agent has a lower workload than an application server or the Deployment Manager.
However, only seven node agents are available to serve as bridge interfaces in this example. Because the topology wants two bridge interfaces per access point, if you only use node agents as bridge interfaces, you are limited to three access points and subsequently three core groups. Therefore, before starting the migration process, you might want to create seven standalone servers to specifically act as bridge interfaces and that do not host applications. Then each access point can contain one node agent and one standalone bridge interface server. This setup gives you a total of seven access points and seven core groups.
Chapter 8. Planning for a large cell migration 141

� We recommend a single core group access point group that contains all of the access points. A single core group access point group ensures that all bridge interface processes can communicate directly. These bridge interfaces form a fully connected mesh.
An alternative topology is to use multiple access point groups, which results in a chain topology. In a chain topology, communication is forwarded from one bridge interface to another through intermediate bridge interfaces along the chain.
Now that you have determined the setup for your core group bridge interfaces, you are ready to decide how to distribute the ten clusters, seven node agents, seven standalone bridge interface servers, and the Deployment Manager across your seven core groups. You want to distribute the processes as evenly as possible across the seven core groups. The following topology is a good example of how to evenly distribute the process contained in the V5.x cell:
� The first core group, Core Group 1, contains the Deployment Manager, the node agent from Node1, the bridge server from Node7, and Cluster 1.
� Core Group 2 contains the node agent from Node2, the bridge server from Node1, Cluster 2, and Cluster 3.
� Core Group 3 contains the node agent from Node3, the bridge server from Node2, Cluster 4, and Cluster 5.
� Core Group 4 contains the node agent from Node4, the bridge server from Node3, Cluster 6, and Cluster 7.
� Core Group 5 contains the node agent from Node5, the bridge server from Node4, and Cluster 8.
� Core Group 6 contains the node agent from Node6, the bridge server from Node5, and Cluster 9.
� Core Group 7 contains the node agent from Node7, the bridge server from Node6, and Cluster 10.
� We recommend a single core group access point group that contains all of the access points in a intra-cell bridging mesh topology.
142 Techniques for Managing Large WebSphere Installations

Figure 8-2 depicts the post-migration topology.
Figure 8-2 Post-migration WebSphere Application Server 6.x topology
The default transport in this example does not need to change.
Node7Node6Node5Node4Node3Node2Node1DMgr
Total 350 application servers with deployed applications
Cluster 9 ASASASASASASASASASAS
ASASASASASASASASAS
ASASASASAS
Cluster 3
Cluster 2 ASASASASASASASASASAS
ASAS ASASASASASASASASASAS
ASASASASASASASASASAS
ASASASASASASASASASAS
ASASASASASASASASASAS
ASASASASASASASASASAS
Cluster 5
Cluster 4 ASASASASASASASASASAS
ASASASASASASASASASAS
ASASASASASASASASASAS
ASASASASASASASASASAS
ASASASASAS
Cluster 7
Cluster 6 ASASASASASASASASASAS
ASASASASASASASASASAS
ASASASASASASASASASAS
ASASASASASASASASASAS
ASASASASAS
Cluster 8 ASASASASASASASASASAS
ASASASASASASASASASAS
ASASASASAS
Cluster 10 ASASASASASASASASASAS
ASASASASASASASASASAS
ASASASASAS
Cluster 1 ASASASASASASASASASAS
ASASASASASASASAS
ASASASASASASASASASAS
ASASASASAS
WAS 6.X WAS 6.X WAS 6.X WAS 6.X WAS 6.X WAS 6.X WAS 6.X WAS 6.X
= Five application servers on node/cluster=Node agentNA BI ASASASASAS=Bridge interface
ASASASASAS
ASASASASASASASASASAS
ASASASASASASASASASAS
ASASASASAS
S
ASASASASAS
ASASASASAS
ASS
uste ASASASASASAASASASAS
de1
AP
G
APG=Access point group
DMgr
Cor
eGro
up3
Cor
eGro
up1
Cor
eGro
up2
Cor
eGro
up4
Cor
eGro
up5
Cor
eGro
up6
Cor
eGro
up7
NABI
BI NA
BI NA
BI NA
NABI
NABI
NA BI
Chapter 8. Planning for a large cell migration 143

Because the example illustrated in Figure 8-2 on page 143 does not indicate that you need more than one coordinator per core group, you can leave the coordinator setting at the default value of 1. However, you might want to make the standalone bridge interface server, which is contained in each core group, the preferred coordinator server for that core group. This designation initially keeps the coordinator’s required workload away from the clustered application servers that are running applications.
8.4.1 Large cell migration plan
If, after reviewing the preceding example and completing the initial planning process for the cell you are migrating, you determine that the default migration flow is not appropriate for your target Version 6.x topology, it is time to develop a plan or a road map for the actual migration process. This plan should include all necessary extra core group-related steps for migrating from Version 5.x to Version 6.x., and it should provide answers to the questions in the sections that follow.
When will you create the new core groups?The best time to create the new core groups is immediately after the Deployment Manager migration completes. As the new core groups are created, you should configure the previously mentioned custom properties. You can use either the administration console or the createCoreGroup wsadmin command to create your new core groups. However, you must use the administration console to configure the custom properties.
What actions must you perform as nodes are migrated?As each node is migrated, you should:
� Create the new standalone application server that is to be one of your core group bridge interfaces.
� Adjust the transport buffer size on all processes on the node. A script is the best option for performing this action.
� Adjust the heap size on the node agent and the standalone server, and turn on verbose GC for these processes.
All of these changes must be completed before you restart the migrated node. You can use the administration console to make these changes and then perform a manual synchronization of the nodes configuration before restarting the node agent and application servers.
144 Techniques for Managing Large WebSphere Installations

When and how are processes moved to new core groups?By default, the migration process places all processes in the DefaultCoreGroup core group. At some point in time, the number of members contained in this core group will exceed the size limits, and you must redistribute the processes to other core groups. It is important to understand that the processes must be stopped before they can be moved. If continuous application availability is required, you must carefully plan the order in which you will move the processes to different core groups.
You can use either the administration console or the moveServerToCoreGroup wsadmin command to move the Deployment Manager, node agents, and standalone application server.
Moving clustered application servers is more complicated. Under normal circumstances, you can use either the administration console or the moveServerToCoreGroup wsadmin command to move clusters. However, during the migration process, because the cluster to be moved might have both Version 6.x and Version 5.x members, the normal commands fail because a Version 5.x cluster member is not yet a member of any core group. To move a mixed cluster to a new core group, you must use the moveClusterToCoreGroup wsadmin command with the optional checkConfig parameter.
For example, suppose Cluster0 has cluster members A, B, C, and D. Member A is on a node that has been migrated to Version 6.x and is a member of the DefaultCoreGroup, while B, C, and D are still on Version 5.x nodes. To move Cluster0 to core group CG1, use the command shown in Example 8-1.
Example 8-1 Move cluster to core group
$AdminTask moveClusterToCoreGroup {-source CoreGroup1 –target CG1 –clusterName Cluster0 –checkConfig false}
When a clustered application server is migrated, the migration utilities determine whether other cluster members have already been migrated and automatically place the migrating members in the same core groups as other members of the same cluster that are already migrated.
In Example 8-1, member A was moved to core group CG1. When the nodes containing B, C, and D are migrated, migration places these cluster members in CG1 instead of the DefaultCoreGroup. Therefore, it is necessary to run the moveClusterToCoreGroup command only once for each cluster.
Chapter 8. Planning for a large cell migration 145

When must you configure core group bridging?By the time you move your processes to multiple core groups, you must have core group bridging configured and running. This means that the processes that you want to use as bridge interfaces in your Version 6.x target topology might not be available when they are initially needed because they have not been migrated from the Version 5.x nodes. Therefore, to ensure continual availability of your applications, you must configure some clustered application servers to be temporary bridge interfaces while the migration continues. After all of the processes have been migrated to Version 6.x, you can adjust the core group bridge configuration to match your desired Version 6.x topology.
8.4.2 Other planning considerations
If your target Version 6.x configuration requires multiple core group bridges, use the IBM_CS_WIRE_FORMAT_VERSION core group custom property to implement scaling improvements.
In addition, if all of your core groups are bridged together and routing shared information among each other, the amount of data shared among the core group members is likely to be much larger than normal. Therefore, you should use the following settings to increase the core group memory settings to enable a more efficient transfer of data:
� Set the IBM_CS_DATASTACK_MEG to 100.
� Set the transport buffer size on all processes to 100.
You should also consider adjusting such factors such as JVM heap sizes for any node agent or application server that is being used as a bridge interface, and any standalone server that is being used as a coordinator. A recommended starting point is to increase the heap size between 512 MB to 1024 MB for large topologies. You can also turn on verbose GC monitoring for these processes so that you can fine-tune the heap sizes over time.
8.4.3 Migration flow
During migration we temporarily bend the rules so that we do not have to stop application servers that are running to move them to a different core group. While the migration is in progress, some core groups will not contain an administrative process for some period of time. This is a technical violation of the rules but is acceptable as long as the core group configuration is not changed while the migration is in progress.
146 Techniques for Managing Large WebSphere Installations
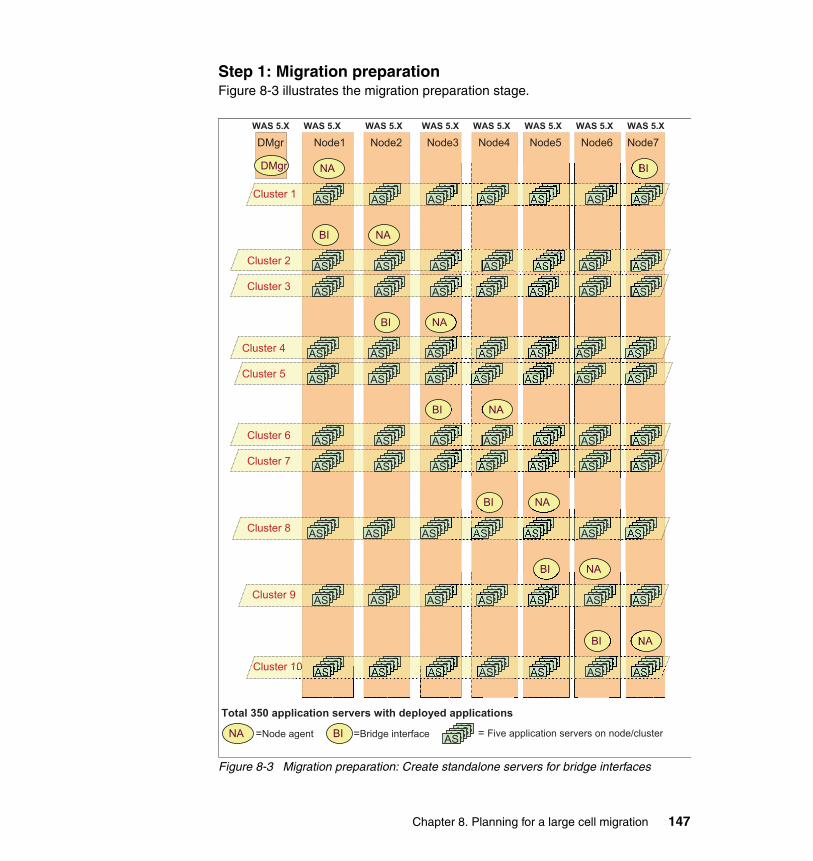
Step 1: Migration preparationFigure 8-3 illustrates the migration preparation stage.
Figure 8-3 Migration preparation: Create standalone servers for bridge interfaces
Node7Node6Node5Node4Node3Node2Node1DMgr
= Five application servers on node/cluster=Node agent
Total 350 application servers with deployed applications
Cluster 9
NABI
ASASASASASASASASASAS
ASASASASASASASASASAS
ASASASASASASASASASAS
ASASASASAS
Cluster 3
Cluster 2
NA
ASASASASASASASASASAS
ASASASASASASASASASAS
ASASASASASASASASASAS
ASASASASASASASASASAS
ASASASASASASASASASAS
ASASASASASASASASASAS
ASASASASASASASASASAS
Cluster 5
Cluster 4
BI NA
ASASASASASASASASASAS
ASASASASASASASASASAS
ASASASASASASASASASAS
ASASASASASASASASASAS
ASASASASASASASASASAS
ASASASASASASASASASAS
ASASASASASASASASASAS
Cluster 7
Cluster 6
BI NA
ASASASASASASASASASAS
ASASASASASASASASASAS
ASASASASASASASASASAS
ASASASASASASASASASAS
ASASASASASASASASASAS
ASASASASASASASASASAS
ASASASASASASASASASAS
Cluster 8
NABI
ASASASASASASASASASAS
ASASASASASASASASASAS
ASASASASASASASASASAS
ASASASASAS
Cluster 10
NABI
ASASASASASASASASASAS
ASASASASASASASASASAS
ASASASASASASASASASAS
ASASASASAS
Cluster 1
NA BI
ASASASASASASASASASAS
ASASASASASASASASASAS
ASASASASASASASASASAS
ASASASASAS
NA BI ASASASASAS=Bridge interface
BI
WAS 5.X WAS 5.X WAS 5.X WAS 5.X WAS 5.XWAS 5.XWAS 5.XWAS 5.X
DMgr
Chapter 8. Planning for a large cell migration 147

We recommend you make the following preparations:
� Create new standalone application servers (labeled “BI” in Figure 8-3 on page 147) on each node that serve as bridge interfaces for your core groups after migration.
� Increase the heap size on the Deployment Manager (“DMgr” in the figure) to 1024 (1 GB). Restart the Deployment Manager for the change to take effect.
148 Techniques for Managing Large WebSphere Installations

Step 2: Migrate Deployment ManagerFigure 8-4 illustrates the migration of the Deployment Manager.
Figure 8-4 Migration of Deployment Manager
Node7Node6Node5Node4Node3Node2Node1
= Five application servers on node/cluster=Node agent
Total 350 application servers with deployed applications
Cluster 9
NABI
ASASASASASASASASASAS
ASASASASASASASASASAS
ASASASASASASASASASAS
ASASASASAS
Cluster 3
Cluster 2
NA
ASASASASASASASASASAS
ASASASASASASASASASAS
ASASASASASASASASASAS
ASASASASASASASASASAS
ASASASASASASASASASAS
ASASASASASASASASASAS
ASASASASASASASASASAS
Cluster 5
Cluster 4
BI NA
ASASASASASASASASASAS
ASASASASASASASASASAS
ASASASASASASASASASAS
ASASASASASASASASASAS
ASASASASASASASASASAS
ASASASASASASASASASAS
ASASASASASASASASASAS
Cluster 7
Cluster 6
BI NA
ASASASASASASASASASAS
ASASASASASASASASASAS
ASASASASASASASASASAS
ASASASASASASASASASAS
ASASASASASASASASASAS
ASASASASASASASASASAS
ASASASASASASASASASAS
Cluster 8
NABI
ASASASASASASASASASAS
ASASASASASASASASASAS
ASASASASASASASASASAS
ASASASASAS
Cluster 10
NABI
ASASASASASASASASASAS
ASASASASASASASASASAS
ASASASASASASASASASAS
ASASASASAS
Cluster 1
NA BI
ASASASASASASASASASAS
ASASASASASASASASASAS
ASASASASASASASASASAS
ASASASASAS
NA BI ASASASASAS=Bridge interface
BID
efau
ltCor
eGro
up WAS 5.X WAS 5.X WAS 5.X WAS 5.X WAS 5.XWAS 5.XWAS 5.XWAS 6.X
DMgr
Chapter 8. Planning for a large cell migration 149

Figure 8-4 on page 149 illustrates the following aspects of the Deployment Manager migration:
� After the migration, the V6.x Deployment Manager is added to the DefaultCoreGroup. For our configuration, we create seven new core groups (CoreGroup 1 to CoreGroup 7) right after the migration of the Deployment Manager. On the average, less than 50 processes are grouped in one core group.
� Several WebSphere Application Server parameters must be modified or added for each core group that is created. Make the following changes:
– Set IBM_CS_DATASTACK_MEG to 100.
This custom property controls the maximum amount of heap memory that the underlying core group transport can allocate. This memory is used for in-flight messages and network communication buffers. A setting of 100 MB is sufficient for most high-throughput topologies).
– Set IBM_CS_WIRE_FORMAT_VERSION core group custom property to implement scaling improvements.
You can verify the preceding changes in the application server SystemOut.log or from the WebSphere Application Server Administration Console.
� Adjust the transport buffer size on all processes on the Deployment Manager node to 100. A script is the best option for performing this action.
� Move the Deployment Manager from the DefaultCoreGroup to CoreGroup 1. Save and run Synchronize changes with nodes.
150 Techniques for Managing Large WebSphere Installations

Step 3: Migrate Node1Figure 8-5 depicts the migration of Node1.
Figure 8-5 Post-Node1 migration
Cor
eGro
up3
Cor
eGro
up1
Cor
eGro
up2
Cor
eGro
up4
Cor
eGro
up5
Node7Node6Node5Node4Node3Node2Node1DMgr
Cor
eGro
up6
Total 350 application servers with deployed applications
Cluster 9
NA
Cluster 9
BI
ASASASASASASASASASAS
ASASASASASASASASASAS
ASASASASASASASASASAS
ASASASASAS
Cluster 3
Cluster 2
Cluster 3
Cluster 2
BI NA
ASASASASASASASASASAS
ASASASASASASASASASAS
ASASASASASASASASASAS
ASASASASASASASASASAS
ASASASASASASASASASAS
ASASASASASASASASASAS
ASASASASASASASASASAS
Cluster 5
Cluster 4
Cluster 5
Cluster 4
BI NA
ASASASASASASASASASAS
ASASASASASASASASASAS
ASASASASASASASASASAS
ASASASASASASASASASAS
ASASASASASASASASASAS
ASASASASASASASASASAS
ASASASASASASASASASAS
Cluster 7
Cluster 6
Cluster
Cluster
BI NA
ASASASASASASASASASAS
ASASASASASASASASASAS
ASASASASASASASASASAS
ASASASASASASASASASAS
ASASASASASASASASASAS
ASASASASASASASASASAS
ASASASASASASASASASAS
Cluster 8
NA
Cluster
BI
ASASASASASASASASASAS
ASASASASASASASASASAS
ASASASASASASASASASAS
ASASASASAS
Cluster 10
NA
Cluster 10r
BI
ASASASASASASASASASAS
ASASASASASASASASASAS
ASASASASASASASASASAS
ASASASASAS
Cluster 1
NA
Cluster 1
NA BI
ASASASASASASASASASAS
ASASASASASASASASASAS
ASASASASASASASASASAS
ASASASASAS
Cor
eGro
up7
WAS 6.X WAS 6.X WAS 5.X WAS 5.X WAS 5.X WAS 5.X WAS 5.X WAS 5.X
= Five application servers on node/cluster=Node agentNA BI ASASASASAS=Bridge interface
DMgr
Chapter 8. Planning for a large cell migration 151

Figure 8-5 on page 151 illustrates the following aspects of the Node1 migration:
� After the migration of Node2, adjust the transport buffer size to 100 on all Node2 processes. A script is the best option for performing this action.
� Node1 contains members from all clusters. One of the core group rules is that all members of a cluster must be members of the same core group. It is crucial to arrange your core group members the way that you want them to be on the first migrated node. The arrangement of the application servers in each core group on the first migrated node impacts the rest of the cluster members on the following migrated nodes. Once you arrange the application servers to the desired core groups, all application servers belonging to the same cluster will be added in the same core group during the node migration processes that follow.
� Arrange application servers among different core groups on Node1. You can use the administration console to move cluster members to different core groups. (Select Servers → Core groups → Core group settings → core_group_name → Core group servers.) However, all custom cluster members have to be moved to the same core group.
� Also, you can use wsadmin.sh to move the cluster members to the desired core groups.
$AdminTask moveClusterToCoreGroup {-source DefaultCoreGroup -target CoreGroupname -checkConfig false}$AdminConfig save
� For this example, we distribute our application servers on Node1 among newly created core groups as follows:
– Move application servers in Cluster 1 to CoreGroup 1. – Move application servers in Cluster 2 and Cluster 3 to CoreGroup 2.– Move application servers in Cluster 4 and Cluster 5 to CoreGroup 3. – Move application servers in Cluster 6 and Cluster 7 to CoreGroup 4.– Move application servers in Cluster 8 to CoreGroup 5. – Move application servers in Cluster 9 to CoreGroup 6.– Move application servers in Cluster 10 to CoreGroup 7.– Move node agent to CoreGroup 1. – Move the standalone server (BI) to CoreGroup 2.
� Core groups require core group bridge servers to communicate among themselves. Since we have seven core groups, we arrange two bridge servers for each core group to prevent a single point of failure. As far as the proper JVM heap sizes for all the bridge servers, we recommend setting each bridge server heap size to 1024 (1 GB) for a customer production environment. The bridge server might not need a 1 GB heap size during normal runs, but in case one of them fails, you want to make sure the remaining available bridge
152 Techniques for Managing Large WebSphere Installations

server has enough memory to handle the communication traffic for the entire core group.
� The preferred active coordinator manages the failover of highly available singleton services and distributes live server state data to interested core group members. For the coordinator to perform the tasks in a large configuration, the required amount of CPU and memory resources is quite large. It is a good practice to select servers that do not get recycled as frequently as the preferred active coordinators. Also, we recommend setting the JVM heap size for each coordinator to 1024 (1 GB) to be able to handle the data transfer among entire core group members.
� Perform the following steps to set up the bridge servers and active coordinators for all the core groups:
a. Select the node agent on Node1 as the bridge server and preferred active coordinator for CoreGroup1. (Select Servers → Core groups → Core group bridge settings → Access point groups → DefaultAccessPointGroup → Core group access points → core_group_name → Show Detail → Bridge interfaces → New.) Eventually, the node agent will be the backup active coordinator.
b. Select the standalone server (BI) on Node1 as the bridge server and preferred active coordinator for CoreGroup 2 (select Servers → Core groups → Core group settings → core_group_name → Preferred coordinator servers).
c. Select five more application servers on Node1 from Cluster 4 through Cluster 10 to be the bridge servers and preferred active coordinator for CoreGroup3 through Core Group7. These application servers will be the temporary bridge servers and coordinators until more nodes are migrated to V6.x.
d. Increase the heap sizes for the node agent and bridge server to 1024 KB (1 MB).
e. Increase the heap size for the temporary bridge servers and coordinators to 512 KB because they will be replaced soon.
f. Save and synchronize changes on all running nodes from the administration console.
� Manually synchronize from the nodes (using the syncNode command) and restart the node agent (run startNode.sh) for the moved node agent.
Chapter 8. Planning for a large cell migration 153

� Start all application servers on Node1. At this time, the client load should be balanced on all available servers, including the newly migrated node.
� Table 8-1 lists the arrangement of the bridge servers and preferred active coordinators and core group members after the Node1 migration. The abbreviations refer to the following:
– NA: node agent– BS: bridge server– AC: preferred active coordinator
Table 8-1 Post-node1 migration - arrangement of bridge servers and active coordinator
Table 8-2 lists the members in each core group after the Node1 migration.
Table 8-2 Post-node 1 migration - core group members
Core group Node1 (V6.x)
CoreGroup 1 NA (BS/AC)
CoreGroup 2 BI (BS/AC)
CoreGroup 3 Server_a in Cluster 4 (BS/AC)
CoreGroup 4 Server_b in Cluster 6(BS/AC)
CoreGroup 5 Server_c in Cluster 8(BS/AC)
CoreGroup 6 Server_d in Cluster 9(BS/AC)
CoreGroup 7 Server_e in Cluster 10 (BS/AC)
Core group Members
CoreGroup 1 Deployment Manager (member)Node agent on Node1 (bridge/active coordinator)Application servers in Cluster 1 on Node1 (member)
CoreGroup 2 BI on Node1 (bridge and coordinator)Application servers in Cluster 2 and Cluster 3 on Node1 (member)
CoreGroup 3 Application server_a of Cluster 4 on Node1 (bridge/active coordinator)Application servers in Cluster 4 and Cluster 5 on Node1 (member)
CoreGroup 4 Application server_b of Cluster 6 on Node1 (bridge/active coordinator)Application servers in Cluster 6 and Cluster 7 on Node1 (member)
154 Techniques for Managing Large WebSphere Installations

CoreGroup 5 Application server_c of Cluster 8 on Node1 (bridge/active coordinator)Application servers in Cluster 8 on Node1 (member)
CoreGroup 6 Application server_d of Cluster 9 on Node1 (bridge/active coordinator)Application servers in Cluster 9 on Node1 (member)
CoreGroup 7 Application server_e of Cluster 10 on Node1 (bridge/active coordinator)Application servers in Cluster 10 on Node1 (member)
Core group Members
Chapter 8. Planning for a large cell migration 155

Step 4: Migrate Node2Figure 8-6 illustrates the migration of Node2.
Figure 8-6 Post-Node2 migration
Node7Node6Node5Node4Node3Node2Node1DMgr
Total 350 application servers with deployed applications
Cluster 9
NA
Cluster 9
BI
ASASASASASASASASASAS
ASASASASASASASASASAS
ASASASASASASASASASAS
ASASASASAS
Cluster 3
Cluster 2
Cluster 3
Cluster 2
BI NA
ASASASASASASASASASAS
ASASASASASASASASASAS
ASASASASASASASASASAS
ASASASASASASASASASAS
ASASASASASASASASASAS
ASASASASASASASASASAS
ASASASASASASASASASAS
Cluster 5
Cluster 4
Cluster 5
Cluster 4
BI NA
ASASASASASASASASASAS
ASASASASASASASASASAS
ASASASASASASASASASAS
ASASASASASASASASASAS
ASASASASASASASASASAS
ASASASASASASASASASAS
ASASASASASASASASASAS
Cluster 7
Cluster 6
Cluster
Cluster
BI NA
ASASASASASASASASASAS
ASASASASASASASASASAS
ASASASASASASASASASAS
ASASASASASASASASASAS
ASASASASASASASASASAS
ASASASASASASASASASAS
ASASASASASASASASASAS
Cluster 8
NA
Cluster
BI
ASASASASASASASASASAS
ASASASASASASASASASAS
ASASASASASASASASASAS
ASASASASAS
Cluster 10
NA
Cluster 10r
BI
ASASASASASASASASASAS
ASASASASASASASASASAS
ASASASASASASASASASAS
ASASASASAS
Cluster 1
NA
Cluster 1
NA BI
ASASASASASASASASASAS
ASASASASASASASASASAS
ASASASASASASASASASAS
ASASASASAS
WAS 6.X WAS 6.X WAS 6.X WAS 5.X WAS 5.X WAS 5.X WAS 5.X WAS 5.X
= Five application servers on node/cluster=Node agentNA BI ASASASASAS=Bridge interface
DMgr
Cor
eGro
up3
Cor
eGro
up1
Cor
eGro
up2
Cor
eGro
up4
Cor
eGro
up5
Cor
eGro
up6
Cor
eGro
up7
156 Techniques for Managing Large WebSphere Installations

Figure 8-6 on page 156 illustrates the following aspects of the Node2 migration:
After the migration of Node1, adjust the transport buffer size to 100 on all Node1 processes. A script is the best option for performing this action.
� Follow similar steps as described for the Node1 migration while moving application servers among different core groups and rearranging bridge servers and coordinators:
a. Move the node agent on Node2 to CoreGroup 2. b. Move the standalone server (BI) on Node2 to CoreGroup 3.c. Select the node agent on Node2 as the bridge server and backup active
coordinator (the second one in the list) for CoreGroup 2.d. Select BI on Node2 as the bridge server for CoreGroup 3. e. Select BI on Node2 as the first preferred coordinator server for
CoreGroup 3.f. Deselect server_a as the bridge server and active coordinator and restart
server_a.g. Increase the heap sizes for the node agent and BI to 1024 KB.h. Save and synchronize changes on all running nodes from the
administration console.
� Manually synchronize (run syncNode.sh Deployment Manager Node name) and restart the node agent (run startNode.sh) for the moved node agent.
� Start all application servers on Node2.
� Table 8-3 lists the arrangement of the bridge servers and preferred active coordinators and core group members after the Node2 migration. The abbreviations are as follows:
– NA: node agent– BS: bridge server– AC: preferred active coordinator
Table 8-3 Post-node2 migration - arrangement of bridge servers and active coordinator
Core group Node1 (V6.x) Node2 (V6.x)
CoreGroup 1 NA (BS/AC)
CoreGroup 2 BI (BS/AC) NA (BS/backup AC)
CoreGroup3 BI (BS/AC)
CoreGroup 4 Server_b in Cluster 6 (BS/AC)
CoreGroup 5 Server_c in Cluster 8 (BS/AC)
CoreGroup 6 Server_d in Cluster 9 (BS/AC)
CoreGroup 7 Server_e in Cluster 10 (BS/AC)
Chapter 8. Planning for a large cell migration 157

Table 8-4 shows the list of members in each core group after Node2 migration.
Table 8-4 Post-node2 migration - core group members
Step 5: Migrate Node3 through Node7We repeatedly migrate Node3 to Node7 from WebSphere Application Server V5.x to WebSphere Application Server V6.x following the steps described in the Node2 migration.
Core group Members
CoreGroup 1 Deployment Manager (member)Node agent on Node1 (bridge/active coordinator)Application servers in Cluster 1 on Node1 and Node 2 (member)
CoreGroup 2 Node agent on Node2 (bridge)BI on Node1 (bridge and coordinator)Application servers in Cluster 2 and Cluster 3 on Node1 and Node2 (member)
CoreGroup 3 BI on Node2 (bridge/active coordinator)Application servers in Cluster 4 and Cluster 5 on Node1 and Node2 (member)
CoreGroup 4 Application server_b of Cluster 6 on Node1 (bridge/active coordinator)Application servers in Cluster 6 and Cluster 7 on Node1 and Node2 (member)
CoreGroup 5 Application server_c of Cluster 8 on Node1 (bridge/active coordinator)Application servers in Cluster 8 on Node1 and Node2 (member)
CoreGroup 6 Application server_d of Cluster 9 on Node1 (bridge/active coordinator)Application servers in Cluster 9 on Node1 and Node2 (member)
CoreGroup 7 Application server_e of Cluster 10 on Node1 (bridge/active coordinator)Application servers in Cluster 10 on Node1 and Node2 (member)
158 Techniques for Managing Large WebSphere Installations

Figure 8-7 illustrates the Node3 migration.
Figure 8-7 Post-Node3 migration
Node7Node6Node5Node4Node3Node2Node1DMgr
Total 350 application servers with deployed applications
Cluster 9
NA
Cluster 9
BI
ASASASASASASASASASAS
ASASASASASASASASASAS
ASASASASASASASASASAS
ASASASASAS
Cluster 3
Cluster 2
Cluster 3
Cluster 2
BI NA
ASASASASASASASASASAS
ASASASASASASASASASAS
ASASASASASASASASASAS
ASASASASASASASASASAS
ASASASASASASASASASAS
ASASASASASASASASASAS
ASASASASASASASASASAS
Cluster 5
Cluster 4
Cluster 5
Cluster 4
BI NA
ASASASASASASASASASAS
ASASASASASASASASASAS
ASASASASASASASASASAS
ASASASASASASASASASAS
ASASASASASASASASASAS
ASASASASASASASASASAS
ASASASASASASASASASAS
Cluster 7
Cluster 6
Cluster
Cluster
BI NA
ASASASASASASASASASAS
ASASASASASASASASASAS
ASASASASASASASASASAS
ASASASASASASASASASAS
ASASASASASASASASASAS
ASASASASASASASASASAS
ASASASASASASASASASAS
Cluster 8
NA
Cluster
BI
ASASASASASASASASASAS
ASASASASASASASASASAS
ASASASASASASASASASAS
ASASASASAS
Cluster 10
NA
Cluster 10r
BI
ASASASASASASASASASAS
ASASASASASASASASASAS
ASASASASASASASASASAS
ASASASASAS
Cluster 1
NA
Cluster 1
NA BI
ASASASASASASASASASAS
ASASASASASASASASASAS
ASASASASASASASASASAS
ASASASASAS
WAS 6.X WAS 6.X WAS 6.X WAS 6.X WAS 5.X WAS 5.X WAS 5.X WAS 5.X
= Five application servers on node/cluster=Node agentNA BI ASASASASAS=Bridge interface
DMgr
Cor
eGro
up3
Cor
eGro
up1
Cor
eGro
up2
Cor
eGro
up4
Cor
eGro
up5
Cor
eGro
up6
Cor
eGro
up7
Chapter 8. Planning for a large cell migration 159

Table 8-5 lists the arrangement of the bridge servers and preferred active coordinators and core group members after the Node3 migration. The abbreviations used in the table are as follows:
– NA: Node agent– BS: Bridge server– AC: Preferred active coordinator
Table 8-5 Post node3 migration - arrangement of bridge servers and active coordinator
Core group Node1 (V6.x) Node2 (V6.x) Node3 (V6.x)
CoreGroup 1 NA (BS/AC)
CoreGroup 2 BI (BS/AC) NA (BS/backup AC)
CoreGroup 3 BI (BS/AC) NA (BS/backup AC)
CoreGroup 4 BI (BS/AC)
CoreGroup 5 Server_c in Cluster 8 (BS/AC)
CoreGroup 6 Server_d in Cluster 9 (BS/AC)
CoreGroup 7 Server_e in Cluster 10 (BS/AC)
160 Techniques for Managing Large WebSphere Installations
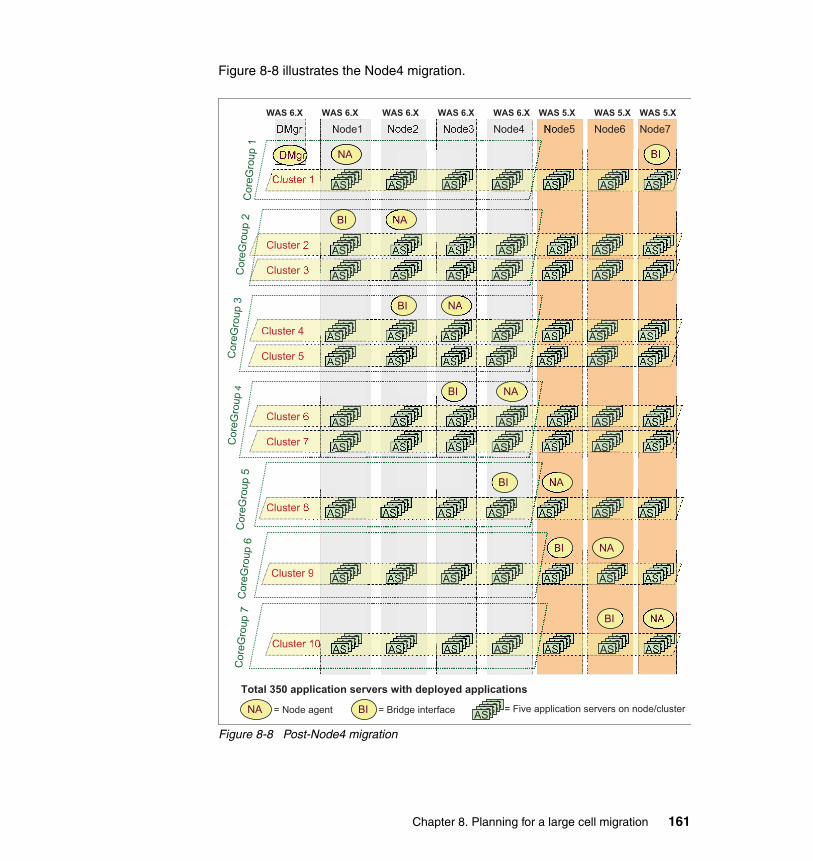
Figure 8-8 illustrates the Node4 migration.
Figure 8-8 Post-Node4 migration
Node7Node6Node5Node4Node3Node2Node1DMgr
Total 350 application servers with deployed applications
Cluster 9
NA
Cluster 9
BI
ASASASASASASASASASAS
ASASASASASASASASASAS
ASASASASASASASASASAS
ASASASASAS
Cluster 3
Cluster 2
Cluster 3
Cluster 2
BI NA
ASASASASASASASASASAS
ASASASASASASASASASAS
ASASASASASASASASASAS
ASASASASASASASASASAS
ASASASASASASASASASAS
ASASASASASASASASASAS
ASASASASASASASASASAS
Cluster 5
Cluster 4
Cluster 5
Cluster 4
BI NA
ASASASASASASASASASAS
ASASASASASASASASASAS
ASASASASASASASASASAS
ASASASASASASASASASAS
ASASASASASASASASASAS
ASASASASASASASASASAS
ASASASASASASASASASAS
Cluster 7
Cluster 6
Cluster
Cluster
BI NA
ASASASASASASASASASAS
ASASASASASASASASASAS
ASASASASASASASASASAS
ASASASASASASASASASAS
ASASASASASASASASASAS
ASASASASASASASASASAS
ASASASASASASASASASAS
Cluster 8
NA
Cluster
BI
ASASASASASASASASASAS
ASASASASASASASASASAS
ASASASASASASASASASAS
ASASASASAS
Cluster 10
NA
Cluster 10r
BI
ASASASASASASASASASAS
ASASASASASASASASASAS
ASASASASASASASASASAS
ASASASASAS
Cluster 1
NA
Cluster 1
NA BI
ASASASASASASASASASAS
ASASASASASASASASASAS
ASASASASASASASASASAS
ASASASASAS
WAS 6.X WAS 6.X WAS 6.X WAS 6.X WAS 6.X WAS 5.X WAS 5.X WAS 5.X
= Five application servers on node/cluster= Node agentNA BI ASASASASAS= Bridge interface
DMgr
Cor
eGro
up3
Cor
eGro
up1
Cor
eGro
up2
Cor
eGro
up4
Cor
eGro
up5
Cor
eGro
up6
Cor
eGro
up7
Chapter 8. Planning for a large cell migration 161

� Table 8-6 shows the arrangement of the bridge servers and preferred active coordinators and core group members after the Node4 migration. The abbreviations are as follows:
– NA: Node agent– BS: Bridge server– AC: Preferred active coordinator
Table 8-6 Post-node4 migration - arrangement of bridge servers and active coordinator
Core group Node1 (V6.x) Node2 (V6.x) Node3 (V6.x) Node4 (V6.x)
CoreGroup1 NA (BS/AC)
CoreGroup 2 BI (BS/AC) NA (BS/backup AC)
CoreGroup 3 BI (BS/AC) NA (BS/backup AC)
CoreGroup 4 BI (BS/AC) NA (BS/backup AC)
CoreGroup 5 BI (BS/AC)
CoreGroup 6 Server_d in Cluster 9 (BS/AC)
CoreGroup 7 Server_e in Cluster 10 (BS/AC)
162 Techniques for Managing Large WebSphere Installations
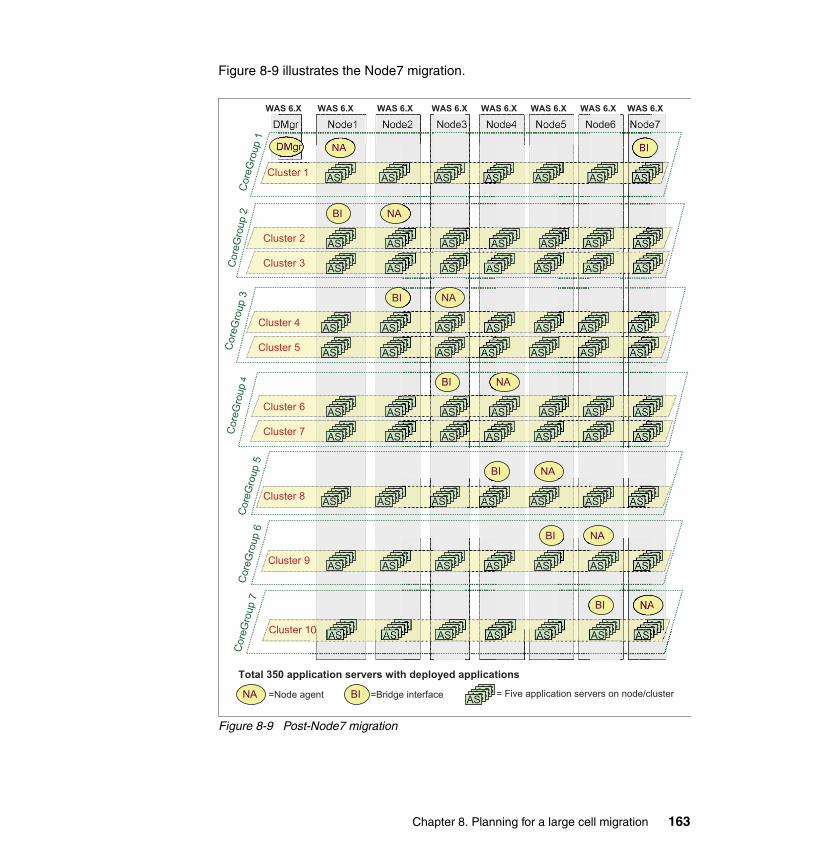
Figure 8-9 illustrates the Node7 migration.
Figure 8-9 Post-Node7 migration
Node7Node6Node5Node4Node3Node2Node1DMgr
Total 350 application servers with deployed applications
Cluster 9
NABI
ASASASASASASASASASAS
ASASASASASASASASASAS
ASASASASASASASASASAS
ASASASASAS
Cluster 3
Cluster 2
BI NA
ASASASASASASASASASAS
ASASASASASASASASASAS
ASASASASASASASASASAS
ASASASASASASASASASAS
ASASASASASASASASASAS
ASASASASASASASASASAS
ASASASASASASASASASAS
Cluster 5
Cluster 4
BI NA
ASASASASASASASASASAS
ASASASASASASASASASAS
ASASASASASASASASASAS
ASASASASASASASASASAS
ASASASASASASASASASAS
ASASASASASASASASASAS
ASASASASASASASASASAS
Cluster 7
Cluster 6
BI NA
ASASASASASASASASASAS
ASASASASASASASASASAS
ASASASASASASASASASAS
ASASASASASASASASASAS
ASASASASASASASASASAS
ASASASASASASASASASAS
ASASASASASASASASASAS
Cluster 8
NABI
ASASASASASASASASASAS
ASASASASASASASASASAS
ASASASASASASASASASAS
ASASASASAS
Cluster 10
NA
Cluster 10r
ABI
ASASASASASASASASASAS
ASASASASASASASASASAS
ASASASASASASASASASAS
ASASASASAS
Cluster 1
NA
Cluster 1
NA BI
ASASASASASASASASASAS
ASASASASASASASASASAS
ASASASASASASASASASAS
ASASASASAS
WAS 6.X WAS 6.X WAS 6.X WAS 6.X WAS 6.X WAS 6.X WAS 6.X WAS 6.X
= Five application servers on node/cluster=Node agentNA BI ASASASASAS=Bridge interface
DMgr
Cor
eGro
up3
Cor
eGro
up1
Cor
eGro
up2
Cor
eGro
up4
Cor
eGro
up5
Cor
eGro
up6
Cor
eGro
up7
Chapter 8. Planning for a large cell migration 163

Table 8-7 shows the final configuration of all members after all nodes have been migrated.
Table 8-7 Post-node7 migration - core group members
Step 6: Create a core group access pointCreate a single core group access point group that contains all of the access points. A single core group access point group ensures that all bridge interface processes can communicate directly. These bridge interfaces form a fully connected mesh as shown in Figure 8-2 on page 143.
Core group Members
CoreGroup1 Deployment Manager (member)BI on Node7 (bridge and coordinator)Node agent on Node1 (bridge and backup coordinator)Application servers in Cluster 1 on Node1 to Node7(member)
CoreGroup 2 BI on Node1 (bridge and coordinator)Node agent on Node2 (bridge and backup coordinator)Application servers in Cluster 2 and Cluster 3 on Node1 to Node7 (member)
CoreGroup 3 BI on Node2 (bridge and coordinator)Node agent on Node3 (bridge and backup coordinator)Application servers in Cluster 4 and Cluster 5 on Node1 to Node7 (member)
CoreGroup 4 BI on Node3 (bridge and coordinator)Node agent on Node4 (bridge and backup coordinator)Application servers in Cluster 6 and Cluster 7 on Node1 to Node7 (member)
CoreGroup 5 BI on Node4 (bridge and coordinator)Node agent on Node5 (bridge and backup coordinator)Application servers in Cluster 8 on Node1 to Node 7 (member)
CoreGroup 6 BI on Node5 (bridge and coordinator)Node agent on Node6 (bridge and backup coordinator)Application servers in Cluster 9 on Node1 to Node7 (member)
CoreGroup 7 BI on Node6 (bridge and coordinator)Node agent on Node7 (bridge and backup coordinator)Application servers in Cluster 10 on Node1 to Node 7 (member)
164 Techniques for Managing Large WebSphere Installations

Part 3 Administration and problem determination
Part 3
© Copyright IBM Corp. 2008. All rights reserved. 165

166 Techniques for Managing Large WebSphere Installations

Chapter 9. System management and configuration
This chapter describes how to configure and manage large WebSphere installations and the various interfaces that can be used to do so.
This chapter contains the following:
� 9.1“Introduction” on page 168� 9.2“Areas of administration” on page 168� 9.3“Scripting and tooling” on page 202
9
Attention: Many of the scripts, batch command files, and monitoring and sample applications discussed in this chapter are available for download as documented in Appendix A, “Additional material” on page 315.
© Copyright IBM Corp. 2008. All rights reserved. 167

9.1 Introduction
Setting up and maintaining WebSphere Application Server installations lends itself to automation for the following reasons:
� Execution of repetitive tasks is often error prone.
� Execution of a series of tasks in the exact same sequence and with the same parameters is difficult to reproduce manually.
� Manual execution of setup and maintenance procedures is not auditable.
� Manual execution is typically slow.
The need for automation becomes even more important when facing large WebSphere installations.
When setting up our lab and test environment for this book, we faced a challenge. It became clear to us that we would have to quickly set up and tear down various test scenarios in our lab, all with many servers, clusters, core groups, and applications (up to 200) and set them up with no errors and make our setup reproducible. We had to accomplish this in a matter of weeks, while at the same time creating completely new and different configurations in a controlled and repeatable manner as our testing requirements matured. It was evident that the only way to meet this challenge was by choosing and preparing a set of tools for the different requirements of setting up, maintaining, and configuring a WebSphere environment.
In this chapter we first introduce the techniques we used in our lab, our experiences with them, and some ideas for improvements. We then introduce tooling for the configuration management in more detail.
9.2 Areas of administration
We break the areas of administration into the following fields:
� 9.2.1“Product installation and maintenance” on page 169
� 9.2.2“Profile management” on page 175
� 9.2.3“Configuration management” on page 177
� 9.2.4“Application deployment” on page 198
168 Techniques for Managing Large WebSphere Installations

The first two fields, product installation and profile management, both require that the tasks be executed on each individual machine participating in a WebSphere installation. Configuration and deployment management tasks, however, can be performed remotely with the Deployment Manager.
9.2.1 Product installation and maintenance
As mentioned previously, product installation and maintenance has to be performed on each individual machine in a WebSphere environment. The first issue concerns how the actual installation - or upgrade - package is built, while the second issue concerns how the package is delivered to the various machines.
Installation FactoryIn setting up a large WebSphere Application Server environment, one of the first major challenges is the installation of WebSphere Application Server itself on each of the machines that are part of the large WebSphere installation topology.
ProblemInstalling WebSphere Application Server separately on each machine is definitely a redundant task and is even more so when the installation procedure remains the same across machines comprised of various refresh packs, fix packs, iFixes, and so on.
SolutionThe answer to our challenge was the Installation Factory for WebSphere Application Server, which provides a facility to create an integrated installation package (IIP) for one machine per platform and use the same package to install WebSphere Application Server on all other machines.
The advantages of using an IIP are:
� Multiple installation packages can be installed in a single installation session.
� Refresh packs, fix packs, and iFixes can be combined into a customized installation package (CIP) to create a single-step installation of WebSphere Application Server at the required refresh pack and fix pack levels.
� We found IIP very useful when installing the WebSphere Application Server V6.1 Feature Pack for Web Services.
Note: Using IBM Installation Factory is one of the solutions to the large WebSphere Application Server installation setup. Various other methods for setting up a large environment might better suit your needs.
Chapter 9. System management and configuration 169

CIP, IIP, and the Installation FactoryThe following sections provide descriptions of the functions and features, including CIP and IIP, of the IBM WebSphere Application Server Version 6.1 Feature Pack.
Customized installation package (CIP)Customized installation packages are WebSphere Application Server or WebSphere Application Server Version 6.1 Feature Pack installation images with pre-applied maintenances - fix packs, interim fixes, a set profile customizations, and so on. CIPs make installing WebSphere Application Server or WebSphere Application Server Version 6.1 Feature Pack more convenient because one installation can bring the system to the required level. Users do not have to go through multiple steps involving Update Installer for WebSphere Software.
CIP is a vertical bundle of a single product, while IIP is a horizontal bundle of multiple products. A CIP can be a contribution to an IIP.
You can use a CIP in the following instances:
� When a series of steps in the end-to-end installation and configuration process of a given package requires automation and optimization to ensure highly repeatable results. For example:
– A large-scale WebSphere Application Server deployment within an organization
– An independent software vendor (ISV) product bundles and installs WebSphere Application Server plus its own applications
� When you want a single installation package that can perform both new scratch-installs as well as updates. CIP is useful in this instance because you do not have to automate these installations and updates differently.
Note: CIPs can be created based on a product. A WebSphere Application Server CIP can include WebSphere Application Server fix packs, SDK fix packs, WebSphere Application Server interim fixes, profile customizations, and additional user files. A Feature Pack for Web Services CIP can include Feature Pack for Web Services fix packs, Feature Pack for Web Services interim fixes, profile customizations, and additional user files.
170 Techniques for Managing Large WebSphere Installations

� When the update package must contain updates to the WebSphere Application Server product files and newer versions of customer applications, configuration changes, and so on - for example, a comprehensive set of the updated assets, instead of just one piece of the overall puzzle.
� When the update package is applied to installations that are too down-level for a fix pack or an iFix by itself to be applied.
– For example, a CIP at WebSphere Application Server Version 6.0.2.19 can be applied to any installation earlier than that version (such as V6.0, V6.0.1, and so on), whereas the fix pack for V6.0.2.19 can be installed only when V6.0.2 has already been installed.
� When tight integration with the standard WebSphere Application Server installation and profile mechanisms is desired. For example, a new entry is created in the profile management tool to allow the custom configuration and application deployment to be repeated in new profiles after the installation.
Integrated installation package (IIP)Integrated installation packages enable a user to install multiple installation packages in a single installation session, instead of having to install each package one at a time. The installation packages within an IIP are invoked one after the other by the IIP to complete the end-to-end installation. IIP cannot be replaced by chaining different installers in a batch or shell script. IIP has built-in intelligence that allows the bundled contribution invocations to communicate with each other.
For example, if a user wants to install WebSphere Application Server Version 6.1 Feature Pack for Web Services, the user has to manually install WebSphere Application Server first and then install the Feature Pack for Web Services. If the system includes 20 machines, the user has to repeat the same tasks 20 times.
In scenarios such as that previously described, a user can create an IIP that contains WebSphere Application Server and the Feature Pack for Web Services (two contributions) and invoke each contribution once. The IIP automatically sets the installation location of the Feature Pack for Web Services the same as the installation location of WebSphere Application Server, and the IIP also presets all the default values.
Chapter 9. System management and configuration 171

When to use an Integrated installation package:
� Use an IIP to install two or more “products”1 in an integrated fashion, particularly when the installation must be repeated more than just a couple of times. For example:
– Large-scale deployment of WebSphere Application Server plus one or more Feature Packs within an organization
– An ISV product bundles and installs WebSphere Application Server plus one or more Feature Packs
� Use an IIP to perform a turn-key installation of a package, requiring no additional user input at the time of installation.
– Contains all the required information (such as built-in defaults for all supported options) to install the package and can even block the user from overriding pieces of that information.
– Helps reduce or eliminate effort on the part of the user and avoids user errors, especially when the users of the installation package are geographically dispersed or have little experience installing the product.
– Helps enforce corporate standards (for example, the installation location for WebSphere Application Server).
� Use an IIP to mask the differences between installation packages (that is, to normalize the way in which different packages are installed).
– The IIP provides an abstraction layer so that a wide variety of packages can be installed without your having to worry about the idiosyncrasies of each one.
– An automation and provisioning system does not have to be “taught” how to handle each installation package, it simply has to know how to invoke an IIP and pass in an IIP-level response file.
� Use an IIP to embed and bundle one or more products inside a higher-level product.
1 The term “product” includes any standalone installation package such as WebSphere Application Server, IBM HTTP Server, and the WebSphere Application Server Version 6.1 Feature Pack for Web Services, in addition to actual product installation packages such as WebSphere Extended Deployment.
172 Techniques for Managing Large WebSphere Installations

Installation FactoryInstallation Factory is a tool that creates CIPs and IIPs. It has a user interface (ifgui) and a command-line utility (ifcli). The result of using the Installation Factory is the creation of a CIP or IIP and a build definition that can be reused. Using the Installation Factory GUI, users can create CIPs and IIPs in connected mode or disconnected mode. Connected mode is used when all input is available on the local system, so that users can browse and select. Disconnected mode is used when input is not available on the local system; for example, on Windows, users try to create a build definition file for Linux. When disconnected mode is used, users have run ifcli the build definition file on the target system to generate the CIP or IIP there.
Beyond just installing WebSphere Application Server at a given level of maintenance, Installation Factory can also be used to automate the execution of configuration scripts and to perform application deployment, resulting in a single turn-key package: A customized golden master WebSphere Application Server image to be distributed throughout the organization.
WebSphere Application Server configuration scripts can be added to the CIP via the Installation Factory so that they become an integrated part of the installation package and actually get installed under <WAS_HOME> when WebSphere Application Server is installed. Installation Factory can leverage the native WebSphere Application Server mechanisms for profile creation to automate the execution of these scripts - regardless of whether the profile gets created during or after the installation via the profile management tool GUI or the manageprofiles command. The user experience is consistent with the creation of standard out-of-the-box profiles.
Scripts can also be added that are strictly for installation-time setup, independent of profile creation. And arbitrary sets of additional files can also be added to the CIP and are installed when WebSphere Application Server is installed.
Note: CIPs and IIPs can be used as part of an organization’s maintenance (service) strategy, and there are several advantages to doing so. A single WebSphere Application Server image can be used for new scratch-installs of WebSphere Application Server (and Feature Packs), and the image can apply updates to existing installations. Those updates are not limited to just the WebSphere Application Server product files but can also include newer versions of the customer’s own assets - for example, enterprise archives (EARs) and configuration scripts.
Chapter 9. System management and configuration 173

Figure 9-1 illustrates the basic flow path for creating and installing an IIP.
Figure 9-1 General flow of creating and installing an IIP
Figure 9-2 illustrates the basic flow path for creating and installing a CIP.
Figure 9-2 General flow of creating and installing a CIP
The benefits of using an IIP and the Installation Factory are:
� An Installation Factory user creates an IIP that aggregates and integrates otherwise independent installation packages.
� IIP can be used to install all of the packages at once in a highly repeatable fashion.
Install
Install
Install
Integrated Install Package
WebSphere Application Server
Feature Pack for Web Services
Feature Pack for SOA
Feature Pack for EJB 3.0
CreateInput
WebSphere Application Server
GA or CIP
Feature Pack for Web Services
GA or CIP
Feature Pack for SOAGA or CIP
Feature Pack for EJB 3.0GA or CIP
Install
FP 6.1.0.9
JDK 1.5.2 SR3
iFix
“A” & “B”A
BA
B
J2EE Apps
Admin Scripts
WebSphere
6.1
Config Archive
Automated, customized WebSphereinstall package
CreateInput
Install
Install
Single package containingV6.1
V6.1.0.9
J2EE Apps
Config archive
JDK 1.5.2 SR3
iFix “A” and “B”
Admin Scripts
Single package containingV6.1
V6.1.0.9
J2EE Apps
Config archive
JDK 1.5.2 SR3
iFix “A” and “B”
Admin Scripts
174 Techniques for Managing Large WebSphere Installations

Rolling out installation packagesThe scope of this book does not cover the topic of rolling out installation packages. We assume that most customers have already considered and implemented rollout mechanisms and have integrated them into their environment. If not, consider the product Tivoli® Provisioning Manager to determine whether it suits your needs.
ReferencesFor further information about Installation Factory, go to the WebSphere Application Server, Version 6.1 Information Center at the following URL:
http://publib.boulder.ibm.com/infocenter/wasinfo/v6r1/index.jsp
9.2.2 Profile management
Profile management can be accomplished using scripts provided by WebSphere Application Server. We differentiate three main tasks:
� Setting up a profile and federating its node into a cell
� Synchronizing and starting a node
� Unfederating a node and possibly even deleting its profile
Setting up profilesAfter a WebSphere installation, setting up profiles is the next primary task. Example 9-1 shows using the manageprofiles.bat utility (manageprofiles.sh utility on UNIX®) in WebSphere to create a profile.
Example 9-1 Creating a profile using manageprofiles.bat
set WAS_HOME=C:\IBM\WebSphere\AppServer
%WAS_HOME%\bin\manageprofiles.bat -create -profileName <myProfile> -profilePath %WAS_HOME%\profiles\<myProfile> -templatePath %WAS_HOME%\profileTemplates\managed -nodeName <myProfNode> -cellName <myProfCell> -hostName <myHost>
In Example 9-1:
� myProfile: name of the profile you want to create
� myProfNode: node name of the profile to be created
� myProfCell: cell name of the profile to be created
� myHost: host name of the machine where the profile will be created
Chapter 9. System management and configuration 175

To federate the profile node (in the preceding list) into the Deployment Manager (dmgr), run the addNode.bat utility (addNode.sh utility on UNIX) from the appserver node machine (see Example 9-2).
Example 9-2 Federating the node using addNode.bat
%WAS_HOME%\bin\addNode.bat <dmgr_host_name> <dmgr_soap_port>
In Example 9-2:
� dmgr_host_name: host name of Deployment Manager
� dmgr_soap_port: SOAP connector port of Deployment Manager
Handling nodesOnce the nodes are created and federated, you must start the node agents and synchronize them with the Deployment Manager. Stop the node agents before synchronizing and then run the commands shown in Example 9-3 from the node agent machine.
Example 9-3 Sample script to sync and start node agent
set WAS_HOME=C:\IBM\WebSphere\AppServerset PROFILE_HOME=%WAS_HOME%\profiles\<myProf>
%PROFILE_HOME%\syncNode.bat <dmgr_hostName> <dmgr_soap_port>%PROFILE_HOME%\startNode.bat
Removing profilesExample 9-4 illustrates the steps for removing federated nodes and profiles from the Deployment Manager. The script uses the removeNode.bat and manageprofiles.bat utilities for unfederating the node from the Deployment Manager and deleting the profile.
Example 9-4 Snippet for removing nodes from dmgr and deleting profiles
%WAS_HOME%\bin\removeNode.bat
%WAS_HOME%\bin\manageprofiles.bat -delete -profileName <myProf>
In Example 9-4:
� myProf: name of the profile to be removed
176 Techniques for Managing Large WebSphere Installations

9.2.3 Configuration management
WebSphere Application Server provides several mechanisms that enable you to configure practically all aspects of an installation. While all the interfaces are useful, our favorites are the Jython scripting client (wsadmin) and the Integrated Solutions Console (ISC). The main question is when to use which tool. After addressing this question, we describe the scripting of major operations and their verification in the ISC.
When to use ISC and when to use scriptingThis section describes the ISC and the WebSphere Application Server scripting program.
Integrated Solutions Console (ISC)The ISC contains an administration console GUI that can be used for performing all the administration, configuration, and management tasks on WebSphere Application Server. Using the console is similar to using any other tool such as Java Management Extensions (JMX) and other scripts.
In the case of a large WebSphere installation environment, we mainly used the ISC for information, verification, and control of the configuration tasks performed using scripting.
ScriptingThe WebSphere Application Server administration scripting program (wsadmin) is a powerful command interpreter environment enabling you to run administrative operations in a scripting language. The wsadmin tool is intended for production environments and unattended operations.
For our large WebSphere installation setup, we used scripting for making the configuration changes, modifications, and so on. We used the ISC solely for cross-verification of the tasks performed by the scripts and for a few control operations such as stopping and starting servers, clusters, and applications.
Setting up the environmentIn the following section, we walk through all the major steps for setting up an environment like the one we set up in our lab and provide recommended settings. This process begins with empty profiles and ends with a fully functional environment: multiple servers, multiple applications, potentially multiple core groups, optional bridging, and various deployments.
Chapter 9. System management and configuration 177

Creating bridge servers and preferred coordinatorsAs shown in Example 9-5, we first create a standalone application server that can be used for bridging and coordinating.
Example 9-5 Create standalone application server
AdminTask.createApplicationServer(nodeName, ['-name', serverName, '-templateName', params.get(server,"template")])
Creating a clusterAs shown in Example 9-6, we next create a cluster, which is a simple operation. Only the name of the new cluster has to be provided.
Example 9-6 Create a cluster
AdminTask.createCluster("[-clusterConfig [[" + clusterName + "\"\"]]]")
178 Techniques for Managing Large WebSphere Installations

A panel in the administration console displaying the list of clusters is shown in Figure 9-3.
Figure 9-3 List of clusters created in the cell
Creating a cluster memberCreating a cluster member requires slightly different options depending on whether or not you are creating the first member of the cluster (see Example 9-7 and Example 9-8 on page 180).
Example 9-7 Creating cluster member
AdminTask.createClusterMember(‘[-clusterName <clusterName> -memberConfig [[<nodeName> <memberName> "true false"]]]’)
Chapter 9. System management and configuration 179

To create the first cluster member, use the command shown in Example 9-8.
Example 9-8 Creating the first member of the cluster
AdminTask.createClusterMember(‘[-clusterName <clusterName> -memberConfig [[<nodeName> <memberName> "true false"]] -firstMember [[<templateName>]]]’)
In Example 9-7 on page 179 and Example 9-8:
� clusterName: target cluster on which members are to be created
� nodeName: name of the node where the cluster member resides
� memberName: server name for the cluster member
� templateName: server template to be used only while creating the first member of cluster
180 Techniques for Managing Large WebSphere Installations

Figure 9-4 shows an administration console view of the cluster and its cluster members.
Figure 9-4 Cluster members
Creating a core groupThe wsadmin Jython command (see Example 9-9) enables you to create a new core group with the name cgName.
Example 9-9 Jython command for creating a new core group
AdminTask.createCoreGroup(‘[-coreGroupName] <cgName>]’)
Chapter 9. System management and configuration 181

Figure 9-5 shows an administration console view listing all the core groups available in the cell.
Figure 9-5 List of core groups
182 Techniques for Managing Large WebSphere Installations

Moving clusters and servers across core groupsIn Example 9-10 and Example 9-11, you see the corresponding Jython commands for moving clusters and servers from one core group to another.
Example 9-10 Jython commands for moving clusters across core groups
AdminTask.moveClusterToCoreGroup([‘-source <OldCoreGroup> -target <NewCoreGroup> -clusterName <clusterOne>]’)
Example 9-11 Jython commands for moving servers between core groups
AdminTask.moveServerToCoreGroup([‘-source <OldCoreGroup> -target <NewCoreGroup> -nodeName <myNode> -serverName <myServer>]’)
In Example 9-10 and Example 9-11:
� OldCoreGroup: source core group name of the cluster or application server
� NewCoreGroup: name of the destination core group into which the cluster or application server has to be moved
� clusterOne: name of the cluster to be moved
� myNode: node name of the application server to be moved
� myServer: name of the application server to be moved
Creating virtual host aliasesWhen you have created the clusters using scripting, you now must create the respective virtual host aliases corresponding to the HTTP transport port values of all the cluster members. You perform this step so that the Web modules of applications deployed on the clusters can be mapped to the virtual host.
Example 9-12 shows how to create a virtual host alias.
Example 9-12 Creating a virtual host alias
AdminConfig.create('HostAlias', <vhost>, [['hostname', '*'], ['port', <port_number>]], 'aliases')
In Example 9-12:
� vhost: configuration ID for the virtual host
� port_number: value for the port number attribute for the virtual host alias
For example, vhost = AdminConfig.getid('/VirtualHost:default_host/') defines the configuration ID for the default_host virtual host.
Chapter 9. System management and configuration 183
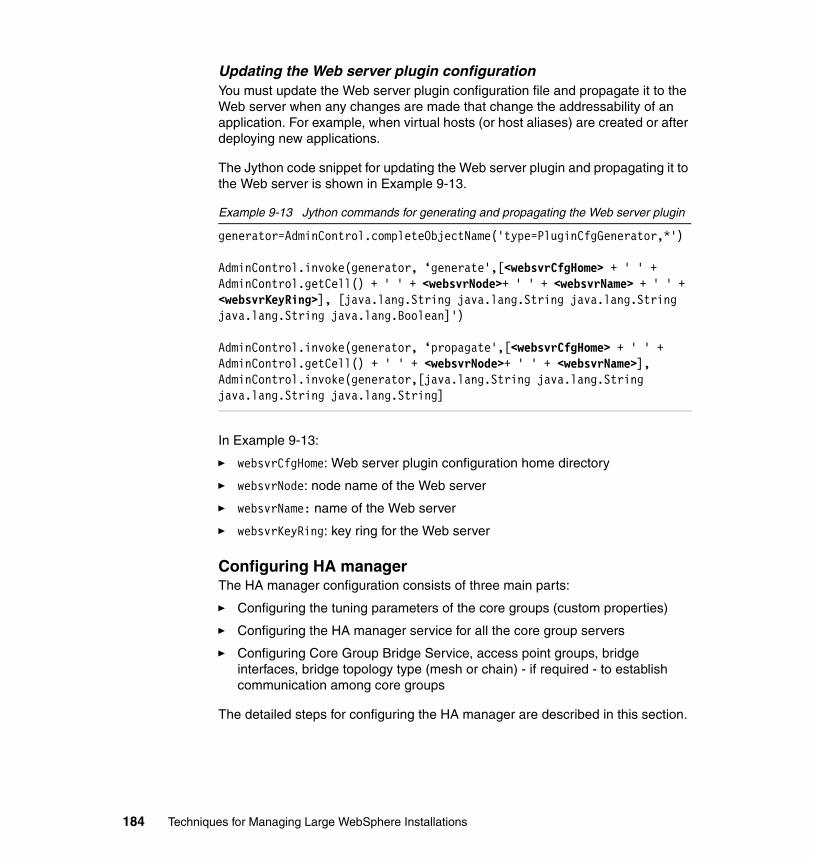
Updating the Web server plugin configurationYou must update the Web server plugin configuration file and propagate it to the Web server when any changes are made that change the addressability of an application. For example, when virtual hosts (or host aliases) are created or after deploying new applications.
The Jython code snippet for updating the Web server plugin and propagating it to the Web server is shown in Example 9-13.
Example 9-13 Jython commands for generating and propagating the Web server plugin
generator=AdminControl.completeObjectName('type=PluginCfgGenerator,*')
AdminControl.invoke(generator, ‘generate',[<websvrCfgHome> + ' ' + AdminControl.getCell() + ' ' + <websvrNode>+ ' ' + <websvrName> + ' ' + <websvrKeyRing>], [java.lang.String java.lang.String java.lang.String java.lang.String java.lang.Boolean]')
AdminControl.invoke(generator, ‘propagate',[<websvrCfgHome> + ' ' + AdminControl.getCell() + ' ' + <websvrNode>+ ' ' + <websvrName>],AdminControl.invoke(generator,[java.lang.String java.lang.String java.lang.String java.lang.String]
In Example 9-13:
� websvrCfgHome: Web server plugin configuration home directory
� websvrNode: node name of the Web server
� websvrName: name of the Web server
� websvrKeyRing: key ring for the Web server
Configuring HA managerThe HA manager configuration consists of three main parts:
� Configuring the tuning parameters of the core groups (custom properties)
� Configuring the HA manager service for all the core group servers
� Configuring Core Group Bridge Service, access point groups, bridge interfaces, bridge topology type (mesh or chain) - if required - to establish communication among core groups
The detailed steps for configuring the HA manager are described in this section.
184 Techniques for Managing Large WebSphere Installations

Configuring core group custom propertiesThe different custom properties and their functionalities are described in Table 9-1.
Table 9-1 Core group custom properties
To create a custom property, we must determine the configuration ID of the core group, then the name, and the value pair constituting the attributes of the custom property to be created, as shown in Example 9-14 and Example 9-15.
Example 9-14 Obtaining configuration ID for the core group
cgId = AdminConfig.getid('/Cell:myCell/CoreGroup:myCgName')
myCell and myCgName are the names of the cell and core group, respectively.
For creating a custom property IBM_CS_WIRE_FORMAT_VERSION with a value of 6.1.0, we set the property attributes and create the custom property as shown in Example 9-15.
Example 9-15 Creating custom property using AdminConfig object
attrs = [['name', IBM_CS_WIRE_FORMAT_VERSION], ['value', 6.1.0]]AdminConfig.create('Property', cgId, attrs )
Property name Description
IBM_CS_WIRE_FORMAT_VERSION Specifies the value among one of the supported core group protocols: 6.0.0, 6.0.2.9, or 6.1.0
IBM_CS_UNICAST_DISCOVERY_INTERVAL_SECS
Specifies the discovery protocol for a core group
IBM_CS_FD_PERIOD_SECS Configures the failure detection protocol time interval between consecutive heartbeats for a core group
IBM_CS_FD_CONSECUTIVE_MISSED Species the number of heartbeats that are missed before the failure detection protocol assumes that the core group member failed
IBM_CS_DATASTACK_MEG Specifies the amount of memory used by the core group data stack
IBM_CS_SOCKET_BUFFER_SIZE Changes the size of the socket buffer that the core group transport obtains
Chapter 9. System management and configuration 185
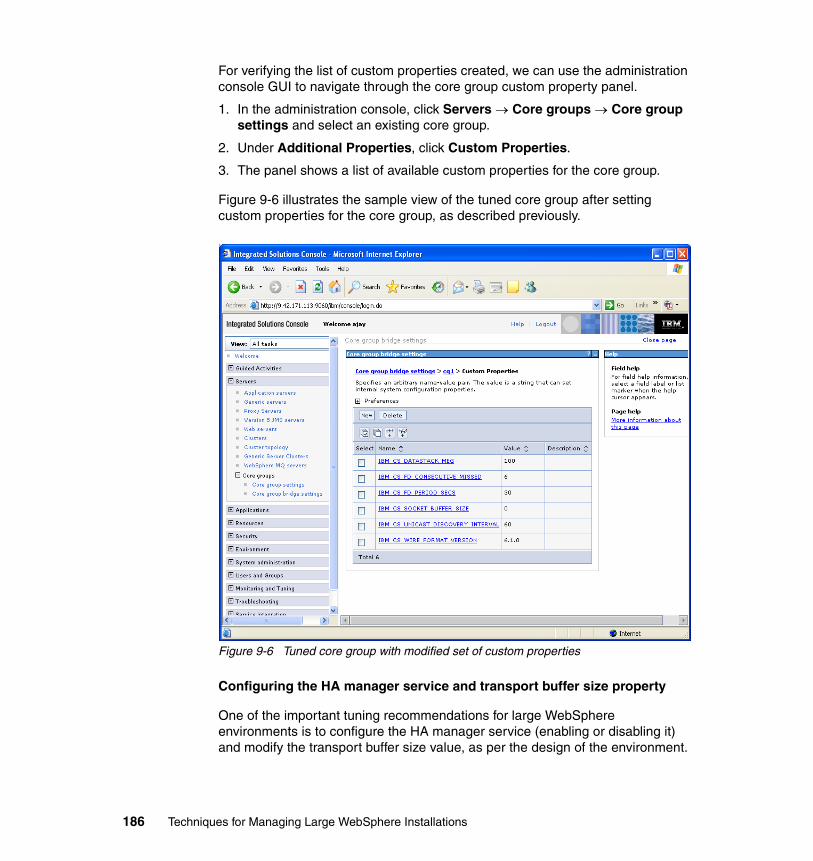
For verifying the list of custom properties created, we can use the administration console GUI to navigate through the core group custom property panel.
1. In the administration console, click Servers → Core groups → Core group settings and select an existing core group.
2. Under Additional Properties, click Custom Properties.
3. The panel shows a list of available custom properties for the core group.
Figure 9-6 illustrates the sample view of the tuned core group after setting custom properties for the core group, as described previously.
Figure 9-6 Tuned core group with modified set of custom properties
Configuring the HA manager service and transport buffer size property
One of the important tuning recommendations for large WebSphere environments is to configure the HA manager service (enabling or disabling it) and modify the transport buffer size value, as per the design of the environment.
186 Techniques for Managing Large WebSphere Installations

Enabling or disabling the HA manager serviceThe HA manager service itself can be enabled or disabled, as needed, in accord with the requirements of the design of your large WebSphere installation environment. The enabling and disabling has to be performed at the server level for each of the core group members separately.
Modifying transportBufferSize for the HA managerWe recommend you modify the transport buffer size for the HA manager service. To modify the HA manager transport buffer size using Jython scripting, you must first obtain the configuration object ID for the particular core group member (CG_member1) and then the ID for the HA manager service for that core group member (see Example 9-16).
Example 9-16 Obtaining config IDs of server and HA manager service for the server
serverId = AdminConfig.getid(‘/Server:CG_member1/’)hamId = AdminConfig.list('HAManagerService', serverId)
Then using the HA manager service config id (obtained previously in Example 9-16), you can enable or disable the property value for the HA manager service and also modify the transportBufferSize property value (this is applicable only when the HA manager service is enabled), as illustrated in Example 9-17.
Example 9-17 Modifying the HA manager service and transport buffer size properties
AdminConfig.modify(hamId, [['enable', “false”]])AdminConfig.modify(hamId, [['transportBufferSize', “100”]])
Note: By default the HA manager service is enabled for all application servers and cluster members during their creation, irrespective of the core groups they get assigned to.
Note: When modifying these properties for all members of a core group, you can make use of a for loop in your scripts. The scripts enable you to run the AdminConfig.modify() command for all application servers within the core group.
Chapter 9. System management and configuration 187

You can verify the configurations made via scripting from the administration console using the following steps:
1. In the administration console, click Servers → Application servers → <CG_member1>. Under Additional properties, click Core group service (see Figure 9-7).
Figure 9-7 Console view of HA manager configuration panel
2. Verify whether the HA manager service (the Enable service at server startup check box) and the transport buffer size text field values match the ones set using the Jython script in Example 9-17 on page 187.
188 Techniques for Managing Large WebSphere Installations

Configuring preferred coordinators for the core groupTo configure the preferred coordinators for the core group, you need the server config id for the server that will be the preferred coordinator (see Example 9-18).
Example 9-18 Configuring core group preferred coordinators
server = AdminConfig.getid('/CoreGroup:<cgName>/CoreGroupServer:<svr>') attrs = []attrs.append(['numCoordinators', <cgNumCoordinators>])attrs.append(['preferredCoordinatorServers', coordinatorIdList])AdminConfig.modify(cgId, attrs)
In Example 9-18:
� cgName: name of the core group
� svr: name of the preferred coordinator core group server
� cgNumCoordinators: number of core group coordinators to be configured
Chapter 9. System management and configuration 189

The configuration can then be verified using the administration console and following these steps:
1. In the administration console, click Servers → Core groups → <cg1>.
2. Select Preferred coordinator servers, as shown in Figure 9-8.
Figure 9-8 Preferred coordinators for a core group
Configuring Core Group Bridge ServiceYou configure the Core Group Bridge Service to establish communication between core groups - that is, to share the availability status of the servers in each core group among all other configured core groups. You configure an access point group to establish communication between core groups. (An access point group is a collection of core groups that communicate with each other. For more information about access points and the Core Group Bridge Service, refer
190 Techniques for Managing Large WebSphere Installations

to Chapter 4, “Core group bridging” on page 45 and to Chapter 7, “Best practices and tuning recommendations for large environments” on page 105.)
Configure an access point group to define the core groups that must communicate. To do so, you can choose an existing access point group or create a new access point group.
Creating an access point groupExample 9-19 shows the process of creating an access point group.
Example 9-19 Create an access point group
attrs = ['name', <apgName>]cellId = AdminConfig.getid('/Cell:<cellName>/')cgbsId = AdminConfig.list('CoreGroupBridgeSettings', cellId) AdminConfig.create('AccessPointGroup', cgbsId, attrs)
In Example 9-19:
� apgName: name of the access point group to be created
� cellName: name of the cell containing the core group and the access point groups
Configuring an access point groupTo configure an access point group, use the commands shown in Example 9-20.
Example 9-20 Configure an access point group
apgId = AdminConfig.getid('/AccessPointGroup:<apgName>/')cgapIdAttrs = []cgapIdAttrs = cgapIdAttrs.append(<cgName>)cgrefs = [ ['coreGroupAccessPointRefs', cgapIdAttrs ] ]
AdminConfig.modify(apgId, cgrefs) )
In Example 9-20:
� apgName: name of the access point group to be created
� cgName: name of the core group
Chapter 9. System management and configuration 191
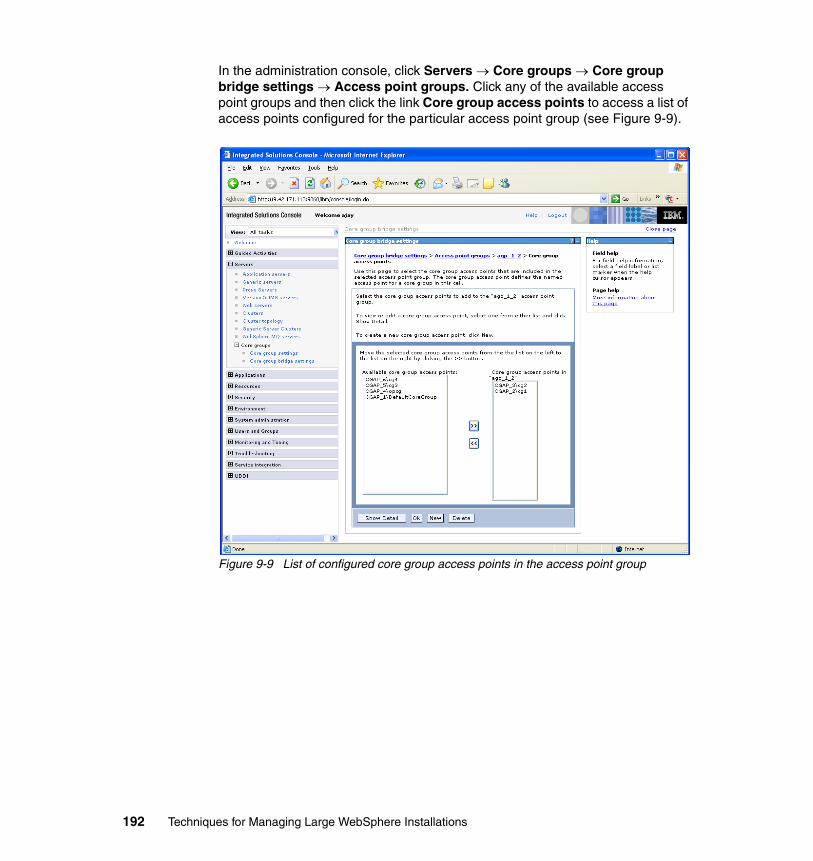
In the administration console, click Servers → Core groups → Core group bridge settings → Access point groups. Click any of the available access point groups and then click the link Core group access points to access a list of access points configured for the particular access point group (see Figure 9-9).
Figure 9-9 List of configured core group access points in the access point group
192 Techniques for Managing Large WebSphere Installations

Configuring core group bridgingUse the Jython commands shown in Example 9-21 to establish the Core Group Bridge Service between core groups.
Example 9-21 Creating bridge interfaces between core groups
bridgeInterfaceAttrs = []bridgeInterfaceAttrs.append([ ['node', <nodeName>], ['server', <bridgeServer>], ['chain', 'DCS'] ])
attrs = [ ['bridgeInterfaces', bridgeInterfaceAttrs ] ]clearAttrs = [ ['bridgeInterfaces', [] ] ]
cgapId = AdminConfig.list('CoreGroupAccessPoint')cg = AdminConfig.showAttribute(cgap, 'coreGroup')
AdminConfig.modify(cgapId, clearAttrs) AdminConfig.modify(cgapId, attrs)
In Example 9-21:
� bridgeServer: server constituting the bridge interface for the core groups
� nodeName: node name of the server where the bridge server exists
Using the administration console, you can verify the bridge interfaces settings by completing the following steps:
1. In the administration console, click Servers → Core groups → Core group bridge settings → Access point groups and select an existing access point group.
2. Under Additional Properties, click Core group access points → <apgName> → Bridge interfaces and select an existing bridge interface.
Chapter 9. System management and configuration 193

Figure 9-10 shows the administration console view of a bridge interface.
Figure 9-10 Core group bridge
Modifying the environmentTo modify an object in the configuration, you first need to use the AdminConfig.getid command to get the ID for the object. For example, to check whether an application server exists and get its ID, use the command in Example 9-22.
Example 9-22 Retrieving a server ID
svrId = AdminConfig.getid('/Cell:<cellName>/Node:<nodeName>/Server:<svrName>/’)
194 Techniques for Managing Large WebSphere Installations

Then you can use general conditional statements such as the if statement to verify whether the svrId returned is not null, which signifies that the server exists. If svrId returns a null value (an empty string), the server you queried does not exist in the configuration.
Another similar usage of modification statements is in a scenario in which a cluster with n number of members is already configured. Suppose you, as the administrator, want to add or remove members from the cluster.
A simple approach to adding or removing cluster members is to delete the cluster and re-create it with the new set of members. A better way of achieving this is to determine whether the members you want to create or remove already exist in the cluster. If so, skip those members during the creation process and remove them during the removal process. If the members do not exist, create them in the creation process and do nothing for the removal process. The Jython procedures in Example 9-23 and Example 9-24 demonstrate how to create a cluster member after checking for its existence.
Example 9-23 Creating a cluster member in a server cluster
def createClusterMember( <clsName>, <clsMember> ):if ( not clusterMemberExists( <clsMember>) ):
log(INFO_, "Creating ClusterMember " + clsMember)<<< Code for creating cluster member goes here >>>
else:log(INFO_, "ClusterMember <clsMember> already exists, do nothing.")
#endIf#endDef
In Example 9-23:
� clsName: name of the server cluster
� clsMember: name of the cluster member to be created
The Jython function (or procedure) clusterMemberExists, referred to in Example 9-23, is shown in Example 9-24.
Example 9-24 Determining whether a cluster member exists
def clusterMemberExists( <clsMember> ):return ( AdminConfig.getid(‘/Server:<clsMember>/’) !=’’)
#endDef
clsMember is the name of the cluster member to be checked to determine whether it exists.
Chapter 9. System management and configuration 195

The procedure shown in Example 9-24 on page 195 returns a boolean value of true if the configuration ID for the cluster member (clsMember) is found (that is, no null value is returned from the AdminConfig.getid() method). If the configuration ID for the cluster member is found to be a null value (that is, an empty string), the if condition fails and a boolean value of false is returned.
Thus with a simple preliminary check approach using scripts, we can provide an incremental solution to configure or modify even more complex objects. This approach mainly simplifies the reconfiguration process in the case of large WebSphere installations, enabling you to modify the existing topology configurations with a minimum of changes.
Controlling runtime objectsControlling runtime objects consists of performing runtime tasks with the configuration data. For example, with any configuration changes that occur in the environment, you might have to restart the application servers, node agents, clusters, and so on. The usual runtime operations performed on clusters, servers and node agents are start, stop, restart, and so on. This section provides the Jython commands for performing these operations.
Run the Jython commands in Example 9-25 to start a server.
Example 9-25 Starting a server
na = AdminControl.queryNames('type=NodeAgent,node=<nodeName>,*')AdminControl.invoke(na, 'launchProcess', '<serverName>', '[java.lang.String]')
Run the Jython commands in Example 9-26 to stop a server.
Example 9-26 Stopping a server
AdminControl.invoke(<server>, 'stop')
In Example 9-26:
� server: configuration ID of the server to be stopped
Run the Jython commands in Example 9-27 to retrieve the status of a server.
Example 9-27 Retrieving the server status
server = AdminControl.completeObjectName('type=Server,name=<svr>,*')
196 Techniques for Managing Large WebSphere Installations

On running this Jython command, an object is returned only if the server is running; otherwise, an empty string is returned. Hence using an if condition statement and checking for none value (which corresponds to an empty string) of a server variable, you can determine whether the server is stopped or running.
Configuration changes made at the Deployment Manager must be synchronized with the nodes after saving the configuration.
Use the Jython scriptlet in Example 9-28 to synchronize nodes.
Example 9-28 Synchronizing nodes
sync=AdminControl.completeObjectName('type=NodeSync,node=<nodeName>,*’)
AdminControl.invoke(sync, 'sync')
nodeName is the name of the node that has to be synchronized.
While working with runtime operations, especially with large WebSphere Application Server installations, you must allow sufficient time during the server starts, stops, and node sync operations.
A sample Jython procedure, as shown in Example 9-29, shows one possible means of waiting for a certain period of time to allow the server (or node agent) to reach the desired state before carrying out future operations on them.
Example 9-29 Wait for a scheduled time to allow server to be in the desired state
def isServerInState( <serverName>, <desiredState> ):actualState = AdminControl.getAttribute(<serverName>, 'state')log(INFO_, " ** Actual state: " + actualState + " Desired state: " +
desiredState) return (actualState == desiredState);#endDef
def waitForServerState( <serverName>, <desiredState> ):retries = -1while ((not isServerInState(<serverName>, <desiredState>)) and
retries < 30 ): sleep(5) retries += 1
#endWhilesleep(3)
#endDef
Chapter 9. System management and configuration 197

In Example 9-29 on page 197:
� serverName: name of the server whose state is to be determined
� desiredState: desired state of the server its expected to be in
The procedure shown in Example 9-29 on page 197 first determines the current state of the server using the isServerInState function. Based on the boolean value (true or false) it returns, the while loop is executed. For example, if you expect the server to be stopped (desired state) and its current state is started (actual state), the isServerInState function returns false. In this case, the program enters the while loop waiting for five seconds and after five seconds checks again for the current server status to be stopped. If it is stopped, the while loop ends. If the server has not stopped, the loop continues with wait time intervals of five seconds and runs for a maximum of 30 iterations before timing out.
9.2.4 Application deployment
When we describe application deployment, the description quickly becomes more complicated than the deployment we used in our lab setup. In a production environment, the full life cycle, versioning, responsibilities, and much more must be considered.
This section briefly introduces deployment mechanism we used in our lab setup. We prepared the deployment itself as a script.
Basic deploymentThe basic deployment is slightly different depending on whether it is a first-time install or an update of an existing application.
Installing an applicationTo install an application, both an application name (must be unique in a cell) and a cluster name to map to are required.
See “Options” on page 199 for a description of adding all the optional parts before the application is installed. We did added them by simply appending them to the options array as shown in Example 9-30.
Example 9-30 Setting up options for installing an application
options = [ '-appname', appName, '-cluster', clusterName ]
198 Techniques for Managing Large WebSphere Installations

Once all options have been added, install the application as shown in Example 9-31.
Example 9-31 Installing an application
AdminApp.install(<earFile>, options)
earFile is the complete path of the application file to be installed
Updating an existing applicationWhen you are setting up an update of an application, you must specify the contents of the ear file and the operation (see Example 9-32).
Example 9-32 Setting up options for updating an application
options = [ '-contents', params.get(app, "earFile"), '-operation', 'update']
See ”Options” (which follows) on how all the optional parts can be added before the application is updated. You can do so by simply appending them to the options array as specified earlier.
After you have added all the options, update the application as shown in Example 9-33.
Example 9-33 Updating an application
AdminApp.update(appName, 'app', options)
OptionsMany options are possible when deploying an application. The options you use depend on the ear and its features. For example, when you are deploying an EJB module, you can use an option that specifies binding the EJBs into the JNDI namespace. See the following sections for descriptions of various deployment options. In addition, refer to 9.3.3“Working with wsadmin objects” on page 207 to determine how you can check all available options for a specific ear file.
Chapter 9. System management and configuration 199

MapModulesToServersExample 9-34 is a deployment option used for mapping the application modules (Web or EJB) to servers (or clusters) during the installation of the application.
Example 9-34 Mapping modules to servers
options = [‘-MapModulesToServers’ [[ <moduleName>,<moduleUrl>,'WebSphere:cell=<cellName>,cluster=<clsName> ]]
In Example 9-34:
� moduleName: name of the Web/EJB module to be mapped
� moduleUrl: URL of the module to be mapped. For a Web module, it is in the following form:
– BeenThere.war,WEB-INF/web.xml
� For an EJB module, it is in this form:
– BeenThere.jar,META-INF/ejb-jar.xml
� cellName: name of the cell of the WebSphere installation
� clsName: name of cluster to which the module is mapped
MapWebModToVHYou can use this option to map Web or EJB modules to virtual host aliases during application deployment. The virtual host alias should pre-exist before running the command shown in Example 9-35.
Example 9-35 Mapping modules to virtual host aliases
options = [‘-MapWebModToVH’ [[<moduleName>,<moduleUrl>,<vhostName>]] ]
In Example 9-35:
� moduleName: name of the Web or EJB module to be mapped
� moduleUrl: URL of the Web or EJB module to be mapped to the virtual host
� vhostName: name of virtual host alias to which the Web or EJB module is mapped
200 Techniques for Managing Large WebSphere Installations

CtxRootForWebModYou can use this option to provide the context root for a Web or an EJB module for the application during its deployment (see Example 9-36).
Example 9-36 Providing context root for modules
options = [‘-CtxRootForWebMod’ [[ <moduleName>, <moduleUrl>, <ctxRootValue> ]] ]
In Example 9-36:
� moduleName: name of the Web or EJB module to be mapped
� moduleUrl: URL of the Web or EJB module to be mapped
� ctxRootValue: context root of the Web or EJB module
JSPReloadForWebModUse this option to map the xmi URL for all the JSPs in the Web or EJB module of the application being installed (see Example 9-37).
Example 9-37 Mapping the xmi URL to the JSPs in modules
options = [‘-JSPReloadForWebMod’ [[ <moduleName>,<xmiUrl>,<jspReloadForWebModFlag>,<jspReloadForWebModInterval>]] ]
In Example 9-37:
� moduleName: name of the Web or EJB module with the JSPs whose deploy options are to be overridden.
� xmiUrl: xmi URL for the JSPs in the Web or EJB module.
� jspReloadForWebModFlag: flag for the JSP™ reload option in the Web or EJB module. Valid values for this option are Yes and No.
� jspReloadForWebModInterval: JSP reload interval (in seconds) for the Web or EJB module.
MapEJBRefToEJBUse this deployment option to map EJB references to an EJB (see Example 9-38).
Example 9-38 Mapping EJB references to EJBs
options = [‘-MapEJBRefToEJB’ [[<ejbModuleName>,'',<ejbUrl>,<ejbResourceRef>, <ejbClass>, <ejbJndiName>]] ]
Chapter 9. System management and configuration 201

In Example 9-38 on page 201:
� ejbModuleName: name of the EJB module
� ejbUrl: URL of the EJB module to be mapped
� ejbResourceRef: EJB whose resource is referred
� ejbClass: class name of the EJB
� ejbJndiName: JNDI name of the EJB resource to be mapped
BindJndiForEJBNonMessageBindingUse this deployment option to bind the JNDI names to each of the EJB modules (see Example 9-39).
Example 9-39 Binding EJBs with JNDI names
options = [‘-BindJndiForEJBNonMessageBinding’ [[<ejbModuleName>, <ejbName>, <ejbUrl>, <ejbJndiName>]] ]
In Example 9-38 on page 201:
� ejbModuleName: name of the EJB module
� ejbUrl: URL of the EJB module to be mapped
� ejbName: name of the EJB
� ejbJndiName: JNDI name of the EJB to be bound
9.3 Scripting and tooling
In this section we introduce the tooling we used to do all setup, configuration, and administration tasks in our lab. We briefly describe working with the Application Server Toolkit (AST), give useful tips on important wsadmin functions, and provide the Jython scripts we created for this project.
202 Techniques for Managing Large WebSphere Installations
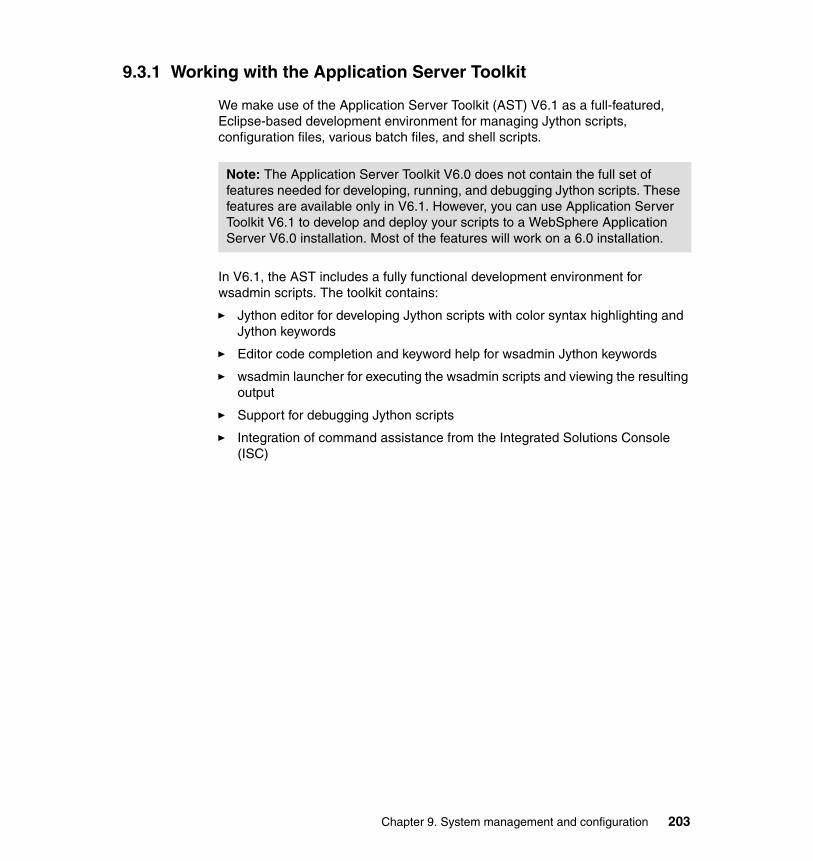
9.3.1 Working with the Application Server Toolkit
We make use of the Application Server Toolkit (AST) V6.1 as a full-featured, Eclipse-based development environment for managing Jython scripts, configuration files, various batch files, and shell scripts.
In V6.1, the AST includes a fully functional development environment for wsadmin scripts. The toolkit contains:
� Jython editor for developing Jython scripts with color syntax highlighting and Jython keywords
� Editor code completion and keyword help for wsadmin Jython keywords
� wsadmin launcher for executing the wsadmin scripts and viewing the resulting output
� Support for debugging Jython scripts
� Integration of command assistance from the Integrated Solutions Console (ISC)
Note: The Application Server Toolkit V6.0 does not contain the full set of features needed for developing, running, and debugging Jython scripts. These features are available only in V6.1. However, you can use Application Server Toolkit V6.1 to develop and deploy your scripts to a WebSphere Application Server V6.0 installation. Most of the features will work on a 6.0 installation.
Chapter 9. System management and configuration 203
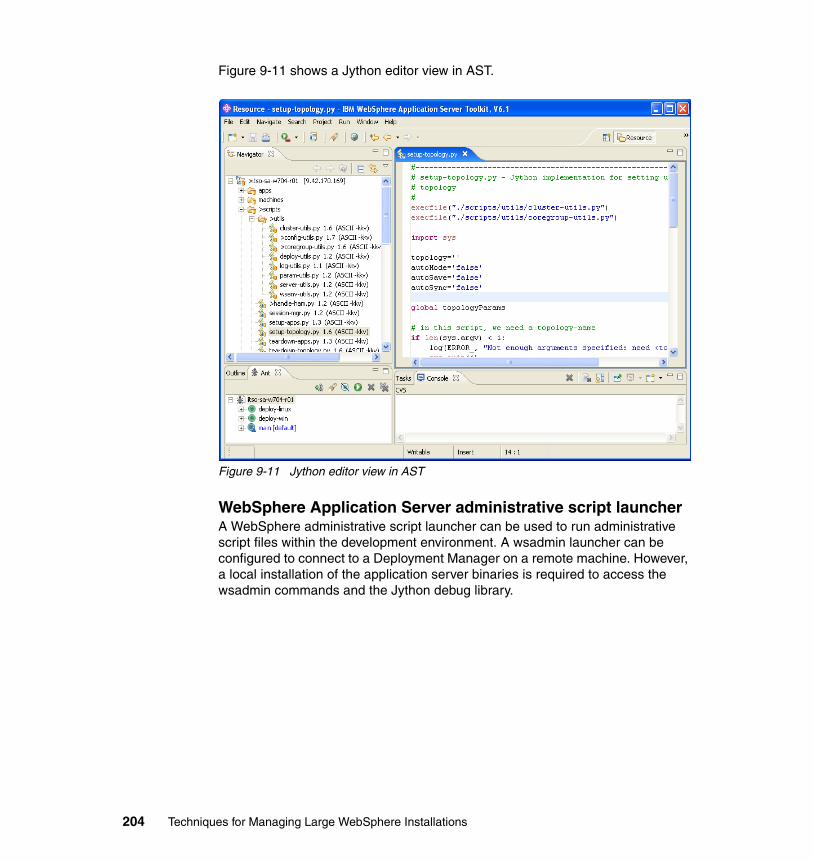
Figure 9-11 shows a Jython editor view in AST.
Figure 9-11 Jython editor view in AST
WebSphere Application Server administrative script launcherA WebSphere administrative script launcher can be used to run administrative script files within the development environment. A wsadmin launcher can be configured to connect to a Deployment Manager on a remote machine. However, a local installation of the application server binaries is required to access the wsadmin commands and the Jython debug library.
204 Techniques for Managing Large WebSphere Installations
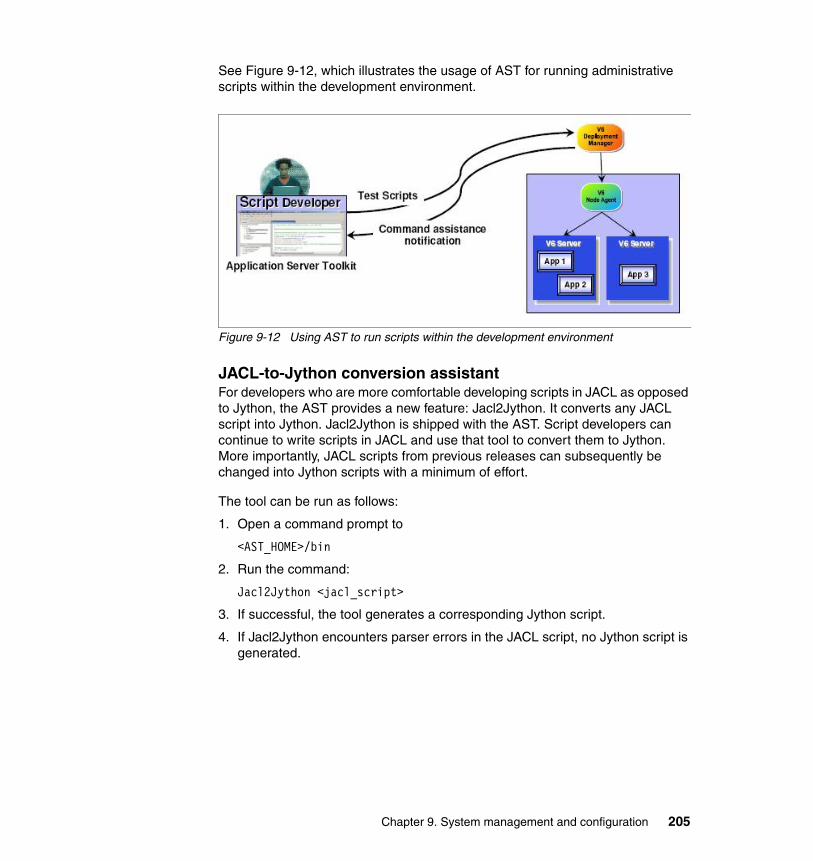
See Figure 9-12, which illustrates the usage of AST for running administrative scripts within the development environment.
Figure 9-12 Using AST to run scripts within the development environment
JACL-to-Jython conversion assistantFor developers who are more comfortable developing scripts in JACL as opposed to Jython, the AST provides a new feature: Jacl2Jython. It converts any JACL script into Jython. Jacl2Jython is shipped with the AST. Script developers can continue to write scripts in JACL and use that tool to convert them to Jython. More importantly, JACL scripts from previous releases can subsequently be changed into Jython scripts with a minimum of effort.
The tool can be run as follows:
1. Open a command prompt to
<AST_HOME>/bin
2. Run the command:
Jacl2Jython <jacl_script>
3. If successful, the tool generates a corresponding Jython script.
4. If Jacl2Jython encounters parser errors in the JACL script, no Jython script is generated.
Chapter 9. System management and configuration 205

9.3.2 Getting help with scripting from ISC
From WebSphere Application Server V6.1, the Integrated Solutions Console (ISC - formerly known as the AdminConsole) contains new features that help with script development.
In the ISC, click System Administration → Console Preferences to access the page shown in Figure 9-13.
Figure 9-13 ISC: console preferences
Tip: Use the fully qualified name for <jacl_script>, such as:
X:\MyPath\MyScript.jacl
Upon successful completion of running the tool, the corresponding Jython script is generated at
X:\MyPath\MyScript.py
206 Techniques for Managing Large WebSphere Installations

Three check boxes in Figure 9-13 on page 206 are relevant to scripting activities:
� Show the help portlet: Enabling this check box displays a help portlet on all pages. Usually a link on the current page under Page help usually accesses online help for the ISC. Additionally, whenever you perform a command via the console, a second link under Command Assistance enables you to review the last action, formulated as a wsadmin command.
� Enable command assistance notifications: Enabling this check box allows notifications to the connected AST V6.1, thus enabling interaction between the commands you perform in the ISC, and the development of scripts in AST.
� Log command assistance commands: Enabling this check box turns on a recorder of all relevant actions, which gives you the option of viewing a Jython command of the last action performed. For many of the activities that can be performed interactively on the console, you can enable login preferences.
These excellent features enable you to work with and learn about wsadmin commands, and they are easy to use.
9.3.3 Working with wsadmin objects
The wsadmin scripting program is a powerful, nongraphical command interpreter environment enabling you to run administrative operations in a scripting language. The wsadmin tool is intended for production environments and unattended operations. The wsadmin tool supports both JACL and Jython scripting languages. JACL is the language specified by default. If you prefer to use Jython scripting language, use the following startup command:
wsadmin.sh -lang Jython
Or you can specify the language option in the wsadmin.properties file under the <WAS_PROFILE_HOME>/properties directory, where WAS_PROFILE_HOME is the profile home directory of your WebSphere Application Server installation.
Restriction: Unfortunately, especially in large environments, not all functions are covered by the previously described check boxes. For example, when trying to specify a bridge interface for an access point, you see entries and links for getting named TCPEndPoints and listing eligible bridge interfaces. When you select a bridge interface and save it, you do not see a link on the page or an entry in the command assistance log file, which is when the techniques described in tChapter 10, “Problem determination” on page 221 can help.
Chapter 9. System management and configuration 207
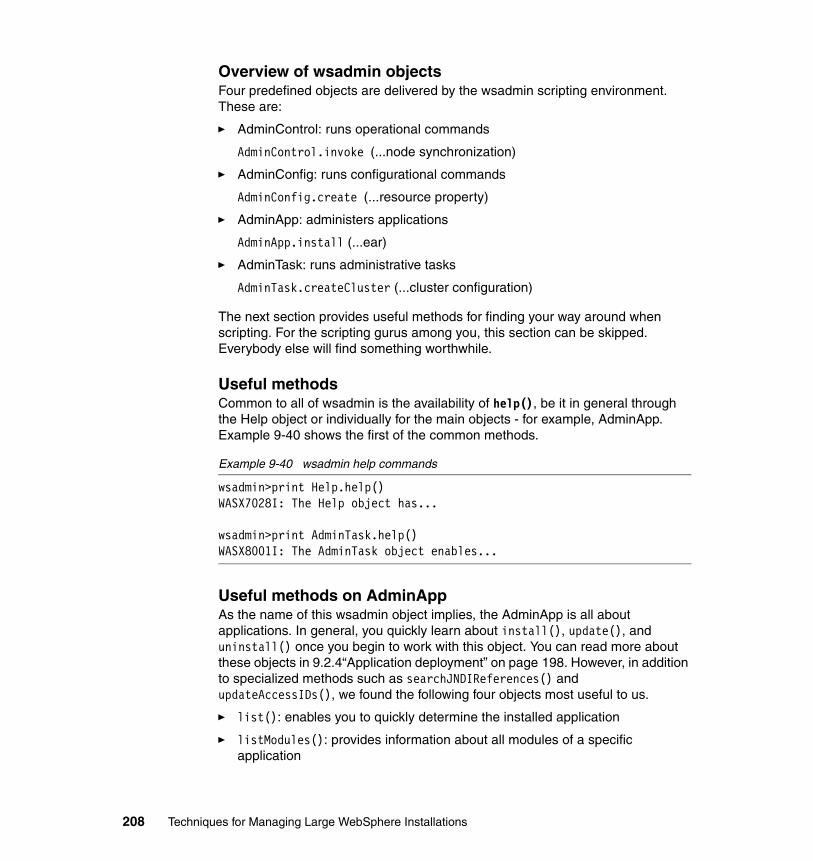
Overview of wsadmin objectsFour predefined objects are delivered by the wsadmin scripting environment. These are:
� AdminControl: runs operational commands
AdminControl.invoke (...node synchronization)
� AdminConfig: runs configurational commands
AdminConfig.create (...resource property)
� AdminApp: administers applications
AdminApp.install (...ear)
� AdminTask: runs administrative tasks
AdminTask.createCluster (...cluster configuration)
The next section provides useful methods for finding your way around when scripting. For the scripting gurus among you, this section can be skipped. Everybody else will find something worthwhile.
Useful methodsCommon to all of wsadmin is the availability of help(), be it in general through the Help object or individually for the main objects - for example, AdminApp. Example 9-40 shows the first of the common methods.
Example 9-40 wsadmin help commands
wsadmin>print Help.help()WASX7028I: The Help object has...
wsadmin>print AdminTask.help()WASX8001I: The AdminTask object enables...
Useful methods on AdminAppAs the name of this wsadmin object implies, the AdminApp is all about applications. In general, you quickly learn about install(), update(), and uninstall() once you begin to work with this object. You can read more about these objects in 9.2.4“Application deployment” on page 198. However, in addition to specialized methods such as searchJNDIReferences() and updateAccessIDs(), we found the following four objects most useful to us.
� list(): enables you to quickly determine the installed application
� listModules(): provides information about all modules of a specific application
208 Techniques for Managing Large WebSphere Installations

� options(): provides possible configurations of a certain ear file
� view(): shows the current configuration of an application and all its modules
Useful methods on AdminConfigAmong the many methods provided by AdminConfig, we found four of them especially useful:
� showall(): all attributes for a given ID of a configuration object
� types(): list of all types of configuration objects
� attributes(): all available attributes for a certain type
� required(): all required attributes for a certain type
9.3.4 Introducing a scripting project
In this section, we introduce the scripting project that evolved while creating this book. We determined that we needed quick setup and teardown options for our lab machines, and we worked with large numbers of objects. So instead of ending up with about 200 different, very specific scripts, we set up an AST project and structured it accordingly. We ended up with a fairly clearly structured API for many important tasks necessary for setting up and managing many tasks in a WebSphere environment.
The most important aspect of the approach we took for the scripting project was the separation of configuration data and the scripts themselves. To achieve that, we made use of the ConfigParser module class, which is available in the Jython library and provides just a basic configuration file parser language.
Attention: Be sure that you fully understand all of the scripts provided as additional material with this book before using any of the project scripts in your environment.
Chapter 9. System management and configuration 209

ConfigParserThe ConfigParser class implements a basic configuration file parser language that provides a structure similar to that found in Microsoft Windows .ini files. You can use this class to feed Jython scripts in a highly parameterized manner (see Example 9-41).
Example 9-41 ConfigParser input
[coregroups]items: cg1,cg2
[cg1]clusters: WebCluster01
[cg2]clusters: WebCluster02
As shown in Example 9-41, we can identify a so-called section (for example [coregroups]) that contains one or more options (for example, items: cg1,cg2). Another item of note in the example is that in the section [coregroups], we see two items: Their names are used as their own sections [cg1] and [cg2] with their own options. This features gives you the ability to build hierarchical configurations. ConfigParser includes methods for checking the availability of sections and options. The configuration file consists of sections, each led by a [<section>] header and followed by name: value entries, with continuations in the style of RFC 822; name=value is also accepted.
Value interpolation using Python formatting strings is also supported. This feature enables you to build values that depend on one another (this is especially handy for paths or URLs).
Development and maintenance of the scriptsThe scripting project was treated as a standard development project in the sense that it was checked in a CVS (Concurrent Versioning System) and included versioning, builds, and deployments. It was, however, slightly simpler than a full-blown project.
The build does not currently exist; however, a build can be developed (through Ant filtering) as soon as the project includes multiple target environments with specific parameters.
The deployment of the scripts to the target machine (in our case the Deployment Manager machine and the target servers for managing profiles and log files) is done by using Ant to copy selected files onto shared file systems on these machines (for Linux) and on the common file share (for Windows).
210 Techniques for Managing Large WebSphere Installations

Structure of the projectIn this section, we briefly describe the most important files in the project. Follow the instructions given in Appendix A, “Additional material” on page 315 to download and use the additional material. The structure is shown in Figure 9-14.
Figure 9-14 Project folder structure
Chapter 9. System management and configuration 211

Top-level filesAt the top-level, we placed only two files (besides the omnipresent .project file). These files are needed by Ant.
� build.xml: Ant build file to deploy the script files to target machines
� build.properties: properties used by the Ant build file
Folder appsThe apps folder contains applications we used during our lab work. This location most likely is not where you would create such a file in a production or any other multiple application environment. Instead you would probably use a specified location on some designated share for users to deliver their applications to. (Or even better, use no binaries at all - instead, start the deployment process from the source repository by creating the build prior to actual deployment.) The solution in use here is just enough for what we needed for our lab work.
Folder binThe bin folder contains the main scripts and batch files common to a certain environment. These three are used by machine-specific scripts:
� setup-profile.sh (.bat): create a profile and federate it into the cell
� sync-and-start-node.sh (.bat): sync and start a node
� teardown-profile.sh (.bat): unfederate a node and delete its profile
While the following scripts can be used on any machine, we usually used them on our Deployment Manager machine. These batch files simply connect to the Deployment Manager and start a Jython script:
� setup-topology.bat: Starts the Jython-Script scripts/setup-topology.py, which is described in section “Folder scripts” on page 213.
� modify-topology.bat: Starts various Jython-Scripts depending on the argument this batch-file is given. Among these are scripts/ham-config.py, scripts/vhost-aliases.py, which are described in “Folder scripts” on page 213.
� teardown-topology.bat: Starts the Jython-Script scripts/teardown-topology.py described in “Folder scripts” on page 213.
� setup-apps.bat: Starts the Jython-Script scripts/setup-apps.py described in “Folder scripts” on page 213.
� teardown-apps.bat: Starts the Jython-Script scripts/teardown-apps.py described in “Folder scripts” on page 213.
� test.bat: Starts the Jython-Script scripts/test.py described in “Folder scripts” on page 213.
212 Techniques for Managing Large WebSphere Installations

Folder machinesFor each machine participating in our WebSphere environment, we collected the profile-management scripts in their own directories - for example, appsrv1, appsrv2, x3950, x445. Each directory contains these scripts:
� <machine>-setup-profile.sh (.bat): Calls the common script setup-profile.sh (.bat) for all the profiles planned for this machine. Each profile is created, and its node is immediately federated into the cell.
� <machine>-sync-and-start-node.sh (.bat): Calls the common script sync-and-start-node.sh (.bat) for each node residing on this machine. Each node is synchronized and started.
� <machine>-teardown-profile.sh (.bat): Calls the common script teardown-profile.sh (.bat) for each node residing on this machine. Each node is unfederated from the cell, and its profile is deleted.
On Linux machines, we used three additional scripts:
� <machine>-archive-logs.sh: Copies the important log files (SystemOut.log, SystemErr.log, trace.log, and so on) of all servers (the list of servers is hard-coded in the script) on a machine to a designated folder and packs them into a tar file
� <machine>-clear-logs.sh: Clears out the important log files (SystemOut.log, SystemErr.log, trace.log, and so on) of all servers on a machine (the list of servers is hard-coded in the script).
� <machine>-tune-redhat.sh: Applies recommended tuning to Linux machines
This arrangement of scripts allows separate deployment of the scripts to each machine, which we recommend. Separate deployment can easily be done with pattern-matching rules for the fileset selection in the build process.
Folder scriptsThis folder is the entry point for Jython-Scripts. The scripts mostly contain control-flow logic, and some initial configuration parsing logic. Note that the most important input is the scenario configuration files, described next in “Folder topologies” on page 216.
� setup-topology.py: This script is used to create standalone application servers, clusters, and cluster members. It also creates core groups and manages core group members (that is, it moves them from one core group to another). The processes that must be moved are stopped first. The script checks each individual object before it creates it; therefore, this script can be run multiple times with no issue. The script reads configuration files <scenario>/<scenario>.dat from the topologies folder described in “Folder topologies” on page 216.
Chapter 9. System management and configuration 213

� teardown-topology.py: Counterpart of the setup script mentioned previously, this script is used to tear down servers, clusters, and core groups. It also moves core group members (such as node agents) back to the default core group in order to be able to remove the core group itself. The script reads configuration files <scenario>/<scenario>.dat from the topologies folder.
� setup-apps.py: This script is used for deployment of applications. It accomplishes this straightforward but allows the deployment of a single application on multiple clusters (using indexed values where needed), which was necessary for us but probably would not be in other cases. Some options are already supported for specification (such as MapWebModToVH, CtxRootForWebMod, MapModulesToServers, JSPReloadForWebMod, MapEJBRefToEJB, and BindJndiForEJBNonMessageBinding). Others can easily be added. The script reads configuration files <scenario>/<scenario>-apps.dat from the topologies folder.
� teardown-apps.py: Counterpart to the setup-apps.py script, this script is used to uninstall applications. The script reads configuration files <scenario>/<scenario>-apps.dat from the topologies folder.
� ham-config.py: This script is used to configure core group, core group bridging, and the HA manager of selected processes. It can also disable the HA manager for a whole core group if specified. The script reads configuration files <scenario>/<scenario>-ham-config.dat from the topologies folder.
� plugin-config.py: This script generates and propagates the plugin configuration for the current set of applications. This script assumes that the virtual host bindings and port assignments are already finished and current (see later in this list for a description of vhost-aliases.py). The script reads configuration files <scenario>/<scenario>-vhost-aliases.dat from the topologies folder.
� session-mgr.py: This script configures session manager settings on all members of a cluster, for both Web and EJB modules. It also creates replication domains, currently one per cluster. In a real-world environment, this script probably should be more flexible. The script reads configuration files <scenario>/<scenario>-apps.dat from the topologies folder.
� vhost-aliases.py: This script collects virtual host bindings for all given cluster members and standalone application servers relevant to HTTP and HTTPS transports. It first clears the already-configured ports to avoid duplicate entries and adds port 80 hard coded. The script reads configuration files <scenario>/<scenario>-apps.dat from the topologies folder.
214 Techniques for Managing Large WebSphere Installations

� test-*.bat: Individual test scripts for various scenarios. They all follow the same pattern:
a. Perform an operation; wait for it to finish.
b. Pause a reasonable amount of time to let the system settle down.
c. Repeat step a.
Folder scripts/utilsThe actual scripting is located in this folder. The scripts are separated in various files grouping together similar functionality. We included all scripts that we used in our test setups; however, the collection is definitely far from being complete. A rough outline of what is covered in each script follows:
� cluster-utils.py: Contains scripts that peform operations on clusters and cluster members.
� cluster-control-utils.py: Performs control operations on clusters, such as starting, stopping, and detecting the current state of a cluster.
� server-utils.py: Contains scripts that peform operations on servers (clusters or standalone application servers). Additionally includes a function to configure the session manager of an application server.
� server-control-utils.py: Performs control operations on servers, such as (re)starting, stopping, and detecting the current state of a server. It also allows batch-start of multiple servers (nonblocking calls, wait in the end for all).
coregroup-utils.py: Contains scripts that perform operations on:
– Core groups, including custom properties, bridge interfaces, and preferred coordinators
– Access point groups
– HA manager configuration (enabling and disabling, transport buffer size)
– Members moved between core groups (servers and clusters)
This file also contains methods, which must be relocated into the control operations.
� deploy-utils.py: Covers operations to install, update, and uninstall applications on clusters.
� wsenv-utils.py: Performs operations for replication domains (such operations as create, read, update, and delete) and for plugin configuration management (operations such as virtual host bindings and generating and exporting the configuration).
Chapter 9. System management and configuration 215
� config-utils.py: Contains multiple groups for various basic functionality, including helper functions to handle config IDs and lists of them, functions for saving and synchronizing configuration changes, and helpers with the ConfigParser methods.
� param-utils.py: Enables the parsing of specified configuration files, following the naming conventions mentioned previously.
� log-utils.py: Taken from online script samples and used almost as is.
Folder topologiesLast but not least, this folder contains the scenarios that we set up while writing this book. We provide a brief overview of the structure for scenario2 (to make the configurations for multiple core groups available for explanation).
The files are currently somewhat separated, but we could have just as easily used only a single file. The following files are located in the folder topologies/scenario2.
� scenario2.dat: The basic topology configuration data is located in this file. It covers the list of core groups; for each it covers the list of clusters, node agents, and servers to configure as members. It also contains a list of cluster types. A cluster type is an artificial construct containing one or more clusters that use the same list of member types. A member type is the definition of a certain type of application server (defined by the template to be used when creating it), the node to place it on, and one or more member names. Finally, a list of standalone application servers can be defined. Each server is defined again by a node (to place it on), a template (to use for creation), and a name.
� scenario2-apps.dat: This configuration file contains all definitions required for the deployment of applications on a given topology. A list of applications ready for deployment is provided. To fully define an application, the name (and relative path) of the ear file must be given, as well as an application name, a list of the modules in the application, and the lclusters where the application is going to be deployed. The cluster list can be used for multiple modules, which depend on each other (a feature that is probably not realistic in a real-world environment). To complete the definitions, the modules have to be specified with several options (for example, MapModulesToServer).
� scenario2-ham-config.dat: This configuration file contains information about core groups, bridging, and HA manager configuration. A list of access point groups can be given, each one specified by the list of core groups they should connect. A list of core groups also can be given; each core group is specified by the number of active coordinators, the (ordered) list of preferred coordinators, the list of bridge servers, the configuration of the core group itself, as well as the configuration of the HA manager of all the members of the core group. The folder contains additional configuration files - one is a bridging configuration, the other a disconnected one. We used them in turn by
216 Techniques for Managing Large WebSphere Installations

copying and changing the name to the one shown here (to follow the established naming convention). A configuration for a core group can contain a list of named custom properties and an HA manager configuration. A configuration for a core group also can enable or disable it and sets the transport buffer size explicitly.
� scenario2-session-mgr.dat: This configuration file can contain multiple session management configurations, targeted for different groups of clusters. A single configuration provides parameters for specifying the replication domain to be used, whether stateful session bean failover should also be enabled, and the configuration and tuning of the replication to be used.
� scenario2-vhost-aliases.dat: This configuration file contains a list of clusters as well as a list of servers, which should be considered when managing the virtual host bindings (currently only default_host is supported). As a target for the generation and propagation of the plugin configuration, a list of Web servers can be specified. The path to the profile of the Deployment Manager is specified as a fully qualified path. This can be changed to the variable ${USER_INSTALL_ROOT} instead. For each Web server defined, the name of the server as well as the target node has to be defined.
All these configuration files have two statements similar to those shown in Example 9-42.
Example 9-42 Common configuration
[cell]name: kpxv838Cell01
[mnodes]items: node_op01,node_op02,node_web01,...
The name of the cell can be derived at runtime; thus, a configuration can be used regardless of the name of the cell. The list of nodes seen in the section [mnodes] can also be derived at runtime. They can be derived by calculating the nodes affected by configuration changes and synchronizing them (or retrieve the list of nodes from the cell and synchronize them).
How to run a scriptRunning a script is as easy as it sounds. You need to change the settings for the Deployment Manager in the script shown in Example 9-43 before you run it.
Example 9-43 Invoking setting up the topology for scenario 1
cd %script_home%\binsetup-topology.bat scenario1
Chapter 9. System management and configuration 217

In Example 9-43 on page 217:
� %script_home%: Location where you unpacked/deployed/installed the script project on your machine.
� scenario1: Scenario you run; this implies that scenario1*.dat files are present in the topologies directory.
The following section describes the general flow of the script and what the script does.
Flow of the scriptWhen we ran a script for our project, several general steps were invoked to set up the proper control for the actual methods called to modify the installation. Utilities such as logging, configuration, and save and synchronize dialogs are provided.
If you start a script as shown in Example 9-43 on page 217, the following steps are executed in the Jython part. (They are executed after calling wsadmin.bat with setup-topology.py as the script to be executed.)
1. Check that the arguments at least provide the name of the scenario to be run
2. Load the parameters for the given scenario by using the ConfigParser; the input file is found in topologies/scenario1.dat.
3. Parse the list of items for each section [servers]that is present. For each of the standalone application servers, determine whether the current standalone application server exists. If not, create the standalone application server.
4. Parse the list of items for each section [clusterTypes] that is present. If the section of the current clusterType contains the option [items], for each of the clusters do the following:
a. If the current cluster does not exist, create the cluster.
b. For all specified cluster members (types are used to distinguish the nodes they are created on), create the cluster member. (The first member is created slightly different than the remaining members.)
5. If the section [coregroups] is present, parse its list of items, and for each of the core groups do the following:
a. If the current core group does not exist, create the core group.
b. For the option [clusters] on the current core group section, parse the list of items, and for each of the clusters do the following:
i. Determine the core group the cluster has to be moved from.
ii. Move the cluster to the current core group.
218 Techniques for Managing Large WebSphere Installations

c. For the option [servers] on the current core group section, parse the list of items, and for each of the servers do the following:
i. Determine both the node name of the server and the core group the server has to be moved from.
ii. Move the server to the current core group.
d. For the option [nodeagents] on the current core group section, parse the list of items. For each of the nodes, move the node agent of the current node to the current core group.
e. Ask the user, whether the changes should be saved:
f. If the changes should be saved
i. Save the changes
ii. Ask the user, whether to synchronize the nodes; if the nodes should be synchronized, synchronize them.
g. Finish.
To review, this script creates all standalone application servers, clusters, and cluster members, and it moves them into the specified core groups that are also created along the way.
Although they have different objectives as to the changes that are made to the current configuration, all other scripts follow the same pattern. Most of the scripts can be run multiple times without creating duplicates.
Further improvementsWhen you read the description of the scripting project we set up for our work, you may question some of its design aspects. However, these scripts are simply used for illustration purposes. Your scripts must be designed for your specific environment and needs. We definitely took an approach that was not generic, but there is added value in having an API narrow enough to reflect our environment. So the scripting abilities grow with the needs of the environment and the effort required.
Nevertheless, we anticipate making several improvements in the future. Among these improvements are:
� Create a build process specific for different environments and different machines.
� Add (or may be complete) scripting API for all types. (However, this aspect of our future improvements will probably remain a do-as-required item.)
� Consider subtle differences for WebSphere Application Server versions (from V6.0 but not for V5.x).
Chapter 9. System management and configuration 219

� Perform general cleanup and improvement of functions and utilities.
� Add logging to a file.
� Simplify modification operations.
� Add detection logic for affected nodes for each operation (it is currently hard coded).
9.3.5 Further reading
For further information about tooling and scripting, consult the following resources:
� “Scripting the application serving environment (wsadmin)” at WebSphere Application Server Network Deployment, Version 6.x:
http://publib.boulder.ibm.com/infocenter/wasinfo/v6r1/index.jsp?topic=/com.ibm.websphere.nd.doc/info/ae/ae/welc6topscripting.html
� “Jython User Guide”:
http://www.jython.org/Project/userguide.html
� “Sample Scripts for WebSphere Application Server Versions 5 and 6” at developerWorks:
http://www.ibm.com/developerworks/websphere/library/samples/SampleScripts.html
� “Jython Development Tools (JyDT) for Eclipse” at Red Robin Software:
http://www.redrobinsoftware.net
220 Techniques for Managing Large WebSphere Installations

Chapter 10. Problem determination
In large, complex WebSphere Application Server installations, diagnosing problems requires a thorough understanding of the various components configured in the topology and the messages generated by these components in the log files. Troubleshooting large environments requires addressing the configuration and runtime issues occurring in WebSphere Application Server components such as the high availability manager, core groups, and Core Group Bridge Service (CGBS).
In this chapter we discuss the configuration and runtime issues that are typical in large WebSphere installations, and we take a look at some of the log messages generated by the previously mentioned components.
Another challenge to troubleshooting in a large distributed environment is the correlation of log file data from several different processes. In this chapter we address some of the tools appropriate for problem analysis in large WebSphere environments.
This chapter covers the following topics:
� 10.1, “Troubleshooting large environments” on page 222� 10.2, “Configuration issues in large topologies” on page 222� 10.3, “Runtime issues in large topologies” on page 223� 10.4, “Tools for problem analysis” on page 240
10
© Copyright IBM Corp. 2008. All rights reserved. 221

10.1 Troubleshooting large environments
In large, complex WebSphere Application Server installations diagnosing problems requires a thorough understanding of the various components configured in the topology and the messages generated by these components in the log files. In Chapter 6, “Planning for large environments” on page 79, we classified various topologies that can be configured in large environments and discussed the WebSphere Application Server components that must be configured for these topologies. Depending on the type of topology implemented in your environment, troubleshooting large installations requires addressing the configuration and runtime issues occurring in WebSphere Application Server components such as the high availability manager (HA manager), core groups, and Core Group Bridge Service (CGBS).
In the following sections we discuss the configuration issues facing large environments and the runtime informational and error messages generated in the SystemOut.log files. We also discuss steps that must be taken to remedy these configuration or runtime problems.
10.2 Configuration issues in large topologies
In this subsection we discuss some of the typical configuration issues facing large WebSphere installations.
Port managementWhen creating more than 100 application servers on one physical server using wsadmin, users may receive a StackOverflow error preventing them from creating any additional JVMs on the machine. The reason for receiving this error is a recursive call in the class
com.ibm.ws.management.configservice.EndpointConfigHelper
and in the method adjustPort() that fills up the stack. This typically happens when more than 1652 ports are already taken between the starting port and the next free one.
One solution is to increase the stack size of the Deployment Manager JVM. But this solution is not recommended because it increases the stack size on all threads in the Deployment Manager JVM, which is not required. The user can create additional servers, but the stack would eventually fill up again.
222 Techniques for Managing Large WebSphere Installations

An alternative workaround is to use templates to create your application server JVMs and modify your template for creating new servers after about 100 servers are created by moving the starting ports into a different port range.
10.3 Runtime issues in large topologies
In this section we discuss some of the typical runtime issues facing large installations. Many messages discussed here are purely informational, or they are diagnostic health-check messages, while others are warnings or errors.
FFDC entries in SystemOut logs You may notice repeated informational first-failure data capture (FFDC) entries that may appear in SystemOut.log as shown in Example 10-1. Ignore these FFDC messages because they are solely informational messages.
Example 10-1 FFDC entries in SystemOut.log file
[8/29/07 9:45:21:312 EDT] 00000046 ServiceLogger I com.ibm.ws.ffdc.IncidentStreamImpl initialize FFDC0009I: FFDC opened incident stream file C:\IBM\WebSphere\AppServer\profiles\prf_mnode2003\logs\ffdc\cls15_srv20_4f114f11_07.08.29_09.45.21_0.txt
[8/29/07 9:45:21:328 EDT] 00000046 ServiceLogger I com.ibm.ws.ffdc.IncidentStreamImpl resetIncidentStream FFDC0010I: FFDC closed incident stream file C:\IBM\WebSphere\AppServer\profiles\prf_mnode2003\logs\ffdc\cls15_srv20_4f114f11_07.08.29_09.45.21_0.txt
10.3.1 Troubleshooting the HA manager and core groups
Runtime informational messages for the HA manager and core groups originate during:
� Execution of the HA manager protocols: discovery, failure detection, view synchrony
� HA active coordinator election
Tip: In large installations special attention must be given to port management. Pre-planning the port assignments helps alleviate port configuration issues.
Chapter 10. Problem determination 223
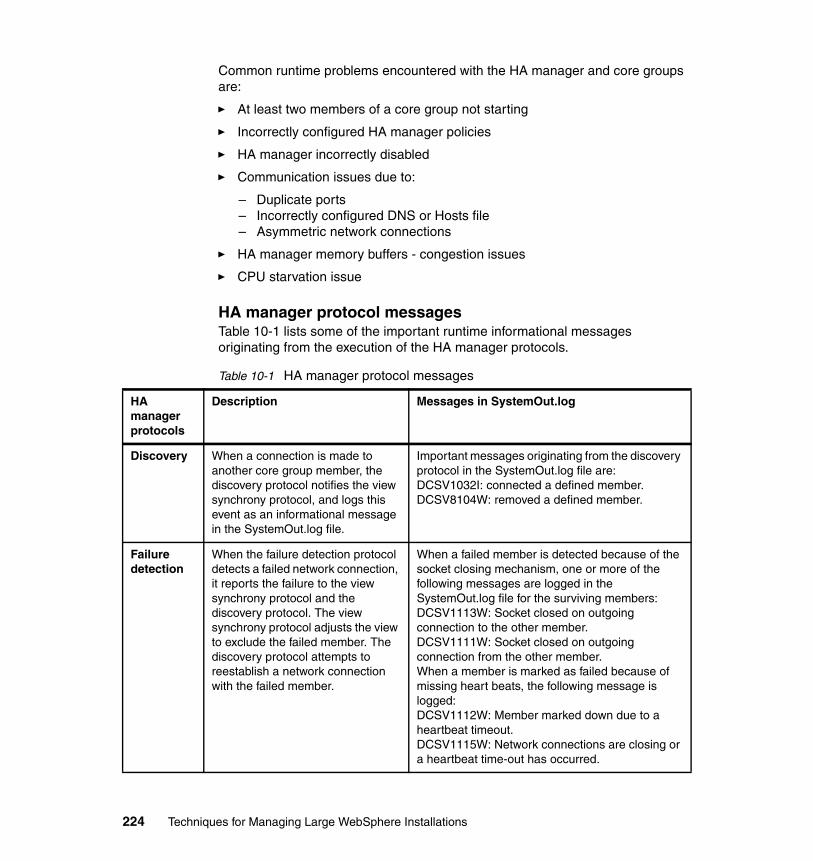
Common runtime problems encountered with the HA manager and core groups are:
� At least two members of a core group not starting
� Incorrectly configured HA manager policies
� HA manager incorrectly disabled
� Communication issues due to:
– Duplicate ports– Incorrectly configured DNS or Hosts file– Asymmetric network connections
� HA manager memory buffers - congestion issues
� CPU starvation issue
HA manager protocol messagesTable 10-1 lists some of the important runtime informational messages originating from the execution of the HA manager protocols.
Table 10-1 HA manager protocol messages
HA manager protocols
Description Messages in SystemOut.log
Discovery When a connection is made to another core group member, the discovery protocol notifies the view synchrony protocol, and logs this event as an informational message in the SystemOut.log file.
Important messages originating from the discovery protocol in the SystemOut.log file are:DCSV1032I: connected a defined member.DCSV8104W: removed a defined member.
Failure detection
When the failure detection protocol detects a failed network connection, it reports the failure to the view synchrony protocol and the discovery protocol. The view synchrony protocol adjusts the view to exclude the failed member. The discovery protocol attempts to reestablish a network connection with the failed member.
When a failed member is detected because of the socket closing mechanism, one or more of the following messages are logged in the SystemOut.log file for the surviving members:DCSV1113W: Socket closed on outgoing connection to the other member.DCSV1111W: Socket closed on outgoing connection from the other member.When a member is marked as failed because of missing heart beats, the following message is logged:DCSV1112W: Member marked down due to a heartbeat timeout.DCSV1115W: Network connections are closing or a heartbeat time-out has occurred.
224 Techniques for Managing Large WebSphere Installations

Verifying the HA manager is working properly
To verify that the number of members in view matches the number of running core group servers, determine the members of the core group, and determine the number of many members running. Check to see whether the view size equals the running members. Select a running member and examine the SystemOut.log file. Check the current view by looking at the last DCSV8050I message in the log (see Example 10-2).
Example 10-2 Last DSCV8050I message
DCSV8050I: DCS Stack <core_group_name> at Member <this_member>: New view installed, identifier (9:0.<view_leader_name>), view size is 27 (AV=27, CD=27, CN=27, DF=27)
DCSV8050I – indicates that a new view was installed.
� AV (Actual View) – the number of members in the new view.
� CD (Connected - Denied) – the number of connected members minus the number of denied members (members are denied from the view for various reasons).
� CN (Connected) – the number of connected members.
� DF (Defined) – the total number of core group members defined in the configuration (but not necessarily running)
View synchrony
The view synchrony protocol establishes initial view at startup and re-establishes the view every time it receives a notification from either the discovery or failure detection protocols.
Important messages printed in the SystemOut.log file from the view synchrony protocol are:DCSV8054I: View change in progress.HMGR0218I/DCSV8050I: When a new view is installed, also prints the name of the view and details about number of members.DCSV1033I: Confirmation that all new members are in the new view.DCSV2004I: All messages in the current view are completed and acknowledged.DCSV8050I: Extended status information about connected, total, and bad members in the view.
HA manager protocols
Description Messages in SystemOut.log
Chapter 10. Problem determination 225

HA manager protocol messages - inconsistent group membershipInconsistent core group membership means that the HA manager’s view of the servers available in the core group is different from the actual servers that are available. This can occur if changes are made to the configuration that are not fully synchronized when servers are started. Verify the size and status of the core group. Check for DCSV8050I messages in the logs. As explained previously, DCSV8050I contains the following information:
� AV - number of active members in the view.
� CN - members that are connected to this member. This usually should be the same as AV.
� CD - CN - number of suspect members.
� That is the number of members that the server has a connection to, but the HA manager suspects their integrity and does not want to be in the same view with them.
� DF - number of defined members.
If all core group servers are started, the number of active members (AV) equals the number of defined members (DF). If this is not the case, perform a full resynchronization from the Deployment Manager to all node agents and verify the configuration.
Identifying connected members in a viewAnalyze the connect messages in the SystemOut.log file (seeExample 10-3).
Example 10-3 DCSV1032I connect messages in SystemOut.log
DCSV1032I: DCS Stack <core_group_name> at Member <this_member>: Connected a defined member <remote_member>.
At startup a DCSV1032I is logged for each successful connection to another core group member. After one or more connections, a view is installed, and a DCSV8050 is logged. As additional members are started and discovered, DCSV1032I messages are again logged and a new view established. Looking at the DCSV1032I messages logged at startup can tell you which members are connected. When checking for connections and the view size, do not forget to count the process you are looking at. For example, if three processes in a core
226 Techniques for Managing Large WebSphere Installations

group were started, one sees only two DCSV1032I messages (one for each remote process), but the view size shows three. For example (ServerA log):
� Server A is started. See Example 10-4.
Example 10-4 ServerA started
DCSV1032I: DCS Stack DefaultCoreGroup at Member Cell01\Node01\ServerA: Connected a defined member Cell01\Node01\nodeagent.DCSV1032I: DCS Stack DefaultCoreGroup at Member Cell01\Node01\ServerA: Connected a defined member Cell01\CellManager01\dmgr.DCSV8050I: DCS Stack DefaultCoreGroup at Member Cell01\Node01\ServerA: New view installed, identifier (13:0.Cell01\CellManager01\dmgr), view size is 3 (AV=3, CD=3, CN=3, DF=7)
At this point dmgr, node agent, and ServerA are connected and in view.
� ServerB is started. See Example 10-5.
Example 10-5 ServerB started
DCSV1032I: DCS Stack DefaultCoreGroup at Member Cell01\Node01\ServerA: Connected a defined member Cell01\Node01\ServerB.DCSV8050I: DCS Stack DefaultCoreGroup at Member Cell01\Node01\ServerA: New view installed, identifier (14:0.Cell01\CellManager01\dmgr), view size is 4 (AV=4, CD=4, CN=4, DF=7)
Now the dmgr, node agent, ServerA, and ServerB are connected and in view.
� ServerC is started. See Example 10-6.
Example 10-6 ServerC started
DCSV1032I: DCS Stack DefaultCoreGroup at Member Cell01\Node01\ServerA: Connected a defined member Cell01\Node01\ServerC.DCSV8050I: DCS Stack DefaultCoreGroup at Member Cell01\Node01\ServerA: New view installed, identifier (15:0.Cell01\CellManager01\dmgr), view size is 5 (AV=5, CD=5, CN=5, DF=7)
Now the dmgr, node agent, ServerA, ServerB, and ServerC are connected and in view.
Chapter 10. Problem determination 227

HA active coordinator messagesTo identify which process is currently an active coordinator, the following messages can be searched for:
� HMGR0206I: The process is an active coordinator.
� HMGR0228I: The process is not an active coordinator.
� HMGR0207I: The process was an active coordinator but is not anymore.
Identifying the HA active coordinatorCheck the SystemOut.log file for an HMGR0206I message.
If a preferred coordinator was configured, you can limit your search to that process. Otherwise you must search the logs from the various core group members.
Every view change results in one of the following messages being logged. Open the latest SystemOut.log and check for the latest entries of any of the following messages:
� A coordinator server (JVM) announces itself as shown in Example 10-7:
Example 10-7 HA active coordinator
HMGR0206I: The Coordinator is an Active Coordinator for core group <core_group_name>.
� A non-coordinator server (JVM) mentions the message in Example 10-8:
Example 10-8 Not HA active coordinator
HMGR0228I: The Coordinator is an not an Active Coordinator for core group <core_group_name>.
� An active coordinator may become inactive due to addition of new servers (JVM) to the core group (see Example 10-9).
Example 10-9 HA coordinator that lost leadership
HMGR0207I: The Coordinator was previously an Active Coordinator for core group <core_group_name> but has lost leadership.
228 Techniques for Managing Large WebSphere Installations

Cluster member fails to start - incorrect HA policyA cluster member fails to start and the message shown in Example 10-10 is continuously logged.
Example 10-10 Cluster member fails to start - CWRLS0030W
CWRLS0030W: Waiting for HAManager to activate recovery processing…
If CWRLS0030W is continuously logged and the process is in an established view, the most likely cause of the problem is an incorrectly configured HA policy.
Cluster member fails to start - communication issuesA cluster member fails to start and the message shown in Example 10-11 is continuously logged.
Example 10-11 Cluster member fails to start - DCSV8030I
DCSV8030I: DCS Stack DefaultCoregroup at Member myCell\myNode1\myAppServer1: Failed a join attempt with member [myCell\myNode2\myAppServer2]. The reason is Not all candidates are connected…
DCSV8030I messages have several possible causes, mostly related to communication.
� Check if connections (DCSV1032I) are being established.
� Check if the process established a DCS view (DCSV8050I).
� Check if any other DCSV or HMGR messages indicate a problem.
– DCSV1111W, DCSV1112W, DCSV1113W, or DCSV1115W messages indicate network connections are closing or a heartbeat timeout has occurred.
– HMGR0024W, HMGR0027W, HMGR0028E, or HMGR0090W messages indicate potential configuration problems (duplicate ports, duplicate IPs, missing configuration files, and so on).
If the message “DCSV8030I Failed a join attempt… reason is Not all candidates are connected…” is continuously logged, the problem is most likely an asymmetric connected condition.
Asymmetric connected sets can occur as explained here:
Suppose members A and B are in a view together (view size = 2). Now member C is started. A and C can communicate fine, and A wants to bring C into the view. For some reason B and C are unable to establish communication. At this point A and B are in a view together, and C is in a view
Chapter 10. Problem determination 229

by itself. C continues to fail to join the view with A and B until both A and B agree that C should be allowed in. Periodically C tries to join the view, and each time it fails, resulting in a DCSV8030I message as long as the communication problem persists.
DCSV8030I message indicates one of the following:
� The core group is partitioned into smaller groups, and those groups are unable to join into a single view because some members cannot communicate with others.
� To determine which processes are having connection problems, you must locate the log where the DCSV8030I message is logged by the RoleViewLeader (see Example 10-12).
Example 10-12 DCSV8030I messages
RoleViewLeade I DCSV8030I: DCS Stack DefaultCoregroup at Member myCell\myNode1\myAppServer1: Failed a join attempt with member [myCell\myNode2\myAppServer2]. The reason is Not all candidates are connected ConnectedSetMissing=[ ] ConnectedSetAdditional [myCell\myNode1\myAppServer3 myCell\myNode1\myAppServer4 ].
This message contains several process names:
� View leader (this member)
� Process trying to join (failed join attempt with)
� ConnectedSetMissing = [ ]
� ConnectedSetAdditional = [ ]
These processes have potential connectivity problems. You should closely examine their logs for communication problems.
If the problem is transient, you can try stopping the members with potential connectivity problems. Then restart them one at a time, checking to see that they are properly added into the view once they are running.
HA manager memory buffers - congestion issuesIn large topologies using Data Replication Service (DRS) such as HTTP session replication, stateful session bean failover, and dynacache, the default HA manager memory buffer settings may not be adequate and may lead to DCS congestion messages (DCSV1051W, DCSV1052W, DCSV1053I) appearing in the SystemOut.log file. These messages indicate problems transferring large amounts of message data.
230 Techniques for Managing Large WebSphere Installations

An outgoing messages queue from DCS to Reliable Multicast Messaging (RMM) is being controlled. Three marks (yellow, red, and green) are in this control mechanism, each of which represents a certain amount of memory occupied by the outgoing messages queue.
Yellow markDCSV1052W appears when the outgoing message queue hits the yellow mark (see Example 10-13).
Example 10-13 DCSV1052W messages
[10/9/04 10:50:46:300 EDT] 00003510 TransmitterTh W DCSV1052W: DCS Stack DefaultCoreGroup at Member dmgr\dmgr\dmgr: Raised a medium severity congestion event for outgoing messages. Internal details are Total stored bytes: 2017690, Red mark is 2411520, Yellow mark is 1929216, Green mark is 1205248.
Red markDCSV1051W appears when the outgoing messages queue hits the red mark. At this point, DCS blocks further sending of outgoing messages and waits until Reliable Multicast Messaging sends enough messages, so that the outgoing messages queue goes down to the green line (see Example 10-14).
Example 10-14 DCSV1051W messages
[10/9/04 10:50:46:388 EDT] 00003510 TransmitterTh W DCSV1051W: DCS Stack DefaultCoreGroup at Member dmgr\dmgr\dmgr: Raised a high severity congestion event for outgoing messages. Internal details are Total stored bytes: 2421228, Red mark is 2411520, Yellow mark is 1929216, Green mark is 1205248.
Green markDCSV1053I appears when outgoing messages queue return to the green mark (see Example 10-15).
Example 10-15 DCSV1053I messages
[10/9/04 10:50:46:497 EDT] 000006f9 TransmitterTh I DCSV1053I: DCS Stack DefaultCoreGroup at Member dmgr\dmgr\dmgr: Outgoing messages congestion state is back to normal.
Chapter 10. Problem determination 231

The following properties require tuning to address the congestion issue (refer to 7.2.2, “Tuning the HA manager memory buffers” on page 111):
� Set IBM_CS_DATASTACK_MEG = 100 (Specifies the DCS memory buffer parameter. This is a per-core group configuration parameter.)
� Set TransportBufferSize = 100 (Specifies the Reliable Multicast Messaging transport buffer size. This is a per-process configuration parameter. The transport buffer size should be set to the same value for all core group members.)
� Always set ‘Transport buffer size’ >= IBM_CS_DATASTACK_MEG. The value of these two parameters can be bumped up to the maximum value of 256.
CPU starvation issueHMGR0152W warning messages are being logged in the SystemOut.log file (see Example 10-16).
Example 10-16 CPU starvation
[09/05/07 16:42:27:635 EDT] 0000047a CoordinatorCo W HMGR0152W: CPU Starvation detected. Current thread scheduling delay is 9 seconds.
The HMGR0152W message is an indication that JVM thread-scheduling delays are occurring for this process.
The WebSphere Application Server HA manager component contains thread-scheduling delay detection logic that periodically schedules a thread to run and tracks whether the thread was dispatched and run as scheduled. By default a delay detection thread is scheduled to run every 30 seconds, and logs an HMGR0152W message if it is not run within 5 seconds of the expected schedule. The message indicates the delay time or time differential between when the thread was expected to get the CPU, and when the thread actually got CPU cycles.
The HMGR0152W message can occur even when plenty of CPU resources are available. The reasons why the scheduled thread may not have been able to get the CPU in a timely fashion are numerous. Some common causes include the following:
� The physical memory is overcommitted, and paging is occurring.
� The heap size for the process is too small, causing garbage collection to run too frequently or too long, blocking execution of other threads.
� Simply too many threads may be running in the system, and too much load is placed on the machine, which may be indicated by high CPU utilization.
232 Techniques for Managing Large WebSphere Installations

The HMGR0152W message is attempting to warn the customer that a condition is occurring that may lead to instability if it is not corrected. Analysis should be performed to understand why the thread scheduling delays are occurring, and what action should be taken. Some common solutions include the following:
� Add more physical memory to prevent paging.
� Tune the JVM memory (heap size) for optimal garbage collection by enabling verbose GC.
� Reduce overall system load to an acceptable value.
� If the HMGR0152W messages do not occur often and indicate that the thread-scheduling delay is relatively short (for example, less than 20 seconds), it is likely that no other errors will occur and the message can safely be ignored.
The HA manager thread-scheduling delay detection is configurable by setting one of two custom properties. The custom property IBM_CS_THREAD_SCHED_DETECT_PERIOD determines how often a delay detection thread is scheduled to run. The default value of this parameter is 30 (seconds).
The custom property IBM_CS_THREAD_SCHED_DETECT_ERROR determines how long of a delay should be tolerated before a warning message is logged. By default this value is 5 (seconds)
These properties are scoped to a core group and can be configured as follows:
In the administration console, click Servers → Core groups → Core groups settings → [core group name].
� Under Additional Properties, click Custom properties → New.
� Enter the property name and desired value.
� Save the changes.
� Restart the server for these changes to take effect.
10.3.2 Troubleshooting Core Group Bridge Service
Diagnosing Core Group Bridge Service (CGBS) problems generally requires inspection of SystemOut.log files for active coordinator and bridge servers of the various core groups.
Chapter 10. Problem determination 233

Runtime informational messages originating from CGBS include the following:
� CGBS startup messages
� Core group communication
� Access point group communication
Common runtime problems encountered with CGBS are:
� Process start and restart
– Failure to restart active coordinator or bridge servers after saving configuration changes.
– Failure to start more than one process in a core group.
� Peer access point configuration
– Incorrect remote cell name– Incorrect remote core group name
� Security configuration with cross-cell bridging
– Security is enabled on some cells but not on others.– Failure to export or import Lightweight Third Party Authentication (LTPA)
keys between cells.
CGBS startup messagesThe CGBS startup is indicated by the messages in the SystemOut.log (see Example 10-17). Verify the successful startup of the CGBS and the subscription router.
Example 10-17 CGBS startup messages
[2/21/07 11:16:49:734 CST] 0000000a CGBridge I CWRCB0105I: The core group bridge service is enabled to communicate between core groups.
[2/21/07 11:16:49:765 CST] 0000000a CGBridgeServi I CWRCB0101I: The core group bridge service has started.
[2/21/07 11:16:49:796 CST] 0000000a CGBridgeSubsc I CWRCB0102I: The core group bridge service has started the subscription router.
234 Techniques for Managing Large WebSphere Installations

Core group communication messagesThe active coordinator and the bridge servers within the core group must connect and establish communication with each other for inner core group communication (see Figure 10-1).
Figure 10-1 Inner core group communication
Example 10-18 shows the communication messages between the active coordinator and bridge servers in a core group.
Example 10-18 Inner core group communication
[2/22/07 9:18:19:250 CST] 0000003b MbuRmmAdapter I DCSV1032I: DCS Stack DefaultCoreGroup.P at Member Cell01\CellManager01\dmgr: Connected a defined member Cell01\Node01\ServerA.
[2/22/07 9:18:36:375 CST] 00000992 DataStackMemb I DCSV8050I: DCS Stack DefaultCoreGroup.P at Member Cell01\CellManager01\dmgr: New view installed, identifier (2:0.Cell01\CellManager01\dmgr), view size is 2 (AV=2, CD=2, CN=2, DF=2)
For communication between the active coordinator and bridge servers within a core group:
� DCS Stack is named <core group>.
� DCSV1032I indicates connection established.
� DCSV8050I indicates view synchrony complete.
DefaultCoreGroup
ServerB
BI
DefaultCoreGroup.P
Inner core group communicationActive CoordinatorLocal Bridge Interfaces
ServerC ServerABI
ServerABI
ACDmgr
BI
Chapter 10. Problem determination 235

In the Deployment Manager (dmgr) log shown in Example 10-18 on page 235:
� The dmgr process is the active coordinator for the DefaultCoreGroup.
� The dmgr process is also a bridge server for the DefaultCoreGroup.
� The process ServerA is another bridge server for the DefaultCoreGroup.
� The dmgr log shows a connection established to ServerA and then shows a view size=2 successfully established.
Access point group communication messagesAll the running bridge servers within an access point group must connect and establish communication with each other for access point group communication (see Figure 10-2).
Figure 10-2 Access point group communication
� Within a core group, communication flows between the active coordinator for the core group and the bridge interfaces.
� Within an access point group, communication flows between the configured bridge interfaces.
� Communication both within a single core group and across core groups can be verified by looking at SystemOut.log files.
� DefaultCoreGroup has an active coordinator and two bridge servers.
� CoreGroup1 has an active coordinator and two bridge servers.
� The DefaultAccessPointGroup connects DefaultCoreGroup and CoreGroup1 (four bridge servers).
CoreGroup1DefaultCoreGroup
Inner core group communication
Active CoordinatorLocal Bridge
Interfaces
Cross core groupcommunication
All Bridge Interfaces
BI
CoreGroup1.PDefaultCoreGroup.P
DefaultAccessPointGroup.P
ServerB
ServerC
ServerABI
ACDMgr
BI
ACC1M1
BI
C1M2BI
236 Techniques for Managing Large WebSphere Installations

Example 10-19 shows the communication between bridge servers in an access point group.
Example 10-19 Access point group communication
[2/21/07 11:17:26:453 CST] 0000003b MbuRmmAdapter I DCSV1032I: DCS Stack DefaultAccessPointGroup.P at Member 9.10.87.238:9358: Connected a defined member 9.10.87.238:9359.
[2/21/07 11:17:43:546 CST] 00000037 DataStackMemb I DCSV8050I: DCS Stack DefaultAccessPointGroup.P at Member 9.10.87.238:9358: New view installed, identifier (2:0.9.10.87.238:9358), view size is 2 (AV=2, CD=2, CN=2, DF=2)
For communication between bridge servers in access point group:
� DCS Stack is named <access point group>.
� DCSV1032I indicates connection established.
� DCSV8050I indicates view synchrony complete.
In the Deployment Manager (dmgr) log shown previously in Example 10-19:
� The DefaultAccessPointGroup bridges DefaultCoreGroup and CoreGroup1.
� The dmgr process (9.10.87.238:9358)is a bridge server in the DefaultCoreGroup.
� The c1m1 process (9.10.87.238:9359) is a bridge server in CoreGroup1.
� Only the dmgr and c1m1 bridge servers have been started.
� The dmgr log shows a connection established to 9.10.87.238:9359, and then a view size=2 successfully established.
Chapter 10. Problem determination 237

Peer access point – incorrect cell or core group nameFor suspected peer access point configuration issues, check the SystemErr.log of the various bridge servers. SystemErr.log on a bridge server contains an entry similar to what is shown in Example 10-20.
Example 10-20 Peer access point - incorrect cell or core group name
5/5/06 12:22:49:250 EDT] 00000015 SystemErr R The MemberMap for CELL1:DefaultCoreGroup does not contain key IBM_PMG_IS_MGR:CELL1:DefaultCoreGroup in memberProperties : [_ham.serverid:9.37.241.45:9360][NODENAME:Node2][PROCESS_TYPE:NodeAgent][IBM_PMG_IS_MGR:CELL2:DefaultCoreGroup:1] [IBM_PMG_IS_MGR:CELL-WRONG:DefaultCoreGroup:1][CELLNAME:CELL2][serverid:nodeagent][COREGROUPNAME:DefaultCoreGroup]
In troubleshooting peer access points, verify the cell names, core group names, and peer port configurations defined for the peer access points.
Security configuration with cross-cell bridgingFor suspected security configuration issues, check the SystemOut.log and FFDC logs for the various bridge servers.
SystemOut.log on a bridge server contains an entry similar to what is shown in Example 10-21.
Example 10-21 Cross-cell bridge server SystemOut.log
DefaultTokenP I HMGR0149E: An attempt by another process to connect to this process via the core group transport has been rejected. The connecting process provided a source core group name of DefaultAccessPointGroup, a target of Secure Token???, a member name of ,myCell01,DefaultCoreGroup,CGAP_1, myhost.ibm.com,9353,NFWP,602 and an IP address of /9.5.23.61. The error message is Security Off.
238 Techniques for Managing Large WebSphere Installations

The FFDC log for a bridge server may contain the exceptions shown in Example 10-22.
Example 10-22 Cross-cell bridge server FFDC log
Index Count Time of last Occurrence Exception SourceId ProbeId 1 69 4/14/06 13:14:42:919 EDT com.ibm.websphere.security.auth.WSLoginFailedException com.ibm.ws.security.token.WSCredentialTokenMapper.createPropagationTokenBeforeAuthenticatedCallerSet 1167 2 139 4/14/06 13:14:53:138 EDT javax.crypto.BadPaddingException com.ibm.ws.security.ltpa.LTPACrypto 1896 3 69 4/14/06 13:14:42:919 EDT com.ibm.websphere.security.auth.WSLoginFailedException com.ibm.ws.hamanager.runtime.DefaultTokenProvider 23
Security configuration issues with cross-cell (inter-cell) bridging arise due to following reasons:
� Security is enabled on some cells but not on others.
� Failure to export or import Lightweight Third Party Authentication (LTPA) keys between cells.
Security in inter-cell bridging may require the following:
� The same user registry in both cells
� Exporting LTPA keys
� Importing LTPA keys
� Enabling single sign-on
Timeouts during cross-core group EJB callsIf the core group bridge servers are configured incorrectly, timeout errors may occur when making cross-core group RMI-IIOP calls as shown in Example 10-23. This happens because the EJB interoperable object reference (IOR) cannot be located.
Example 10-23 Timeouts in cross-core group RMI-IIOP calls
[8/28/07 20:00:42:734 EDT] 0000003b SystemErr R Caused by: org.omg.CORBA.NO_RESPONSE: Request 24 timed out vmcid: IBM minor code: B01 completed: Maybe at com.ibm.rmi.iiop.Connection.send(Connection.java:2146)
Chapter 10. Problem determination 239

10.4 Tools for problem analysis
In this section we introduce techniques for:
� Detecting and analyzing runtime problems using the Application Server Toolkit as a single point of operation to deal with logs and traces and to correlate these problems across different products and products on different servers
� Develop your applications using WebSphere Application Server Common Base Events, which can be correlated with events from other applications later on using tools like the Application Server Toolkit.
10.4.1 Detecting and analyzing runtime problems
IBM Application Server Toolkit (AST) includes tools to collect log data - for example, Log and Trace Analyzer and Log Adapter.
AST can be used as a single point of operation to deal with logs and traces produced by various components of a deployed system. By capturing and correlating end-to-end events in the distributed stack of a customer application, this tool allows a more structured analysis of distributed application problems.
Determining the root cause of a problem in a system that consists of a collection of products can be difficult. All products produce problem determination data, such as trace records, log records, and messages. However, the problem determination data cannot be easily correlated across different products and products on different servers. Time stamps are not sufficient: they are not granular enough, and clocks are not often sufficiently synchronized between servers. All of these problems make the job of problem isolation (that is, determining which server, which product, and the root cause of the problem) difficult, and this complexity increases with the complexity and size of a system.
The Log and Trace Analyzer, which enables you to import various log files as well as symptom databases against which log files can be analyzed, decreases this complexity. The core issue in problem isolation in today’s solutions is that problem determination data between products is not correlated - that is, you cannot easily determine the relationship of events captured by one product with the events captured by another. The Log and Trace Analyzer addresses this problem by enabling you to import and analyze log files (or trace files) from multiple products, as well as to determine the relationship between the events captured by these products (correlation).
240 Techniques for Managing Large WebSphere Installations
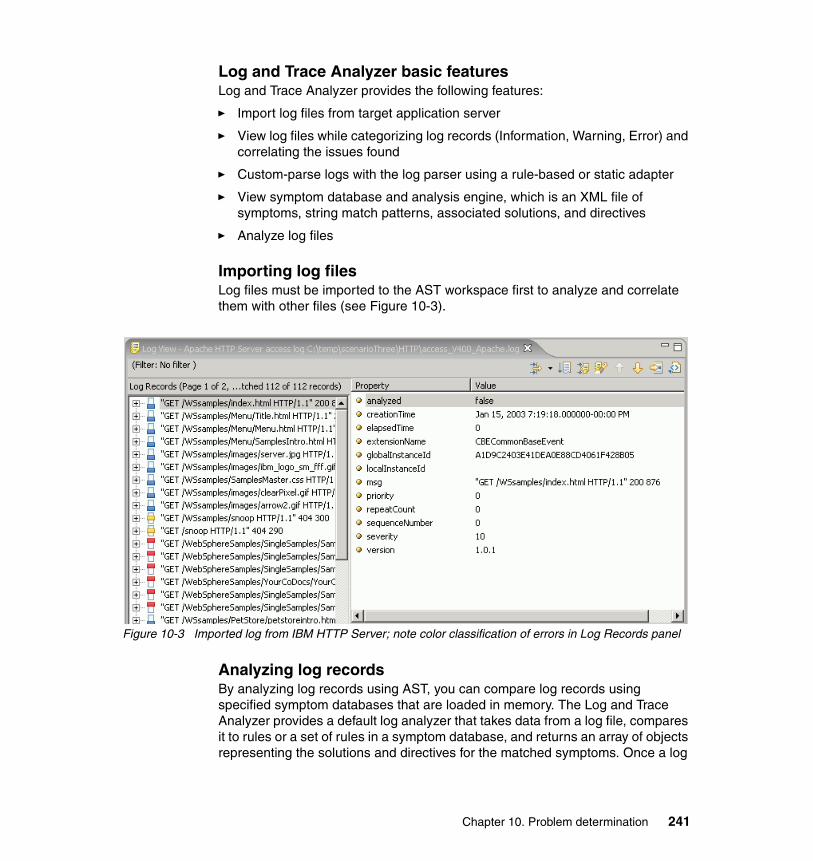
Log and Trace Analyzer basic featuresLog and Trace Analyzer provides the following features:
� Import log files from target application server
� View log files while categorizing log records (Information, Warning, Error) and correlating the issues found
� Custom-parse logs with the log parser using a rule-based or static adapter
� View symptom database and analysis engine, which is an XML file of symptoms, string match patterns, associated solutions, and directives
� Analyze log files
Importing log filesLog files must be imported to the AST workspace first to analyze and correlate them with other files (see Figure 10-3).
Figure 10-3 Imported log from IBM HTTP Server; note color classification of errors in Log Records panel
Analyzing log recordsBy analyzing log records using AST, you can compare log records using specified symptom databases that are loaded in memory. The Log and Trace Analyzer provides a default log analyzer that takes data from a log file, compares it to rules or a set of rules in a symptom database, and returns an array of objects representing the solutions and directives for the matched symptoms. Once a log
Chapter 10. Problem determination 241
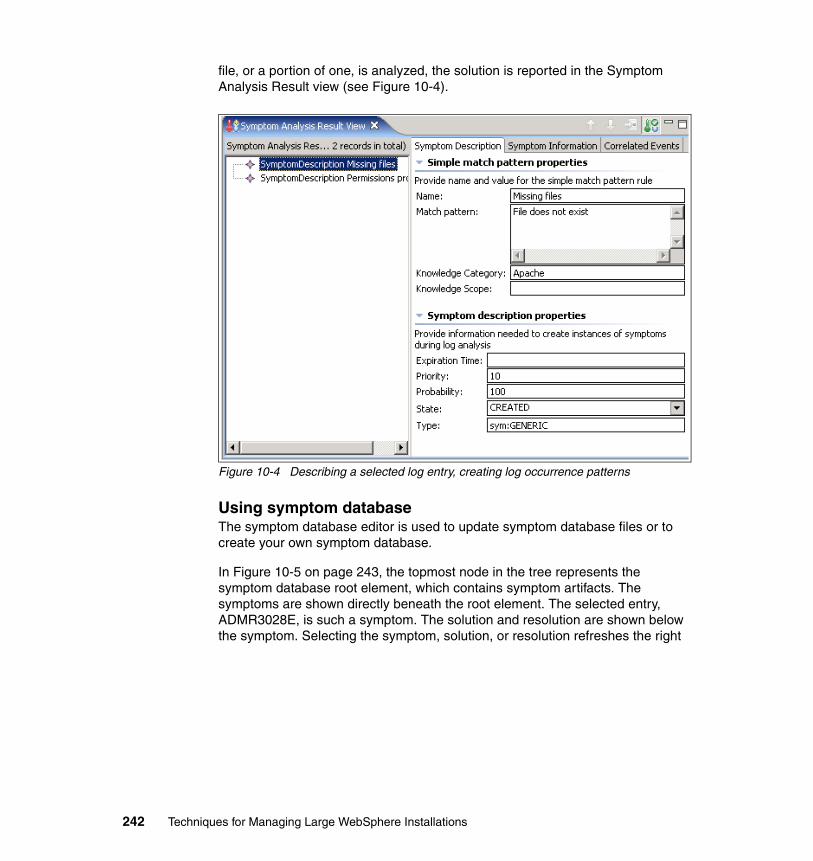
file, or a portion of one, is analyzed, the solution is reported in the Symptom Analysis Result view (see Figure 10-4).
Figure 10-4 Describing a selected log entry, creating log occurrence patterns
Using symptom databaseThe symptom database editor is used to update symptom database files or to create your own symptom database.
In Figure 10-5 on page 243, the topmost node in the tree represents the symptom database root element, which contains symptom artifacts. The symptoms are shown directly beneath the root element. The selected entry, ADMR3028E, is such a symptom. The solution and resolution are shown below the symptom. Selecting the symptom, solution, or resolution refreshes the right
242 Techniques for Managing Large WebSphere Installations
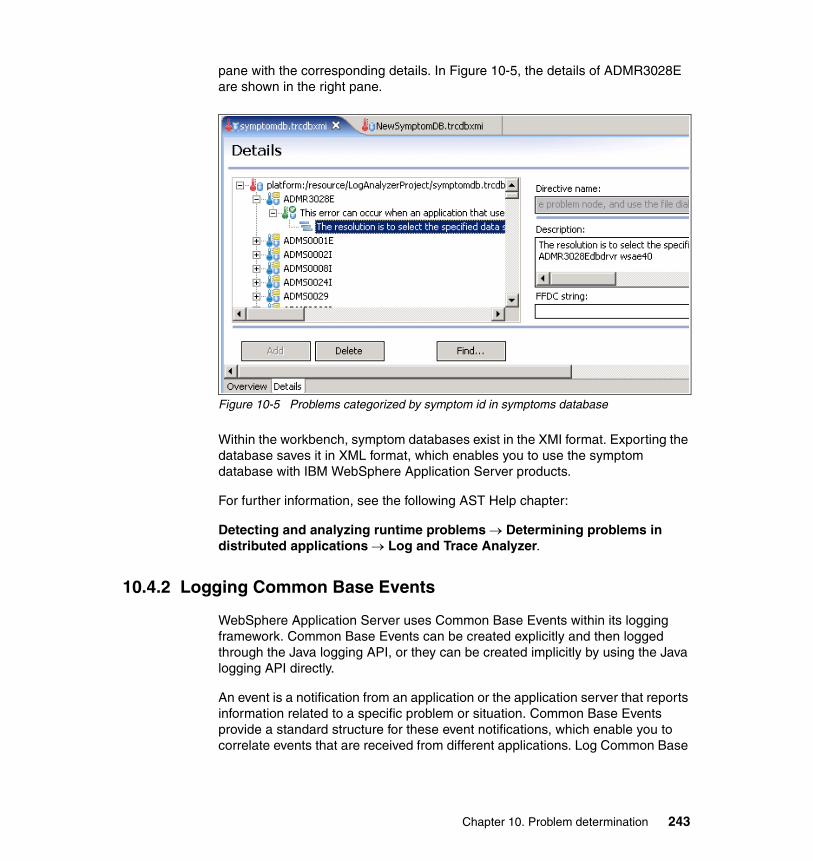
pane with the corresponding details. In Figure 10-5, the details of ADMR3028E are shown in the right pane.
Figure 10-5 Problems categorized by symptom id in symptoms database
Within the workbench, symptom databases exist in the XMI format. Exporting the database saves it in XML format, which enables you to use the symptom database with IBM WebSphere Application Server products.
For further information, see the following AST Help chapter:
Detecting and analyzing runtime problems → Determining problems in distributed applications → Log and Trace Analyzer.
10.4.2 Logging Common Base Events
WebSphere Application Server uses Common Base Events within its logging framework. Common Base Events can be created explicitly and then logged through the Java logging API, or they can be created implicitly by using the Java logging API directly.
An event is a notification from an application or the application server that reports information related to a specific problem or situation. Common Base Events provide a standard structure for these event notifications, which enable you to correlate events that are received from different applications. Log Common Base
Chapter 10. Problem determination 243

Events to capture events from different sources to help you fix a problem within an application environment or to tune system performance.
Configuring Common Base EventsYou have two options for configuring the framework:
� Default event factory
� Common base event API
Generating Common Base EventsIn this section we introduce the process of generating Common Base Events.
A default Common Base Event content handler populates Common Base Events with WebSphere Application Server runtime information. This content handler can also use a Common Base Event template to populate Common Base Events.
Use the default content handler when the server creates CommonBaseEventLogRecords as shown in Example 10-24.
Example 10-24 Creating Logger in your application
// Get a named loggerLogger logger = Logger.getLogger("com.ibm.someLogger");// Log to the logger -- implicitly the default content handler// will be associated with the CommonBaseEvent contained in the// CommonBaseEventLogRecord. logger.warning("MSG_KEY_001");
To specify a Common Base Event template in a case such as that shown in Example 10-24, a Logger.properties file must be provided with an event factory entry for com.ibm.someLogger. If a valid template is found on the classpath, the Logger's event factory uses the specified template’s content in addition to the WebSphere Application Server runtime information when populating Common Base Events. If the template is not found on the classpath or is invalid, the logger’s event factory uses only the WebSphere Application Server runtime information when populating Common Base Events.
The default content handler is also associated with the event factory home supplied in the global event factory context. This is convenient for creating
244 Techniques for Managing Large WebSphere Installations

Common Base Events that have to be populated with content similar to that generated from the WebSphere Application Server (see Example 10-25).
Example 10-25 Requesting event factory in your application
// Request the event factory from the global event factory homeEventFactory eventFactory = EventFactoryContext.getInstance().getEventFactoryHome().getEventFactory(templateName);
// Create a Common Base EventCommonBaseEvent commonBaseEvent = eventFactory.createCommonBaseEvent();
// Complete the Common Base Event using content from the template (if specified above)// and the server runtime information.eventFactory.getContentHandler().completeEvent(commonBaseEvent);
Best practicesThe following practices ensure consistent use of Common Base Events within your components, and between your components and WebSphere Application Server components.
Follow these guidelines:
� Use a different logger for each component. Sharing loggers across components gets in the way of associating loggers with component-specific information.
� Associate loggers with event templates that specify source component identification. This association ensures that the source of all events created with the logger is properly identified.
� Use the same template for directly created Common Base Events (events created using the Common Base Event factories) and indirectly created Common Base Events (events created using the Java logging API) within the same component.
� Avoid calling the complete method on Common Base Events until you are finished adding data to the Common Base Event and are ready to log it. This approach ensures that any decisions made by the content handler based on data already in the event are made using the final data.
For additional information, refer to the WebSphere Application Server, Version 6.1 Information Center entry Troubleshooting and support → Adding logging
Chapter 10. Problem determination 245

and tracing to your application → Logging common base events at the following URL:
http://publib.boulder.ibm.com/infocenter/wasinfo/v6r1/topic/com.ibm.websphere.nd.doc/info/ae/ae/ttrb_events.html
246 Techniques for Managing Large WebSphere Installations

Part 4 Sample scenarios
Part 4
© Copyright IBM Corp. 2008. All rights reserved. 247

248 Techniques for Managing Large WebSphere Installations

Chapter 11. Large installation scenarios
In this chapter we describe using different techniques to identify problems in large WebSphere Application Server installations and making topology decisions based on application test scenarios. Our goal is to identify the best topology for a given set of application servers while evaluating the configuration and system management issues of each scenario. We also describe our approach to planning, configuring, testing, and evaluating the test scenarios.
Before getting into test execution, we introduce the process of building the testing environment using various tools. The tools employ scripts ready for you to use in your environment evaluation.
� 11.1, “Introduction” on page 250� 11.2, “Tools and techniques” on page 251� 11.3, “Topology scenarios” on page 259� 11.4, “Scenario 1 topology” on page 273� 11.5, “Scenario 2 topology” on page 285� 11.6, “Scenario 3 topology” on page 301
11
Attention: Many of the scripts, batch command files, monitoring and sample applications discussed in this chapter are available for download in Appendix A, “Additional material” on page 315.
© Copyright IBM Corp. 2008. All rights reserved. 249

11.1 Introduction
The overall goal of the tests documented in this chapter is to find the impact of core group modifications while running heavy duty tests. To ensure any possible performance impact is actually induced by core group modifications, these modifications are to be executed on separate nodes that do not run any server applications.
Before running the tests, we tuned up both the core group settings and operating system settings that usually impact large installations.
Each test includes detailed time frame measurements of client response times and server CPU utilization; we also provide usage recommendations and conclusions.
The size of our testing environment might not be as large as some customer sites. The hardware available in our lab supported just a few nodes and few hundred application servers; yet we believe it was large enough to build representative topologies and evaluate the pros and cons of each using just a few simple testing tools and techniques.
The tools necessary for running the test scenarios:
� Jython administration scripts: Creating large WebSphere Application Server topologies is virtually impossible without scripting because of the repetitive nature of the process. Manually setting up the environment proves to be a slow and an error-prone process. You must be able to tear down the whole environment and set it up again quickly and correctly. Some administration tasks - for example, HA manager setup - cannot be achieved using WebSphere Application Server administration console in WebSphere Application Server V6.0; thus, scripting is required there.
� JMeter application: After setting up a test topology, we need to measure and evaluate the performance of a given environment using a test application and a performance measurement tool for which we chose JMeter. Apache JMeter is a freely available tool designed to load-test functional behavior and measure performance. We used JMeter primarily as a load driver tool.
� Sample applications: We used sample applications to test the performance of each topology scenario using JMeter, which simulates running this application by hundreds or thousands of users. The sample applications consisted of two modules, a Web part with servlets and JSPs, and an EJB part with a stateless EJB. This way we were able to involve both the Web and EJB containers of the application server in our tests.
250 Techniques for Managing Large WebSphere Installations

Our topology scenario tests target three main areas:
� Single core group topology (see 11.4, “Scenario 1 topology” on page 273)
� Two core groups topology (see 11.5, “Scenario 2 topology” on page 285)
� Four core groups mesh and chain topologies (see 11.6, “Scenario 3 topology” on page 301)
11.2 Tools and techniques
In this section we introduce the tools used for testing functionality and performance in our large WebSphere Application Server topology scenarios. In our controlled and limited test environment, these tools proved satisfactory to gather and report the data we required for our documentation purposes. However, in a large production environment, Rational® Performance Tester is a better choice for load testing. In addition, a tool such as IBM Tivoli Composite Application Manager (ITCAM) is an excellent choice for monitoring and gathering performance metrics and problem determination data.
11.2.1 Jython
You can use scripting as a nongraphical alternative for configuring and managing WebSphere Application Server, and Jython is the preferred language. Jython is an implementation of Python, an object-oriented language written in Java and integrated with the Java platform - that is, its runtime can be any JVM. This means that you can develop WebSphere Application Server administration scripts in the Application Server Toolkit or in the Rational Application Developer product line and then run these scripts against the application server.
Jython allows for
� Embedded scripting: Scripts can be combined with other scripts and Java classes.
� Interactive scripting: Scripts are run by an interactive interpreter.
� Extending Java classes: You can extend existing Java classes.
Chapter 11. Large installation scenarios 251

WebSphere Application Server provides the wsadmin tool to run Jython scripts; this tool supports a full range of administrative activities. When developing Jython scripts for wsadmin, the most important part is finding and using methods available with the wsadmin objects. Refer to 9.3.3, “Working with wsadmin objects” on page 207 for more information about wsadmin objects such as the following:
� AdminControl: Runs operational commands, for example:
AdminControl.invoke(...node synchronization)
� AdminConfig: Runs configurational commands, for example:
AdminConfig.create(...resource property)
� AdminApp: Administers applications, for example:
AdminApp.install(...ear)
� AdminTask: Runs administrative tasks, for example:
AdminTask.createCluster(...cluster configuration)
ReferencesJython User Guide:
http://www.jython.org/Project/userguide.html
Sample Scripts for WebSphere Application Server Versions 5 and 6:
http://www.ibm.com/developerworks/websphere/library/samples/SampleScripts.html
WebSphere Application Server, V6.1 Information Center section: “Scripting the application serving environment (wsadmin)” under “Network Deployment (Distributed platforms and Windows), Version 6.1”:
http://publib.boulder.ibm.com/infocenter/wasinfo/v6r1/index.jsp
11.2.2 JMeter
Apache JMeter is a Java application designed to load-test functional behavior and measure performance. You can use it to test performance on dynamic resources, such as servlets. The main entry point to our testing application monitored by JMeter is a JSP and a servlet.
You can use JMeter to simulate a heavy load on a server or to analyze overall performance under different load types; in our tests, we simulate the load just by adding simulated users working on the same front-end application.
252 Techniques for Managing Large WebSphere Installations

JMeter setupThis section describes the process of setting up JMeter.
1. Download JMeter from the Apache Jakarta Project JMeter site (http://jakarta.apache.org/jmeter) onto your workstation, which is going to be used as your testing simulation client.
2. Start JMeter using the jmeter.bat / jmeter.sh script. You may have to modify the batch or environment settings to point to the installed JVM.
3. Set up your workstation to collect sample data as follows:
a. Add a thread group to the default test plan.
b. Select the thread group by choosing Add → Config element → HTTP Request Defaults.
c. Enter the server name and server port of your target HTTP server.
d. Select Workbench → Add → Non-test elements → HTTP Proxy server.
e. Set the proxy server port to 9090.
f. In the Target controller combo-box, select Test plan → Thread Group.
g. Start the proxy server.
4. Set the JMeter proxy server to intercept calls from your Internet browser (see Figure 11-1).
For Microsoft Internet Explorer®, select Tools → Internet options → Connection → LAN settings. Check Use proxy server for your LAN. In the enabled fields, enter localhost (or JMeter workstation IP address) and port 9090.
Figure 11-1 JMeter setup to intercept Web browser traffic
Chapter 11. Large installation scenarios 253

5. Use your application URL at the Web server (set previously in step 3 on page 253c on page 253). The browser’s call is intercepted by JMeter, and this call may be used later for load simulation.
Each browser call is recorded by JMeter under the HTTP Request Defaults node. Be sure to leave only those calls you want to use for your performance measurements.
Collecting performance data with JMeterTo collect performance data, follow these steps:
1. Select Thread group. Enter the number of threads - that is, users (100). Enter Ramp up period - that is, the number of seconds it take to start all the users (10). Enter the loop count - that is, how many times each client runs the test (50).
2. Set up the report by selecting Thread group → Add → Listener → Aggregate report. A new node aggregate report appears under the thread group.
3. Start collecting performance data by selecting Run → Start in the menu bar.
4. Check the performance load result by selecting your aggregate report (see Figure 11-2).
Figure 11-2 JMeter Aggregate Report
Tip: The default JMeter Metal Look and Feel may skew the tables, which makes the lines unreadable; in that case, just change the Look and Feel to Windows.
254 Techniques for Managing Large WebSphere Installations

JMeter provides a convenient way to store performance sample results into local files in XML or CSV format; these files can be later loaded to a selected Listener for graphical evaluation (see Figure 11-3).
Figure 11-3 JMeter Thread Group setting number of users and counts
JMeter features many options for performance analysis. For example, you can add other listeners to your thread group or display an aggregate graph to see the response time of the actual JSPs.
Remote testing with JMeterA single JMeter client is probably not capable of sufficiently stressing a large WebSphere Application Server installation, so multiple remote testing clients are required. We used a single central GUI client to collect performance data from five remote testing clients. To attach a remote JMeter client to a GUI client:
1. On each remote test client, start /bin/jmeter-server.bat or /bin/jmeter-server.sh. You may have to copy rmiregistry.exe from the Java distribution to the /bin directory.
2. On a local GUI client, modify the /bin/jmeter.properties file; for each remote client, add its IP address to the remote_hosts property line.
3. On a local GUI client, select Run → Remote start and select a remote client IP or select Remote start all.
Tip: To evaluate a complex test scenario (for example, Start a cluster while collecting performance data against another cluster), check the Loop Count - Forever option. After completing the test, stop the JMeter collection using menu option Run → Stop.
Chapter 11. Large installation scenarios 255

Note that we did not use a time server; thus, some of our test result data may look off by tens of seconds.
Standalone remote clientsYou should always monitor the testing client CPU to be sure the client does not overload itself. We tried to use remote JMeter clients as described previously, but during the first test rounds, some of the clients consumed 100% CPU all the time, which probably distorted our test data. Thus we decided to use standalone test clients, and after each test, collected the data and aggregated it using the JmeterAnalyzer.jar program that we developed. This program can be run using the JmeterAnalyzer.bat batch file.
Both JmeterAnalyzer.jar and JmeterAnalyzer.bat are included in the additional material available with this publication (see Appendix A, “Additional material” on page 315).
The JmeterAnalyzer.bat file must be modified to point to a folder containing the test results from JMeter. The program aggregates all files with the .cvs extension into one results file (with five-second aggregated response time intervals). The result can be viewed as a graph in Microsoft Excel® following these steps:
� Select the Date and Avg columns.
� Select Insert → Chart → Area.
You will see a color graph with all the data.
Tips on using JMeter
� Using a too small number of URLs (or even a single URL) for too many simulated users results in many JMeter errors, which should be avoided because these errors distort test data. JMeter opens a new connection to the server for each test; if the test is too short, JMeter cannot close the connection socket fast enough, which results in socket congestion. We recommend using at least 10 URLs in a sequence; these 10 URLs will consume just 1 socket.
� Use the Microsoft Windows command netstat -ano to list all the sockets consumed.
� When testing a stateful conversation (that is, using a stateful session EJB or even just a servlet), the client must retain the conversation cookie in order not to create a new socket for each call. In this case, the HTTP cookie manager listener has to be added to the thread group.
� You should use a time server to properly correlate results from multiple boxes.
256 Techniques for Managing Large WebSphere Installations
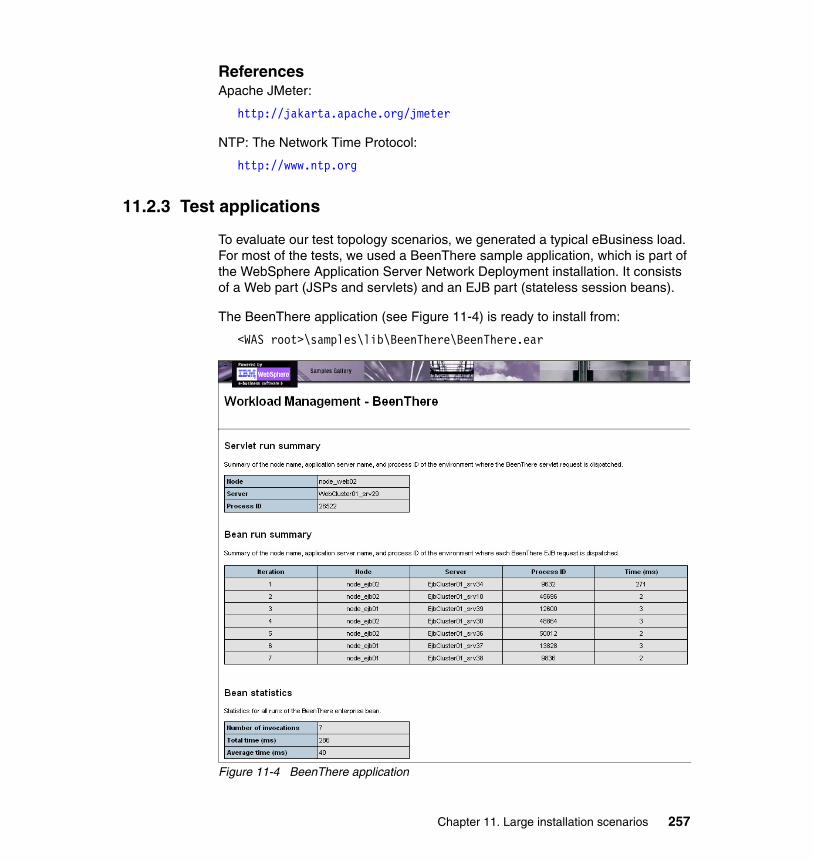
ReferencesApache JMeter:
http://jakarta.apache.org/jmeter
NTP: The Network Time Protocol:
http://www.ntp.org
11.2.3 Test applications
To evaluate our test topology scenarios, we generated a typical eBusiness load. For most of the tests, we used a BeenThere sample application, which is part of the WebSphere Application Server Network Deployment installation. It consists of a Web part (JSPs and servlets) and an EJB part (stateless session beans).
The BeenThere application (see Figure 11-4) is ready to install from:
<WAS root>\samples\lib\BeenThere\BeenThere.ear
Figure 11-4 BeenThere application
Chapter 11. Large installation scenarios 257

For more information about the BeenThere application, refer to 8.7 “Installing and configuring BeenThere” in the IBM Redbook publication WebSphere Application Server V6 Scalability and Performance Handbook, SG24-6392.
11.2.4 Other tools
JMeter provides a useful picture of application throughput, yet it cannot measure other performance parameters, such as time. These performance parameters are required to start up a cluster. To obtain information about these parameters, other tools have to be used:
� nmon - free to download from developerWorks:
http://www.ibm.com/developerworks
� Microsoft Excel (to graph textual performance results from JMonitor)
Microsoft Excel must be used as nmon analyzer. You produce server performance data using nmon. Then you load the result files into a Microsoft Excel evaluation spreadsheet, which comes bundled with nmon.
The nmon tool is available for Linux and AIX® only; it is not available for Microsoft Windows. It performs the following functions:
� Provides overall CPU utilization for a detail time frame
� Provides CPU utilization for a given process for a detail time frame
The nmon tool can provide performance analysis for a detail time frame including:
� CPU and memory utilization
� kernel statistics and queue information
� Disk I/O rates, transfers, and read/write ratios
� Top processors
� Paging space and paging rates
We installed Red Hat Enterprise server on all the measured systems.
ReferencesFor more information, refer to:
http://www.ibm.com/collaboration/wiki/display/WikiPtype/nmon
258 Techniques for Managing Large WebSphere Installations
11.3 Topology scenarios
In this section we describe topology scenarios built on our testing environment to evaluate differences in using core groups from manageability, functionality, and throughput viewpoints. We provide an introduction to all the tests and list the steps required to perform them:
� Deployment infrastructure setup
� Scenario test environment setup
� Scenario tests planning. The planning sections
– Explain the topology goals
– Demonstrate how to achieve the goals
– Prove the intended goal was met
� Scenario server setup
� Scenario client setup
Chapter 11. Large installation scenarios 259

11.3.1 Infrastructure for topology scenarios
Figure 11-5 depicts the infrastructure environment we used to run all the scenario tests. Note that the environment also involved network components not shown in the figure.
Figure 11-5 Scenarios infrastructure environment
JMeter clients
x236 a2 CPU / 3.3 GB
MS Windows 2003 ServerWAS 6.1 ND App servers
x236 c2 CPU / 2 GB
MS Windows 2003 ServerIBM HTTP Server
x236 d2 CPU / 3.3 GB
MS Windows 2003 ServerWAS 6.1 ND Deployment Mgr
x395016 CPU / 32 GB / 64bitRedhat 4 Linux server
WAS 6.1 ND App servers
x4458 CPU / 16 GB / 32bitRedhat 5 Linux server
WAS 6.1 ND App servers
EJB clusters
Web clusters
HTTP
HTTP
RMI/IIOP
OP clusters
HTTP plugin
x236 b2 CPU / 3.3 GB
MS Windows 2003 ServerWAS 6.1 ND App servers
OP clusters
260 Techniques for Managing Large WebSphere Installations

All scenario tests must be planned over the same set of clusters:
� Web clusters: Distributed only on node x445; host the Web part of the testing application. Web and EJB clusters shared the same node in Scenario 3.
� EJB clusters: Distributed only on node x3950; host the EJB part of the testing application.
� OP clusters: Distributed on nodes x236a and x236b; host clusters with no applications installed on them at all.
OP clusters on nodes x236a and x236b play an important role in measuring the impact of their start and stop cluster operations onto the other two nodes.
In all tested topologies, the OP clusters span five application servers configured on node x236a and another five application servers configured on node x236b.
Important:
� During the tests, our clients use only the Web and EJB clusters. Therefore any operations on the plain OP clusters should not affect the clients; yet as we see later, core group-related configurations executed on OP clusters at the same time had significant impact on all clients and servers.
� In the following topology scenarios, the entire Web part of the application, along with session replication processing, ran on the x445 machine, while the EJB part of the application ran on the x3950. The Web part of the application and session replication is a bit more CPU intensive, so the x445 appears to be busier in all the scenarios.
Chapter 11. Large installation scenarios 261

11.3.2 Setting up a test topology scenario
In this section we discuss the steps for setting up the server and client environments for running the selected topology scenario. The goal of the tests is to set up and tear down the topology scenario as quickly as possible without error. Each setup and teardown is a repetitive task that must be carefully planned (see Figure 11-6).
Figure 11-6 Scenario topology repetitive task flow
Plan client performance throuput# clients / threads / urls
Distribute test to JMeter clientsTest.jtl
Profile management:Setup-profile.bat
Topology managementSetup-topology.bat
Deployment managementSetup-apps.bat
Start server monitoring
Start Load DriverJMeter test clients
Start / Stop bridges using scriptsMonitor server performance
Stop all clients.Collect results.
Evaluate client / server results
Performance tuningModify-topology.bat
Plan topology scenario# Core groups, nodes, servers
Configure TopologyModify-topology.bat
262 Techniques for Managing Large WebSphere Installations

Note that the JMeter tests slightly differ from scenario to scenario due to the number of clusters. The test distribution to JMeter clients is not a one-time activity. The tests differ in the URLs used, but the number of client threads and number of URLs were always the same.
One major point of each test was to determine which cluster actually received a client request depending on the number of clusters started.
11.3.3 Planning scenario tests
Starting from a small and simple topology, we gradually arrived at large topology scenarios. The topology scenarios address the following large installation problems:
� Single core group topology (Scenario 1 tests)
Impact of too much growth in a single core group topology
� Two core groups topology (Scenario 2 tests)
Fixing single core group problems using bridging
� Four core groups mesh and chain topologies (Scenario 3 tests)
Find mesh topology scalability limits
Table 11-1 lists all the tests accomplished.
Table 11-1 Building simple to complex scenarios
Scenario name Topology Test name Configuration
Scenario 1: single core group
Single core group
Scenario 1-44 44 members
Scenario 1-80 80 members
Chapter 11. Large installation scenarios 263

The same set of tests were run on each topology scenario and then evaluated. Next we increased the load, reran the test, modified the topology, and ran it again.
11.3.4 Tuning the topology
We applied tuning on two levels:
� Core group tuning
Achieved by using script ham-config
� Operating system-level tuning
Manually on Redhat Linux system
Scenario 2: two core groups
Two core groups: mesh
Scenario 2:No bridge
80 membersNo core group bridging
Scenario 2:Bridge
80 membersCore group bridging, but no application traffic across
Scenario2:Cross bridge
80 membersCore group bridging, with application traffic across
Scenario 3: three and more core groups Mesh Scenario 3:
Mesh48 membersCore group bridging connected in mesh
Chain Scenario 3:Chain
48 membersCore group bridging connected in chain
Scenario name Topology Test name Configuration
264 Techniques for Managing Large WebSphere Installations

Tuning core groupsThe significant parameters shown in Table 11-2 have been tuned up for the second round of tests in file scenario1-ham-config.dat. These settings are also produced in the WebSphere Application Server console by selecting Servers → Core groups → Core group settings.
Table 11-2 Core groups tuning parameters
Topology parameter Value Default Note
Core groups 1
Core group members 104
Session management ON No
HA manager ON No
IBM_CS_WIRE_FORMAT_VERSION 6.1.0 No Core group protocol ID; core group scalability improvement
IBM_CS_DATASTACK_MEG 100 No Data stack memory amount in MB
IBM_CS_FD_PERIOD_SECS 30 Yes Time interval in seconds between consecutive heartbeats.
IBM_CS_FD_CONSECUTIVE_MISSED 6 Yes Consecutive number of heartbeats that must be missed before the protocol assumes that the core group member has failed
IBM_CS_UNICAST_DISCOVERY_INTERVAL
60 Yes Time in seconds the discovery protocol waits before it recalculates the set of unconnected core group members and attempts to open connections to those members
IBM_CS_SOCKET_BUFFER_SIZE 0 Yes Size of the socket buffer that the core group transport obtains
HA manager tuned:TransportBufferSize
100 No Transport buffer size
Chapter 11. Large installation scenarios 265

Tuning the operating systemThe significant parameters shown in Table 11-3 have been tuned at the operating system level according to recommendations in the WebSphere Application Server, Version 6.1 Information Center at:
http://publib.boulder.ibm.com/infocenter/wasinfo/v6r1/index.jsp
Table 11-3 Tuning operating system parameters
ReferencesRefer to the following for more information:
Linux Performance and Tuning Guidelines, REDP-4285
http://w3.itso.ibm.com/abstracts/redp4285.html?Open
Tuning Red Hat Enterprise Linux on IBM eServer xSeries Servers, REDP-3861
http://w3.itso.ibm.com/abstracts/redp3861.html?Open
WebSphere Application Server, Version 6.1 Information Center section, “Tuning operating systems”:
http://publib.boulder.ibm.com/infocenter/wasinfo/v6r1/topic/com.ibm.websphere.nd.doc/info/ae/ae/tprf_tuneopsys.html
See our custom settings for Red Hat Linux in files x445-tune-redhat.sh and x3950-tune-redhat.sh in Appendix A, “Additional material” on page 315.
Parameter name Value Description
tcp_fin_timeout 30 Elapsed time before TCP/IP can release a closed connection and reuse its resources
netdev_max_backlog 3000 Connection backlog when a high rate of incoming requests result in connection failures
somaxconn 3000 Maximum number of connections when a high rate of incoming requests result in connection failures
tcp_keepalive_intvl 15 Wait time between isAlive interval probes
tcp_keepalive_probes 5 Number of probes before timing out
ulimit 8000 Linux file descriptors: specifies the number of open files that are supported
266 Techniques for Managing Large WebSphere Installations
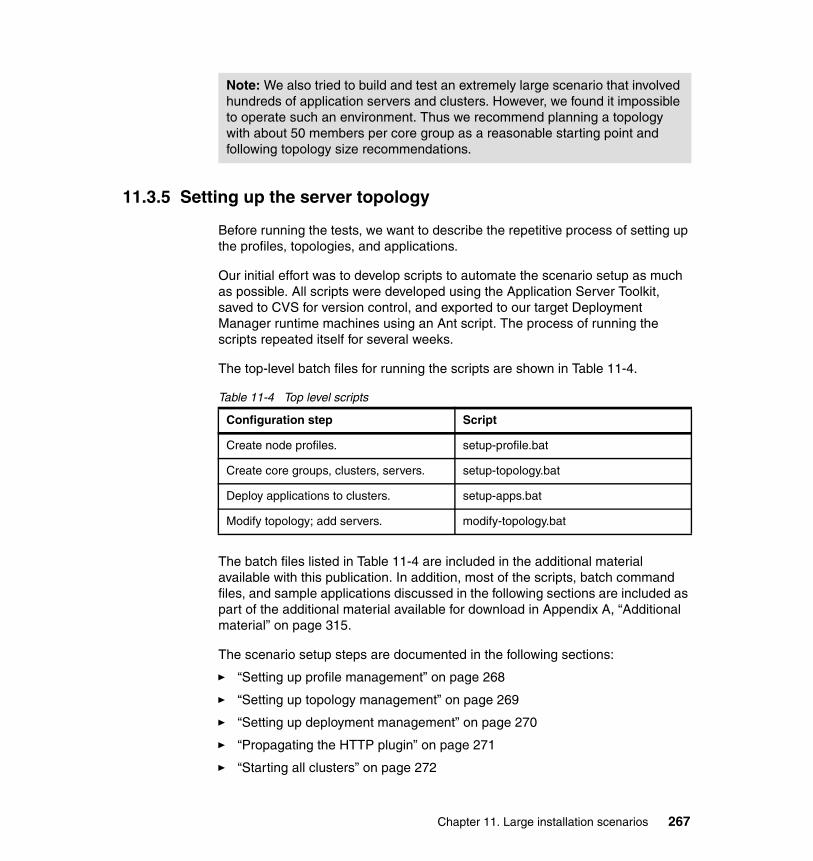
11.3.5 Setting up the server topology
Before running the tests, we want to describe the repetitive process of setting up the profiles, topologies, and applications.
Our initial effort was to develop scripts to automate the scenario setup as much as possible. All scripts were developed using the Application Server Toolkit, saved to CVS for version control, and exported to our target Deployment Manager runtime machines using an Ant script. The process of running the scripts repeated itself for several weeks.
The top-level batch files for running the scripts are shown in Table 11-4.
Table 11-4 Top level scripts
The batch files listed in Table 11-4 are included in the additional material available with this publication. In addition, most of the scripts, batch command files, and sample applications discussed in the following sections are included as part of the additional material available for download in Appendix A, “Additional material” on page 315.
The scenario setup steps are documented in the following sections:
� “Setting up profile management” on page 268
� “Setting up topology management” on page 269
� “Setting up deployment management” on page 270
� “Propagating the HTTP plugin” on page 271
� “Starting all clusters” on page 272
Note: We also tried to build and test an extremely large scenario that involved hundreds of application servers and clusters. However, we found it impossible to operate such an environment. Thus we recommend planning a topology with about 50 members per core group as a reasonable starting point and following topology size recommendations.
Configuration step Script
Create node profiles. setup-profile.bat
Create core groups, clusters, servers. setup-topology.bat
Deploy applications to clusters. setup-apps.bat
Modify topology; add servers. modify-topology.bat
Chapter 11. Large installation scenarios 267
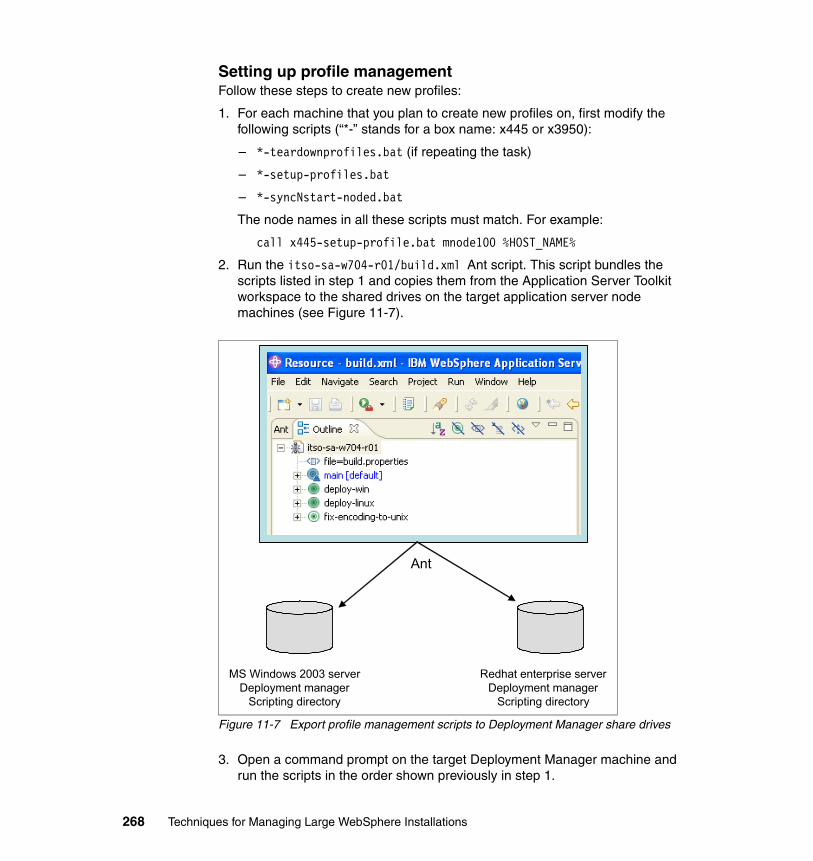
Setting up profile managementFollow these steps to create new profiles:
1. For each machine that you plan to create new profiles on, first modify the following scripts (“*-” stands for a box name: x445 or x3950):
– *-teardownprofiles.bat (if repeating the task)
– *-setup-profiles.bat
– *-syncNstart-noded.bat
The node names in all these scripts must match. For example:
call x445-setup-profile.bat mnode100 %HOST_NAME%
2. Run the itso-sa-w704-r01/build.xml Ant script. This script bundles the scripts listed in step 1 and copies them from the Application Server Toolkit workspace to the shared drives on the target application server node machines (see Figure 11-7).
Figure 11-7 Export profile management scripts to Deployment Manager share drives
3. Open a command prompt on the target Deployment Manager machine and run the scripts in the order shown previously in step 1.
MS Windows 2003 serverDeployment manager
Scripting directory
Redhat enterprise serverDeployment manager
Scripting directory
Ant
268 Techniques for Managing Large WebSphere Installations

4. Verify profile management setup results using a file browser on the target application server boxes (see Figure 11-8); folders should be created for each profile declared in the scripts.
Figure 11-8 Verify profiles created
Setting up topology management Follow these steps to create the topology scenario:
1. Modify the *.dat files.
These files provide primary input for the Jython scripts. For example, /itso-sa-w704-r01/topologies/scenario1/scenario1.dat contains the names of the deployment components and their configuration. These components are include the cell, nodes, clusters, servers, and core groups. (delete the rest of the text for step 1 and the list (a-d).
2. Before exporting and running the scripts, you should check the contents of the setup-topology.py script, which is the entry point from setup-topology.bat; this script is the main worker that creates the required core groups.
3. Similar to the profile management scripts, run an Ant script to export the scripts and dat files from the Application Server Toolkit workspace to the shared drives on the target Deployment Manager machine.
4. Open a command prompt on the target Deployment Manager machine and run the scripts - for example setup-topology.bat.
Important: Node names used in profile management setup scripts have to match the node names used later in the topology management *.dat files for the Jython scripts - for example, scenario1.dat.
Chapter 11. Large installation scenarios 269

5. Verify the topology management setup results in the WebSphere Application Server administration console: the core groups should be visible under System administration → Cell → Local topology (see Figure 11-9).
Figure 11-9 Topology management setup - verify core groups created in administration console
Refer to Chapter 9, “System management and configuration” on page 167 for more information about Jython scripts.
Setting up deployment management Follow these steps to deploy applications onto clusters:
1. Put your applications into folder itso-sa-w704-r01/apps (included as part of the additional material documented in Appendix A, “Additional material” on page 315).
Important:If you want to use the scripts provided, do not modify the section names, such as [cell] or [mnodes], and do not modify the section labels, such as name: or items:. These pointers are required by the Jython scripts.
270 Techniques for Managing Large WebSphere Installations

2. Modify those dat files that declare the application names to be deployed. File itso-sa-w704-r01/scenario1/scenario1-apps.dat contains declarations for each application.
For example:
name: ShopCartWebModuleurl: ShopCartWeb.war,WEB-INF/web.xmlxmiUrl: ShopCartWeb.war,WEB-INF/ibm-web-ext.xmiMapModulesToServers: +WebSphere:cell=kpxv838Cell01,node=redbooks-node,server=webserver1CtxRootForWebMod: /CartMapWebModToVH: default_hostJSPReloadForWebModFlag: YesJSPReloadForWebModInterval: 10ejbResourceRefs: ejbShopCartEjbRef
3. Before exporting and running the scripts, you should check the contents of the setup-apps.py script, which is the entry point from setup-apps.bat; this script is the main worker that deploys the applications to target clusters.
4. Run the Ant script to export the scripts and dat files from the Application Server Toolkit workspace to shared drives on the target Deployment Manager machines.
5. Open a command prompt on the target Deployment Manager machine and run the scripts - for example, setup-apps.bat.
6. Verify the topology management setup results in the IBM WebSphere Application Server administration console: the core groups should be visible under Applications → Enterprise applications.
Propagating the HTTP pluginWith each new automatic setup and deployment, the plugins for the WebSphere Application Server IBM HTTP Server have to be regenerated. Although it could be done manually using the WebSphere Application Server administration console, we developed the plug-in-config.py script to automate the task. HTTP plugin propagation can be invoked - for example:
modify-topology.bat scenario2 ham-config
Note: We used the same prefix for the topology and deployment scripts. scenario1.dat and scenario1-apps.dat form a pair for a single topology and deployment scenario.
Chapter 11. Large installation scenarios 271

Starting all clustersStart all the applications on all the clusters in IBM WebSphere Application Server console, choosing Servers → Clusters → Start.
After completing the first round of tests, evaluating the results, and setting goals for the next test, it is necessary to modify the topology, again using the scripts. The process of modifying the topology is described in the sections that follow.
Modifying the topologyFollow these steps to modify the topology scenario:
1. Modify the *.dat files. in the /itso-sa-w704-r01/topologies directory.
2. Run the Ant script to export the scripts and dat files from the Application Server Toolkit workspace to the shared drives on the target Deployment Manager machine.
3. Open a command prompt on the target Deployment Manager machine and run the scripts using modify-topology.bat.
4. Verify the topology management setup results in the IBM WebSphere Application Server administration console. The core groups should be visible under System administration → Cell → Local topology.
TroubleshootingAfter each setup step, check the logs using automation tools - for example, the alerter tool that pops up a message that WebSphere Application Server logged an exception.
If an error is found, the problem is probably in the *topology.dat or *apps.dat files because these files are the only input for the scripts. Double-check the *.dat files.
For further information, see 10.4, “Tools for problem analysis” on page 240.
11.3.6 Steps for setting up JMeter clients
To compare the results (see Table 11-5), we ran the same set of client tests for approximately 30 minutes (using the JMeter settings Thread group → Loop count → Forever).
Table 11-5 Common setup of all clients for all topology scenarios
JMeter clients
Web client threads for each JMeter client
URLs for each client thread
Think time per each URL request
4 50 10 requests per client session over two URLs
Sleep time 600 msec
272 Techniques for Managing Large WebSphere Installations

While testing the BeenThere application, we used a different count of interaction between the servlet and the stateless session EJB, randomly between three to seven times.
Note that the Microsoft Excel spreadsheet limit is 5000 lines. Thus, data lines aggregated from multiple test clients have to be trimmed down to meet this limit. We approximated every five lines into one line in the target input file for Microsoft Excel.
We could not find a feature in JMeter that would allow data aggregation from multiple standalone clients, so we had to develop a simple Java program (see JMeterAnalyzer.jar included in Appendix A, “Additional material” on page 315). This program aggregates all client CSV files to a single file to be graphed in Microsoft Excel.
11.4 Scenario 1 topology
In this section we evaluate single core group topology scenarios as the first stage of evaluating the environments in Figure 3-1 on page 23.
The input parameters we used for Scenario 1 are documented in Appendix A, “Additional material” on page 315 in the \itso-sa-w704-r01\topologies\scenario 1\ directory.
4 50 10 requests per client session over two URLs
Sleep time 600 msec
2 80 12 requests per client session over four URLs
Sleep time 600 msec
Tip: To save data to local files, the best type of listener is “Simple data writer,” configured as follows:
� Do not to save data as XML (that is, as plain CSV text).
� Leave the Save Assertion Results Failure Message option unchecked.
Tip: JMeter does not do a reliable job of graphing performance data along a time axis, so we recommend collecting data to text CSV files on all the clients. Then create the graphs using Microsoft Excel or a similar tool.
JMeter clients
Web client threads for each JMeter client
URLs for each client thread
Think time per each URL request
Chapter 11. Large installation scenarios 273
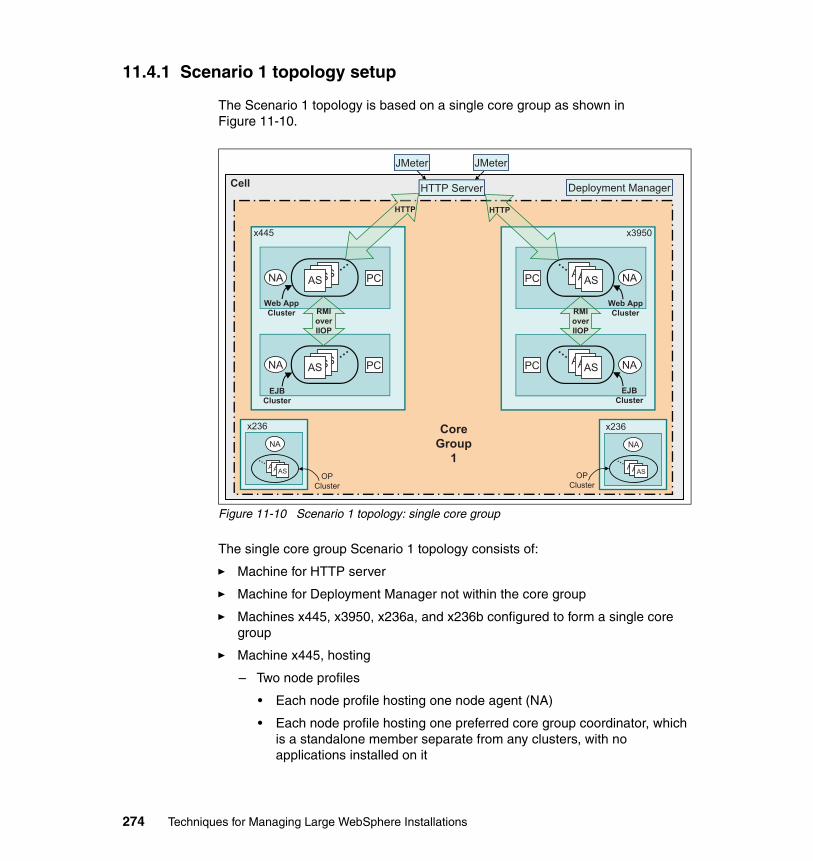
11.4.1 Scenario 1 topology setup
The Scenario 1 topology is based on a single core group as shown in Figure 11-10.
Figure 11-10 Scenario 1 topology: single core group
The single core group Scenario 1 topology consists of:
� Machine for HTTP server
� Machine for Deployment Manager not within the core group
� Machines x445, x3950, x236a, and x236b configured to form a single core group
� Machine x445, hosting
– Two node profiles
• Each node profile hosting one node agent (NA)
• Each node profile hosting one preferred core group coordinator, which is a standalone member separate from any clusters, with no applications installed on it
x236
OPCluster
HTTP ServerCell
Core
Group
1
JMeter JMeter
Deployment Manager
NA
ASASAS
…
OPCluster
x445
PCNA ASASAS…
PCNA ASASAS…
EJB
Cluster
Web App
Cluster RMI
over
IIOP
x3950
PC NAASASAS
…
PC NAASASAS
…
EJB
Cluster
Web App
ClusterRMI
over
IIOP
x236
NA
ASASAS
…
HTTP HTTP
274 Techniques for Managing Large WebSphere Installations

– Two clusters
• Each cluster hosting six members
• One of the clusters hosting just the Web application
• One of the clusters hosting just the EJB application
� Machine x3950 hosting
– Two node profiles
• Each node profile hosting one node agent
• Each node profile hosting one core group coordinator, which is a standalone member separate from any clusters, with no applications installed on it
– Two clusters
• Each cluster hosting six members
• One of the clusters hosting just the Web application
• One of the clusters hosting just the EJB application
� Machine x236a hosting
– One node profile hosting one node agent
– One cluster
• Hosting five members
• No applications installed
� Machine x236b hosting
– One node profile hosting one node agent
– One cluster
• Hosting five members
• No applications installed
The core group coordinator members were configured to use memory heap size of 512 MB, all other members use size 256 MB.
The two physical x236 server boxes with the OP clusters on them play an important role in measuring the impact of their start and stop cluster operations onto the other two nodes x445 and x3950, which are the nodes running the applications. The OP clusters span five application servers on each node; yet no applications are installed on them.
Chapter 11. Large installation scenarios 275

We have tested the single core group topology progressively with 44, 56, 68, and 80 servers with an average CPU utilization of up to 60%. Only after introducing 104 servers did the server CPU utilization go up to 100%.
As a rule of thumb, we tried to increase the load up to 100% CPU utilization for each scenario. Because steady 100% utilization is not desirable, we strived to find a load that intermittently used 70 to 100% of CPU. In a production environment, however, a steady CPU utilization above 70% may indicate a need for a hardware upgrade.
11.4.2 Scenario 1 tests planning
Scenario 1 involves the tests shown in Table 11-6.
Table 11-6 Building scenarios from simple to complex using one core group
Each test involves
� Application servers under load - that is, processing test client requests
� Administration processes (specifically, HA manager processes)
� HA coordinators (different for each topology)
� Node agents (same for all the tests)
Scenario name Topology Test name Configuration Recommended
Scenario 1: single core group
Single core group
Scenario1-44 44 members Yes
Scenario1-80 80 members NoLeads to two core groups
276 Techniques for Managing Large WebSphere Installations

11.4.3 Scenario1-44 topology
Test Scenario1-44 consists of 44 servers in a single core group (see Table 11-7).
Table 11-7 Scenario1-44 overview
Topology parameter Value
Core groups 1
Core group membersApp servers under loadOP cluster servers (2x5)Node agentsHA coordinators
44241064
Session management On
HA manager On
Chapter 11. Large installation scenarios 277

The graphs shown in Figure 11-11 depict the correlation of the aggregated response times and server CPU utilization of the JMeter test clients.
Figure 11-11 Correlation in Scenario1-44:- 44 servers in single core group
Scenario1-44: 44 members tuned in a single core group
Sta
rtO
P c
lust
er 1
Star
tOP
clus
ter 2
Stop
OP
clus
ters
1&2
Sta
rt se
rver
s BI
_Web
01,0
2
Sto
p 4
serv
ers
Star
t4se
rver
s
Stop
Ser
ver B
I_W
eb_0
1
Stop
ser
ver B
I_W
eb02
278 Techniques for Managing Large WebSphere Installations

The top graph in Figure 11-11 on page 278 is an aggregated clients response time report. It graphs the response time averages from all the clients in milliseconds. The Y axis shows the response time in milliseconds, the X axis shows the actual time. Ideally, the line should always be flat. However, core group activity or administrative activity causes the client response times to go up.
The lower two graphs in Figure 11-11 on page 278 show server CPU utilization and disk and network I/O utilization. One graph is for the x445, and the other is for the x3950. The Y axis shows CPU utilization, while the X axis shows the actual time. The dark line indicates server CPU utilization, and the lighter line is disk and network I/O utilization.
The vertical lines attempt to correlate the times between clients and servers - that is, correlate client response times with a core group activity or an administrative function on the servers.
Table 11-8 depicts the correlation of start and stop times of clusters with the impact on the client response times and the server CPU utilization.
Table 11-8 Server operations while running Scenario1-44: 44 servers in single core group
Step Operation Time Impact on clients Impact on servers
1 Sleeping for 120 seconds. 10:26:23
2 Starting clusters: ['OpCluster1']. 10:28:23 No impact No impact
3 Finished starting clusters: ['OpCluster1']. 10:30:50
4 Sleeping for 120 seconds. 10:30:50
5 Starting clusters: ['OpCluster2']. 10:32:50 No impact No impact
6 Finished starting clusters: ['OpCluster2']. 10:35:26
7 Sleeping for 120 seconds. 10:35:26
8 Stopping clusters: ['OpCluster1', 'OpCluster2'].
10:37:26 Momentary increase in response time +100 msec
Momentary increase in CPU utilization +10%
9 Finished stopping clusters: ['OpCluster1', 'OpCluster2'].
10:39:00
10 Sleeping for 120 seconds 10:39:00
11 Stopping servers: ['BI_Web01'].BI_Web02 becomes the active preferred coordinator!
10:41:00 Momentary increase in response time +100 msec
Momentary increase in CPU utilization +10%
12 Finished stopping servers: ['BI_Web01']. 10:41:22
13 Sleeping for 120 seconds. 10:41:22
Chapter 11. Large installation scenarios 279

ConclusionAs a result of our tests of the Scenario1-44 topology, we can recommend it; Running 44 servers in a single core group has no impact on both client response times and server CPU utilization when executing core group modifications:
� Stopping servers under load has some impact on client response time.
� If configuring core group settings of the same core group but on a different box than servers under load, the impact on all is visible yet minor.
� When stopping the servers under load, we can see some impact on the clients. This is due to server session replication executed by the application servers so the clients do not loose their connections; yet the impact is minor.
14 Stopping servers: ['BI_Web02'].BI_Ejb01 becomes the active preferred coordinator!
10:43:22 Momentary increase in response time +100 msec
No impact
15 Finished stopping servers: ['BI_Web02']. 10:43:41
16 Sleeping for 120 seconds. 10:43:41
17 Starting servers: ['BI_Web01', 'BI_Web02'].BI_Web01 becomes the active preferred coordinator!
10:45:41 No impact No impact
18 Finished starting servers. 10:46:46
19 Sleeping for 240 seconds. 10:46:46
20 Stopping servers: ['WebCluster01_srv01', 'WebCluster02_srv02', 'EjbCluster01_srv01', 'EjbCluster02_srv02'].Failing over to remaining members!
10:50:46 Momentary increase in response time +700 msec
No impact on server CPU utilization but major increase in I/O
21 Finished stopping servers. 10:51:33
22 Sleeping for 120 seconds. 10:51:33
23 Starting servers: ['WebCluster01_srv01', 'WebCluster02_srv02', 'EjbCluster01_srv01', 'EjbCluster02_srv02'].
10:53:33 Momentary increase in response time +700 msec
No impact
24 Finished starting servers. 10:58:22
Step Operation Time Impact on clients Impact on servers
280 Techniques for Managing Large WebSphere Installations

11.4.4 Scenario1-80 topology
Test Scenario1-80 consists of 80 servers in a single core group (see Table 11-9).
Table 11-9 Scenario1-80 overview
Figure 11-12 on page 282 depicts the correlation of the aggregated response times and server CPU utilization of the JMeter test clients.
Topology parameter Value
Core groups 1
Core group membersApp servers under loadOP cluster servers (2x5)Node agentsHA coordinators
80601064
Session management On
HA manager On
Chapter 11. Large installation scenarios 281
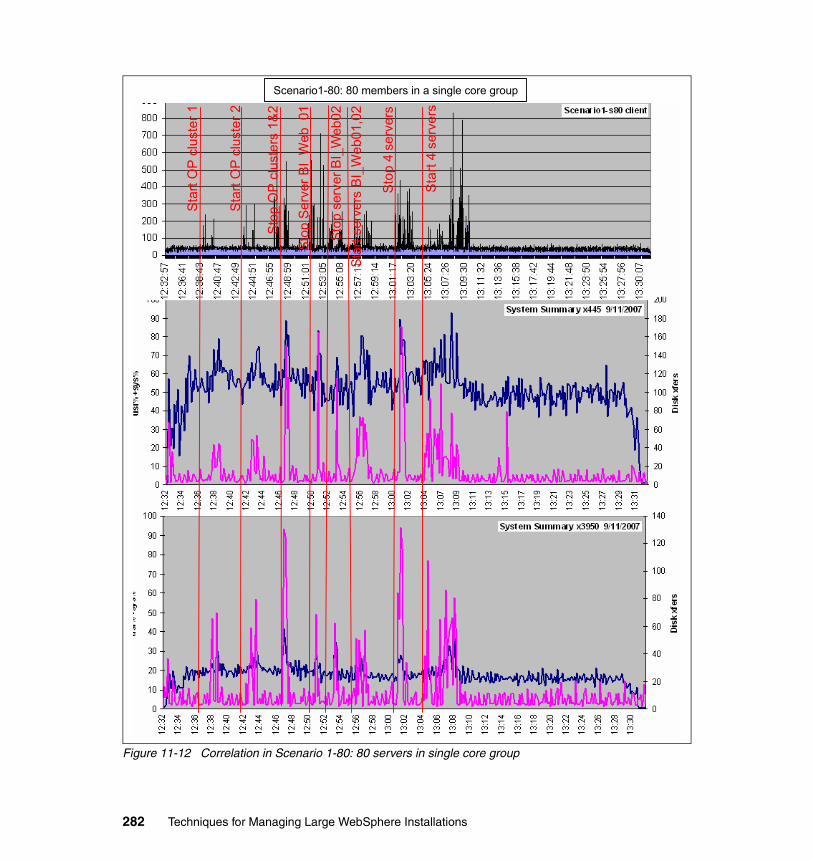
Figure 11-12 Correlation in Scenario 1-80: 80 servers in single core group
Scenario1-80: 80 members in a single core group
Sta
rtO
P c
lust
er 1
Sta
rtO
P c
lust
er 2
Sto
p O
P c
lust
ers
1&2
Sta
rt se
rver
s B
I_W
eb01
,02
Sto
p 4
serv
ers
Sta
rt4
serv
ers
Sto
p S
erve
r BI_
Web
_01
Sto
p se
rver
BI_
Web
02
282 Techniques for Managing Large WebSphere Installations

The top graph in Figure 11-12 on page 282 is an aggregated clients response time report. It graphs the response time averages from all the clients in milliseconds. The Y axis shows response time in milliseconds; the X axis shows the actual time. Ideally, the line should always be flat. However, whenever core group activity or administration activity occurs, client response times go up.
The lower two graphs show server CPU utilization and disk and network I/O utilization. One graph is for the x445, and the other is for the x3950. The Y axis shows CPU utilization, while the X axis shows time. The dark line is server CPU utilization, and the lighter line is disk and network I/O utilization.
The vertical lines attempt to correlate the times between clients and servers - that is, correlate client response times with a core group activity or an administrative function on the servers.
Table 11-10 depicts the correlation of start and stop times of clusters with the impact on the client response times and the server CPU utilization.
Table 11-10 Server operations while running Scenario1-80: 80 servers in single core group
Step Operation Time Impact on clients Impact on servers
1 Sleeping for 120 seconds. 12:35:30
2 Starting clusters: ['OpCluster1']. 12:37:30 No impact No impact
3 Finished starting clusters: ['OpCluster1']. 12:40:07
4 Sleeping for 120 seconds. 12:40:07
5 Starting clusters: ['OpCluster2']. 12:42:07 No impact No impact
6 Finished starting clusters: ['OpCluster2']. 12:45:02
7 Sleeping for 120 seconds. 12:45:02
8 Stopping clusters: ['OpCluster1', 'OpCluster2'].
12:47:02 Momentary increase in response time +400 msec
Momentary increase in CPU utilization up to 85%
9 Finished stopping clusters: ['OpCluster1', 'OpCluster2'].
12:49:05
10 Sleeping for 120 seconds. 12:49:05
11 Stopping Servers: ['BI_Web01'].BI_Web02 becomes the active preferred coordinator!
12:51:05 Problem: steady increase in response time +400 msec
Momentary increase in CPU utilization up to 80%
12 Finished stopping servers: ['BI_Web01']. 12:51:29
13 Sleeping for 120 seconds. 12:51:29
14 Stopping servers: ['BI_Web02']. 12:53:29 No impact No impact
15 Finished stopping servers: ['BI_Web02']. 12:53:51
Chapter 11. Large installation scenarios 283

ConclusionWe do not recommend running 80 servers tuned in a single core group as represented by the Scenario1-80 topology; we saw significant impact on both client response times and server CPU utilization when executing core group modifications:
� Noticeable peaks on both the client and server side originate from core group traffic (stopping and starting OP clusters); this behavior is completely acceptable.
� We also do not recommend this scenario because of the behavior induced by stopping the bridge interfaces. A single core group takes too long to recover from a bridge interface stop operation.
� System resources get noticeably stressed when stopping and starting servers under load, which causes too much impact on the clients.
� Client response time tends to increase when starting the bridge interfaces; at the same time, server CPU utilization tends to increase too. While client response time is still acceptable (just below one second), the server CPU utilization is close to 95%.
16 Sleeping for 120 seconds. 12:53:51
17 Starting servers: ['BI_Web01', 'BI_Web02'].BI_Web01 becomes the active preferred coordinator!
12:55:51 Steady increase in response time +100 msec
Less impact
18 Finished starting servers 12:57:15
19 Sleeping for 240 seconds. 12:57:15
20 Stopping servers: ['WebCluster01_srv01', 'WebCluster02_srv02', 'EjbCluster01_srv01', 'EjbCluster02_srv02'].Failing over to remaining members!
13:01:15 Problem: steady increase in response time +500 msec
Problem: steady increase in CPU utilization up to 80%
21 Finished stopping servers 13:02:24
22 Sleeping for 120 seconds. 13:02:24
23 Starting servers: ['WebCluster01_srv01', 'WebCluster02_srv02', 'EjbCluster01_srv01', 'EjbCluster02_srv02'].
13:04:24 Problem: steady increase in response time +800 msec
Problem: steady increase in CPU utilization up to 95%
24 Finished starting servers 13:09:06
Step Operation Time Impact on clients Impact on servers
284 Techniques for Managing Large WebSphere Installations

11.5 Scenario 2 topology
In this section we evaluate two core group topology scenarios as the first stage of an environment evaluation as depicted in Figure 11-13.
Figure 11-13 Scenario 2 topology: two core groups
The input parameters we used for Scenario 2 are documented in Appendix A, “Additional material” on page 315 in the \itso-sa-w704-r01\topologies\scenario 2\ directory.
Recommendation: Our tests of Scenario1-80 indicate the single core group topology should be split into multiple core groups.
x236
OPCluster
HTTP ServerCell
Core
Group
1
JMeter JMeter
Deployment Manager
NA
ASASAS
…
OPCluster
x445
NA ASASAS…
NA ASASAS…
EJB
Cluster
Web App
Cluster RMI
over
IIOP
x3950
NAASASAS
…
NAASASAS
…
EJB
Cluster
Web App
ClusterRMI
over
IIOP
x236
NA
ASASAS
…
HTTP HTTP
Core
Group
2
BI
BI
BI
BI
Chapter 11. Large installation scenarios 285

11.5.1 Scenario 2 topology setup
Scenario 2 topology is based on two core groups:
Topology scenario 2 consists of:
� Machine for HTTP server
� Machine for Deployment Manager not within the core group
� Machines x445 and x236a configured to form core group 1
� Machines x3950 and x236b configured to form core group 2
� Machine x445 hosting
– Two node profiles
• Each node profile hosting one node agent (“NA” in Figure 11-13 on page 285).
• Each node profile hosting one bridge interface (“BI”) and acts as a preferred coordinator. The bridge interface/preferred coordinator server is a standalone member separate from any clusters, with no applications installed on it.
– Two clusters
• Each cluster hosting six members.
• One of the clusters hosts just the Web application.
• One of the clusters hosts just the EJB application.
� Machine x3950 hosting
– Two node profiles
• Each node profile hosting one node agent.
• Each node profile hosting one bridge interface and acts as a preferred coordinator. The bridge interface/preferred coordinator server is a standalone member separate from any clusters, with no applications installed on it.
• Each cluster hosting six members.
• One of the clusters hosts just the Web application.
• One of the clusters hosts just the EJB application.
286 Techniques for Managing Large WebSphere Installations

� Machine x236a hosting
– One node profile hosting one node agent
– One cluster
• Hosting five members
• No applications installed
� Machine x236b hosting
– One node profile hosting one node agent
– One cluster
• Hosting five members
• No applications installed
The bridge interface members were configured to use a memory heap size of 512 MB; all other members, a heap size of 256 MB.
11.5.2 Scenario 2 topology tests planning
Scenario 2 involves the tests shown in Table 11-11.
Table 11-11 Building scenarios from simple to complex for two core groups
Scenario name Topology Test name Configuration Recommended
Scenario 2: two core groups
Two core groups: mesh
Scenario2-No bridge
80 membersNo core group bridging
Yes/No,depends on application usage
Scenario2-Bridge
80 membersCore group bridging but no application traffic across
Yes
Scenario2-Cross bridge
80 membersCore group bridging with application traffic across
Yes
Chapter 11. Large installation scenarios 287

11.5.3 Scenario2 topology-No bridge
Test Scenario 2-No bridge consists of 80 servers in two core groups without bridging (see Table 11-12).
Table 11-12 Scenario2-No bridge overview
Tip: Performance tuning techniques:
� When tuning performance, the problem you look for is not a momentary increase in client response time nor a momentary increase in server CPU utilization; on the contrary, you should consider only a steady increase of these performance parameters as a problem.
� When tuning the core group parameters, you often should look performance stabilization, rather than for immediate performance improvement.
Topology parameter Value
Core groups 2
Core group membersApp servers under loadOP cluster servers (2x5)Node agentsHA coordinators
80601064
Session management On
HA manager On
288 Techniques for Managing Large WebSphere Installations
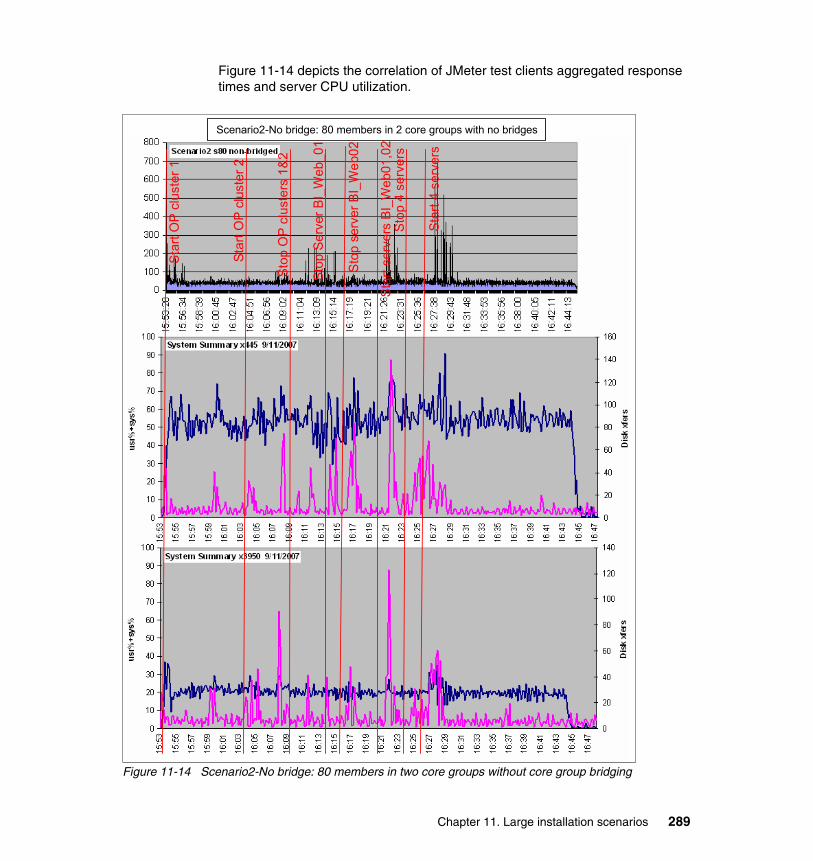
Figure 11-14 depicts the correlation of JMeter test clients aggregated response times and server CPU utilization.
Figure 11-14 Scenario2-No bridge: 80 members in two core groups without core group bridging
Scenario2-No bridge: 80 members in 2 core groups with no bridges
Sta
rtO
P c
lust
er 1
Sta
rtO
P cl
uste
r 2
Sto
p O
P c
lust
ers
1&2
Sta
rt se
rver
s BI
_Web
01,0
2S
top
4se
rver
s
Sta
rt4
serv
ers
Stop
Ser
ver B
I_W
eb_0
1
Sto
p se
rver
BI_
Web
02
Chapter 11. Large installation scenarios 289

The top graph in Figure 11-14 on page 289 is an aggregated client response time report. It graphs the response time averages in milliseconds from all the clients. The Y axis shows the response time in milliseconds; the X axis shows the actual time. Ideally, the line should always be flat. However, whenever core group activity or administration activity occurs, client response times go up.
The lower two graphs show server CPU utilization and disk and network I/O utilization. One graph is for the x445, and the other is for the x3950. The Y axis shows CPU utilization, while the X axis shows time. The dark line represents server CPU utilization, and the lighter line is disk and network I/O utilization.
The vertical lines attempt to correlate the times between clients and servers - that is, correlate client response times with a core group activity or an administrative function on the servers.
Table 11-13 depicts the correlation of start and stop times of clusters with the impact on client response times and server CPU utilization.
Table 11-13 Server operations while running Scenario2-No bridge: 80 servers in two core groups without core group bridging
Step Operation Time Impact on clients Impact on servers
1 Sleeping for 120 seconds. 15:53:02
2 Starting clusters: ['OpCluster1']. 15:55:02 No impact Momentary increase in CPU utilization up to 65%
3 Finished starting clusters: ['OpCluster1']. 16:01:17
4 Sleeping for 120 seconds. 16:01:17
5 Starting clusters: ['OpCluster2']. 16:03:17 No impact No impact
6 Finished starting clusters: ['OpCluster2']. 16:06:22
7 Sleeping for 120 seconds. 16:06:22
8 Stopping clusters: ['OpCluster1', 'OpCluster2'].
16:09:22 No impact No impact
9 Finished stopping clusters: ['OpCluster1', 'OpCluster2'].
16:11:17
10 Sleeping for 120 seconds. 16:11:17
11 Stopping servers: ['BI_Web01'].BI_Web02 becomes the active preferred coordinator!
16:13:17 Momentary increase in response time +100 msec
Less impact
12 Finished stopping servers: ['BI_Web01']. 16:14:25
13 Sleeping for 120 seconds. 16:14:25
290 Techniques for Managing Large WebSphere Installations

ConclusionAs a result of our tests of the Scenario2-No bridge topology, we can recommend it: Running 80 servers tuned in two core groups without core group bridging has some impact on client response time but significant impact on server CPU utilization when executing core group modifications.
We recommend Scenario2-No bridge in the following cases:
� If applications in different core groups do not need to talk to each other - that is, you know the application communication functionality very well.
14 Stopping servers: ['BI_Web02']. 16:16:25 Momentary increase in response time +100 msec
Less impactNote momentary I/O increase on Web and EJB clusters
15 Finished stopping servers: ['BI_Web02']. 16:16:56
16 Sleeping for 120 seconds. 16:16:56
17 Starting servers: ['BI_Web01', 'BI_Web02'].BI_Web01 becomes the active preferred coordinator!
16:18:56 Problem: steady increase in response time +350 msec
Momentary impact on CPU utilization up to 80%
18 Finished starting servers. 16:20:19
19 Sleeping for 240 seconds. 16:20:19
20 Stopping servers: ['WebCluster01_srv01', 'WebCluster02_srv02', 'EjbCluster01_srv01', 'EjbCluster02_srv02'].Failing over to remaining members!
16:22:19 Less impact Less impact
21 Finished stopping servers. 16:21:40
22 Sleeping for 120 seconds. 16:21:40
23 Starting servers: ['WebCluster01_srv01', 'WebCluster02_srv02', 'EjbCluster01_srv01', 'EjbCluster02_srv02'].
16:25:40 Problem: steady increase in response time +700 msec
Problem: steady impact on CPU utilization up to 95%
24 Finished starting servers. 16:28:17
Step Operation Time Impact on clients Impact on servers
Chapter 11. Large installation scenarios 291

� If the environment is built using a silo approach - that is, into separated core groups.
We do not recommend Scenario2-No bridge in such a case as when the applications must talk to each other or when you are unfamiliar with them. Instead, we recommend using the bridging core group scenario.
Note no high availability is achieved in this scenario because the applications do not span multiple boxes.
Tip: Never start all the members at once; try to proportionally divide the members into batches of, for example, seven members to work with. Using the select all option, members starting or stopping results in a significant impact on both the client response time and the server CPU utilization.
292 Techniques for Managing Large WebSphere Installations

11.5.4 Scenario2-Bridge topology
Test Scenario2-Bridge (see Table 11-14) involves:
� Two core groups bridged.
� Application traffic does not flow over the bridges - that is, RMI and IIOP calls from the Web clusters to the EJB clusters never flow over the bridge members.
� Bulletin board is not in use.
Table 11-14 Scenario2-Bridge overview
Figure 11-15 on page 294 depicts the correlation of JMeter test clients aggregated response times and server CPU utilization.
Topology parameter Value
Core groups 2
Core group membersApp servers under loadOP cluster servers (2x5)Node agentsBridge interfaces/preferred coordinators
80601064
Session management On
HA manager On
Chapter 11. Large installation scenarios 293

Figure 11-15 Scenario2-Bridge: 80 members in two core groups without application traffic over the bridges
Scenario2-Bridge: 80 members tuned in 2 core groups bridged, with no apps across
Sta
rtO
P c
lust
er 1
Sta
rtO
P c
lust
er 2
Sto
p O
P c
lust
ers
1&2
Sta
rt se
rver
s B
I_W
eb01
,02
Stop
4se
rver
s
Sta
rt4
serv
ers
Stop
Ser
ver B
I_W
eb_0
1
Sto
p se
rver
BI_
Web
02
294 Techniques for Managing Large WebSphere Installations

The top graph in Figure 11-15 on page 294 is an aggregated client response time report. It graphs the response time averages from all the clients in milliseconds. The Y axis shows response time in milliseconds; the X axis shows the actual time. Ideally, the line should always be flat. However, whenever core group activity or administration activity occurs, client response times go up.
The lower two graphs show server CPU utilization and disk and network I/O utilization. One graph is for the x445, and the other is for the x3950. The Y axis shows CPU utilization, while the X axis shows time. The dark line represents server CPU utilization, and the lighter line is disk and network I/O utilization.
The vertical lines attempt to correlate the times between clients and servers - that is, correlate client response times with a core group activity or an administrative function on the servers.
Table 11-15 depicts the correlation of cluster start and stop times with impact on client response times and server CPU utilization.
Table 11-15 Server operations in Scenario2-Bridge: 80 servers in two core groups without application traffic over the bridges
Step Operation Time Impact on clients Impact on servers
1 Sleeping for 120 seconds. 17:04:38
2 Starting clusters: ['OpCluster1']. 17:06:38 No impact Momentary increase in CPU utilization up to 65%
3 Finished starting clusters: ['OpCluster1'].
17:11:15
4 Sleeping for 120 seconds. 17:11:15
5 Starting clusters: ['OpCluster2']. 17:13:15 No impact No impact
6 Finished starting clusters: ['OpCluster2'].
17:16:04
7 Sleeping for 120 seconds. 17:16:04
8 Stopping clusters: ['OpCluster1', 'OpCluster2'].
17:18:04 No impact No impactnote momentary I/O increase on Web and EJB clusters
9 Finished stopping clusters: ['OpCluster1', 'OpCluster2'].
17:20:13
10 Sleeping for 120 seconds. 17:20:13
11 Stopping servers: ['BI_Web01'].BI_Web02 becomes the active preferred coordinator!
17:22:13 Momentary increase in response time +100 msec
Less impactNote momentary I/O increase on Web and EJB clusters
Chapter 11. Large installation scenarios 295

ConclusionAs a result of our tests of the Scenario2-Bridge topology, we recommend it: Running 80 servers tuned in two core groups has no impact on client response times and some impact on server CPU utilization when executing core group modifications:
� Neither the client or server is impacted when pursuing bridge operations.
� The bridge scenario proves that session management traffic does not flow over the bridges.
12 Finished stopping servers: ['BI_Web01'].
17:22:36
13 Sleeping for 120 seconds. 17:22:36
14 Stopping servers: ['BI_Web02']. 17:24:36 Momentary increase in response time +100 msec
Less impactNote momentary I/O increase on Web and EJB clusters
15 Finished stopping servers: ['BI_Web02'].
17:25:03
16 Sleeping for 120 seconds. 17:25:03
17 Starting servers: ['BI_Web01', 'BI_Web02'].BI_Web01 becomes the active preferred coordinator!
17:27:03 Momentary increase in response time +100 msec
Less impactNote momentary I/O increase on Web and EJB clusters
18 Finished starting servers. 17:28:23
19 Sleeping for 240 seconds. 17:28:23
20 Stopping servers: ['WebCluster01_srv01', 'WebCluster02_srv02', 'EjbCluster01_srv01', 'EjbCluster02_srv02'].Failing over to remaining members!
17:32:23 Momentary increase in response time +100 msec
Less impactNote momentary I/O increase on Web and EJB clusters
21 Finished stopping servers. 17:33:25
22 Sleeping for 120 seconds. 17:33:25
23 Starting servers: ['WebCluster01_srv01', 'WebCluster02_srv02', 'EjbCluster01_srv01', 'EjbCluster02_srv02'].
17:35:25 Momentary increase in response time +500 msec
Less impactNote momentary I/O increase on Web and EJB clusters
24 Finished starting servers. 17:40:13
Step Operation Time Impact on clients Impact on servers
296 Techniques for Managing Large WebSphere Installations

11.5.5 Scenario2-Bridge cross topology
Test Scenario2-Bridge cross involves the following (see Table 11-16):
� Two core groups bridged.
� Application traffic does flow over the bridges - that is, RMI/IIOP calls from the Web clusters to EJB clusters do flow over the bridge members.
� Bulletin board is in use.
Table 11-16 Scenario2-Bridge cross overview
Figure 11-16 on page 298 depicts the correlation of JMeter test clients aggregated response times and server CPU utilization.
Topology parameter Value
Core groups 2
Core group membersApp servers under loadOP cluster servers (2x5)Node agentsHA coordinators
80601064
Session management On
HA manager On
Chapter 11. Large installation scenarios 297

Figure 11-16 Scenario2-Bridge cross: 80 members in two core groups with application traffic over bridge members
Scenario2-Bridge cross: 80 members in 2 core groups bridged, with apps across
Star
tOP
clus
ter 1
Sta
rtO
P cl
uste
r 2
Stop
OP
clus
ters
1&2
Star
t ser
vers
BI_
Web
01,0
2
Stop
4se
rver
s
Sta
rt4
serv
ers
Sto
p Se
rver
BI_
Web
_01
Sto
p se
rver
BI_
Web
02
298 Techniques for Managing Large WebSphere Installations

The top graph in Table 11-16 on page 297 is an aggregated client response time report. It graphs the response time averages in milliseconds from all the clients. The Y axis shows response time in milliseconds; the X axis shows the actual time. Ideally, the line should always be flat. However, whenever core group activity or administration activity occurs, client response times go up.
The lower two graphs show server CPU utilization and disk and network I/O utilization. One graph is for the x445, and the other is for the x3950. The Y axis shows CPU utilization, while the X axis shows the actual time. The dark line represents server CPU utilization, and the lighter line is disk and network I/O utilization.
The vertical lines correlate the times between clients and servers - that is, they correlate client response times with a core group activity or an administrative function on the servers.
Table 11-17 depicts the correlation of cluster start and stop times with the impact on client response times and server CPU utilization.
Table 11-17 Server operations in Scenario2-Bridge cross: 80 servers in two core groups with application traffic over bridges
Step Operation Time Impact on clients Impact on servers
1 Sleeping for 120 seconds. 18:29:48
2 Starting clusters: ['OpCluster1']. 18:31:48 No impact Momentary increase in CPU utilization up to 75%
3 Finished starting clusters: ['OpCluster1']. 18:34:19
4 Sleeping for 120 seconds. 18:34:19
5 Starting clusters: ['OpCluster2']. 18:36:19 No impact No impact
6 Finished starting clusters: ['OpCluster2']. 18:39:13
7 Sleeping for 120 seconds. 18:39:13
8 Stopping clusters: ['OpCluster1', 'OpCluster2'].
18:41:13 No impact No impactNote momentary I/O increase on EJB clusters
9 Finished stopping clusters: ['OpCluster1', 'OpCluster2'].
18:43:00
10 Sleeping for 120 seconds. 18:43:00
11 Stopping servers: ['BI_Web01'].BI_Web02 becomes the active preferred coordinator!
18:45:00 Momentary increase in response time +200 msec
Momentary increase in CPU utilization up to 60%
Chapter 11. Large installation scenarios 299

ConclusionThe Scenario2-Bridge cross topology (running 80 servers tuned in two core groups with application traffic over the bridges) had a significant impact on client response times and on server CPU utilization when executing core group modifications:
� Starting and stopping a bridge interface has a significant impact on performance within the core group and impacts traffic that passes between
12 Finished stopping servers: ['BI_Web01']. 18:45:25
13 Sleeping for 120 seconds. 18:45:25
14 Stopping servers: ['BI_Web02']. 18:47:25 Momentary increase in response time +200 msec
Momentary increase in CPU utilization up to 60%
15 Finished stopping servers: ['BI_Web02']. 18:47:50
16 Sleeping for 120 seconds. 18:47:50
17 Starting servers: ['BI_Web01', 'BI_Web02'].BI_Web01 becomes the active preferred coordinator!
18:49:50 Momentary increase in response time +700 msec
Problem: momentary increase in CPU utilization up to 95%
18 Finished starting servers. 18:51:11
19 Sleeping for 240 seconds. 18:51:11
20 Stopping servers: ['WebCluster01_srv01', 'WebCluster02_srv02', 'EjbCluster01_srv01', 'EjbCluster02_srv02'].Failing over to remaining members!
18:55:11 Momentary increase in response time +200 msec
Momentary increase in CPU utilization up to 75%Note momentary I/O increase on EJB clusters
21 Finished stopping servers. 18:56:07
22 Sleeping for 120 seconds. 18:56:07
23 Starting servers: ['WebCluster01_srv01', 'WebCluster02_srv02', 'EjbCluster01_srv01', 'EjbCluster02_srv02'].
18:58:07 Problem: steady increase in response time +1000 msec
Momentary increase in CPU utilization up to 80%Note steady increase in I/O on both Web and EJB clusters
24 Finished starting servers. 19:02:29
Step Operation Time Impact on clients Impact on servers
300 Techniques for Managing Large WebSphere Installations

core groups. Configuring smaller core groups and assigning coordinators may address this issue. Configure core groups to minimize the application traffic that crosses core group bridges.
� You should use this configuration with care and minimize bridge interface disruptions.
Refer to 6.3.4, “Intra-cell bridging topology” on page 94 for additional information about intra-cell bridging.
11.6 Scenario 3 topology
Scenario 3 topology is based on four or more core groups interconnected in mesh and chain core group topologies.
Scenario 3 topology consists of
� Four core groups hosted on a single box, plus one core group for the operations core group.
� One physical server box, hosting four nodes.
� Each node hosts two bridge interfaces.
� Bridge interfaces are connected in a mesh or chain topology.
� Each physical box hosts two clusters, each spanning two nodes.
� Each cluster hosts one application spanning tens of application servers.
� Cluster 1 hosts the Web application; cluster 2 hosts the EJB application.
Note: Server CPU utilization over 90% over an extended period of time probably distorts the testing data.
Chapter 11. Large installation scenarios 301

11.6.1 Scenario 3 topology tests planning
Table 11-18 Building scenarios from simple to complex using four core groups
11.6.2 Scenario3-Mesh topology
The Scenario3-Mesh test topology consists of 48 servers in four core groups using a mesh topology.
The input parameters we used for Scenario 3 are documented in Appendix A, “Additional material” on page 315 in the \itso-sa-w704-r01\topologies\scenario 3\ directory.
Scenario name Topology Test name Configuration Recommended
Scenario 3: three or more core groups Mesh Scenario3-
Mesh48 membersCore group bridging connected in mesh
Yes
Chain Scenario3-Chain
48 membersCore group bridging connected in chain
Yes
302 Techniques for Managing Large WebSphere Installations

Scenario 3 topology setupFigure 11-17 depicts the mesh topology interconnecting four core groups.
Figure 11-17 Scenario 3 topology: four core groups in mesh topology
NA
NA ASASAS
…
ASASAS
…
NANA
NANA
Core Group 2
Core Group 4
ASASAS
…
ASASAS
…ASASAS
…
ASASAS
…
ASASAS
…
ASASAS
…ASASAS
…
ASASAS
…
NANA
Core Group 1
ASASAS
…
ASASAS
…ASASAS
…
ASASAS
…
NANA
Core Group 3
ASASAS
…
ASASAS
…ASASAS
…
ASASAS
…
CGAP2 BIBI
CGAP4BI BI
APG1
CGAP1 BIBI
CGAP3BI BI
Op Core
Group
BI
CG
AP
5
BI
Web AppCluster
EJBCluster
Web AppCluster
EJBCluster
EJBCluster
Web AppCluster
Web AppCluster
EJBCluster
RMI over IIOP
RMI over IIOP
RMIoverIIOP
RMIoverIIOP
Chapter 11. Large installation scenarios 303

The two core groups topology 2 consists of (see Table 11-19):
� Machine x445 with all core groups configured
– Five core groups
– Each core group spanning two nodes
– Each cluster spanning two nodes
– Each node hosting one bridge server
Table 11-19 Scenario3-Mesh overview
Topology parameter Value
Core groups 4+1
Core group membersApp servers under loadOP cluster servers (2x5)Node agentsHA coordinators
12 per core group4x8 per core group1010, 2 per core group10, 2 per core group
Session management ON
HA manager ON
304 Techniques for Managing Large WebSphere Installations

Figure 11-18 depicts the correlating of JMeter test clients aggregated response times and server CPU utilization.
Figure 11-18 Scenario3-Mesh: 48 members in four core groups
Scenario3-Mesh: 48 members tuned in four mesh core groups
Star
tOP
clus
ter 1
Star
tOP
clus
ter 2
Stop
OP
clus
ters
1&2
Sta
rt se
rver
sBI_
Cg1
01, 3
02
Sto
p 8
serv
ers
Sta
rt8
serv
ers
Stop
Ser
ver B
I_C
g101
Sto
p se
rver
BI_
Cg3
02
Chapter 11. Large installation scenarios 305

The top graph in Figure 11-18 on page 305 is an aggregated client response time report. It graphs the response time averages in milliseconds from all the clients. The Y axis shows response time in milliseconds; the X axis shows the actual time. Ideally, the line should always be flat. However, whenever core group activity or administration activity occurs, client response times go up.
The bottom graph shows x445 server CPU utilization and disk and network I/O utilization. The Y axis shows CPU utilization, while the X axis shows the actual time. The dark line represents server CPU utilization, and the lighter line is disk and network I/O utilization.
The vertical lines correlate the times between clients and servers - that is, the lines correlate client response times with a core group activity or an administrative function on the servers.
Table 11-20 correlates the start and stop times of clusters with the impact on client response times and server CPU utilization.
Table 11-20 Server operations while running Scenario3-Mesh: 48 servers in four core groups
Step Operation Time Impact on clients Impact on servers
1 Sleeping for 120 seconds. 9:19:04
2 Starting clusters: ['OpCluster1']. 9:21:04 No impact No impact
3 Finished starting clusters: ['OpCluster1'].
9:23:37
4 Sleeping for 120 seconds. 9:23:37
5 Starting clusters: ['OpCluster2']. 9:25:37 No impact No impact
6 Finished starting clusters: ['OpCluster2'].
9:28:19
7 Sleeping for 120 seconds. 9:28:19
8 Stopping clusters: ['OpCluster1', 'OpCluster2'].
9:30:19 No impact No impact
9 Sleeping for 120 seconds. 9:43:02
10 Finished stopping clusters: ['OpCluster1', 'OpCluster2'].
9:43:02
11 Sleeping for 120 seconds. 9:45:26
12 Stopping servers: ['BI_Cg101']. 9:45:02 Momentary increase in response time +100 msec
Momentary increase in CPU utilization +10%
13 Finished stopping servers: ['BI_Cg101'].
9:45:26
306 Techniques for Managing Large WebSphere Installations

ConclusionAs a result of our tests of the Scenario3-Mesh topology, we recommend it: Running 48 servers tuned in four mesh core groups has no impact on client response times and little impact on server CPU utilization when executing core group modifications:
� “Small mesh” is always a recommended scenario.
� Note that the mesh topology cannot scale indefinitely.
14 Stopping servers: ['BI_Cg302']. 9:47:26 Momentary increase in response time +100 msec
Momentary increase in CPU utilization +10%
15 Finished stopping servers: ['BI_Cg302'].
9:47:49
16 Sleeping for 120 seconds. 9:47:49
17 Starting servers: ['BI_Cg101', 'BI_Cg302'].
9:49:49 No impact Momentary increase in CPU utilization +10%
18 Finished starting servers. 9:51:07
19 Sleeping for 240 seconds. 9:51:07
20 Stopping servers: ['WebCluster01_srv01', 'WebCluster02_srv02', 'WebCluster03_srv03', 'WebCluster04_srv04', 'EjbCluster01_srv01', 'EjbCluster02_srv02', 'EjbCluster03_srv03', 'EjbCluster04_srv04'].Failing over to remaining members!
09:55:07 Momentary increase in response time +100 msec
Momentary increase in CPU utilization +10%
21 Finished stopping servers. 10:01:00
22 Sleeping for 120 seconds. 10:01:00
23 Starting Servers: ['WebCluster01_srv01', 'WebCluster02_srv02', 'WebCluster03_srv03', 'WebCluster04_srv04', 'EjbCluster01_srv01', 'EjbCluster02_srv02', 'EjbCluster03_srv03', 'EjbCluster04_srv04'].
10:03:00 Momentary increase in response time +500 msec
Momentary increase in CPU utilization +10%
24 Finished starting servers. 10:16:28
Step Operation Time Impact on clients Impact on servers
Chapter 11. Large installation scenarios 307

Refer to 7.4, “Recommendations for intra-cell core group bridging” on page 120 for additional material on intra-cell core group bridging.
11.6.3 Scenario3-Chain topology
The Scenario3-Chain topology consists of 48 servers in four core groups using chaining.
Figure 11-19 depicts the chain topology interconnecting four core groups.
Figure 11-19 Scenario 3 topology: four core groups in chain topology
Tip: Our tests of the Scenario3-Mesh topology proved that distributing the start and stop members properly into batches and adding at least two minutes for the overall topology to recover from core group modifications significantly improves the performance on both client and server sides.
NANA
NANA
Core Group 2
Core Group 4
ASASAS
…
ASASAS
…ASASAS
…
ASASAS
…
ASASAS
…
ASASAS
…ASASAS
…
ASASAS
…
NANA
Core Group 1
ASASAS
…
ASASAS
…ASASAS
…
ASASAS
…
NANA
Core Group 3
ASASAS
…
ASASAS
…ASASAS
…
ASASAS
…
CGAP2 BIBICGAP1 BIBI
CGAP4BI BI CGAP3BI BI
APG12
APG34
APG23APG41
NA
NA ASASAS
…
ASASAS
…
Op Core
Group
BI
CG
AP
5
BI
Web AppCluster
EJBCluster
Web AppCluster
EJBCluster
EJBCluster
Web AppCluster
Web AppCluster
EJBCluster
RMI over IIOP
RMI over IIOP
RMIoverIIOP
RMIoverIIOP
308 Techniques for Managing Large WebSphere Installations

Table 11-21 provides an overview of the Scenario3-Chain topology.
Table 11-21 Scenario3-Chain overview
Figure 11-20 on page 310 depicts the correlation of JMeter test client aggregated response times and server CPU utilization.
Topology parameter Value
Core groups 4
Core group membersApp servers under loadOP cluster servers (2x5)Node agentsHA coordinators
12 per core group4x8 per core group1010, 2 per core group10, 2 per core group
Session management On
HA manager On
Chapter 11. Large installation scenarios 309

Figure 11-20 Scenario3-Chain: 48 members in four core groups using chain topology
Scenario3-Mesh: 48 members in four chain core groups
Star
tOP
clus
ter 1
Sta
rtO
P c
lust
er 2
Sto
p O
P c
lust
ers
1&2
Sta
rt se
rver
sBI_
Cg1
01, 3
02
Sto
p 8
serv
ers
Star
t8se
rver
s
Stop
Ser
ver B
I_C
g101
Stop
ser
ver B
I_C
g302
310 Techniques for Managing Large WebSphere Installations

The top graph in Figure 11-20 on page 310 is an aggregated client response time report. It graphs the response time averages in milliseconds from all the clients. The Y axis shows response time in milliseconds, the X axis shows the actual time. Ideally, the line should always be flat. However, whenever core group activity or administration activity occurs, client response times go up.
The bottom graph shows x445 server CPU utilization and disk and network I/O utilization. The Y axis shows CPU utilization, while the X axis shows the actual time. The dark line represents server CPU utilization, and the lighter line is disk and network I/O utilization.
The vertical lines correlate the times between clients and servers - that is, correlate the client response times with a core group activity or an administrative function on the servers.
Table 11-22 correlates cluster start and stop times with the impact on the client response times and the server CPU utilization.
Table 11-22 Server operations in running Scenario3-Chain: 48 servers in four core groups in chain topology
Step Operation Time Impact on clients Impact on servers
1 Sleeping for 120 seconds. 17:48:17
2 Starting clusters: ['OpCluster1']. 17:50:17 No impact Momentary increase in CPU utilization +10%
3 Finished starting clusters: ['OpCluster1']. 17:52:33
4 Sleeping for 120 seconds. 17:52:33
5 Starting clusters: ['OpCluster2']. 17:54:33 No impact No impact
6 Finished starting clusters: ['OpCluster2']. 17:59:52
7 Sleeping for 120 seconds. 17:59:52
8 Stopping clusters: ['OpCluster1', 'OpCluster2'].
18:01:52 No impact No impact
9 Finished stopping clusters: ['OpCluster1', 'OpCluster2'].
18:03:45
10 Sleeping for 120 seconds. 18:03:45
11 Stopping servers: ['BI_Cg101']. 18:05:45 No impact Less impact
12 Finished stopping servers: ['BI_Cg101']. 18:06:15
13 Sleeping for 120 seconds. 18:06:15
14 Stopping servers: ['BI_Cg302']. 18:06:15 No impact No impact
15 Finished stopping servers: ['BI_Cg302']. 18:08:39
16 Sleeping for 120 seconds. 18:08:39
Chapter 11. Large installation scenarios 311

ConclusionAs a result of our tests of the Scenario3-Chain topology, we recommend it: Running 48 servers tuned in four chain core groups has no impact on client response times and almost no impact on server CPU utilization when executing core group modifications.
See 7.4.3, “Bridging topologies” on page 121 for more information about bridge topologies.
17 Starting servers: ['BI_Cg101', 'BI_Cg302'].
18:10:39 No impact No impact
18 Finished starting servers. 18:11:50
19 Sleeping for 240 seconds. 18:11:50
20 Stopping servers: ['WebCluster01_srv01', 'WebCluster02_srv02', 'WebCluster03_srv03', 'WebCluster04_srv04', 'EjbCluster01_srv01', 'EjbCluster02_srv02', 'EjbCluster03_srv03', 'EjbCluster04_srv04'].Failing over to remaining members!
18:15:50 No impact Momentary increase in CPU utilization +10%
21 Finished stopping servers. 18:17:40
22 Sleeping for 120 seconds. 18:17:54
23 Starting servers: ['WebCluster01_srv01', 'WebCluster02_srv02', 'WebCluster03_srv03', 'WebCluster04_srv04', 'EjbCluster01_srv01', 'EjbCluster02_srv02', 'EjbCluster03_srv03', 'EjbCluster04_srv04'].
18:19:54 Momentary increase in response time +200 msec
No impact on CPU butsignificant increase of I/O utilization up to 95%
24 Finished starting servers. 18:28:51
Step Operation Time Impact on clients Impact on servers
Tip: Comparing the mesh and chain topologies, the chain core groups topology outperforms the mesh core groups topology by an insignificant amount of server CPU utilization.
312 Techniques for Managing Large WebSphere Installations

Part 5 Appendixes
Part 5
© Copyright IBM Corp. 2008. All rights reserved. 313

314 Techniques for Managing Large WebSphere Installations

Appendix A. Additional material
Various chapters in this book refer to additional material that can be downloaded from the Internet as described in this appendix. This additional material consists of the scripting project that we used to set up all our test scenarios as well as a small program that helps to analyze JMeter result files.
Refer to “Structure of the project” on page 211 for a detailed description of the objects included in this additional material.
Locating the Web material
The Web material associated with this book is available in softcopy on the Internet from the IBM Redbooks Web server. Point your Web browser at:
ftp://www.redbooks.ibm.com/redbooks/SG247536
Alternatively, you can go to the IBM Redbooks Web site at:
ibm.com/redbooks
Select the Additional materials and open the directory that corresponds with the IBM Redbooks form number, SG24-7536.
A
© Copyright IBM Corp. 2008. All rights reserved. 315

Using the Web material
The additional Web material that accompanies this book includes the following files:
File name DescriptionAddmat.zip Zipped scripts, batch command files, applications
Expanding the Addmat.zip file results in the following directories being created on your system:
File name Descriptionitso-sa-w704-r01 Contains multiple directories with scripts, batch command
files, and sample applicationsjmeter-analyzer JMeter application and filesreadme.txt
316 Techniques for Managing Large WebSphere Installations

Glossary
A
application server The primary runtime component in all configurations. Applications actually execute on the application server. All WebSphere Application Server configurations can have one or more application servers. In the WebSphere Application Server - Express configuration and in the base configuration, each application server functions as a separate entity. There is no workload distribution or central administration among application servers. With WebSphere Application Server Network Deployment, you can build a distributed server environment consisting of multiple application servers maintained from a central administration point. In a distributed server environment, you can cluster application servers for workload distribution.
C
cell A grouping of nodes in a single administrative domain. In the base configuration and the WebSphere Application Server - Express configuration, a cell contains one node, and that node contains one application server. In a distributed server configuration, a cell can consist of multiple nodes, which are all administered from a single point (the Deployment Manager). The configuration and application files for all nodes in the cell are centralized in a master configuration repository. This centralized repository is managed by the Deployment Manager and synchronized with local copies that are held on each of the nodes.It is possible to have a cell comprised of nodes on mixed platforms. This is referred to as a heterogeneous cell.
© Copyright IBM Corp. 2008. All rights reserved.
cluster A set of application servers that are managed together and participate in Workload Management. Application servers participating in a cluster can be on the same node or on different nodes. A Network Deployment cell can contain no clusters or have many clusters depending on the need of the administration of the cell. The cluster is a logical representation of the application servers. It is not necessarily associated with any node and does not correspond to any real server process running on any node. A cluster contains only application servers and the weighted workload capacity associated with those servers.
core group A high availability domain within a cell. It serves as a physical grouping of JVMs in a cell that are candidates to host singleton services. It can contain standalone servers, cluster members, node agents, or the Deployment Manager. Each of these run in a separate JVM.
core group coordinator Members of core group elected to be responsible for managing the high availability groups within a core group
D
Deployment Manager Provides a single, central point of administrative control for all elements in a cell. It hosts the Web-based administration console application. It is a special type of server that manages operations for a cell. It is an administration application that runs in a special application server, which is created when you install WebSphere Application Server Network Deployment or when you create a new profile using the Deployment Manager profile template. With the Deployment Manager, you can administer multiple WebSphere Application Server nodes.
317

H
high availability manager (HA manager) A service within each WebSphere Application Server process (Deployment Manager, node agents, or application servers) that monitors the health of WebSphere singleton services. In the event of a server failure, the HA manager will failover any singleton service that was running on the failed server to a peer server.
J
JFAP The proprietary formats and protocols that are used to communicate between messaging engines, and between clients and messaging engines.
N
node A grouping of application servers for configuration and operational management on one machine. Nodes usually correspond to a logical or physical computer system with a distinct IP host address. It is possible to have multiple nodes on a single machine, but nodes cannot span machines. A standalone application server environment contains only one node. With Network Deployment, you can configure multiple nodes in a distributed server environment that are managed from one central administration server.
node agent An administrative agent that manages all application servers on a node and works with the Deployment Manager to represent the node in the management cell.
S
Session Initiation Protocol (SIP) A signaling protocol creating, modifying, and terminating sessions with one or more participants (Internet conferencing, telephony, presence, events notification, and instant messaging).
U
unified clustering framework Communicates routing information between the Session Initiation Protocol (SIP) container and the SIP proxy. Using unified clustering framework, the SIP proxy routes messages to the least-loaded SIP container or to a container that is taking over sessions for a failed server.
318 Techniques for Managing Large WebSphere Installations

acronyms
AIX Advanced Interactive eXecutive
APAR authorized program analysis report
APG access point group
API application programming interface
AST Application Server Toolkit
BB bulletin board
BI bridge interface
CA certificate authority
CG core groups
CGAP core group access point
CGBS core group bridge service
CIP customized installation package
CPU central processing unit
CSV comma separated values
CVS Concurrent Versions System
DB database
DCS distribution and consistency services
DNS Domain Name System
DRS Data Replication Services
EJB Enterprise JavaBeans
FFDC first-failure data capture
FIFO first-in-first-out
GC garbage collection
GCS group communications system
HA High Availability
HAM High Availability manager
HTTP Hypertext Transfer Protocol
I/O input/output
IBM International Business Machines Corporation
ID identifier
IIOP Internet Inter-ORB Protocol
Abbreviations and
© Copyright IBM Corp. 2008. All rights reserved.
IIP Integrated Installation Package
IOR interoperable object reference
IP Internet Protocol
ISC Integrated Solutions Console
IT information technology
ITSO International Technical Support Organization
JCA J2EE Connector Architecture
JMS Java Message Service
JMX Java Management Extensions
JNDI Java Naming and Directory Interface™
JSP JavaServer™ Pages™
JVM Java Virtual Machine
KB kilobyte
LAN local area network
LDAP Lightweight Directory Access Protocol
LSD location service daemon
LTPA Lightweight Third Party Authentication
MB megabyte
ME messaging engine
ND network deployment
ODC on demand configuration
PAP peer access point
PMG Partitioned Managed Group
PMI Performance Monitoring Infrastructure
RFC Request for Comments
RMI Remote Method Invocation
RMI-IIOP RMI over Internet InterORB Protocol
RMM Reliable Multicast Messaging
SAP® Security Attribute Propagation
SCA Service Component Architecture
SIP Session Initiation Protocol
319

SOA service-oriented architecture
SSL Secure Sockets Layer
SSO single sign-on
TAI Trust Association Interceptor
TCP Transmission Control Protocol
TCP/IP Transmission Control Protocol/Internet Protocol
URL Uniform Resource Locator
WAN wide area network
WCCM WebSphere Common Configuration Model
WLM Workload Management
WPF WebSphere Partitioning Facility
XML Extensible Markup Language
320 Techniques for Managing Large WebSphere Installations

Related publications
The publications listed in this section are considered particularly suitable for a more detailed discussion of the topics covered in this book.
IBM Redbooks
For information about ordering these publications, see “How to get Redbooks” on page 322. Note that some of the documents referenced here may be available in softcopy only.
� Linux Performance and Tuning Guidelines, REDP-4285
� Optimizing Operations with WebSphere Extended Deployment V6.1, SG24-7422WebSphere Application Server V6 Migration Guide, SG24-6369
� Tuning Red Hat Enterprise Linux on IBM eServer xSeries Servers, REDP-3861
� WebSphere Application Server Network Deployment V6: High Availability Solutions, SG24-6688
� WebSphere Application Server V6 Scalability and Performance Handbook, SG24-6392
� WebSphere Application Server V6.1: System Management and Configuration, SG24-7304
� WebSphere Application Server V6.1: Technical Overview, REDP-4191
Online resources
These Web sites are also relevant as further information sources:
� Alternate Jython plugin for Eclipse
http://www.redrobinsoftware.net
� Apache JMeter
http://jakarta.apache.org/jmeter
© Copyright IBM Corp. 2008. All rights reserved. 321

� Automate peer recovery for transactions and messages in WebSphere Application Server V6.0.x
http://www.ibm.com/developerworks/websphere/techjournal/0509_lee/0509_lee.html
� Best Practices for Large WebSphere Topologies, A Quarterly Report from the WebSphere Large Topology Task Force
http://www.ibm.com/developerworks/websphere/library/techarticles/0710_largetopologies/0710_largetopologies.html
� Jython User-Guide
http://www.jython.org/Project/userguide.html
� Network Time Protocol
http://www.ntp.org
� nmon overview and usage
http://www.ibm.com/collaboration/wiki/display/WikiPtype/nmon
� Reliable Distributed Systems: Technologies, Web Services, and Applications, Kenneth P. Birman:
http://www.cs.cornell.edu/ken/book/
� WebSphere Application Server library
http://www.ibm.com/software/webservers/appserv/was/library/
� WebSphere Application Server ND V6.1 scripting
http://publib.boulder.ibm.com/infocenter/wasinfo/v6r1/index.jsp?topic=/com.ibm.websphere.nd.doc/info/ae/ae/welc6topscripting.html
� WebSphere Application Server V6.1 Information Center
http://publib.boulder.ibm.com/infocenter/wasinfo/v6r1/index.jsp
� WebSphere example scripts
http://www.ibm.com/developerworks/websphere/library/samples/SampleScripts.html
How to get Redbooks
You can search for, view, or download Redbooks, Redpapers, Technotes, draft publications and Additional materials, as well as order hardcopy Redbooks, at this Web site:
ibm.com/redbooks
322 Techniques for Managing Large WebSphere Installations

Help from IBM
IBM Support and downloads
ibm.com/support
IBM Global Services
ibm.com/services
Related publications 323

324 Techniques for Managing Large WebSphere Installations

Index
Aaccess point group 52, 95, 98, 100, 102, 124, 126
bridge server communication 237creating 191mesh topology 96
access point, custom property 128active coordinator 35, 39, 70, 88, 98
messages identifying 40multiple 114See also HA coordinator
active heartbeat 29, 71, 108core group tuning and 265
adjustPort( ) method 222AdminConfig.getid command 194AdminConsole See Integrated Solutions Consoleadministrative process 22agent framework 14, 16Apache Geronimo 9Apache HTTP Server 9Apache JMeter See JMeterApache Tomcat 9application deployment 198–202
onto clusters 270options 199–202
application edition management 8Application Server Toolkit (AST) 203–205,
240–243Jython 203runtime problems and 240See also Log and Trace Analyzer; Log Adapter
application serversapplications, number of 66number per node 64
applicationsdeploying See application deploymentnumber per application servers 66tool for developing 240
ARM (automatic restart manager) 76AST See Application Server Toolkitasymmetric connected condition 229authentication
proxy servers performing 133security and 130–132
© Copyright IBM Corp. 2008. All rights reserved.
authorization 132automatic restart manager (ARM) 76autonomic managers 8
Bbatch workload 6BEA WebLogic Server 9BeenThere application 257, 273BindJndiForEJBNonMessageBinding option (set-
up-apps.py) 202, 214bridge interface 51, 95, 98, 100, 104
access points and 122bridge server, creating 178bridging
inter-cell 56, 101, 103recommendations 124–128
intra-cell 46, 94chain 99mesh 53, 97, 121recommendations 120–123
node agent 120peer access point 125peer communication 125proxy peer communication 126
bridging topologies 121bulletin board 14–15, 94, 101
CGBS and 46users 19
CCA (certificate authority) 133cell 3, 46–47, 56, 61–63, 67, 74–75
core group members in 22core groups 21
number of 66well-formed 23
maximum number of applications in 2nonpartitioned 80, 86partitioned 80, 88, 90See also cell size
cell member, firewall between 46, 116cell size 61, 83
design considerations 67
325

limits on 62topology selection and 84
centralized installation manager 9certificate authority (CA) 133CGAP See Core Group Access PointCGB_ENABLE_602_FEATURES custom property
127CGBS See Core Group Bridge Servicechain topology 56, 73, 96, 99, 121
advantages and disadvantages 56closed chain and open chain 96
channel framework 25, 32checkConfig 145CIP See custom installation packageclosed chain topology 96cluster
creating 178deploying applications onto 270
cluster membercreating 179startup failure 229
Clustered ME Policy 37Clustered TM Policy 37Common Base Events 240, 243–246
best practices 245generating 244
compute-intensive workload 6ConfigParser class 210configuration
core group bridging 72core groups 70peer access point 238security 238troubleshooting 222Web server plugin 184
configuration management 73, 177configuration See also tuningcore group 21–43, 70
administrative process 22communication 23–35communication messages 235configuring 70creating 181formation rules 22, 117member discovery/status 28migrating 136migration example 138–164multiple 116number per cell 66
protocol versions 119recommended settings 119scalability 71transport type 32troubleshooting 223–239tuning 116–119
core group access point 50, 95, 100, 104Core Group Bridge Service (CGBS) 17, 46, 92, 94
chain topology 96configuring 190inter-cell bridging, custom properties 127intra-cell bridging, custom properties 122mesh topology 96security 128startup messages 234topologies 121troubleshooting 233–239
core group bridging 72configuring 193inter-cell 124–128intra-cell 120–123
core group coordinator 35, 138See also active coordinator
core groupsnumber of 70tuning 265
core stack 15CPU 7
starvation issue 232createCoreGroup 144creating
access point group 191bridge server 178cluster 178cluster member 179core group 181preferred coordinator 178virtual host alias 183
CtxRootForWebMod option (setup-apps.py) 201, 214
custom installation package (CIP) 169, 173custom properties
CGBS 122, 127core group 112, 114–115, 123DCS memory buffer 111IBM_CS_WIRE_FORMAT_VERSION 185
Custom Property overrides 138
326 Techniques for Managing Large WebSphere Installations

DData Replication Service (DRS) 17, 69, 84, 92, 111,
230dynacache 18high availability and 14HTTP session replication 18stateful session bean failover 18
data stacks 15DCS congestion messages 111
HA manager memory buffers 230transport buffer size 112
DCS PMI counters 112DCS See distribution and consistency servicesDefaultCoreGroup 136deployment management 270Deployment Manager 74
cell structure 63core group administrative process 22master repository 73in partitioned cell 89
disabling HA manager 42discovery protocol 26–29, 69, 107
core group tuning and 265messages 28, 224resource consumption 34
DistributedMap (HA manager) 84distribution and consistency services (DCS) 22, 24,
26doubly linked chain topology See chain topologyDRS See Data Replication Servicedynacache 18, 69, 84dynamic application placement 8dynamic operations 7
EEJB Workload Management 20EJBs (Enterprise JavaBeans) 84ephemeral ports 27
Ffailover
bridging 72stateful session bean 69
failure detection protocol 26, 29–31, 69, 107messages 30, 224recommended settings 109resource consumption 34
FFDC See first-failure data capture
firewall 71between cell members 46, 116
first-failure data capture (FFDC) 223bridge servers 239security configuration issues 238SystemOut logs 223
FW_PASSIVE_MEMBER custom property 128
Ggarbage collection 232GCS See group communications systemgreen mark (messaging queue) 231group communications system (GCS) 21, 25, 67
HHA coordinator 35–42
active coordinator 70multiple 114
messages 228preferred coordinator 40tuning 113–116
HA group 14, 16, 38managing 37
HA group users 18HA manager 13–20
active coordinator 70agent framework 14bulletin board 14components 15
state data exchange 15configuring 184–194disabling 42enabling or disabling 42, 90, 187HA group 14layers 24
DCS 24RMM 25virtual synchrony 25
memory buffers 69congestion 230tuning 111–113
partitioned managed group 14protocols 26–31, 69, 107
discovery protocol 26–29failure detection protocol 29–31messages 224–227recommendations 109view synchrony protocol 31
Index 327

scalability and 69services that use 91troubleshooting 223–239tuning 106–116usage 16verifying proper operation 225
health management 8heap size 51, 66, 113, 115, 123, 146, 148, 152–153
bridge interface 121garbage collection and 232node agent 144preferred coordinator selection and 40
heartbeat See active heartbeathigh availability manager See HA managerHTTP plugin 271HTTP servers 9HTTP session replication 18, 67, 69, 84HTTP, through proxy server 19
IIBM Tivoli Composite Application Manager (ITCAM)
251IBM Tivoli Provisioning Manager 175IBM_CS_DATASTACK_MEG custom property
111, 114, 146, 150, 232, 265IBM_CS_FD_CONSECUTIVE_MISSED custom
property 30, 108, 115, 265IBM_CS_FD_PERIOD_SECS custom property 30,
108, 114, 265IBM_CS_LS_DATASTACK_MEG custom proper-
ty 122IBM_CS_SOCKET_BUFFER_SIZE custom proper-
ty 112, 115, 265IBM_CS_THREAD_SCHED_DETECT_ERROR
custom property 233IBM_CS_THREAD_SCHED_DETECT_PERIOD
custom property 233IBM_CS_UNICAST_DISCOVERY_INTERVAL cus-
tom property 29, 107, 115, 265IBM_CS_WIRE_FORMAT_VERSION 146, 150,
185IBM_CS_WIRE_FORMAT_VERSION custom prop-
erty 112, 114, 119, 123, 265ifcli utility (Installation Factory) 173IIP See integrated installation packageIncomingMessageSize 112Installation Factory 169, 173integrated installation package (IIP) 169, 171–174
Integrated Solutions Console (ISC) 42, 177script development 206when to use 177
inter-cell bridging 56, 72, 80, 101, 103, 124–129configuration 124custom properties 127recommendations 124–128
interoperable object reference (IOR) 49intra-cell bridging 46, 72, 80, 94, 120–123
chain topology 99configuration 120custom properties 122mesh topology 97
IOR (interoperable object reference) 49ISC See Integrated Solutions ConsoleITCAM (IBM Tivoli Composite Application Manager)
251
JJ2EE Connector Architecture (JCA) 84JACL See Java Application Control LanguageJacl2Jython 205Java 2 security 76, 130Java Application Control Language (JACL) 205
wsadmin 207Java Management Extensions (JMX) 73Java virtual machine (JVM) 13, 22JBoss 9JCA (J2EE Connector Architecture) 84JCA resource adapter 92JFAP 85, 95, 101, 318JMeter 252–256
collecting performance data 254evaluating performance 250setting up 253
clients 272JMX (Java Management Extensions) 74JSPReloadForWebMod option (setup-apps.py)
201, 214JVM (Java virtual machine) 13JVM thread-scheduling delays 232Jython 251
AST 203running test scenarios 250wsadmin 207
KKeepAlive setting, SSL and 133
328 Techniques for Managing Large WebSphere Installations

Llayers
DCS 24HA manager 24RMM 25virtual synchrony 25
life cycle support 9full 9generic 9
Lightweight Third Party Authentication (LTPA) 234security configuration 239
location service daemon 49Log Adapter 240Log and Trace Analyzer 240logging
analyzing log records 241collecting data 240Common Base Events 243importing log files 241
long-running workload 6LTPA See Lightweight Third Party Authentication
Mmanageprofiles command 173MapEJBRefToEJB option 201, 214MapModulesToServers option 200, 214, 216MapWebModToVH option 200, 214memory 7memory buffers 7, 69
congestion 230green, yellow, red marks 231
tuning 111–113mesh topology 53, 73, 96–97, 121
advantages/disadvantages 54messages
HA coordinator 228HA manager protocols 224–227
messaging engine 16, 18, 20, 37migration 136
core group example 138–164moveClusterToCoreGroup command 145moveServerToCoreGroup command 145multicast 32–33
Nnmon tool 258node 64node agent 87
as bridge 72, 120core group administrative process 22
nonpartitioned cell 80, 86
OObjectGrid 92ODC See on demand configurationODR See On Demand Routeron demand configuration (ODC) 14, 19, 46, 84, 92,
94On Demand Router (ODR) 7, 101One-of-N policy 14, 16, 18open chain topology 96operating system, tuning 266operational management 74operations optimization feature 6options, application deployment 199–202OutGoingMessageSize 112
PParallel Sysplex 76partitioned cell 80, 88partitioned managed group (PMG) 14, 16partitioning facility 92peer access point 101, 104
as bridge 125configuring 238
peer communication 125performance
core groups and 116CPU starvation 232DCS congestion 111evaluating 250
tools for 251–258fix packs 130JMeter data collection 254memory buffers and 230security and 130
PHP server 9ports
ephemeral 27managing 222number of 26
preferred coordinator 40, 87, 89, 93, 98configuring 189creating 178
problem analysisCommon Base Events 243
Index 329

runtime problems 240tools 240–246
See also Application Server Toolkitprofile
creating 268managing 175removing 176setting up 175
profile management tool 171, 173protocols
discovery protocol 26–29failure detection protocol 26, 29–31HA manager 26–31, 69, 107view synchrony protocol 26, 31
proxy peer access point 57, 125proxy peer communication 126proxy server
authentication and 133HTTP through 19
Qquality of service (QoS) 71, 80
RRational Performance Tester 251red mark (messaging queue) 231Redbooks Web site 322
contacting xvReliable Multicast Messaging (RMM) 24, 42, 111,
115, 231congestion issues and 231
resource consumption, HA manager protocols 34Resource Recovery Services (RRS) 76resources, failure detection protocol and 108ripple restart 110RMM See Reliable Multicast Messagingrouting data 71RRS (Resource Recovery Services) 76
SSCA See Service Component Architecturescalability
core group tuning 265core groups and 71, 116, 119
scriptingproject 209–220when to use 177
searchJNDIReferences( ) 208Secure Sockets Layer (SSL) 76, 133security 130–133
attribute propagation 133authentication and 130–132CGBS 128components of 76configuring 238fix packs 130inter-cell bridging 239Java 2 and 76, 130performance and 130
server topology 267Service Component Architecture (SCA) 84
HA manager and 92WebSphere Process Server and 20
Session Initiation Protocol (SIP) 19, 84single sign-on (SSO) 128SIP See Session Initiation Protocolsockets, number of 26SSL See Secure Sockets LayerSSO (single sign-on) 128StackOverflow error 222state data exchange See bulletin boardstateful session bean failover 18, 69, 84svrId command 195symptom database 242system management components 129SystemOut log 223
CGBS startup 234messages
discovery protocol 28, 224failure detection protocol 30view synchrony protocol 32
security configuration 238
TTCP_KEEP_ALIVE setting 115
failure detection protocol and 109thread-scheduling delays 232Tivoli Composite Application Manager 251Tivoli Provisioning Manager 175topologies
bridging 73, 121CGBS 121chain 96, 99closed chain 96doubly linked chain 73
330 Techniques for Managing Large WebSphere Installations

evaluatingwith BeenThere 257performance of 250testing scenarios 260–264
inter-cell bridging 72, 80, 101, 103intra-cell bridging 72, 80, 94managing 269mesh 96–97nonpartitioned cell 80, 86open chain 96partitioned cell 80, 88selecting 83
topologychain 56mesh 54
traffic shaping 8transaction log recovery 19transaction manager 37transport buffer size, core group tuning 265transport type 32TransportBufferSize custom property 115, 232
core group tuning 265modifying 187
troubleshooting 221–246CGBS 233–239configuration issues 222core groups 223–239HA manager 223–239runtime problems 240See also problem analysis
tuningcore groups 116–119, 265discovery protocol 107failure detection protocol 108HA coordinator 113–116HA manager 106–116memory buffers 111–113operating system 266view synchrony protocol 109
Uunicast 32unified clustering framework 84, 92updateAccessIDs( ) 208
Vview synchrony protocol 26, 31, 69, 107
messages 32, 224
resource consumption 34tuning 109
virtual host alias, creating 183virtual synchrony 25virtually synchronous messaging 21
WWCCM (WebSphere Common Configuration Model)
73Web server plugin configuring 184WebSphere administrative script launcher 204WebSphere Application Server
configuration management 73operational management 74
WebSphere Application Server administrative script launcher 204
WebSphere Application Server Toolkit 203WebSphere Common Configuration Model (WCCM)
73WebSphere Extended Deployment 5, 20, 47
HA manager and 92inter-cell bridging topology 56, 101intra-cell bridging topology 95topology selection 84
WebSphere partitioning facility 84WebSphere Process Server 20WLM See Workload Managerworkload 7Workload Manager (WLM) 14, 19, 46, 76, 94wsadmin program 177, 207
Java support 207scripts, predefined objects 208WebSphere administrative script launcher and 204
Yyellow mark (messaging queue) 231
Index 331

332 Techniques for Managing Large WebSphere Installations

333
(0.5” spine)0.475”<
->0.875”
250 <->
459 pages
Techniques for M
anaging Large W
ebSphere Installations


®
SG24-7536-00 ISBN 0738485713
INTERNATIONAL TECHNICALSUPPORTORGANIZATION
BUILDING TECHNICALINFORMATION BASED ONPRACTICAL EXPERIENCE
IBM Redbooks are developed by the IBM International Technical Support Organization. Experts from IBM, Customers and Partners from around the world create timely technical information based on realistic scenarios. Specific recommendations are provided to help you implement IT solutions more effectively in your environment.
For more information:ibm.com/redbooks
®
Techniques for Managing LargeWebSphere InstallationsHigh availability manager and core groups
Tuning recommendations
Configuration best practices
As WebSphere Application Server installations grow to accommodate the growth of business processing, the question “How large can a WebSphere Application Server cell be?” is being asked more often. This IBM Redbook discusses large WebSphere Application Server installations, and as you will see, the answer to the question is not straightforward. Numerous variables play a part in supporting or constraining the size of a WebSphere environment. These variables are most likely different in each WebSphere Application Server installation, resulting in a different answer for each environment.
This Redbook discusses large WebSphere Application Server topologies, focusing specifically on best practices when planning and configuring the high availability manager, core groups, and core group bridging. A review of high availability, core groups, and core group bridging features is followed by extensive coverage of planning, designing, and implementing a large cell migration. The book then covers detailed scenarios of configuring single and multiple core group topologies.
In addition, the scripts, applications, and batch files used to set up and test the scenarios are included as additional material that can be downloaded and modified as required for your environment.
This Redbook is intended for WebSphere Application Server administrators and planners who are considering migrating their small to midsize installations to larger topologies.
Back cover