Embed Size (px)
Citation preview

NASA Technical Memorandum 4521
Techniques To Improve Maneuver StabilityCharacteristics of a Nonlinear Wide-BodyTransport Airplane in Cruise Flight
William D. Grantham, Lee H. Person, Jr., Melvin L. Bailey, and Stephen A. Tingas
March 1994

NASA Technical Memorandum 4521
Techniques To Improve Maneuver StabilityCharacteristics of a Nonlinear Wide-BodyTransport Airplane in Cruise FlightWilliam D. Grantham and Lee H. Person, Jr.Langley Research Center � Hampton, Virginia
Melvin L. BaileyLockheed Engineering & Sciences Company � Hampton, Virginia
Stephen A. TingasLockheed Aeronautical Systems Company � Marietta, Georgia
National Aeronautics and Space AdministrationLangley Research Center � Hampton, Virginia 23681-0001
March 1994

National Aeronautics andSpace AdministrationCode JTTWashington, D.C.20546-0001
Official BusinessPenalty for Private Use, $300
B U L K R A T E
POSTAGE & FEES PAIDNASA Permit No. G-27
Postmaster: If undeliverable (Section 158 Postal Manual) Do Not Return

Summary
NASA, the Federal Aviation Administration, andthe Lockheed Corporation performed a cooperative ight simulation experiment in the six-degree-of-freedom, ground-based, Langley Visual/Motion Sim-ulator (VMS). An objective of the study was to pro-vide engineering guidance for acceptable nonlinearmaneuver stability characteristics for transport air-craft. The baseline mathematical model of the air-plane represented a wide-body jet transport with apitch active control system (PACS). The PACS isa simulation of an experimental pitch-rate damperthat is installed on a single Lockheed L-1011 air-craft used for in- ight research. The PACS providedacceptable ying qualities for negative static mar-gins to 5 percent. As the aircraft center of gravitymoved aft and the static margin changed from posi-tive to negative, the maneuver stability characteris-tics were modi�ed through systematic variations ofPACS, pitch-rate damper gain, control loading (col-umn force per column de ection (Fc=�c)), and controlgearing (horizontal-tail de ection per control force(�H=�c)). The evaluation tasks consisted of perform-ing (l) small pitch-attitude changes, (2) standard op-erational turns, and (3) wind-up turns at an altitudeof 33 000 ft at a Mach number of 0.83, and in calm at-mospheric conditions. Nonlinear maneuver stabilityis de�ned as a nonincremental change in stick forcerequired to e�ect an incremental change in normalacceleration.
The results of this experiment verify current mil-itary speci�cation boundaries for linear maneuverstability characteristics. Also for linear maneuverstability cases, a degradation in pilot ratings at ex-treme values of column force per normal accelera-tion (Fc=nz) was evident for all tasks performed withthe statically unstable con�gurations. However, stat-ically stable con�gurations appeared to be degradedonly in high-load-factor tasks (i.e., wind-up turns).The maneuver stability was made linear by eitheradjusting Fc=�c or �H=�c. The results indicate thatvariations in �H=�c, as opposed to Fc=�c, to maintainlinear Fc=nz provide improved ying qualities in theupper Fc=nz range, but provide no advantage in thelower range. However, these two parameters are def-initely coupled; that is, an acceptable range of �H=�cat a �xed value of Fc=�c may not be acceptable atanother value of Fc=�c.
The results indicate that for the nonlinear ma-neuver stability cases evaluated, substantial levels ofnonlinearity are acceptable to the pilots as long asactual column force at selected load factors remainswithin the current military speci�cations for level 1(satisfactory) extremes (23.3 lbf/g and 80 lbf/g). Pi-
lot ratings were acquired for Fc=nz variations with asingle break at nz = 1:333g or 1.667g and with aninitial slope of 50 lbf/g. As expected, pilots preferredan increase, not a reduction, in the slope of high loadfactors when the break occurred at nz = 1:333g.Slope reduction was more noticeable to the pilotsthan slope increase. A comparison of the two meth-ods used to control the maneuver stability character-istics shows little di�erence in the break at 1.333g.However, with the break at 1.667g, pilots preferreda �xed �H=�c, with variable Fc=�c, particularly forhigher Fc=nz slopes. This comparison provides in-sight into a possible means of linearizing the maneu-ver stability characteristics of a control system withinherent nonlinearities.
Introduction
The longitudinal maneuver control force gradi-ent in an aircraft is a critical parameter of y-ing qualities that ensures structural protection aswell as adequate prediction of load-factor controlfor the pilot. Currently, maneuver stability ightcharacteristics are not uniquely addressed in FederalAviation Regulations (FAR) Part 25 for transportaircraft (ref. 1). In previous transport category cer-ti�cation programs, the Federal Aviation Adminis-tration (FAA) used a combination of requirements(longitudinal control, vibration and bu�eting, high-speed characteristics, and out-of-trim characteris-tics) to ensure safe and controllable maneuver sta-bility characteristics over a range of ight conditionsand aircraft con�gurations. These regulations arecontroversial and require a considerable amount oftime for design studies and tests (ref. 2). Addi-tional engineering guidance is needed to identify ac-ceptable nonlinear maneuver stability characteristics,particularly for relaxed stability, highly augmentedtransport con�gurations. The current trend in largeaircraft design, such as the Airbus A320 (ref. 3), istoward relaxed, or even negative, static margins forimproved fuel e�ciency. Advanced ight control sys-tems developed for these aircraft, in many instances,have rendered current maneuver stability criteriaeither too stringent or of little practical use.
Swept-wing high-subsonic aircraft are prone toexhibiting nonlinear maneuver stability character-istics at higher load factors. Figure 1 shows theamount of column force (Fc) required by the sim-ulated aircraft to command increases in normal ac-celeration (nz). The upper limit of linear maneu-ver stability military speci�cation (80 lbf/nz) is alsoshown in the �gure.
The research proceeded as follows. First, thenonlinear Fc=nz was made linear by two methods.

Second, pilot opinions for each of the two meth-ods were recorded and compared with the militarystandard. Third, a break in the slope of the linearFc=nz characteristics was introduced and the opinionof the pilot of several initial and �nal slope pairs wererecorded. Finally, a few cases with two slope breaksin the linear Fc=nz characteristics were evaluated bythe pilots.
An objective of this study was to evaluate a broadspectrum of linear and nonlinear longitudinal stabil-ity characteristics to generate data for de�ning sat-isfactory and unacceptable maneuver characteristicsas de�ned by the opinions of the pilots. This studywas a joint venture of NASA, the Federal AviationAdministration, and Lockheed Corporation with fourpilots participating: one from NASA, one from theFAA, and two from Lockheed.
Symbols
Measurements and calculations were made in U.S.Customary Units, and all calculations are based onairplane body axes.
�c mean aerodynamic chord, ft
c.g. airplane center of gravity, ft
Fc column force, lbf
Fc;max maximum column force, lbf
Fc;min minimum column force, lbf
g acceleration due to gravity,
1g = 32.17 ft/sec2
KFF feedforward gain
Kq pitch-rate damper gain
M Mach number
nz normal acceleration, g units
q pitch rate, deg/sec
SM static margin, percent
s Laplace transform operator
�c column de ection, in.
�c;MTC column de ection due to Mach trimcompensation, in.
�c;PACS column de ection (software only)due to pitch active control system,in.
�c;p column de ection due to pilot forceinput, in.
�c;trim column de ection due to pilot trimbeeper input, in.
�col software stick position, in.
�col;trim column de ection due to total trimand pilot force, in.
�H horizontal-tail de ection, deg
� time constant, sec
�lag pitch damper lag, sec
� bank angle, deg
Abbreviations:
AACS aileron active control system
CHR Cooper-Harper ratings
FAA Federal Aviation Administration
FAR Federal Aviation Regulations
IMC instrument meteorology conditions
PACS pitch active control system
PIO pilot-induced oscillation
SAS stability augmentation system
VMS Visual/Motion Simulator
Description of Simulated Airplane
The Lockheed L-1011 airplane with extendedwing span is a current generation, subsonic, commer-cial transport airplane (�g. 2). The airplane is pow-ered by three Rolls-Royce 211-225 high-bypass-ratioturbofan engines and has a ying stabilizer with ageared elevator. During these simulations the aileronactive control system (AACS) was inoperative. Air-plane geometry and weight data are presented intable I.
The simulated L-1011 airplane uses a ying sta-bilizer for longitudinal control, inboard and out-board ailerons and spoilers for lateral control, anda rudder for directional control. The basic lon-gitudinal control system includes a servoactuator,cable stretch, and position- and rate-limiter model-ing. The lateral control system also includes a servo-actuator and position-limiter modeling. Only spoilerpanels 2 and 4 to 6 were modeled for lateral con-trol (�g. 2(b)). Spoiler panel 1 is for ground use andspoiler panel 3 is operated only with AACS, whichwas not used for this study. The directional controlsystem determines manual and stability augmenta-tion system (SAS) contributions to rudder position.The directional SAS consists of a yaw damper and a
2

wheel-driven aileron and rudder interconnection forimproved turn coordination.
For this study, servoactuator and rate- andposition-limiter modeling were also used. The pitchactive control system (PACS) provided acceptable ying qualities for negative static margins to 5 per-cent. The maneuver stability characteristics of thesimulated aircraft were nonlinear (�g. 1). For thisstudy, the column force per normal acceleration wasmade linear by one of two di�erent methods: a non-linear control loading with constant stick to tail gear-ing or a nonlinear tail gearing with constant stickforce per inch control loading.
Description of Simulation Equipment
This study was made in the general-purpose cock-pit of the Langley Visual/Motion Simulator (VMS),a ground-based six-degree-of-freedom motion simula-tor. For this study, the VMS had a transport-typecockpit equipped with conventional ight and engine-thrust controls and a ight-instrument display repre-sentative of the control panel found in current trans-port airplanes. (See �g. 3.) Instruments that indicateangle of attack, sideslip angle, ap angle, horizontal-stabilizer angle, and column force were also provided.A digital normal acceleration indicator was locatedon the instrument panel adjacent to the control col-umn force meter, and a digital Mach meter was pro-vided on an extended instrument panel above theconventional panel.
The control forces on the wheel, column, and rud-der pedals were provided by a hydraulic system cou-pled with an analog computer. The system allowedfor the usual characteristics of sti�ness, damping,coulomb friction, breakout forces, detents, and in-ertia. No visual cues from outside were required forthis study; therefore, evaluations were conducted un-der instrument meteorology conditions (IMC).
The average motion delay of the VMS, includ-ing computational time, is less than 70 msec. Thewashout system used to present motion-cue com-mands to the motion base is nonstandard and wasconceived and developed at Langley (ref. 4). Thewashout system continuously adapts to parameterchanges to (1) minimize a cost functional throughcontinuous steepest descent method and (2) producemotion cues for translational accelerations and rota-tional rates within the motion envelope of the syner-gistic base.
Aural cues included engine noise and a tone thatbeeped intermittently at 1.5g and increased to a solidtone at 2.0g. This tone signaled g units in wind-upturns.
Tests and Procedures
To generate data for acceptable maneuver char-acteristics, this study evaluated a broad spectrum oflinear and nonlinear longitudinal control characteris-tics that are unique to nonlinear, swept-wing, high-subsonic, jet transport aircraft. The objective wasto develop a database for acceptable maneuver sta-bility characteristics for FAR Part 25 (regulations onengineering guidance). Various maneuver stabilitycharacteristics were de�ned by a mathematical modelof an L-1011 aircraft for the piloted tests (ref. 5).Only a nominal, cruise ight condition was consid-ered (Weight = 360 000 lbf, Altitude = 31 000 ft,M = 0.83). The basic maneuver stability (Fc=nz)characteristics were systematically varied by (1) mov-ing the aircraft center of gravity (c.g.) location,(2) changing the pitch-rate feedback multiplier gain(Kq) of the near-term PACS (�g. 4 and ref. 2),(3) changing the Fc=�c, and (4) changing the �H=�c.The basic longitudinal control system is describedin reference 2. When Fc=�c was varied, �H=�c wasset to a constant �1:0�/in. Conversely, when �H=�cwas varied, Fc=�c was set to a constant 15.77 lbf/in.These conditions allowed Fc=nz to be varied as shownin �gure 5 instead of following the baseline nonlinearschedule shown in �gure 1. A digital normal acceler-ation indicator was located on the instrument paneladjacent to a control column force meter to verify thelinearity of Fc=nz.
Seven aircraft c.g. locations were simulated,which represented static margins from approximately33 percent (c.g. = 0:12�c) to �5 percent (c.g. =0:50�c). Factors that were considered in the selec-tion of maneuver stability characteristics are indi-cated in �gure 5. The con�gurations evaluated areindicated in table II. Although 176 con�gurations areindicated in the table, con�gurations 22 through 27and 46 through 51 were not evaluated. All con�gu-rations were not evaluated by all pilots. Table IIIsummarizes the con�gurations evaluated by eachpilot.
For each con�guration, the pilot completed thecomment card (�g. 6) by assigning a Cooper-Harperrating (CHR) to each maneuver (ref. 6 and �g. 7) andby commenting on the tendency toward pilot-inducedoscillation (PIO). The pilot was asked to perform andevaluate the following four primary tasks:
1. Trimmability: Evaluate the ease or di�cultyto initially trim the aircraft and to recapturetrim from a disturbed condition.
2. Small pitch-attitude changes: Evaluate atti-tude stability when pitch attitude is changedand held with column force only.
3

3. Operational turns: Evaluate turn entry andexit characteristics when 30� to 40� bankedturns are performed at constant airspeed withcolumn force used to control attitude and al-titude. Airspeed should be maintained within5 knots, altitude should be maintained within100 ft, and a 30� banked turn should produce1.15g.
4. Wind-up turns: Evaluate maneuver force andstability characteristics during wind-up turns.This emergency maneuver is performed atmaximum power by rolling to a 60� bankedturn with a minimum of 2g and without losingaltitude or stalling the airplane.
Results and Discussion
Center of Gravity and Pitch-Rate
Damping
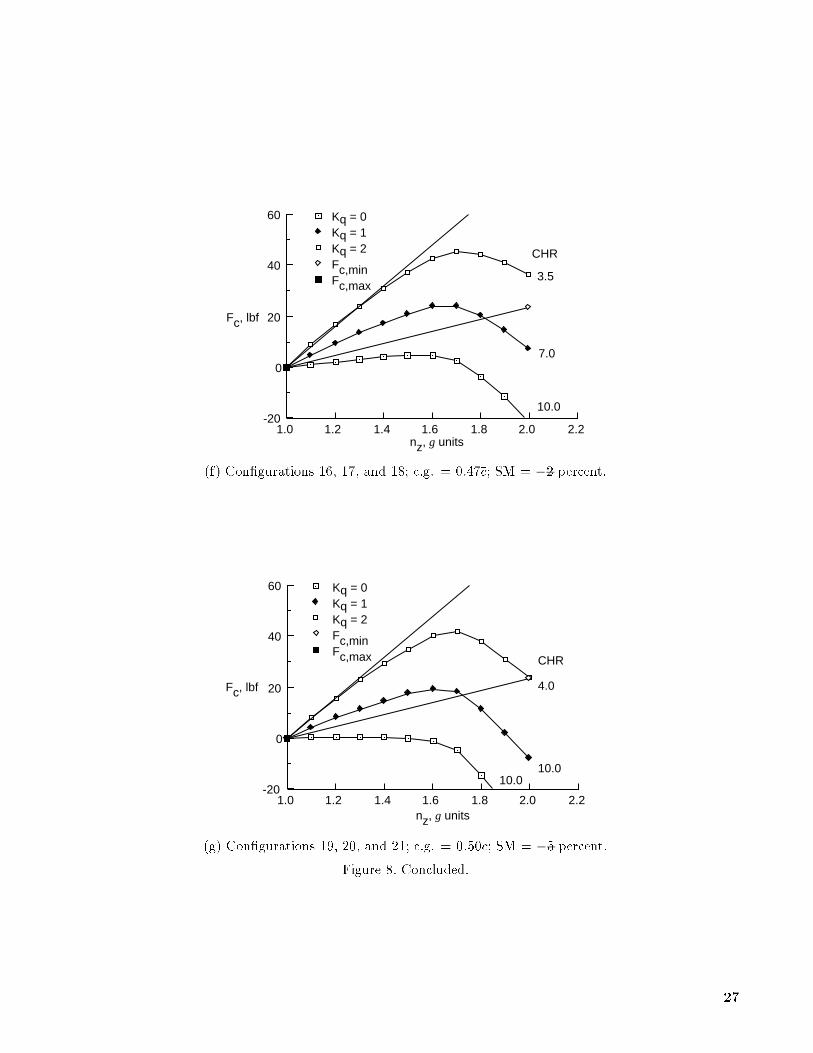
The �rst 21 con�gurations were evaluated to de-termine the e�ects of c.g. and pitch-rate damping onthe maneuver stability characteristics of the math-ematical model of the basic airplane. As expected,increasing pitch-rate damping increased Fc=nz, andmoving the c.g. aft decreased Fc=nz. (See �g. 8.)The evaluation of these 21 con�gurations for pilot 1is also indicated in �gure 8. The average ratings ofall pilots who ew the con�gurations are given in ta-ble II. These results indicate that when pitch-ratedamping was high, pilot 1 rated Fc=nz as accept-able (CHR < 6.5), although the maneuver stabilitywas nonlinear. Also, with Kq = 2, the Fc=nz wasrated within the satisfactory (CHR < 3.5) linear lim-its of references 7 and 8. However, to maintain level 1short-period damping ratio, Kq should be less than2 for c.g. locations forward of approximately 0:40�c(�g. 9). Also, maintaining Kq as high as possible isadvantageous for phugoid stability (�g. 10). There-fore, for con�gurations 28 through 176 (table II),all tests were performed at the highest possible Kq
for phugoid suppression while retaining level 1 short-period characteristics.
Linear Maneuver Stability
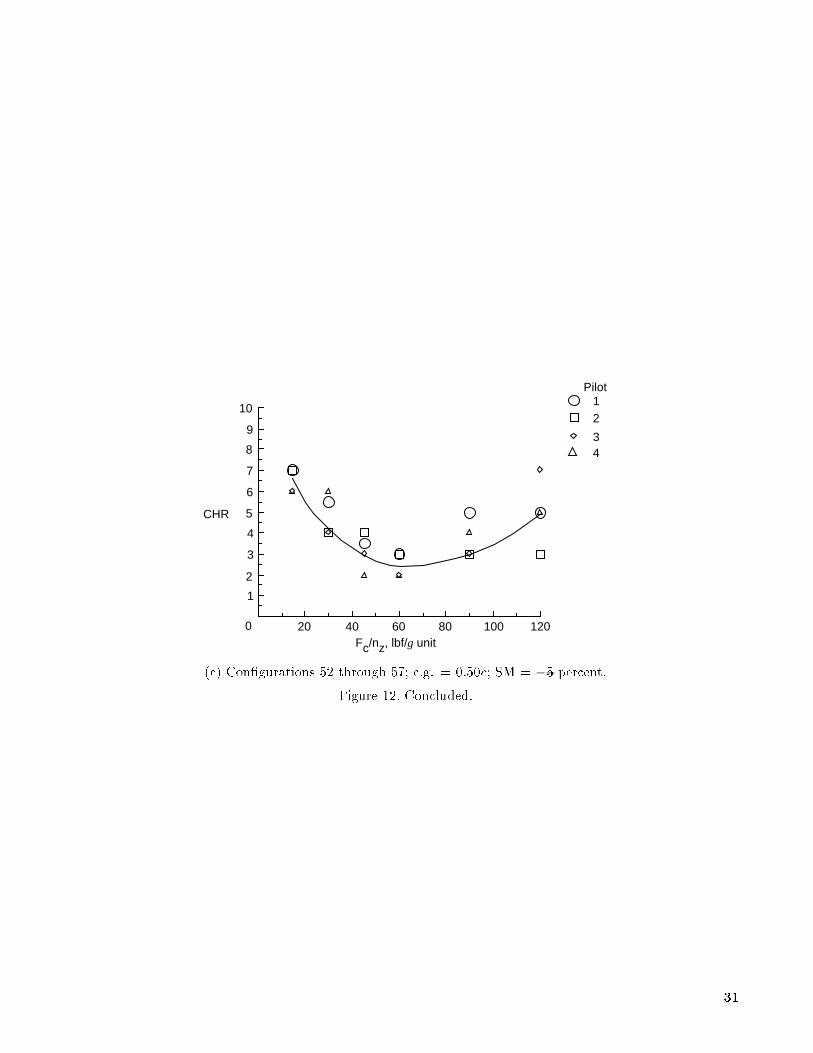
Before determining acceptable levels of nonlinearmaneuver stability, the validity of current militarylevel 1 boundaries for linear Fc=nz must �rst betested (refs. 7 and 8). (Boundaries for Fc=nz arethe same in refs. 7 and 8). For an L-1011 airplanewith a limit load factor of 2.5, these boundaries are23.3 lbf/g and 80.0 lbf/g. Figure 11 presents overallpilot ratings and associated trend curves for linearFc=nz obtained by varying Fc=�c with �H=�c con-stant. These overall ratings include all tasks per-formed by each pilot. (Pilot ratings of individual
tasks are presented subsequently in the discussion.)Figure 12 indicates overall pilot ratings for linearFc=nz obtained by varying �H=�c, with Fc=�c con-stant. For both the variable Fc=�c and �H=�c con-ditions, Kq, was set at 2.0 (highest tested value)for improved phugoid damping. The short-periodfrequency and damping characteristics were withinthe level 1 boundaries of reference 7. The trendcurves indicated in �gures 11 and 12 were visually�tted through the available data points. Becausedata for the highly stable con�gurations (c.g. forwardof 0:40�c) were limited, the analysis concentrated oncon�gurations with low static margins ranging from5 percent (c.g. = 0:40�c) to �5 percent (c.g. = 0:50�c).The PIO tendencies were evident primarily at lowmaneuver stability levels. Typical of these was con-�guration 34 with c.g. = 0:40�c and 15 lbf/g. This con-�guration evoked comments about PIO such as \Os-cillations tend to develop when pilot initiates abruptmaneuvers or attempts tight control."
The overall pilot ratings shown in �gures 11and 12 are replotted in �gure 13 for comparison oftechniques used to maintain linear maneuver stabil-ity. The level 1 maneuver stability boundaries of ref-erence 7 are also indicated in �gure 13. The twomethods used for varying Fc=nz and maintaining alinear slope show little di�erence in the lower Fc=nzrange for c.g. locations of 0:40�c and 0:45�c. (No con-clusions were drawn for the statically unstable con-�guration, c.g. = 0:50�c, because all available datafor the variable Fc=�c method were within level 1boundaries of ref. 7.) However, the pilots seemedto be more sensitive to variations in Fc=�c than tovariations in �H=�c in the upper Fc=nz range. Theimplication is that a design with inadequate maneu-ver stability characteristics can be improved morereadily through variations in Fc=�c than in �H=�c.However, these two parameters are de�nitely cou-pled. That is, an acceptable range of �H=�c at aspeci�c value of Fc=�c may not be acceptable at adi�erent value of Fc=�c.
The trend curves of �gure 13 also indicate an opti-mum linear maneuver stability level of approximately50 to 60 lbf/g for the subject con�guration. In addi-tion, a degradation of pilot ratings at extreme valuesof Fc=nz is indicated and is most severe as columnforces become lighter (i.e., reduction in Fc=nz fromoptimum of 50 to 60 lbf/g).
For each con�guration, the pilots rated individ-ual tasks such as operational turns (g < 1:5) andwind-up turns (g > 1:5) (�g. 6). Pilot ratingsfor operational turns and wind-up turns are pre-sented in �gure 14 for variable Fc=�c and in �gure 15for �H=�c con�gurations. Trend curves were �tted
4

visually through the data. Again, it appears thatdegradation in pilot ratings is more severe in lowerFc=nz regions particularly when the variable �H=�cmethod is used (�g. 15). The pilot comments also in-dicated a PIO tendency for low Fc=nz con�gurations.
For the small pitch-attitude changes and oper-ational turns using the variable (Fc=�c) method,the pilot ratings were consistently good for stat-ically stable (c.g. = 0:40�c) and neutrally stable(c.g. = 0:45�c) con�gurations (�g. 14). These con-�gurations were degraded by extreme Fc=nz levelsonly for high-load-factor pilot tasks (i.e., for wind-upturns). However, statically unstable con�gurations(c.g. = 0:50�c) appeared to be degraded at the ex-treme maneuver stability levels for all pilot tasks,including the small pitch-attitude changes and op-erational turns when the �H=�c method was used(�g. 15). The pilot ratings for small pitch-attitudechanges were the same as the ratings for operationalturns for the con�gurations in �gures 14 and 15.
Based on a maximum level 1 Cooper-Harperrating of 3.5, the level 1 boundaries suggested bythe results of the linear maneuver stability por-tion of this study are summarized in table IV.These results are based on both overall and in-dividual pilot task ratings indicated in �gures 13to 15. Although the limited results of this study pre-clude determination of suggested maneuver stabilityboundaries, for this particular aircraft, a shift of ap-proximately 10 lbf/g higher for values of Fc=nz forminimum and maximum level 1 maneuver stabilityboundaries found in references 7 and 8 appears to beappropriate.
Nonlinear Maneuver Stability
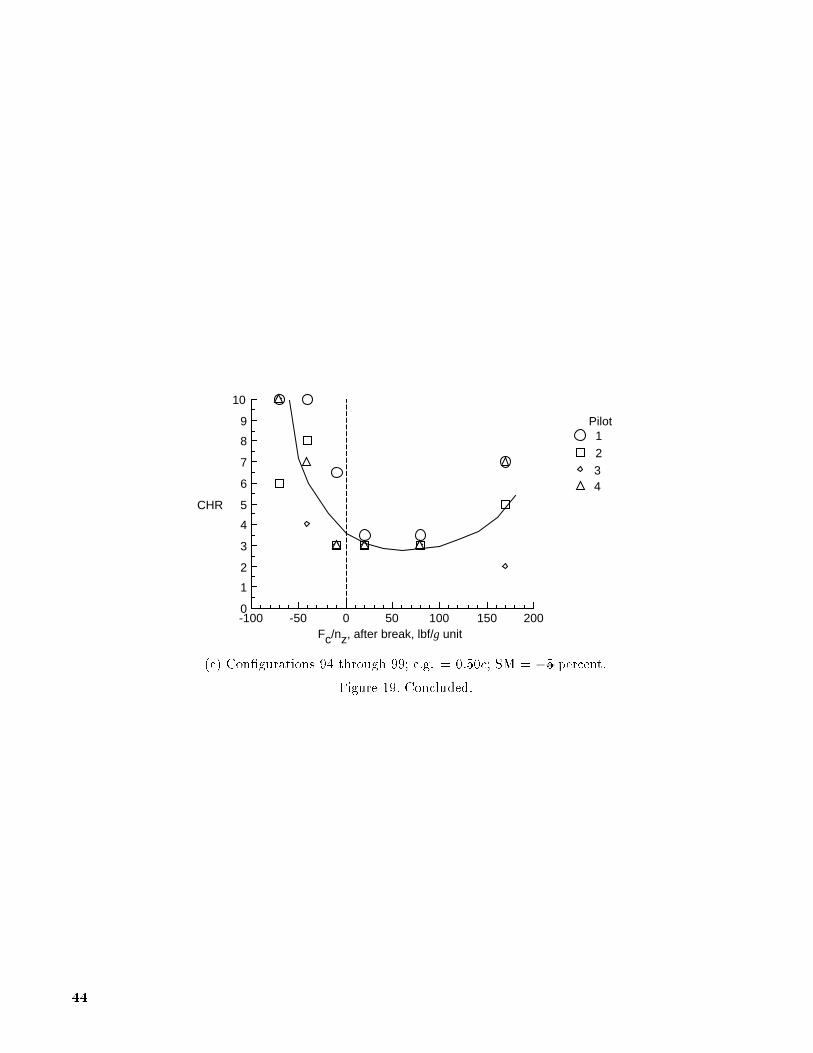
Although pilots prefer linear Fc=nz, providingsuch characteristics is sometimes di�cult because ofrelaxed static stability in transports with advancedcontrol systems. The degree of nonlinearity in ma-neuver stability characteristics acceptable to the pi-lots was evaluated during this study by parametricvariations of Fc=nz slope and are presented in �g-ures 16 and 17. Fc=nz variations with a single breakat nz = 1:333g or 1:667=g with an initial slope of50 lbf/g. This initial part of the slope falls in themidrange of acceptable values as speci�ed in refer-ence 7 for level 1 ying qualities. The slopes of Fc=nzwere controlled through either Fc=�c or �H=�c.
Figures 18 through 21 present pilot ratings forcon�gurations with a single break in the Fc=nz curvesat either nz = 1:667g or nz = 1:333g with the staticmargins ranging from 5 percent to �5 percent. Thetrend curves �tted through these data are replotted
and presented in �gure 22 for comparing the e�ectsof Fc=�c with �H=�c. These trend curves indicatethat the pilots preferred a linear Fc=nz variationfor low-load-factor tasks (optimum pilot ratings atapproximately 50 lbf/g, which implies no break),but they preferred a slight reduction in slope abovenz = 1:667g. For the con�guration with c.g. = 0:50�cand SM = �5 percent with variable �H=�c, the pilotspreferred a reduction in Fc=nz slope from 50 lbf/gto 30 lbf/g at nz = 1:667g. Also, with the break atnz = 1:333g, the pilots strongly preferred an increasein slope over a reduction in slope, as indicated bya more rapid increase in pilot ratings with reducedslope after the break. The e�ect of slope reductionwas much more noticeable to the pilots than the e�ectof slope increase, especially when the slope was nearzero or negative (�g. 5). However, with the breakat nz = 1:667g, the pilot rating curves were fairlysymmetrical about an optimum second slope value(�g. 28).
A comparison of the two methods used to mod-ify the maneuver stability characteristics (�g. 22)shows little di�erence at low Fc=nz values with thebreak at nz = 1:333g for all c.g. locations evalu-ated. When the break occurred at nz = 1:667g(�g. 22), the pilots had a slight preference for theFc=�c method for statically stable (c.g. = 0:40�c)and neutrally stable (c.g. = 0:45�c) con�gurations.However, for the statically unstable con�guration(c.g. = 0:50�c), the pilots had a strong preference forthe �H=�c method.
These results probably depend on the value se-lected for the �xed parameter (either �H=�c or Fc=�c)and only provide a single test point in what should bea more detailed analysis. However, this comparisonprovides insight into the proper means of lineariz-ing the maneuver stability characteristics of a controlsystem with inherent nonlinear maneuver stability.However, this study did not provide su�cient datato conclude which method is better.
In addition to the overall Cooper-Harper ratingsfor each con�guration, separate ratings were obtainedfor each task. Figures 23 through 26 present pilot rat-ings for con�gurations with static margins of 5 per-cent and �5 percent and a single break in the Fc=nzcurve for the operational turn (nz � 1:4g) and wind-up turn (nz � 2:0g) tasks. These are the same con-�gurations for which overall pilot ratings were pre-sented in �gures 18 through 21. Pilot ratings of thesmall pitch-attitude changes were consistently goodand, therefore, are not presented. This task did notexplore maneuver stability regions a�ected by thebreaks evaluated in this study. The data of �gures 23through 26 are replotted in �gure 27 for comparison.
5

Figure 27 indicates by favorable pilot ratingsfor the operational turns task with the break atnz = 1:667g that when the pilot evaluation taskoccurs in the linear portion of the maneuver stabil-ity curve, no degradation in ying qualities is de-tected. However, when the task called for maneuver-ing beyond the break point (in either direction), largechanges in maneuver stability resulted in poor pilotratings. Even large increases in maneuver stabilityfrom nz = 1:333g had little e�ect on pilot ratingsfor the operational turns with the statically unsta-ble con�guration (c.g. = 0:50�c). (The only augmen-tation for this simulated aircraft was an electronicpitch-rate damper.) With the task performed at amaximum load factor of 1:4g, column forces had notyet become unreasonably high; thus, maneuver sta-bility (Fc=nz) increases were still undetected. Thepilots were not seriously a�ected by large increasesin maneuvering stability at nz = 1:333g for any tasksperformed with the unstable (c.g. = 0:50�c) con�gu-ration. However, severe degradations in pilot ratingsare indicated with the statically stable (c.g. = 0:40�c)con�guration. Likewise, reductions in Fc=nz slopesat nz = 1:333g brought about large degradations inpilot ratings for both the stable and the unstablecon�guration.
The question arises as to whether the pilot rat-ing degradations due to abrupt changes in maneu-ver stability (Fc=nz slope) were actually caused bythe change in stability or by the fact that columnforces may be approaching unacceptable values, asindicated in �gures 16 and 17. Comments indicatedthat the pilots frequently did not detect a change incontrol characteristics at the actual break point, butrather as the column force approached establishedlevel 1 maneuver stability boundaries. For example,when the slope of Fc=nz at nz = 1:667g changedfrom 50 lbf/g to �40 lbf/g, degradation in ying qual-ities was detected as the column force approached thelower level 1 boundary (1.9g), instead of where theactual break occurred. (See �g. 16.) Pilot commentsfrequently suggested that the break occurred nearlevel 1 boundaries, not where the actual break oc-curred. Con�gurations that actually did have a breakin the Fc=nz curve, but did not cross level 1 bound-aries were typically rated as satisfactory. When theslope was �10 lbf/g after the break at nz = 1:667gis one example (�g. 16). A second example, with aslope of 80 lbf/g after the break produced commentssuch as \a little heavy but very yable."
Pilot ratings for double-break maneuver stabilityvariations (�g. 28 and con�gurations 152 through 170of table II) were acquired but were insu�cient fordetailed analysis. Initial pilot ratings indicated no
improvements over single-break con�gurations andfor the sake of brevity were limited to at least onepilot ying each con�guration.
Near the conclusion of this study, the primaryproject pilot was asked to design what he believedwould be the optimum maneuver stability curve forthis particular airplane. The result is presented in�gure 29, but because of insu�cient evaluations noanalysis was made of the Fc=nz characteristic. Thispilot opted for three distinct values for Fc=nz insteadof a constant value. He chose a nominal value of45 lbf/g, then a reduction of 40 percent to 27 lbf/gbetween nz = 1:15g (� � 30�) and 1.6g (� � 50�),and �nally an increase in Fc=nz to 65 lbf/g beyondnz = 1:6g.
Concluding Remarks
NASA, Federal Aviation Administration, andLockheed Corporation performed a cooperative ightsimulation experiment in the six-degree-of-freedom,ground-based Langley Visual/Motion Simulator(VMS). An objective of the study was to provideengineering guidance for acceptable nonlinear ma-neuver stability characteristics for transport aircraft.The baseline mathematical model of the airplanerepresented a wide-body jet transport with a pitch-active control system (PACS). The PACS providedacceptable ying qualities for negative static marginsto 5 percent. The maneuver stability characteristicswere modi�ed through systematic variations of PACSpitch-rate damper gain, aircraft center of gravity,control loading (column force per column de ection(Fc=�c)), and control gearing (horizontal-tail de ec-tion per control force (�H=�c)). The evaluation tasksconsisted of performing (1) pitch-attitude changes,(2) standard operational turns, and (3) wind-upturns, at a representative ight condition in calm at-mospheric conditions.
The current military speci�cations dictate mini-mum and maximum levels of maneuver stability (col-umn force per normal acceleration, Fc=nz) for level 1(satisfactory) ying qualities. These boundaries are23.3 lbf/g and 80.0 lbf/g, respectively, for the base-line airframe used in this study. The results of thisexperiment verify the speci�cation boundaries, withonly a slight possible shift toward higher (by approx-imately 10 lbf/g) column forces recommended for thistype of aircraft. However, the present speci�cationlevel 1 boundaries appear to be reasonable.
A degradation in pilot ratings at extreme valuesof Fc=nz was evident for all pilot tasks for staticallyunstable con�gurations evaluated. However, thestatically stable con�gurations appear to be degraded
6

only in high-load-factor pilot tasks (e.g., wind-upturns).
The maneuver stability was made linear by eitheradjusting Fc=�c or �H=�c. The results indicated thatvariations in �H=�c rather than Fc=�c, to maintainlinear Fc=nz provided improved longitudinal yingqualities in the upper Fc=nz range but providedno advantage in the lower range. However, thesetwo parameters are coupled; that is, an acceptablerange of �H=�c at a �xed value of Fc=�c may not beacceptable at another value of Fc=�c.
While this research was comprehensive, somecon�gurations were tested by only one or two pi-lots and these con�gurations may deserve furtherinvestigation.
NASA Langley Research CenterHampton, VA 23681-0001
December 15, 1993
References
1. Airworthiness Standards: Transport Category Airplanes.
FAR, Pt. 25, Federal Aviation Adm., June 1974.
2. Grantham, William D.; Person, Lee H., Jr.; Brown,
PhilipW.; Becker, Lawrence E.; Hunt, George E.; Rising,
J. J.; Davis, W. J.; Willey, C. S.; Weaver, W. A.;and Cokeley, R.: Handling Qualities of a Wide-Body
Transport AirplaneUtilizingPitch Active ControlSystems(PACS) for Relaxed Static Stability Application. NASA
TP-2482, 1985.
3. Jagger, Douglas H.: New Technology in the A320. AIAA-84-2444, Oct.{Nov. 1984.
4. Martin, D. J., Jr.: A Digital Program for MotionWashout
on Langley's Six-Degree-of-Freedom Motion Simulator.NASA CR-145219, 1977.
5. Grantham, William D.; Smith, Paul M.; Person,
Lee H., Jr.; Meyer, Robert T.; and Tingas, Stephen A.:Piloted Simulator Study of Allowable Time Delays in
Large-AirplaneResponse. NASA TP-2652, 1987.
6. Cooper, George E.; and Harper, Robert P., Jr.: The Useof Pilot Rating in the Evaluation of Aircraft Handling
Qualities. NASA TN D-5153, 1969.
7. Military Speci�cation|Flying Qualities of Piloted Air-planes. MIL-F-8785C,Nov. 5, 1980. (Supersedes MIL-F-
8785B, Aug. 7, 1969.)
8. Military Standard|Flying Qualities of Piloted Aircraft.MIL-STD-1797A, Jan. 30, 1990. (Supersedes MIL-STD-
1797(USAF), Mar. 31, 1987.)
7

Table I. Airplane Geometry and Weight Data
Wing:Reference area, ft2 . . . . . . . . . . . . . . . . . . . . . . . . . . . . . . . . . . . 3456
Reference mean aerodynamic chord, ft2 . . . . . . . . . . . . . . . . . . . . . . . . . . 24.46Span, ft . . . . . . . . . . . . . . . . . . . . . . . . . . . . . . . . . . . . . . . . 164.33Aspect ratio . . . . . . . . . . . . . . . . . . . . . . . . . . . . . . . . . . . . . . 7.817Leading-edge sweep, deg . . . . . . . . . . . . . . . . . . . . . . . . . . . . . . . . . . 35
Horizontal tail:Area, ft2 . . . . . . . . . . . . . . . . . . . . . . . . . . . . . . . . . . . . . . . . 1282Span, ft . . . . . . . . . . . . . . . . . . . . . . . . . . . . . . . . . . . . . . . . 71.58Aspect ratio . . . . . . . . . . . . . . . . . . . . . . . . . . . . . . . . . . . . . . . 4. 0Leading-edge sweep, deg . . . . . . . . . . . . . . . . . . . . . . . . . . . . . . . . . . 35
Vertical tail:Area, ft2 . . . . . . . . . . . . . . . . . . . . . . . . . . . . . . . . . . . . . . . . . 550Span, ft . . . . . . . . . . . . . . . . . . . . . . . . . . . . . . . . . . . . . . . . 2 9.67Aspect ratio . . . . . . . . . . . . . . . . . . . . . . . . . . . . . . . . . . . . . . . 1.6Leading-edge sweep, deg . . . . . . . . . . . . . . . . . . . . . . . . . . . . . . . . . . 35
Weight:Maximum ramp, lbf . . . . . . . . . . . . . . . . . . . . . . . . . . . . . . . . . . 424 000Maximum takeo�, lbf . . . . . . . . . . . . . . . . . . . . . . . . . . . . . . . . . 422 000Maximum landing, lbf . . . . . . . . . . . . . . . . . . . . . . . . . . . . . . . . . 358 000Cruise at 33 000 ft (M = 0:83), lbf . . . . . . . . . . . . . . . . . . . . . . . . . . . 360 000Zero fuel, lbf . . . . . . . . . . . . . . . . . . . . . . . . . . . . . . . . . . . . . 312 460Operating empty, lbf . . . . . . . . . . . . . . . . . . . . . . . . . . . . . . . . . 261 000
8

Table II. Average Evaluations of Con�gurations
First Second Second Third
Con�guration No. of break, slope, break, slope, Average
number c.g. SM Kq Fc=�c �H=�c Fc=nz breaks nz Fc=nz nz Fc=nz CHR
1 0.12 33 0 Fixed Fixed Basic 0 3.5
2 0.12 33 1 Fixed Fixed Basic 0 3.0
3 0.12 33 2 Fixed Fixed Basic 0 3.5
4 0.25 20 0 Fixed Fixed Basic 0 5.0
5 0.25 20 1 Fixed Fixed Basic 0 3.5
6 0.25 20 2 Fixed Fixed Basic 0 3.5
7 0.35 10 0 Fixed Fixed Basic 0 6.0
8 0.35 10 1 Fixed Fixed Basic 0 5.5
9 0.35 10 2 Fixed Fixed Basic 0 3.5
10 0.40 5 0 Fixed Fixed Basic 0 9.0
11 0.40 5 1 Fixed Fixed Basic 0 6.0
12 0.40 5 2 Fixed Fixed Basic 0 3.5
13 0.45 0 0 Fixed Fixed Basic 0 10.0
14 0.45 0 1 Fixed Fixed Basic 0 6.5
15 0.45 0 2 Fixed Fixed Basic 0 3.5
16 0.47 �2 0 Fixed Fixed Basic 0 10.0
17 0.47 �2 1 Fixed Fixed Basic 0 7.0
18 0.47 �2 2 Fixed Fixed Basic 0 4.0
19 0.50 �5 0 Fixed Fixed Basic 0 10.0
20 0.50 �5 1 Fixed Fixed Basic 0 10.0
21 0.50 �5 2 Fixed Fixed Basic 0 5.5
22 0.12 33 0 Fixed Variable 15 0
23??
??
??
??
?? 30
??
24??
??
??
??
?? 45
??
25??
??
??
??
?? 60
??
26??
??
??
??
?? 90
??
27
?y
?y
?y
?y
?y
120
?y
28 0.25 20 1 Fixed Variable 15 0 6.0
29??
??
??
??
?? 30
?? 3.5
30??
??
??
??
?? 45
?? 3.0
31??
??
??
??
?? 60
?? 3.0
32??
??
??
??
?? 90
?? 4.0
33
?y
?y
?y
?y
?y
120
?y
6.0
9

Table II. Continued
First Second Second Third
Con�guration No. of break, slope, break, slope, Average
number c.g. SM Kq Fc=�c �H=�c Fc=nz breaks nz Fc=nz nz Fc=nz CHR
34 0.40 5 2 Fixed Variable 15 0 6.0
35??
??
??
??
?? 30
?? 4.5
36??
??
??
??
?? 45
?? 3.0
37??
??
??
??
?? 60
?? 3.0
38??
??
??
??
?? 90
?? 3.5
39
?y
?y
?y
?y
?y
120
?y
4.0
40 0.45 0 2 Fixed Variable 15 0 5.0
41??
??
??
??
?? 30
?? 3.0
42??
??
??
??
?? 45
?? 2.5
43??
??
??
??
?? 60
?? 2.0
44??
??
??
??
?? 90
?? 3.0
45
?y
?y
?y
?y
?y
120
?y
4.0
46 0.47 �2 2 Fixed Variable 15 0 5.0
47??
??
??
??
?? 30
??
48??
??
??
??
?? 45
??
49??
??
??
??
?? 60
??
50??
??
??
??
?? 90
??
51
?y
?y
?y
?y
?y
120
?y
52 0.50 �5 2 Fixed Variable 15 0 6.5
53??
??
??
??
?? 30
?? 5.0
54??
??
??
??
?? 45
?? 3.5
55??
??
??
??
?? 60
?? 3.0
56??
??
??
??
?? 90
?? 4.0
57
?y
?y
?y
?y
?y
120
?y
5.0
58 0.12 33 0 Variable Fixed 30 0 9.0
59??
??
??
??
?? 45
?? 7.0
60??
??
??
??
?? 60
?? 7.0
61
?y
?y
?y
?y
?y
90
?y
7.0
62 0.25 20 1 Variable Fixed 30 0 3.0
63??
??
??
??
?? 45
?? 3.5
64??
??
??
??
?? 60
?? 3.5
65??
??
??
??
?? 90
?? 4.0
66
?y
?y
?y
?y
?y
120
?y
7.0
67 0.40 5 2 Variable Fixed 45 0 3.0
68??
??
??
??
?? 60
?? 3.0
69??
??
??
??
?? 90
?? 4.5
70
?y
?y
?y
?y
?y
120
?y
5.0
10

Table II. Continued
First Second Second Third
Con�guration No. of break, slope, break, slope, Average
number c.g. SM Kq Fc=�c �H=�c Fc=nz breaks nz Fc=nz nz Fc=nz CHR
71 0.45 0 2 Variable Fixed 30 0 3.5
72??
??
??
??
?? 45
?? 2.5
73??
??
??
??
?? 60
?? 3.0
74
?y
?y
?y
?y
?y
90
?y
4.0
75 0.47 �2 2 Variable Fixed 30 0 3.5
76??
??
??
??
?? 45
?? 3.0
77??
??
??
??
?? 60
?? 3.0
78
?y
?y
?y
?y
?y
90
?y
3.0
79 0.50 �5 2 Variable Fixed 30 0 3.0
80 0.50 �5 2 Variable Fixed 45 0 3.0
81 0.50 �5 2 Variable Fixed 60 0 4.5
82 0.40 5 2 Fixed Variable Variabley 1 1.667 �70 10.0
83??
??
??
??
??
??
??
??
�40 9.0
84??
??
??
??
??
??
??
??
�10 6.5
85??
??
??
??
??
??
??
?? 20 3.0
86??
??
??
??
??
??
??
?? 80 3.0
87
?y
?y
?y
?y
?y
?y
?y
?y
170 8.0
88 0.45 0 2 Fixed Variable Variable 1 1.667 �70 10.0
89??
??
??
??
??
??
??
??
�40 8.5
90??
??
??
??
??
??
??
??
�10 7.0
91??
??
??
??
??
??
??
?? 20 3.0
92??
??
??
??
??
??
??
?? 80 3.5
93
?y
?y
?y
?y
?y
?y
?y
?y
170 8.0
94 0.50 �5 2 Fixed Variable Variable 1 1.667 �70 10.0
95??
??
??
??
??
??
??
??
�40 8.5
96??
??
??
??
??
??
??
??
�10 4.0
97??
??
??
??
??
??
??
?? 20 3.0
98??
??
??
??
??
??
??
?? 80 3.0
99
?y
?y
?y
?y
?y
?y
?y
?y
170 6.5
100 0.40 5 2 Variable Fixed Variable 1 1.667 �40 8.0
101??
??
??
??
??
??
??
??
�10 4.0
102??
??
??
??
??
??
??
??
�20 3.0
103??
??
??
??
??
??
??
?? 80 3.0
104
?y
?y
?y
?y
?y
?y
?y
?y
170 5.0
yInitial slope 50 lbf/g.
11
Table II. Continued
First Second Second Third
Con�guration No. of break, slope, break, slope, Average
number c.g. SM Kq Fc=�c �H=�c Fc=nz breaks nz Fc=nz nz Fc=nz CHR
105 0.45 0 2 Variable Fixed Variable 1 1.667 �40 8.0
106??
??
??
??
??
??
??
??
�10 5.0
107??
??
??
??
??
??
??
??
�20 2.5
108??
??
??
??
??
??
??
?? 80 4.0
109
?y
?y
?y
?y
?y
?y
?y
?y
170 5.0
110 0.50 �5 2 Variable Fixed Variable 1 1.667 �70 9.5
111??
??
??
??
??
??
??
??
�40 7.0
112??
??
??
??
??
??
??
??
�10 4.5
113??
??
??
??
??
??
??
?? 20 3.0
114
?y
?y
?y
?y
?y
?y
?y
?y
80 8.0
115 0.40 5 2 Fixed Variable Variable 1 1.333 �10 10.0
116??
??
??
??
??
??
??
?? 5 7.0
117??
??
??
??
??
??
??
?? 20 5.0
118??
??
??
??
??
??
??
?? 35 3.5
119??
??
??
??
??
??
??
?? 65 3.5
120??
??
??
??
??
??
??
?? 110 4.5
121
?y
?y
?y
?y
?y
?y
?y
?y
155 7.0
122 0.45 0 2 Fixed Variable Variable 1 1.333 �10 10.0
123??
??
??
??
??
??
??
?? 5 7.0
124??
??
??
??
??
??
??
?? 20 5.0
125??
??
??
??
??
??
??
?? 35 3.5
126??
??
??
??
??
??
??
?? 65 3.5
127??
??
??
??
??
??
??
?? 110 6.0
128
?y
?y
?y
?y
?y
?y
?y
?y
155 6.0
129 0.50 �5 2 Fixed Variable Variable 1 1.333 �10 10.0
130??
??
??
??
??
??
??
?? 5 7.0
131??
??
??
??
??
??
??
?? 20 6.0
132??
??
??
??
??
??
??
?? 35 3.0
133??
??
??
??
??
??
??
?? 65 3.0
134??
??
??
??
??
??
??
?? 110 4.0
135
?y
?y
?y
?y
?y
?y
?y
?y
155 5.0
136 0.40 5 2 Variable Fixed Variable 1 1.333 1 7.0
137??
??
??
??
??
??
??
?? 20 4.0
138??
??
??
??
??
??
??
?? 35 3.0
139??
??
??
??
??
??
??
?? 65 4.5
140??
??
??
??
??
??
??
?? 110 5.0
141
?y
?y
?y
?y
?y
?y
?y
?y
155 6.0
12

Table II. Concluded
First Second Second Third
Con�guration No. of break, slope, break, slope, Average
number c.g. SM Kq Fc=�c �H=�c Fc=nz breaks nz Fc=nz nz Fc=nz CHR
142 0.45 0 2 Variable Fixed Variable 1 1.333 5 6.0
143??
??
??
??
??
??
??
?? 20 5.0
144??
??
??
??
??
??
??
?? 35 3.5
145??
??
??
??
??
??
??
?? 65 3.5
146
?y
?y
?y
?y
?y
?y
?y
?y
110 3.5
147 0.50 �5 2 Variable Fixed Variable 1 1.333 �10 8.5
148??
??
??
??
??
??
??
?? 5 7.0
149??
??
??
??
??
??
??
?? 20 6.5
150??
??
??
??
??
??
??
?? 35 5.0
151
?y
?y
?y
?y
?y
?y
?y
?y
65 5.5
152 0.25 20 1 Fixed Variable Variable 2 1.333 0 1.667 �20 8.5
153 0.25 20 1 Fixed Variable Variable 2 1.333 20 1.667 20 7.0
154 0.25 20 1 Fixed Variable Variable 2 1.333 50 1.667 50 7.0
155 0.25 20 1 Fixed Variable Variable 2 1.333 �20 1.667 0 10.0
156??
??
??
??
??
??
??
??
??
?? 20 10.0
157??
??
??
??
??
??
??
??
??
?? 40 9.0
158
?y
?y
?y
?y
?y
?y
?y
?y
?y
?y
70 9.0
159 0.50 �5 2 Fixed Variable Variable 2 1.333 0 1.667 �20 10.0
160 0.50 �5 2 Fixed Variable Variable 2 1.333 0 1.667 20 6.0
161 0.50 �5 2 Fixed Variable Variable 2 1.333 0 1.667 50 6.0
162 0.50 �5 2 Fixed Variable Variable 2 1.333 �20 1.667 0 10.0
163??
??
??
??
??
??
??
??
??
?? 20 10.0
164??
??
??
??
??
??
??
??
??
?? 40 7.5
165
?y
?y
?y
?y
?y
?y
?y
?y
?y
?y
70 9.0
166 0.25 20 1 Variable Fixed Variable 2 1.333 0 1.667 20 8.0
167 0.25 20 1 Variable Fixed Variable 2 1.333 50 1.667 50 7.0
168 0.50 �5 2 Fixed Variable Variable 2 1.333 0 1.667 �20 5.0
169 0.50 �5 2 Fixed Variable Variable 2 1.333 20 1.667 �20 6.0
170 0.50 �5 2 Fixed Variable Variable 2 1.333 50 1.667 �20 6.0
171 0.40 5 2 Fixed Variable Variable 2 1.155 27 1.600 65 3.0
172 0.45 0 2 Fixed Variable Variable 2 1.155 27 1.600 65 3.0
173 0.50 �5 2 Fixed Variable Variable 2 1.155 27 1.600 65 3.5
174 0.40 5 2 Variable Fixed Variable 2 1.155 27 1.600 65 5.5
175 0.45 0 2 Variable Fixed Variable 2 1.155 27 1.600 65 3.5
176 0.50 �5 2 Variable Fixed Variable 2 1.155 27 1.600 65 5.0
13

Table III. Con�gurations Evaluated by Each Pilot
Con�guration Pilot 1 Pilot 2 Pilot 3 Pilot 4 Con�guration Pilot 1 Pilot 2 Pilot 3 Pilot 4
1 X X 55 X X X X
2 X X 56 X X X X
3 X X 57 X X X X
4 X X X X 58 X
5 X X X X 59 X
6 X X X X 60 X
7 X X 61 X
8 X X 62 X
9 X X 63 X
10 X X X X 64 X
11 X X X X 65 X
12 X X X X 66 X
13 X X X X 67 X X X X
14 X X X X 68 X X X X
15 X X X X 69 X X X X
16 X X X X 70 X X X X
17 X X X X 71 X X X X
18 X X X X 72 X X X X
19 X X X 73 X X X X
20 X X X 74 X X X X
21 X X X X 75 X X
28 X X 76 X X
29 X X 77 X X
30 X X 78 X X
31 X X 79 X X X X
32 X X 80 X X X
33 X X 81 X X X
34 X X X X 82 X X X
35 X X X X 83 X X X X
36 X X X X 84 X X X X
37 X X X X 85 X X X X
38 X X X X 86 X X X X
39 X X X X 87 X X X X
40 X X X X 88 X X
41 X X X X 89 X X
42 X X X X 90 X X
43 X X X X 91 X X
44 X X X X 92 X X
45 X X X X 93 X X
52 X X X X 94 X X X X
53 X X X X 95 X X X X
54 X X X X 96 X X X
14

Table III. Concluded
Con�guration Pilot 1 Pilot 2 Pilot 3 Pilot 4 Con�guration Pilot 1 Pilot 2 Pilot 3 Pilot 4
97 X X X 139 X X X
98 X X X 140 X
99 X X X X 141 X
100 X X X X 142 X X X
101 X X X X 143 X X X
102 X X X X 144 X X X
103 X X X X 145 X
104 X X 146 X
105 X X X 147 X X X
106 X X X 148 X X X X
107 X X X 149 X X X X
108 X X 150 X X X X
109 X X 151 X
110 X X 152 X X
111 X X X X 153 X X X
112 X X X X 154 X X X
113 X X X X 155 X
114 X X X 156 X
115 X X 157 X X
116 X X X 158 X X
117 X X 159 X X X
118 X X X 160 X X X X
119 X X 161 X X X
120 X X X 162 X
121 X X 163 X
122 X X 164 X X
123 X X X 165 X X
124 X X 166 X X X
125 X X X 167 X X X
126 X X 168 X
127 X X X 169 X X X
128 X X 170 X X X
129 X X X 171 X
130 X X X X 172 X X
131 X X 173 X
132 X X X X 174 X X
133 X X X 175 X X
134 X X X X 176 X X
135 X X X
136 X X X
137 X X X
138 X X X
15

Table IV. Linear Maneuver Stability Level 1 Boundaries of ThisStudy and Military Speci�cations
Force per acceleration,Fc=nz, lbf/g-unit
Static margin, Technique used toSource percent linearize Fc=nz Minimum Maximum
Present study 5 Variable �H=�c 41 1070 Variable �H=�c 29 103�5 Variable �H=�c 31 825 Variable Fc=�c 39 850 Variable Fc=�c 27 74�5 Variable Fc=�c
Military Speci�cations a33.4 a90.2(refs. 7 and 8) 23.3 80.0
aAverage
16

Servocommand limit, in. Column, in.
Cable, in.Series servo
q, deg/sec
Airframe
Basic longitudinal
control system
1.250.67
-0.78
Feedforward gain
Washout
Lag PrefilterCable, in.
Column, in.1
0.03s + 11
1.5s + 1KFF
+
-
δ col, trim = δ c,p - (δc,trim + δc, MTC)
0.4
Feedback lagged pitch damper loop
Feedforward lagged column minus trim loop
δHδc, PACS1
0.000625s2 + 0.05s +1
Pitch damper gain Prefilter Lag
Kq1
0.03s + 11
τlags + 1
8s8s + 1
Figure 4. Analytical diagram of near-term PACS.
21

Vary initial gradient Vary initial gradient and
gradient after break
Vary initial gradient, location of break andgradient after break
Vary gradient after first break, location of second break and gradient after second break
nz nz
nz nz
Fc, lbf Fc, lbf
Fc, lbf Fc, lbf
Figure 5. Possible maneuver stability characteristics for piloted ight simulation evaluation.
22

DATE:______________CONFIGURATION:________________________PILOT:_______________________
1. TRIMMABILITY:- 2. SMALL PITCH CHANGES: Initial response:-
Damping:-
Predictability /Precision:-
PIO:-
Cooper-Harper____________Major Reason:-
3. OPERATIONAL TURNS (g < 1.5):
Entry/exit characteristics:-
Ability to hold altitude (±100'):-
Tendency to PIO:-
Stick Force Characteristics:-
Special techniques:-
Cooper-Harper_______________Major reason:-
4. WIND-UP TURNS (g >1.5):
Ability to attain/stabilize desired load factor:-
Tendency to PIO:-
Maneuver Force Characteristics;
Predictability:-
Forces:-
Disp:-
Sens:-
Linearity:-
Special Techniques:-
Cooper-Harper_______________Major reason:-
SUMMARY:
Good Features:-
Major Problems:-
Overall Cooper-Harper___________.
Overall PIO: Rating_____________Task_____________________.
Phugoid:-
Figure 6. Pilot comment card.
23

ADEQUACY FOR SELECTED TASK OR REQUIRED OPERATION*
Level 1
Improvement not
required
Excellent Highly desirable
Good Negligible deficiencies
Fair—Some mildly unpleasant deficiencies
Minor but annoying deficiencies
Moderately objectionable deficiencies
Very objectionable but tolerable deficiencies
AIRCRAFT CHARACTERISTICS
DEMAND ON THE PILOT IN SELECTED TASK
OR REQUIRED OPERATION*CHR
RATING
Major deficiencies
Major deficiencies
Major deficiencies
Major deficiencies
Adequate performance not attainable with maximum tolerable pilot compensation.Controllability not in question.
Considerable pilot compensation is required for control
Intense pilot compensation is required to retain control
Control will be lost during some portion of required operation
Is it satisfactory without
improvement?
Is it controllable?
Pilot decisions
Pilot compensation not a factor for desired performance
Pilot compensation not a factor for desired performance
Minimal pilot compensation required for desired performance
Desired performance requires moderate pilot compensation
Adequate performance requires considerable pilot compensation
Adequate performance requires extensive pilot compensation
Level 2
Deficiencies require
improvement
Level 2
Deficiencies require
improvement
Level 2
Deficiencies require
improvement
1
2
3
4
5
6
7
9
8
*Definition of required operation involves designation of flight phase and/or subphases with accompanying conditions.
Level 2
Deficiencies require
improvement
Level 3
Deficiencies require
improvement
Level 3+
Improvement mandatory
10
Yes
Yes
Yes
No
No
No
Is adequate performance
attainable with a tolerable pilot work load?
Figure 7. Pilot rating system (from ref. 6).
24

2.22.01.81.61.41.21.00
20
40
60
80 Kq = 0Kq = 1Kq = 2Fc,minFc,max
nz, g units
Fc, lbf
CHR
3.5
3.0
3.5
(a) Con�gurations 1, 2, and 3; c.g = 0.12�c; SM = 33 percent.
2.22.01.81.61.41.21.00
20
40
60
80
6.5
3.0
3.5
CHR
nz, g units
Fc, lbf
Kq = 0Kq = 1Kq = 2Fc,minFc,max
(b) Con�gurations 4, 5, and 6; c.g. = 0.25�c; SM = 20 percent.
2.22.01.81.61.41.21.00
20
40
60
80
5.0
4.0
3.5
CHR
nz, g units
Fc, lbf
Kq = 0Kq = 1Kq = 2Fc,minFc,max
(c) Con�gurations 7, 8, and 9; c.g. = 0.35�c; SM = 10 percent.
Figure 8. E�ect of c.g. and Kq on Fc=nz and on pilot rating.
25

2.22.01.81.61.41.21.00
20
40
60
80
9.0
6.0
4.5
CHR
nz, g units
Fc, lbf
Kq = 0Kq = 1Kq = 2Fc,minFc,max
(d) Con�gurations 10, 11, and 12; c.g. = 0.40�c; SM = 5 percent.
2.22.01.81.61.41.21.0-20
0
20
40
60
10.0
6.5
3.5
CHR
nz, g units
Fc, lbf
Kq = 0Kq = 1Kq = 2Fc,minFc,max
(e) Con�gurations 13, 14, and 15; c.g. = 0.45�c; SM = 0.
Figure 8. Continued.
26
2.22.01.81.61.41.21.0-20
0
20
40
60
10.0
7.0
3.5
CHR
nz, g units
Fc, lbf
Kq = 0Kq = 1Kq = 2Fc,minFc,max
(f) Con�gurations 16, 17, and 18; c.g. = 0.47�c; SM = �2 percent.
2.22.01.81.61.41.21.0-20
0
20
40
60
10.010.0
4.0
CHR
nz, g units
Fc, lbf
Kq = 0Kq = 1Kq = 2Fc,minFc,max
(g) Con�gurations 19, 20, and 21; c.g. = 0.50�c; SM = �5 percent.
Figure 8. Concluded.
27

.6.5.4.3.2.10
.1
.2
.3
.4
.5
.6
.7
.8 011.52
Satisfactory
Unsatisfactory
Unacceptable
Kq
c.g., percent c
Kq
Figure 9. E�ect of c.g. and Kq on short-period damping.
.6.5.4.3.2.1-.8
-.6
-.4
-.2
0
.2Satisfactory
Unsatisfactory
Unacceptable
Kq 011.52
c.g., percent c
Kq
Figure 10. E�ect of c.g. and Kq on phugoid damping.
28

120100806040200
1
2
3
4
5
6
7
8
9
10
1 2 3 4
Fc/nz, lbf/g unit
CHR
Pilot
(a) Con�gurations 67 through 70; c.g. = 0.40�c; SM = 5 percent.
120100806040200
1
2
3
4
5
6
7
8
9
10
CHR
Fc/nz, lbf/g unit
1 2 3 4
Pilot
(b) Con�gurations 71 through 74; c.g. = 0.45�c; SM = 0.
120100806040200
1
2
3
4
5
6
7
8
9
10
CHR
Fc/nz, lbf/g unit
1 2 3 4
Pilot
(c) Con�gurations 79 through 81; c.g. = 0.50�c; SM = �5 percent.
Figure 11. Pilot ratings for various levels of maneuver stability. Variable Fc=�c; �H=�c = �1:0�/in.
29

120100806040200
1
2
3
4
5
6
7
8
9
10
1 2
3 4
CHR
Pilot
Fc/nz, lbf/g unit
(a) Con�gurations 34 through 39; c.g. = 0.40�c; SM = 5 percent.
120100806040200
1
2
3
4
5
6
7
8
9
10
1 2 3 4
CHR
Pilot
Fc/nz, lbf/g unit
(b) Con�gurations 40 through 45; c.g. = 0.45�c; SM = 0.
Figure 12. Pilot ratings for various levels of linear maneuver stability. Variable �H=�c; Fc=�c = 15.77 lbf/in.
30
120100806040200
1
2
3
4
5
6
7
8
9
10 1 2
3 4
CHR
Pilot
Fc/nz, lbf/g unit
(c) Con�gurations 52 through 57; c.g. = 0.50�c; SM = �5 percent.
Figure 12. Concluded.
31

120100806040200
1
2
3
4
5
6
7
8
9
10 δH/δcFc/δc
CHR
Level 1 region (ref. 7)
Fc/nz, lbf/g unit
(a) c.g. = 0.40�c; SM = 5 percent.
120100806040200
1
2
3
4
5
6
7
8
9
10
CHR
δH/δcFc/δcLevel 1 region (ref. 7)
Fc/nz, lbf/g unit
(b) c.g. = 0.45�c; SM = 0.
Figure 13. Pilot ratings for techniques used to maintain linear maneuver stability.
32

120100806040200
1
2
3
4
5
6
7
8
9
10
CHR
δH/δcFc/δcLevel 1 region (ref. 7)
Fc/nz, lbf/g unit
(c) c.g. = 0.50�c; SM = �5 percent.
Figure 13. Concluded.
33

120100806040200
1
2
3
4
5
6
7
8
1234
CHR
Pilot
120100806040200
1
2
3
4
5
6
7
8
1
23
4
Fc/nz, lbf/g unit
Operational turns
CHR
Pilot
Fc/nz, lbf/g unit
Wind-up turns
(a) Con�gurations 67 through 70; c.g. = 0.40�c; SM = 5 percent.
Figure 14. E�ect of magnitude of linear maneuver stability on pilot rating for operational and wind-up turns.Variable Fc=�c; �H=�c = �1:0
�/in.
34

120100806040200
1
2
3
4
5
6
7
8
1234
CHR
Pilot
120100806040200
1
2
3
4
5
6
7
8
1234
CHR
Pilot
Fc/nz, lbf/g unit
Operational turns
Fc/nz, lbf/g unit
Wind-up turns
(b) Con�gurations 71 through 74; c.g. = 0.45�c; SM = 0.
Figure 14. Continued.
35

120100806040200
1
2
3
4
5
6
7
8
123
CHR
Pilot
120100806040200
1
2
3
4
5
6
7
8 12
34
CHR
Pilot
Fc/nz, lbf/g unit
Operational turns
Fc/nz, lbf/g unit
Wind-up turns
(c) Con�gurations 79 through 81; c.g. = 0.50�c; SM = �5 percent.
Figure 14. Concluded.
36

120100806040200
1
2
3
4
5
6
7
8
CHR
120100806040200
1
2
3
4
5
6
7
8
123
4
CHR
Pilot
123
4
Pilot
Fc/nz, lbf/g unit
Operational turns
Fc/nz, lbf/g unit
Wind-up turns
(a) Con�gurations 34 through 39; c.g. = 0.40�c; SM = 5 percent.
Figure 15. E�ect of magnitude of linear maneuver stability on pilot opinion for operational and wind-up turns.Variable �H=�c; Fc=�c = 15.77 lbf/in.
37

120100806040200
1
2
3
4
5
6
7
8 123
4
CHR
Pilot
120100806040200
1
2
3
4
5
6
7
81
234
CHR
Pilot
Fc/nz, lbf/g unit
Operational turns
Fc/nz, lbf/g unit
Wind-up turns
(b) Con�gurations 40 through 45; c.g. = 0.45�c; SM = 0.
Figure 15. Continued.
38

120100806040200
1
2
3
4
5
6
7
8
1234
CHR
Pilot
120100806040200
1
2
3
4
5
6
7
8
1234
CHR
Pilot
Fc/nz, lbf/g unit
Operational turns
Fc/nz, lbf/g unit
Wind-up turns
(c) Con�gurations 52 through 57; c.g. = 0.50�c; SM = �5 percent.
Figure 15. Concluded.
39

2.01.81.61.41.21.00
20
40
60
80
100
120
nz, g units
Fc, lbf
170
80
20
-10
-40-70
Second slope
Level 1 boundaries (ref. 7)
Maneuver stability
Figure 16. Maneuver stability characteristics with single break at 1.667g.
2.01.81.61.41.21.00
20
40
60
80
100
120 155
65
20
5
-10
35
110
Fc, lbf
Second slope
nz, g units
Level 1 boundaries (ref. 7)
Maneuver stability
Figure 17. Maneuver stability characteristics with single break at 1.333g.
40

200150100500-50-1000
1
2
3
4
5
6
7
8
9
10
1
234
Fc/nz, after break, lbf/g unit
CHR
Pilot
(a) Con�gurations 100 through 104; c.g. = 0.40�c; SM = 5 percent.
200150100500-50-1000
1
2
3
4
5
6
7
8
9
10
134
CHR
Pilot
Fc/nz, after break, lbf/g unit
(b) Con�gurations 105 through 109; c.g. = 0.45�c; SM = 0.
Figure 18. E�ect of single break in maneuver stability on pilot opinion. Break at nz = 1.667g; variable Fc=�c;�H=�c = �1:0
�/in.
41

200150100500-50-1000
1
2
3
4
5
6
7
8
9
10
1234
CHR
Pilot
Fc/nz, after break, lbf/g unit
(c) Con�gurations 110 through 114; c.g. = 0.50�c; SM = �5 percent.
Figure 18. Concluded.
42

200150100500-50-1000
1
2
3
4
5
6
7
8
9
10
1234
Fc/nz, after break, lbf/g unit
CHR
Pilot
(a) Con�gurations 82 through 87; c.g. = 0.40�c; SM = 5 percent.
200150100500-50-1000
1
2
3
4
5
6
7
8
9
10
12
CHR
Pilot
Fc/nz, after break, lbf/g unit
(b) Con�gurations 88 through 93; c.g. = 0.45�c; SM = 0.
Figure 19. E�ect of single break in maneuver stability on pilot opinion. Break at nz = 1.667g; variable �H=�c;Fc=�c = 15.77 lbf/in.
43
200150100500-50-1000
1
2
3
4
5
6
7
8
9
10
1234
CHR
Pilot
Fc/nz, after break, lbf/g unit
(c) Con�gurations 94 through 99; c.g. = 0.50�c; SM = �5 percent.
Figure 19. Concluded.
44

200150100500-50-1000
1
2
3
4
5
6
7
8
9
10
1234
CHR
Pilot
Fc/nz, after break, lbf/g unit
(a) Con�gurations 136 through 141; c.g. = 0.40�c; SM = 5 percent.
200150100500-50-1000
1
2
3
4
5
6
7
8
9
10
1
23
CHR
Pilot
Fc/nz, after break, lbf/g unit
(b) Con�gurations 142 through 146; c.g. = 0.45�c; SM = 0.
Figure 20. E�ect of single break in maneuver stability on pilot opinion. Break at nz = 1.333g; variable Fc=�c;�H=�c = �1:0
�/in.
45

200150100500-50-1000
1
2
3
4
5
6
7
8
9
10
1234
CHR
Pilot
Fc/nz, after break, lbf/g unit
(c) Con�gurations 147 through 151; c.g. = 0.50�c; SM = �5 percent.
Figure 20. Concluded.
46

200150100500-50-1000
1
2
3
4
5
6
7
8
9
10124
CHR
Pilot
Fc/nz, after break, lbf/g unit
(a) Con�gurations 115 through 121; c.g. = 0.40�c; SM = 5 percent.
200150100500-50-1000
1
2
3
4
5
6
7
8
9
10
1
2
4
CHR
Pilot
Fc/nz, after break, lbf/g unit
(b) Con�gurations 122 through 128; c.g. = 0.45�c; SM = 0.
Figure 21. E�ect of single break in maneuver stability on pilot opinion. Break at nz = 1.333g; variable �H=�c;Fc=�c = 15.77 lbf/in.
47

200150100500-50-1000
1
2
3
4
5
6
7
8
9
10
12
34
CHR
Pilot
Fc/nz, after break, lbf/g unit
(c) Con�gurations 129 through 135; c.g. = 0.50�c; SM = �5 percent.
Figure 21. Concluded.
48

200150100500-50-1000
1
2
3
4
5
6
7
8
9
10
CHR
200150100500-50-1000
1
2
3
4
5
6
7
8
9
10 Variable δH/δcVariable Fc/δc
Fc/nz, after break, lbf/g unit
Break at nz = 1.333g
CHR
Variable δH/δcVariable Fc/δc
Fc/nz, after break, lbf/g unit
Break at nz = 1.667g
(a) c.g. = 0.40�c; SM = 5 percent.
Figure 22. Trends for methods used (variable �H=�c of Fc=�c) to adjust maneuver stability characteristics.
49

200150100500-50-1000
1
2
3
4
5
6
7
8
9
10
CHR
200150100500-50-1000
1
2
3
4
5
6
7
8
9
10
CHR
Variable δH/δcVariable Fc/δc
Fc/nz, after break, lbf/g unit
Break at nz = 1.333g
Variable δH/δcVariable Fc/δc
Fc/nz, after break, lbf/g unit
Break at nz = 1.667g
(b) c.g. = 0.45�c; SM = 0.
Figure 22. Continued.
50

200150100500-50-1000
1
2
3
4
5
6
7
8
9
10
CHR
200150100500-50-1000
1
2
3
4
5
6
7
8
9
10
CHR
Variable δH/δcVariable Fc/δc
Fc/nz, after break, lbf/g unit
Break at nz = 1.333g
Variable δH/δcVariable Fc/δc
Fc/nz, after break, lbf/g unit
Break at nz = 1.667g
(c) c.g. = 0.50�c; SM = �5 percent.
Figure 22. Concluded.
51

200150100500-50-1000
1
2
3
4
5
6
7
8
9
10
1234
CHR
Pilot
200150100500-50-1000
1
2
3
4
5
6
7
8
9
10
1234
Fc/nz, after break, lbf/g unit
Operational turns
CHR
Pilot
Fc/nz, after break, lbf/g unit
Wind-up turns
(a) Con�gurations 100 through 104; c.g. = 0.40�c; SM = 5 percent.
Figure 23. E�ect of single break in maneuver stability curve and c.g. location on individual pilot ratings. Initialslope = 50 lbf/g; break at nz = 1.667g; variable Fc=�c; �H=�c = �1
�/in.
52

200150100500-50-1000
1
2
3
4
5
6
7
8
9
10
1234
CHR
Pilot
200150100500-50-1000
1
2
3
4
5
6
7
8
9
10
123
4CHR
Pilot
Fc/nz, after break, lbf/g unit
Operational turns
Fc/nz, after break, lbf/g unit
Wind-up turns
(b) Con�gurations 110 through 114; c.g. = 0.50�c; SM = �5 percent.
Figure 23. Concluded.
53

200150100500-50-1000
1
2
3
4
5
6
7
8
9
10
CHR
200150100500-50-100
123
4CHR
Pilot
123
4
Pilot
0
1
2
3
4
5
6
7
8
9
10
Fc/nz, after break, lbf/g unit
Operational turns
Fc/nz, after break, lbf/g unit
Wind-up turns
(a) Con�gurations 82 through 87; c.g. = 0.40�c; SM = 5 percent.
Figure 24. E�ect of single break in maneuver stability curve and c.g. location on individual pilot ratings. Initialslope = 50 lbf/g; break at nz = 1.667g; variable �H=�c; Fc=�c = 15.77 lbf/in.
54

200150100500-50-1000
1
2
4
5
6
7
8
9
10
CHR
200150100500-50-1000
1
2
3
4
5
6
7
8
9
10
1
234
CHR
Pilot
3
1
234
Pilot
Fc/nz, after break, lbf/g unit
Operational turns
Fc/nz, after break, lbf/g unit
Wind-up turns
(b) Con�gurations 94 through 99; c.g. = 0.50�c; SM = �5 percent.
Figure 24. Concluded.
55

200150100500-50-1000
1
2
3
4
5
6
7
8
9
10
1234
CHR
Pilot
200150100500-50-1000
1
2
3
4
5
6
7
8
9
10
1234
CHR
Pilot
Fc/nz, after break, lbf/g unit
Operational turns
Fc/nz, after break, lbf/g unit
Wind-up turns
(a) Con�gurations 136 through 141; c.g. = 0.40�c; SM = 5 percent.
Figure 25. E�ect of single break in maneuver stability curve and c.g. location on individual pilot ratings. Initialslope = 50 lbf/g; break at nz = 1.333g; variable Fc=�c; �H=�c = �1
�/in.
56

200150100500-1000
1
2
3
4
5
6
7
8
9
10
CHR
200150100500-50-1000
1
2
3
4
5
6
7
8
9
1234CHR
Pilot
10
-50
1234
Pilot
Fc/nz, after break, lbf/g unit
Operational turns
Fc/nz, after break, lbf/g unit
Wind-up turns
(b) Con�gurations 147 through 151; c.g. = 0.50�c; SM = �5 percent.
Figure 25. Concluded.
57

200150100500-50-1000
1
2
3
4
5
6
7
8
9
10
124
CHR
Pilot
200150100500-50-1000
1
2
3
4
5
6
7
8
9
10
124
CHR
Pilot
Fc/nz, after break, lbf/g unit
Operational turns
Fc/nz, after break, lbf/g unit
Wind-up turns
(a) Con�gurations 115 through 121; c.g. = 0.40�c; SM = 5 percent.
Figure 26. E�ect of single break in maneuver stability curve and c.g. location on individual pilot ratings. Initialslope = 50 lbf/g; break at nz = 1.333g; variable �H=�c; Fc=�c = 15.77 lbf/in.
58

200150100500-50-1000
1
2
3
4
5
6
7
8
9
10
1234
CHR
Pilot
200150100500-50-1000
1
2
3
4
5
6
7
8
9
10
1
234
CHR
Pilot
Fc/nz, after break, lbf/g unit
Operational turns
Fc/nz, after break, lbf/g unit
Wind-up turns
(b) Con�gurations 129 through 135; c.g. = 0.50�c; SM = �5 percent.
Figure 26. Concluded.
59

200150100500-50-100
0
1
2
3
4
5
6
7
8
9
10
CHR
200150100500-50-100
1
2
3
4
5
6
7
8
9
10
CHR
0
Wind-up turns
Operational turns
Wind-up turns
Operational turns
Variable δH/δcVariable Fc/δc
Fc/nz, after break, lbf/g unit
Break at nz = 1.333g
Variable δH/δcVariable Fc/δc
Fc/nz, after break, lbf/g unit
Break at nz = 1.667g
(a) c.g. = 0.40�c; SM = 5 percent.
Figure 27. Comparison of pilot rating trends of individual tasks with single break in maneuver stability curves.Initial slope = 50 lbf/g.
60

200150100500-50-1000
1
2
3
4
5
6
7
8
9
10
CHR
200150100500-50-1000
1
2
3
4
5
6
7
8
9
10
CHRWind-up turns
Operational turns
Wind-up turns
Operational turns
Variable δH/δcVariable Fc/δc
Fc/nz, after break, lbf/g unit
Break at nz = 1.333g
Variable δH/δcVariable Fc/δc
Fc/nz, after break, lbf/g unit
Break at nz = 1.667g
(b) c.g. = 0.50�c; SM = �5 percent.
Figure 27. Concluded.
61

2.01.81.61.41.21.00
20
40
60
80
100
nz, g units
Fc, lbf
50
20
-20
Third slope
Level 1 boundaries (ref. 7)
Maneuver stability
(a) Second slope of zero.
2.01.81.61.41.21.00
20
40
60
80
100
nz, g units
Fc, lbf
70
40200
Third slope
Level 1 boundaries (ref. 7)
Maneuver stability
(b) Second slope of �20 lbf/g.
Figure 28. Con�gurations 152 through 170 with double break in maneuver curves. Initial slope = 50 lbf/g.
62

2.01.81.61.41.21.00
20
40
60
80
100
nz, g units
Fc, lbf
45 lbf/gunit
27 lbf/g unit
65 lbf/g unit
Level 1 boundaries (ref. 7)
Maneuver stability
Figure 29. Preferred maneuver stability characteristics of the test airplane by pilot number one.
63

L-75-7570
(a) Langley Visual/Motion Simulator.
L-78-7794
(b) Instrument panel.
Figure 3. Langley Visual/Motion Simulator and instrument panel display.
(a) Langley Visual/Motion Simulator.
Figure 3. Langley Visual/Motion Simulator and instrument panel display.
(b) Instrument panel.
Figure 3. Concluded.
1

REPORT DOCUMENTATION PAGEForm Approved
OMB No. 0704-0188
Public reporting burden for this collection of information is estimated to average 1 hour per response, including the time for reviewing instructions, searching existing data sources,gathering and maintaining the data needed, and completing and reviewing the collection of information. Send comments regarding this burden estimate or any other aspect of thiscollection of information, including suggestions for reducing this burden, toWashington Headquarters Services, Directorate for Information Operations and Reports, 1215 Je�ersonDavis Highway, Suite 1204, Arlington, VA 22202-4302, and to the O�ce of Management and Budget, Paperwork Reduction Project (0704-0188), Washington, DC 20503.
1. AGENCY USE ONLY(Leave blank) 2. REPORT DATE 3. REPORT TYPE AND DATES COVERED
March 1994 Technical Memorandum
4. TITLE AND SUBTITLE
Techniques To Improve Maneuver Stability Characteristics of a
Nonlinear Wide-Body Transport Airplane in Cruise Flight
6. AUTHOR(S)
William D. Grantham, Lee H. Person, Jr., Melvin L. Bailey,
and Stephen A. Tingas
7. PERFORMING ORGANIZATION NAME(S) AND ADDRESS(ES)
NASA Langley Research Center
Hampton, VA 23681-0001
9. SPONSORING/MONITORING AGENCY NAME(S) AND ADDRESS(ES)
National Aeronautics and Space Administration
Washington, DC 20546-0001
5. FUNDING NUMBERS
WU 505-64-52-01
8. PERFORMING ORGANIZATION
REPORT NUMBER
L-17205
10. SPONSORING/MONITORING
AGENCY REPORT NUMBER
NASA TM-4521
11. SUPPLEMENTARY NOTES
Grantham and Person: Langley Research Center, Hampton, VA; Bailey: Lockheed Engineering & SciencesCo., Hampton, VA; Tingas: Lockheed Aeronautical Systems Co., Marietta, GA.
12a. DISTRIBUTION/AVAILABILITY STATEMENT 12b. DISTRIBUTION CODE
Unclassi�ed|Unlimited
Subject Category 08
13. ABSTRACT (Maximum 200 words)
The maneuver control stability characteristics of an aircraft are a ying qualities parameter of critical importance, to ensure
structural protection as well as adequate predictability to the pilot. Currently, however, maneuver stability characteristics are
not uniquely addressed in the Federal Aviation Regulations (FAR) Part 25, for transport aircraft. In past transport category
certi�cation programs, the Federal Aviation Administration(FAA) has used a combination of requirements (longitudinal control,
vibration and bu�eting, high-speed characteristics, and out-of-trim characteristics) to ensure safe and controllable maneuver
stability characteristics over a range of ight conditions and airplane con�gurations. Controversies exist regarding each of
these regulations, however, and considerable expenditures in terms of design studies and testing time have resulted from the
requirements. It is also recognized that additional engineering guidance is needed for identifying acceptable nonlinear maneuver
stability characteristics, particularly as they relate to relaxed stability, highly augmented transport con�gurations. The current
trend in large aircraft design is toward relaxed, or even negative, static margins for improved fuel e�ciency. The advanced
ight control systems developed for these aircraft, in many instances, have rendered current aforementioned maneuver stability
criteria either too stringent or of little practical use. Current design requirementsdo not account for these advanced designs. The
objective of the present study was to evaluate a broad spectrum of linear and nonlinear longitudinal stability characteristics to
generate data for de�ning satisfactoryand unacceptable maneuver characteristics, as de�ned by pilot opinion. Primary emphasis
was placed on two techniques of varying column force per normal acceleration. This study was a joint venture with four pilots
participating; one from NASA, one from the FAA, and two from industry.
14. SUBJECT TERMS 15. NUMBER OF PAGES
Maneuver stability; Column force; Column de ection; Horizontal-tail de ection 64
16. PRICE CODE
A0417. SECURITY CLASSIFICATION 18. SECURITY CLASSIFICATION 19. SECURITY CLASSIFICATION 20. LIMITATION
OF REPORT OF THIS PAGE OF ABSTRACT OF ABSTRACT
Unclassi�ed Unclassi�ed
NSN 7540-01-280-5500 Standard Form 298(Rev. 2-89)Prescribed by ANSI Std. Z39-18298-102