Embed Size (px)
Citation preview

Techniques to Reduce the Environmental
Impacts and Costs of Road Construction
A Results Based Study

Other authors:Ron Neden, P.Eng. &
Freeman Smith, P.Geo. of Terratech Consulting
Ltd.James Schwab, R.P.F.,
P.Geo. Of B.C. Ministry of Forests

Acknowledgements
Skeena Cellulous West Fraser Timber
FRBC and FIIBC Ministry of Forests
Robert BalshawSilvicon Services Ltd
Silvatech Consulting LtdBGC Engineering Ltd

QUESTIONS
1. Can the incidence of road fillslope landslides be reduced?
2. Can forest road construction practises be improved and/or economized?
3. Can both be done at the same time?

LOOKING BACKAT PAST RESULTS
• Past road practises -- What did not work ?• Why?• What worked?• How can we build upon it?

STUDY DESIGN
• Focused on road fillslope landslides• Existing roads constructed across slopes
greater than 50% (based on TRIM mapping) • Past road construction and management
techniques

HOW• Collect terrain and road attributes at sites where
fillslope landslides occurred; and• Collect the same attributes at similar sites where
landslides had not occurred.• Compare the data sets statistically• Determine what combinations of terrain and road
construction attributes contribute to fillslope landslides; and by default
• What combination of terrain and road construction attributes do not contribute to fillslope landslides

DATA COLLECTED INCLUDED
• Existing topographic, road, bedrock and surficial geology data;
• Interpreted information from aerial photographs; and
• Field data

FIELD DATA INCLUDED
Terrain Attributes• Slope (up and down)• Surficial Material• Aspect• Drainage• Bedrock Type• Slope Profile (Shape)• Etc.
Road Attributes• Fill Width• Fill Slope Length & Angle• Fill Type (R, SM, GP, etc)• Ditch Condition• Wood in fill• Configuration of wood in fill• Cracks in Road• Deactivation?• Etc.

STUDY AREA STATISTICS
Kalum Forest District• Coastal Western Hemlock Biogeoclimatic Zone• 158,000 hectares• 1079 km of forest roads• 196 km or 18% located on moderately steep to
steep slopes (based on TRIM data)• Williams; West Copper; Kleanza; Legate-
Chimdemash; and West Kalum

STUDY AREA Kalum Forest
District

Road lengths
Distribution of Road Lengths by Slopes
874
59 43 37 24 15 10 8 90
100
200
300
400
500
600
700
800
900
1000
0-47 48-52 53-57 58-62 63-67 68-72 73-77 78-82 83+
Terrain Slope (%)
Ro
ad L
eng
th (k
m)
Total length of forest road = 1079 km
Road lengths obtained from TRIM map base and considered to be approximate only.

RESULTS OF STUDY
• Field data collected at 40 landslide sites and 89 null site (non landslide sites)
• Distribution of terrain slopes where data was collected is as follows:

Natural slope down
Distribution of Road Fill Landslides by Natural Slope
0
5
10
15
20
25
30
35
Slope Range (%) Measured at Toe of Fill
Per
cen
t o
f S
ites
Road Fill LandslidesNull Sites
<45 46-55 56-65 66-75 76-85 86-95 96-105 >105
N = 4
4
3
2

STATISTICAL ANALYSIS
• Bivariate Analysis• Logistic Regression Model
Statistical analysis conducted by Dr. Robert Balshaw, Ph.D.

Table 1 (Listed by p-values in bivariate analysis)
Attribute p-value Number of
Missing Values Identified in Logistic Regression Model
Gullied < 0.0001 0 - Natural Landslides Present < 0.0001 0 Y Slope Profile <0.0001 0 Y Natural Drainage Classification 0.0001 0 Y Drainage Basin Size 0.0006 0 - Road Status 0.0007 0 - Surficial Material 0.0031 0 - Aspect 0.0048 0 - Rock Fill 0.027 5 - Perched Fill Height 0.07 6 Y Natural Slope Gradient Down 0.11 4 - Difference in Slope Gradient (Perched Fill – Average Fill Slope)
0.17
4 -
Cracks in Fill 0.2 7 Y Ditch Condition 0.21 12 Y Bedrock 0.29 0 - Average Fill Slope Gradient 0.43 4 Y

Table 1 (Listed by p-values in bivariate analysis)
Attribute p-value Number of
Missing Values Identified in Logistic Regression Model
Flow Accumulation (Concentration) 0.45 4 - Log of Flow Accumulation 0.45 4 - Perched Fill Slope Gradient 0.7 60 - Wood in the Fill 0.7 3 - Watershed 0.75 0 - Natural Slope Gradient Up 0.78 4 - Road Width 0.84 8 - Fill Width 1 21 -
The bivariate analysis compares the site type (landslide or null) to the various terrain and road attributes, one at a time. The p-value can be thought of as the probability that there is no association of the attribute with landslide activity (i.e. probability that the events are random)

Exploratory Classification Tree from Logistic Regression Model
Natural Landslides
Yes 2N/14LNo (113)
Slope Profile
Concave or Convex 55N/6L
Escarpment or Straight (52)
Perch Height >2.15 m 2N/8L
<2.15 m (42)
Ditch Condition
Poor or None (32)
Good or Acceptable
10N/0L
Drainage Class
Moderate or imperfect
2N/5L
Rapid or Well 18N/7L

Natural Instability
Sites Located within Polygons Mapped as having Natural Landslides
0%
10%
20%
30%
40%
50%
60%
70%
80%
90%
100%
No Landslides Landslides
Per
cen
tag
e o
f S
ites
Road Fill Landslide
Null Sites

Slope profile
Road Fill Landslide Association with Terrain Slope Profile
0%10%20%30%40%50%60%70%
Escarpment Straight Convex Concave
Perc
enta
ge o
f Site
s
Landslide
Null Site

Perch height
Distribution of Heights of Perched Fill
0%
5%
10%
15%
20%
25%
30%
35%
40%
45%
50%
1 2 3 4 5 6 >6
Perch Slope Height (m)
Per
cen
tag
e o
f S
ites
Landslide
Null Site

Ditch condition
Ditch Condition
0%
10%
20%
30%
40%
50%
60%
70%
Good-Acceptable Poor No Ditch
Pe
rce
nta
ge
of
Sit
es
Road Fill Landslide
Null Site

Drainage class
Drainage Class Comparison
0%
10%
20%
30%
40%
50%
60%
70%
imperfect moderate well rapid
Drainage Class (Canadian Soil Classification System)
Per
cen
tag
e o
f S
ites
Road Fill Landslide
Null Sites

WHAT DID NOT
WORK?
Airphoto 60 Kleanza River

Although there can be many factors that give rise to landslide activity, there is only one trigger (Wieczorek, 1996).
This means that although many factors may contribute to a landslide, only one factor causes
the slope to fail.

Landslide triggers can be grouped into one of four categories:
1. Increased loading on the slope
2. Removal of material from the toe of the slope
3. Vibration loading (such as earth-quake or man-caused vibration)
4. Increased pore water pressure

Slide trigger
Triggers of Road Fill Landslides
0
2
4
6
8
10
12
14
16
18
StreamDiversion
Existing DitchDiversion
Road SurfaceDiversion
BlockedCulvert or X-
Ditch
ConcentratedDitch Flows
Existing DitchAvulsion
BlockedSeepage
CutslopeInstability
Loading Fill
Nu
mb
er
of
La
nd
sli
de
Sit
es

Blocked Seepage
Creek flowing out of bedrock near original toe of fill

WHAT DID NOT WORK?
Road Drainage Systems

WHY?
• Inappropriate location of culverts• Inadequate number and in some cases size of
culverts• Inadequate culverts maintenance• Lack of maintenance• Lack of deactivation• Concentration of surface and seepage water flows• Inadequate ditching and ditch maintenance• Inadequate control of seepage water

CAN THIS BE IMPROVED?
YES
Existing legislation requires the maintenance of natural surface water flow paths. This has gone a long way to reducing the incidence of all landslide activity within the forest land base.

HOWEVER
Detailed assessments and planning of road drainage systems is typically limited to terrain class IV and V (potentially unstable and unstable terrain)
and
Drainage issues on moderate to gentle terrain and on non-status roads and trails continue to contribute to landslide activity downslope of these areas

THEREFORE:
Detailed assessments of development related impacts on natural site drainage should be conducted upslope of all moderately steep to steep slopes or potentially unstable and unstable slopes

WHAT DID WORK?
• Over 80% of all sites (landslide and null site) incorporated wood material into the road construction
• Statistically, there is a 70% probability that the simple presence or absence of wood in fill has no influence on fillslope landslide activity

Forest Roads: A Synthesis of Scientific Information
“Little is documented about the potential for increased mass failures from roads resulting from decay of buried organic material that has been incorporated into road fills or landings during road building. Anecdotal evidence is abundant that failures occur predictably after decay of the organic material.” Gucinski et al, (2001) states:

Is this really an issue?

Wood in fill
Wood in Road Fill Slope
0%
10%
20%
30%
40%
50%
60%
70%
80%
90%
Per
cen
tag
e o
f S
ites
Road Fill LandslideNull Site

Is this an Issue?

Cracks
Presence or Absence of Cracks in Fill at Road Surface
35%
65%
47%
53%
0%
10%
20%
30%
40%
50%
60%
70%
Cracks Present No CracksCracks in Fill
Per
cen
tag
e o
f S
ites
Road Fill Landslides
Null Site

Observation
The failure plane of all the landslides noted in this study was either within the C horizon soils or along the bedrock surface.
No failure planes were noted within the fill materials
In other words, the native soils beneath the fill failed.

Sample cross-section 1Failure Plane in C horizon
soils not in fill

Fillslope Stability Analysis
• Parametric Study to look at:– Influence of location of perch fill – Height of perch fill– Influence of pore water pressures– Weight (density) of fill– Influence of soil matrix suction

Base Case Model
Base Case Model

Upper slope perched
Mid slope perched
Lower slope perched
Comparative Model Used For
Existing Fillslope Stability

RESULTS OF LIMIT EQUILIBRIUM ANALYSES OF SLOPE STABILITY
Influence of the location of the perch fill and height of perch fillCASE Factor of
Safety*, Dry
Change from Base (Case%)
Factor of Safety*, Wet
(0.6m thick)
Change from Base
Case (%)
Base Geometry (1.5m high) 1.14 N/A 1.00 -12 (dry)
Perched Fill at Toe, 1.5m high 1.14 0 0.99 -13 (dry)
Perched Fill at Mid-slope, 1.5m high 1.13 -1 0.95 -17 (dry)
Perched Fill at Top, 1.5m high 1.12 -2 0.91 -20 (dry)
Base Geometry (3.0m high) 1.07 N/A 0.98 -8 (dry)
Perched Fill at Toe, 3.0m high 1.07 0 1.00 -7 (dry)
Perched Fill at Mid-slope, 3.0m high 1.03 -4 0.94 -12 (dry)
Perched Fill at Top, 3.0m high 1.01 -6 0.88 -18 (dry)

Conclusion
• Location of perch on slope has little influence on the stability for shallow fills
• Location of perch on slope has greater influence on stability for deeper fills
• Influence of water has an order of magnitude greater influence

Light Weight Fill Stability
Model115% fillslope angle

RESULTS OF LIMIT EQUILIBRIUM ANALYSES OF SLOPE STABILITY
Influence of Density of Fill on Slope Stability
CASE Factor of Safety*,
Dry
Change from Base (Case%)
Factor of Safety*, Wet
(0.6m thick)
Change from Base
Case (%)
Fill with steepened face (115%), base geometry
- - 0.99 N/A
Light weight fill near steep portion of shear
- - 1.00 +1 (wet)
Light weight fill downslope of shoulder of road
- - 0.98 -1 (wet)
All wood fill near steep portion of shear
- - 1.02 +3 (wet)
Bulk density of lightweight fill varied from about 15.5kN/m3 to 8.5kN/m3

Conclusion
• Reducing the density of the fill has little influence on the stability of the slope
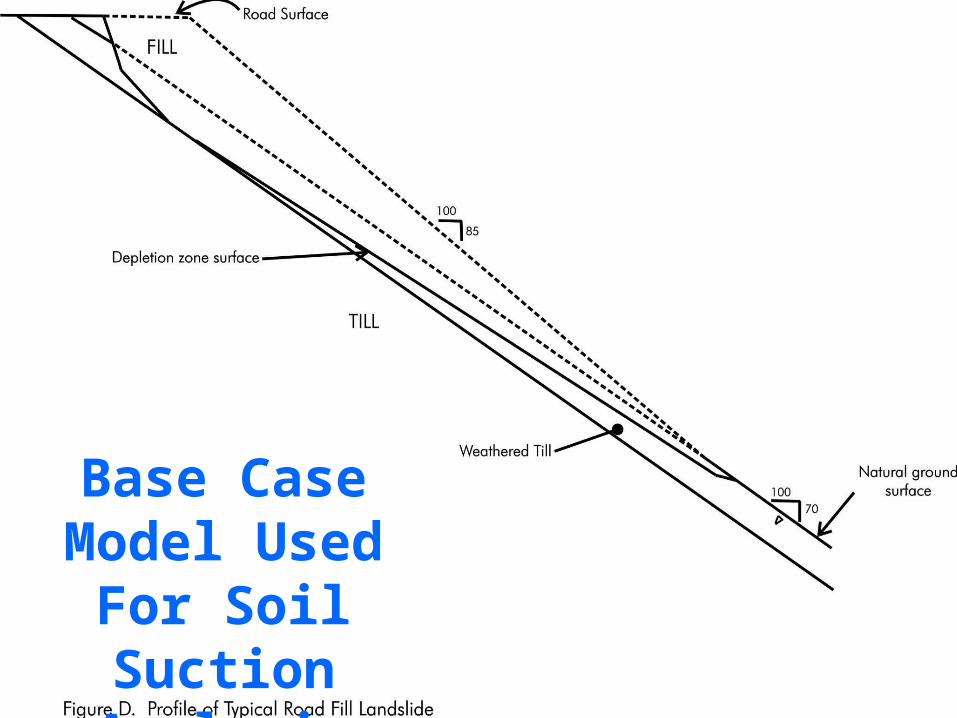
Base Case Model
Base Case Model Used For Soil
Suction Analysis

RESULTS OF LIMIT EQUILIBRIUM ANALYSES OF SLOPE STABILITY
Influence of Soil Suction
CASE Factor of Safety*,
Dry
Change from Base (Case%)
Factor of Safety*, Wet
(0.6m thick)
Change from Base
Case (%)
Base Geometry (1.5m high) 1.14 N/A 1.00 -12 (dry)
Base Geometry (1.5m high) with soil suction = 10 kPa
1.27 +11 - -
Base Geometry (1.5m high) with soil suction = 20 kPa
1.40 +23 - -
Base Geometry (1.5m high) with soil suction = 30 kPa
1.53 +34 - -

Conclusion
• Soil suction can have a significant increase in the stability of the slope

Summary of Stability Analysis
• Modest perch fill height are not a significant factor
• Perch location on slope not an issue unless the perch height is high
• Pore water pressures are a significant factor in stability
• Density of fill material has little influence on stability
• Soil suction is a significant factor in the stability of unsaturated slopes

Reinforced Soil Structures
The past use of wood in forest road can be considered as a reinforced soil structure as woody material was often included in the road fills
In some cases, the woody material was included as layers known as puncheon

Our study looked back several decades
Take a brief look back a millennium or more

HISTORICALLY
• Dykes throughout the Netherlands and England were built using reeds to reinforce the soil
• Portions of the Great Wall of China were built using fine woody debris (twigs) to reinforce sand and gravel fill (200 B.C.)
• The ancient Mesopotamians (modern day Iraq) built ziggurats (towers up to 100m high, over 3000 years ago), using mats constructed of woven layers of palm fronds to reinforce granular soils

Great Wall
Section of Great Wall of China built 200 B.C.

CURRENT REINFORCED SOIL STRUCTURES
Currently, steel and plastics (geotextiles and geogrids) are most commonly used to constructed reinforced soil structures
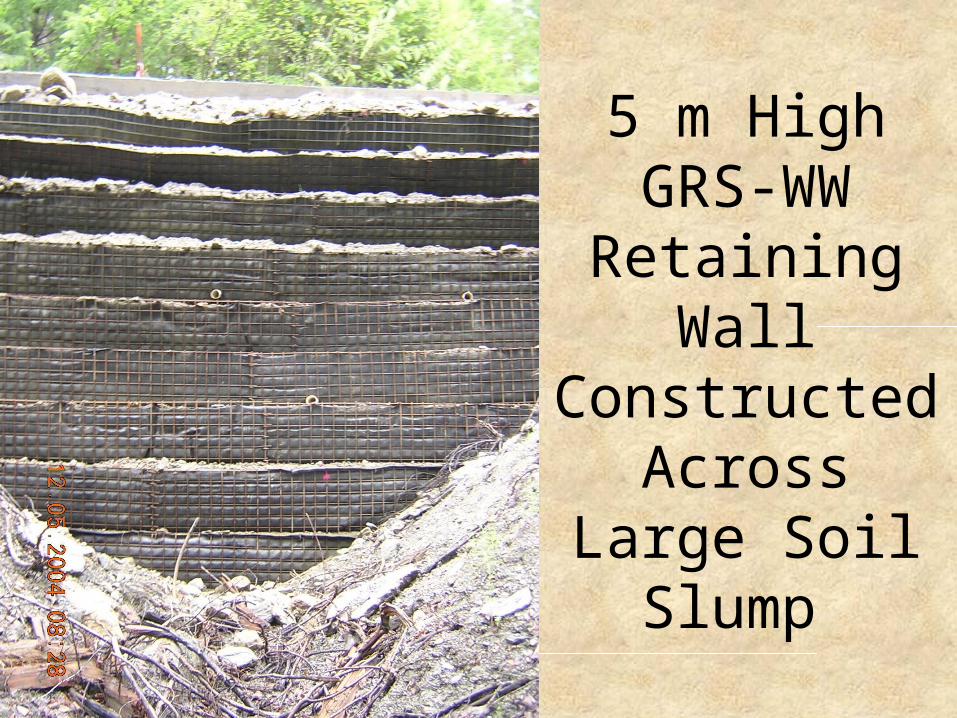
5 m High GRS-WW Retaining
Wall Constructed
Across Large Soil Slump

4.7 m High GRS-WW
Retaining Wall Constructed Across Very
Steep Bedrock Slope

2.8 m High Wall
Constructed Across Steeply sloping
Glaciofluvial Escarpment

4 m High Retaining
Wall Constructed
Across Steeply Sloping
Bedrock and Talus

HOW CAN WE BUILD UPON IT?
1. Use state of the art knowledge of the behaviour of Reinforced Soil;
2. Consider the past performance of wood supported forest road fills;
3. A healthy respect for the influence of surface and subsurface water on fillslope landslides;
4. Modern road building equipment capabilities; and
5. Team work approach

Design and Construction of Forest Roads Across Moderately
Steep to Steep Slopes
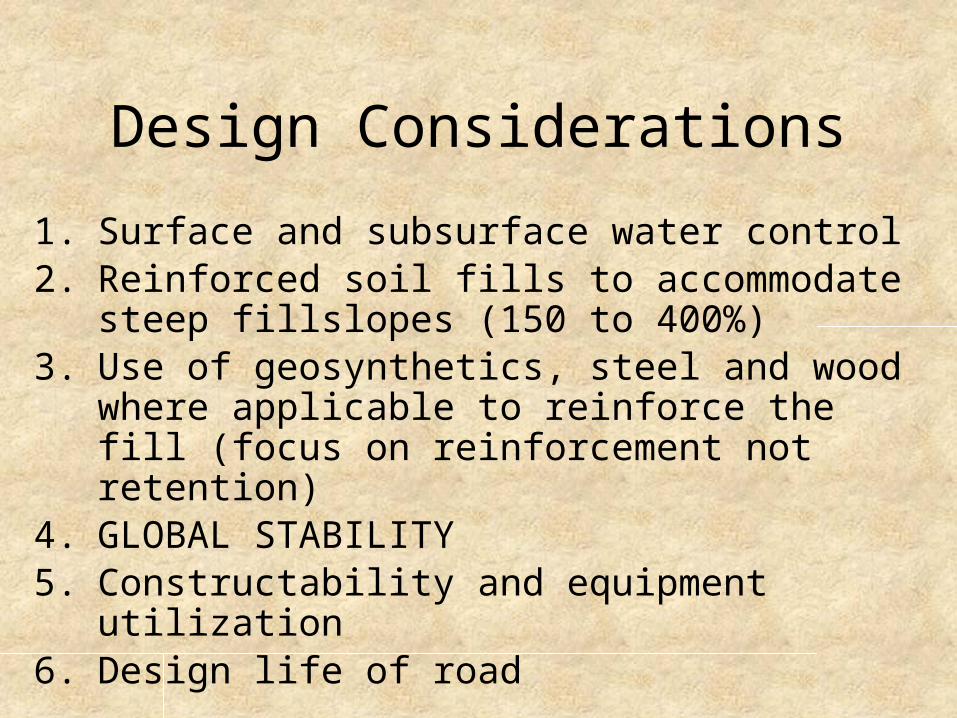
Design Considerations
1. Surface and subsurface water control2. Reinforced soil fills to accommodate steep fillslopes
(150 to 400%)3. Use of geosynthetics, steel and wood where applicable
to reinforce the fill (focus on reinforcement not retention)
4. GLOBAL STABILITY5. Constructability and equipment utilization6. Design life of road

Internal Stability

External Stability

Forest Road Design Limitations
Based on Assumed Site Conditions with very limited
subsurface data
therefore

Construction
1. Construct in accordance with the intent of the critical design details
2. Confirmation of actual site conditions is required during construction
3. Some design and construction details are likely to change as a result of the knowledge of the actual site conditions
4. Flexibility required in construction and design to facilitate changes required to suit actual site conditions

Possible Design Cross-Section Sketch
Horizontally Continuous Layers of
wood reinforcement
(puncheon)
Original ground surface
Cutslope
Subdrain
Wood Reinforced Soil
Geosynthetic ReinforcementWell
Compacted Mineral Soil
Fill

Reinforced Fillslope Model
FoS = 1.25 with out consideration for soil suction

QUESTIONS
Can the incidence of road fillslope landslides be reduced?YESCan forest road construction practises be improved and/or economized?YESCan both be done at the same time?YES

Further Studies
• Extend similar research into other geographic areas• Conduct research into the effects of root generated
soil matric suction

THE BEGINNING
Thank you

RESULTS OF LIMIT EQUILIBRIUM ANALYSES OF SLOPE STABILITY
CASE Factor of Safety*,
Dry
Change from Base (Case
%)
Factor of Safety*, Wet (0.6m thick)
Change from Base Case (%)
Base Geometry (1.5m high) 1.14 N/A 1.00 -12 (dry)
Perched Fill at Toe, 1.5m high 1.14 0 0.99 -13 (dry)
Perched Fill at Mid-slope, 1.5m high 1.13 -1 0.95 -17 (dry)
Perched Fill at Top, 1.5m high 1.12 -2 0.91 -20 (dry)
Base Geometry (3.0m high) 1.07 N/A 0.98 -8 (dry)
Perched Fill at Toe, 3.0m high 1.07 0 1.00 -7 (dry)
Perched Fill at Mid-slope, 3.0m high 1.03 -4 0.94 -12 (dry)
Perched Fill at Top, 3.0m high 1.01 -6 0.88 -18 (dry)
Fill with steepened face (115%), base geometry - - 0.99 N/A
Light weight fill near steep portion of shear - - 1.00 +1 (wet)
Light weight fill downslope of shoulder of road - - 0.98 -1 (wet)
All wood fill near steep portion of shear - - 1.02 +3 (wet)
Base Geometry (1.5m high) with soil suction = 10 kPa 1.27 +11 - -
Base Geometry (1.5m high) with soil suction = 20 kPa 1.40 +23 - -
Base Geometry (1.5m high) with soil suction = 30 kPa 1.53 +34 - -
Wood-reinforced fill extended into till 1.25 +10 1.13 +13 (wet)
As above, with gravel native foundation - - 1.06 + (wet)
Native, undisturbed slope 1.12 - 0.62 -
As above, water level 0.1m above unweathered till - - 1.00 -
*Factors of safety are for comparison only, to illustrate trends. The absolute values are not critical. Wet condition assumes a ground water level 0.6m above the surface of the unweathered till.