Embed Size (px)
Citation preview
energies
Article
Techno-Economic Analysis (TEA) of DifferentPretreatment and Product Separation Technologies forCellulosic Butanol Production from Oil Palm Frond
Nazira Mahmud 1,2 and Kurt A. Rosentrater 1,*1 Department of Agricultural and Biosystems Engineering, Iowa State University, Elings Hall, Ames, IA 50011,
USA; [email protected] or [email protected] Faculty of Industrial Sciences and Technology, University Malaysia Pahang, Lebuhraya Tun Razak,
Kuantan 26300, Malaysia* Correspondence: [email protected]; Tel.: +1-515-294-4019
Received: 27 November 2019; Accepted: 27 December 2019; Published: 1 January 2020�����������������
Abstract: Among the driving factors for the high production cost of cellulosic butanol lies thepretreatment and product separation sections, which often demand high amounts of energy, chemicals,and water. In this study, techno-economic analysis of several pretreatments and product separationtechnologies were conducted and compared. Among the pretreatment technologies evaluated,low-moisture anhydrous ammonia (LMAA) pretreatment has shown notable potential with apretreatment cost of $0.16/L butanol. Other pretreatment technologies evaluated were autohydrolysis,soaking in aqueous ammonia (SAA), and soaking in sodium hydroxide solution (NaOH) withpretreatment costs of $1.98/L, $3.77/L, and $0.61/L, respectively. Evaluation of different productseparation technologies for acetone-butanol-ethanol (ABE) fermentation process have shown that insitu stripping has the lowest separation cost, which was $0.21/L. Other product separation technologiestested were dual extraction, adsorption, and membrane pervaporation, with the separation costs of$0.38/L, $2.25/L, and $0.45/L, respectively. The evaluations have shown that production of cellulosicbutanol using combined LMAA pretreatment and in situ stripping or with dual extraction recordedamong the lowest butanol production cost. However, dual extraction model has a total solventproductivity of approximately 6% higher than those of in situ stripping model.
Keywords: ABE fermentation; LMAA pretreatment; techno-economic analysis; cellulosic butanol
1. Introduction
The potential of large-scale cellulosic butanol production is limited by the low efficiency ofthe pretreatment process as well as the extensive downstream processing requirement. Studieshave revealed both operations as potentially driving the production cost of cellulosic butanol [1–4].Pretreatment is essential to reduce the recalcitrant structure of lignocellulosic materials and thereforeresults in better sugar yield after the enzyme hydrolysis process [5]. Nevertheless, the process oftenrequires harsh processing conditions (high temperature and pressure) as well as a high amount ofchemical and water [6], which makes it unfeasible for commercial application.
Similarly, downstream processing in biobutanol production also entails considerable cost becauseof low productivity of the fermentation process (acetone-butanol-ethanol (ABE) fermentation) due to thetoxic and inhibition effect given by the fermentation products to the microorganisms used. The knownapproach, capable of solving this problem, is to use the inline separation method which reduces theproduct concentration in the fermentation broth through the external loop (also called slipstream) ofcell separation and recycling throughout the fermentation [7,8]. A more efficient approach is the in
Energies 2020, 13, 181; doi:10.3390/en13010181 www.mdpi.com/journal/energies
Energies 2020, 13, 181 2 of 26
situ product separation process, which enables the product to be separated and removed from thefermentation system as soon as it is produced, avoiding microorganism inhibition.
Inline and in situ product separation methods have successfully increased ABE productionfrom the concentration of <2 wt.% to 46 wt.% [9]. Several potential product separation approachesemploying different principles including membrane-based, gas–liquid equilibrium, and liquid–liquidequilibrium are investigated in this study, which includes integrated fermentation–membranepervaporation, integrated fermentation–adsorption technology, extractive fermentation, and integratedfermentation–in situ gas stripping [10]. Among the appealing characteristics of these approaches is thelow energy requirement associated with the process through the application of mild reaction conditionscompared to the conventional separation method (distillation), which is a crucial consideration whendesigning an industrial-scale separation process.
Various pretreatment and product separation approaches were developed to solve the problem.Researchers have been highlighting the issue of the current technologies and discussing the potentialmanipulation that could be conducted in terms of design, technical, and process parameters to achieveoptimum separation from the selected process. For example, reducing total liquid requirement in apretreatment process, controlling bubble size in the gas stripping process, searching for novel extractantand design improvement using membrane for solvent extraction process, development of stableadsorbent for adsorption process, and substitution of sweep gas by low vapor pressure for pervaporationprocess, as well as better preconditioning step prior to each mentioned technology [5,7,8,11–14] haveall been considered.
For commercial application, optimum performance must not be attenuated by adverse economicfeatures. Other than capital cost, operating cost that involves mainly the energy cost is an important costfactor of a process. Previous work has revealed that conducting a separation at a higher temperaturewould likely increase its rate; however, it will also likely increase the cost of operation and harm the cellfor an in situ separation approach [4]. Other expenditures such as purchasing the extractant, adsorbent,solvent, or other required chemical are similarly crucial in choosing a process for a commercialapplication. It is related to the loss that might be incurred, which will require many years for aproduction plant to break even. Hence, techno-economic analysis (TEA) of these processes is anessential key factor in determining the best method.
Between steam explosion, dilute sulfuric acid, ammonia fiber explosion (AFEX), and biologicalpretreatment, Baral & Shah [15] concluded that steam explosion and dilute sulfuric acid pretreatmentrequire the least cost mainly because of the high productivity of the process at low capital and energyrequirement. AFEX pretreatment, although recording higher productivity, also required higher energy,therefore has a higher cost. It indicates that other than having a high amount of exposed carbohydrateafter the pretreatment, the total energy required for the process was equally important. Also, a highcapital process would only be feasible if the yield is high enough to compensate for the cost. This studyfocused on low-moisture anhydrous ammonia (LMAA) pretreatment, a process with potentially lowenergy, chemical, and liquid requirement, as well as production of no inhibitory compounds [16,17].Several other pretreatments including alkali pretreatment were chosen to serve as a comparison forLMAA pretreatment.
Díaz & Tost [18] has compared the extraction-based product separation method for biobutanolproduction. They found that extractive fermentation had significantly lower production cost thanthose of separate extraction systems, primarily due to the extensive requirement of high-pressuresteam in the external extraction. Nevertheless, to model extractive fermentation is a challenge due tothe complexity of the reaction. Therefore, work on the separate extraction approach is continued usingvarious novel solvents in varying set-ups and the application of an on-site steam-generation systemwhich would likely reduce the economic effect of high steam cost. For the adsorption process, Qureshiet al. [19] concluded that silicalite adsorbent possesses significant attraction over activated carbon(AC) adsorbent due to complete desorption of the products. Further study by Abdehagh et al. [20]concluded the contrary, where AC adsorbent was better than silicalite in terms of adsorption rate,
Energies 2020, 13, 181 3 of 26
adsorption capacity, and selectivity towards butanol. Their subsequent study confirmed that AC F-400could achieve between 80–90% butanol desorption [21].
Recent studies on pervaporation-based product separation suggested that this process potentiallygives a better result by the development of a closed reactor–pervaporation membrane coupled system,which enables continuous in situ fermentation and product separation [22–24]. Polydimethylsiloxane(PDMS) membrane is of interest for this purpose primarily due to its stability and low price. Workson separate pervaporations showed that silicalite and silicone membranes, which were more readilyavailable, could give promising yields [25,26]. Another interesting approach in product separationfrom the fermenter is the in situ stripping process [9,27,28]. Among benefits provided by this methodwere the indirect agitation effect given by the sparged stripping gas that reduced impeller works, theuse of non-toxic separation medium, and relatively simple equipment set-up.
Several available works compared the energy performance of the product separationprocess [1,4,8,10,13]. However, researchers have agreed that direct comparison among the availableliterature is hard due to the various operating conditions and system assumptions used [18]. Despitethat, studies related to the overall economic impact on specific technologies applied in the biobutanolproduction plant are still lacking. For instance, it is not necessarily that the process with the lowestenergy consumption will have the lowest production cost if the consumables (extractant, adsorbent, andmembrane) are expensive. Therefore, in this study, techno-economic analysis of different pretreatmentand product separation technologies were conducted for butanol production from oil palm frond (OPF).
2. Materials and Methods
2.1. Software Tools
The butanol production plant simulation and cost modeling analyses were conducted usingSuperPro Designer V.9.0 (Intelligen, Inc., Scotch Plains, NJ, USA).
2.2. Techno-Economic Analysis (TEA)
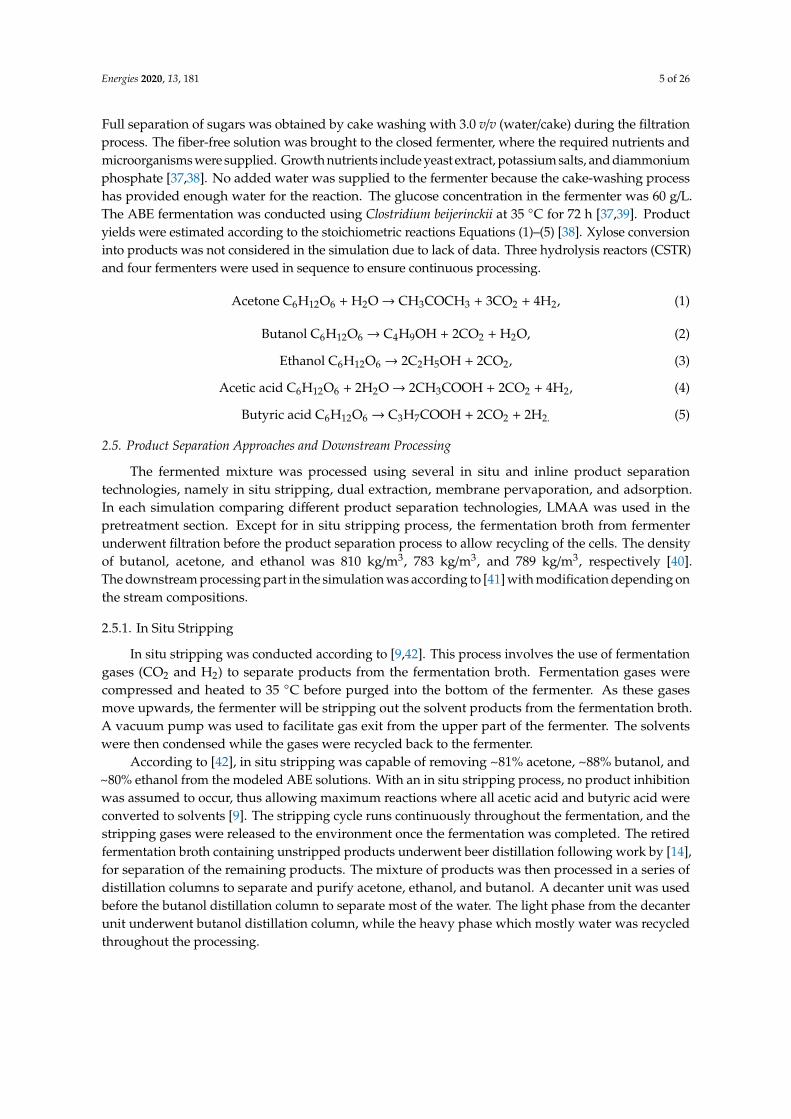
The economic evaluation of butanol production from OPF was conducted based on 95.34 × 10⁶ Lbutanol/y production plant capacity. Different pretreatment and product separation approaches weresimulated. Figure 1 highlights the pretreatment and product separation stages in the modeled cellulosicbutanol plant. All models were simulated in a continuous mode of operation with independentcycle time for most of the unit operation. It was assumed that the production plant is located inPahang, Malaysia, where approximately 732,052 hectares of oil palm plantation area are available [29].All analysis was done based on a functional unit of 1 L butanol.Energies 2020, 13, x FOR PEER REVIEW 4 of 29
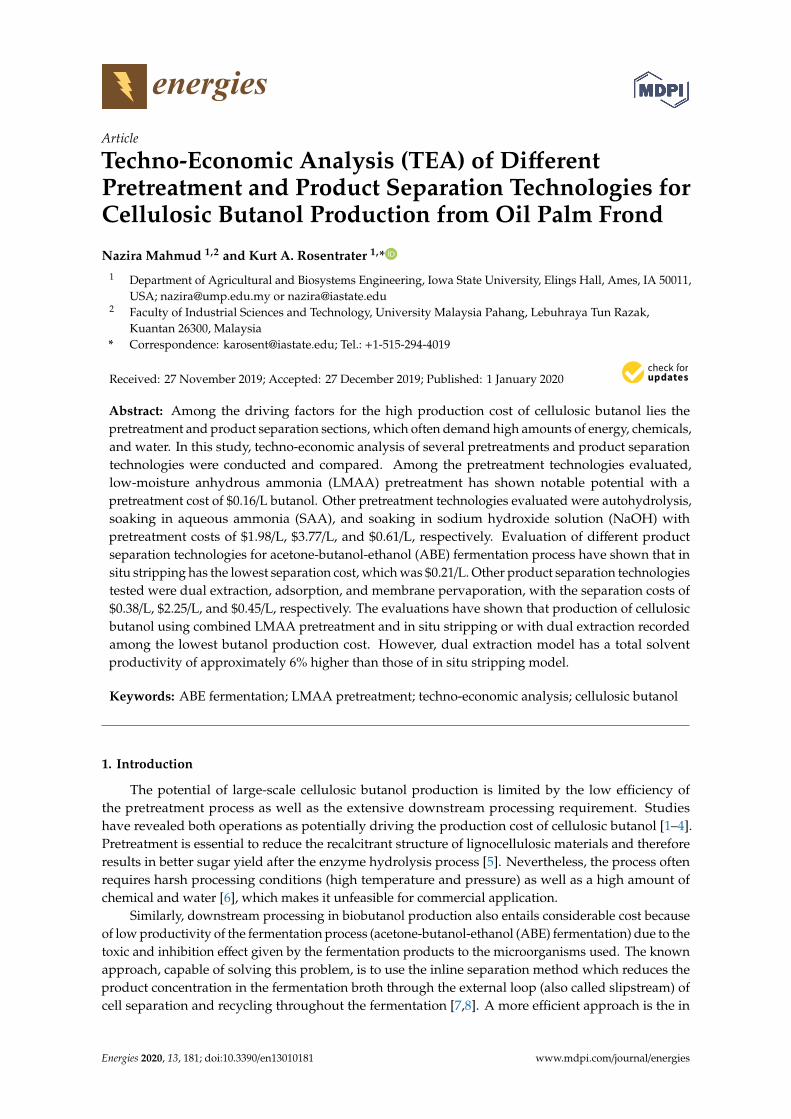
Figure 1. Major unit operations used in the SuperPro simulations. Different colored boxes denote different production stages; (R)—recycle. Note that this figure only includes major unit operations. More thorough plant set-ups were used in the simulations.
2.3. Pretreatment Approaches
The simulation was started at the point the pre-milled OPF arrived at the production facility. The OPF was assumed to have been pre-milled and cleaned by the supplier. The assumption was applied to reduce the extensive milling requirement that must be incurred by the processing plant due to the morphology of OPF. Only rough milling by hammer mill was conducted before the pretreatment process. Different pretreatment approaches were selected based on available literature on the pretreatment of OPF, which includes LMAA pretreatment, autohydrolysis pretreatment, soaking in aqueous ammonia (SAA) pretreatment, and soaking in sodium hydroxide (NaOH) pretreatment. For every pretreatment model simulated, the same enzyme hydrolysis and in situ stripping product separation processes were applied. The untreated OPF was assumed to have 51% cellulose, 17% hemicellulose, and 26% lignin.
2.3.1. Low-Moisture Anhydrous Ammonia (LMAA) Pretreatment
The moisture content of OPF was adjusted to 50% (dry basis) by mixing with water. Ammoniation was conducted by introducing 0.18 g NH3/g biomass into the reactor for 1 h, after which it was incubated at 75 °C for 24 h. All selected process parameters were from previous works and have been validated in the laboratory [30–32]. Continuous stirred tank reactors (CSTR) were used to simulate the ammoniation process, while the incubation process was simulated using heated storage tanks. A 90% recycle NH3 was achieved through a compressor unit installed at each of the ammoniation and incubation tanks [16]. The pretreatment recorded a 17.6% increase in cellulose, a 27.4% reduction in hemicellulose, and a 58.9% reduction in lignin contents.
2.3.2. Autohydrolysis Pretreatment
Autohydrolysis pretreatment was conducted according to [33]. OPF with water added at a ratio of 1:10 was heated at 121 °C and 15 psi for 1 h. CSTR was used to simulate the autohydrolysis pretreatment process, after which the OPF slurry was cooled and fed to the rotary filtration unit to reduce the water content. The process was reported to recover 75% of insoluble solids, with the total cellulose, hemicellulose, and lignin contents reduced by 1.3%, 61.9%, and 12.3%, respectively, from those of the untreated sample.
Figure 1. Major unit operations used in the SuperPro simulations. Different colored boxes denotedifferent production stages; (R)—recycle. Note that this figure only includes major unit operations.More thorough plant set-ups were used in the simulations.
Energies 2020, 13, 181 4 of 26
2.3. Pretreatment Approaches
The simulation was started at the point the pre-milled OPF arrived at the production facility.The OPF was assumed to have been pre-milled and cleaned by the supplier. The assumption was appliedto reduce the extensive milling requirement that must be incurred by the processing plant due to themorphology of OPF. Only rough milling by hammer mill was conducted before the pretreatment process.Different pretreatment approaches were selected based on available literature on the pretreatment ofOPF, which includes LMAA pretreatment, autohydrolysis pretreatment, soaking in aqueous ammonia(SAA) pretreatment, and soaking in sodium hydroxide (NaOH) pretreatment. For every pretreatmentmodel simulated, the same enzyme hydrolysis and in situ stripping product separation processes wereapplied. The untreated OPF was assumed to have 51% cellulose, 17% hemicellulose, and 26% lignin.
2.3.1. Low-Moisture Anhydrous Ammonia (LMAA) Pretreatment
The moisture content of OPF was adjusted to 50% (dry basis) by mixing with water. Ammoniationwas conducted by introducing 0.18 g NH3/g biomass into the reactor for 1 h, after which it wasincubated at 75 ◦C for 24 h. All selected process parameters were from previous works and have beenvalidated in the laboratory [30–32]. Continuous stirred tank reactors (CSTR) were used to simulatethe ammoniation process, while the incubation process was simulated using heated storage tanks.A 90% recycle NH3 was achieved through a compressor unit installed at each of the ammoniation andincubation tanks [16]. The pretreatment recorded a 17.6% increase in cellulose, a 27.4% reduction inhemicellulose, and a 58.9% reduction in lignin contents.
2.3.2. Autohydrolysis Pretreatment
Autohydrolysis pretreatment was conducted according to [33]. OPF with water added at a ratio of1:10 was heated at 121 ◦C and 15 psi for 1 h. CSTR was used to simulate the autohydrolysis pretreatmentprocess, after which the OPF slurry was cooled and fed to the rotary filtration unit to reduce thewater content. The process was reported to recover 75% of insoluble solids, with the total cellulose,hemicellulose, and lignin contents reduced by 1.3%, 61.9%, and 12.3%, respectively, from those of theuntreated sample.
2.3.3. Soaking in Aqueous Ammonia (SAA) Pretreatment
SAA pretreatment was conducted according to [34]. In a reaction tank, 7% aqueous NH3 and OPFat 1:12 (S/L ratio) were added and left to react at 80 ◦C for 20 h. CSTR was used to simulate the SAApretreatment process, after which the OPF slurry was cooled and fed to the rotary filtration unit witha water washing stream for detoxification. The process was reported to recover 81.7% of insolublesolids, with the total cellulose, hemicellulose, and lignin contents reduced by 9.4%, 31.4%, and 24.6%,respectively, from those of the untreated sample.
2.3.4. Soaking in Sodium Hydroxide (NaOH) Pretreatment
NaOH pretreatment was conducted according to [35]. OPF was soaked in 4.42% sodium hydroxide(NaOH) solution at 100 ◦C for ~1 h. CSTR was used to simulate the NaOH pretreatment process, afterwhich the OPF slurry was cooled and fed to the rotary filtration unit with a water washing stream fordetoxification. The treated OPF was reported as having an increase of 46.7% and 22.7% in celluloseand hemicellulose, respectively, as well as 30.8% decrease in lignin content.
2.4. Enzyme Hydrolysis and ABE Fermentation
The treated OPF was hydrolyzed using cellulase enzyme according to [36]. The substrateconcentration in the hydrolysis process was 15% (wt. OPF/v. water). Validation in the laboratory hasshown that glucose yield after the hydrolysis process was about 0.33 g/g treated OPF [32]. The hydrolysatemixture was separated from the fiber residue to ease the subsequent in situ product separation process.
Energies 2020, 13, 181 5 of 26
Full separation of sugars was obtained by cake washing with 3.0 v/v (water/cake) during the filtrationprocess. The fiber-free solution was brought to the closed fermenter, where the required nutrients andmicroorganisms were supplied. Growth nutrients include yeast extract, potassium salts, and diammoniumphosphate [37,38]. No added water was supplied to the fermenter because the cake-washing processhas provided enough water for the reaction. The glucose concentration in the fermenter was 60 g/L.The ABE fermentation was conducted using Clostridium beijerinckii at 35 ◦C for 72 h [37,39]. Productyields were estimated according to the stoichiometric reactions Equations (1)–(5) [38]. Xylose conversioninto products was not considered in the simulation due to lack of data. Three hydrolysis reactors (CSTR)and four fermenters were used in sequence to ensure continuous processing.
Acetone C6H12O6 + H2O→ CH3COCH3 + 3CO2 + 4H2, (1)
Butanol C6H12O6→ C4H9OH + 2CO2 + H2O, (2)
Ethanol C6H12O6→ 2C2H5OH + 2CO2, (3)
Acetic acid C6H12O6 + 2H2O→ 2CH3COOH + 2CO2 + 4H2, (4)
Butyric acid C6H12O6→ C3H7COOH + 2CO2 + 2H2. (5)
2.5. Product Separation Approaches and Downstream Processing
The fermented mixture was processed using several in situ and inline product separationtechnologies, namely in situ stripping, dual extraction, membrane pervaporation, and adsorption.In each simulation comparing different product separation technologies, LMAA was used in thepretreatment section. Except for in situ stripping process, the fermentation broth from fermenterunderwent filtration before the product separation process to allow recycling of the cells. The densityof butanol, acetone, and ethanol was 810 kg/m3, 783 kg/m3, and 789 kg/m3, respectively [40].The downstream processing part in the simulation was according to [41] with modification depending onthe stream compositions.
2.5.1. In Situ Stripping
In situ stripping was conducted according to [9,42]. This process involves the use of fermentationgases (CO2 and H2) to separate products from the fermentation broth. Fermentation gases werecompressed and heated to 35 ◦C before purged into the bottom of the fermenter. As these gasesmove upwards, the fermenter will be stripping out the solvent products from the fermentation broth.A vacuum pump was used to facilitate gas exit from the upper part of the fermenter. The solventswere then condensed while the gases were recycled back to the fermenter.
According to [42], in situ stripping was capable of removing ~81% acetone, ~88% butanol, and~80% ethanol from the modeled ABE solutions. With an in situ stripping process, no product inhibitionwas assumed to occur, thus allowing maximum reactions where all acetic acid and butyric acid wereconverted to solvents [9]. The stripping cycle runs continuously throughout the fermentation, and thestripping gases were released to the environment once the fermentation was completed. The retiredfermentation broth containing unstripped products underwent beer distillation following work by [14],for separation of the remaining products. The mixture of products was then processed in a series ofdistillation columns to separate and purify acetone, ethanol, and butanol. A decanter unit was usedbefore the butanol distillation column to separate most of the water. The light phase from the decanterunit underwent butanol distillation column, while the heavy phase which mostly water was recycledthroughout the processing.
Energies 2020, 13, 181 6 of 26
2.5.2. Dual Extraction
This process was selected due to its simplicity and straightforward simulation approach.Although [18] reported the high cost of high-pressure steam associated with this process, employmentof the combined heat and power (CHP) system in this study would considerably reduce the cost.The simulation was conducted according to [3]. The fermentation broth was entering extraction-1where most of the acetone, butanol, and ethanol will be separated. The organic stream proceeds to theregeneration column to recover the extractant-1. The aqueous phase from extraction-1 proceeded toextraction-2, where the remaining extractant-1 was removed before recycling the broth back to thefermenter. Both extraction processes were conducted at 37 ◦C and 1 bar.
Extractants used were 2-methyl-1-hexanol (non-biocompatible) and cyclopentane (biocompatible)for extraction-1 and extraction-2, respectively. The distribution coefficients for water, acetone, butanol,ethanol, acetic acid, butyric acid, and 2-methyl-1-hexanol in extractant-1 were 0.06, 2.45, 12.6, 3.89, 0.94,10.2, and 150, respectively. The distribution coefficients for water, acetone, butanol, ethanol, acetic acid,butyric acid, 2-methyl-1-hexanol, and cyclopentane in extractant-2 were 0.0002, 0.37, 1.47, 1.00, 0.15,0.79, 664, and 8313, respectively. The mixture of products from the regeneration column underwentdistillation where lowest boiling-point components (acetone and ethanol) were separated from thebutanol–water mixture. The acetone–ethanol mixture then underwent distillation to purify both theacetone and ethanol. Because of high water content in the water–butanol mixture, a decanter was usedto generate phase 2 in which the lighter phase (butanol) proceeded to distillation for purification.
2.5.3. Adsorption
ABE fermentation product separation using adsorption technology was based on work from [21,43].AC F-400 was used as the adsorbent. Fermentation broth from the fermenter underwent filtrationto allow recycling of the cell. The cell-free mixture was loaded into the adsorption column which isselective towards butanol and acetone. An optimistic condition was assumed (99% recovery). Hot air(150 ◦C) was purged into the adsorption column to desorb the acetone and butanol, and regenerate theadsorbent. The stripped air containing acetone and butanol was condensed before going through aseries of distillations. Column equilibration was conducted using water at room temperature before thenext cycle of the adsorption process. The butanol- and acetone-depleted solution from the adsorptioncolumn proceeded to the ethanol distillation.
2.5.4. Membrane Pervaporation
The external pervaporation (PV) process was simulated following work from [26]. A siliconemembrane was used with the assumed shelf-life of 100 cycles. The product-containing fermentationbroth was heated to 80 ◦C before being fed to the PV unit. The silicone membrane was reportedto be able to separate acetone, butanol, ethanol, butyric acid, and acetic acid from the fermentationbroth with varied selectivities [26]. In this simulation, an optimistic condition was assumed on the PVmembrane, where it could achieve ~99% separation efficiency for all products. Compressed air wasintroduced to remove diffused products from the membrane surface. The product-free broth was thenrecycled to the fermenter. The mixture of products was processed in a series of distillation columns toseparate and purify acetone, ethanol, and butanol.
2.6. Power, Heating, and Cooling Requirement
The remaining lignin and other solid residues (undigested cellulose and hemicellulose) separatedfrom the fermentable sugar after enzyme hydrolysis were used as a fuel for the CHP generationsystem. It was dried to approximately 10% moisture content before fed to the CHP system. The CHP
Energies 2020, 13, 181 7 of 26
system was also supplemented with natural gas because burning only waste fibers did not generateenough steam for the entire production plant. The actual Rankine Cycle consisting of a boiler unit,and a multistage steam turbine was used and simulated using SuperPro built-in expansion models.The generator was assumed to be 90% efficient.
The compositions of the waste fibers were lignin (~18%), undigested cellulose (~58%),hemicellulose (~11%), and the rest were moisture and ash. The elemental compositions for lignin,cellulose, hemicellulose, and natural gas used in the simulation were summarized in Table 1. Air andwater at a pressure of 1 bar and 11 bar, respectively, and atmospheric temperature entered the boiler ata rate calculated by the software. The generated high-pressure and high-temperature steam (45 bar,257.44 ◦C) was expanded in a multistage steam turbine to produce electricity as well as steam withspecific pressures. The cooling and chilled water requirement for the process were fulfilled by theon-site cooling tower and electric cooling, respectively.
Table 1. Elemental compositions of fuels used for the boiler.
Elements Lignin (%) [44] Cellulose (%) [45] Hemicellulose (%) [45] Natural Gas (%) [46]
Carbon 58.45 44.40 45.50 75.85Hydrogen 6.80 6.20 6.10 24.15Nitrogen 1.12 - - -Oxygen 33.63 49.40 48.40 -
2.7. Sensitivity Analysis
The sensitivity of selected processes at ±20% parameter values were conducted to addressany possibility for uncertainty. Among parameters included were costs of pretreatment agents,membrane cost (pervaporation), extractant cost (dual extraction), the presence of xylose, hydrolysisyield, pretreatment yield, and land cost. For the presence of xylose, 20% xylose content was assumed tobe obtained from the conversion of hemicellulose that was recovered after each pretreatment process.Only those simulations with promising butanol production cost (less than $2.50/L) were subjected tothis study. Sensitivity analysis was also conducted on the profit of the simulated plant. The biobutanolselling price of $1.73/kg was applied [47].
2.8. Assumptions and Limitations of the Study
The techno-economic analysis was conducted with the assumption that the plant was built inMalaysia (location factor, LF = 1.14) [48]. Capital expenditures (CapEx), operating expenditures(OpEx), and production costs per unit of butanol were calculated based on assumptions in Table 2.Based on the level of detail of the modeled plant, small equipment that were not considered explicitlywere assumed to be 10% and 20% from the equipment purchased cost for upstream and downstreamprocessing stages, respectively [49]. Professional and management labor costs were not included inthe assessment.
No heat loss, leakage, or any accidents were assumed to happen throughout the processingyear. Transportation cost was not included in the assessment. The C. beijerinckii was cultivated andmaintained in the plant facility, thus purchase cost was not included. Nutrient costs were assumed at$200/t each. Water was recycled throughout the production. Wastewater treatment cost, which mightalso include the neutralization process, was assumed to be $0.53/m3 [49]. By-product credit of $1.04/Lethanol price and $1.28/kg acetone price, and butanol price of $1.73/kg were applied [47]. Table 3summarizes other assumptions used in the study. Costs for OPF and utilities were with reference tothe prices in Malaysia, considering an exchange rate of $1.00 = MYR 4.10 (January 2018).
Energies 2020, 13, 181 8 of 26
Table 2. Key assumptions used for the techno-economic analysis, adapted from [49,50].
Capital Cost
Installation 39% × EpInstrument and Control 26% × Ep
Piping 10% × EpElectrical System 31% × Ep
Building 29% × EpYard Improvement 12% × Ep
Service 55% × Ep
Total Installed Equipment Cost (TIEC)
Engineering 32% × EpConstruction 34% × Ep
Legal and Contractor Fees 23% × Ep
Total Indirect Cost (TIC)
Contingency 10% × (TIEC + TIC)Fixed Capital Investment (FCI) (TIEC + TIC + contingency) × LF
Working Capital (WC) 15% × FCILand 6% × Ep
Total Project Investment (TPI) FCI + WC + Land
Operating Cost
Maintenance and Repairs 1% × TPIMaterials Unit cost of each materials × Total unit used
Labor Cost Wage rate × No. of operator ×Working hoursUtilities Electricity cost + Heat cost + Cooling cost
Total Direct Operating Cost
Overhead 50% × (labor + maintenance and repairs)Taxes 2% × TPI
Insurance 0.46% × TPIDepreciation (D) Straight line
Total Indirect Operating Cost
Salvage 15%Capital Charges (CC) TPI × i(1 + i)n/((1 + i)n
− 1)Annual Operating Cost Total direct and indirect operating cost + CC + D
By-Product Credit Amount by-product generated × Unit selling priceNet Annual Operating Cost Annual operating cost—By-product credit
Unit Production Cost Net annual operating cost/annual product
Ep = equipment purchased cost; LF = location factor; Total direct operating cost = all variable operating cost; Total indirectoperating cost = all fixed operating cost; i = annual interest rate of the loan; n = loan payment period.
Table 3. Other assumptions used for the techno-economic analysis.
Assumptions
Annual Working Hours 7920OPF Price $0.032/kg [51]
Cellulase Price $5/kg [38]Ammonia Solution Price $300/t [38]
Anhydrous Ammonia Price $512/t [52]Sodium Hydroxide Price $450/t [53]2-Methyl-1-Hexanol Price ~$1900/t [3] *
Cyclopentane Price ~$1150/t [3] *Activated Carbon Price $2000/t [54]
Silicone Membrane Price $250/m2
Electricity Price (to grid) $0.08/kWh [55]Water Price $0.21/m3 [56]
Natural Gas Price $0.004/ft3
Annual Interest Rate 0.08% [57]Operator Wage Rate $2.26/h [58]
Interest Year 20 yEquipment Lifetime 20 y
* Currency exchange—1 GBP = 1.27 USD (January 2018).
Energies 2020, 13, 181 9 of 26
3. Results and Discussions
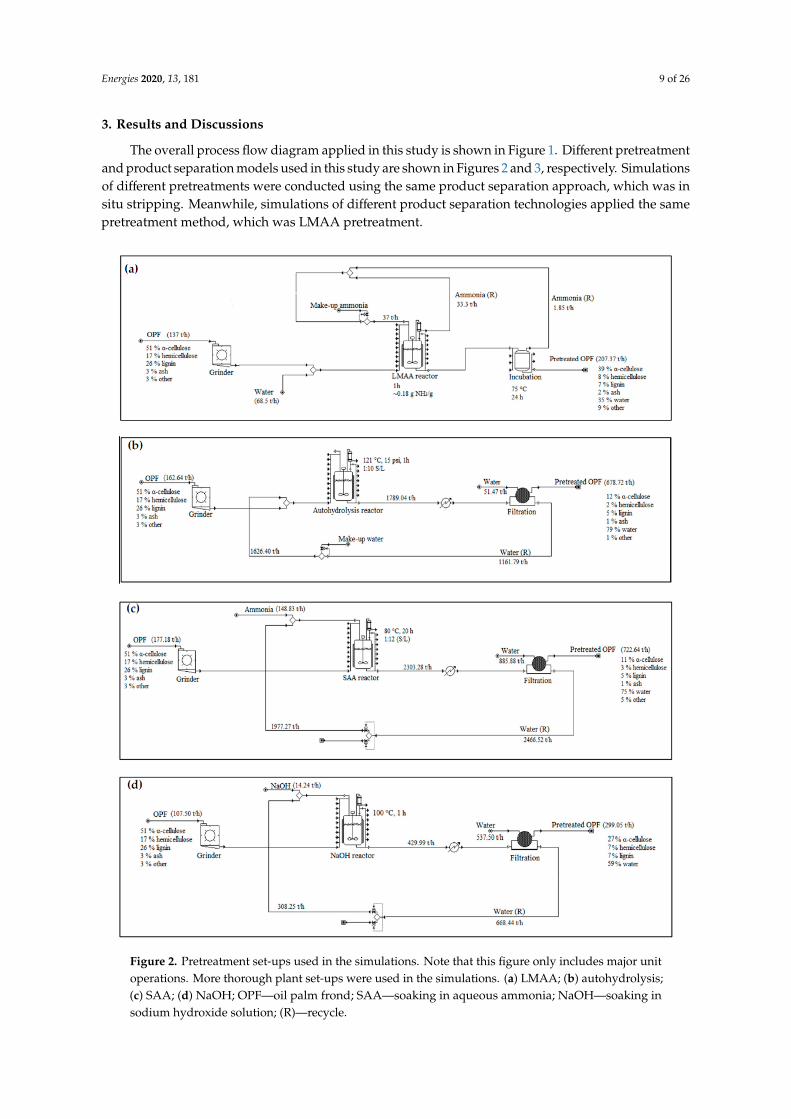
The overall process flow diagram applied in this study is shown in Figure 1. Different pretreatmentand product separation models used in this study are shown in Figures 2 and 3, respectively. Simulationsof different pretreatments were conducted using the same product separation approach, which was insitu stripping. Meanwhile, simulations of different product separation technologies applied the samepretreatment method, which was LMAA pretreatment.Energies 2020, 13, x FOR PEER REVIEW 10 of 29
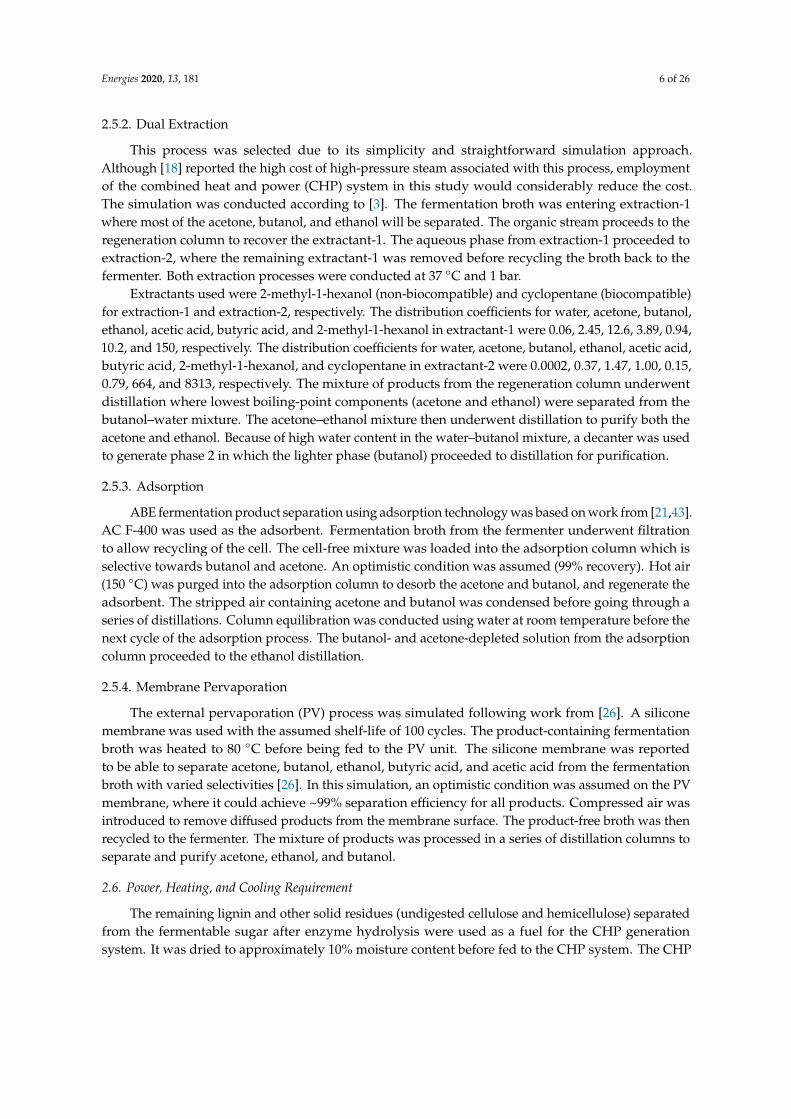
Figure 2. Pretreatment set-ups used in the simulations. Note that this figure only includes major unit operations. More thorough plant set-ups were used in the simulations. (a) LMAA; (b) autohydrolysis; (c) SAA; (d) NaOH; OPF—oil palm frond; SAA—soaking in aqueous ammonia; NaOH—soaking in sodium hydroxide solution; (R)—recycle.
Figure 2. Pretreatment set-ups used in the simulations. Note that this figure only includes major unitoperations. More thorough plant set-ups were used in the simulations. (a) LMAA; (b) autohydrolysis;(c) SAA; (d) NaOH; OPF—oil palm frond; SAA—soaking in aqueous ammonia; NaOH—soaking insodium hydroxide solution; (R)—recycle.
Energies 2020, 13, 181 10 of 26
Energies 2020, 13, x FOR PEER REVIEW 11 of 29
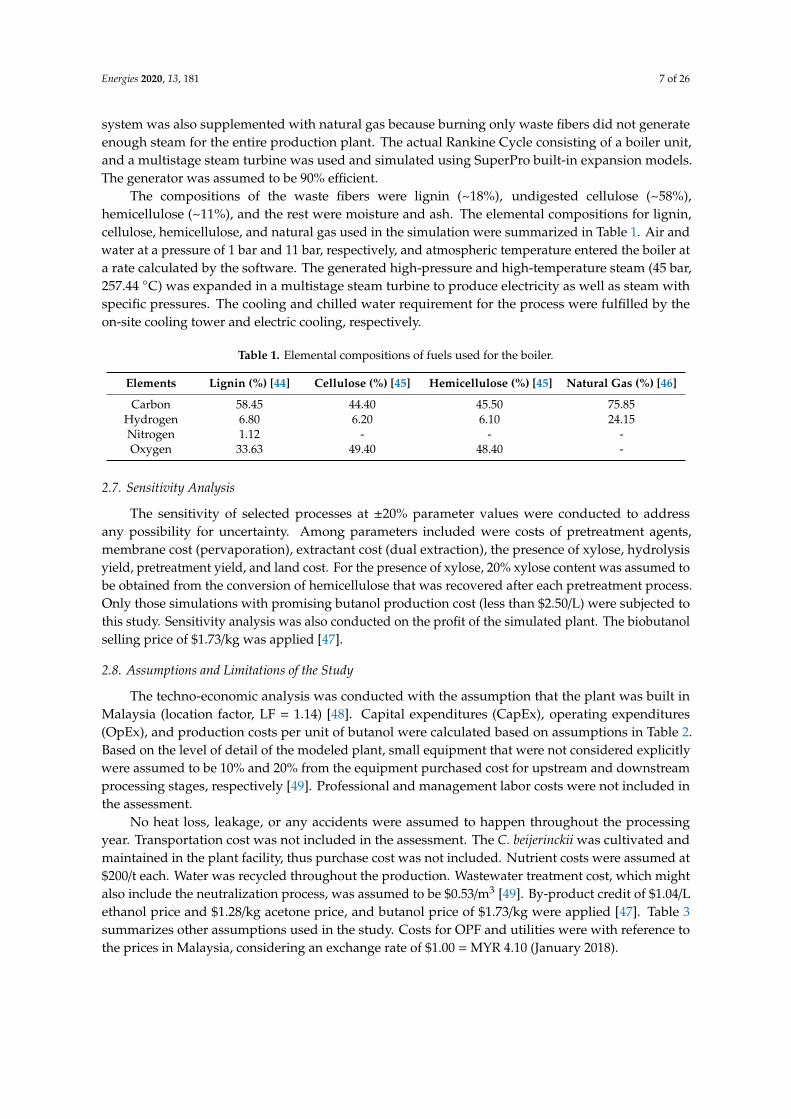
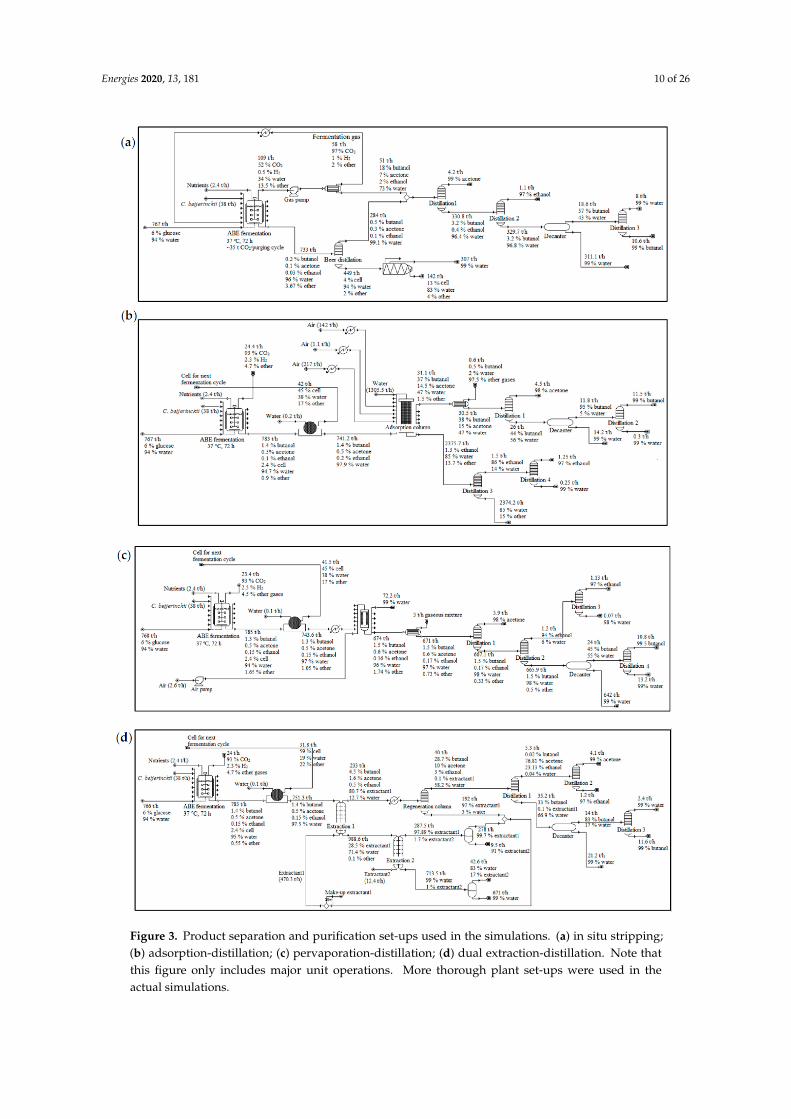
Figure 3. Product separation and purification set-ups used in the simulations. (a) in situ stripping; (b) adsorption-distillation; (c) pervaporation-distillation; (d) dual extraction-distillation. Note that this figure only includes major unit operations. More thorough plant set-ups were used in the actual simulations.
Figure 3. Product separation and purification set-ups used in the simulations. (a) in situ stripping;(b) adsorption-distillation; (c) pervaporation-distillation; (d) dual extraction-distillation. Note thatthis figure only includes major unit operations. More thorough plant set-ups were used in theactual simulations.
Energies 2020, 13, 181 11 of 26
3.1. Comparison of Different Pretreatment Technologies
3.1.1. Production Costs of Butanol
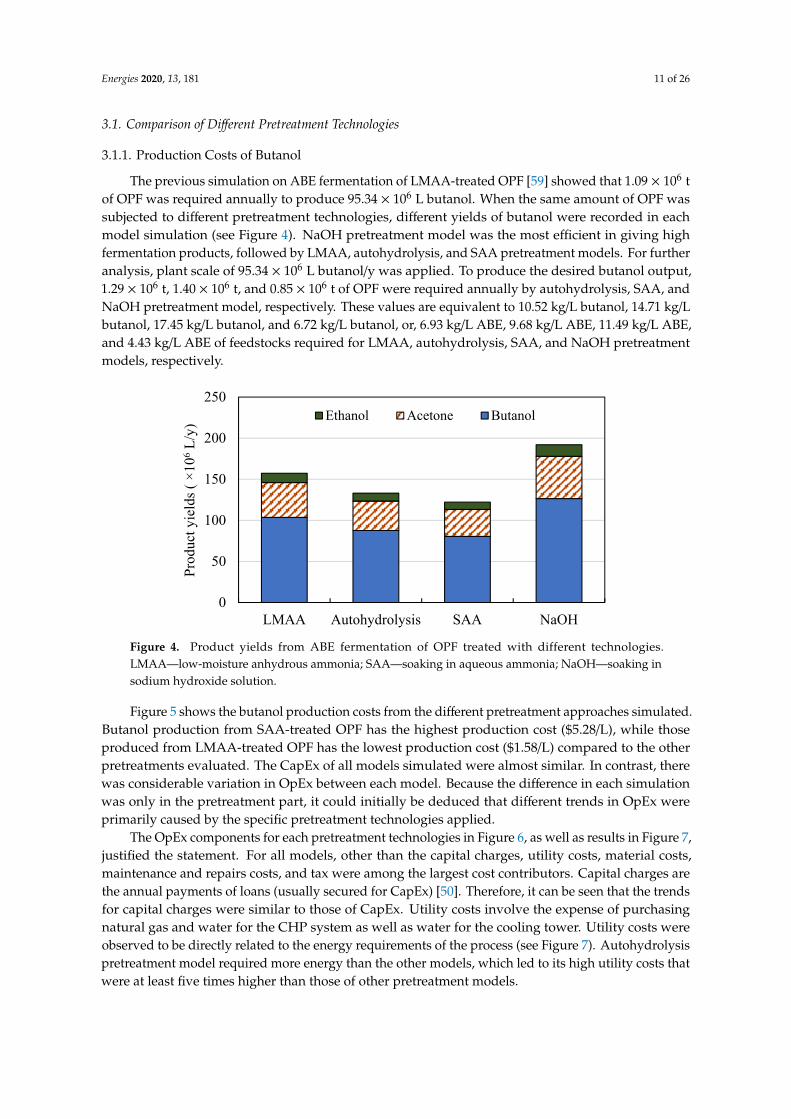
The previous simulation on ABE fermentation of LMAA-treated OPF [59] showed that 1.09 × 10⁶ tof OPF was required annually to produce 95.34 × 10⁶ L butanol. When the same amount of OPF wassubjected to different pretreatment technologies, different yields of butanol were recorded in eachmodel simulation (see Figure 4). NaOH pretreatment model was the most efficient in giving highfermentation products, followed by LMAA, autohydrolysis, and SAA pretreatment models. For furtheranalysis, plant scale of 95.34 × 10⁶ L butanol/y was applied. To produce the desired butanol output,1.29 × 106 t, 1.40 × 10⁶ t, and 0.85 × 10⁶ t of OPF were required annually by autohydrolysis, SAA, andNaOH pretreatment model, respectively. These values are equivalent to 10.52 kg/L butanol, 14.71 kg/Lbutanol, 17.45 kg/L butanol, and 6.72 kg/L butanol, or, 6.93 kg/L ABE, 9.68 kg/L ABE, 11.49 kg/L ABE,and 4.43 kg/L ABE of feedstocks required for LMAA, autohydrolysis, SAA, and NaOH pretreatmentmodels, respectively.
Energies 2020, 13, x FOR PEER REVIEW 12 of 29
3.1. Comparison of Different Pretreatment Technologies
3.1.1. Production Costs of Butanol
The previous simulation on ABE fermentation of LMAA-treated OPF [59] showed that 1.09 × 10⁶ t of OPF was required annually to produce 95.34 × 10⁶ L butanol. When the same amount of OPF was subjected to different pretreatment technologies, different yields of butanol were recorded in each model simulation (see Figure 4). NaOH pretreatment model was the most efficient in giving high fermentation products, followed by LMAA, autohydrolysis, and SAA pretreatment models. For further analysis, plant scale of 95.34 × 10⁶ L butanol/y was applied. To produce the desired butanol output, 1.29 × 10⁶ t, 1.40 × 10⁶ t, and 0.85 × 10⁶ t of OPF were required annually by autohydrolysis, SAA, and NaOH pretreatment model, respectively. These values are equivalent to 10.52 kg/L butanol, 14.71 kg/L butanol, 17.45 kg/L butanol, and 6.72 kg/L butanol, or, 6.93 kg/L ABE, 9.68 kg/L ABE, 11.49 kg/L ABE, and 4.43 kg/L ABE of feedstocks required for LMAA, autohydrolysis, SAA, and NaOH pretreatment models, respectively.
Figure 4. Product yields from ABE fermentation of OPF treated with different technologies. LMAA—low-moisture anhydrous ammonia; SAA—soaking in aqueous ammonia; NaOH—soaking in sodium hydroxide solution.
Figure 5 shows the butanol production costs from the different pretreatment approaches simulated. Butanol production from SAA-treated OPF has the highest production cost ($5.28/L), while those produced from LMAA-treated OPF has the lowest production cost ($1.58/L) compared to the other pretreatments evaluated. The CapEx of all models simulated were almost similar. In contrast, there was considerable variation in OpEx between each model. Because the difference in each simulation was only in the pretreatment part, it could initially be deduced that different trends in OpEx were primarily caused by the specific pretreatment technologies applied.
0
50
100
150
200
250
LMAA Autohydrolysis SAA NaOH
Prod
uct y
ield
s ( ×
106
L/y)
Ethanol Acetone Butanol
Figure 4. Product yields from ABE fermentation of OPF treated with different technologies.LMAA—low-moisture anhydrous ammonia; SAA—soaking in aqueous ammonia; NaOH—soaking insodium hydroxide solution.
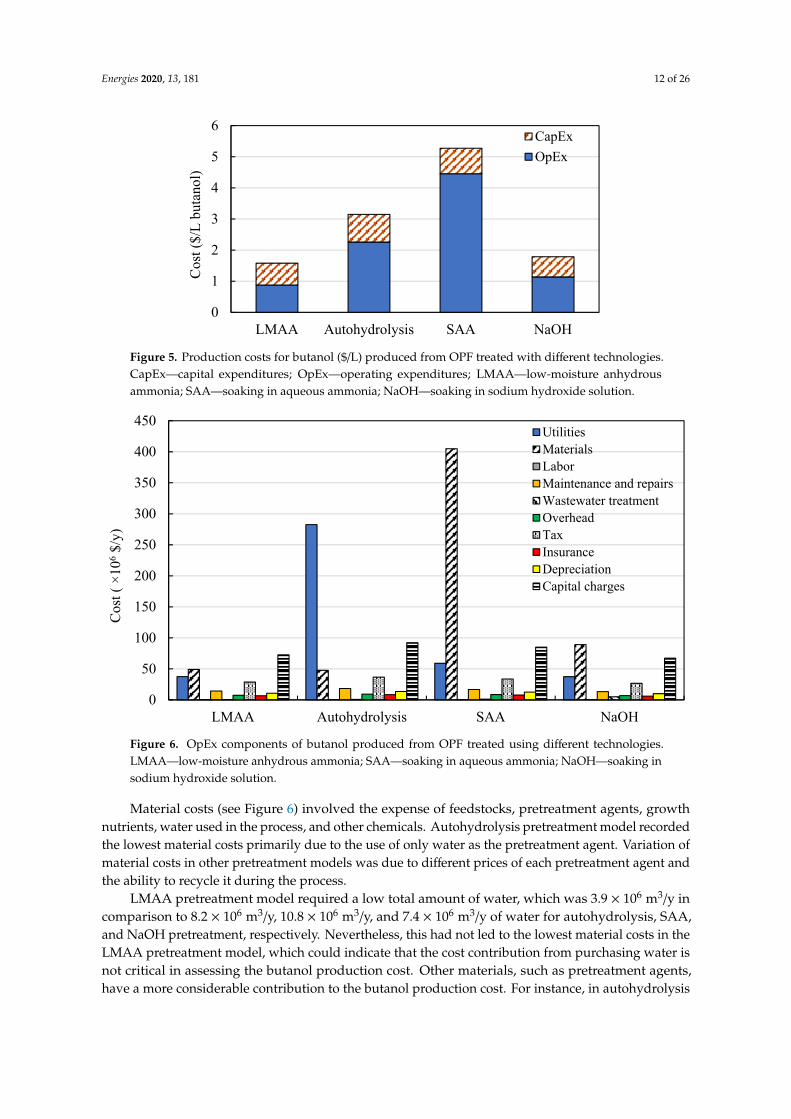
Figure 5 shows the butanol production costs from the different pretreatment approaches simulated.Butanol production from SAA-treated OPF has the highest production cost ($5.28/L), while thoseproduced from LMAA-treated OPF has the lowest production cost ($1.58/L) compared to the otherpretreatments evaluated. The CapEx of all models simulated were almost similar. In contrast, therewas considerable variation in OpEx between each model. Because the difference in each simulationwas only in the pretreatment part, it could initially be deduced that different trends in OpEx wereprimarily caused by the specific pretreatment technologies applied.
The OpEx components for each pretreatment technologies in Figure 6, as well as results in Figure 7,justified the statement. For all models, other than the capital charges, utility costs, material costs,maintenance and repairs costs, and tax were among the largest cost contributors. Capital charges arethe annual payments of loans (usually secured for CapEx) [50]. Therefore, it can be seen that the trendsfor capital charges were similar to those of CapEx. Utility costs involve the expense of purchasingnatural gas and water for the CHP system as well as water for the cooling tower. Utility costs wereobserved to be directly related to the energy requirements of the process (see Figure 7). Autohydrolysispretreatment model required more energy than the other models, which led to its high utility costs thatwere at least five times higher than those of other pretreatment models.
Energies 2020, 13, 181 12 of 26Energies 2020, 13, x FOR PEER REVIEW 13 of 29
Figure 5. Production costs for butanol ($/L) produced from OPF treated with different technologies. CapEx—capital expenditures; OpEx—operating expenditures; LMAA—low-moisture anhydrous ammonia; SAA—soaking in aqueous ammonia; NaOH—soaking in sodium hydroxide solution.
The OpEx components for each pretreatment technologies in Figure 6, as well as results in Figure 7, justified the statement. For all models, other than the capital charges, utility costs, material costs, maintenance and repairs costs, and tax were among the largest cost contributors. Capital charges are the annual payments of loans (usually secured for CapEx) [50]. Therefore, it can be seen that the trends for capital charges were similar to those of CapEx. Utility costs involve the expense of purchasing natural gas and water for the CHP system as well as water for the cooling tower. Utility costs were observed to be directly related to the energy requirements of the process (see Figure 7). Autohydrolysis pretreatment model required more energy than the other models, which led to its high utility costs that were at least five times higher than those of other pretreatment models.
Figure 6. OpEx components of butanol produced from OPF treated using different technologies. LMAA—low-moisture anhydrous ammonia; SAA—soaking in aqueous ammonia; NaOH—soaking
in sodium hydroxide solution.
0
1
2
3
4
5
6
LMAA Autohydrolysis SAA NaOH
Cost
($/L
but
anol
)
CapExOpEx
0
50
100
150
200
250
300
350
400
450
LMAA Autohydrolysis SAA NaOH
Cost
( ×10
6$/
y)
UtilitiesMaterialsLaborMaintenance and repairsWastewater treatmentOverheadTaxInsuranceDepreciationCapital charges
Figure 5. Production costs for butanol ($/L) produced from OPF treated with different technologies.CapEx—capital expenditures; OpEx—operating expenditures; LMAA—low-moisture anhydrousammonia; SAA—soaking in aqueous ammonia; NaOH—soaking in sodium hydroxide solution.
Energies 2020, 13, x FOR PEER REVIEW 13 of 29
Figure 5. Production costs for butanol ($/L) produced from OPF treated with different technologies. CapEx—capital expenditures; OpEx—operating expenditures; LMAA—low-moisture anhydrous ammonia; SAA—soaking in aqueous ammonia; NaOH—soaking in sodium hydroxide solution.
The OpEx components for each pretreatment technologies in Figure 6, as well as results in Figure 7, justified the statement. For all models, other than the capital charges, utility costs, material costs, maintenance and repairs costs, and tax were among the largest cost contributors. Capital charges are the annual payments of loans (usually secured for CapEx) [50]. Therefore, it can be seen that the trends for capital charges were similar to those of CapEx. Utility costs involve the expense of purchasing natural gas and water for the CHP system as well as water for the cooling tower. Utility costs were observed to be directly related to the energy requirements of the process (see Figure 7). Autohydrolysis pretreatment model required more energy than the other models, which led to its high utility costs that were at least five times higher than those of other pretreatment models.
Figure 6. OpEx components of butanol produced from OPF treated using different technologies. LMAA—low-moisture anhydrous ammonia; SAA—soaking in aqueous ammonia; NaOH—soaking
in sodium hydroxide solution.
0
1
2
3
4
5
6
LMAA Autohydrolysis SAA NaOH
Cost
($/L
but
anol
)
CapExOpEx
0
50
100
150
200
250
300
350
400
450
LMAA Autohydrolysis SAA NaOH
Cost
( ×10
6$/
y)
UtilitiesMaterialsLaborMaintenance and repairsWastewater treatmentOverheadTaxInsuranceDepreciationCapital charges
Figure 6. OpEx components of butanol produced from OPF treated using different technologies.LMAA—low-moisture anhydrous ammonia; SAA—soaking in aqueous ammonia; NaOH—soaking insodium hydroxide solution.
Material costs (see Figure 6) involved the expense of feedstocks, pretreatment agents, growthnutrients, water used in the process, and other chemicals. Autohydrolysis pretreatment model recordedthe lowest material costs primarily due to the use of only water as the pretreatment agent. Variation ofmaterial costs in other pretreatment models was due to different prices of each pretreatment agent andthe ability to recycle it during the process.
LMAA pretreatment model required a low total amount of water, which was 3.9 × 10⁶ m3/y incomparison to 8.2 × 10⁶ m3/y, 10.8 × 10⁶ m3/y, and 7.4 × 10⁶ m3/y of water for autohydrolysis, SAA,and NaOH pretreatment, respectively. Nevertheless, this had not led to the lowest material costs in theLMAA pretreatment model, which could indicate that the cost contribution from purchasing water isnot critical in assessing the butanol production cost. Other materials, such as pretreatment agents,have a more considerable contribution to the butanol production cost. For instance, in autohydrolysis
Energies 2020, 13, 181 13 of 26
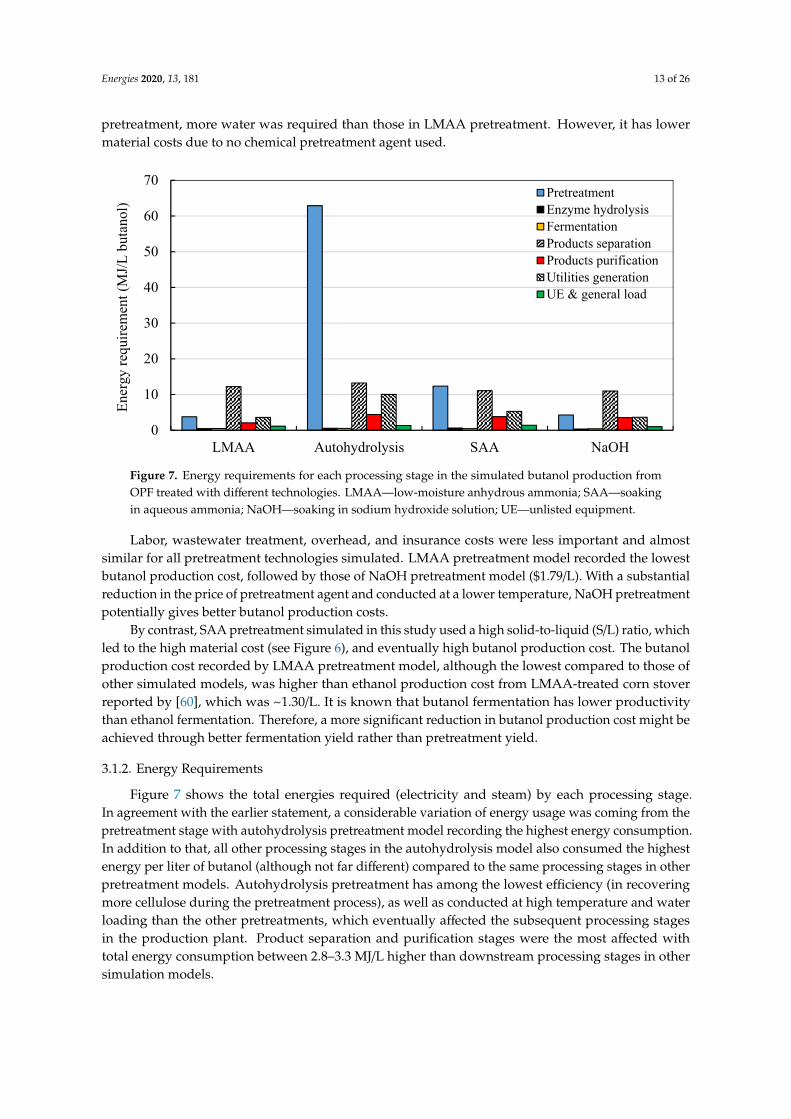
pretreatment, more water was required than those in LMAA pretreatment. However, it has lowermaterial costs due to no chemical pretreatment agent used.Energies 2020, 13, x FOR PEER REVIEW 14 of 29
Figure 7. Energy requirements for each processing stage in the simulated butanol production from OPF treated with different technologies. LMAA—low-moisture anhydrous ammonia; SAA—soaking in aqueous ammonia; NaOH—soaking in sodium hydroxide solution; UE—unlisted equipment.
Material costs (see Figure 6) involved the expense of feedstocks, pretreatment agents, growth nutrients, water used in the process, and other chemicals. Autohydrolysis pretreatment model recorded the lowest material costs primarily due to the use of only water as the pretreatment agent. Variation of material costs in other pretreatment models was due to different prices of each pretreatment agent and the ability to recycle it during the process.
LMAA pretreatment model required a low total amount of water, which was 3.9 × 10⁶ m3/y in comparison to 8.2 × 10⁶ m3/y, 10.8 × 10⁶ m3/y, and 7.4 × 10⁶ m3/y of water for autohydrolysis, SAA, and NaOH pretreatment, respectively. Nevertheless, this had not led to the lowest material costs in the LMAA pretreatment model, which could indicate that the cost contribution from purchasing water is not critical in assessing the butanol production cost. Other materials, such as pretreatment agents, have a more considerable contribution to the butanol production cost. For instance, in autohydrolysis pretreatment, more water was required than those in LMAA pretreatment. However, it has lower material costs due to no chemical pretreatment agent used.
Labor, wastewater treatment, overhead, and insurance costs were less important and almost similar for all pretreatment technologies simulated. LMAA pretreatment model recorded the lowest butanol production cost, followed by those of NaOH pretreatment model ($1.79/L). With a substantial reduction in the price of pretreatment agent and conducted at a lower temperature, NaOH pretreatment potentially gives better butanol production costs.
By contrast, SAA pretreatment simulated in this study used a high solid-to-liquid (S/L) ratio, which led to the high material cost (see Figure 6), and eventually high butanol production cost. The butanol production cost recorded by LMAA pretreatment model, although the lowest compared to those of other simulated models, was higher than ethanol production cost from LMAA-treated corn stover reported by [60], which was ~1.30/L. It is known that butanol fermentation has lower productivity than ethanol fermentation. Therefore, a more significant reduction in butanol production cost might be achieved through better fermentation yield rather than pretreatment yield.
3.1.2. Energy Requirements
Figure 7 shows the total energies required (electricity and steam) by each processing stage. In agreement with the earlier statement, a considerable variation of energy usage was coming from the
0
10
20
30
40
50
60
70
LMAA Autohydrolysis SAA NaOH
Ener
gy re
quire
men
t (M
J/L b
utan
ol)
PretreatmentEnzyme hydrolysisFermentationProducts separationProducts purificationUtilities generationUE & general load
Figure 7. Energy requirements for each processing stage in the simulated butanol production fromOPF treated with different technologies. LMAA—low-moisture anhydrous ammonia; SAA—soakingin aqueous ammonia; NaOH—soaking in sodium hydroxide solution; UE—unlisted equipment.
Labor, wastewater treatment, overhead, and insurance costs were less important and almostsimilar for all pretreatment technologies simulated. LMAA pretreatment model recorded the lowestbutanol production cost, followed by those of NaOH pretreatment model ($1.79/L). With a substantialreduction in the price of pretreatment agent and conducted at a lower temperature, NaOH pretreatmentpotentially gives better butanol production costs.
By contrast, SAA pretreatment simulated in this study used a high solid-to-liquid (S/L) ratio, whichled to the high material cost (see Figure 6), and eventually high butanol production cost. The butanolproduction cost recorded by LMAA pretreatment model, although the lowest compared to those ofother simulated models, was higher than ethanol production cost from LMAA-treated corn stoverreported by [60], which was ~1.30/L. It is known that butanol fermentation has lower productivitythan ethanol fermentation. Therefore, a more significant reduction in butanol production cost might beachieved through better fermentation yield rather than pretreatment yield.
3.1.2. Energy Requirements
Figure 7 shows the total energies required (electricity and steam) by each processing stage.In agreement with the earlier statement, a considerable variation of energy usage was coming from thepretreatment stage with autohydrolysis pretreatment model recording the highest energy consumption.In addition to that, all other processing stages in the autohydrolysis model also consumed the highestenergy per liter of butanol (although not far different) compared to the same processing stages in otherpretreatment models. Autohydrolysis pretreatment has among the lowest efficiency (in recoveringmore cellulose during the pretreatment process), as well as conducted at high temperature and waterloading than the other pretreatments, which eventually affected the subsequent processing stagesin the production plant. Product separation and purification stages were the most affected withtotal energy consumption between 2.8–3.3 MJ/L higher than downstream processing stages in othersimulation models.
Energies 2020, 13, 181 14 of 26
Pretreatment stage in the LMAA pretreatment model consumed the lowest energy; however,this was not the case for most of the rest of the processing stages. In general, except for the pretreatmentstage, all other processing stages of each model had a similar trend of energy consumption with mostlysmall variations between each. Most of these variations were due to the slightly different streamcompositions throughout the processing and different final product yields. For instance, a highercontent of water in the purification unit demanded more energy for distillation, and higher fibercontent in the hydrolysis reactor demanded higher power for agitation. LMAA pretreatment consumedin total the lowest energy per unit butanol produced followed by NaOH, SAA, and autohydrolysispretreatments, with the amount of 23.75 MJ/L, 24.13 MJ/L, 34.97 MJ/L, and 92.93 MJ/L, respectively.
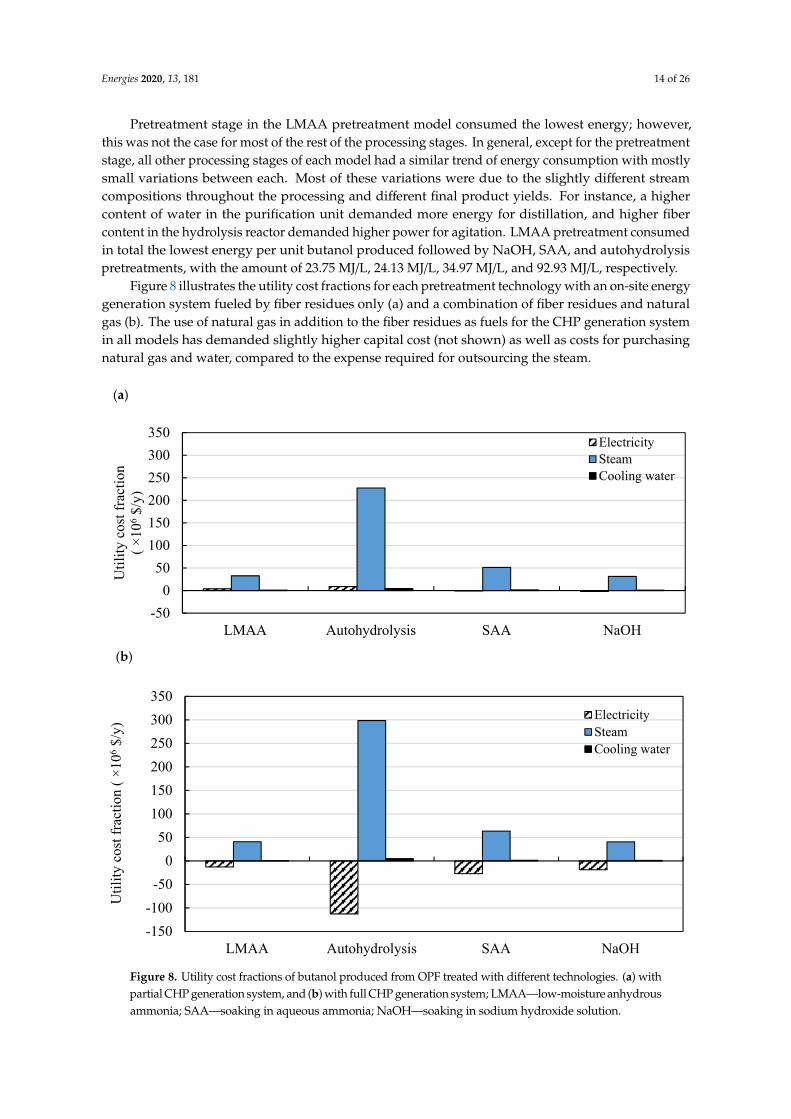
Figure 8 illustrates the utility cost fractions for each pretreatment technology with an on-site energygeneration system fueled by fiber residues only (a) and a combination of fiber residues and naturalgas (b). The use of natural gas in addition to the fiber residues as fuels for the CHP generation systemin all models has demanded slightly higher capital cost (not shown) as well as costs for purchasingnatural gas and water, compared to the expense required for outsourcing the steam.
Energies 2020, 13, x FOR PEER REVIEW 15 of 29
pretreatment stage with autohydrolysis pretreatment model recording the highest energy consumption. In addition to that, all other processing stages in the autohydrolysis model also consumed the highest energy per liter of butanol (although not far different) compared to the same processing stages in other pretreatment models. Autohydrolysis pretreatment has among the lowest efficiency (in recovering more cellulose during the pretreatment process), as well as conducted at high temperature and water loading than the other pretreatments, which eventually affected the subsequent processing stages in the production plant. Product separation and purification stages were the most affected with total energy consumption between 2.8–3.3 MJ/L higher than downstream processing stages in other simulation models.
Pretreatment stage in the LMAA pretreatment model consumed the lowest energy; however, this was not the case for most of the rest of the processing stages. In general, except for the pretreatment stage, all other processing stages of each model had a similar trend of energy consumption with mostly small variations between each. Most of these variations were due to the slightly different stream compositions throughout the processing and different final product yields. For instance, a higher content of water in the purification unit demanded more energy for distillation, and higher fiber content in the hydrolysis reactor demanded higher power for agitation. LMAA pretreatment consumed in total the lowest energy per unit butanol produced followed by NaOH, SAA, and autohydrolysis pretreatments, with the amount of 23.75 MJ/L, 24.13 MJ/L, 34.97 MJ/L, and 92.93 MJ/L, respectively.
Figure 8 illustrates the utility cost fractions for each pretreatment technology with an on-site energy generation system fueled by fiber residues only (a) and a combination of fiber residues and natural gas (b). The use of natural gas in addition to the fiber residues as fuels for the CHP generation system in all models has demanded slightly higher capital cost (not shown) as well as costs for purchasing natural gas and water, compared to the expense required for outsourcing the steam.
-50
050
100150200250300350
LMAA Autohydrolysis SAA NaOH
Util
ity c
ost f
ract
ion
( ×10
6$/
y)
(a)
ElectricitySteamCooling water
Energies 2020, 13, x FOR PEER REVIEW 16 of 29
Figure 8. Utility cost fractions of butanol produced from OPF treated with different technologies. (a) with partial CHP generation system, and (b) with full CHP generation system; LMAA—low-moisture anhydrous ammonia; SAA—soaking in aqueous ammonia; NaOH—soaking in sodium hydroxide solution.
However, the CHP system also generated an excessive amount of electricity, which is sold to the grid for an additional income. By burning only waste fibers in the CHP system, only 44%, 18%, 46%, and 53% of steam needs could be fulfilled in LMAA, autohydrolysis, SAA, and NaOH pretreatment models, respectively. In general, for each technology, high requirement of heating was followed by high demand for cooling (i.e., those with the highest heating works will require the highest amount of cooling water). Reduction of the extent of heating and cooling could be achieved through better heat integration, which allows better heat recovery to be used in process streams requiring less critical heat. Optimization of this aspect was not conducted in this study.
As mentioned before, fiber residues and natural gas were used as fuels in the CHP system. For the autohydrolysis model, which required a considerably larger amount of heat, more natural gas was needed as compared to other simulated models. Approximately 68.89 × 109 ft3 natural gas was needed annually by the autohydrolysis pretreatment model. In comparison, LMAA, SAA, and NaOH pretreatment model required an annual natural gas amount of around 9.15 × 109 ft3, 14.37 × 109 ft3, and 9.11 × 109 ft3, respectively. Approximately only 0.1% of cooling water increased was recorded for all models when the CHP generation system was the sole energy source. This value reflects the amount of cooling required by the condenser in the CHP system, which needed to allow for water recycling.
3.2. Comparison of Different Product Recovery Technologies
3.2.1. Production Costs of Butanol
In the study of comparison of different product separation technologies for the butanol production plant, 1.09 × 10⁶ t of OPF was used annually in all models. The adsorption model recorded the highest total product yields, followed by dual extraction, pervaporation, and in situ stripping models (see Figure 9). Nevertheless, focusing only on butanol yield, dual extraction process gave the highest yield followed by adsorption, pervaporation, and in situ stripping process. Despite that, the lowest butanol production cost (see Figure 10) was given by in situ stripping ($1.58/L), while pervaporation and dual extraction model gave a slightly higher butanol production
-150-100
-500
50100150200250300350
LMAA Autohydrolysis SAA NaOH
Util
ity c
ost f
ract
ion
( ×10
6$/
y)
(b)
ElectricitySteamCooling water
Figure 8. Utility cost fractions of butanol produced from OPF treated with different technologies. (a) withpartial CHP generation system, and (b) with full CHP generation system; LMAA—low-moisture anhydrousammonia; SAA—soaking in aqueous ammonia; NaOH—soaking in sodium hydroxide solution.
Energies 2020, 13, 181 15 of 26
However, the CHP system also generated an excessive amount of electricity, which is sold to thegrid for an additional income. By burning only waste fibers in the CHP system, only 44%, 18%, 46%,and 53% of steam needs could be fulfilled in LMAA, autohydrolysis, SAA, and NaOH pretreatmentmodels, respectively. In general, for each technology, high requirement of heating was followed byhigh demand for cooling (i.e., those with the highest heating works will require the highest amount ofcooling water). Reduction of the extent of heating and cooling could be achieved through better heatintegration, which allows better heat recovery to be used in process streams requiring less critical heat.Optimization of this aspect was not conducted in this study.
As mentioned before, fiber residues and natural gas were used as fuels in the CHP system. For theautohydrolysis model, which required a considerably larger amount of heat, more natural gas wasneeded as compared to other simulated models. Approximately 68.89 × 109 ft3 natural gas wasneeded annually by the autohydrolysis pretreatment model. In comparison, LMAA, SAA, and NaOHpretreatment model required an annual natural gas amount of around 9.15 × 109 ft3, 14.37 × 109 ft3,and 9.11 × 109 ft3, respectively. Approximately only 0.1% of cooling water increased was recorded forall models when the CHP generation system was the sole energy source. This value reflects the amountof cooling required by the condenser in the CHP system, which needed to allow for water recycling.
3.2. Comparison of Different Product Recovery Technologies
3.2.1. Production Costs of Butanol
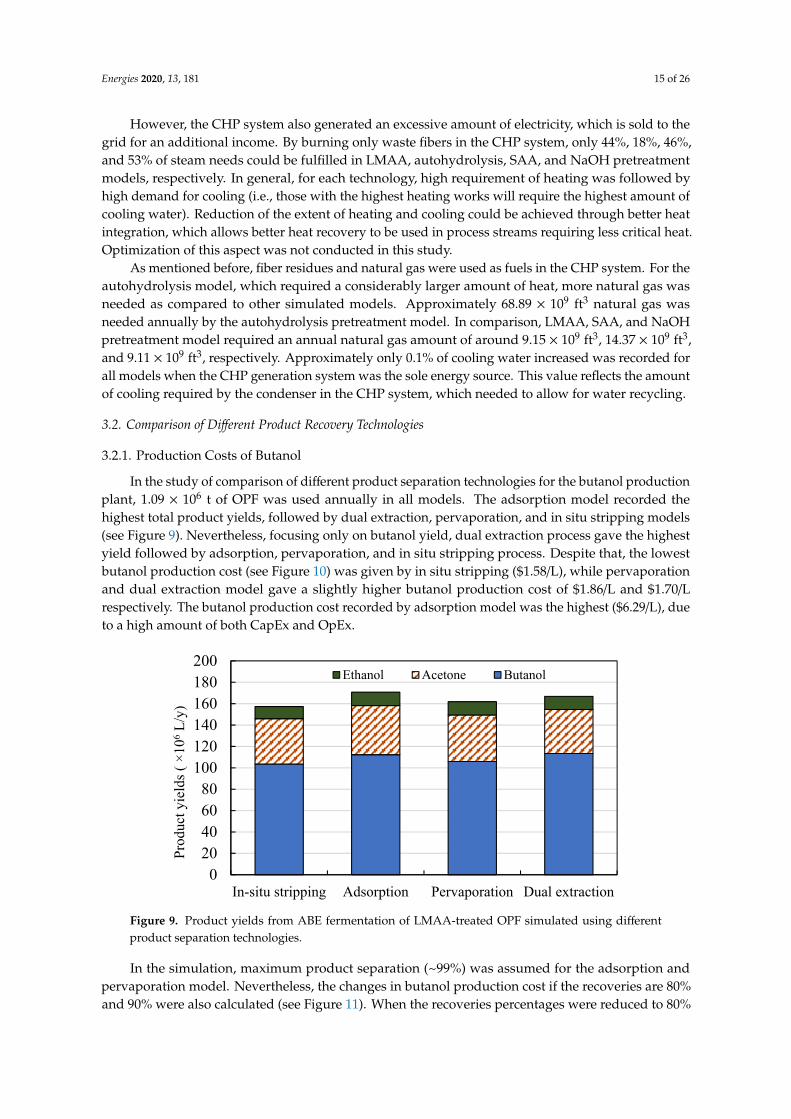
In the study of comparison of different product separation technologies for the butanol productionplant, 1.09 × 10⁶ t of OPF was used annually in all models. The adsorption model recorded thehighest total product yields, followed by dual extraction, pervaporation, and in situ stripping models(see Figure 9). Nevertheless, focusing only on butanol yield, dual extraction process gave the highestyield followed by adsorption, pervaporation, and in situ stripping process. Despite that, the lowestbutanol production cost (see Figure 10) was given by in situ stripping ($1.58/L), while pervaporationand dual extraction model gave a slightly higher butanol production cost of $1.86/L and $1.70/Lrespectively. The butanol production cost recorded by adsorption model was the highest ($6.29/L), dueto a high amount of both CapEx and OpEx.
Energies 2020, 13, x FOR PEER REVIEW 17 of 29
cost of $1.86/L and $1.70/L respectively. The butanol production cost recorded by adsorption model was the highest ($6.29/L), due to a high amount of both CapEx and OpEx.
Figure 9. Product yields from ABE fermentation of LMAA-treated OPF simulated using different
product separation technologies.
Figure 10. Production cost of butanol ($/L) from ABE fermentation of LMAA-treated OPF simulated using different product separation technologies. CapEx—capital expenditures; OpEx—operating expenditures.
In the simulation, maximum product separation (~99%) was assumed for the adsorption and pervaporation model. Nevertheless, the changes in butanol production cost if the recoveries are 80% and 90% were also calculated (see Figure 11). When the recoveries percentages were reduced to 80% and 90%, adsorption model was observed to give higher butanol production cost increase than that for pervaporation model.
020406080
100120140160180200
In-situ stripping Adsorption Pervaporation Dual extraction
Prod
uct y
ield
s ( ×
106
L/y)
Ethanol Acetone Butanol
0
1
2
3
4
5
6
7
In-situ stripping Adsorption Pervaporation Dual extraction
Cost
($/L
but
anol
)
CapEx OpEx
Figure 9. Product yields from ABE fermentation of LMAA-treated OPF simulated using differentproduct separation technologies.
In the simulation, maximum product separation (~99%) was assumed for the adsorption andpervaporation model. Nevertheless, the changes in butanol production cost if the recoveries are 80%and 90% were also calculated (see Figure 11). When the recoveries percentages were reduced to 80%
Energies 2020, 13, 181 16 of 26
and 90%, adsorption model was observed to give higher butanol production cost increase than that forpervaporation model.
Energies 2020, 13, x FOR PEER REVIEW 17 of 29
cost of $1.86/L and $1.70/L respectively. The butanol production cost recorded by adsorption model was the highest ($6.29/L), due to a high amount of both CapEx and OpEx.
Figure 9. Product yields from ABE fermentation of LMAA-treated OPF simulated using different
product separation technologies.
Figure 10. Production cost of butanol ($/L) from ABE fermentation of LMAA-treated OPF simulated using different product separation technologies. CapEx—capital expenditures; OpEx—operating expenditures.
In the simulation, maximum product separation (~99%) was assumed for the adsorption and pervaporation model. Nevertheless, the changes in butanol production cost if the recoveries are 80% and 90% were also calculated (see Figure 11). When the recoveries percentages were reduced to 80% and 90%, adsorption model was observed to give higher butanol production cost increase than that for pervaporation model.
020406080
100120140160180200
In-situ stripping Adsorption Pervaporation Dual extraction
Prod
uct y
ield
s ( ×
106
L/y)
Ethanol Acetone Butanol
0
1
2
3
4
5
6
7
In-situ stripping Adsorption Pervaporation Dual extraction
Cost
($/L
but
anol
)
CapEx OpEx
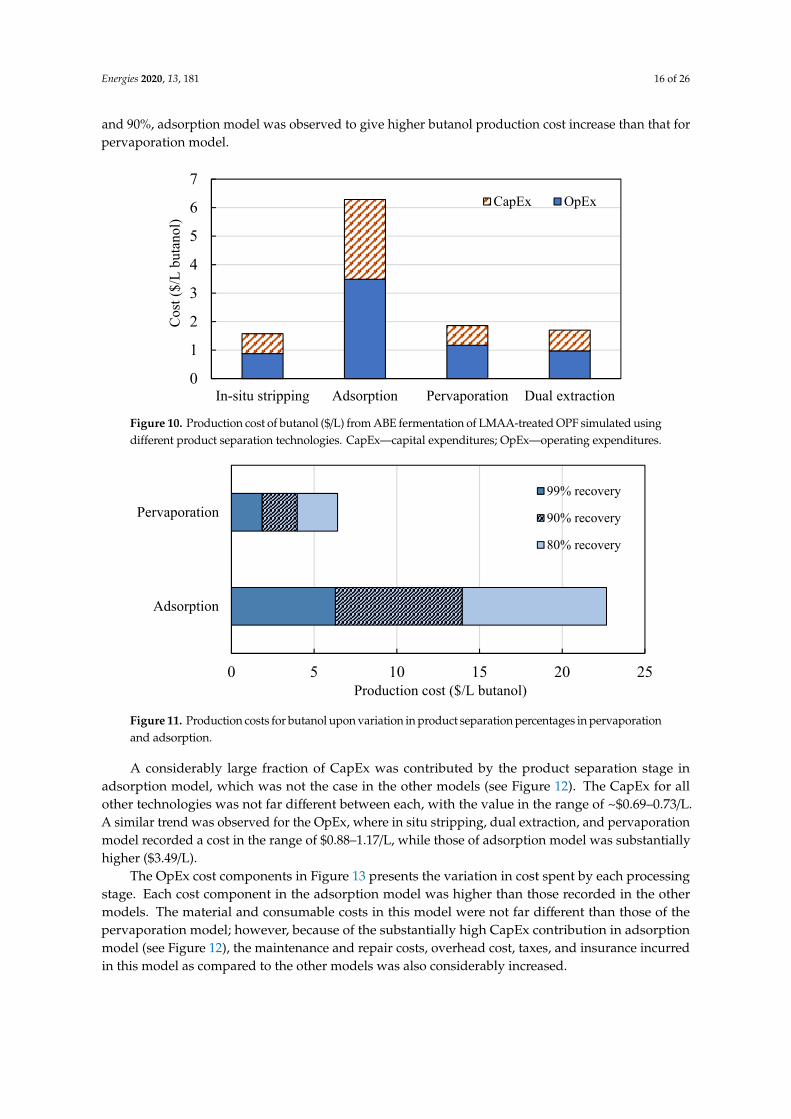
Figure 10. Production cost of butanol ($/L) from ABE fermentation of LMAA-treated OPF simulated usingdifferent product separation technologies. CapEx—capital expenditures; OpEx—operating expenditures.
Energies 2020, 13, x FOR PEER REVIEW 18 of 29
Figure 11. Production costs for butanol upon variation in product separation percentages in
pervaporation and adsorption.
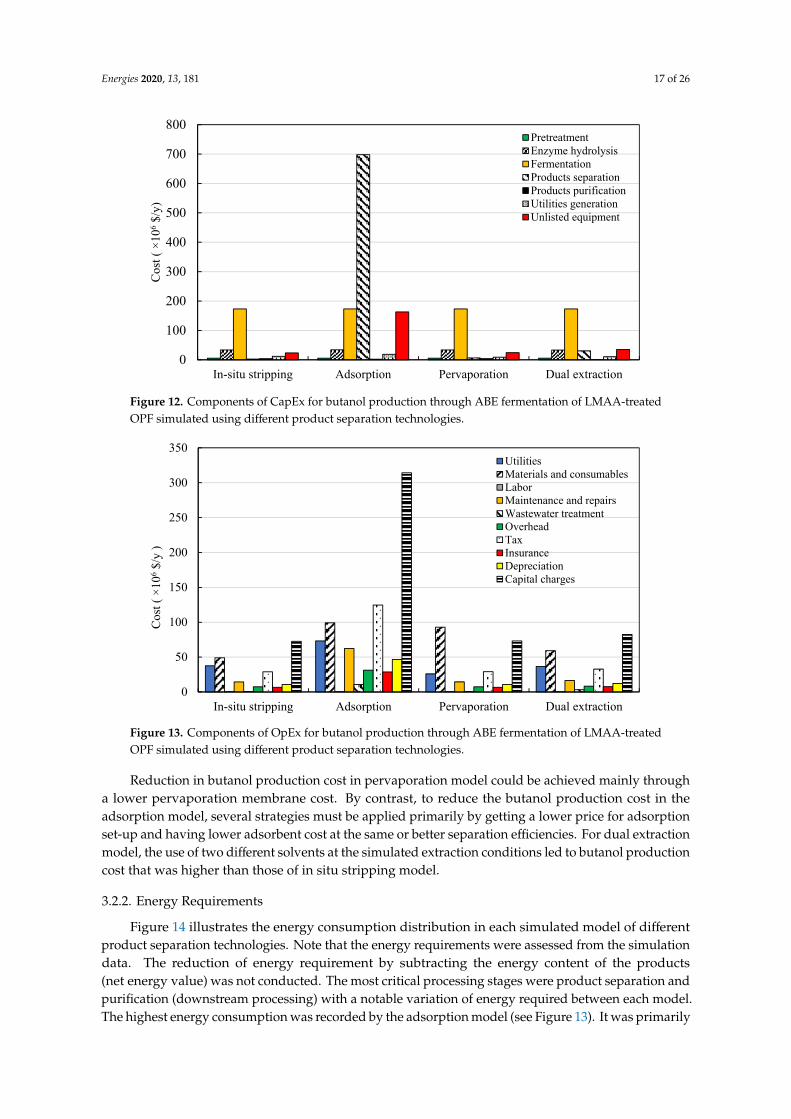
A considerably large fraction of CapEx was contributed by the product separation stage in adsorption model, which was not the case in the other models (see Figure 12). The CapEx for all other technologies was not far different between each, with the value in the range of ~$0.69–0.73/L. A similar trend was observed for the OpEx, where in situ stripping, dual extraction, and pervaporation model recorded a cost in the range of $0.88–1.17/L, while those of adsorption model was substantially higher ($3.49/L).
Figure 12. Components of CapEx for butanol production through ABE fermentation of
LMAA-treated OPF simulated using different product separation technologies.
The OpEx cost components in Figure 13 presents the variation in cost spent by each processing stage. Each cost component in the adsorption model was higher than those recorded in the other models. The material and consumable costs in this model were not far different than those of the pervaporation model; however, because of the substantially high CapEx contribution in adsorption model (see Figure 12), the maintenance and repair costs, overhead cost, taxes, and insurance incurred in this model as compared to the other models was also considerably increased.
0 5 10 15 20 25
Adsorption
Pervaporation
Production cost ($/L butanol)
99% recovery
90% recovery
80% recovery
0
100
200
300
400
500
600
700
800
In-situ stripping Adsorption Pervaporation Dual extraction
Cost
( ×10
6$/
y)
PretreatmentEnzyme hydrolysisFermentationProducts separationProducts purificationUtilities generationUnlisted equipment
Figure 11. Production costs for butanol upon variation in product separation percentages in pervaporationand adsorption.
A considerably large fraction of CapEx was contributed by the product separation stage inadsorption model, which was not the case in the other models (see Figure 12). The CapEx for allother technologies was not far different between each, with the value in the range of ~$0.69–0.73/L.A similar trend was observed for the OpEx, where in situ stripping, dual extraction, and pervaporationmodel recorded a cost in the range of $0.88–1.17/L, while those of adsorption model was substantiallyhigher ($3.49/L).
The OpEx cost components in Figure 13 presents the variation in cost spent by each processingstage. Each cost component in the adsorption model was higher than those recorded in the othermodels. The material and consumable costs in this model were not far different than those of thepervaporation model; however, because of the substantially high CapEx contribution in adsorptionmodel (see Figure 12), the maintenance and repair costs, overhead cost, taxes, and insurance incurredin this model as compared to the other models was also considerably increased.
Energies 2020, 13, 181 17 of 26
Energies 2020, 13, x FOR PEER REVIEW 18 of 29
Figure 11. Production costs for butanol upon variation in product separation percentages in
pervaporation and adsorption.
A considerably large fraction of CapEx was contributed by the product separation stage in adsorption model, which was not the case in the other models (see Figure 12). The CapEx for all other technologies was not far different between each, with the value in the range of ~$0.69–0.73/L. A similar trend was observed for the OpEx, where in situ stripping, dual extraction, and pervaporation model recorded a cost in the range of $0.88–1.17/L, while those of adsorption model was substantially higher ($3.49/L).
Figure 12. Components of CapEx for butanol production through ABE fermentation of
LMAA-treated OPF simulated using different product separation technologies.
The OpEx cost components in Figure 13 presents the variation in cost spent by each processing stage. Each cost component in the adsorption model was higher than those recorded in the other models. The material and consumable costs in this model were not far different than those of the pervaporation model; however, because of the substantially high CapEx contribution in adsorption model (see Figure 12), the maintenance and repair costs, overhead cost, taxes, and insurance incurred in this model as compared to the other models was also considerably increased.
0 5 10 15 20 25
Adsorption
Pervaporation
Production cost ($/L butanol)
99% recovery
90% recovery
80% recovery
0
100
200
300
400
500
600
700
800
In-situ stripping Adsorption Pervaporation Dual extraction
Cost
( ×10
6$/
y)PretreatmentEnzyme hydrolysisFermentationProducts separationProducts purificationUtilities generationUnlisted equipment
Figure 12. Components of CapEx for butanol production through ABE fermentation of LMAA-treatedOPF simulated using different product separation technologies.Energies 2020, 13, x FOR PEER REVIEW 19 of 29
Figure 13. Components of OpEx for butanol production through ABE fermentation of LMAA-treated OPF simulated using different product separation technologies.
Reduction in butanol production cost in pervaporation model could be achieved mainly through a lower pervaporation membrane cost. By contrast, to reduce the butanol production cost in the adsorption model, several strategies must be applied primarily by getting a lower price for adsorption set-up and having lower adsorbent cost at the same or better separation efficiencies. For dual extraction model, the use of two different solvents at the simulated extraction conditions led to butanol production cost that was higher than those of in situ stripping model.
3.2.2. Energy Requirements
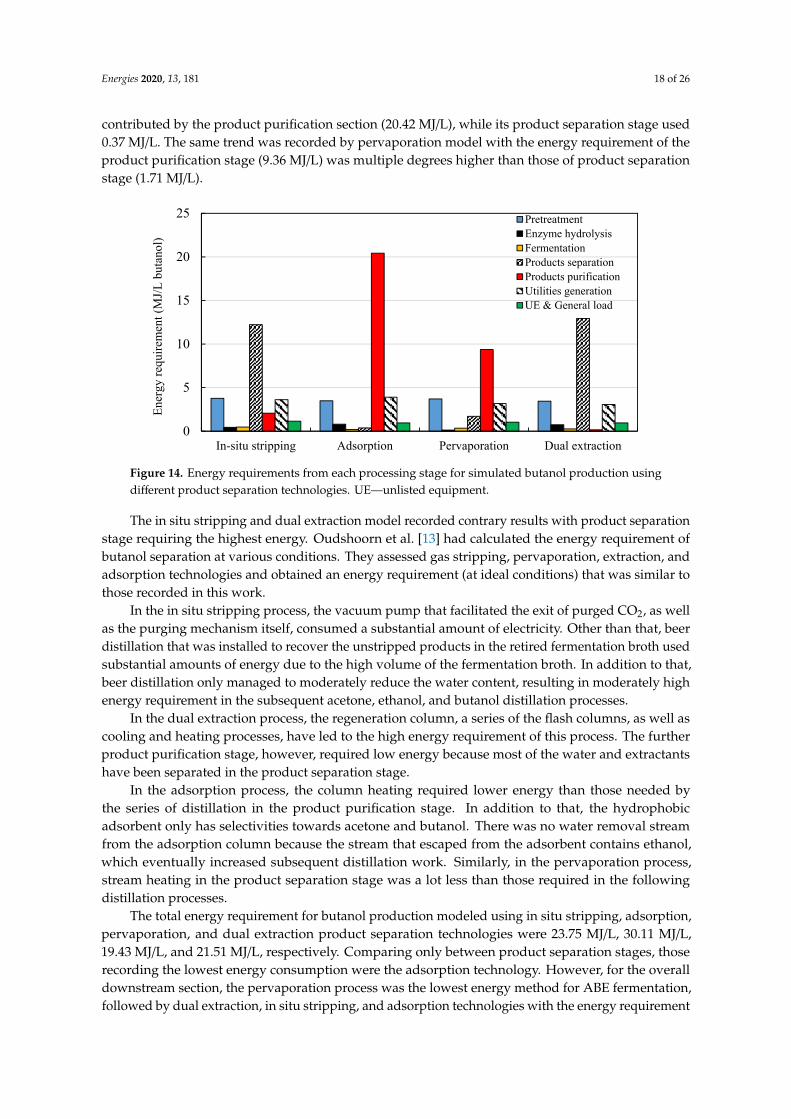
Figure 14 illustrates the energy consumption distribution in each simulated model of different product separation technologies. Note that the energy requirements were assessed from the simulation data. The reduction of energy requirement by subtracting the energy content of the products (net energy value) was not conducted. The most critical processing stages were product separation and purification (downstream processing) with a notable variation of energy required between each model. The highest energy consumption was recorded by the adsorption model (see Figure 13). It was primarily contributed by the product purification section (20.42 MJ/L), while its product separation stage used 0.37 MJ/L. The same trend was recorded by pervaporation model with the energy requirement of the product purification stage (9.36 MJ/L) was multiple degrees higher than those of product separation stage (1.71 MJ/L).
0
50
100
150
200
250
300
350
In-situ stripping Adsorption Pervaporation Dual extraction
Cost
( ×10
6$/
y)
UtilitiesMaterials and consumablesLaborMaintenance and repairsWastewater treatmentOverheadTaxInsuranceDepreciationCapital charges
Figure 13. Components of OpEx for butanol production through ABE fermentation of LMAA-treatedOPF simulated using different product separation technologies.
Reduction in butanol production cost in pervaporation model could be achieved mainly througha lower pervaporation membrane cost. By contrast, to reduce the butanol production cost in theadsorption model, several strategies must be applied primarily by getting a lower price for adsorptionset-up and having lower adsorbent cost at the same or better separation efficiencies. For dual extractionmodel, the use of two different solvents at the simulated extraction conditions led to butanol productioncost that was higher than those of in situ stripping model.
3.2.2. Energy Requirements
Figure 14 illustrates the energy consumption distribution in each simulated model of differentproduct separation technologies. Note that the energy requirements were assessed from the simulationdata. The reduction of energy requirement by subtracting the energy content of the products(net energy value) was not conducted. The most critical processing stages were product separation andpurification (downstream processing) with a notable variation of energy required between each model.The highest energy consumption was recorded by the adsorption model (see Figure 13). It was primarily
Energies 2020, 13, 181 18 of 26
contributed by the product purification section (20.42 MJ/L), while its product separation stage used0.37 MJ/L. The same trend was recorded by pervaporation model with the energy requirement of theproduct purification stage (9.36 MJ/L) was multiple degrees higher than those of product separationstage (1.71 MJ/L).Energies 2020, 13, x FOR PEER REVIEW 20 of 29
Figure 14. Energy requirements from each processing stage for simulated butanol production using different product separation technologies. UE—unlisted equipment.
The in situ stripping and dual extraction model recorded contrary results with product separation stage requiring the highest energy. Oudshoorn et al. [13] had calculated the energy requirement of butanol separation at various conditions. They assessed gas stripping, pervaporation, extraction, and adsorption technologies and obtained an energy requirement (at ideal conditions) that was similar to those recorded in this work.
In the in situ stripping process, the vacuum pump that facilitated the exit of purged CO2, as well as the purging mechanism itself, consumed a substantial amount of electricity. Other than that, beer distillation that was installed to recover the unstripped products in the retired fermentation broth used substantial amounts of energy due to the high volume of the fermentation broth. In addition to that, beer distillation only managed to moderately reduce the water content, resulting in moderately high energy requirement in the subsequent acetone, ethanol, and butanol distillation processes.
In the dual extraction process, the regeneration column, a series of the flash columns, as well as cooling and heating processes, have led to the high energy requirement of this process. The further product purification stage, however, required low energy because most of the water and extractants have been separated in the product separation stage.
In the adsorption process, the column heating required lower energy than those needed by the series of distillation in the product purification stage. In addition to that, the hydrophobic adsorbent only has selectivities towards acetone and butanol. There was no water removal stream from the adsorption column because the stream that escaped from the adsorbent contains ethanol, which eventually increased subsequent distillation work. Similarly, in the pervaporation process, stream heating in the product separation stage was a lot less than those required in the following distillation processes.
The total energy requirement for butanol production modeled using in situ stripping, adsorption, pervaporation, and dual extraction product separation technologies were 23.75 MJ/L, 30.11 MJ/L, 19.43 MJ/L, and 21.51 MJ/L, respectively. Comparing only between product separation stages, those recording the lowest energy consumption were the adsorption technology. However, for the overall downstream section, the pervaporation process was the lowest energy method for ABE fermentation, followed by dual extraction, in situ stripping, and adsorption technologies with the energy requirement of 11.06 MJ/L, 13.08 MJ/L, 14.29 MJ/L, and 20.79 MJ/L, respectively. Dual extraction possesses high potential in further cost reduction by using more efficient extractants that
0
5
10
15
20
25
In-situ stripping Adsorption Pervaporation Dual extraction
Ener
gy re
quire
men
t (M
J/L b
utan
ol)
PretreatmentEnzyme hydrolysisFermentationProducts separationProducts purificationUtilities generationUE & General load
Figure 14. Energy requirements from each processing stage for simulated butanol production usingdifferent product separation technologies. UE—unlisted equipment.
The in situ stripping and dual extraction model recorded contrary results with product separationstage requiring the highest energy. Oudshoorn et al. [13] had calculated the energy requirement ofbutanol separation at various conditions. They assessed gas stripping, pervaporation, extraction, andadsorption technologies and obtained an energy requirement (at ideal conditions) that was similar tothose recorded in this work.
In the in situ stripping process, the vacuum pump that facilitated the exit of purged CO2, as wellas the purging mechanism itself, consumed a substantial amount of electricity. Other than that, beerdistillation that was installed to recover the unstripped products in the retired fermentation broth usedsubstantial amounts of energy due to the high volume of the fermentation broth. In addition to that,beer distillation only managed to moderately reduce the water content, resulting in moderately highenergy requirement in the subsequent acetone, ethanol, and butanol distillation processes.
In the dual extraction process, the regeneration column, a series of the flash columns, as well ascooling and heating processes, have led to the high energy requirement of this process. The furtherproduct purification stage, however, required low energy because most of the water and extractantshave been separated in the product separation stage.
In the adsorption process, the column heating required lower energy than those needed bythe series of distillation in the product purification stage. In addition to that, the hydrophobicadsorbent only has selectivities towards acetone and butanol. There was no water removal streamfrom the adsorption column because the stream that escaped from the adsorbent contains ethanol,which eventually increased subsequent distillation work. Similarly, in the pervaporation process,stream heating in the product separation stage was a lot less than those required in the followingdistillation processes.
The total energy requirement for butanol production modeled using in situ stripping, adsorption,pervaporation, and dual extraction product separation technologies were 23.75 MJ/L, 30.11 MJ/L,19.43 MJ/L, and 21.51 MJ/L, respectively. Comparing only between product separation stages, thoserecording the lowest energy consumption were the adsorption technology. However, for the overalldownstream section, the pervaporation process was the lowest energy method for ABE fermentation,followed by dual extraction, in situ stripping, and adsorption technologies with the energy requirement
Energies 2020, 13, 181 19 of 26
of 11.06 MJ/L, 13.08 MJ/L, 14.29 MJ/L, and 20.79 MJ/L, respectively. Dual extraction possesses highpotential in further cost reduction by using more efficient extractants that could give better separationefficiencies. It is also worth highlighting that pervaporation technology possesses huge potential dueto its low energy consumption and high product yields.
Available works from others recorded energy requirements in the range of 50–79 MJ/kg (41–64 MJ/L)for conventional distillation product purification in ABE fermentation process [13,61]. Energy requirementsrecorded by modern technologies assessed in this study were lower than those conventional methods.Nevertheless, considering the energy content of butanol (~28 MJ/L), the adsorption model withthe conditions evaluated in this study was regarded as an energy sink and, therefore, unfeasiblefor commercialization.
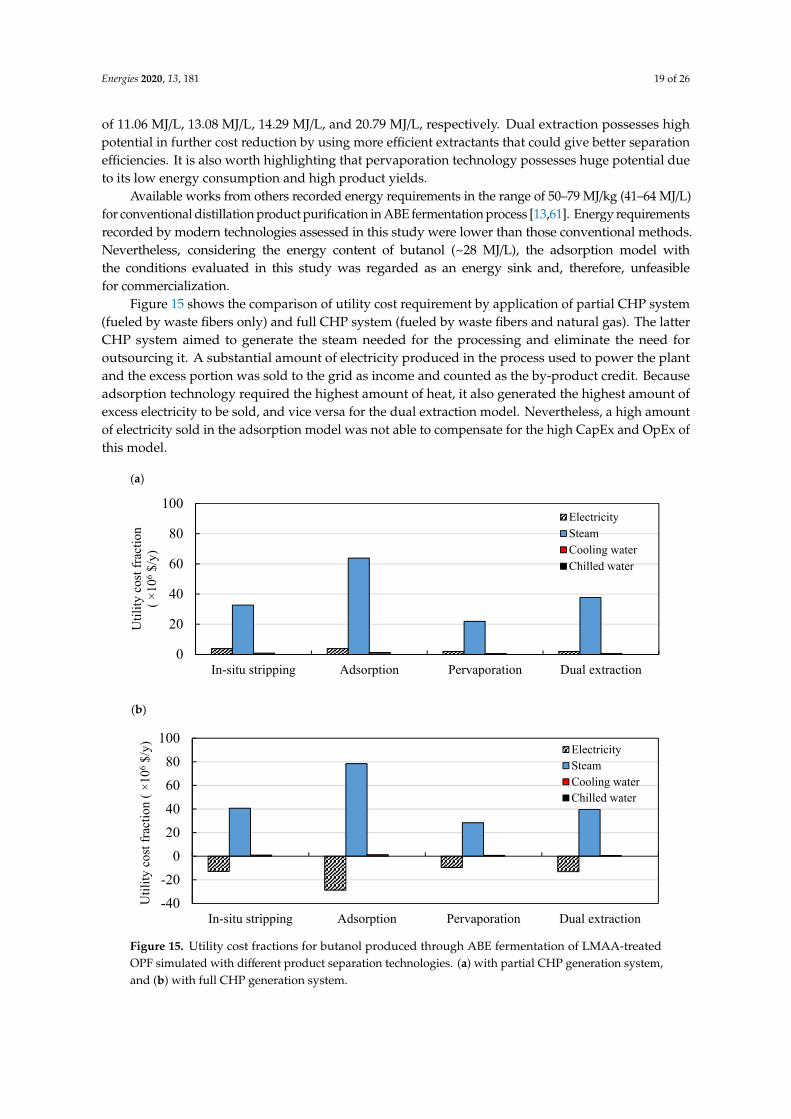
Figure 15 shows the comparison of utility cost requirement by application of partial CHP system(fueled by waste fibers only) and full CHP system (fueled by waste fibers and natural gas). The latterCHP system aimed to generate the steam needed for the processing and eliminate the need foroutsourcing it. A substantial amount of electricity produced in the process used to power the plantand the excess portion was sold to the grid as income and counted as the by-product credit. Becauseadsorption technology required the highest amount of heat, it also generated the highest amount ofexcess electricity to be sold, and vice versa for the dual extraction model. Nevertheless, a high amountof electricity sold in the adsorption model was not able to compensate for the high CapEx and OpEx ofthis model.
Energies 2020, 13, x FOR PEER REVIEW 21 of 29
could give better separation efficiencies. It is also worth highlighting that pervaporation technology possesses huge potential due to its low energy consumption and high product yields.
Available works from others recorded energy requirements in the range of 50–79 MJ/kg (41–64 MJ/L) for conventional distillation product purification in ABE fermentation process [13,61]. Energy requirements recorded by modern technologies assessed in this study were lower than those conventional methods. Nevertheless, considering the energy content of butanol (~28 MJ/L), the adsorption model with the conditions evaluated in this study was regarded as an energy sink and, therefore, unfeasible for commercialization.
Figure 15 shows the comparison of utility cost requirement by application of partial CHP system (fueled by waste fibers only) and full CHP system (fueled by waste fibers and natural gas). The latter CHP system aimed to generate the steam needed for the processing and eliminate the need for outsourcing it. A substantial amount of electricity produced in the process used to power the plant and the excess portion was sold to the grid as income and counted as the by-product credit. Because adsorption technology required the highest amount of heat, it also generated the highest amount of excess electricity to be sold, and vice versa for the dual extraction model. Nevertheless, a high amount of electricity sold in the adsorption model was not able to compensate for the high CapEx and OpEx of this model.
Figure 15. Utility cost fractions for butanol produced through ABE fermentation of LMAA-treated OPF simulated with different product separation technologies. (a) with partial CHP generation system, and (b) with full CHP generation system.
0
20
40
60
80
100
In-situ stripping Adsorption Pervaporation Dual extraction
Util
ity c
ost f
ract
ion
( ×10
6$/
y)
(a)
ElectricitySteamCooling waterChilled water
-40-20
020406080
100
In-situ stripping Adsorption Pervaporation Dual extraction
Util
ity c
ost f
ract
ion
( ×10
6$/
y)
(b)
ElectricitySteamCooling waterChilled water
Figure 15. Utility cost fractions for butanol produced through ABE fermentation of LMAA-treatedOPF simulated with different product separation technologies. (a) with partial CHP generation system,and (b) with full CHP generation system.
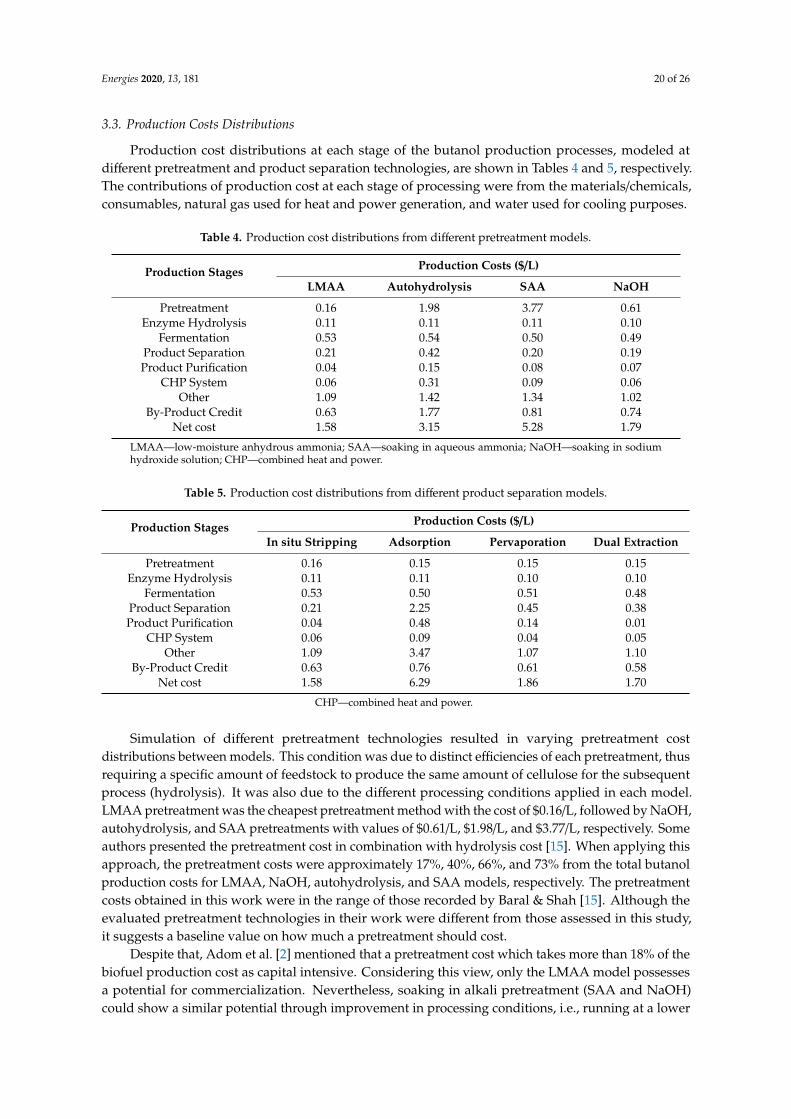
Energies 2020, 13, 181 20 of 26
3.3. Production Costs Distributions
Production cost distributions at each stage of the butanol production processes, modeled atdifferent pretreatment and product separation technologies, are shown in Tables 4 and 5, respectively.The contributions of production cost at each stage of processing were from the materials/chemicals,consumables, natural gas used for heat and power generation, and water used for cooling purposes.
Table 4. Production cost distributions from different pretreatment models.
Production Stages Production Costs ($/L)
LMAA Autohydrolysis SAA NaOH
Pretreatment 0.16 1.98 3.77 0.61Enzyme Hydrolysis 0.11 0.11 0.11 0.10
Fermentation 0.53 0.54 0.50 0.49Product Separation 0.21 0.42 0.20 0.19Product Purification 0.04 0.15 0.08 0.07
CHP System 0.06 0.31 0.09 0.06Other 1.09 1.42 1.34 1.02
By-Product Credit 0.63 1.77 0.81 0.74Net cost 1.58 3.15 5.28 1.79
LMAA—low-moisture anhydrous ammonia; SAA—soaking in aqueous ammonia; NaOH—soaking in sodiumhydroxide solution; CHP—combined heat and power.
Table 5. Production cost distributions from different product separation models.
Production Stages Production Costs ($/L)
In situ Stripping Adsorption Pervaporation Dual Extraction
Pretreatment 0.16 0.15 0.15 0.15Enzyme Hydrolysis 0.11 0.11 0.10 0.10
Fermentation 0.53 0.50 0.51 0.48Product Separation 0.21 2.25 0.45 0.38Product Purification 0.04 0.48 0.14 0.01
CHP System 0.06 0.09 0.04 0.05Other 1.09 3.47 1.07 1.10
By-Product Credit 0.63 0.76 0.61 0.58Net cost 1.58 6.29 1.86 1.70
CHP—combined heat and power.
Simulation of different pretreatment technologies resulted in varying pretreatment costdistributions between models. This condition was due to distinct efficiencies of each pretreatment, thusrequiring a specific amount of feedstock to produce the same amount of cellulose for the subsequentprocess (hydrolysis). It was also due to the different processing conditions applied in each model.LMAA pretreatment was the cheapest pretreatment method with the cost of $0.16/L, followed by NaOH,autohydrolysis, and SAA pretreatments with values of $0.61/L, $1.98/L, and $3.77/L, respectively. Someauthors presented the pretreatment cost in combination with hydrolysis cost [15]. When applying thisapproach, the pretreatment costs were approximately 17%, 40%, 66%, and 73% from the total butanolproduction costs for LMAA, NaOH, autohydrolysis, and SAA models, respectively. The pretreatmentcosts obtained in this work were in the range of those recorded by Baral & Shah [15]. Although theevaluated pretreatment technologies in their work were different from those assessed in this study,it suggests a baseline value on how much a pretreatment should cost.
Despite that, Adom et al. [2] mentioned that a pretreatment cost which takes more than 18% of thebiofuel production cost as capital intensive. Considering this view, only the LMAA model possessesa potential for commercialization. Nevertheless, soaking in alkali pretreatment (SAA and NaOH)could show a similar potential through improvement in processing conditions, i.e., running at a lower
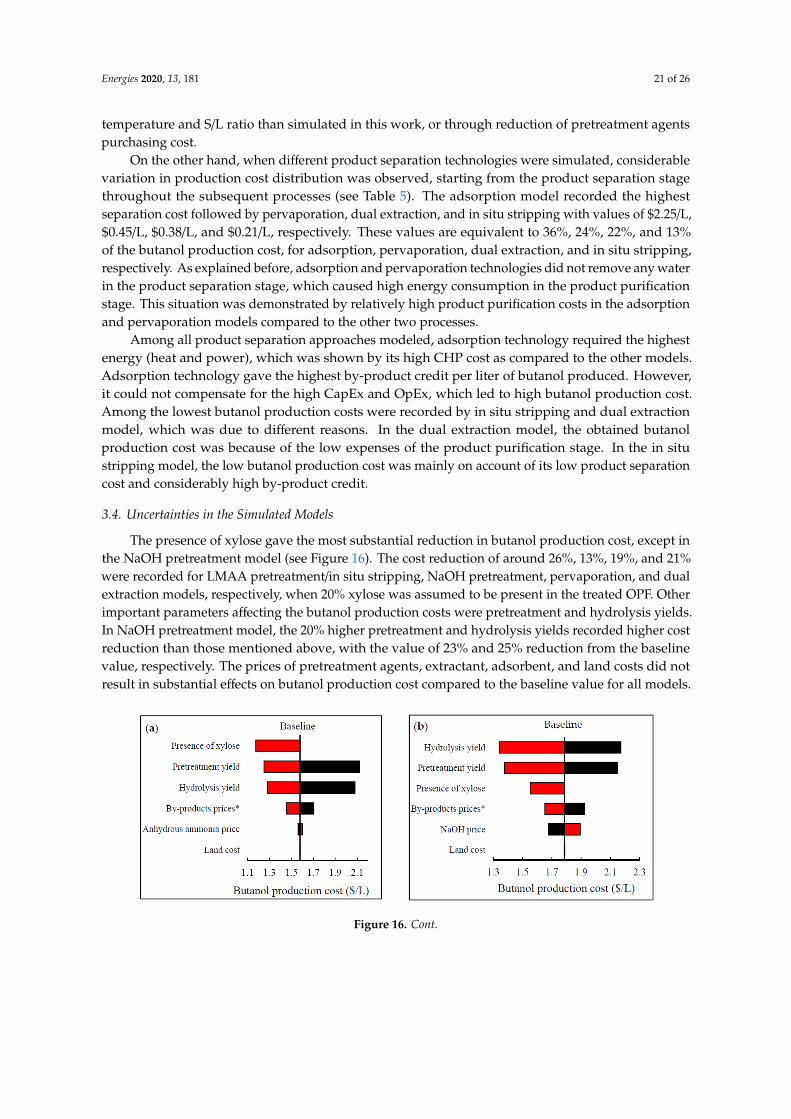
Energies 2020, 13, 181 21 of 26
temperature and S/L ratio than simulated in this work, or through reduction of pretreatment agentspurchasing cost.
On the other hand, when different product separation technologies were simulated, considerablevariation in production cost distribution was observed, starting from the product separation stagethroughout the subsequent processes (see Table 5). The adsorption model recorded the highestseparation cost followed by pervaporation, dual extraction, and in situ stripping with values of $2.25/L,$0.45/L, $0.38/L, and $0.21/L, respectively. These values are equivalent to 36%, 24%, 22%, and 13%of the butanol production cost, for adsorption, pervaporation, dual extraction, and in situ stripping,respectively. As explained before, adsorption and pervaporation technologies did not remove any waterin the product separation stage, which caused high energy consumption in the product purificationstage. This situation was demonstrated by relatively high product purification costs in the adsorptionand pervaporation models compared to the other two processes.
Among all product separation approaches modeled, adsorption technology required the highestenergy (heat and power), which was shown by its high CHP cost as compared to the other models.Adsorption technology gave the highest by-product credit per liter of butanol produced. However,it could not compensate for the high CapEx and OpEx, which led to high butanol production cost.Among the lowest butanol production costs were recorded by in situ stripping and dual extractionmodel, which was due to different reasons. In the dual extraction model, the obtained butanolproduction cost was because of the low expenses of the product purification stage. In the in situstripping model, the low butanol production cost was mainly on account of its low product separationcost and considerably high by-product credit.
3.4. Uncertainties in the Simulated Models
The presence of xylose gave the most substantial reduction in butanol production cost, except inthe NaOH pretreatment model (see Figure 16). The cost reduction of around 26%, 13%, 19%, and 21%were recorded for LMAA pretreatment/in situ stripping, NaOH pretreatment, pervaporation, and dualextraction models, respectively, when 20% xylose was assumed to be present in the treated OPF. Otherimportant parameters affecting the butanol production costs were pretreatment and hydrolysis yields.In NaOH pretreatment model, the 20% higher pretreatment and hydrolysis yields recorded higher costreduction than those mentioned above, with the value of 23% and 25% reduction from the baselinevalue, respectively. The prices of pretreatment agents, extractant, adsorbent, and land costs did notresult in substantial effects on butanol production cost compared to the baseline value for all models.
Energies 2020, 13, x FOR PEER REVIEW 23 of 29
NaOH) could show a similar potential through improvement in processing conditions, i.e., running at a lower temperature and S/L ratio than simulated in this work, or through reduction of pretreatment agents purchasing cost.
On the other hand, when different product separation technologies were simulated, considerable variation in production cost distribution was observed, starting from the product separation stage throughout the subsequent processes (see Table 5). The adsorption model recorded the highest separation cost followed by pervaporation, dual extraction, and in situ stripping with values of $2.25/L, $0.45/L, $0.38/L, and $0.21/L, respectively. These values are equivalent to 36%, 24%, 22%, and 13% of the butanol production cost, for adsorption, pervaporation, dual extraction, and in situ stripping, respectively. As explained before, adsorption and pervaporation technologies did not remove any water in the product separation stage, which caused high energy consumption in the product purification stage. This situation was demonstrated by relatively high product purification costs in the adsorption and pervaporation models compared to the other two processes.
Among all product separation approaches modeled, adsorption technology required the highest energy (heat and power), which was shown by its high CHP cost as compared to the other models. Adsorption technology gave the highest by-product credit per liter of butanol produced. However, it could not compensate for the high CapEx and OpEx, which led to high butanol production cost. Among the lowest butanol production costs were recorded by in situ stripping and dual extraction model, which was due to different reasons. In the dual extraction model, the obtained butanol production cost was because of the low expenses of the product purification stage. In the in situ stripping model, the low butanol production cost was mainly on account of its low product separation cost and considerably high by-product credit.
3.4. Uncertainties in the Simulated Models
The presence of xylose gave the most substantial reduction in butanol production cost, except in the NaOH pretreatment model (see Figure 16). The cost reduction of around 26%, 13%, 19%, and 21% were recorded for LMAA pretreatment/in situ stripping, NaOH pretreatment, pervaporation, and dual extraction models, respectively, when 20% xylose was assumed to be present in the treated OPF. Other important parameters affecting the butanol production costs were pretreatment and hydrolysis yields. In NaOH pretreatment model, the 20% higher pretreatment and hydrolysis yields recorded higher cost reduction than those mentioned above, with the value of 23% and 25% reduction from the baseline value, respectively. The prices of pretreatment agents, extractant, adsorbent, and land costs did not result in substantial effects on butanol production cost compared to the baseline value for all models.
Figure 16. Cont.
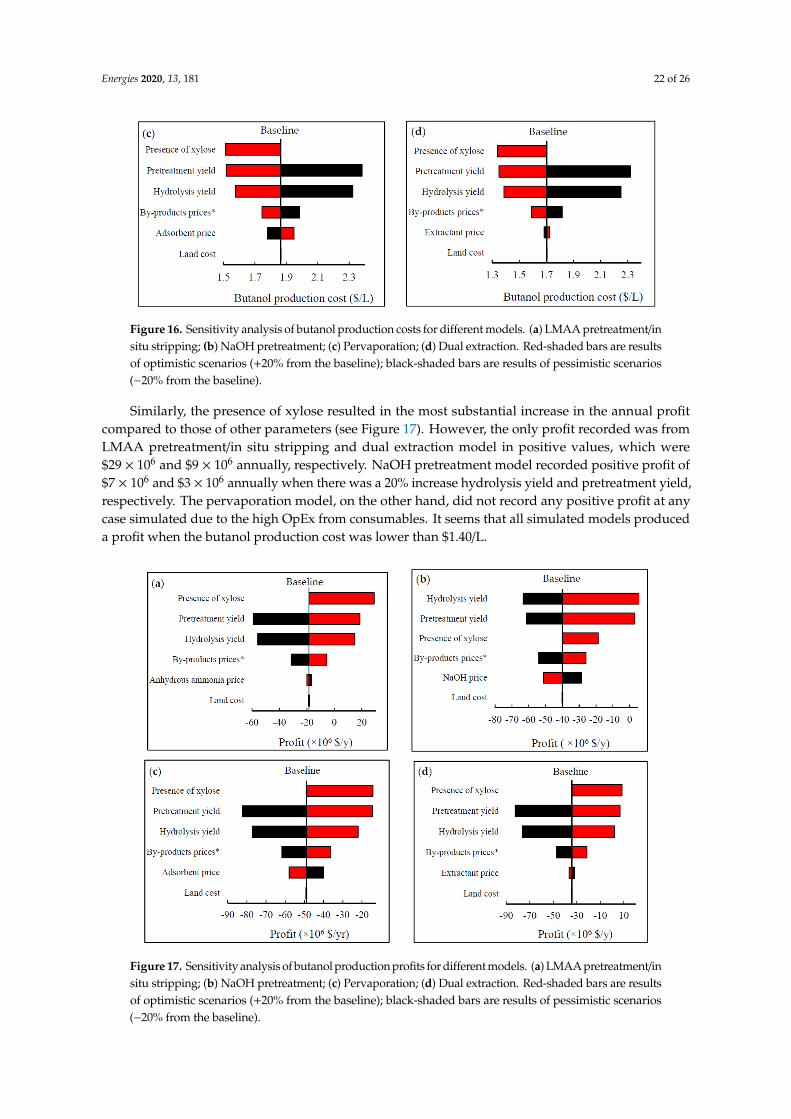
Energies 2020, 13, 181 22 of 26
Energies 2020, 13, x FOR PEER REVIEW 24 of 29
Figure 16. Sensitivity analysis of butanol production costs for different models. (a) LMAA pretreatment/in situ stripping; (b) NaOH pretreatment; (c) Pervaporation; (d) Dual extraction. Red-shaded bars are results of optimistic scenarios (+20% from the baseline); black-shaded bars are results of pessimistic scenarios (−20% from the baseline).
Similarly, the presence of xylose resulted in the most substantial increase in the annual profit compared to those of other parameters (see Figure 17). However, the only profit recorded was from LMAA pretreatment/in situ stripping and dual extraction model in positive values, which were $29 × 106 and $9 × 10⁶ annually, respectively. NaOH pretreatment model recorded positive profit of $7 × 10⁶ and $3 × 10⁶ annually when there was a 20% increase hydrolysis yield and pretreatment yield, respectively. The pervaporation model, on the other hand, did not record any positive profit at any case simulated due to the high OpEx from consumables. It seems that all simulated models produced a profit when the butanol production cost was lower than $1.40/L.
Figure 17. Sensitivity analysis of butanol production profits for different models. (a) LMAA pretreatment/in situ stripping; (b) NaOH pretreatment; (c) Pervaporation; (d) Dual extraction.
Figure 16. Sensitivity analysis of butanol production costs for different models. (a) LMAA pretreatment/insitu stripping; (b) NaOH pretreatment; (c) Pervaporation; (d) Dual extraction. Red-shaded bars are resultsof optimistic scenarios (+20% from the baseline); black-shaded bars are results of pessimistic scenarios(−20% from the baseline).
Similarly, the presence of xylose resulted in the most substantial increase in the annual profitcompared to those of other parameters (see Figure 17). However, the only profit recorded was fromLMAA pretreatment/in situ stripping and dual extraction model in positive values, which were$29 × 106 and $9 × 10⁶ annually, respectively. NaOH pretreatment model recorded positive profit of$7 × 10⁶ and $3 × 10⁶ annually when there was a 20% increase hydrolysis yield and pretreatment yield,respectively. The pervaporation model, on the other hand, did not record any positive profit at anycase simulated due to the high OpEx from consumables. It seems that all simulated models produceda profit when the butanol production cost was lower than $1.40/L.
Energies 2020, 13, x FOR PEER REVIEW 24 of 29
Figure 16. Sensitivity analysis of butanol production costs for different models. (a) LMAA pretreatment/in situ stripping; (b) NaOH pretreatment; (c) Pervaporation; (d) Dual extraction. Red-shaded bars are results of optimistic scenarios (+20% from the baseline); black-shaded bars are results of pessimistic scenarios (−20% from the baseline).
Similarly, the presence of xylose resulted in the most substantial increase in the annual profit compared to those of other parameters (see Figure 17). However, the only profit recorded was from LMAA pretreatment/in situ stripping and dual extraction model in positive values, which were $29 × 106 and $9 × 10⁶ annually, respectively. NaOH pretreatment model recorded positive profit of $7 × 10⁶ and $3 × 10⁶ annually when there was a 20% increase hydrolysis yield and pretreatment yield, respectively. The pervaporation model, on the other hand, did not record any positive profit at any case simulated due to the high OpEx from consumables. It seems that all simulated models produced a profit when the butanol production cost was lower than $1.40/L.
Figure 17. Sensitivity analysis of butanol production profits for different models. (a) LMAA pretreatment/in situ stripping; (b) NaOH pretreatment; (c) Pervaporation; (d) Dual extraction.
Figure 17. Sensitivity analysis of butanol production profits for different models. (a) LMAA pretreatment/insitu stripping; (b) NaOH pretreatment; (c) Pervaporation; (d) Dual extraction. Red-shaded bars are resultsof optimistic scenarios (+20% from the baseline); black-shaded bars are results of pessimistic scenarios(−20% from the baseline).
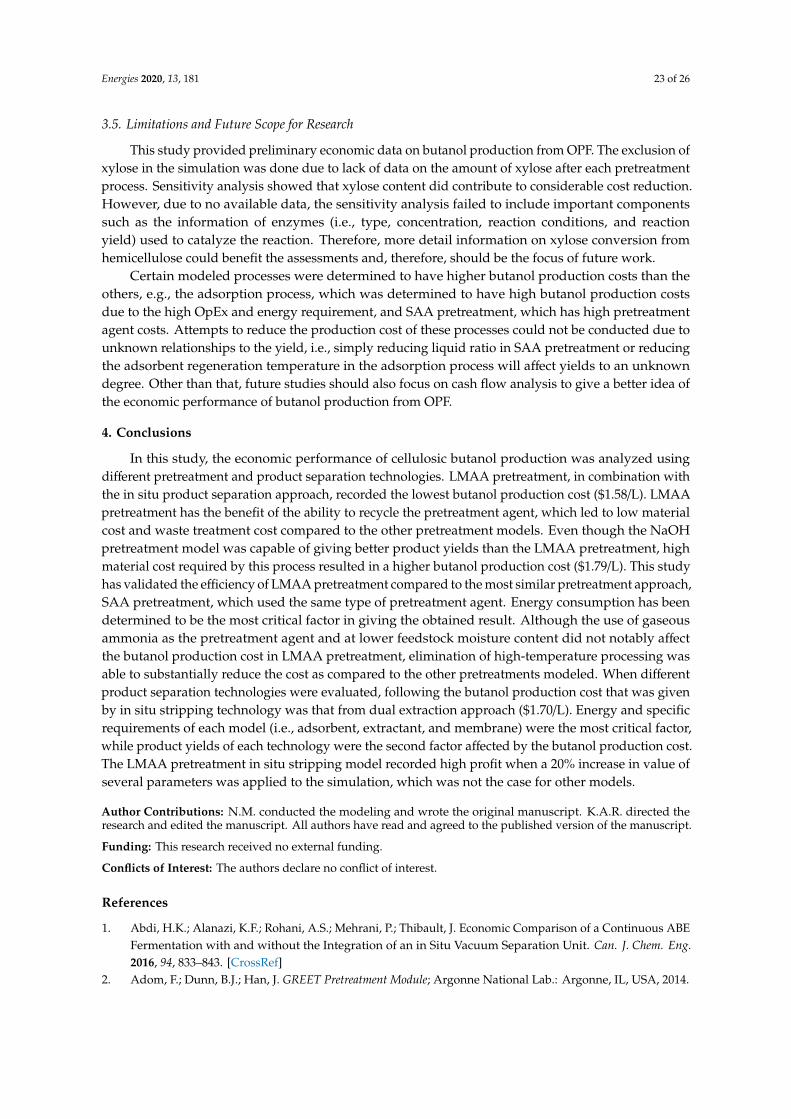
Energies 2020, 13, 181 23 of 26
3.5. Limitations and Future Scope for Research
This study provided preliminary economic data on butanol production from OPF. The exclusion ofxylose in the simulation was done due to lack of data on the amount of xylose after each pretreatmentprocess. Sensitivity analysis showed that xylose content did contribute to considerable cost reduction.However, due to no available data, the sensitivity analysis failed to include important componentssuch as the information of enzymes (i.e., type, concentration, reaction conditions, and reactionyield) used to catalyze the reaction. Therefore, more detail information on xylose conversion fromhemicellulose could benefit the assessments and, therefore, should be the focus of future work.
Certain modeled processes were determined to have higher butanol production costs than theothers, e.g., the adsorption process, which was determined to have high butanol production costsdue to the high OpEx and energy requirement, and SAA pretreatment, which has high pretreatmentagent costs. Attempts to reduce the production cost of these processes could not be conducted due tounknown relationships to the yield, i.e., simply reducing liquid ratio in SAA pretreatment or reducingthe adsorbent regeneration temperature in the adsorption process will affect yields to an unknowndegree. Other than that, future studies should also focus on cash flow analysis to give a better idea ofthe economic performance of butanol production from OPF.
4. Conclusions
In this study, the economic performance of cellulosic butanol production was analyzed usingdifferent pretreatment and product separation technologies. LMAA pretreatment, in combination withthe in situ product separation approach, recorded the lowest butanol production cost ($1.58/L). LMAApretreatment has the benefit of the ability to recycle the pretreatment agent, which led to low materialcost and waste treatment cost compared to the other pretreatment models. Even though the NaOHpretreatment model was capable of giving better product yields than the LMAA pretreatment, highmaterial cost required by this process resulted in a higher butanol production cost ($1.79/L). This studyhas validated the efficiency of LMAA pretreatment compared to the most similar pretreatment approach,SAA pretreatment, which used the same type of pretreatment agent. Energy consumption has beendetermined to be the most critical factor in giving the obtained result. Although the use of gaseousammonia as the pretreatment agent and at lower feedstock moisture content did not notably affectthe butanol production cost in LMAA pretreatment, elimination of high-temperature processing wasable to substantially reduce the cost as compared to the other pretreatments modeled. When differentproduct separation technologies were evaluated, following the butanol production cost that was givenby in situ stripping technology was that from dual extraction approach ($1.70/L). Energy and specificrequirements of each model (i.e., adsorbent, extractant, and membrane) were the most critical factor,while product yields of each technology were the second factor affected by the butanol production cost.The LMAA pretreatment in situ stripping model recorded high profit when a 20% increase in value ofseveral parameters was applied to the simulation, which was not the case for other models.
Author Contributions: N.M. conducted the modeling and wrote the original manuscript. K.A.R. directed theresearch and edited the manuscript. All authors have read and agreed to the published version of the manuscript.
Funding: This research received no external funding.
Conflicts of Interest: The authors declare no conflict of interest.
References
1. Abdi, H.K.; Alanazi, K.F.; Rohani, A.S.; Mehrani, P.; Thibault, J. Economic Comparison of a Continuous ABEFermentation with and without the Integration of an in Situ Vacuum Separation Unit. Can. J. Chem. Eng.2016, 94, 833–843. [CrossRef]
2. Adom, F.; Dunn, B.J.; Han, J. GREET Pretreatment Module; Argonne National Lab.: Argonne, IL, USA, 2014.
Energies 2020, 13, 181 24 of 26
3. Kurkijärvi, A.J.; Melin, K.; Lehtonen, J. Comparison of Reactive Distillation and Dual Extraction Processesfor the Separation of Acetone, Butanol, and Ethanol from Fermentation Broth. Ind. Eng. Chem. Res. 2016, 55,1952–1964. [CrossRef]
4. Outram, V.; Lalander, C.A.; Lee, J.G.M.; Davies, E.T.; Harvey, A.P. Applied in Situ Product Recovery in ABEFermentation. Biotechnol. Prog. 2017, 33, 563–579. [CrossRef] [PubMed]
5. Karimi, K.; Tabatabaei, M.; Horváth, I.S.; Kumar, R. Recent Trends in Acetone, Butanol, and Ethanol (ABE)Production. Biofuel Res. J. 2015, 8, 301–308. [CrossRef]
6. Maiti, S.; Gallastegui, G.; Sarma, S.J.; Brar, S.K.; Le Bihan, Y.; Drogui, P.; Buelna, G.; Verma, M. A Re-Look atthe Biochemical Strategies to Enhance Butanol Production. Biomass Bioenergy 2016, 94, 187–200. [CrossRef]
7. Friedl, A. Downstream Process Options for the ABE Fermentation. FEMS Microbiol. Lett. 2016, 363. [CrossRef]8. Vane, L.M. Separation Technologies for the Recovery and Dehydration of Alcohols from Fermentation Broths.
Biofuels Bioprod. Biorefin. 2008, 2, 553–588. [CrossRef]9. Ezeji, T.C.; Qureshi, N.; Blaschek, H.P. Microbial Production of a Biofuel (Acetone-Butanol-Ethanol) in a
Continuous Bioreactor: Impact of Bleed and Simultaneous Product Removal. Bioprocess Biosyst. Eng. 2013,36, 109–116. [CrossRef]
10. Huang, H.J.; Ramaswamy, S.; Liu, Y. Separation and Purification of Biobutanol during Bioconversion ofBiomass. Sep. Purif. Technol. 2014, 132, 513–540. [CrossRef]
11. Abdehagh, N.; Tezel, F.H.; Thibault, J. Separation Techniques in Butanol Production: Challenges andDevelopments. Biomass Bioenergy 2014, 60, 222–246. [CrossRef]
12. Ezeji, T.C.; Qureshi, N.; Blaschek, H.P. Butanol Fermentation Research: Upstream and DownstreamManipulations. Chem. Rec. 2004, 4, 305–314. [CrossRef] [PubMed]
13. Oudshoorn, A.; Van Der Wielen, L.A.M.; Straathof, A.J.J. Assessment of Options for Selective 1-ButanolRecovery from Aqueous Solution. Ind. Eng. Chem. Res. 2009, 48, 7325–7336. [CrossRef]
14. Sánchez-Ramírez, E.; Quiroz-Ramírez, J.J.; Segovia-Hernández, J.G.; Hernández, S.; Bonilla-Petriciolet, A.Process Alternatives for Biobutanol Purification: Design and Optimization. Ind. Eng. Chem. Res. 2015, 54,351–358. [CrossRef]
15. Baral, N.R.; Shah, A. Comparative Techno-Economic Analysis of Steam Explosion, Dilute Sulfuric Acid,Ammonia Fiber Explosion and Biological Pretreatments of Corn Stover. Bioresour. Technol. 2017, 232, 331–343.[CrossRef] [PubMed]
16. Yoo, C.G.; Nghiem, N.P.; Hicks, K.B.; Kim, T.H. Pretreatment of Corn Stover Using Low-Moisture AnhydrousAmmonia (LMAA) Process. Bioresour. Technol. 2011, 102, 10028–10034. [CrossRef]
17. Nghiem, N.P.; Senske, G.E.; Kim, T.H. Pretreatment of Corn Stover by Low Moisture Anhydrous Ammonia(LMAA) in a Pilot-Scale Reactor and Bioconversion to Fuel Ethanol and Industrial Chemicals. Appl. Biochem.Biotechnol. 2016, 179, 111–125. [CrossRef]
18. Díaz, V.H.G.; Tost, G.O. Techno-Economic Analysis of Extraction-Based Separation Systems for Acetone,Butanol, and Ethanol Recovery and Purification. Bioresour. Bioprocess. 2017, 4. [CrossRef]
19. Qureshi, N.; Hughes, S.; Maddox, I.S.; Cotta, M.A. Energy-Efficient Recovery of Butanol from Model Solutionsand Fermentation Broth by Adsorption. Bioprocess Biosyst. Eng. 2005, 27, 215–222. [CrossRef]
20. Abdehagh, N.; Tezel, F.H.; Thibault, J. Adsorbent Screening for Biobutanol Separation by Adsorption:Kinetics, Isotherms and Competitive Effect of Other Compounds. Adsorption 2013, 19, 1263–1272. [CrossRef]
21. Abdehagh, N.; Gurnani, P.; Tezel, F.H.; Thibault, J. Adsorptive Separation and Recovery of Biobutanol fromABE Model Solutions. Adsorption 2015, 21, 185–194. [CrossRef]
22. Van Hecke, W.; Hofmann, T.; De Wever, H. Pervaporative Recovery of ABE during Continuous Cultivation:Enhancement of Performance. Bioresour. Technol. 2013, 129, 421–429. [CrossRef] [PubMed]
23. Chen, C.; Xiao, Z.; Tang, X.; Cui, H.; Zhang, J.; Li, W.; Ying, C. Acetone-Butanol-Ethanol Fermentation ina Continuous and Closed-Circulating Fermentation System with PDMS Membrane Bioreactor. Bioresour.Technol. 2013, 128, 246–251. [CrossRef] [PubMed]
24. Van Hecke, W.; Vandezande, P.; Claes, S.; Vangeel, S.; Beckers, H.; Diels, L.; De Wever, H. IntegratedBioprocess for Long-Term Continuous Cultivation of Clostridium Acetobutylicum Coupled to Pervaporationwith PDMS Composite Membranes. Bioresour. Technol. 2012, 111, 368–377. [CrossRef] [PubMed]
25. Negishi, H.; Sakaki, K.; Ikegami, T. Silicalite Pervaporation Membrane Exhibiting a Separation Factor of over400 for Butanol. Chem. Lett. 2010, 39, 1312–1314. [CrossRef]
Energies 2020, 13, 181 25 of 26
26. Qureshi, N.; Blaschek, H.P. Production of Acetone Butanol Ethanol (ABE) by a Hyper-Producing MutantStrain of Clostridium Beijerinckii BA101 and Recovery by Pervaporation. Biotechnol. Prog. 1999, 15, 594–602.[CrossRef]
27. de Vrije, T.; Budde, M.; van der Wal, H.; Claassen, P.A.M.; López-Contreras, A.M. In Situ Removal ofIsopropanol, Butanol and Ethanol from Fermentation Broth by Gas Stripping. Bioresour. Technol. 2013, 137,153–159. [CrossRef]
28. Xue, C.; Zhao, J.; Liu, F.; Lu, C.; Yang, S.T.; Bai, F.W. Two-Stage in Situ Gas Stripping for Enhanced ButanolFermentation and Energy-Saving Product Recovery. Bioresour. Technol. 2013, 135, 396–402. [CrossRef]
29. Department of Agriculture Malaysia. Industrial Crops Statistics; Department of Agriculture Malaysia:Putrajaya, Malaysia, 2016.
30. Cheng, M.; Rosentrater, K.A. Optimization of Low Moisture Anhydrous Ammonia (LMAA) Pretreatment forCorn Stover Enzymatic Digestibility during Hydrolysis Process. In Proceedings of the 2016 ASABE AnnualInternational Meeting, Orlando, FL, USA, 17–20 July 2016. [CrossRef]
31. Yang, M.; Rosentrater, K.A. Small-Scale Low-Moisture Anhydrous Ammonia (LMAA) Pretreatment of CornStover. Biomass Bioenergy 2017, 97, 38–42. [CrossRef]
32. Mahmud, N. Low Moisture Anhydrous Ammonia (LMAA) Pretreatment of Lignocellulosic Biomass andAssessments for Biobutanol Production. Ph.D. Thesis, Iowa State University, Ames, IA, USA, 2019.
33. Sabiha-Hanim, S.; Noor, M.A.M.; Rosma, A. Effect of Autohydrolysis and Enzymatic Treatment on Oil Palm(Elaeis Guineensis Jacq.) Frond Fibres for Xylose and Xylooligosaccharides Production. Bioresour. Technol.2011, 102, 1234–1239. [CrossRef]
34. Jung, Y.H.; Kim, S.; Yang, T.H.; Lee, H.J.; Seung, D.; Park, Y.-C.; Seo, J.-H.; Choi, I.-G.; Kim, K.H. AqueousAmmonia Pretreatment, Saccharification, and Fermentation Evaluation of Oil Palm Fronds for EthanolProduction. Bioprocess Biosyst. Eng. 2012, 35, 1497–1503. [CrossRef]
35. Sukri, S.S.M.; Rahman, R.A.; Illias, R.M.D.; Yaakob, H. Optimization of Alkaline Pretreatment Conditions ofOil Palm Fronds in Improving the Lignocelluloses Contents for Reducing Sugar Production. Rom. Biotechnol.Lett. 2014, 19, 9006–9018. [CrossRef]
36. Triwahyuni, E.; Hariyanti, S.; Dahnum, D.; Nurdin, M.; Abimanyu, H. Optimization of Saccharification andFermentation Process in Bioethanol Production from Oil Palm Fronds. Procedia Chem. 2015, 16, 141–148.[CrossRef]
37. Ezeji, T.C.; Blaschek, H.P. Fermentation of Dried Distillers’ Grains and Solubles (DDGS) Hydrolysates toSolvents and Value-Added Products by Solventogenic Clostridia. Bioresour. Technol. 2008, 99, 5232–5242.[CrossRef] [PubMed]
38. Tao, L.; He, X.; Tan, E.C.D.; Zhang, M.; Aden, A. Comparative Techno-Economic Analysis and Reviewsof n-Butanol Production from Corn Grain and Corn Stover. Biofuels Bioprod. Biorefin. 2014, 8, 342–361.[CrossRef]
39. Qureshi, N.; Ezeji, T.C.; Ebener, J.; Dien, B.S.; Cotta, M.A.; Blaschek, H.P. Butanol Production by ClostridiumBeijerinckii. Part I: Use of Acid and Enzyme Hydrolyzed Corn Fiber. Bioresour. Technol. 2008, 99, 5915–5922.[CrossRef] [PubMed]
40. Wu, M.; Wang, M.; Liu, J.; Huo, H. Assessment of Potential Life-Cycle Energy and Greenhouse Gas EmissionEffects from Using Corn-Based Butanol as a Transportation Fuel. Biotechnol. Prog. 2008, 24, 1204–1214.[CrossRef]
41. Baral, N.R.; Shah, A. Techno-Economic Analysis of Cellulosic Butanol Production from Corn Stover throughAcetone-Butanol-Ethanol Fermentation. Energy Fuels 2016, 30, 5779–5790. [CrossRef]
42. Ezeji, T.C.; Qureshi, N.; Blaschek, H.P. Production of Acetone, Butanol and Ethanol by Clostridium BeijerinckiiBA101 and in Situ Recovery by Gas Stripping. World J. Microbiol. Biotechnol. 2003, 19, 595–603. [CrossRef]
43. Águeda, V.I.; Delgado, J.A.; Uguina, M.A.; Sotelo, J.L.; García, Á. Column Dynamics of anAdsorption-Drying-Desorption Process for Butanol Recovery from Aqueous Solutions with Silicalite Pellets.Sep. Purif. Technol. 2013, 104, 307–321. [CrossRef]
44. Hussin, M.H.; Samad, N.A.; Latif, N.H.A.; Rozuli, N.A.; Yusoff, S.B.; Gambier, F.; Brosse, N. Production ofOil Palm (Elaeis Guineensis) Fronds Lignin-Derived Non-Toxic Aldehyde for Eco-Friendly Wood Adhesive.Int. J. Biol. Macromol. 2018, 113, 1266–1272. [CrossRef]
45. Demirbas, A. Estimating of Structural Composition of Wood and Non-Wood Biomass Samples. EnergySources 2005, 27, 761–767. [CrossRef]
Energies 2020, 13, 181 26 of 26
46. Morvay, Z.K.; Gvozdenac, D.D. Applied Industrial Eenergy and Environmental Management; John Wiley & Sons:Hoboken, NJ, USA, 2008.
47. Haigh, K.F.; Petersen, A.M.; Gottumukkala, L.; Mandegari, M.; Naleli, K.; Görgens, J.F. Simulation andComparison of Processes for Biobutanol Production from Lignocellulose via ABE Fermentation. BiofuelsBioprod. Biorefin. 2018, 12, 1023–1036. [CrossRef]
48. Richardson. Richardson International Construction Factors ManualTM; Cost Data On Line, Inc.: Pahrump, NV,USA, 2008.
49. Heinzle, E.; Biwer, A.P.; Cooney, C.L. Development of Sustainable Bioprocesses: Modelling and Assessment; JohnWiley & Sons: Hoboken, NJ, USA, 2006.
50. Brown, R.C.; Brown, T.R. Economics of Biorenewable Resources. In Biorenewable Resources: Engineering NewProducts from Agriculture, 2nd ed.; John Wiley & Sons, Inc.: Hoboken, NJ, USA, 2014; pp. 287–326.
51. Utusan-Malaysia. Kilang Pelet Pelepah Sawit Untuk Ternakan. Available online: http://integratedfarm.blogspot.com/2009/07/kilang-pelet-pelepah-sawit-untuk.html (accessed on 8 September 2016).
52. Schnitkey, G. Weekly Farm Economics: Fertilizer Prices Higher for 2019 Crop. Farmdoc Dly. 2018, 8, 178.53. You, Z.; Zhang, S.; Kim, H.; Chiang, P.-C.; Sun, Y.; Guo, Z.; Xu, H. Effects of Corn Stover Pretreated with
NaOH and CaO on Anaerobic Co-Digestion of Swine Manure and Corn Stover. Appl. Sci. 2019, 9, 123.[CrossRef]
54. Wang, Y.; Liu, Z.; Hao, P. Investigation on Mechanical and Microwave Heating Characteristics of AsphaltMastic Using Activated Carbon Powder as Electro-Magnetic Absorbing Materials. Constr. Build. Mater. 2019,202, 692–703. [CrossRef]
55. TNB-Malaysia. Pricing & Tariffs. Available online: http://www.tnb.com.my/residential/pricing-tariffs(accessed on 10 March 2018).
56. SPAN-Malaysia. Water Tariff. Available online: https://www.span.gov.my/document/upload/
AtBz79IrBNcxpXRh9R2SXYAcr1cAZ5oK.pdf (accessed on 10 March 2018).57. UHY. Doing Business in Malaysia; Urbach Hacker Young International Ltd.: Kuala Lumpur, Malaysia, 2015.
[CrossRef]58. Richard, R. Kenyataan Media: Perintah Gaji Minimum 2016; Ministry of Human Resources Malaysia: Putrajaya,
Malaysia, 2016.59. Mahmud, N.; Rosentrater, K.A. Techno-Economic Analysis of Low Moisture Anhydrous Ammonia (LMAA)
Pretreatment for Butanol Production from Oil Palm Frond. Biomass Convers. Biorefin. 2019. [CrossRef]60. Yang, M.; Rosentrater, K.A. Techno-Economic Analysis (TEA) of Low-Moisture Anhydrous Ammonia
(LMAA) Pretreatment Method for Corn Stover. Ind. Crops Prod. 2015, 76, 55–61. [CrossRef]61. Matsumura, M.; Kataoka, H.; Sueki, M.; Araki, K. Energy Saving Effect of Pervaporation Using Oleyl Alcohol
Liquid Membrane in Butanol Purification. Bioprocess Eng. 1988, 3, 93–100. [CrossRef]
© 2020 by the authors. Licensee MDPI, Basel, Switzerland. This article is an open accessarticle distributed under the terms and conditions of the Creative Commons Attribution(CC BY) license (http://creativecommons.org/licenses/by/4.0/).