Embed Size (px)
Citation preview
LLNL-TR-642494
Technoeconomic Evaluation of MEAversus Mixed Amines for CO2 Removalat Near-Commercial Scale at DukeEnergy Gibson 3 Plant
D. A. Jones, T. McVey, S. J. Friedmann
August 19, 2013
Disclaimer
This document was prepared as an account of work sponsored by an agency of the United States government. Neither the United States government nor Lawrence Livermore National Security, LLC, nor any of their employees makes any warranty, expressed or implied, or assumes any legal liability or responsibility for the accuracy, completeness, or usefulness of any information, apparatus, product, or process disclosed, or represents that its use would not infringe privately owned rights. Reference herein to any specific commercial product, process, or service by trade name, trademark, manufacturer, or otherwise does not necessarily constitute or imply its endorsement, recommendation, or favoring by the United States government or Lawrence Livermore National Security, LLC. The views and opinions of authors expressed herein do not necessarily state or reflect those of the United States government or Lawrence Livermore National Security, LLC, and shall not be used for advertising or product endorsement purposes.
This work performed under the auspices of the U.S. Department of Energy by Lawrence Livermore National Laboratory under Contract DE-AC52-07NA27344.
1
-
Contents
Contents ........................................................................................................................................................ 1
Tables ............................................................................................................................................................ 2
Figures ........................................................................................................................................................... 3
Executive Summary ....................................................................................................................................... 4
Scope Note ................................................................................................................................................ 5
Chapter 1: Introduction and background .................................................................................................... 6
Chapter 2: Engineering Analysis ................................................................................................................. 10
Introduction ............................................................................................................................................ 10
Process Review........................................................................................................................................ 10
Discussion of Amine Technology ........................................................................................................ 10
Design Bases........................................................................................................................................ 12
Process Description ............................................................................................................................. 13
Baseline 1: CO2 Removal using 30% Monoethanolamine ....................................................................... 15
Process Details .................................................................................................................................... 15
MEA – 30% Amine Concentration ....................................................................................................... 17
Mixed Amines – 30% Amine Concentration ....................................................................................... 17
Mixed Amines – 35% Amine Concentration ....................................................................................... 17
Chapter 3: Process Economics .................................................................................................................... 19
Summary ................................................................................................................................................. 19
Conclusions and Analysis ........................................................................................................................ 20
Methodology ........................................................................................................................................... 20
Equipment Sizing ................................................................................................................................. 20
Capital Cost Estimation ....................................................................................................................... 20
Operating Costs ................................................................................................................................... 22
Cost Parameters .................................................................................................................................. 22
Chapter 4: Uncertainties and Opportunities .............................................................................................. 24
2
Uncertainties ........................................................................................................................................... 24
Opportunities for Further Optimization ................................................................................................. 24
Appendix A: ................................................................................................................................................. 27
Appendix B: Stream Tables ......................................................................................................................... 28
Appendix C: Equipment Lists for 30% Mixed Amine and 35% Mixed Amines .............................................. 40
Appendix D: Detailed Cost Estimate Tables ................................................................................................ 44
Appendix E: Discussion of Shidongkou Plant Visit ...................................................................................... 56
References .................................................................................................................................................. 66
Tables
Table ES.1. Cost Estimate Summary Table for 0.91 million tonne/annum CO2 capture plant..................... 5
Table 1.1: Unit Information, Gibson Generating Station, Owensville, IN, USA (source: Wikipedia) ............ 7
Table 2.1. Design Bases ............................................................................................................................... 12
Table 2.2. Gibson-3 Flue Gas Composition ................................................................................................. 13
Table 2.3. Baseline Case – Solvent Composition of 30% MEA Major Process Equipment List ................... 15
Table 2.4. Table of Comparative Power Losses for all three processes ...................................................... 17
Table 3.1. Capital Cost Summary ................................................................................................................ 19
Table 3.2. Operating Cost Summary ........................................................................................................... 19
Table 3.3. Cost Parameters Used ................................................................................................................ 22
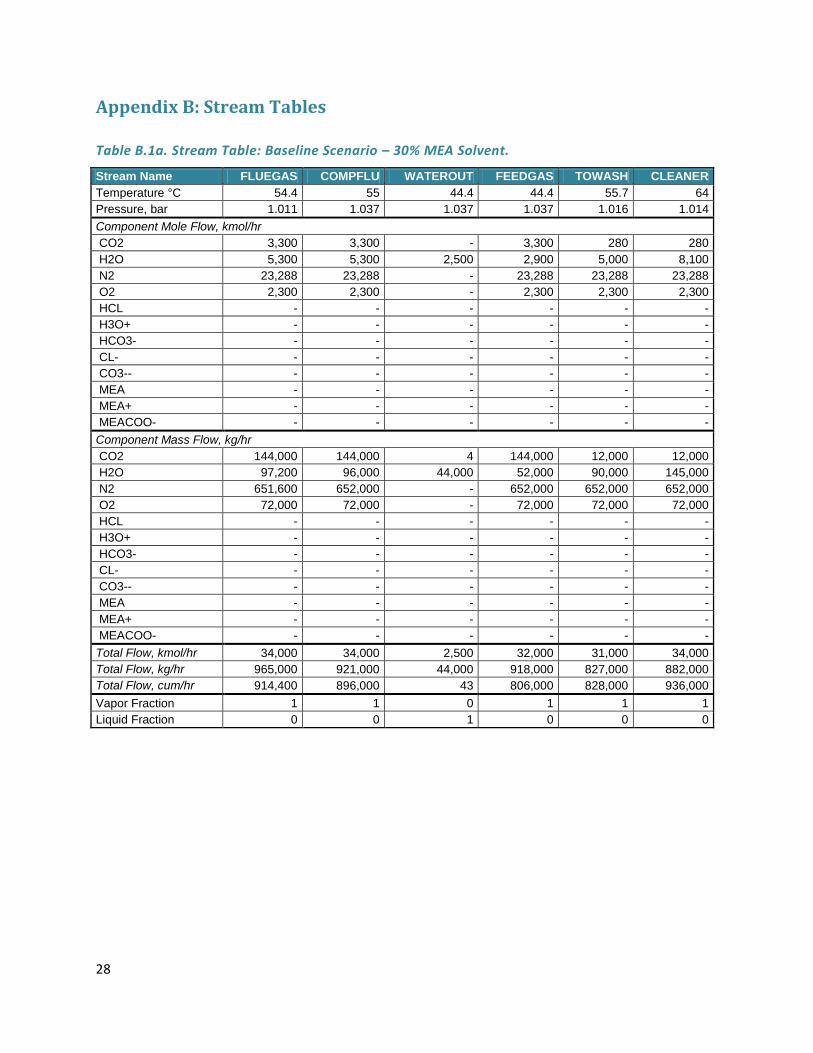
Table B.1a. Stream Table: Baseline Scenario – 30% MEA Solvent. ............................................................. 28
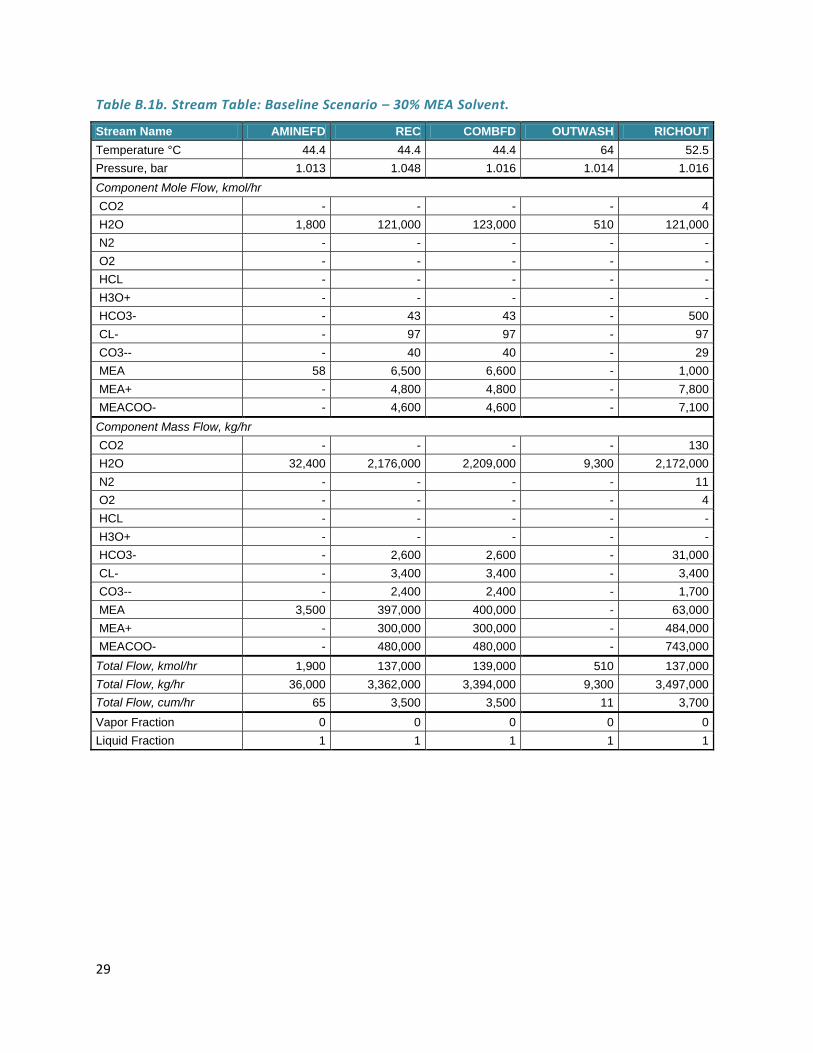
Table B.1b. Stream Table: Baseline Scenario – 30% MEA Solvent. ............................................................. 29
Table B.1c. Stream Table: Baseline Scenario – 30% MEA Solvent. ............................................................. 30
Table B.1d. Stream Table: Baseline Scenario – 30% MEA Solvent. ............................................................. 31
Table B.2a. Stream Table: 30% Mixed Amine Solvent. ............................................................................... 32
Table B.2b. Stream Table: 30% Mixed Amine Solvent. ............................................................................... 33
Table B.2c. Stream Table: 30% Mixed Amine Solvent. ............................................................................... 34
Table B.2d. Stream Table: 30% Mixed Amine Solvent. ............................................................................... 35
Table B.3a. Stream Table: 35% Mixed Amine Solvent. ............................................................................... 36
Table B.3b. Stream Table: 35% Mixed Amine Solvent. ............................................................................... 37
Table B.3c. Stream Table: 35% Mixed Amine Solvent. ............................................................................... 38
Table B.3d. Stream Table: 35% Mixed Amine Solvent. ............................................................................... 39
Table C.1. 30% Mixed Amine Major Process Equipment List. .................................................................... 40
Table C.2. 35% Mixed Amine Major Process Equipment List. .................................................................... 42
Table D.1. Capital Cost Estimate: Baseline Scenario – 30% MEA Solvent. ................................................. 44
3
Table D.2. Variable Cost Estimate: Baseline Scenario – 30% MEA Solvent. ............................................... 45
Table D.3. Operating Cost Estimate: Baseline Scenario – 30% MEA Solvent. ............................................ 46
Table D.4. Capital Cost Estimate: 30% Mixed Amine Solvent. .................................................................... 48
Table D.5. Variable Cost Estimate: 30% Mixed Amine Solvent. .................................................................. 49
Table D.6. Operating Cost Estimate: 30% Mixed Amine Solvent. ............................................................... 50
Table D.7. Capital Cost Estimate: 35% Mixed Amine Solvent. .................................................................... 52
Table D.8. Variable Cost Estimate: 35% Mixed Amine Solvent. .................................................................. 53
Table D.9. Operating Cost Estimate: 35% Mixed Amine Solvent ................................................................ 54
Figures
Figure 1.1: Gibson Generating Station, Owensville, Indiana ........................................................................ 7
Figure 1.2: Shidongkou Power Plant #2, Shanghai, China (left) and CO2 capture unit (right) ..................... 8
Figure 2.1. Carbon capture process ............................................................................................................ 13
Figure A.1. Process Flow Diagram ............................................................................................................... 27
Figure E.1. Photograph of Shidongkou PFD. ............................................................................................... 57
Figure E.2. Recreation of PFD for Shidongkou CO2 Capture Plant. ............................................................. 58
Figure E.3. Carbon Capture PFD from LLNL Aspen model. ......................................................................... 58
Figure E 4. Photograph Absorber and stripper columns. ............................................................................ 59
Figure E.5. CO2 Purification and Product CO2 storage tanks. ...................................................................... 60
Figure E.6. Stripper Reflux Separator. ......................................................................................................... 61
Figure E.7. Probable Water Storage Tank. .................................................................................................. 62
Figure E.8. Probable Solvent Surge Tank and Feed Amine Storage Tank. .................................................. 63
Figure E.9. Pump Sets.................................................................................................................................. 64
Figure E.10. Amine Recovery Vacuum Flash Vessel. ................................................................................... 65
4
Executive Summary
The US-China Clean Energy Research Center (CERC) was established in November 2009 by Presidents Obama and Hu. CERC is made up of three consortia focused on building efficiency, clean vehicles and advanced coal technologies.
The Advanced Coal Technology Consortium (ACTC) brings together many of the top scientists and leading companies in the power sector, who work together collaboratively to accelerate deployment of the most promising technologies and tackle some of the most pressing issues in making coal plants more efficient and environmentally friendly.
Reducing carbon emissions in the power sector is a central goal for both US and Chinese decision makers and industrial leaders, since, worldwide, coal power plants produce nearly 40% of greenhouse gases. In order to deeply reduce their greenhouse gas emissions, many utilities are considering carbon capture, utilization, and sequestration (CCUS). CCUS can enable the current fossil fuel infrastructure to be utilized while non-fossil fuel based energy supplies evolve to replace fossil fuels.
For the existing US and Chinese coal-burning fleets, post-combustion capture (PCC) remains a critically important option and viable approach. While companies provide technology for PCC retrofits, the costs and performance of these systems remain largely untested in commercial settings. As such, power generation companies have very few technical or economic data sets on which to base large capital decisions. Moreover, initial estimates suggest the costs will prove prohibitively high in many settings.
Huaneng Power Group and Duke Energy Collaborate to Evaluate CCUS Technology
In support of gaining this information, the world’s largest power company, Huaneng Power Group, has developed and deployed a demonstration scale PCC system as a retrofit at its plant at Shidongkou, Shanghai. Duke Energy Inc., North America’s largest power generator and utility, is considering options for CCUS retrofits and has created a partnership with Huaneng to assess the viability of a retrofit project on one of its US plants. In support of this effort, and in partnership with Duke and Huaneng under the US-China Clean Energy Research Program (CERC), LLNL has evaluated the economics of a novel amine-solvent technology for removal of CO2 from flue gas developed by Huaneng’s Clean Energy Research Institute (HNCERI). This technology is being considered for implementation by Duke Energy at their Gibson-3 unit in Indiana.
To execute this analysis, the parties shared an unprecedented amount of information and data, including technical specifications of the Gibson plant, patent information, and the configurations and operating records of Huaneng’s reactor. The project required field visits, exchanges, and lengthy face-to-face meetings and discussions in order to ensure agreement between the parties. This created a confident analytical baseline central to the results.
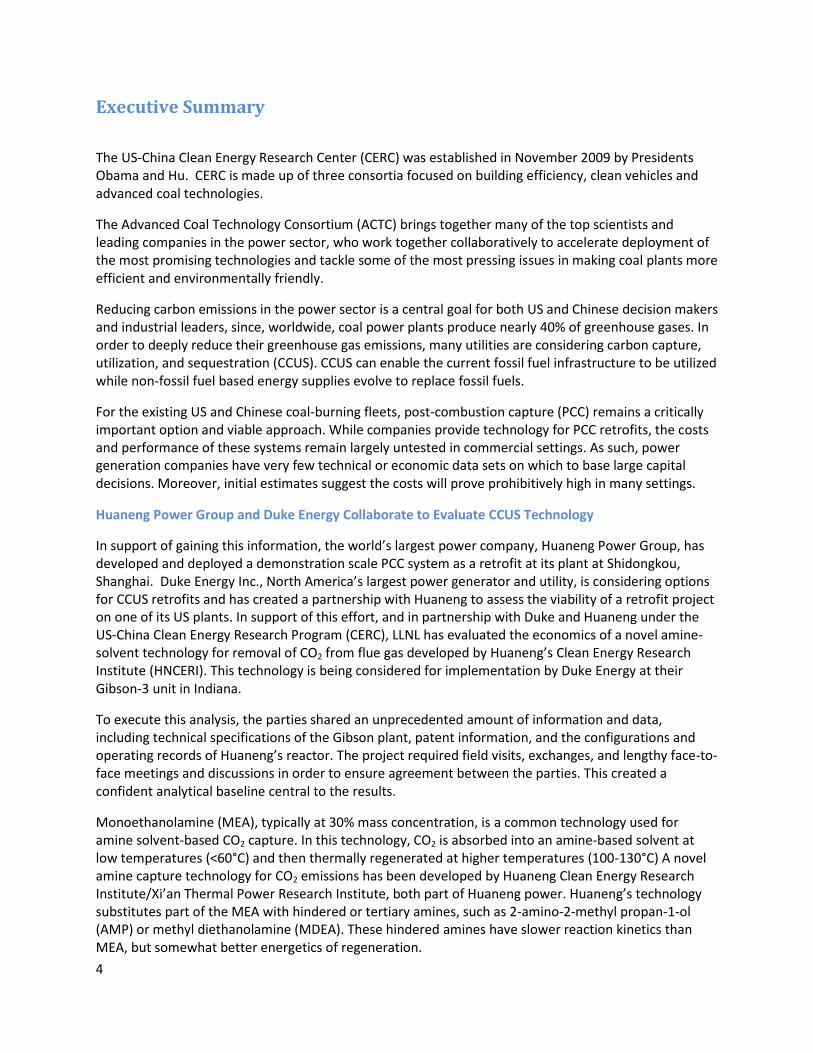
Monoethanolamine (MEA), typically at 30% mass concentration, is a common technology used for amine solvent-based CO2 capture. In this technology, CO2 is absorbed into an amine-based solvent at low temperatures (<60°C) and then thermally regenerated at higher temperatures (100-130°C) A novel amine capture technology for CO2 emissions has been developed by Huaneng Clean Energy Research Institute/Xi’an Thermal Power Research Institute, both part of Huaneng power. Huaneng’s technology substitutes part of the MEA with hindered or tertiary amines, such as 2-amino-2-methyl propan-1-ol (AMP) or methyl diethanolamine (MDEA). These hindered amines have slower reaction kinetics than MEA, but somewhat better energetics of regeneration.
5
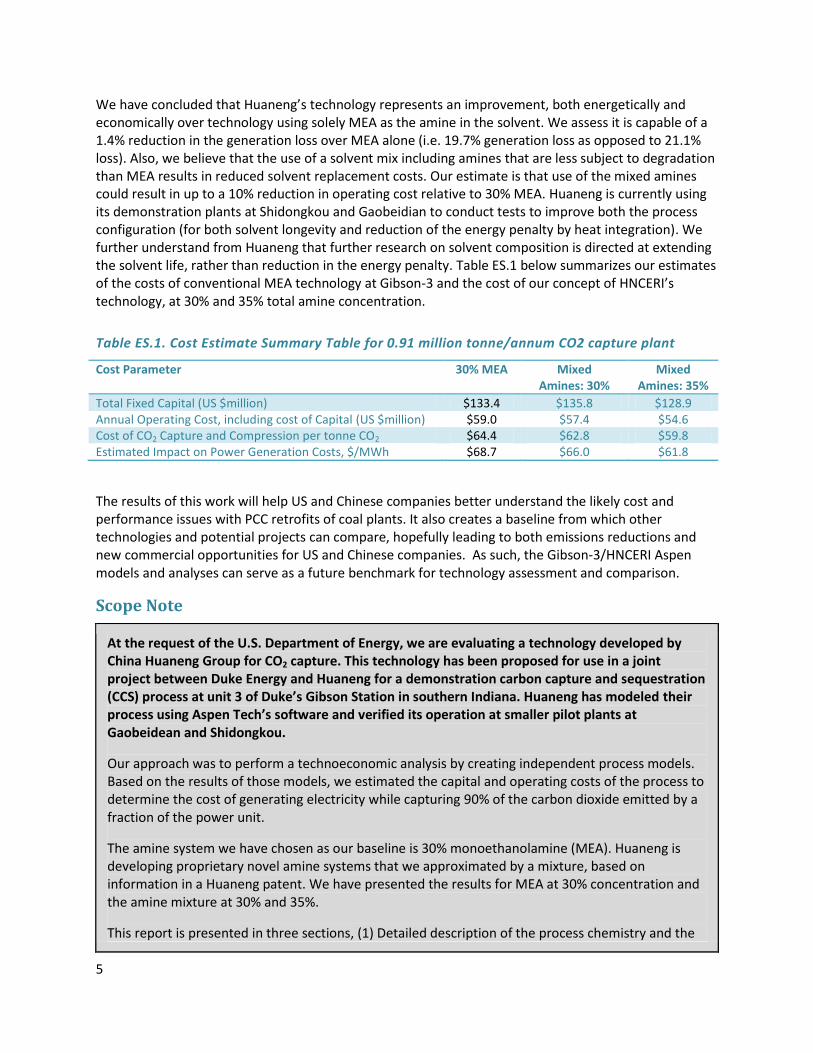
We have concluded that Huaneng’s technology represents an improvement, both energetically and economically over technology using solely MEA as the amine in the solvent. We assess it is capable of a 1.4% reduction in the generation loss over MEA alone (i.e. 19.7% generation loss as opposed to 21.1% loss). Also, we believe that the use of a solvent mix including amines that are less subject to degradation than MEA results in reduced solvent replacement costs. Our estimate is that use of the mixed amines could result in up to a 10% reduction in operating cost relative to 30% MEA. Huaneng is currently using its demonstration plants at Shidongkou and Gaobeidian to conduct tests to improve both the process configuration (for both solvent longevity and reduction of the energy penalty by heat integration). We further understand from Huaneng that further research on solvent composition is directed at extending the solvent life, rather than reduction in the energy penalty. Table ES.1 below summarizes our estimates of the costs of conventional MEA technology at Gibson-3 and the cost of our concept of HNCERI’s technology, at 30% and 35% total amine concentration.
Table ES.1. Cost Estimate Summary Table for 0.91 million tonne/annum CO2 capture plant
Cost Parameter 30% MEA Mixed Amines: 30%
Mixed Amines: 35%
Total Fixed Capital (US $million) $133.4 $135.8 $128.9 Annual Operating Cost, including cost of Capital (US $million) $59.0 $57.4 $54.6 Cost of CO2 Capture and Compression per tonne CO2 $64.4 $62.8 $59.8 Estimated Impact on Power Generation Costs, $/MWh $68.7 $66.0 $61.8
The results of this work will help US and Chinese companies better understand the likely cost and performance issues with PCC retrofits of coal plants. It also creates a baseline from which other technologies and potential projects can compare, hopefully leading to both emissions reductions and new commercial opportunities for US and Chinese companies. As such, the Gibson-3/HNCERI Aspen models and analyses can serve as a future benchmark for technology assessment and comparison.
Scope Note
At the request of the U.S. Department of Energy, we are evaluating a technology developed by China Huaneng Group for CO2 capture. This technology has been proposed for use in a joint project between Duke Energy and Huaneng for a demonstration carbon capture and sequestration (CCS) process at unit 3 of Duke’s Gibson Station in southern Indiana. Huaneng has modeled their process using Aspen Tech’s software and verified its operation at smaller pilot plants at Gaobeidean and Shidongkou.
Our approach was to perform a technoeconomic analysis by creating independent process models. Based on the results of those models, we estimated the capital and operating costs of the process to determine the cost of generating electricity while capturing 90% of the carbon dioxide emitted by a fraction of the power unit.
The amine system we have chosen as our baseline is 30% monoethanolamine (MEA). Huaneng is developing proprietary novel amine systems that we approximated by a mixture, based on information in a Huaneng patent. We have presented the results for MEA at 30% concentration and the amine mixture at 30% and 35%.
This report is presented in three sections, (1) Detailed description of the process chemistry and the
6
results of the Aspen models for the three cases above, (2) Presentation of the process installation and operating costs for each case, and (3) Process modifications and improvements made necessary by the conditions at the Gibson Station and discussions with Huaneng engineers during a visit to the Shidongkou installation. Supplementary materials and tables are presented in appendices.
This work was performed under the auspices of the U.S. Department of Energy by Lawrence Livermore National Laboratory under Contract DE-AC52-07NA27344.
Chapter 1: Introduction and background
To achieve deep cuts in carbon emissions and stabilize atmospheric concentrations of greenhouse gases (GHGs) below dangerous levels, both the US and China have embarked on pathways to develop, test, and evaluate critical clean energy technology. The two countries represent roughly 40% of global GHG emissions, and each has an economy and energy system heavy in fossil fuel conversion and use. In that context, carbon capture, utilization, and storage (CCUS) remains a critically important option for both countries to explore and consider.
Towards that end, and among other initiatives, the US and China agreed to create the US-China Clean Energy Research Center (CERC) in 2009, and selected from each country a consortium aimed at research, development, and demonstration of clean coal and CCUS technology. Those groups form the Advanced Coal Technology Consortium (ACTC), which has begun a program of technology research, development, and assessment with industrial, academic, and governmental partners from both countries. Importantly, the ACTC chose early to focus on large-scale commercial projects as the anchors for technology sharing and evaluation, in part to draw foster closer commercial ties between both countries, and in part to provide both governments with insight and advice that could not be gained from business-to-business or peer-to-peer partnerships alone.
Today, one of the most important concerns about widespread deployment of CCUS technology is its cost. In particular, the retrofit of pulverized-coal power plants carries concerns about both high capital cost and reductions of efficiency that both countries find unappealing. The many assessments and studies published to date present a broad range of potential costs1,2,3, in part based on the wide set of technologies, coal types, and plants considered for retrofit. Published anticipated costs ranging from $70/ton CO2 avoided4 to $129/ton5 – however, there are no full-scale retrofits in place, so these assessments remain paper studies based on expert analyses and models of unscaled technologies. This highlighted a need for a common basis for assessing these technologies, and a common model to benchmark potential new technologies.
To in part resolve this need, a team of experts from the US and China partnered together to assess a particular technology as applied to retrofit a particular plant. The team comprised members from industry and government: Duke Energy, Inc. (US), Huaneng Clean Energy Research Institute (HNCERI - China), and Lawrence Livermore National Laboratory (LLNL – US).
Beginning in June 2011, the LLNL, Huaneng, and Duke team began to exchange information in order to assess the merits of a post-combustion capture (PCC) retrofit using novel HNCERI technology on a supercritical pulverized coal plant (SC-PC). The technology in question is a liquid solvent capture
7
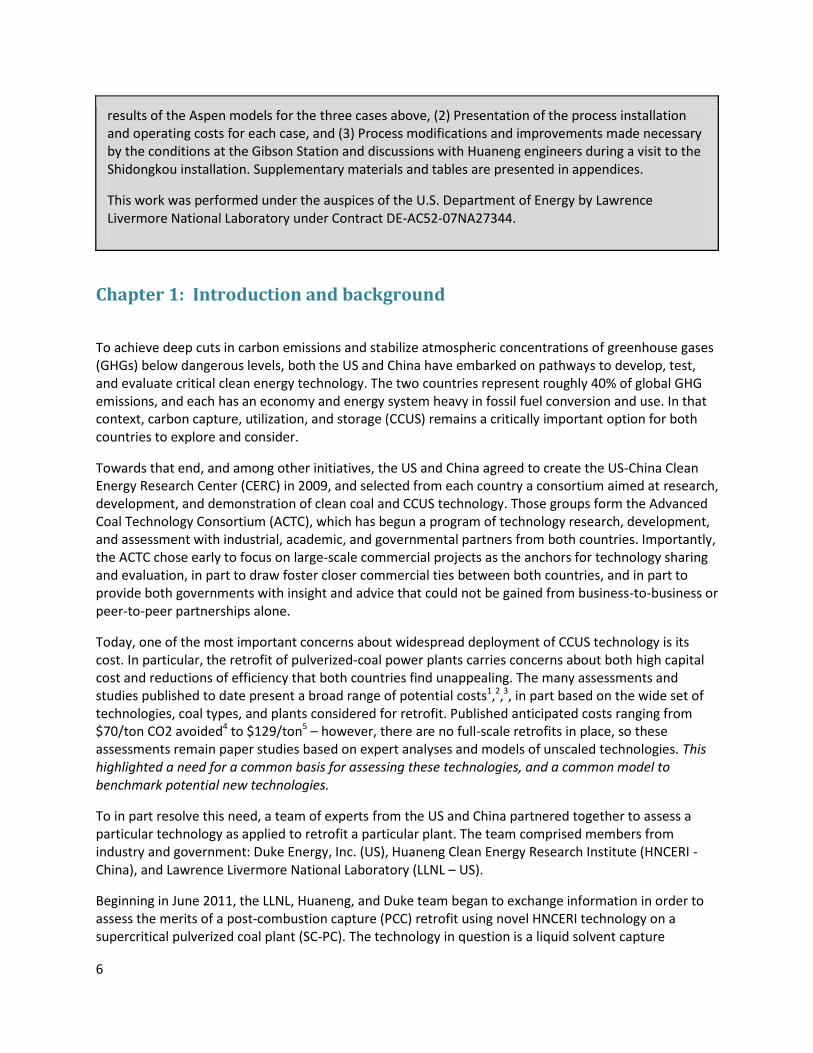
technology based on mixtures of amines6. The plant is Gibson power station in southwestern Indiana, in particular the number 3 unit (Figure 1.1, Table 1.1). This selection was made based on several grounds, including the relatively high efficiency of the supercritical boiler there and the relative ease of engineering a retrofit in terms of space, cooling water, permitting, and other considerations.
Importantly, the three groups agreed to share information, data, and results for the purpose of objective analysis and assessment. In an unprecedented step, the parties also agreed to share operational information, site information, and cost data with the expectation of releasing this data. This arrangement and openness was critical to the success of the research program, and helps make the analysis unique in terms of its value as a potential benchmark for future retrofit technology assessments.
Figure 1.1: Gibson Generating Station, Owensville, Indiana
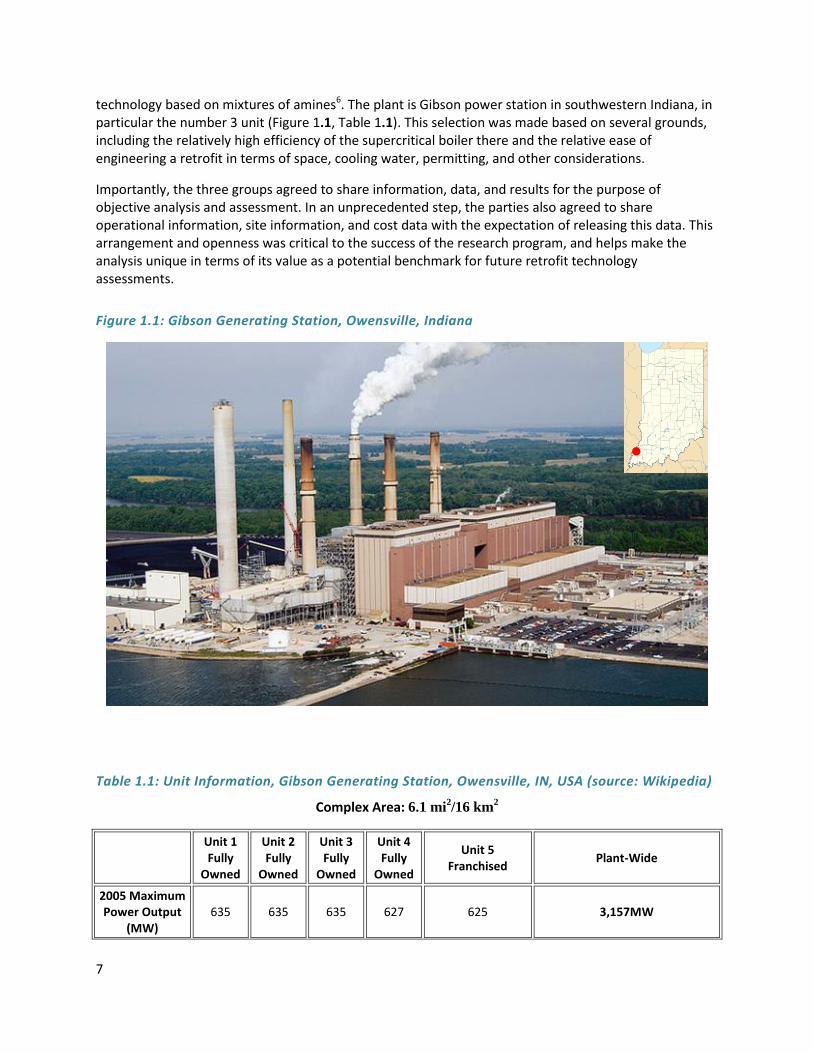
Table 1.1: Unit Information, Gibson Generating Station, Owensville, IN, USA (source: Wikipedia)
Complex Area: 6.1 mi2/16 km
2
Unit 1 Fully
Owned
Unit 2 Fully
Owned
Unit 3 Fully
Owned
Unit 4 Fully
Owned
Unit 5 Franchised
Plant-Wide
2005 Maximum Power Output
(MW) 635 635 635 627 625 3,157MW
8
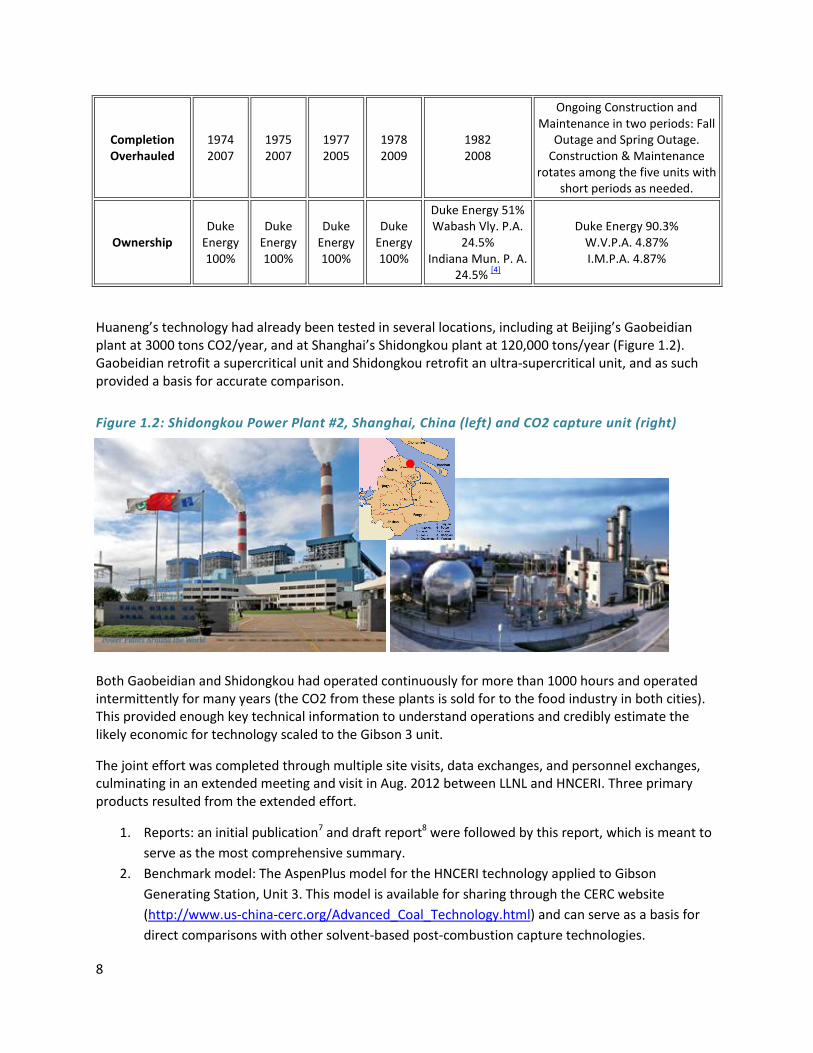
Completion Overhauled
1974 2007
1975 2007
1977 2005
1978 2009
1982 2008
Ongoing Construction and Maintenance in two periods: Fall
Outage and Spring Outage. Construction & Maintenance
rotates among the five units with short periods as needed.
Ownership Duke
Energy 100%
Duke Energy 100%
Duke Energy 100%
Duke Energy 100%
Duke Energy 51% Wabash Vly. P.A.
24.5% Indiana Mun. P. A.
24.5% [4]
Duke Energy 90.3% W.V.P.A. 4.87% I.M.P.A. 4.87%
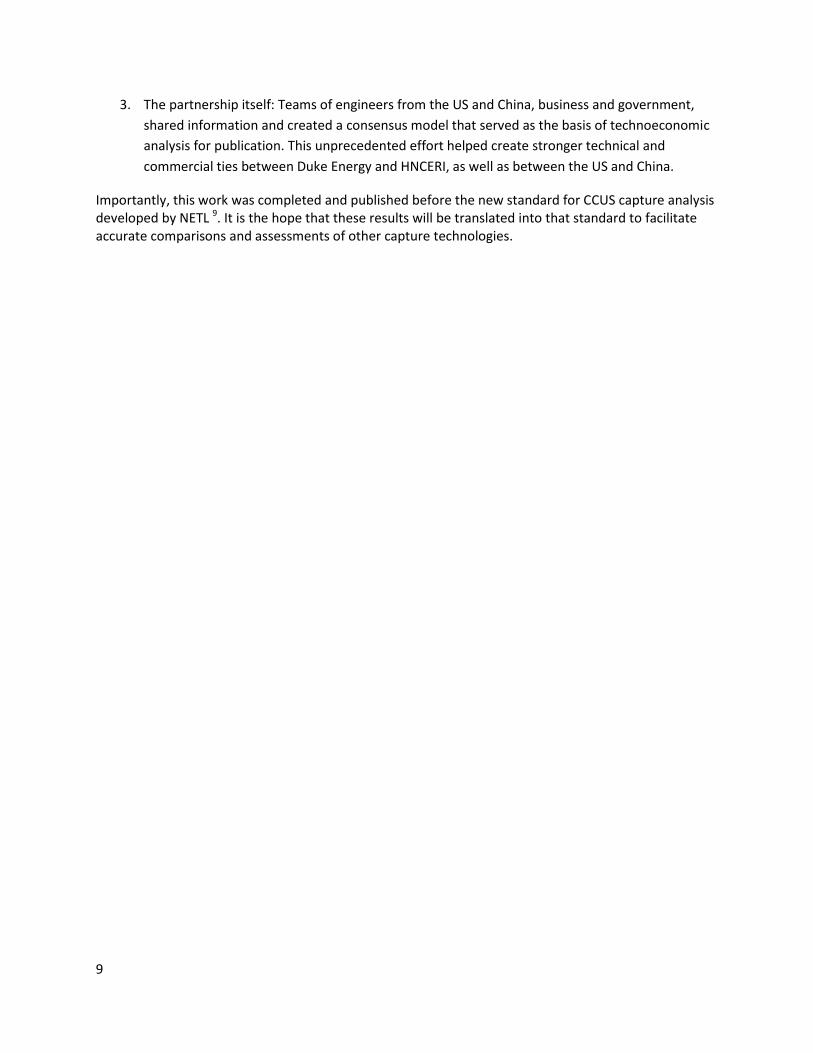
Huaneng’s technology had already been tested in several locations, including at Beijing’s Gaobeidian plant at 3000 tons CO2/year, and at Shanghai’s Shidongkou plant at 120,000 tons/year (Figure 1.2). Gaobeidian retrofit a supercritical unit and Shidongkou retrofit an ultra-supercritical unit, and as such provided a basis for accurate comparison.
Figure 1.2: Shidongkou Power Plant #2, Shanghai, China (left) and CO2 capture unit (right)
Both Gaobeidian and Shidongkou had operated continuously for more than 1000 hours and operated intermittently for many years (the CO2 from these plants is sold for to the food industry in both cities). This provided enough key technical information to understand operations and credibly estimate the likely economic for technology scaled to the Gibson 3 unit.
The joint effort was completed through multiple site visits, data exchanges, and personnel exchanges, culminating in an extended meeting and visit in Aug. 2012 between LLNL and HNCERI. Three primary products resulted from the extended effort.
1. Reports: an initial publication7 and draft report8 were followed by this report, which is meant to
serve as the most comprehensive summary.
2. Benchmark model: The AspenPlus model for the HNCERI technology applied to Gibson
Generating Station, Unit 3. This model is available for sharing through the CERC website
(http://www.us-china-cerc.org/Advanced_Coal_Technology.html) and can serve as a basis for
direct comparisons with other solvent-based post-combustion capture technologies.
9
3. The partnership itself: Teams of engineers from the US and China, business and government,
shared information and created a consensus model that served as the basis of technoeconomic
analysis for publication. This unprecedented effort helped create stronger technical and
commercial ties between Duke Energy and HNCERI, as well as between the US and China.
Importantly, this work was completed and published before the new standard for CCUS capture analysis developed by NETL 9. It is the hope that these results will be translated into that standard to facilitate accurate comparisons and assessments of other capture technologies.
10
Chapter 2: Engineering Analysis
Introduction Beginning in June 2011, the LLNL, Huaneng, and Duke team began to exchange information in order to assess the merits of a PCC retrofit using the HNCERI technology. Early on, the decision was made to focus on a project at the Gibson power station in southwestern Indiana, in particular the number 3 unit. This selection was made based on several grounds, including the relatively high efficiency of the supercritical boiler there and the relative ease of engineering a retrofit in terms of space, cooling water, permitting, and other considerations.
Importantly, the three groups agreed to share information, data, and results for the purpose of objective analysis and assessment. In an unprecedented step, the parties also agreed to share operational information, site information, and cost data with the expectation of releasing this data. This arrangement and openness was critical to the success of the research program, and helps make the analysis unique in terms of its value as a potential benchmark for future retrofit technology assessments.
Process Review
Discussion of Amine Technology Alkanolamines, amines that contain an amine group and one or more hydroxyl groups, are a class of organic base that have been used to remove the acidic species, such as carbon dioxide from flue gas.These amines aid the absorption of CO2 by either forming carbamate salts, or by stabilizing bicarbonate ions in solution. The carbon dioxide can then be removed as a gas by heating the CO2-rich solution at moderate temperatures (90-130°C), after which the carbon dioxide gas can be compressed for storage or reuse. Alkanolamines (amines with an additional alcohol functional group) are generally used in the CCS process because of their increased solubility and reduced volatility compared to other amines.
Chemistry
Discussion of chemistry of reactions
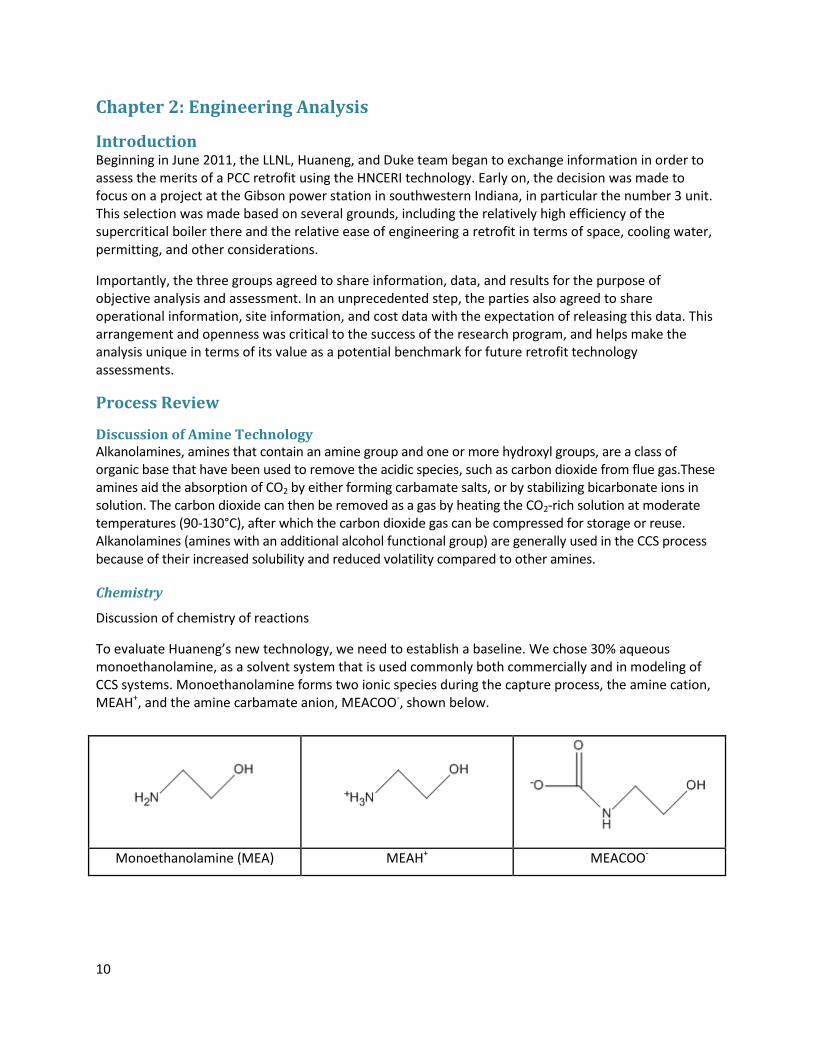
To evaluate Huaneng’s new technology, we need to establish a baseline. We chose 30% aqueous monoethanolamine, as a solvent system that is used commonly both commercially and in modeling of CCS systems. Monoethanolamine forms two ionic species during the capture process, the amine cation, MEAH+, and the amine carbamate anion, MEACOO-, shown below.
Monoethanolamine (MEA) MEAH+ MEACOO-
11
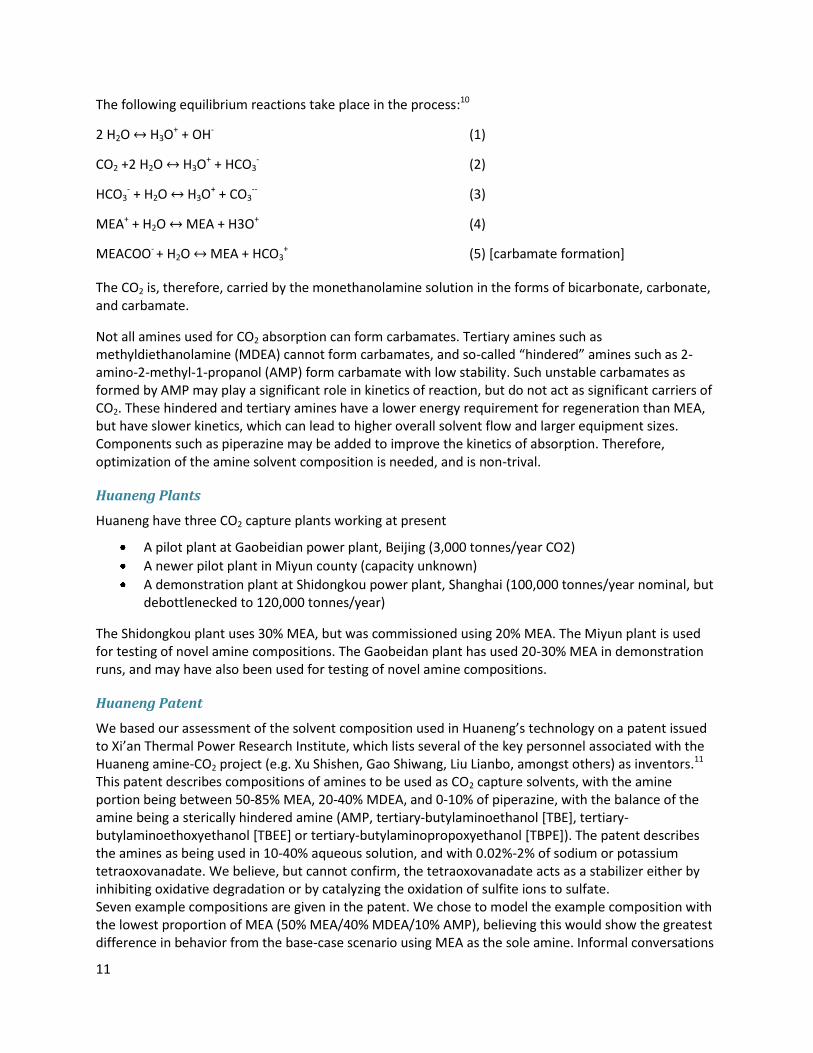
The following equilibrium reactions take place in the process:10
2 H2O H3O+ + OH- (1)
CO2 +2 H2O H3O+ + HCO3
- (2)
HCO3- + H2O H3O
+ + CO3-- (3)
MEA+ + H2O MEA + H3O+ (4)
MEACOO- + H2O MEA + HCO3+ (5) [carbamate formation]
The CO2 is, therefore, carried by the monethanolamine solution in the forms of bicarbonate, carbonate, and carbamate.
Not all amines used for CO2 absorption can form carbamates. Tertiary amines such as methyldiethanolamine (MDEA) cannot form carbamates, and so-called “hindered” amines such as 2-amino-2-methyl-1-propanol (AMP) form carbamate with low stability. Such unstable carbamates as formed by AMP may play a significant role in kinetics of reaction, but do not act as significant carriers of CO2. These hindered and tertiary amines have a lower energy requirement for regeneration than MEA, but have slower kinetics, which can lead to higher overall solvent flow and larger equipment sizes. Components such as piperazine may be added to improve the kinetics of absorption. Therefore, optimization of the amine solvent composition is needed, and is non-trival.
Huaneng Plants
Huaneng have three CO2 capture plants working at present
A pilot plant at Gaobeidian power plant, Beijing (3,000 tonnes/year CO2)
A newer pilot plant in Miyun county (capacity unknown)
A demonstration plant at Shidongkou power plant, Shanghai (100,000 tonnes/year nominal, but debottlenecked to 120,000 tonnes/year)
The Shidongkou plant uses 30% MEA, but was commissioned using 20% MEA. The Miyun plant is used for testing of novel amine compositions. The Gaobeidan plant has used 20-30% MEA in demonstration runs, and may have also been used for testing of novel amine compositions.
Huaneng Patent
We based our assessment of the solvent composition used in Huaneng’s technology on a patent issued to Xi’an Thermal Power Research Institute, which lists several of the key personnel associated with the Huaneng amine-CO2 project (e.g. Xu Shishen, Gao Shiwang, Liu Lianbo, amongst others) as inventors.11 This patent describes compositions of amines to be used as CO2 capture solvents, with the amine portion being between 50-85% MEA, 20-40% MDEA, and 0-10% of piperazine, with the balance of the amine being a sterically hindered amine (AMP, tertiary-butylaminoethanol [TBE], tertiary-butylaminoethoxyethanol [TBEE] or tertiary-butylaminopropoxyethanol [TBPE]). The patent describes the amines as being used in 10-40% aqueous solution, and with 0.02%-2% of sodium or potassium tetraoxovanadate. We believe, but cannot confirm, the tetraoxovanadate acts as a stabilizer either by inhibiting oxidative degradation or by catalyzing the oxidation of sulfite ions to sulfate. Seven example compositions are given in the patent. We chose to model the example composition with the lowest proportion of MEA (50% MEA/40% MDEA/10% AMP), believing this would show the greatest difference in behavior from the base-case scenario using MEA as the sole amine. Informal conversations
12
with Huaneng have indicated that while Huaneng are still optimizing their solvent composition, the performance of what we modeled is reasonable for Huaneng’s technology. They have also indicated that they have ruled out use of TBE, TBEE, or TBPE in their solvent mixture, as these are expensive relative to the other amines without offering a corresponding benefit for the increased cost.
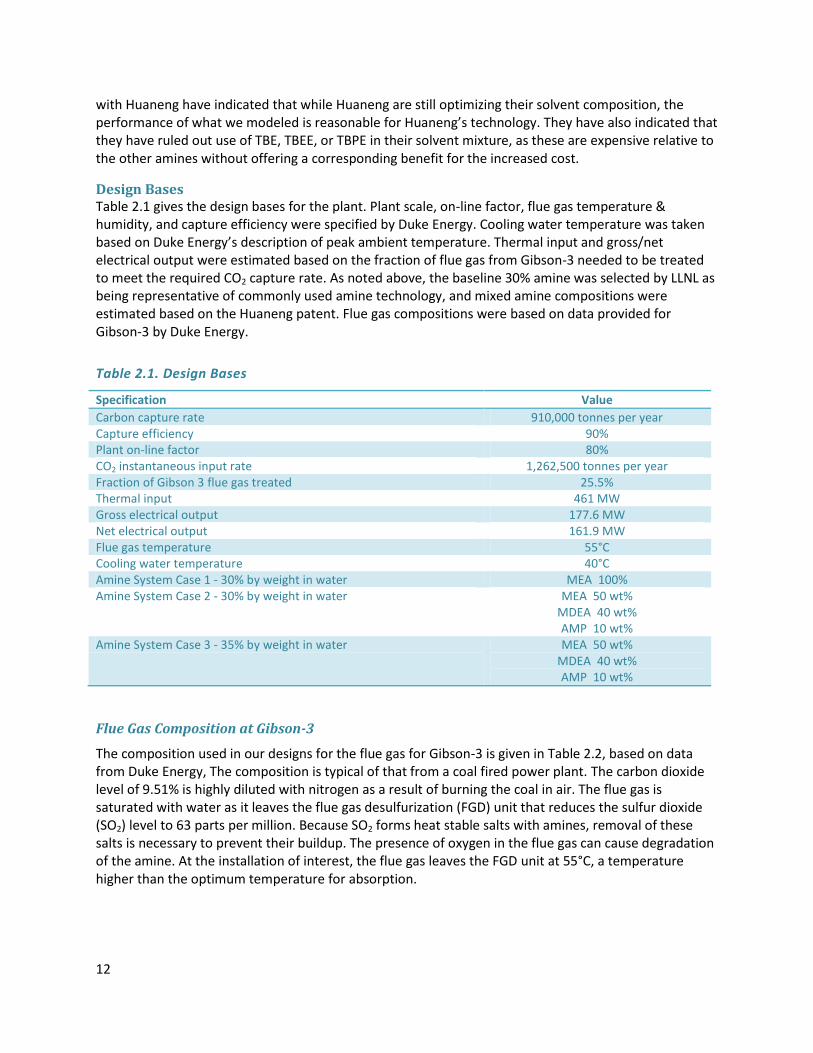
Design Bases Table 2.1 gives the design bases for the plant. Plant scale, on-line factor, flue gas temperature & humidity, and capture efficiency were specified by Duke Energy. Cooling water temperature was taken based on Duke Energy’s description of peak ambient temperature. Thermal input and gross/net electrical output were estimated based on the fraction of flue gas from Gibson-3 needed to be treated to meet the required CO2 capture rate. As noted above, the baseline 30% amine was selected by LLNL as being representative of commonly used amine technology, and mixed amine compositions were estimated based on the Huaneng patent. Flue gas compositions were based on data provided for Gibson-3 by Duke Energy.
Table 2.1. Design Bases
Specification Value
Carbon capture rate 910,000 tonnes per year Capture efficiency 90% Plant on-line factor 80% CO2 instantaneous input rate 1,262,500 tonnes per year Fraction of Gibson 3 flue gas treated 25.5% Thermal input 461 MW Gross electrical output 177.6 MW Net electrical output 161.9 MW Flue gas temperature 55°C Cooling water temperature 40°C Amine System Case 1 - 30% by weight in water MEA 100% Amine System Case 2 - 30% by weight in water MEA 50 wt%
MDEA 40 wt% AMP 10 wt%
Amine System Case 3 - 35% by weight in water MEA 50 wt% MDEA 40 wt% AMP 10 wt%
Flue Gas Composition at Gibson-3
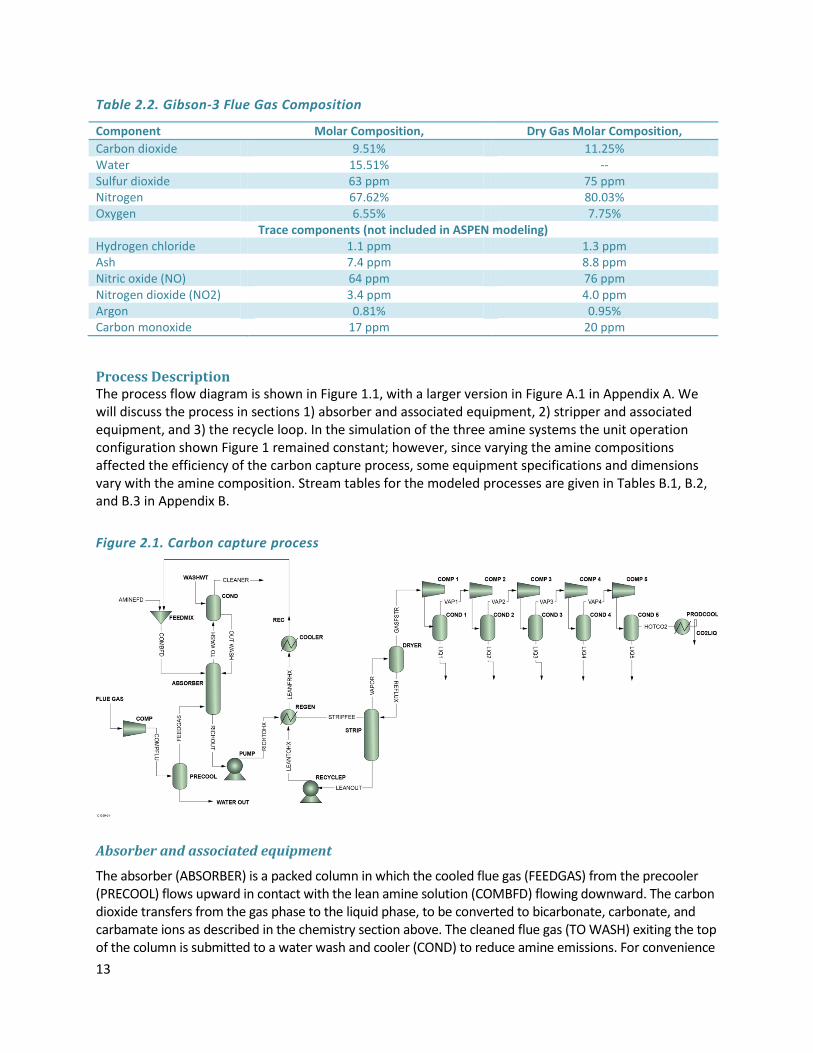
The composition used in our designs for the flue gas for Gibson-3 is given in Table 2.2, based on data from Duke Energy, The composition is typical of that from a coal fired power plant. The carbon dioxide level of 9.51% is highly diluted with nitrogen as a result of burning the coal in air. The flue gas is saturated with water as it leaves the flue gas desulfurization (FGD) unit that reduces the sulfur dioxide (SO2) level to 63 parts per million. Because SO2 forms heat stable salts with amines, removal of these salts is necessary to prevent their buildup. The presence of oxygen in the flue gas can cause degradation of the amine. At the installation of interest, the flue gas leaves the FGD unit at 55°C, a temperature higher than the optimum temperature for absorption.
13
Table 2.2. Gibson-3 Flue Gas Composition
Component Molar Composition, Dry Gas Molar Composition,
Carbon dioxide 9.51% 11.25% Water 15.51% -- Sulfur dioxide 63 ppm 75 ppm Nitrogen 67.62% 80.03% Oxygen 6.55% 7.75%
Trace components (not included in ASPEN modeling) Hydrogen chloride 1.1 ppm 1.3 ppm Ash 7.4 ppm 8.8 ppm Nitric oxide (NO) 64 ppm 76 ppm Nitrogen dioxide (NO2) 3.4 ppm 4.0 ppm Argon 0.81% 0.95% Carbon monoxide 17 ppm 20 ppm
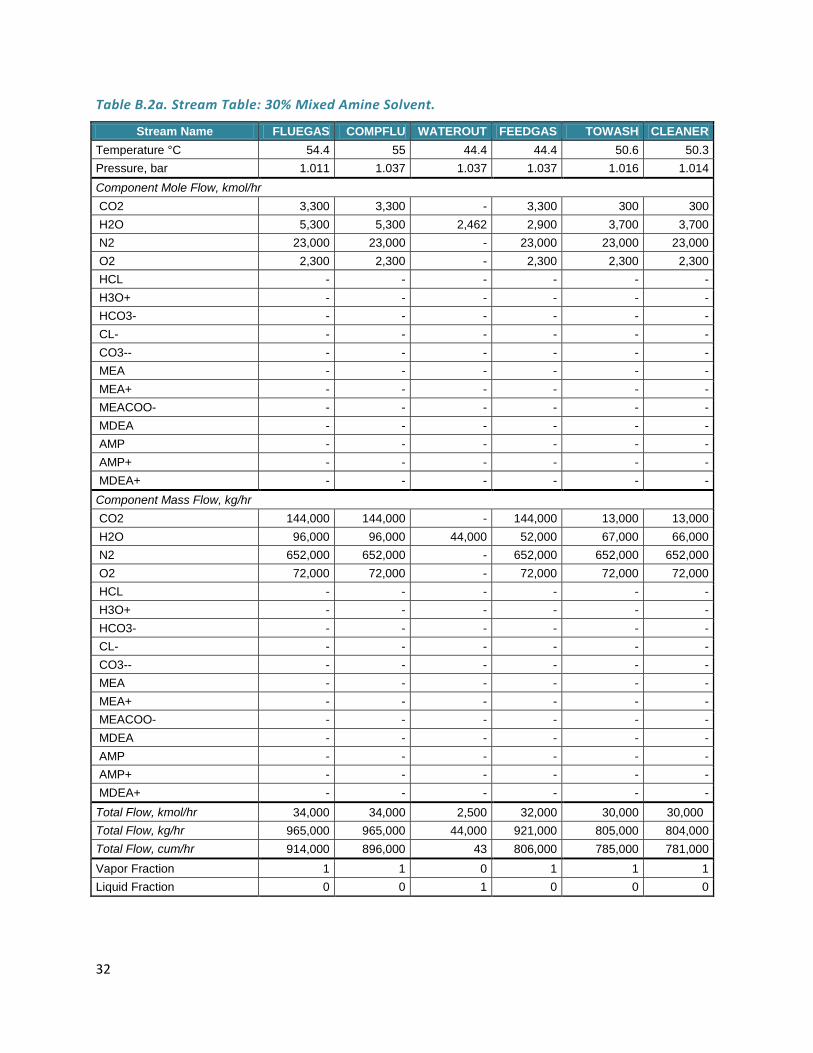
Process Description The process flow diagram is shown in Figure 1.1, with a larger version in Figure A.1 in Appendix A. We will discuss the process in sections 1) absorber and associated equipment, 2) stripper and associated equipment, and 3) the recycle loop. In the simulation of the three amine systems the unit operation configuration shown Figure 1 remained constant; however, since varying the amine compositions affected the efficiency of the carbon capture process, some equipment specifications and dimensions vary with the amine composition. Stream tables for the modeled processes are given in Tables B.1, B.2, and B.3 in Appendix B.
Figure 2.1. Carbon capture process
Absorber and associated equipment
The absorber (ABSORBER) is a packed column in which the cooled flue gas (FEEDGAS) from the precooler (PRECOOL) flows upward in contact with the lean amine solution (COMBFD) flowing downward. The carbon dioxide transfers from the gas phase to the liquid phase, to be converted to bicarbonate, carbonate, and carbamate ions as described in the chemistry section above. The cleaned flue gas (TO WASH) exiting the top of the column is submitted to a water wash and cooler (COND) to reduce amine emissions. For convenience
14
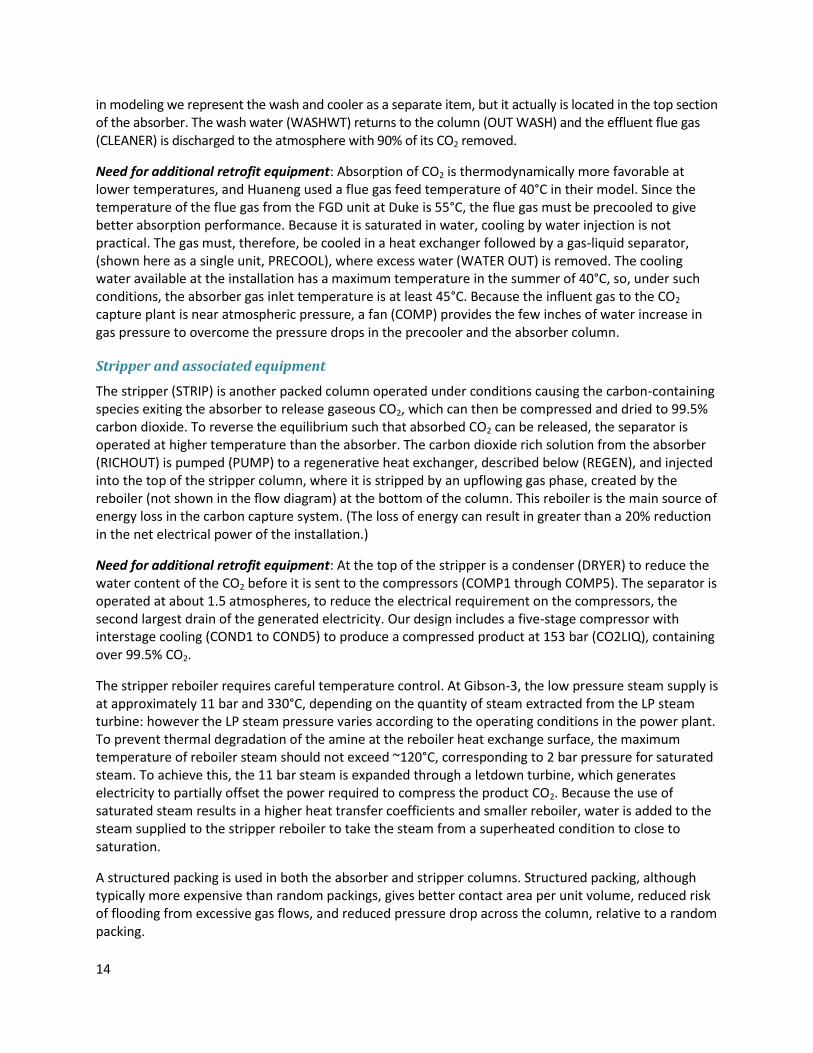
in modeling we represent the wash and cooler as a separate item, but it actually is located in the top section of the absorber. The wash water (WASHWT) returns to the column (OUT WASH) and the effluent flue gas (CLEANER) is discharged to the atmosphere with 90% of its CO2 removed.
Need for additional retrofit equipment: Absorption of CO2 is thermodynamically more favorable at lower temperatures, and Huaneng used a flue gas feed temperature of 40°C in their model. Since the temperature of the flue gas from the FGD unit at Duke is 55°C, the flue gas must be precooled to give better absorption performance. Because it is saturated in water, cooling by water injection is not practical. The gas must, therefore, be cooled in a heat exchanger followed by a gas-liquid separator, (shown here as a single unit, PRECOOL), where excess water (WATER OUT) is removed. The cooling water available at the installation has a maximum temperature in the summer of 40°C, so, under such conditions, the absorber gas inlet temperature is at least 45°C. Because the influent gas to the CO2 capture plant is near atmospheric pressure, a fan (COMP) provides the few inches of water increase in gas pressure to overcome the pressure drops in the precooler and the absorber column.
Stripper and associated equipment
The stripper (STRIP) is another packed column operated under conditions causing the carbon-containing species exiting the absorber to release gaseous CO2, which can then be compressed and dried to 99.5% carbon dioxide. To reverse the equilibrium such that absorbed CO2 can be released, the separator is operated at higher temperature than the absorber. The carbon dioxide rich solution from the absorber (RICHOUT) is pumped (PUMP) to a regenerative heat exchanger, described below (REGEN), and injected into the top of the stripper column, where it is stripped by an upflowing gas phase, created by the reboiler (not shown in the flow diagram) at the bottom of the column. This reboiler is the main source of energy loss in the carbon capture system. (The loss of energy can result in greater than a 20% reduction in the net electrical power of the installation.)
Need for additional retrofit equipment: At the top of the stripper is a condenser (DRYER) to reduce the water content of the CO2 before it is sent to the compressors (COMP1 through COMP5). The separator is operated at about 1.5 atmospheres, to reduce the electrical requirement on the compressors, the second largest drain of the generated electricity. Our design includes a five-stage compressor with interstage cooling (COND1 to COND5) to produce a compressed product at 153 bar (CO2LIQ), containing over 99.5% CO2.
The stripper reboiler requires careful temperature control. At Gibson-3, the low pressure steam supply is at approximately 11 bar and 330°C, depending on the quantity of steam extracted from the LP steam turbine: however the LP steam pressure varies according to the operating conditions in the power plant. To prevent thermal degradation of the amine at the reboiler heat exchange surface, the maximum temperature of reboiler steam should not exceed ~120°C, corresponding to 2 bar pressure for saturated steam. To achieve this, the 11 bar steam is expanded through a letdown turbine, which generates electricity to partially offset the power required to compress the product CO2. Because the use of saturated steam results in a higher heat transfer coefficients and smaller reboiler, water is added to the steam supplied to the stripper reboiler to take the steam from a superheated condition to close to saturation.
A structured packing is used in both the absorber and stripper columns. Structured packing, although typically more expensive than random packings, gives better contact area per unit volume, reduced risk of flooding from excessive gas flows, and reduced pressure drop across the column, relative to a random packing.
15
Recycle loop
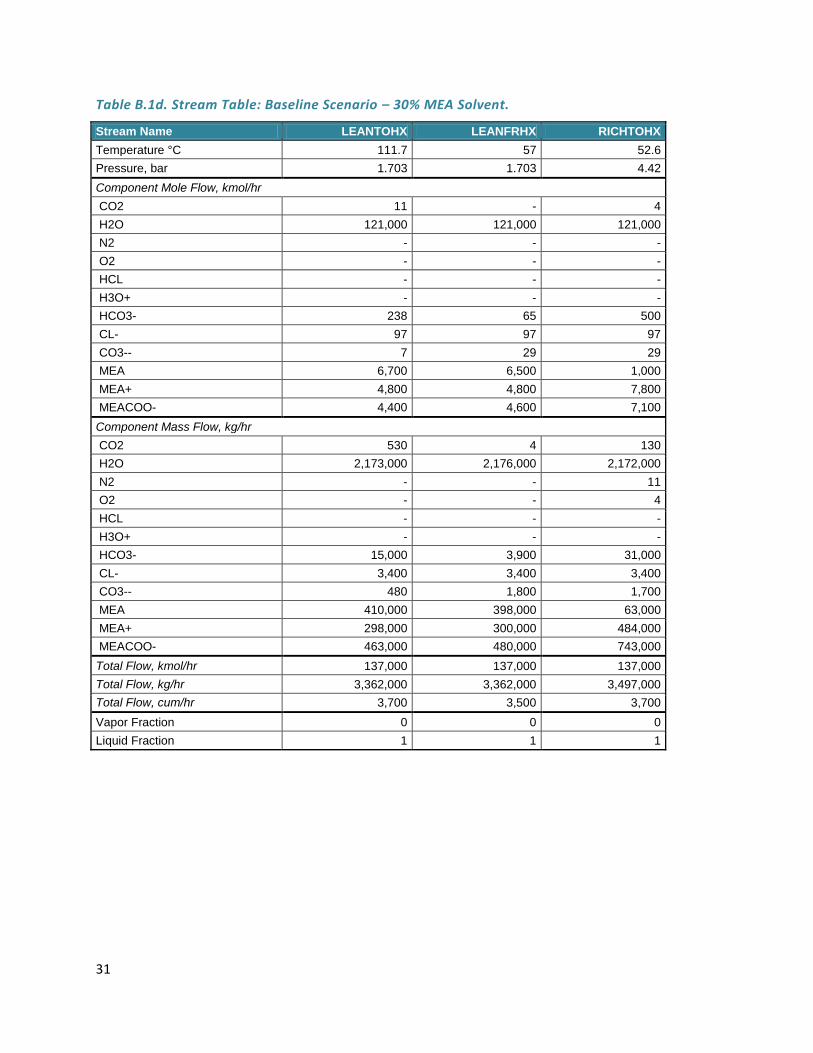
The purpose of the recycle loop is to heat the CO2-rich solution (RICHTOHX) for injection into the stripper while cooling the CO2-lean solution from the stripper (LEANTOHX) for injection into the absorber. The main component of the recycle loop is the regenerative heat exchanger (REGEN) that heats the stripper feed (STRIPFEE) as it cools the stripper lean (LEANFRHX) solution. The recycle loop contains two centrifugal pumps, one (PUMP) to advance the CO2 rich absorber product through the regenerative heat exchanger and compress it to 1.5 bar as it is fed to the stripper. The recycle pump (RECYCLEP) overcomes the pressure drop in the regenerative heat exchanger, and the head difference between the bottom of the stripper and the top of the absorber column. The cooler (COOL), reduces the recycled solution temperature to the desired absorber feed temperature. The recycled solvent is adjusted for amine and water concentration (makeup solvent is the AMINEFD stream) before being fed to the absorber. The stream, AMINEFD, in Tables B.1 – B.3 contains a significant amount of water and a very small (MEA case) to not measurable (Mixed amine case) amount of amine. This stream also includes the water added to the washer (COND) at the top of the absorber.
Baseline 1: CO2 Removal using 30% Monoethanolamine
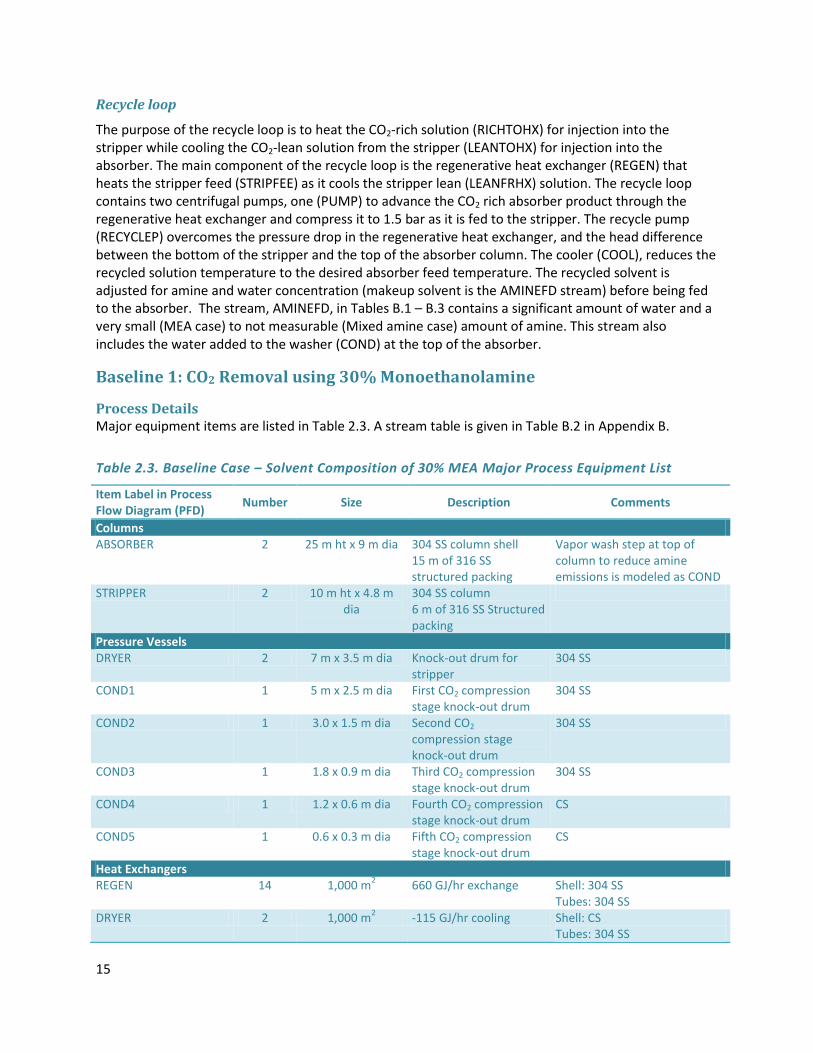
Process Details Major equipment items are listed in Table 2.3. A stream table is given in Table B.2 in Appendix B.
Table 2.3. Baseline Case – Solvent Composition of 30% MEA Major Process Equipment List
Item Label in Process Flow Diagram (PFD)
Number Size Description Comments
Columns ABSORBER 2 25 m ht x 9 m dia 304 SS column shell
15 m of 316 SS structured packing
Vapor wash step at top of column to reduce amine emissions is modeled as COND
STRIPPER 2 10 m ht x 4.8 m dia
304 SS column 6 m of 316 SS Structured packing
Pressure Vessels DRYER 2 7 m x 3.5 m dia Knock-out drum for
stripper 304 SS
COND1 1 5 m x 2.5 m dia First CO2 compression stage knock-out drum
304 SS
COND2 1 3.0 x 1.5 m dia Second CO2 compression stage knock-out drum
304 SS
COND3 1 1.8 x 0.9 m dia Third CO2 compression stage knock-out drum
304 SS
COND4 1 1.2 x 0.6 m dia Fourth CO2 compression stage knock-out drum
CS
COND5 1 0.6 x 0.3 m dia Fifth CO2 compression stage knock-out drum
CS
Heat Exchangers REGEN 14 1,000 m
2 660 GJ/hr exchange Shell: 304 SS
Tubes: 304 SS
DRYER 2 1,000 m2 -115 GJ/hr cooling Shell: CS
Tubes: 304 SS

16
Item Label in Process Flow Diagram (PFD)
Number Size Description Comments
REBOIL 4 1,000 m2 440 GJ/hr heating Shell: CS
Tubes: 304 SS COOLER 4 1,000 m
2 -137 GJ/hr cooling Shell: CS
Tubes: 304 SS CO2COND1 4 900 m
2 -18 GJ/hr cooling Shell: CS
Tubes: 304 SS CO2COND2 3 800 m
2 -12 GJ/hr cooling Shell: CS
Tubes: 304 SS CO2COND3 3 800 m
2 -12 GJ/hr cooling Shell: CS
Tubes: 304 SS CO2COND4 3 800 m
2 -12 GJ/hr cooling Shell: CS
Tubes: CS CO2COND5 4 1,000 m
2 -24 GJ/hr cooling Shell: CS
Tubes: 304 SS PRECOOLERHX 10 1,000 m
2 -108 GJ/hr Shell: CS
Tubes: 304 SS Not shown on flow diagram
INTERCOOLER 2 1,000 m2 Shell: CS
Tubes: 304 SS Not shown on flow diagram
Compressors COMP 7 0.1 MW Pre-Absorber Blower Stainless Steel COMP1 1 2.25 MW Brake Power Stainless Steel COMP2 1 2.25 MW Brake Power Stainless Steel COMP3 1 2.25 MW Brake Power Stainless Steel COMP4 1 2.25 MW Brake Power CS COMP5 1 2.25 MW Brake Power CS Pumps Absorber Bottoms Pump
5 0.3 m3/s 750 kPa ΔP 304 SS
Stripper Bottoms Pump 5 0.3 m3/s 300 kPa ΔP 304 SS
Intercooling Pump 5 0.3 m3/s
30 kPa ΔP 304 SS. Not shown on flow
diagram Tankage Amine Solution Surge Tank
2 750 m3 304 SS
Amine Solution Mixing Tank
1 90 m3 304 SS
Caustic Mixing Tank 1 10 m3 Glass-lined CS.
Caustic Storage Tank 1 400 m3 Glass-lined CS. 28 day storage
MEA Storage Tank 1 180 m3 304 SS. 28 day storage
Other Ion Exchange Column 2 7.75 m x 2.5 m dia Used to remove heat-
stable salts from the amine solution
Resin-lined CS pressure vessel. Not shown on flow diagram
Activated Carbon Beds for Amine Solution
2 6 m x 2 m dia Used to remove amine
degradation byproducts from amine solution
Activated carbon bed with resin-lined CS. Not shown on flow diagram
17
Item Label in Process Flow Diagram (PFD)
Number Size Description Comments
CO2 Drying Beds 2 5.5 m x 1.5 m dia Used to dry CO2 after COND3 knock-out drum
Silica: CS vessel shell. Not shown on flow diagram
Activated Carbon Beds for treatment of CO2
2 4 m x 1 m dia For removal of organic
impurities from CO2. Activated carbon with resin-lined CS. Not shown on flow diagram
MEA – 30% Amine Concentration A process flowsheet showing most, but not all, of these equipment items is given in Appendix A as Figure A.1. A stream table of process flows for the baseline 30% MEA scenario is given in Table B.1.
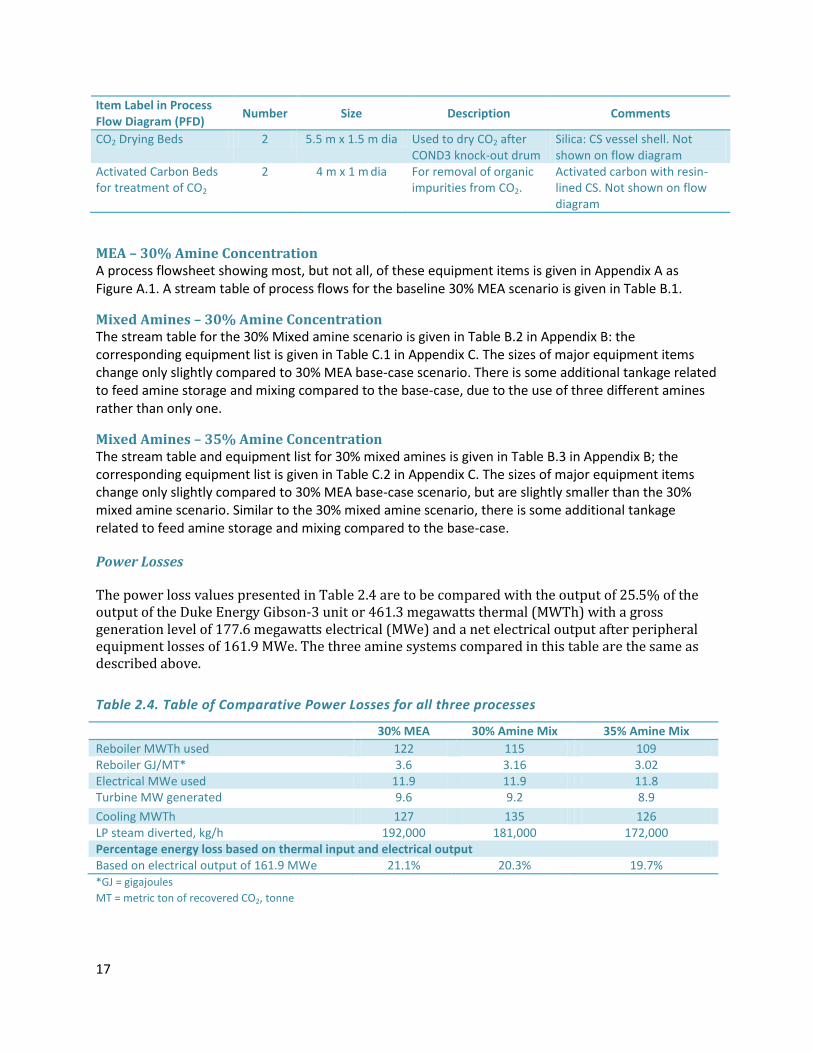
Mixed Amines – 30% Amine Concentration The stream table for the 30% Mixed amine scenario is given in Table B.2 in Appendix B: the corresponding equipment list is given in Table C.1 in Appendix C. The sizes of major equipment items change only slightly compared to 30% MEA base-case scenario. There is some additional tankage related to feed amine storage and mixing compared to the base-case, due to the use of three different amines rather than only one.
Mixed Amines – 35% Amine Concentration The stream table and equipment list for 30% mixed amines is given in Table B.3 in Appendix B; the corresponding equipment list is given in Table C.2 in Appendix C. The sizes of major equipment items change only slightly compared to 30% MEA base-case scenario, but are slightly smaller than the 30% mixed amine scenario. Similar to the 30% mixed amine scenario, there is some additional tankage related to feed amine storage and mixing compared to the base-case.
Power Losses
The power loss values presented in Table 2.4 are to be compared with the output of 25.5% of the output of the Duke Energy Gibson-3 unit or 461.3 megawatts thermal (MWTh) with a gross generation level of 177.6 megawatts electrical (MWe) and a net electrical output after peripheral equipment losses of 161.9 MWe. The three amine systems compared in this table are the same as described above.
Table 2.4. Table of Comparative Power Losses for all three processes
30% MEA 30% Amine Mix 35% Amine Mix
Reboiler MWTh used 122 115 109 Reboiler GJ/MT* 3.6 3.16 3.02 Electrical MWe used 11.9 11.9 11.8 Turbine MW generated 9.6 9.2 8.9
Cooling MWTh 127 135 126 LP steam diverted, kg/h 192,000 181,000 172,000 Percentage energy loss based on thermal input and electrical output Based on electrical output of 161.9 MWe 21.1% 20.3% 19.7% *GJ = gigajoules
MT = metric ton of recovered CO2, tonne
18
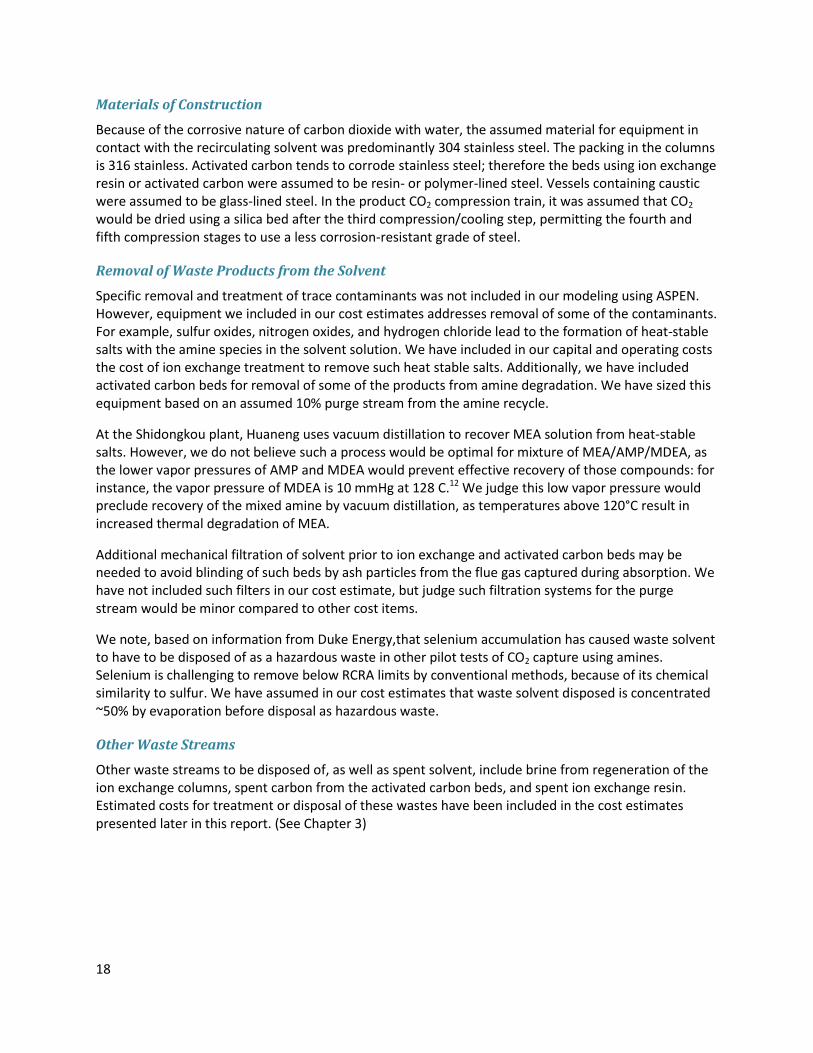
Materials of Construction
Because of the corrosive nature of carbon dioxide with water, the assumed material for equipment in contact with the recirculating solvent was predominantly 304 stainless steel. The packing in the columns is 316 stainless. Activated carbon tends to corrode stainless steel; therefore the beds using ion exchange resin or activated carbon were assumed to be resin- or polymer-lined steel. Vessels containing caustic were assumed to be glass-lined steel. In the product CO2 compression train, it was assumed that CO2 would be dried using a silica bed after the third compression/cooling step, permitting the fourth and fifth compression stages to use a less corrosion-resistant grade of steel.
Removal of Waste Products from the Solvent
Specific removal and treatment of trace contaminants was not included in our modeling using ASPEN. However, equipment we included in our cost estimates addresses removal of some of the contaminants. For example, sulfur oxides, nitrogen oxides, and hydrogen chloride lead to the formation of heat-stable salts with the amine species in the solvent solution. We have included in our capital and operating costs the cost of ion exchange treatment to remove such heat stable salts. Additionally, we have included activated carbon beds for removal of some of the products from amine degradation. We have sized this equipment based on an assumed 10% purge stream from the amine recycle.
At the Shidongkou plant, Huaneng uses vacuum distillation to recover MEA solution from heat-stable salts. However, we do not believe such a process would be optimal for mixture of MEA/AMP/MDEA, as the lower vapor pressures of AMP and MDEA would prevent effective recovery of those compounds: for instance, the vapor pressure of MDEA is 10 mmHg at 128 C.12 We judge this low vapor pressure would preclude recovery of the mixed amine by vacuum distillation, as temperatures above 120°C result in increased thermal degradation of MEA.
Additional mechanical filtration of solvent prior to ion exchange and activated carbon beds may be needed to avoid blinding of such beds by ash particles from the flue gas captured during absorption. We have not included such filters in our cost estimate, but judge such filtration systems for the purge stream would be minor compared to other cost items.
We note, based on information from Duke Energy,that selenium accumulation has caused waste solvent to have to be disposed of as a hazardous waste in other pilot tests of CO2 capture using amines. Selenium is challenging to remove below RCRA limits by conventional methods, because of its chemical similarity to sulfur. We have assumed in our cost estimates that waste solvent disposed is concentrated ~50% by evaporation before disposal as hazardous waste.
Other Waste Streams
Other waste streams to be disposed of, as well as spent solvent, include brine from regeneration of the ion exchange columns, spent carbon from the activated carbon beds, and spent ion exchange resin. Estimated costs for treatment or disposal of these wastes have been included in the cost estimates presented later in this report. (See Chapter 3)
19
Chapter 3: Process Economics
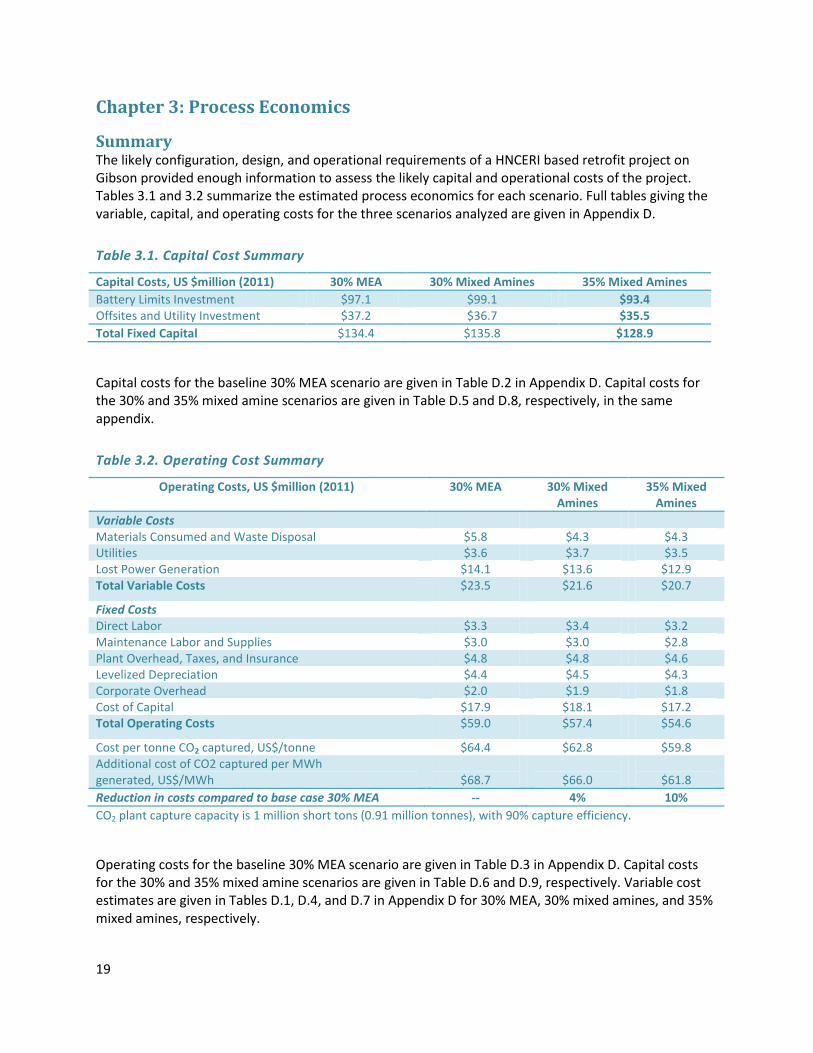
Summary The likely configuration, design, and operational requirements of a HNCERI based retrofit project on Gibson provided enough information to assess the likely capital and operational costs of the project. Tables 3.1 and 3.2 summarize the estimated process economics for each scenario. Full tables giving the variable, capital, and operating costs for the three scenarios analyzed are given in Appendix D.
Table 3.1. Capital Cost Summary
Capital Costs, US $million (2011) 30% MEA 30% Mixed Amines 35% Mixed Amines
Battery Limits Investment $97.1 $99.1 $93.4 Offsites and Utility Investment $37.2 $36.7 $35.5
Total Fixed Capital $134.4 $135.8 $128.9
Capital costs for the baseline 30% MEA scenario are given in Table D.2 in Appendix D. Capital costs for the 30% and 35% mixed amine scenarios are given in Table D.5 and D.8, respectively, in the same appendix.
Table 3.2. Operating Cost Summary
Operating Costs, US $million (2011) 30% MEA 30% Mixed Amines
35% Mixed Amines
Variable Costs Materials Consumed and Waste Disposal $5.8 $4.3 $4.3 Utilities $3.6 $3.7 $3.5 Lost Power Generation $14.1 $13.6 $12.9 Total Variable Costs $23.5 $21.6 $20.7
Fixed Costs Direct Labor $3.3 $3.4 $3.2 Maintenance Labor and Supplies $3.0 $3.0 $2.8 Plant Overhead, Taxes, and Insurance $4.8 $4.8 $4.6 Levelized Depreciation $4.4 $4.5 $4.3 Corporate Overhead $2.0 $1.9 $1.8 Cost of Capital $17.9 $18.1 $17.2 Total Operating Costs $59.0 $57.4 $54.6
Cost per tonne CO2 captured, US$/tonne $64.4 $62.8 $59.8 Additional cost of CO2 captured per MWh generated, US$/MWh
$68.7
$66.0
$61.8
Reduction in costs compared to base case 30% MEA -- 4% 10%
CO2 plant capture capacity is 1 million short tons (0.91 million tonnes), with 90% capture efficiency.
Operating costs for the baseline 30% MEA scenario are given in Table D.3 in Appendix D. Capital costs for the 30% and 35% mixed amine scenarios are given in Table D.6 and D.9, respectively. Variable cost estimates are given in Tables D.1, D.4, and D.7 in Appendix D for 30% MEA, 30% mixed amines, and 35% mixed amines, respectively.
20
Conclusions and Analysis We assess that use of the mixed amines, as envisioned in the Huaneng patent, can give modest but definite benefits: up to 10% in operating cost savings for 35% mixed amines. The savings primarily come from both lower lost generation and from reduced material costs because of increased amine stability.
We conclude that the Huaneng mixed amine technology represents an improvement over conventional 30% MEA, but that the improvement in operating cost is not only due to reduced heat of regeneration, but also due to lower amine losses from degradation reducing the solvent replacement costs. We understand that Huaneng is working on process improvements to both decrease lean loading (and hence reduce solvent flow), to improve heat integration, and further extend solvent life. We envision these could yield an additional modest improvement in economics when implemented. These improvements are described in Chapter 3.
Methodology A factorial method based on equipment costs was used for capital cost estimation. Frieght-on-board (FOB) costs of capital equipment were estimated based on the equipment size, using published correlations for equipment costs, and adjusted for materials of construction, and inflated to 2012 costs. Installation costs for the equipment were estimated as factor (multiple) of the FOB equipment costs. Additional adjustments were made to account for the difficult geotechnical conditions at the site, and the fact that the installation would be a retrofit rather than a greenfield installation.
After capital costs were estimated, variable costs (including the chemicals consumed, electricty generation losses, and utility costs) were generated based on the mass and energy balance. From the capital and variable costs, operating costs were estimated.
The variable components of the operating costs are costs that are expected to scale with the quantity of CO2 absorbed. These costs include not only the losses to electricity generation, but also chemical costs from operation of the CO2 capture plant (predominantly solvent makeup costs).
Additional operating costs were added for operating labor and plant labor overhead; maintenance labor and supplies; property taxes and insurance; depreciation; cost of capital; and corporate-level general & administrative charges. Depreciation was treated as straight-line over thirty years.
Equipment Sizing Major equipment items were sized based on either simulation results or on standard rules of thumb for conceptual design of chemical plants. Column diameters were calculated based on ASPEN simulations. Heat exchanger areas were calculated based on using the log-mean temperature difference and typical values of heat transfer coefficients based on nature of the fluids on either side of the heat transfer surface: shell and tube heat exchangers were assumed. Compressors and fans were sized based on their power rating: pumps were sized based on pressure difference and flow. Process vessels were sized based on flow rates through said vessels and required hold-up times. Tankage volume was calculated based on the flow rates and the assessed necessary hold-up time (for surge vessels and mix tanks). For feed storage tanks, we assumed the tanks held 2-4 week inventory of chemicals. Ion exchange columns were sized assuming a 1 hour empty bed contact time. Activated carbon beds were sized assuming an empty bed contact time of 0.5 hours.
Capital Cost Estimation Freight-on-board cost of capital equipment items were estimated using correlations in Peters & Timmerhaus, 5th Edition, 2002, or using specific vendor quotes.13 Costs were inflated to 2011 prices
21
using the Chemical Engineering (a trade magazine) Cost Index (CECI). Capital costs were separated into Battery Limits Investment (BLI) including equipment cost and installation of process equipment handling process streams, and Outside Battery Limits Investment (OBLI) which includes utilities, tankage, and general service facilities, and pipelines for utilities and flue gas from the main Gibson plant. Utility investment includes construction of cooling water towers; steam and any make-up process water were assumed to be supplied by the main Gibson plant
Installation costs for equipment were estimated using a factorial method. Installation costs were broken down into four components:
Construction and fabrication (see discussion below)
Instrumentation (15% of base equipment costs)
Electrical (30% of base equipment costs)
Piping (60-90% of base equipment costs)
Base equipment cost is the freight-on-board cost for a piece of equipment fabricated in carbon steel. A material factor of 2.2 was used for equipment assessed to be 304 stainless steel compared to the carbon steel cost. For equipment assessed to be stainless steel, piping costs were assumed to increase but not construction, electrical, or instrumentation costs.
Special Considerations for the Gibson Site
Geotechnical conditions are difficult at the site. The only area available for construction would be part of the current ash disposal area. Further, the underlying soil in the area is poorly consolidated, and the area is seismically sensitive. Hence, it was assumed that the construction cost component of installation costs would be raised by a factor of 2.5 to reflect additional civil engineering costs, such as driving piles to the approximate 50’ bedrock depth. Hence, for carbon steel equipment the construction and fabrication costs were assumed to be between 150%-225% of the freight-on-board equipment costs. For 304 stainless steel, the construction and fabrication costs varied from 68%-102% of the equipment cost.
As costs in Peters & Timmerhaus are for greenfield construction, a complexity factor of 1.2 was used to reflect the additional design engineering and construction costs of constructing a facility within an existing operating plant.
Comparison with Capital Costs for Shidongkou
We assess, by comparing to the cost of the Shindongkou plant, that our capital cost estimates are in the reasonable range. A method of cross-checking chemical plant capital cost estimates is to use construction costs for previously constructed plants, and adjust for costs related to scale and location. The Shidongkou plant was installed at a cost of RMB 160 million (US$24 million) for a nominal capacity of 100,000 tonnes using 15-20% MEA, later debottlenecked to 120,000 tonnes. Capital cost for chemical plants built in China vary between 60-80% of the cost for an equivalent U.S. plant. Therefore, using a location factor of 70% to convert from U.S. costs to Chinese costs14, and a scaling exponent of 0.66, we would get rough estimate of a capital cost for US$130 million for a 910,000 tonne capacity plant in the U.S. However, the Shidongkou plant uses a 15-20% solution of MEA, so would have a somewhat higher capital cost than a plant using 30% MEA. However, this is balanced out by the need in our cost estimates to account for poor geotechnical conditions at the Gibson power station. Given this, our estimate of the capital cost of an MEA carbon capture plant of US$134 million seem to be in line with what we would expect from comparison with the plant at Shidongkou.

22
Operating Costs Variable costs for the processes include materials consumed, the opportunity cost of electricity not generated because of operation of the plant, and utilities used (cooling water). Steam and any make-up process water were assumed to be supplied by the Gibson plant; the cost of supplied steam is costed as opportunity loss of lost electricity generated.
Cost of amines consumed were based on list prices given by Dow Chemical, which were then discounted by 20%, as contract prices for chemical are typically substantially lower than list prices. Costs of other materials (e.g. activated carbon, ion exchange resins, desiccants) were based on professional experience and data found on vendor websites on prevailing prices. Estimates for amine were based on MEA degradation rates using data from Singh, et al.;15 relative degradation rates for MEA and MDEA relative to MEA were extrapolated from published experiments by Lepaumier et al. for aqueous amines at 140 C and high pressures of O2 and CO2,
16 and also based on feedback from Huaneng.
While the carbon capture plant is operating, there is a loss of electricity generation due to both thermal energy diverted to the carbon capture plant for solvent regeneration, and also due to parasitic electricity demand of pumps and compressors used in the process (including the cooling water recirculation pumps). The cost of the energy penalty of steam diverted from production of electricity to the stripper reboiler was priced as an opportunity cost, using the five-year average contract price for wholesale electricity for Midwest ISO/Cinergy, which is the grid Independent System Operator for the Gibson plant
Cost Parameters Table 3.3 indicates the cost parameters used by the team in the capital and operating cost estimates.
Table 3.3. Cost Parameters Used
Cost Parameter Value Used Comments
Location Princeton, Indiana, USA Project-Specified Discount Rate 12.5% Team Estimate based on typical energy firm
cost of capital Depreciation Lifetime 30 years Industry Standard; treated as straight-line
(levelized) depreciation Contingency factor for capital costs and for drilling costs
20% Team Estimate
General Service Facilities 20% of Total Fixed Capital Team Estimate Waste Treatment Facilities 5% of Battery Limits
Investment Team, Estimate
Labor costs $62/hour Bureau of Labor Statistics Manufacturing Compensation in Indiana
Plant overhead 80% of Operating Labor Maintenance Costs 6% of BLI Typical level for high-maintenance chemical
processes Taxes & Insurance 1.6% of BLI Industry Standard General, Admin, Sales & Research
5% of Plant Gate Costs* Team Estimate
* Plant gate costs are defined here as the cash cost plus depreciation charges. Production cost is equal to the plant gate cost plus a charge for corporate general, sales, administration and R&D costs (GASR). Operating costs are defined as the production cost plus the cost of capital (i.e. the capital investment times the discount rate).
23
Implications for retrofit economics
As discussed in the conclusions subsection above, we estimate that the Huaneng process, especially at 35% concentration, shows modest but definite cost benefits over 30% MEA: with our assessment of the Huaneng process showing up to a 10% operating cost advantage. Capital cost advantages are only seen when using 35% mixed amines, and are slight (3%); however the advantages in energy consumption and solvent degradation are more substantive and are seen for both 30% and 35% mixed amine concentration. We estimate that the cost of CO2 capture is approximately $60/MWh. Note this does not include the cost of liquefaction and disposal of the CO2 captured from the plant, although it includes the cost of compression of CO2 to 150 bar.
24
Chapter 4: Uncertainties and Opportunities
Uncertainties As noted in previous chapters, since we did not have access to the rate-based absorption/distillation module in ASPEN, we had to approximate the column behavior by using equilibrium models for the absorber and stripper. This introduces uncertainty into the packed height of these columns (as we used a published correlation to estimate the HETP for the columns17, rather than being able to use rigorous simulation), and also leads to a potential underestimation of the total solvent flow. However, given the availability of components for accelerating the rate of absorption (e.g. piperazine), we believe we are likely within 10% of the total solvent flow.
While we have some remaining uncertainty regarding the energy loss due to the stripper reboiler in the mixed amine case, we have been informed by Huaneng that they do not anticipate being able to reduce the energy loss to the stripper reboiler much below 3.0 GJ/tonne CO2 absorbed: there may be some reductions from better heat integration, but they anticipate their future focus on solvent composition will be on extending solvent lifetime rather than on reducing the energy penalty.
We are uncertain about the necessary amount of process water make-up, because changes in the precooling operation and in the handling of water in the solvent purge stream sent to purification will radically affect the process water balance. However, even if the most conservative estimate of the water imbalance (the water content in the AMINEFD stream) was made up using process water, the impact on operating cost would be less than $150,000/year; this is minor compared to the overall variable cost estimates of ~$20 million/year. Further, we do not believe any of the three scenarios considered would have a substantive advantage in process water consumption over another.
Opportunities for Further Optimization We understand that Huaneng is pursuing several strategies for further heat integration and for extending solvent life. These include:
1. Intercooling in the absorber 2. Multiple feed locations of lean solvent to absorber 3. Bleed, alkalination, flash and mechanical vapor recompression (MVR) of the lean solution 4. Cooling of incoming raw flue gas with rich solvent 5. Multiple flashes of rich feed to stripper
Detailed description of these opportunities follows:
1. Intercooling in the absorber. As the amine solvent absorbs CO2, the heat of reaction of MEA (and other amines) with CO2 leads to heating of the solution. As higher temperatures shift the equilibrium constants of the solvent values to those less favorable for absorption, cooling of the solvent during absorption reduces temperature peaks in the absorber and decreases solvent flow. A typical intercooling design might have 1-2 intercooling stages between packing sections. Solvent is pumped out of the absorber, cooling in heat exchangers, and then pumped back into the column into the distributors between packed sections. Some intercooling is included LLNL’s model. We found that intercooling is more effective for solvents with a higher heat of absorption of CO2 (i.e. while intercooling improves the absorber performance for all solvent mixtures, the improvement was greater for 30% MEA than for the mixed amines). Intercooling of the liquid in the absorber can be used to eliminate the precooling

25
of the flue gas from 55°C to 44.4°C at a lower capital cost because liquid cooling requires a smaller heat exchanger than gas cooling for the same quantity of heat transferred. A disadvantage of using intercooling to replace precooling is that the 44 tonnes per hour of water that the precooler removes would then be added to the circulation system, requiring water bleed and amine loss.
2. Multiple Feed locations of lean solvent into the absorber. Huaneng expect that by introducing the lean CO2 at multiple locations in the absorber, they can reduce the partial pressure of CO2 in the upper part of the absorber column, by causing more of the absorption of the CO2 to occur in the lower sections of the absorber. With this reconfiguration, they expect that the lean CO2 fed to the upper reaches of the column will further reduce the partial pressure of CO2. As with intercooling, the aim is to reduce the overall solvent flow while maintaining the same performance of CO2removal from the flue gas.
3. Bleed, alkalination, flash and mechanical vapor recompression (MVR) of the lean solution. This more unconventional system adds a bleed stream and pressure swing step to the CO2
stripping section. In this configuration, a slip stream of 10% of the lean solution is bled from the stripper bottoms discharge and mixed with sodium hydroxide to convert heat stable amine bisulfite and sulfite salts to sodium bisulfite and sulfite and free amines. The resulting mixture is flashed to below-atmospheric pressure to volatilize CO2, steam, and amine, leaving heat stable sodium bisulfite (hydrogen sulfite) and sulfite salts in the residual liquid. The vapor is recompressed and fed to the stripper bottoms section. The aim of this configuration is to lower the lean loading of CO2 on the solvent, both by flashing some CO2 in the flash drum, but also, as most of the recompressed vapor is steam, the partial pressure of CO2 in the lower part of the stripping column is reduced, further reducing the lean loading. For the mixed amine scenario, as a portion of the low boiling monoethanolamine (MEA) is replaced with methyldiethanolamine (MDEA) and 2 amino-2-methylpropanolamine (AMP), the amine boiling point will increase and amine recovery in this step will be more difficult than for the scenario where solely MEA is used.
4. Cooling of incoming raw flue gas with rich solvent This is a more straightforward heat integration step, using low-grade heat from the flue gas prior to the flue gas desulfurization to heat the rich solvent before entering the stripping column. This should lower the reboiler duty. Disadvantages are that this type of heat integration can be difficult if the pipe runs are long, and the poor gas-side heat exchange coefficients can result in large heat exchanger sizes for only a moderate amount of heat integration. Also, as the proportion of CO2 captured from the plant increases, the increase in temperature of the solvent from pre-heating by the flue gas decreases, i.e. as the CO2 capture process scales up, the impact of this process change per tonne of CO2 captured will decrease.
5. Multiple flashes of rich solvent prior to feed into the stripper. Unlike the flash stages after the stripper, here the aim is to reduce oxidative degradation of the amine in the stripper by flashing off most of the oxygen prior to the solvent being exposed to the higher temperature in the reboiler.
26
Additional implications for potential operations
Huaneng has been able to directly assess process improvements at their three pilot-to-near production scale amine-based carbon capture facilities in China. Although we have not performed formal modeling of the process improvements mentioned above, based on our qualitative assessment we see them as incrementally improving the operability and economics of a carbon capture plant. For instance, although a pre-stripper flash will decrease oxidative degradation of the amines, there are still thermal- and CO2-catalyzed degradation paths that would lead to solvent degradation, particularly for MEA. While the cost of solvent replacement would decrease, we qualitatively assess this would be at most a 20-30% decrease in solvent replacement costs. Further, the process improvements, while reducing the energy penalty (and hence cost of lost electricity generated) and the costs from replacement solvent, would not be expected to radically reduce capital-related and other fixed costs, which are over 60% of the total costs. Hence, these improvements may add further to the modest operational cost benefit of the use of mixed amines, but not to the point of making a revolutionary improvement in the cost of carbon capture.

27
Appendix A:
Figure A.1. Process Flow Diagram
28
Appendix B: Stream Tables
Table B.1a. Stream Table: Baseline Scenario – 30% MEA Solvent.
Stream Name FLUEGAS COMPFLU WATEROUT FEEDGAS TOWASH CLEANER
Temperature °C 54.4 55 44.4 44.4 55.7 64
Pressure, bar 1.011 1.037 1.037 1.037 1.016 1.014
Component Mole Flow, kmol/hr
CO2 3,300 3,300 - 3,300 280 280
H2O 5,300 5,300 2,500 2,900 5,000 8,100
N2 23,288 23,288 - 23,288 23,288 23,288
O2 2,300 2,300 - 2,300 2,300 2,300
HCL - - - - - -
H3O+ - - - - - -
HCO3- - - - - - -
CL- - - - - - -
CO3-- - - - - - -
MEA - - - - - -
MEA+ - - - - - -
MEACOO- - - - - - -
Component Mass Flow, kg/hr
CO2 144,000 144,000 4 144,000 12,000 12,000
H2O 97,200 96,000 44,000 52,000 90,000 145,000
N2 651,600 652,000 - 652,000 652,000 652,000
O2 72,000 72,000 - 72,000 72,000 72,000
HCL - - - - - -
H3O+ - - - - - -
HCO3- - - - - - -
CL- - - - - - -
CO3-- - - - - - -
MEA - - - - - -
MEA+ - - - - - -
MEACOO- - - - - - -
Total Flow, kmol/hr 34,000 34,000 2,500 32,000 31,000 34,000
Total Flow, kg/hr 965,000 921,000 44,000 918,000 827,000 882,000
Total Flow, cum/hr 914,400 896,000 43 806,000 828,000 936,000
Vapor Fraction 1 1 0 1 1 1
Liquid Fraction 0 0 1 0 0 0
29
Table B.1b. Stream Table: Baseline Scenario – 30% MEA Solvent.
Stream Name AMINEFD REC COMBFD OUTWASH RICHOUT
Temperature °C 44.4 44.4 44.4 64 52.5
Pressure, bar 1.013 1.048 1.016 1.014 1.016
Component Mole Flow, kmol/hr
CO2 - - - - 4
H2O 1,800 121,000 123,000 510 121,000
N2 - - - - -
O2 - - - - -
HCL - - - - -
H3O+ - - - - -
HCO3- - 43 43 - 500
CL- - 97 97 - 97
CO3-- - 40 40 - 29
MEA 58 6,500 6,600 - 1,000
MEA+ - 4,800 4,800 - 7,800
MEACOO- - 4,600 4,600 - 7,100
Component Mass Flow, kg/hr
CO2 - - - - 130
H2O 32,400 2,176,000 2,209,000 9,300 2,172,000
N2 - - - - 11
O2 - - - - 4
HCL - - - - -
H3O+ - - - - -
HCO3- - 2,600 2,600 - 31,000
CL- - 3,400 3,400 - 3,400
CO3-- - 2,400 2,400 - 1,700
MEA 3,500 397,000 400,000 - 63,000
MEA+ - 300,000 300,000 - 484,000
MEACOO- - 480,000 480,000 - 743,000
Total Flow, kmol/hr 1,900 137,000 139,000 510 137,000
Total Flow, kg/hr 36,000 3,362,000 3,394,000 9,300 3,497,000
Total Flow, cum/hr 65 3,500 3,500 11 3,700
Vapor Fraction 0 0 0 0 0
Liquid Fraction 1 1 1 1 1

30
Table B.1c. Stream Table: Baseline Scenario – 30% MEA Solvent.
Stream Name STRIPFEE LEANOUT VAPOR REFLUX GASFSTR CO2LIQ
Temperature °C 97.7 111.6 96.6 47.7 47.7 44.4
Pressure, bar 1.662 1.52 1.52 1.52 1.52 153
Component Mole Flow, kmol/hr
CO2 970 11 3,000 - 3,000 3,000
H2O 121,000 121,000 2,800 2,500 240 11
N2 - - - - - -
O2 - - - - - -
HCL - - - - - -
H3O+ - - - - - -
HCO3- 510 240 - 4 - -
CL- 97 97 - - - -
CO3-- 11 7 - - - -
MEA 3,000 6,700 4 - - -
MEA+ 6,800 4,800 - 4 - -
MEACOO- 6,200 4,400 - - - -
Component Mass Flow, kg/hr
CO2 43,000 530 131,000 58 131,000 131,000
H2O 2,172,000 2,173,000 50,000 46,000 4,300 180
N2 11 - 11 - 11 11
O2 4 - 4 - 4 4
HCL - - - - - -
H3O+ - - - - - -
HCO3- 31,000 15,000 - 180 - -
CL- 3,400 3,400 - - - -
CO3-- 620 480 - - - -
MEA 181,000 410,000 180 - - -
MEA+ 423,000 298,000 - 180 - -
MEACOO- 643,000 463,000 - - - -
Total Flow, kmol/hr 138,000 137,000 5,700 2,500 3,200 3,000
Total Flow, kg/hr 3,497,000 3,362,000 181,000 46,000 135,000 131,000
Total Flow, cum/hr 35,000 3,700 115,000 47 56,000 194
Vapor Fraction 0.012 0 1 0 1 1
Liquid Fraction 0.988 1 0 1 0 0
31
Table B.1d. Stream Table: Baseline Scenario – 30% MEA Solvent.
Stream Name LEANTOHX LEANFRHX RICHTOHX
Temperature °C 111.7 57 52.6
Pressure, bar 1.703 1.703 4.42
Component Mole Flow, kmol/hr
CO2 11 - 4
H2O 121,000 121,000 121,000
N2 - - -
O2 - - -
HCL - - -
H3O+ - - -
HCO3- 238 65 500
CL- 97 97 97
CO3-- 7 29 29
MEA 6,700 6,500 1,000
MEA+ 4,800 4,800 7,800
MEACOO- 4,400 4,600 7,100
Component Mass Flow, kg/hr
CO2 530 4 130
H2O 2,173,000 2,176,000 2,172,000
N2 - - 11
O2 - - 4
HCL - - -
H3O+ - - -
HCO3- 15,000 3,900 31,000
CL- 3,400 3,400 3,400
CO3-- 480 1,800 1,700
MEA 410,000 398,000 63,000
MEA+ 298,000 300,000 484,000
MEACOO- 463,000 480,000 743,000
Total Flow, kmol/hr 137,000 137,000 137,000
Total Flow, kg/hr 3,362,000 3,362,000 3,497,000
Total Flow, cum/hr 3,700 3,500 3,700
Vapor Fraction 0 0 0
Liquid Fraction 1 1 1
32
Table B.2a. Stream Table: 30% Mixed Amine Solvent.
Stream Name FLUEGAS COMPFLU WATEROUT FEEDGAS TOWASH CLEANER
Temperature °C 54.4 55 44.4 44.4 50.6 50.3
Pressure, bar 1.011 1.037 1.037 1.037 1.016 1.014
Component Mole Flow, kmol/hr
CO2 3,300 3,300 - 3,300 300 300
H2O 5,300 5,300 2,462 2,900 3,700 3,700
N2 23,000 23,000 - 23,000 23,000 23,000
O2 2,300 2,300 - 2,300 2,300 2,300
HCL - - - - - -
H3O+ - - - - - -
HCO3- - - - - - -
CL- - - - - - -
CO3-- - - - - - -
MEA - - - - - -
MEA+ - - - - - -
MEACOO- - - - - - -
MDEA - - - - - -
AMP - - - - - -
AMP+ - - - - - -
MDEA+ - - - - - -
Component Mass Flow, kg/hr
CO2 144,000 144,000 - 144,000 13,000 13,000
H2O 96,000 96,000 44,000 52,000 67,000 66,000
N2 652,000 652,000 - 652,000 652,000 652,000
O2 72,000 72,000 - 72,000 72,000 72,000
HCL - - - - - -
H3O+ - - - - - -
HCO3- - - - - - -
CL- - - - - - -
CO3-- - - - - - -
MEA - - - - - -
MEA+ - - - - - -
MEACOO- - - - - - -
MDEA - - - - - -
AMP - - - - - -
AMP+ - - - - - -
MDEA+ - - - - - -
Total Flow, kmol/hr 34,000 34,000 2,500 32,000 30,000 30,000
Total Flow, kg/hr 965,000 965,000 44,000 921,000 805,000 804,000
Total Flow, cum/hr 914,000 896,000 43 806,000 785,000 781,000
Vapor Fraction 1 1 0 1 1 1
Liquid Fraction 0 0 1 0 0 0

33
Table B.2b. Stream Table: 30% Mixed Amine Solvent.
Stream Name AMINEFD REC COMBFD OUTWASH RICHOUT
Temperature °C 44.4 44.4 44.4 50.3 50
Pressure, bar 1.013 1.048 1.016 1.014 1.016
Component Mole Flow, kmol/hr
CO2 - - - - 4
H2O 4,600 140,000 137,000 3,700 139,000
N2 - - - - -
O2 - - - - -
HCL - - - - -
H3O+ - - - - -
HCO3- - 68 68 - 1,224
CL- - - - - -
CO3-- - 29 29 - 72
MEA - 2,400 2,400 - 170
MEA+ - 2,900 2,900 - 3,300
MEACOO- - 3,700 3,700 - 5,400
MDEA - 3,300 3,300 - 1,300
AMP - 620 620 - 86
AMP+ - 600 600 - 1,100
MDEA+ - 350 350 - 2,400
Component Mass Flow, kg/hr
CO2 - - - - 160
H2O 84,000 2,516,000 2,470,000 66,000 2,499,000
N2 - - - - 14
O2 - - - - 4
HCL - - - - -
H3O+ - - - - -
HCO3- - 4,300 4,100 - 74,700
CL- - - - - -
CO3-- - 1,800 1,700 - 4,400
MEA - 145,000 145,000 - 11,000
MEA+ - 177,000 177,000 - 204,000
MEACOO- - 382,000 382,000 - 565,000
MDEA - 392,000 392,000 - 152,000
AMP - 55,000 55,000 - 7,600
AMP+ - 54,000 54,000 - 102,000
MDEA+ - 42,000 42,000 - 285,000
Total Flow, kmol/hr 4,600 154,000 151,000 3,700 154,000
Total Flow, kg/hr 84,000 3,771,000 3,724,000 66,000 3,905,000
Total Flow, cum/hr 65 3,800 3,800 68 3,900
Vapor Fraction 0 0 0 0 0
Liquid Fraction 1 1 1 1 1

34
Table B.2c. Stream Table: 30% Mixed Amine Solvent.
Stream Name STRIPFEE LEANOUT VAPOR REFLUX GASFSTR CO2LIQ
Temperature °C 99.4 110.6 98 47.7 47.7 44.4
Pressure, bar 1.662 1.52 1.52 1.52 1.52 153
Component Mole Flow, kmol/hr
CO2 960 7 2,952 - 2,900 2,900
H2O 139,000 140,000 3,700 3,500 230 230
N2 - - - - - -
O2 - - - - - -
HCL - - - - - -
H3O+ - - - - - -
HCO3- 688 227 - - - -
CL- - - - - - -
CO3-- 14 7 - - - -
MEA 810 2,900 - - - -
MEA+ 3,000 2,500 - - - -
MEACOO- 5,100 3,500 - - - -
MDEA 1,800 2,800 - - - -
AMP 300 730 - - - -
AMP+ 920 490 - - - -
MDEA+ 1,900 806 - - - -
Component Mass Flow, kg/hr
CO2 42,000 360 130,000 79 130,000 130,000
H2O 2,510,000 2,514,000 67,000 62,000 4,200 180
N2 14 - 14 - 14 14
O2 4 - 4 - 4 4
HCL - - - - - -
H3O+ - - - - - -
HCO3- 41,969 13,939 - 79 - -
CL- - - - - - -
CO3-- 950 380 - - - -
MEA 50,000 176,000 54 - - -
MEA+ 187,000 154,000 - 54 - -
MEACOO- 527,000 368,000 - - - -
MDEA 214,000 339,000 36 - - -
AMP 27,000 65,000 11 - - -
AMP+ 83,000 44,000 - 11 - -
MDEA+ 223,000 97,000 - 36 - -
Total Flow, kmol/hr 138,000 154,000 7,000 3,500 3,200 3,000
Total Flow, kg/hr 3,497,000 3,771,000 197,000 63,000 134,000 130,000
Total Flow, cum/hr 35,000 4,000 134,000 65 56,000 194
Vapor Fraction 0.012 0 1 0 1 1
Liquid Fraction 0.988 1 0 1 0 0
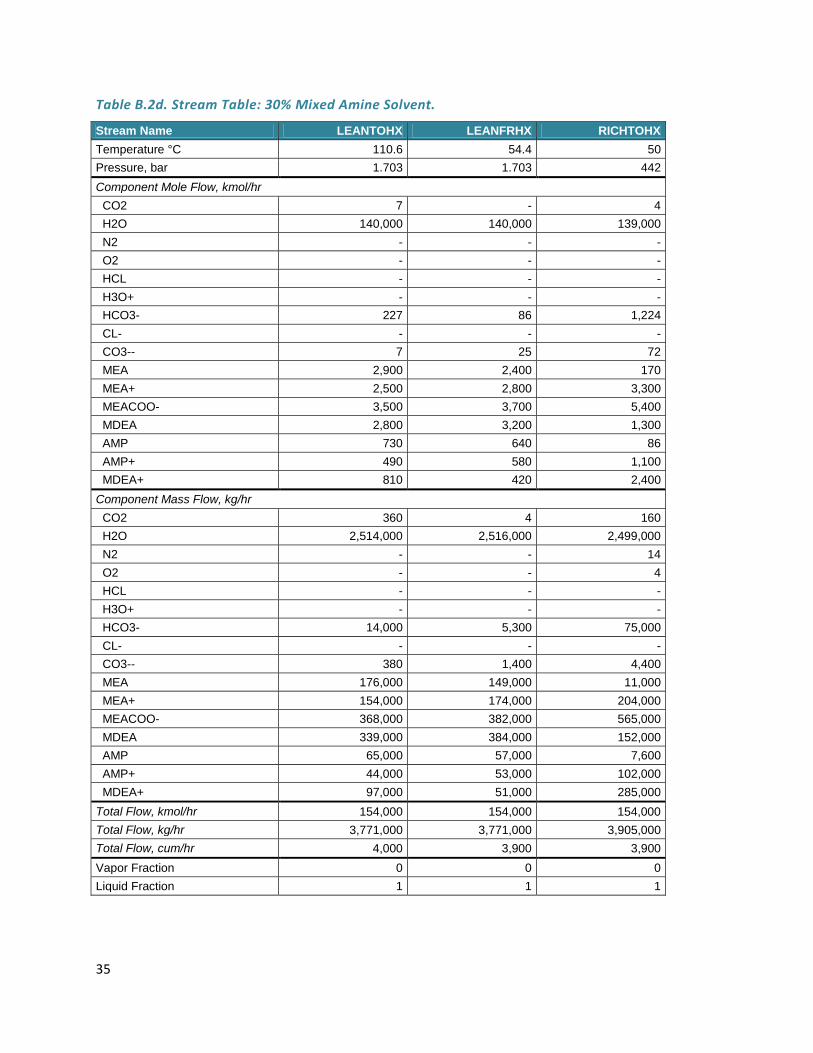
35
Table B.2d. Stream Table: 30% Mixed Amine Solvent.
Stream Name LEANTOHX LEANFRHX RICHTOHX
Temperature °C 110.6 54.4 50
Pressure, bar 1.703 1.703 442
Component Mole Flow, kmol/hr
CO2 7 - 4
H2O 140,000 140,000 139,000
N2 - - -
O2 - - -
HCL - - -
H3O+ - - -
HCO3- 227 86 1,224
CL- - - -
CO3-- 7 25 72
MEA 2,900 2,400 170
MEA+ 2,500 2,800 3,300
MEACOO- 3,500 3,700 5,400
MDEA 2,800 3,200 1,300
AMP 730 640 86
AMP+ 490 580 1,100
MDEA+ 810 420 2,400
Component Mass Flow, kg/hr
CO2 360 4 160
H2O 2,514,000 2,516,000 2,499,000
N2 - - 14
O2 - - 4
HCL - - -
H3O+ - - -
HCO3- 14,000 5,300 75,000
CL- - - -
CO3-- 380 1,400 4,400
MEA 176,000 149,000 11,000
MEA+ 154,000 174,000 204,000
MEACOO- 368,000 382,000 565,000
MDEA 339,000 384,000 152,000
AMP 65,000 57,000 7,600
AMP+ 44,000 53,000 102,000
MDEA+ 97,000 51,000 285,000
Total Flow, kmol/hr 154,000 154,000 154,000
Total Flow, kg/hr 3,771,000 3,771,000 3,905,000
Total Flow, cum/hr 4,000 3,900 3,900
Vapor Fraction 0 0 0
Liquid Fraction 1 1 1
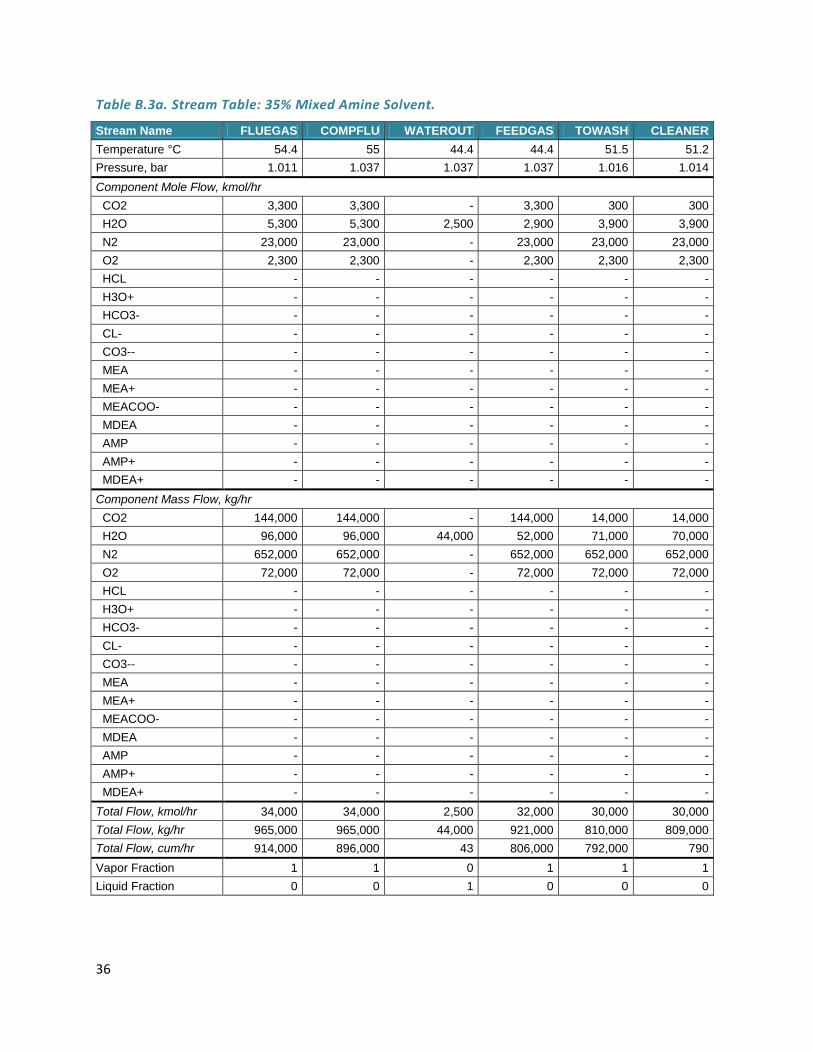
36
Table B.3a. Stream Table: 35% Mixed Amine Solvent.
Stream Name FLUEGAS COMPFLU WATEROUT FEEDGAS TOWASH CLEANER
Temperature °C 54.4 55 44.4 44.4 51.5 51.2
Pressure, bar 1.011 1.037 1.037 1.037 1.016 1.014
Component Mole Flow, kmol/hr
CO2 3,300 3,300 - 3,300 300 300
H2O 5,300 5,300 2,500 2,900 3,900 3,900
N2 23,000 23,000 - 23,000 23,000 23,000
O2 2,300 2,300 - 2,300 2,300 2,300
HCL - - - - - -
H3O+ - - - - - -
HCO3- - - - - - -
CL- - - - - - -
CO3-- - - - - - -
MEA - - - - - -
MEA+ - - - - - -
MEACOO- - - - - - -
MDEA - - - - - -
AMP - - - - - -
AMP+ - - - - - -
MDEA+ - - - - - -
Component Mass Flow, kg/hr
CO2 144,000 144,000 - 144,000 14,000 14,000
H2O 96,000 96,000 44,000 52,000 71,000 70,000
N2 652,000 652,000 - 652,000 652,000 652,000
O2 72,000 72,000 - 72,000 72,000 72,000
HCL - - - - - -
H3O+ - - - - - -
HCO3- - - - - - -
CL- - - - - - -
CO3-- - - - - - -
MEA - - - - - -
MEA+ - - - - - -
MEACOO- - - - - - -
MDEA - - - - - -
AMP - - - - - -
AMP+ - - - - - -
MDEA+ - - - - - -
Total Flow, kmol/hr 34,000 34,000 2,500 32,000 30,000 30,000
Total Flow, kg/hr 965,000 965,000 44,000 921,000 810,000 809,000
Total Flow, cum/hr 914,000 896,000 43 806,000 792,000 790
Vapor Fraction 1 1 0 1 1 1
Liquid Fraction 0 0 1 0 0 0
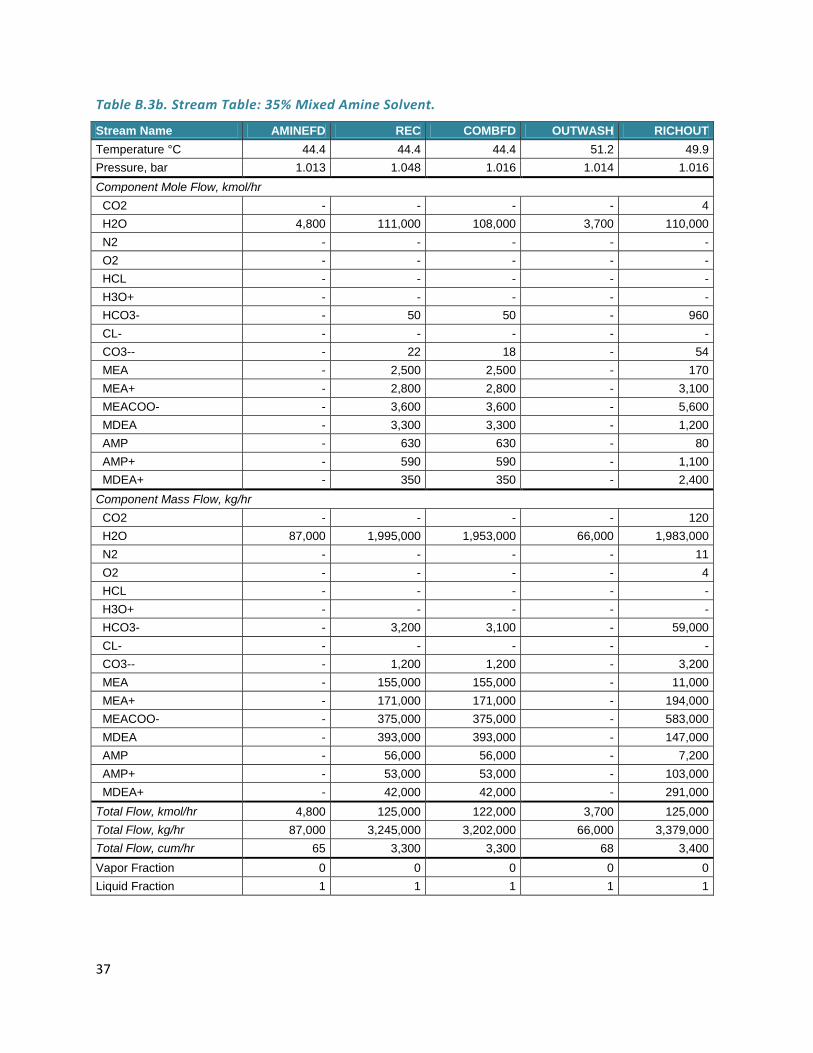
37
Table B.3b. Stream Table: 35% Mixed Amine Solvent.
Stream Name AMINEFD REC COMBFD OUTWASH RICHOUT
Temperature °C 44.4 44.4 44.4 51.2 49.9
Pressure, bar 1.013 1.048 1.016 1.014 1.016
Component Mole Flow, kmol/hr
CO2 - - - - 4
H2O 4,800 111,000 108,000 3,700 110,000
N2 - - - - -
O2 - - - - -
HCL - - - - -
H3O+ - - - - -
HCO3- - 50 50 - 960
CL- - - - - -
CO3-- - 22 18 - 54
MEA - 2,500 2,500 - 170
MEA+ - 2,800 2,800 - 3,100
MEACOO- - 3,600 3,600 - 5,600
MDEA - 3,300 3,300 - 1,200
AMP - 630 630 - 80
AMP+ - 590 590 - 1,100
MDEA+ - 350 350 - 2,400
Component Mass Flow, kg/hr
CO2 - - - - 120
H2O 87,000 1,995,000 1,953,000 66,000 1,983,000
N2 - - - - 11
O2 - - - - 4
HCL - - - - -
H3O+ - - - - -
HCO3- - 3,200 3,100 - 59,000
CL- - - - - -
CO3-- - 1,200 1,200 - 3,200
MEA - 155,000 155,000 - 11,000
MEA+ - 171,000 171,000 - 194,000
MEACOO- - 375,000 375,000 - 583,000
MDEA - 393,000 393,000 - 147,000
AMP - 56,000 56,000 - 7,200
AMP+ - 53,000 53,000 - 103,000
MDEA+ - 42,000 42,000 - 291,000
Total Flow, kmol/hr 4,800 125,000 122,000 3,700 125,000
Total Flow, kg/hr 87,000 3,245,000 3,202,000 66,000 3,379,000
Total Flow, cum/hr 65 3,300 3,300 68 3,400
Vapor Fraction 0 0 0 0 0
Liquid Fraction 1 1 1 1 1
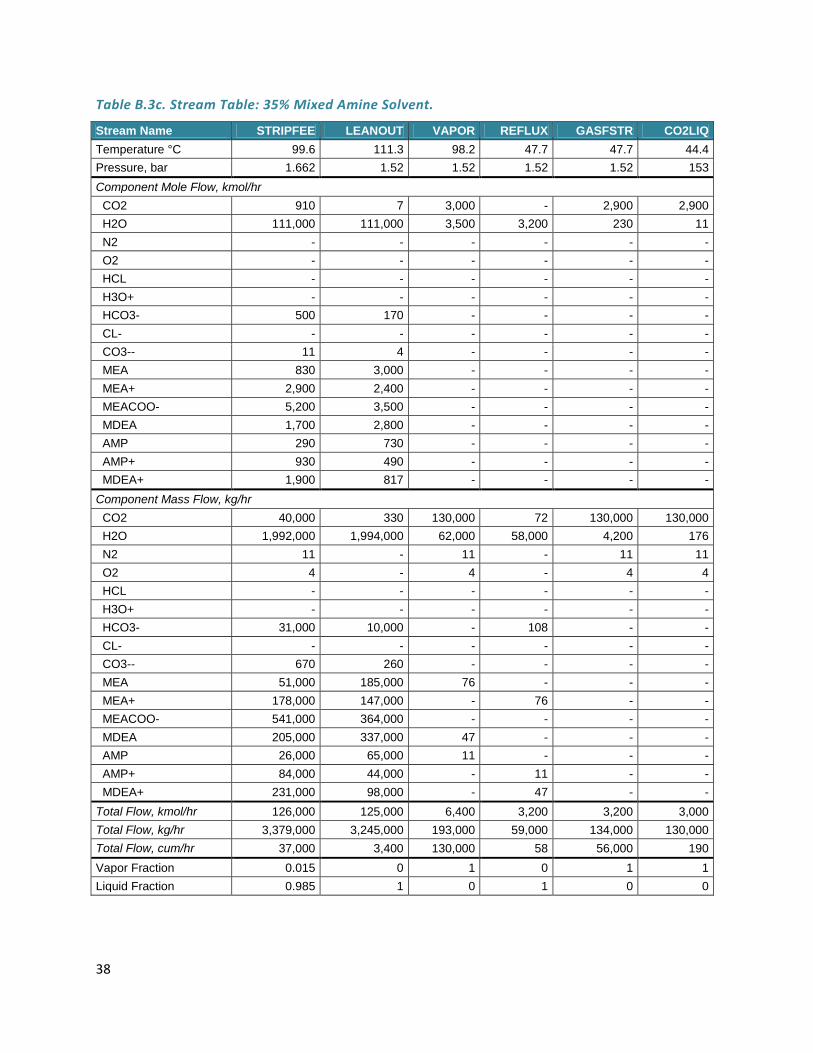
38
Table B.3c. Stream Table: 35% Mixed Amine Solvent.
Stream Name STRIPFEE LEANOUT VAPOR REFLUX GASFSTR CO2LIQ
Temperature °C 99.6 111.3 98.2 47.7 47.7 44.4
Pressure, bar 1.662 1.52 1.52 1.52 1.52 153
Component Mole Flow, kmol/hr
CO2 910 7 3,000 - 2,900 2,900
H2O 111,000 111,000 3,500 3,200 230 11
N2 - - - - - -
O2 - - - - - -
HCL - - - - - -
H3O+ - - - - - -
HCO3- 500 170 - - - -
CL- - - - - - -
CO3-- 11 4 - - - -
MEA 830 3,000 - - - -
MEA+ 2,900 2,400 - - - -
MEACOO- 5,200 3,500 - - - -
MDEA 1,700 2,800 - - - -
AMP 290 730 - - - -
AMP+ 930 490 - - - -
MDEA+ 1,900 817 - - - -
Component Mass Flow, kg/hr
CO2 40,000 330 130,000 72 130,000 130,000
H2O 1,992,000 1,994,000 62,000 58,000 4,200 176
N2 11 - 11 - 11 11
O2 4 - 4 - 4 4
HCL - - - - - -
H3O+ - - - - - -
HCO3- 31,000 10,000 - 108 - -
CL- - - - - - -
CO3-- 670 260 - - - -
MEA 51,000 185,000 76 - - -
MEA+ 178,000 147,000 - 76 - -
MEACOO- 541,000 364,000 - - - -
MDEA 205,000 337,000 47 - - -
AMP 26,000 65,000 11 - - -
AMP+ 84,000 44,000 - 11 - -
MDEA+ 231,000 98,000 - 47 - -
Total Flow, kmol/hr 126,000 125,000 6,400 3,200 3,200 3,000
Total Flow, kg/hr 3,379,000 3,245,000 193,000 59,000 134,000 130,000
Total Flow, cum/hr 37,000 3,400 130,000 58 56,000 190
Vapor Fraction 0.015 0 1 0 1 1
Liquid Fraction 0.985 1 0 1 0 0
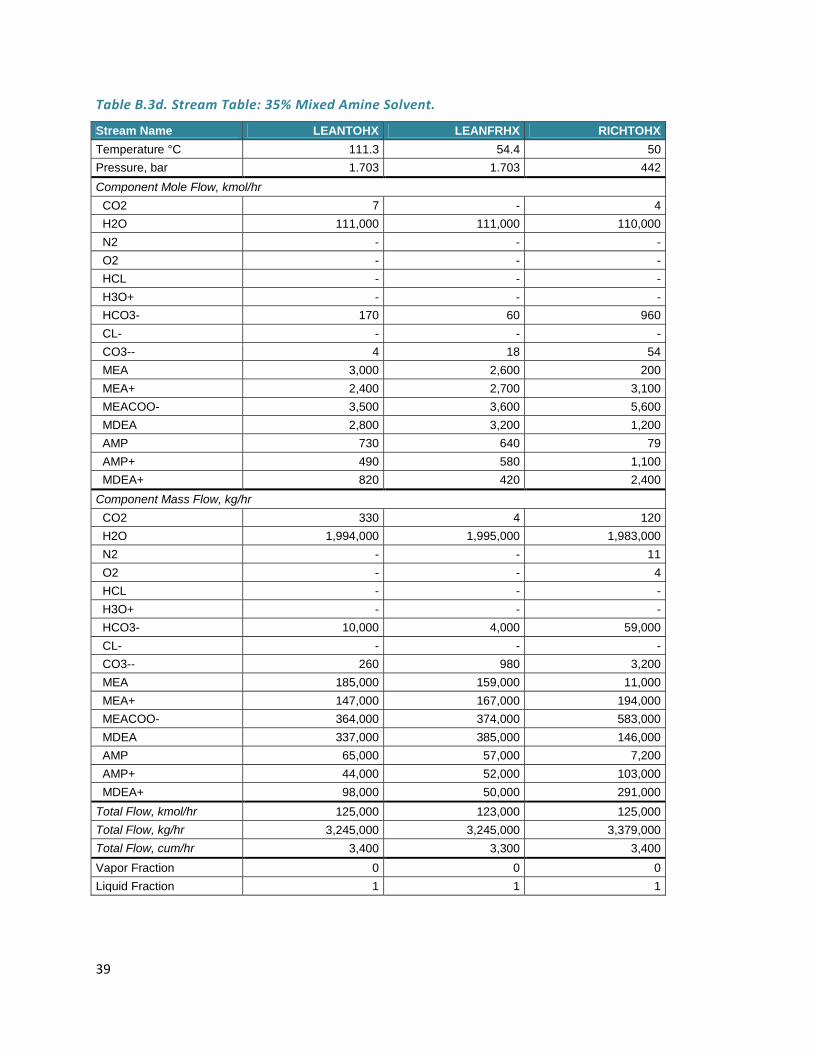
39
Table B.3d. Stream Table: 35% Mixed Amine Solvent.
Stream Name LEANTOHX LEANFRHX RICHTOHX
Temperature °C 111.3 54.4 50
Pressure, bar 1.703 1.703 442
Component Mole Flow, kmol/hr
CO2 7 - 4
H2O 111,000 111,000 110,000
N2 - - -
O2 - - -
HCL - - -
H3O+ - - -
HCO3- 170 60 960
CL- - - -
CO3-- 4 18 54
MEA 3,000 2,600 200
MEA+ 2,400 2,700 3,100
MEACOO- 3,500 3,600 5,600
MDEA 2,800 3,200 1,200
AMP 730 640 79
AMP+ 490 580 1,100
MDEA+ 820 420 2,400
Component Mass Flow, kg/hr
CO2 330 4 120
H2O 1,994,000 1,995,000 1,983,000
N2 - - 11
O2 - - 4
HCL - - -
H3O+ - - -
HCO3- 10,000 4,000 59,000
CL- - - -
CO3-- 260 980 3,200
MEA 185,000 159,000 11,000
MEA+ 147,000 167,000 194,000
MEACOO- 364,000 374,000 583,000
MDEA 337,000 385,000 146,000
AMP 65,000 57,000 7,200
AMP+ 44,000 52,000 103,000
MDEA+ 98,000 50,000 291,000
Total Flow, kmol/hr 125,000 123,000 125,000
Total Flow, kg/hr 3,245,000 3,245,000 3,379,000
Total Flow, cum/hr 3,400 3,300 3,400
Vapor Fraction 0 0 0
Liquid Fraction 1 1 1
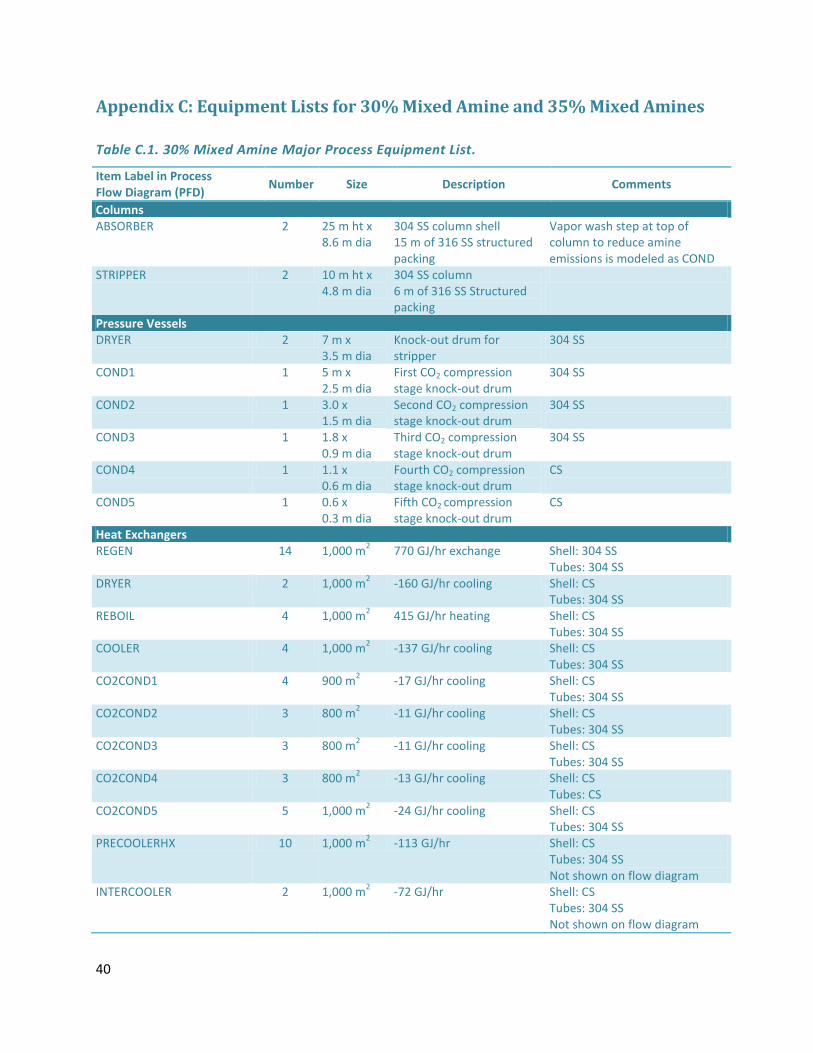
40
Appendix C: Equipment Lists for 30% Mixed Amine and 35% Mixed Amines
Table C.1. 30% Mixed Amine Major Process Equipment List.
Item Label in Process Flow Diagram (PFD)
Number Size Description Comments
Columns ABSORBER 2 25 m ht x
8.6 m dia 304 SS column shell 15 m of 316 SS structured packing
Vapor wash step at top of column to reduce amine emissions is modeled as COND
STRIPPER 2 10 m ht x 4.8 m dia
304 SS column 6 m of 316 SS Structured packing
Pressure Vessels DRYER 2 7 m x
3.5 m dia Knock-out drum for stripper
304 SS
COND1 1 5 m x 2.5 m dia
First CO2 compression stage knock-out drum
304 SS
COND2 1 3.0 x 1.5 m dia
Second CO2 compression stage knock-out drum
304 SS
COND3 1 1.8 x 0.9 m dia
Third CO2 compression stage knock-out drum
304 SS
COND4 1 1.1 x 0.6 m dia
Fourth CO2 compression stage knock-out drum
CS
COND5 1 0.6 x 0.3 m dia
Fifth CO2 compression stage knock-out drum
CS
Heat Exchangers REGEN 14 1,000 m
2 770 GJ/hr exchange Shell: 304 SS
Tubes: 304 SS DRYER 2 1,000 m
2 -160 GJ/hr cooling Shell: CS
Tubes: 304 SS REBOIL 4 1,000 m
2 415 GJ/hr heating Shell: CS
Tubes: 304 SS COOLER 4 1,000 m
2 -137 GJ/hr cooling Shell: CS
Tubes: 304 SS CO2COND1 4 900 m
2 -17 GJ/hr cooling Shell: CS
Tubes: 304 SS CO2COND2 3 800 m
2 -11 GJ/hr cooling Shell: CS
Tubes: 304 SS CO2COND3 3 800 m
2 -11 GJ/hr cooling Shell: CS
Tubes: 304 SS CO2COND4 3 800 m
2 -13 GJ/hr cooling Shell: CS
Tubes: CS CO2COND5 5 1,000 m
2 -24 GJ/hr cooling Shell: CS
Tubes: 304 SS PRECOOLERHX 10 1,000 m
2 -113 GJ/hr Shell: CS
Tubes: 304 SS Not shown on flow diagram
INTERCOOLER 2 1,000 m2 -72 GJ/hr Shell: CS
Tubes: 304 SS Not shown on flow diagram
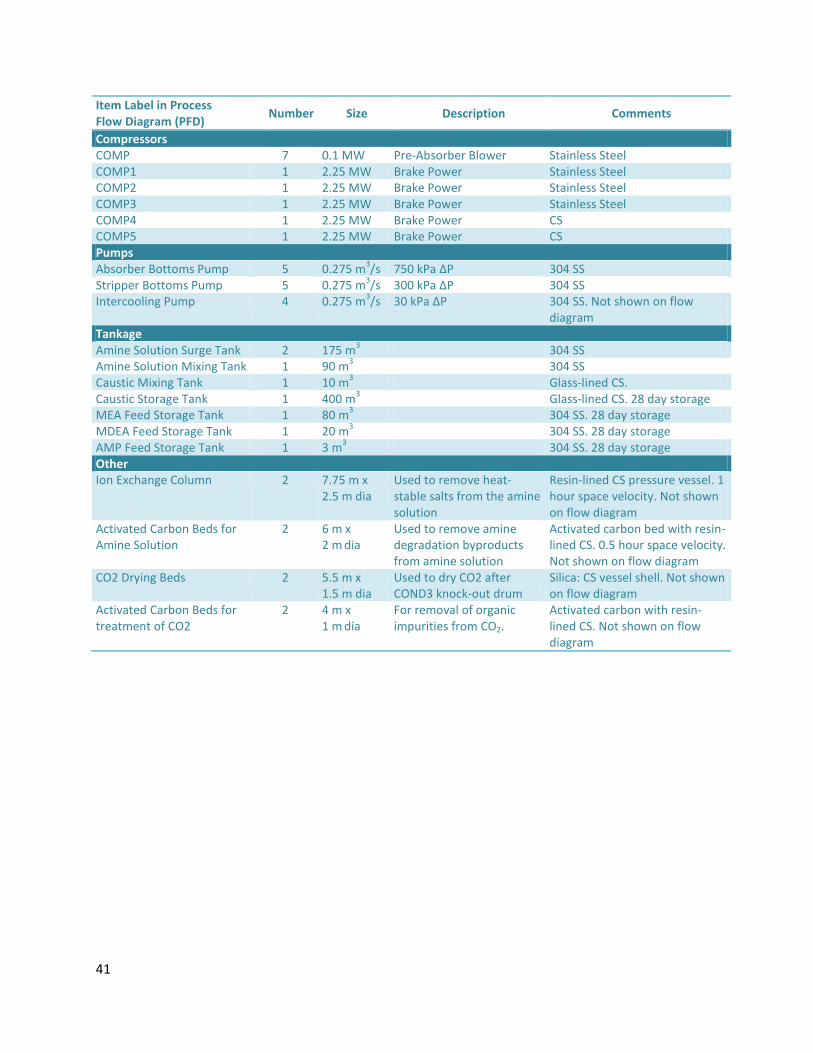
41
Item Label in Process Flow Diagram (PFD)
Number Size Description Comments
Compressors COMP 7 0.1 MW Pre-Absorber Blower Stainless Steel COMP1 1 2.25 MW Brake Power Stainless Steel COMP2 1 2.25 MW Brake Power Stainless Steel COMP3 1 2.25 MW Brake Power Stainless Steel COMP4 1 2.25 MW Brake Power CS COMP5 1 2.25 MW Brake Power CS Pumps Absorber Bottoms Pump 5 0.275 m
3/s 750 kPa ΔP 304 SS
Stripper Bottoms Pump 5 0.275 m3/s 300 kPa ΔP 304 SS
Intercooling Pump 4 0.275 m3/s 30 kPa ΔP 304 SS. Not shown on flow
diagram Tankage Amine Solution Surge Tank 2 175 m
3 304 SS
Amine Solution Mixing Tank 1 90 m3 304 SS
Caustic Mixing Tank 1 10 m3 Glass-lined CS.
Caustic Storage Tank 1 400 m3 Glass-lined CS. 28 day storage
MEA Feed Storage Tank 1 80 m3 304 SS. 28 day storage
MDEA Feed Storage Tank 1 20 m3 304 SS. 28 day storage
AMP Feed Storage Tank 1 3 m3 304 SS. 28 day storage
Other Ion Exchange Column 2 7.75 m x
2.5 m dia Used to remove heat-stable salts from the amine solution
Resin-lined CS pressure vessel. 1 hour space velocity. Not shown on flow diagram
Activated Carbon Beds for Amine Solution
2 6 m x 2 m
dia
Used to remove amine degradation byproducts from amine solution
Activated carbon bed with resin-lined CS. 0.5 hour space velocity. Not shown on flow diagram
CO2 Drying Beds 2 5.5 m x 1.5 m dia
Used to dry CO2 after COND3 knock-out drum
Silica: CS vessel shell. Not shown on flow diagram
Activated Carbon Beds for treatment of CO2
2 4 m x 1 m
dia
For removal of organic impurities from CO2.
Activated carbon with resin-lined CS. Not shown on flow diagram

42
Table C.2. 35% Mixed Amine Major Process Equipment List.
Item Label in Process Flow Diagram (PFD)
Number Size Description Comments
Columns ABSORBER 2 25 m ht x 8.5
m dia
304 SS column shell 15 m of 316 SS structured packing
Vapor wash step at top of column to reduce amine emissions is modeled as COND
STRIPPER 2 10 m ht x 4.8 m dia
304 SS column 6 m of 316 SS Structured packing
Pressure Vessels DRYER 2 6.75 m x
3.5 m dia Knock-out drum for stripper
304 SS
COND1 1 5 m x 2.5 m dia
First CO2 compression stage knock-out drum
304 SS
COND2 1 3.0 x 1.5 m dia
Second CO2 compression stage knock-out drum
304 SS
COND3 1 1.8 x 0.9 m dia
Third CO2 compression stage knock-out drum
304 SS
COND4 1 1.1 x 0.6 m dia
Fourth CO2 compression stage knock-out drum
CS
COND5 1 0.6 x 0.3 m dia
Fifth CO2 compression stage knock-out drum
CS
Heat Exchangers REGEN 13 1,000 m
2 650 GJ/hr exchange Shell: 304 SS
Tubes: 304 SS DRYER 2 900 m
2 -150 GJ/hr cooling Shell: CS
Tubes: 304 SS REBOIL 4 1,000 m
2 392 GJ/hr heating Shell: CS
Tubes: 304 SS COOLER 4 1,000 m
2 -115 GJ/hr cooling Shell: CS
Tubes: 304 SS CO2COND1 4 900 m
2 -17 GJ/hr cooling Shell: CS
Tubes: 304 SS CO2COND2 3 800 m
2 -11 GJ/hr cooling Shell: CS
Tubes: 304 SS CO2COND3 3 800 m
2 -11 GJ/hr cooling Shell: CS
Tubes: 304 SS CO2COND4 3 800 m
2 -13 GJ/hr cooling Shell: CS
Tubes: CS CO2COND5 5 1,000 m
2 -24 GJ/hr cooling Shell: CS
Tubes: 304 SS PRECOOLERHX 10 1,000 m
2 -113 GJ/hr Shell: CS
Tubes: 304 SS Not shown on flow diagram
INTERCOOLER 2 1,000 m2 -72 GJ/hr Shell: CS
Tubes: 304 SS Not shown on flow diagram

43
Item Label in Process Flow Diagram (PFD)
Number Size Description Comments
Compressors COMP 7 0.1 MW Pre-Absorber Blower Stainless Steel COMP1 1 2.25 MW Brake Power Stainless Steel COMP2 1 2.25 MW Brake Power Stainless Steel COMP3 1 2.25 MW Brake Power Stainless Steel COMP4 1 2.25 MW Brake Power CS COMP5 1 2.25 MW Brake Power CS Pumps Absorber Bottoms Pump 5 0.245 m
3/s 750 kPa ΔP 304 SS
Stripper Bottoms Pump 5 0.245 m3/s 300 kPa ΔP 304 SS
Intercooling Pump 4 0.245 m3/s
30 kPa ΔP 304 SS. Not shown on flow
diagram Tankage Amine Solution Surge Tank 2 140 m
3 304 SS
Amine Solution Mixing Tank
1 65 m3 304 SS
Caustic Mixing Tank 1 10 m3 Glass-lined CS.
Caustic Storage Tank 1 400 m3 Glass-lined CS. 28 day storage
MEA Feed Storage Tank 1 80 m3 304 SS. 28 day storage
MDEA Feed Storage Tank 20 m3 304 SS. 28 day storage
AMP Feed Storage Tank 3 m3 304 SS. 28 day storage
Other Ion Exchange Column 2 7.2 m x 2.4 m
dia Used to remove heat-stable salts from the amine solution
Resin-lined CS pressure vessel. 1 hour space velocity. Not shown on flow diagram
Activated Carbon Beds for Amine Solution
2 5.75 m x 2 m
dia
Used to remove amine degradation byproducts from amine solution
Activated carbon bed with resin-lined CS. 0.5 hour space velocity. Not shown on flow diagram
CO2 Drying Beds 2 5.5 m x 1.5 m dia
Used to dry CO2 after COND3 knock-out drum
Silica: CS vessel shell. Not shown on flow diagram
Activated Carbon Beds for treatment of CO2
2 4 m x 1 m
dia
For removal of organic impurities from CO2.
Activated carbon with resin-lined CS. Not shown on flow diagram
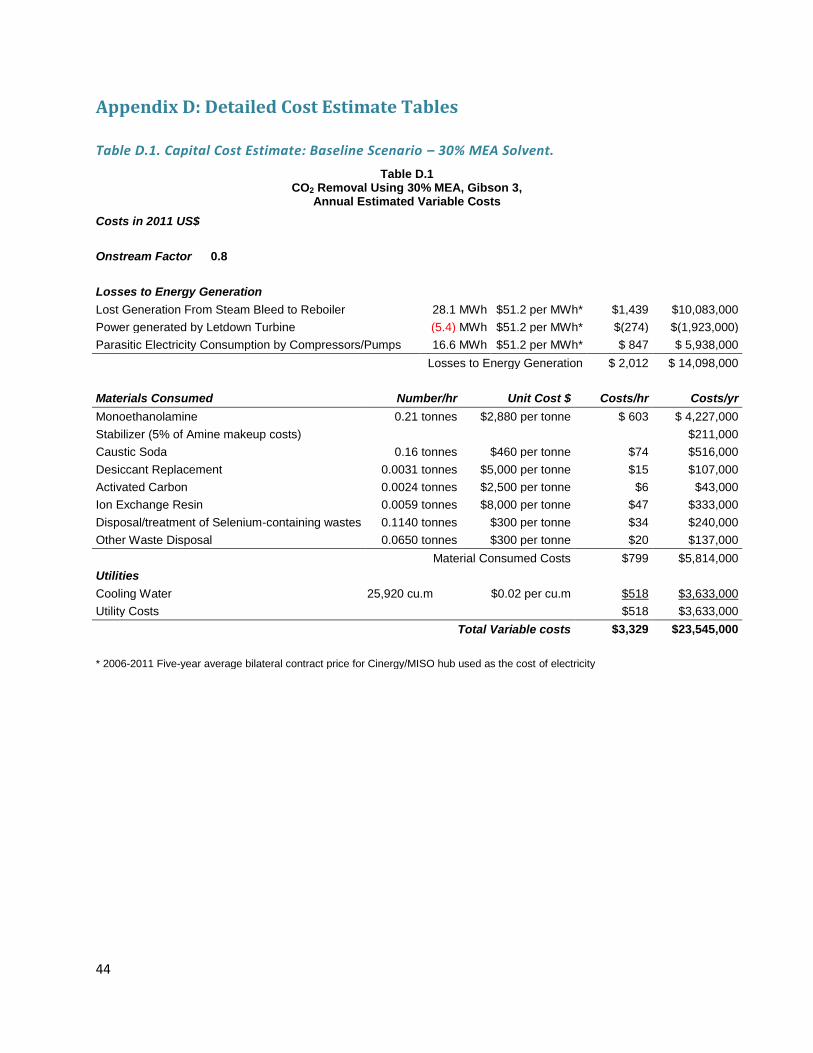
44
Appendix D: Detailed Cost Estimate Tables
Table D.1. Capital Cost Estimate: Baseline Scenario – 30% MEA Solvent.
Table D.1 CO2 Removal Using 30% MEA, Gibson 3,
Annual Estimated Variable Costs
Costs in 2011 US$
Onstream Factor 0.8
Losses to Energy Generation
Lost Generation From Steam Bleed to Reboiler 28.1 MWh $51.2 per MWh* $1,439 $10,083,000
Power generated by Letdown Turbine (5.4) MWh $51.2 per MWh* $(274) $(1,923,000)
Parasitic Electricity Consumption by Compressors/Pumps 16.6 MWh $51.2 per MWh* $ 847 $ 5,938,000
Losses to Energy Generation $ 2,012 $ 14,098,000
Materials Consumed Number/hr Unit Cost $ Costs/hr Costs/yr
Monoethanolamine 0.21 tonnes $2,880 per tonne $ 603 $ 4,227,000
Stabilizer (5% of Amine makeup costs) $211,000
Caustic Soda 0.16 tonnes $460 per tonne $74 $516,000
Desiccant Replacement 0.0031 tonnes $5,000 per tonne $15 $107,000
Activated Carbon 0.0024 tonnes $2,500 per tonne $6 $43,000
Ion Exchange Resin 0.0059 tonnes $8,000 per tonne $47 $333,000
Disposal/treatment of Selenium-containing wastes 0.1140 tonnes $300 per tonne $34 $240,000
Other Waste Disposal 0.0650 tonnes $300 per tonne $20 $137,000
Material Consumed Costs $799 $5,814,000
Utilities
Cooling Water 25,920 cu.m $0.02 per cu.m $518 $3,633,000
Utility Costs $518 $3,633,000
Total Variable costs $3,329 $23,545,000
* 2006-2011 Five-year average bilateral contract price for Cinergy/MISO hub used as the cost of electricity
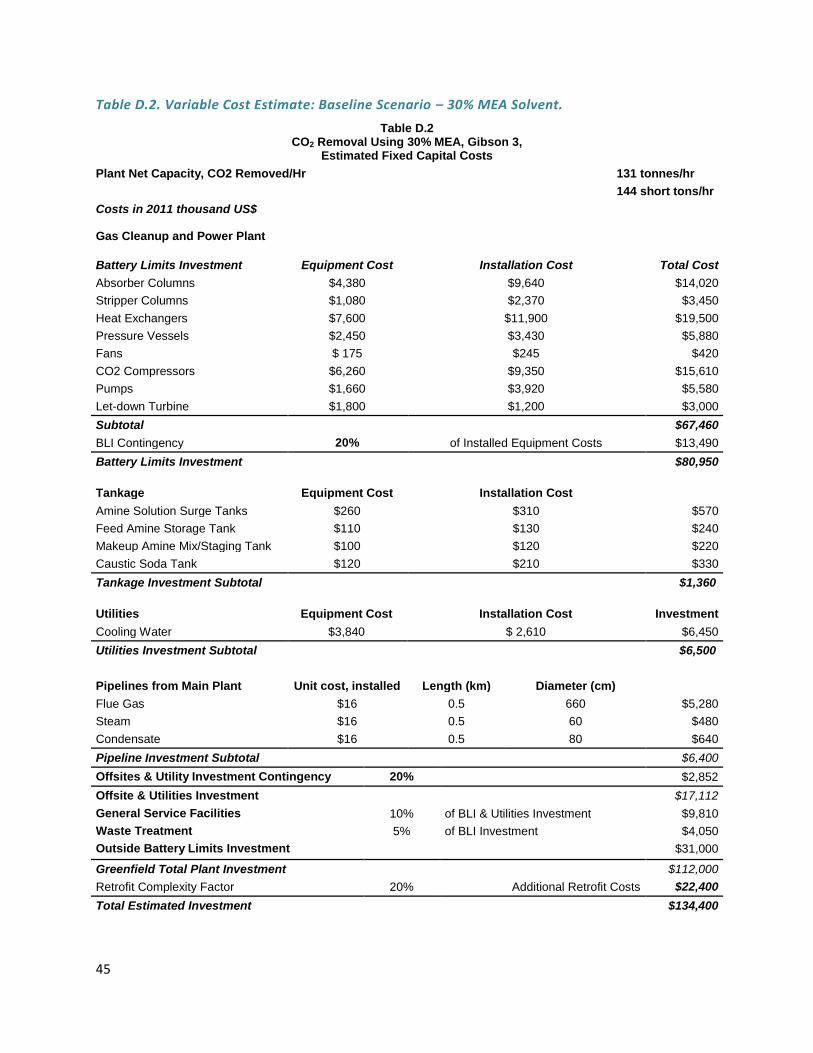
45
Table D.2. Variable Cost Estimate: Baseline Scenario – 30% MEA Solvent.
Table D.2 CO2 Removal Using 30% MEA, Gibson 3,
Estimated Fixed Capital Costs
Plant Net Capacity, CO2 Removed/Hr 131 tonnes/hr
144 short tons/hr
Costs in 2011 thousand US$
Gas Cleanup and Power Plant
Battery Limits Investment Equipment Cost Installation Cost Total Cost
Absorber Columns $4,380 $9,640 $14,020
Stripper Columns $1,080 $2,370 $3,450
Heat Exchangers $7,600 $11,900 $19,500
Pressure Vessels $2,450 $3,430 $5,880
Fans $ 175 $245 $420
CO2 Compressors $6,260 $9,350 $15,610
Pumps $1,660 $3,920 $5,580
Let-down Turbine $1,800 $1,200 $3,000
Subtotal $67,460
BLI Contingency 20% of Installed Equipment Costs $13,490
Battery Limits Investment $80,950
Tankage Equipment Cost Installation Cost
Amine Solution Surge Tanks $260 $310 $570
Feed Amine Storage Tank $110 $130 $240
Makeup Amine Mix/Staging Tank $100 $120 $220
Caustic Soda Tank $120 $210 $330
Tankage Investment Subtotal $1,360
Utilities Equipment Cost Installation Cost Investment
Cooling Water $3,840 $ 2,610 $6,450
Utilities Investment Subtotal $6,500
Pipelines from Main Plant Unit cost, installed Length (km) Diameter (cm)
Flue Gas $16 0.5 660 $5,280
Steam $16 0.5 60 $480
Condensate $16 0.5 80 $640
Pipeline Investment Subtotal $6,400
Offsites & Utility Investment Contingency 20% $2,852
Offsite & Utilities Investment $17,112
General Service Facilities 10% of BLI & Utilities Investment $9,810
Waste Treatment 5% of BLI Investment $4,050
Outside Battery Limits Investment $31,000
Greenfield Total Plant Investment $112,000
Retrofit Complexity Factor 20% Additional Retrofit Costs $22,400
Total Estimated Investment $134,400
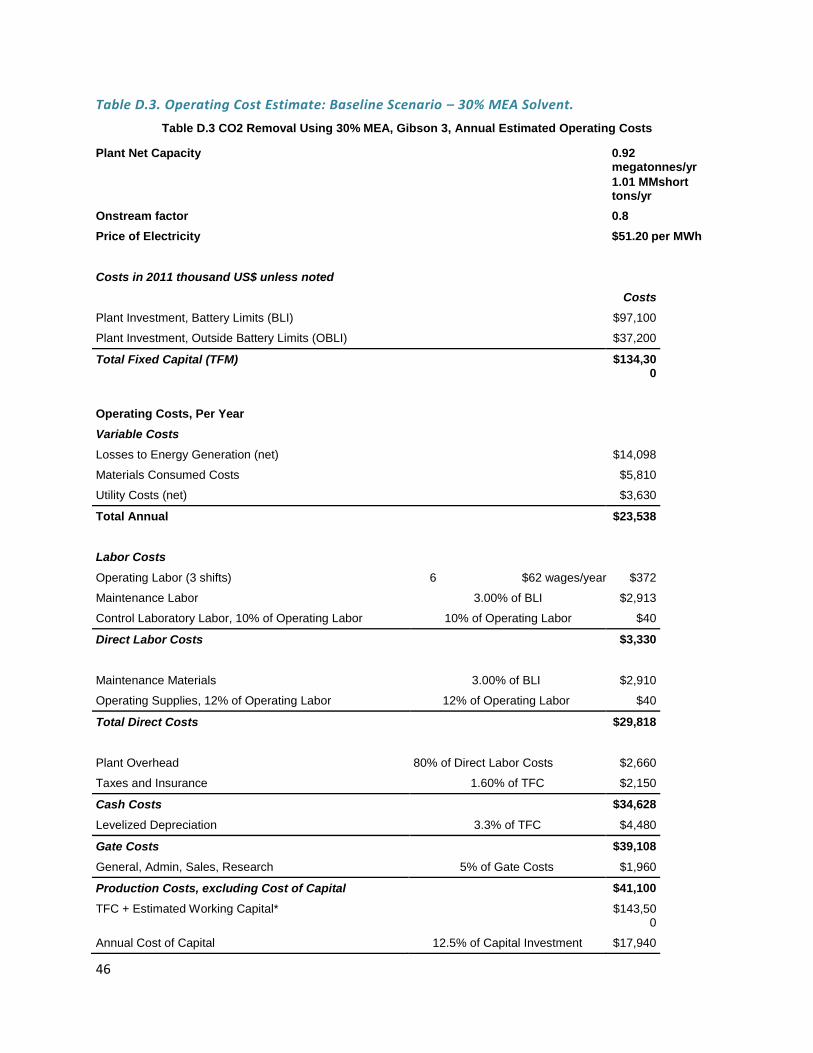
46
Table D.3. Operating Cost Estimate: Baseline Scenario – 30% MEA Solvent.
Table D.3 CO2 Removal Using 30% MEA, Gibson 3, Annual Estimated Operating Costs
Plant Net Capacity 0.92 megatonnes/yr
1.01 MMshort tons/yr
Onstream factor 0.8
Price of Electricity $51.20 per MWh
Costs in 2011 thousand US$ unless noted
Costs
Plant Investment, Battery Limits (BLI) $97,100
Plant Investment, Outside Battery Limits (OBLI) $37,200
Total Fixed Capital (TFM) $134,300
Operating Costs, Per Year
Variable Costs
Losses to Energy Generation (net) $14,098
Materials Consumed Costs $5,810
Utility Costs (net) $3,630
Total Annual $23,538
Labor Costs
Operating Labor (3 shifts) 6 $62 wages/year $372
Maintenance Labor 3.00% of BLI $2,913
Control Laboratory Labor, 10% of Operating Labor 10% of Operating Labor $40
Direct Labor Costs $3,330
Maintenance Materials 3.00% of BLI $2,910
Operating Supplies, 12% of Operating Labor 12% of Operating Labor $40
Total Direct Costs $29,818
Plant Overhead 80% of Direct Labor Costs $2,660
Taxes and Insurance 1.60% of TFC $2,150
Cash Costs $34,628
Levelized Depreciation 3.3% of TFC $4,480
Gate Costs $39,108
General, Admin, Sales, Research 5% of Gate Costs $1,960
Production Costs, excluding Cost of Capital $41,100
TFC + Estimated Working Capital* $143,500
Annual Cost of Capital 12.5% of Capital Investment $17,940
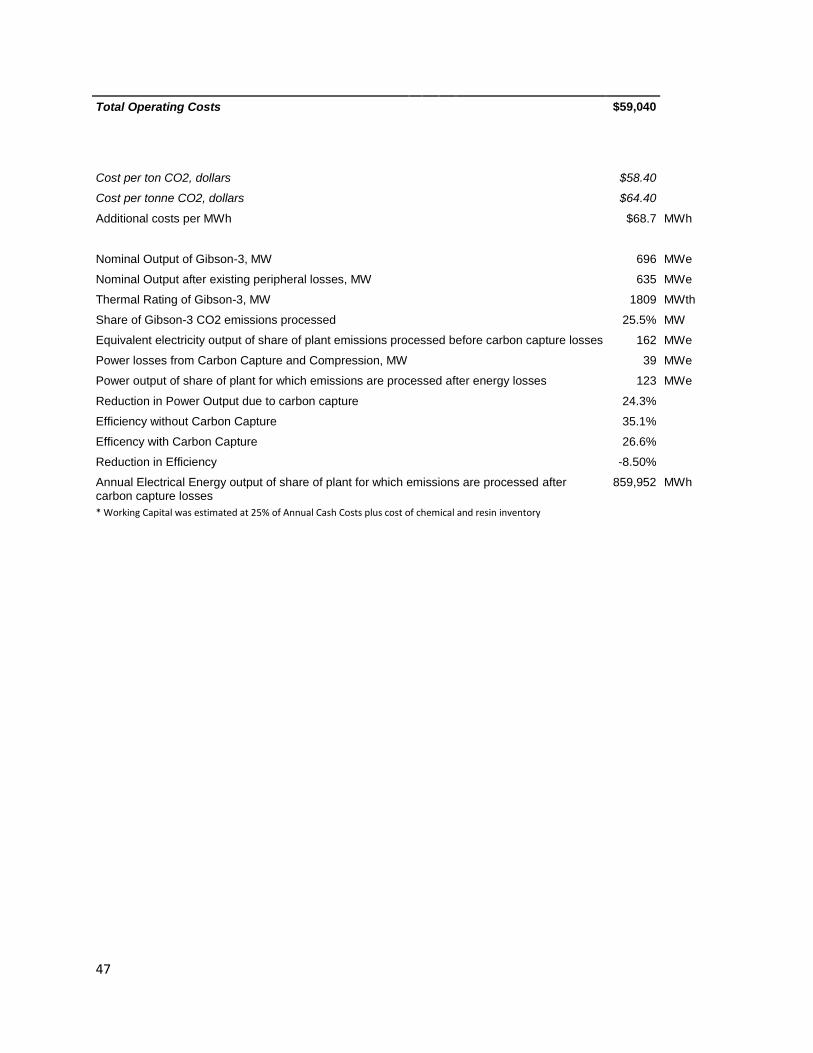
47
Total Operating Costs $59,040
Cost per ton CO2, dollars $58.40
Cost per tonne CO2, dollars $64.40
Additional costs per MWh $68.7 MWh
Nominal Output of Gibson-3, MW 696 MWe
Nominal Output after existing peripheral losses, MW 635 MWe
Thermal Rating of Gibson-3, MW 1809 MWth
Share of Gibson-3 CO2 emissions processed 25.5% MW
Equivalent electricity output of share of plant emissions processed before carbon capture losses 162 MWe
Power losses from Carbon Capture and Compression, MW 39 MWe
Power output of share of plant for which emissions are processed after energy losses 123 MWe
Reduction in Power Output due to carbon capture 24.3%
Efficiency without Carbon Capture 35.1%
Efficency with Carbon Capture 26.6%
Reduction in Efficiency -8.50%
Annual Electrical Energy output of share of plant for which emissions are processed after carbon capture losses
859,952 MWh
* Working Capital was estimated at 25% of Annual Cash Costs plus cost of chemical and resin inventory
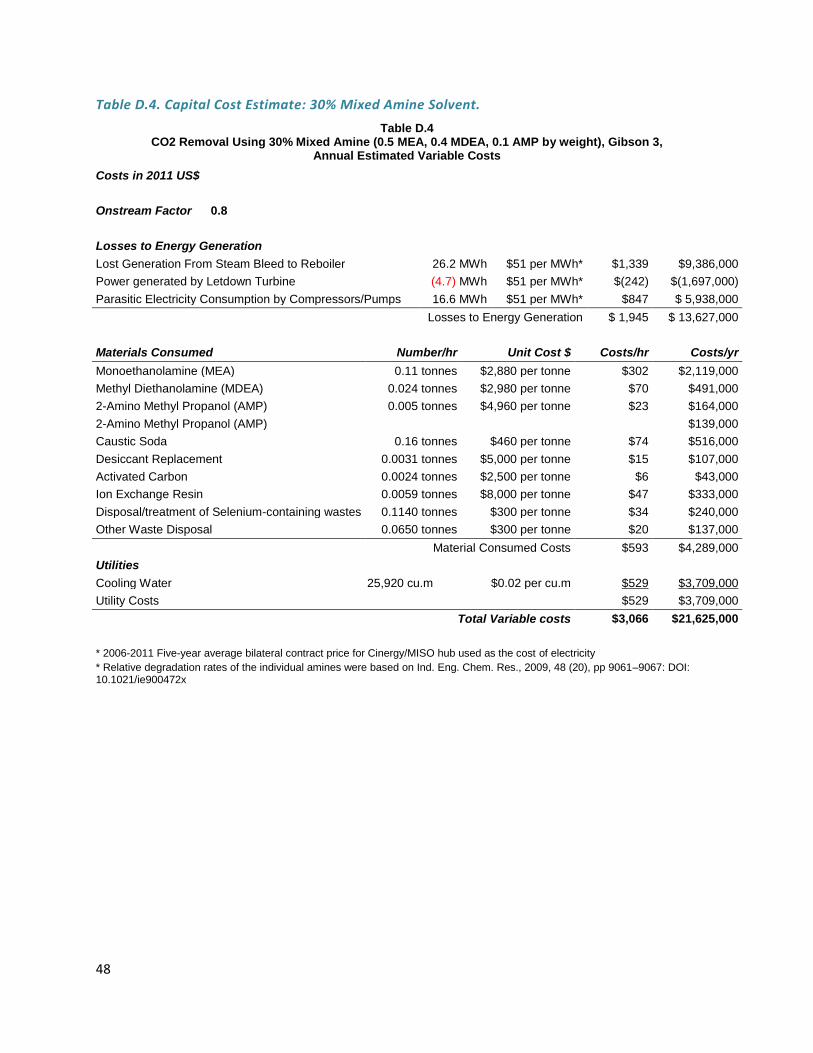
48
Table D.4. Capital Cost Estimate: 30% Mixed Amine Solvent.
Table D.4 CO2 Removal Using 30% Mixed Amine (0.5 MEA, 0.4 MDEA, 0.1 AMP by weight), Gibson 3,
Annual Estimated Variable Costs
Costs in 2011 US$
Onstream Factor 0.8
Losses to Energy Generation
Lost Generation From Steam Bleed to Reboiler 26.2 MWh $51 per MWh* $1,339 $9,386,000
Power generated by Letdown Turbine (4.7) MWh $51 per MWh* $(242) $(1,697,000)
Parasitic Electricity Consumption by Compressors/Pumps 16.6 MWh $51 per MWh* $847 $ 5,938,000
Losses to Energy Generation $ 1,945 $ 13,627,000
Materials Consumed Number/hr Unit Cost $ Costs/hr Costs/yr
Monoethanolamine (MEA) 0.11 tonnes $2,880 per tonne $302 $2,119,000
Methyl Diethanolamine (MDEA) 0.024 tonnes $2,980 per tonne $70 $491,000
2-Amino Methyl Propanol (AMP) 0.005 tonnes $4,960 per tonne $23 $164,000
2-Amino Methyl Propanol (AMP) $139,000
Caustic Soda 0.16 tonnes $460 per tonne $74 $516,000
Desiccant Replacement 0.0031 tonnes $5,000 per tonne $15 $107,000
Activated Carbon 0.0024 tonnes $2,500 per tonne $6 $43,000
Ion Exchange Resin 0.0059 tonnes $8,000 per tonne $47 $333,000
Disposal/treatment of Selenium-containing wastes 0.1140 tonnes $300 per tonne $34 $240,000
Other Waste Disposal 0.0650 tonnes $300 per tonne $20 $137,000
Material Consumed Costs $593 $4,289,000
Utilities
Cooling Water 25,920 cu.m $0.02 per cu.m $529 $3,709,000
Utility Costs $529 $3,709,000
Total Variable costs $3,066 $21,625,000
* 2006-2011 Five-year average bilateral contract price for Cinergy/MISO hub used as the cost of electricity
* Relative degradation rates of the individual amines were based on Ind. Eng. Chem. Res., 2009, 48 (20), pp 9061–9067: DOI: 10.1021/ie900472x
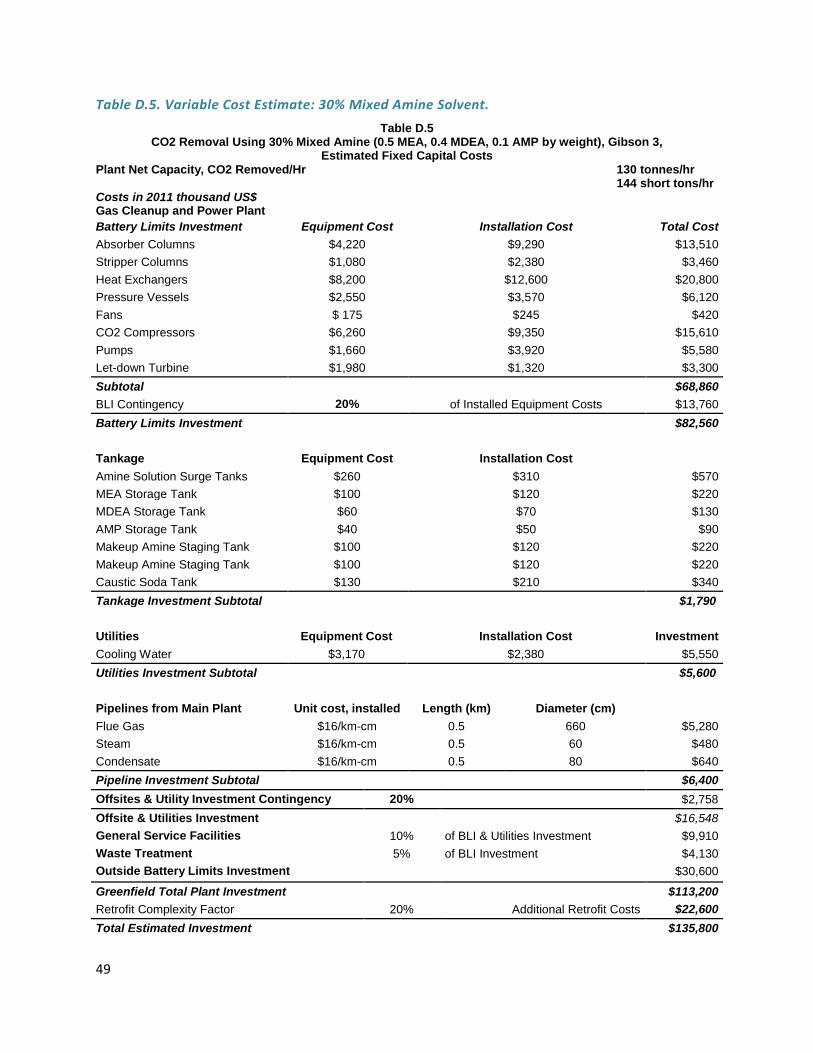
49
Table D.5. Variable Cost Estimate: 30% Mixed Amine Solvent.
Table D.5 CO2 Removal Using 30% Mixed Amine (0.5 MEA, 0.4 MDEA, 0.1 AMP by weight), Gibson 3,
Estimated Fixed Capital Costs Plant Net Capacity, CO2 Removed/Hr 130 tonnes/hr 144 short tons/hr Costs in 2011 thousand US$ Gas Cleanup and Power Plant
Battery Limits Investment Equipment Cost Installation Cost Total Cost
Absorber Columns $4,220 $9,290 $13,510
Stripper Columns $1,080 $2,380 $3,460
Heat Exchangers $8,200 $12,600 $20,800
Pressure Vessels $2,550 $3,570 $6,120
Fans $ 175 $245 $420
CO2 Compressors $6,260 $9,350 $15,610
Pumps $1,660 $3,920 $5,580
Let-down Turbine $1,980 $1,320 $3,300
Subtotal $68,860
BLI Contingency 20% of Installed Equipment Costs $13,760
Battery Limits Investment $82,560
Tankage Equipment Cost Installation Cost
Amine Solution Surge Tanks $260 $310 $570
MEA Storage Tank $100 $120 $220
MDEA Storage Tank $60 $70 $130
AMP Storage Tank $40 $50 $90
Makeup Amine Staging Tank $100 $120 $220
Makeup Amine Staging Tank $100 $120 $220
Caustic Soda Tank $130 $210 $340
Tankage Investment Subtotal $1,790
Utilities Equipment Cost Installation Cost Investment
Cooling Water $3,170 $2,380 $5,550
Utilities Investment Subtotal $5,600
Pipelines from Main Plant Unit cost, installed Length (km) Diameter (cm)
Flue Gas $16/km-cm 0.5 660 $5,280
Steam $16/km-cm 0.5 60 $480
Condensate $16/km-cm 0.5 80 $640
Pipeline Investment Subtotal $6,400
Offsites & Utility Investment Contingency 20% $2,758
Offsite & Utilities Investment $16,548
General Service Facilities 10% of BLI & Utilities Investment $9,910
Waste Treatment 5% of BLI Investment $4,130
Outside Battery Limits Investment $30,600
Greenfield Total Plant Investment $113,200
Retrofit Complexity Factor 20% Additional Retrofit Costs $22,600
Total Estimated Investment $135,800
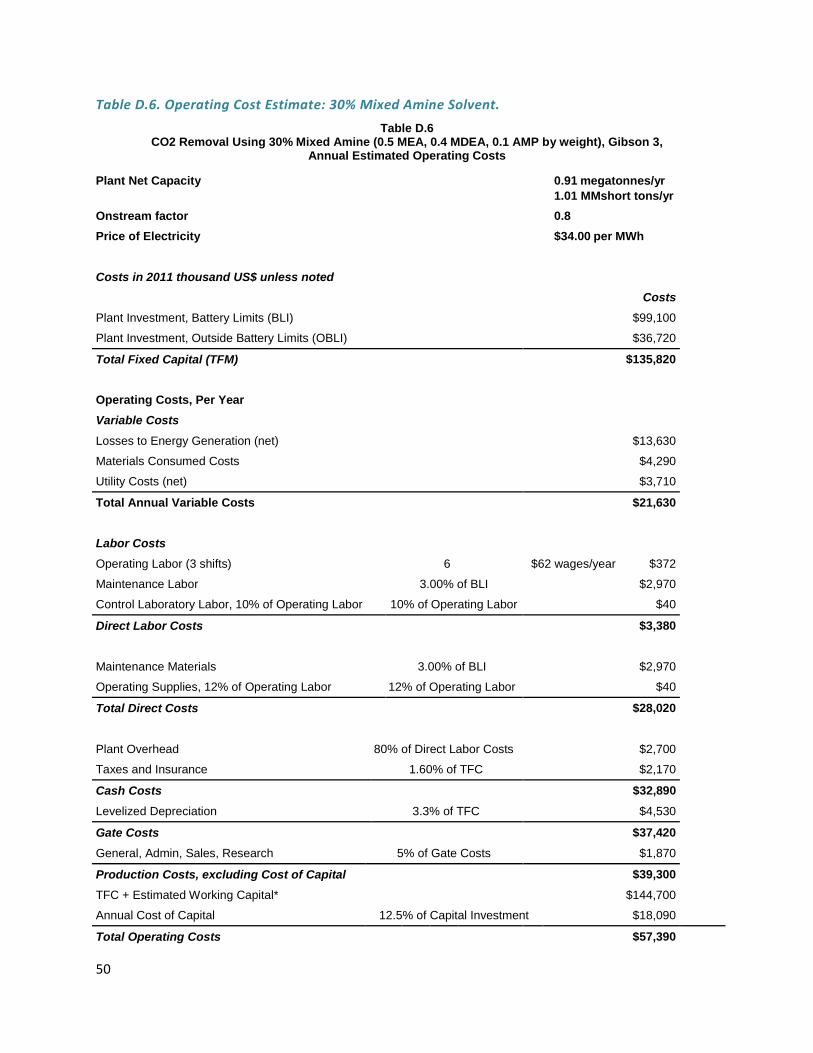
50
Table D.6. Operating Cost Estimate: 30% Mixed Amine Solvent.
Table D.6 CO2 Removal Using 30% Mixed Amine (0.5 MEA, 0.4 MDEA, 0.1 AMP by weight), Gibson 3,
Annual Estimated Operating Costs
Plant Net Capacity 0.91 megatonnes/yr
1.01 MMshort tons/yr
Onstream factor 0.8
Price of Electricity $34.00 per MWh
Costs in 2011 thousand US$ unless noted
Costs
Plant Investment, Battery Limits (BLI) $99,100
Plant Investment, Outside Battery Limits (OBLI) $36,720
Total Fixed Capital (TFM) $135,820
Operating Costs, Per Year
Variable Costs
Losses to Energy Generation (net) $13,630
Materials Consumed Costs $4,290
Utility Costs (net) $3,710
Total Annual Variable Costs $21,630
Labor Costs
Operating Labor (3 shifts) 6 $62 wages/year $372
Maintenance Labor 3.00% of BLI $2,970
Control Laboratory Labor, 10% of Operating Labor 10% of Operating Labor $40
Direct Labor Costs $3,380
Maintenance Materials 3.00% of BLI $2,970
Operating Supplies, 12% of Operating Labor 12% of Operating Labor $40
Total Direct Costs $28,020
Plant Overhead 80% of Direct Labor Costs $2,700
Taxes and Insurance 1.60% of TFC $2,170
Cash Costs $32,890
Levelized Depreciation 3.3% of TFC $4,530
Gate Costs $37,420
General, Admin, Sales, Research 5% of Gate Costs $1,870
Production Costs, excluding Cost of Capital $39,300
TFC + Estimated Working Capital* $144,700
Annual Cost of Capital 12.5% of Capital Investment $18,090
Total Operating Costs $57,390
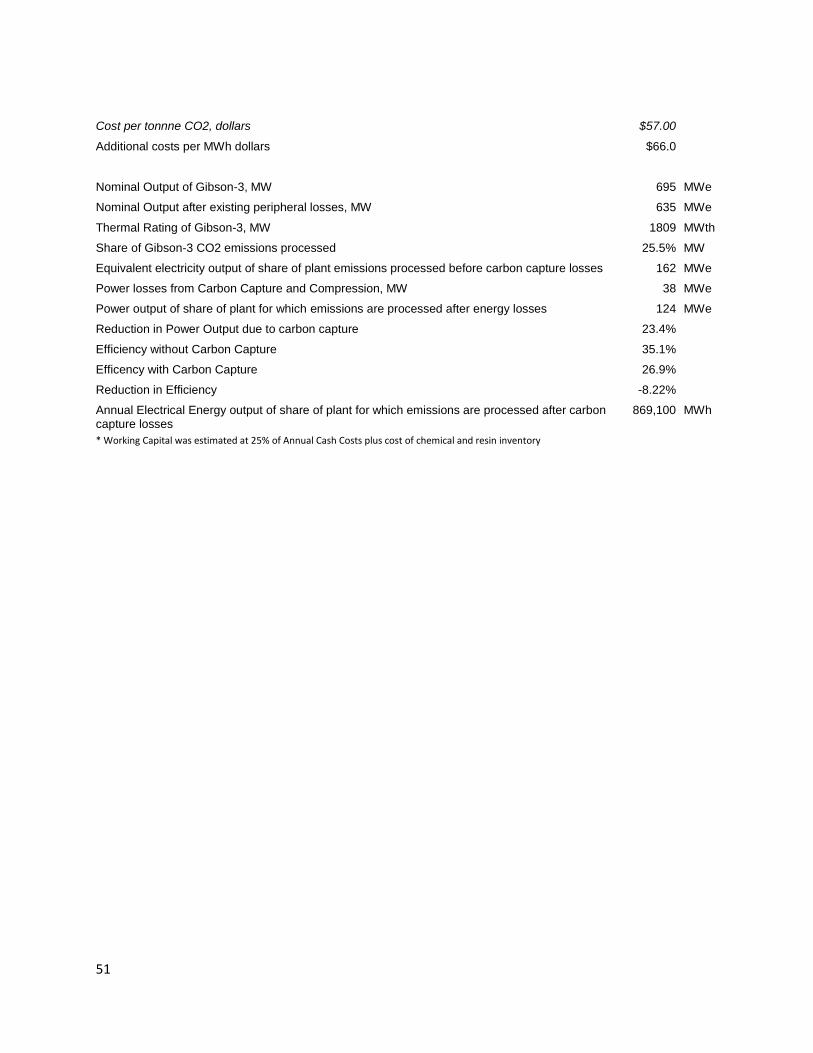
51
Cost per tonnne CO2, dollars $57.00
Additional costs per MWh dollars $66.0
Nominal Output of Gibson-3, MW 695 MWe
Nominal Output after existing peripheral losses, MW 635 MWe
Thermal Rating of Gibson-3, MW 1809 MWth
Share of Gibson-3 CO2 emissions processed 25.5% MW
Equivalent electricity output of share of plant emissions processed before carbon capture losses 162 MWe
Power losses from Carbon Capture and Compression, MW 38 MWe
Power output of share of plant for which emissions are processed after energy losses 124 MWe
Reduction in Power Output due to carbon capture 23.4%
Efficiency without Carbon Capture 35.1%
Efficency with Carbon Capture 26.9%
Reduction in Efficiency -8.22%
Annual Electrical Energy output of share of plant for which emissions are processed after carbon capture losses
869,100 MWh
* Working Capital was estimated at 25% of Annual Cash Costs plus cost of chemical and resin inventory
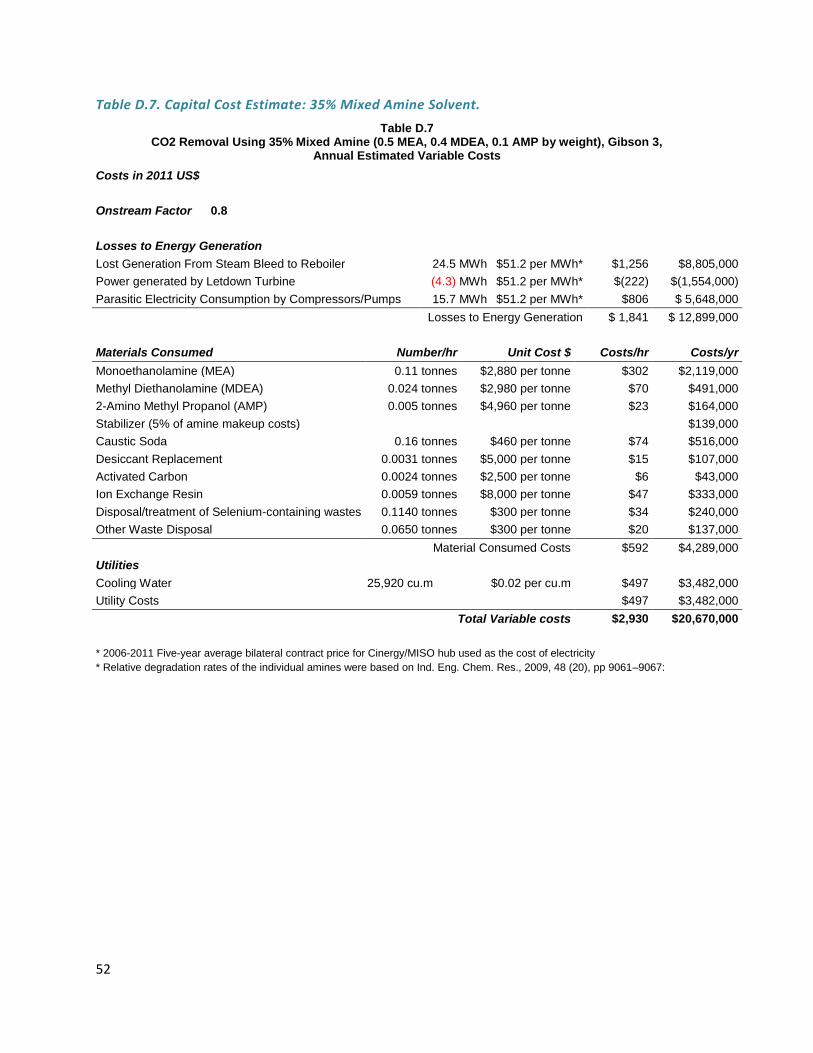
52
Table D.7. Capital Cost Estimate: 35% Mixed Amine Solvent.
Table D.7 CO2 Removal Using 35% Mixed Amine (0.5 MEA, 0.4 MDEA, 0.1 AMP by weight), Gibson 3,
Annual Estimated Variable Costs
Costs in 2011 US$
Onstream Factor 0.8
Losses to Energy Generation
Lost Generation From Steam Bleed to Reboiler 24.5 MWh $51.2 per MWh* $1,256 $8,805,000
Power generated by Letdown Turbine (4.3) MWh $51.2 per MWh* $(222) $(1,554,000)
Parasitic Electricity Consumption by Compressors/Pumps 15.7 MWh $51.2 per MWh* $806 $ 5,648,000
Losses to Energy Generation $ 1,841 $ 12,899,000
Materials Consumed Number/hr Unit Cost $ Costs/hr Costs/yr
Monoethanolamine (MEA) 0.11 tonnes $2,880 per tonne $302 $2,119,000
Methyl Diethanolamine (MDEA) 0.024 tonnes $2,980 per tonne $70 $491,000
2-Amino Methyl Propanol (AMP) 0.005 tonnes $4,960 per tonne $23 $164,000
Stabilizer (5% of amine makeup costs) $139,000
Caustic Soda 0.16 tonnes $460 per tonne $74 $516,000
Desiccant Replacement 0.0031 tonnes $5,000 per tonne $15 $107,000
Activated Carbon 0.0024 tonnes $2,500 per tonne $6 $43,000
Ion Exchange Resin 0.0059 tonnes $8,000 per tonne $47 $333,000
Disposal/treatment of Selenium-containing wastes 0.1140 tonnes $300 per tonne $34 $240,000
Other Waste Disposal 0.0650 tonnes $300 per tonne $20 $137,000
Material Consumed Costs $592 $4,289,000
Utilities
Cooling Water 25,920 cu.m $0.02 per cu.m $497 $3,482,000
Utility Costs $497 $3,482,000
Total Variable costs $2,930 $20,670,000
* 2006-2011 Five-year average bilateral contract price for Cinergy/MISO hub used as the cost of electricity
* Relative degradation rates of the individual amines were based on Ind. Eng. Chem. Res., 2009, 48 (20), pp 9061–9067:

53
Table D.8. Variable Cost Estimate: 35% Mixed Amine Solvent.
Table D.8 CO2 Removal Using 35% Mixed Amine (0.5 MEA, 0.4 MDEA, 0.1 AMP by weight), Gibson 3,
Estimated Fixed Capital Costs Plant Net Capacity, CO2 Removed/Hr 130 tonnes/hr 144 short tons/hr Costs in 2011 thousand US$ Gas Cleanup and Power Plant
Battery Limits Investment Equipment Cost Installation Cost Total Cost
Absorber Columns $4,140 $9,110 $13,250
Stripper Columns $1,080 $2,380 $3,460
Heat Exchangers $7,600 $11,900 $19,500
Pressure Vessels $2,450 $3,430 $5,880
Fans $175 $245 $420
CO2 Compressors $6,260 $9,350 $15,610
Pumps $1,660 $2,850 $4,010
Let-down Turbine $1,500 $1,200 $2,700
Subtotal $64,830
BLI Contingency 20% of Installed Equipment Costs $12,970
Battery Limits Investment $77,80
Tankage Equipment Cost Installation Cost
Amine Solution Surge Tanks $260 $310 $570
MEA Storage Tank $100 $120 $220
MDEA Storage Tank $60 $70 $130
AMP Storage Tank $40 $50 $90
Makeup Amine Staging Tank $100 $120 $220
Makeup Amine Staging Tank $100 $120 $220
Caustic Soda Tank $130 $210 $340
Tankage Investment Subtotal $1,790
Utilities Equipment Cost Installation Cost Investment
Cooling Water $3,190 $2,200 $5,390
Utilities Investment Subtotal $5,400
Pipelines from Main Plant Unit cost, installed Length (km) Diameter (cm)
Flue Gas $16/km-cm 0.5 660 $5,280
Steam $16/km-cm 0.5 60 $480
Condensate $16/km-cm 0.5 80 $640
Pipeline Investment Subtotal $6,400
Offsites & Utility Investment Contingency 20% $2,758
Offsite & Utilities Investment $16,548
General Service Facilities 10% of BLI & Utilities Investment $9,910
Waste Treatment 5% of BLI Investment $4,130
Outside Battery Limits Investment $30,600
Greenfield Total Plant Investment $113,200
Retrofit Complexity Factor 20% Additional Retrofit Costs $22,600
Total Estimated Investment $135,800

54
Table D.9. Operating Cost Estimate: 35% Mixed Amine Solvent
Table D.9 CO2 Removal Using 30% Mixed Amine (0.5 MEA, 0.4 MDEA, 0.1 AMP by weight), Gibson 3,
Annual Estimated Operating Costs
Plant Net Capacity 0.91 megatonnes/yr
1.01 MMshort tons/yr
Onstream factor 0.8
Price of Electricity $51.20 per MWh
Costs in 2011 thousand US$ unless noted
Costs
Plant Investment, Battery Limits (BLI) $93,400
Plant Investment, Outside Battery Limits (OBLI) $35,520
Total Fixed Capital (TFM) $128,920
Operating Costs, Per Year
Variable Costs
Losses to Energy Generation (net) $12,900
Materials Consumed Costs $4,290
Utility Costs (net) $3,480
Total Annual Variable Costs $20,670
Labor Costs
Operating Labor (3 shifts) 6 $62 wages/year $372
Maintenance Labor 3.00% of BLI $2,802
Control Laboratory Labor, 10% of Operating Labor 10% of Operating Labor $40
Direct Labor Costs $3,210
Maintenance Materials 3.00% of BLI $2,802
Operating Supplies, 12% of Operating Labor 12% of Operating Labor $40
Total Direct Costs $26,722
Plant Overhead 80% of Direct Labor Costs $2,570
Taxes and Insurance 1.60% of TFC $2,060
Cash Costs $31,352
Levelized Depreciation 3.3% of TFC $4,300
Gate Costs $35,650
General, Admin, Sales, Research 5% of Gate Costs $1,780
Production Costs, excluding Cost of Capital $37,400
TFC + Estimated Working Capital* $137,500
Annual Cost of Capital 12.5% of Capital Investment $17,190
Total Operating Costs $54,590
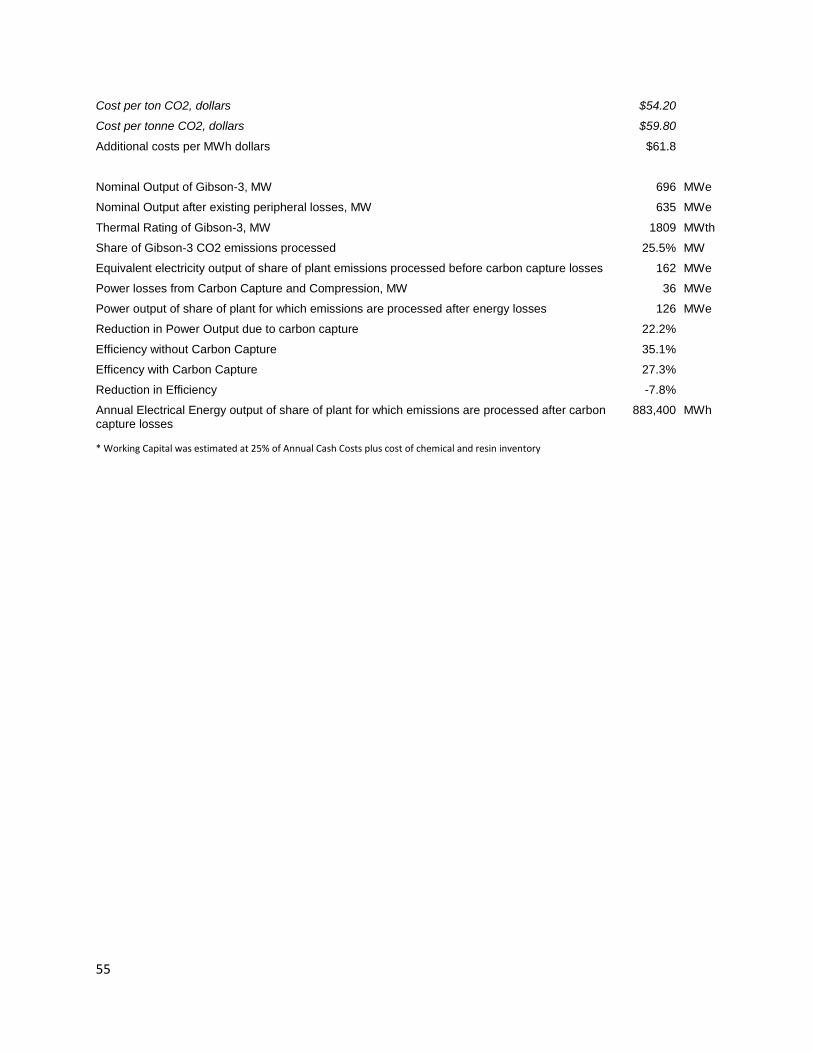
55
Cost per ton CO2, dollars $54.20
Cost per tonne CO2, dollars $59.80
Additional costs per MWh dollars $61.8
Nominal Output of Gibson-3, MW 696 MWe
Nominal Output after existing peripheral losses, MW 635 MWe
Thermal Rating of Gibson-3, MW 1809 MWth
Share of Gibson-3 CO2 emissions processed 25.5% MW
Equivalent electricity output of share of plant emissions processed before carbon capture losses 162 MWe
Power losses from Carbon Capture and Compression, MW 36 MWe
Power output of share of plant for which emissions are processed after energy losses 126 MWe
Reduction in Power Output due to carbon capture 22.2%
Efficiency without Carbon Capture 35.1%
Efficency with Carbon Capture 27.3%
Reduction in Efficiency -7.8%
Annual Electrical Energy output of share of plant for which emissions are processed after carbon capture losses
883,400 MWh
* Working Capital was estimated at 25% of Annual Cash Costs plus cost of chemical and resin inventory

56
Appendix E: Discussion of Shidongkou Plant Visit
The authors visited Huaneng’s Shidongkou pilot plant at Shanghai on Friday, 17 August, 2012. The plant was not operating at the time, but we discussed its operation with Huaneng engineers and plant personnel. The plant was designed to take part (4%) of the flue gas from a 600 MW coal fed power generating unit, and generate 100,000 metric tons of food grade carbon dioxide for commercial use.18 The installation, the world’s largest carbon capture plant when it was built, cost $24 million to build.19
Although we were only able to photograph the equipment from outside the fence, it was apparent that the compactness of the installation enabled good heat integration, where a more spread out layout would worsen the heat integration because of heat loss from long pipe runs. According to plant personnel, startup and shutdown of the carbon capture plant was fast, less than one hour. Also, the carbon capture could be run as low as 50% of the design capacity of 100,000 tonnes per year. Because of overdesign of critical pieces of equipment, Shidongkou was able, through debottlenecking, to increase the capacity to 120,000 tonnes per year.
To date, the only amine system tested at the Shidongkou location was monoethanolamine (MEA), 15-20% in water.
Figure E.1 is a photograph of process flow diagram (PFD) of the Shidongkou carbon capture plant, and Figure E2 is a recreation of the same PFD. For comparison, Figure E.3, identical to Figure A.1, is the PFD from our Aspen model. The recreated PFD in Figure E.2 does not include the purification system to make food grade CO2, because that level of purity is not necessary in our scenarios. In our Aspen model, the liquid CO2 product is 99.5% pure after the five-stage compression with interstage cooling. Also, while the Shidongkou plant includes a spherical holding tank for CO2, we have not included a CO2 holding tank in our cost estimate, assuming that storage of CO2 would be the responsibility of the receiver of the CO2. Other differences exist between the PFD from Shidongkou and our Aspen model such as:
The Shidongkou plant does not have precooling of the flue gas before the absorber.
There is a preheater before the recycle heat exchanger (we believe this may be recovering some low-grade heat from the flue gas stream before the FGD)
The lean solution bleed system is not shown. In this system, 10% of the lean solution is bled off, then combined with caustic soda and flashed under vacuum, the vapor to be recompressed and injected into the bottom section of the stripper.
Shidongkou has a somewhat more rigorous process for purification of CO2 (as the CO2 needs to meet food-grade specifications for use in carbonated beverages)
The stripper reboiler is not shown as a separate piece of equipment in either Figure E.2. or Figure E.3. Although the reboiler is an important component of the carbon capture equipment and the source of most of the energy usage, it is internal to the stripper, so is not shown in the figures.
Plant personnel informed us that the absorber and stripper columns were 4 meters in diameter, which is consistent with our Aspen-calculated absorber diameter of about 12 meters for the Duke system with ten times the throughput, since the diameter varies with the square root of the vapor rate. Based on this, we estimated from Figure E.4. that the column heights are approximately 20 meters.
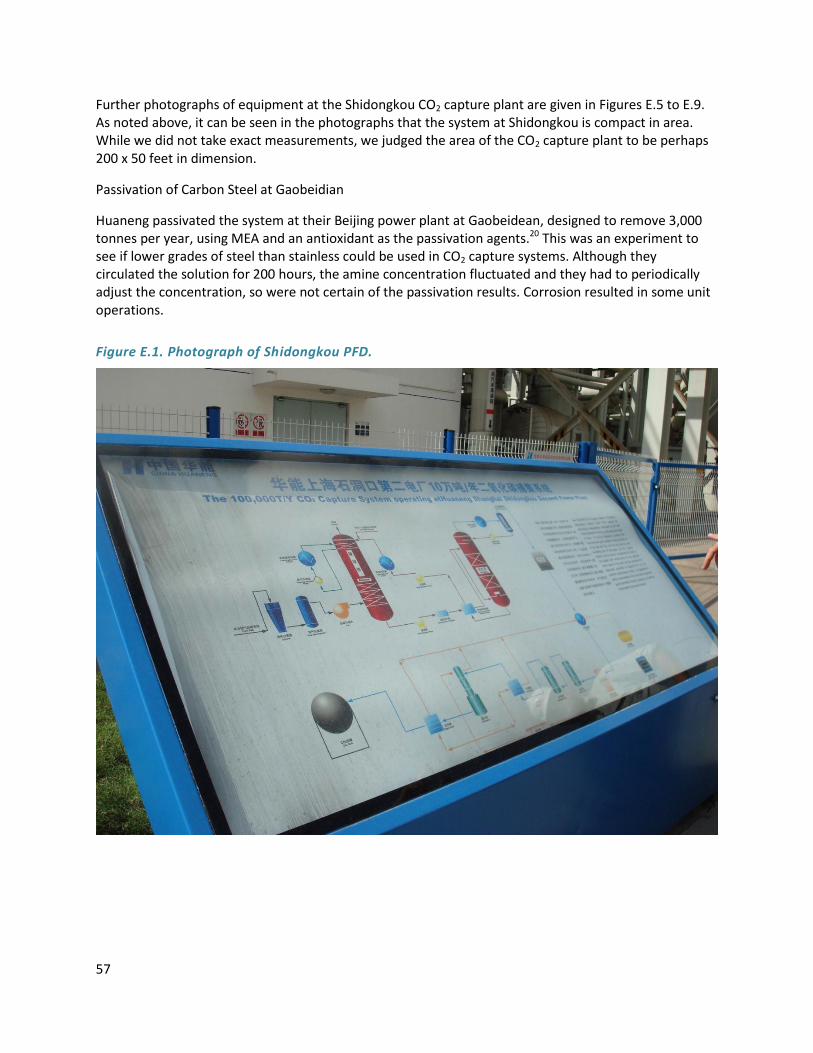
57
Further photographs of equipment at the Shidongkou CO2 capture plant are given in Figures E.5 to E.9. As noted above, it can be seen in the photographs that the system at Shidongkou is compact in area. While we did not take exact measurements, we judged the area of the CO2 capture plant to be perhaps 200 x 50 feet in dimension.
Passivation of Carbon Steel at Gaobeidian
Huaneng passivated the system at their Beijing power plant at Gaobeidean, designed to remove 3,000 tonnes per year, using MEA and an antioxidant as the passivation agents.20 This was an experiment to see if lower grades of steel than stainless could be used in CO2 capture systems. Although they circulated the solution for 200 hours, the amine concentration fluctuated and they had to periodically adjust the concentration, so were not certain of the passivation results. Corrosion resulted in some unit operations.
Figure E.1. Photograph of Shidongkou PFD.
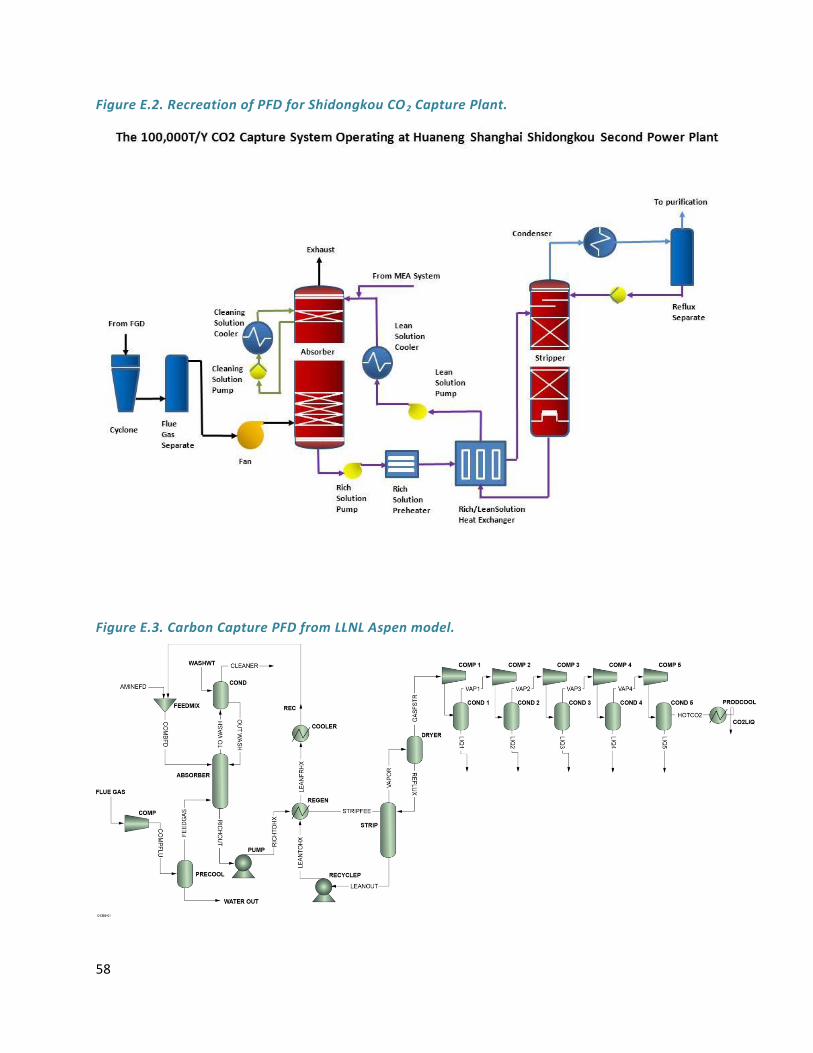
58
Figure E.2. Recreation of PFD for Shidongkou CO2 Capture Plant.
Figure E.3. Carbon Capture PFD from LLNL Aspen model.
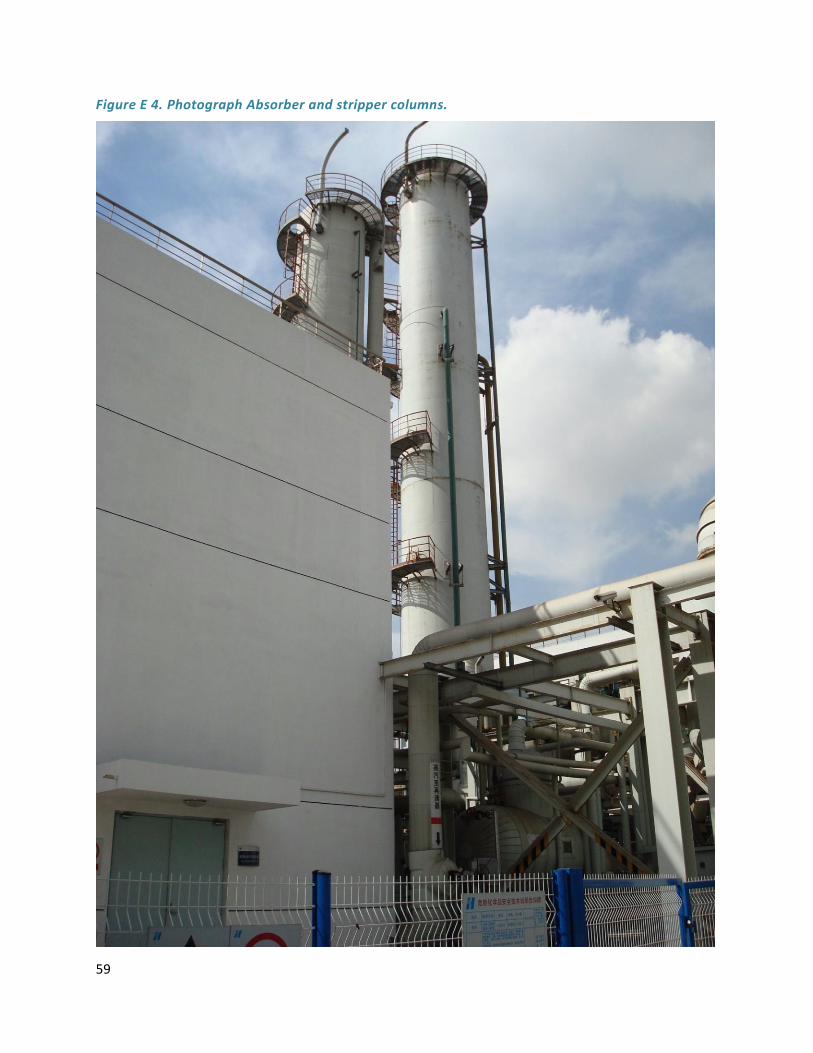
59
Figure E 4. Photograph Absorber and stripper columns.

60
Figure E.5. CO2 Purification and Product CO2 storage tanks.
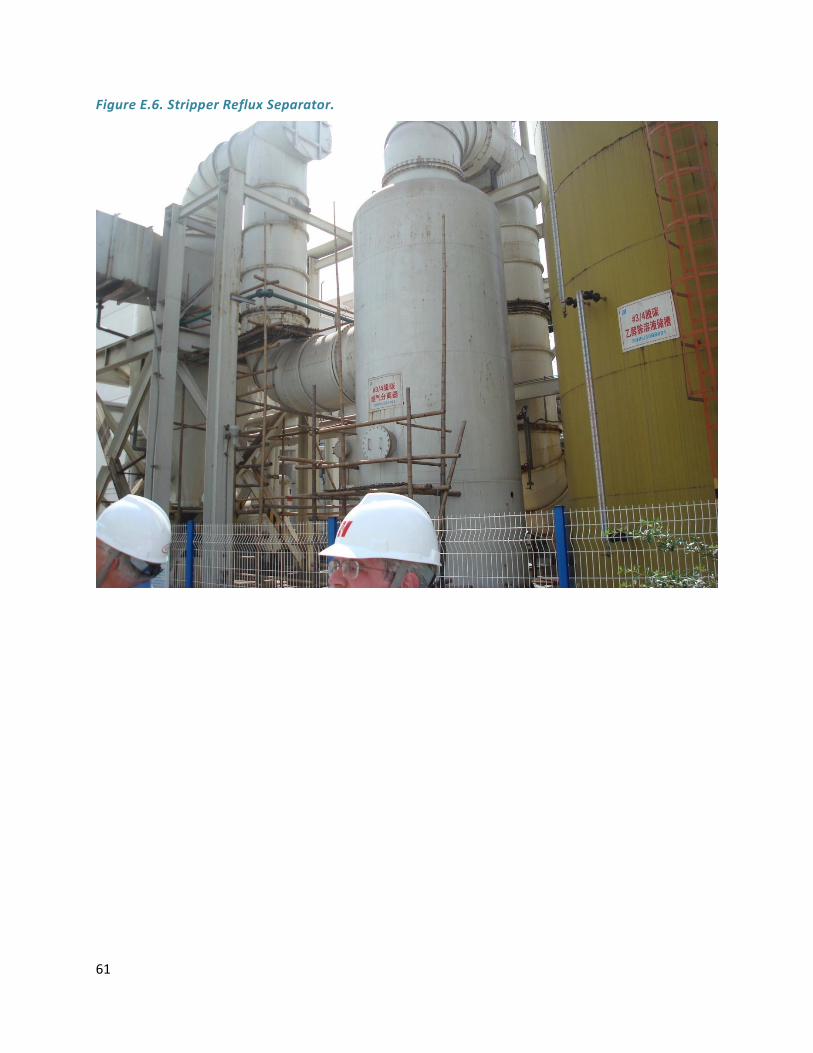
61
Figure E.6. Stripper Reflux Separator.

62
Figure E.7. Probable Water Storage Tank.

63
Figure E.8. Probable Solvent Surge Tank and Feed Amine Storage Tank.
Same floor of this platform contains the plate heat exchangers used (but are not visible from this vantage point) in the process to exchange heat between the stripper feed and stripper bottoms.

64
Figure E.9. Pump Sets.
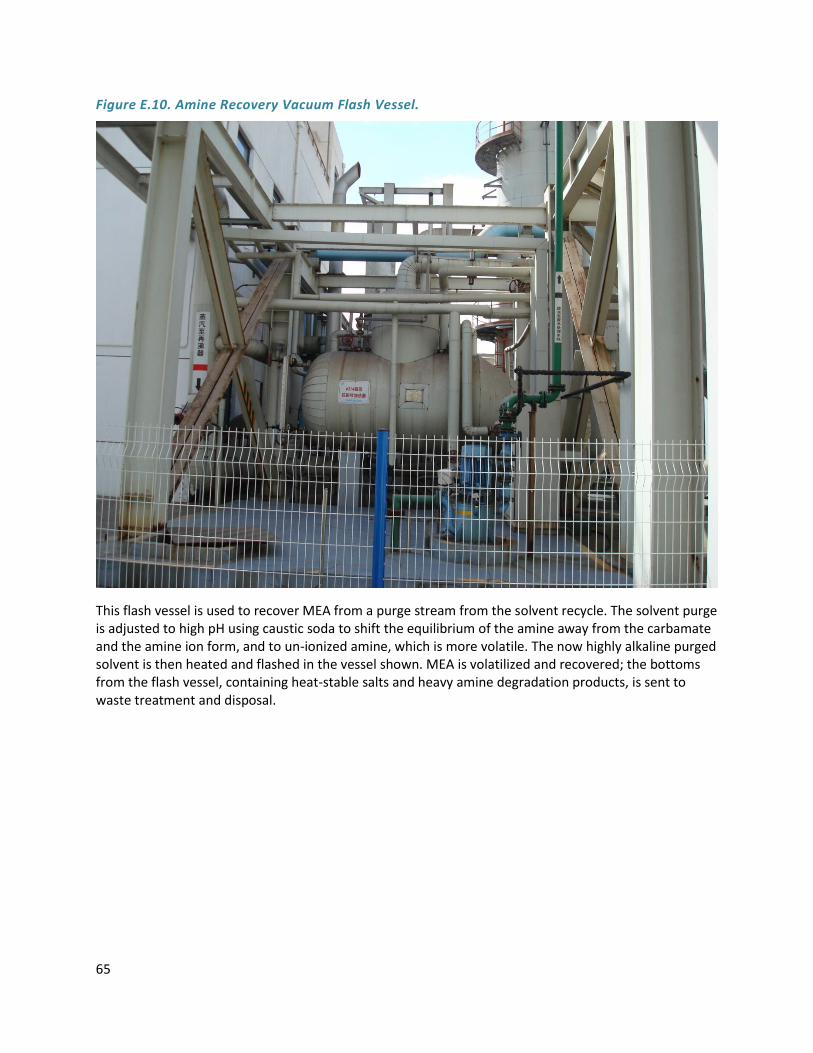
65
Figure E.10. Amine Recovery Vacuum Flash Vessel.
This flash vessel is used to recover MEA from a purge stream from the solvent recycle. The solvent purge is adjusted to high pH using caustic soda to shift the equilibrium of the amine away from the carbamate and the amine ion form, and to un-ionized amine, which is more volatile. The now highly alkaline purged solvent is then heated and flashed in the vessel shown. MEA is volatilized and recovered; the bottoms from the flash vessel, containing heat-stable salts and heavy amine degradation products, is sent to waste treatment and disposal.
66
References 1 D. Simbeck and W. Roekpooritat, 2009, Near-Term Technologies for Retrofit CO2 Capture and
Storage of Existing Coal-fired Power Plants in the United States, in, HJ Herzog (ed.), Retrofitting of Coal-Fired Power Plants for CO2 Emissions Reductions, http://mitei.mit.edu/system/files/simbeck-near-term.pdf
2 Rochelle G, 2009, Amine scrubbing for CO2 capture, Science, v325, 1652-1655
3 Abanades JC, Rubin ES, Anthony EJ, 2004, Sorbent cost and performance in CO2 capture systemts, Ind. Eng. Chem. Res., v.43, 3462-3466
4 DOE-NETL, 2007, U.S. Department of Energy, National Energy Technology Laboratory, Cost and performance baseline for fossil energy plants, Volume 1. Bituminous coal and natural gas to electricity, Revision 1, August, 2007
5 Al-Juaied M, Whitmore A, 2009, Realistic Costs of Carbon Capture, Belfer Center Discussion Paper 2009-08, Harvard Univ., 73 p., http://belfercenter.ksg.harvard.edu/files/2009_AlJuaied_Whitmore_Realistic_Costs_of_Carbon_Capture_web.pdf
6 CN 101537340A,, “Flue gas carbon dioxide adsorbent useful for decarburization of flue gas of coal-fired power plant, comprises monoethanolamine, N-methyl diethanol amine, and sterically hindered amine or piperazidine,” Assignee: Xi’an Thermal Power Research Institute, priority date 30 Apr 2009
7 D. Jones, T. McVey, S. J. Friedmann, 2013, Location-Specific Technoeconomic Evaluation of a Novel Amine Technology, Energy Procedia, GHGT-11, 10p
8 D. Jones, T. McVey, S. J. Friedmann, 2013 Technoeconomic Evaluation of MEA versus Mixed Amines for CO2 Removal at Near-Commercial Scale at Duke Energy Gibson 3 Plant, Lawrence Livermore National Laboratory, Report LLNL-TR-607574, 64p. https://e-reports-int.llnl.gov/pdf/700272.pdf
9 DOE-NETL, E. Rubin, and 5 other organizations, 2013, Toward a common method of cost estimation for CO2 capture and storage at fossil fuel power plants, 36 p., http://cdn.globalccsinstitute.com/sites/default/files/publications/85761/toward-common-method-cost-estimation-ccs-fossil-fuel-power-plants-white-paper.pdf
10 Freguia, Stefano, “Modeling of CO2 Removal from Flue Gases with Monoethanolamine,” M.S. thesis, University of Texas, 2002
11 CN 101537340A,, “Flue gas carbon dioxide adsorbent useful for decarburization of flue gas of coal-fired power plant, comprises monoethanolamine, N-methyl diethanol amine, and sterically hindered amine or piperazidine,” Assignee: Xi’an Thermal Power Research Institute, priority date 30 Apr 2009.
13 M.S. Peters, K.D. Timmerhause, R.E. West, “Plant Design and Economics for Chemical Engineers, 5th Ed.” 2002, McGraw-Hill
14 Personal communication, Mike Arne, Process Economics Program, IHS Consulting, September 2012.
67
15 D. Singh, E. Croiset, et al., “Technoeconomic Study of CO2 Capture from an Existing Coal-fired
Power Plant,” Energy Conversion & Management, 2003, 44 3073-3091
16 Helene Lepaumier, Dominique Picq and Pierre-Louis Carrette, “New Amines for CO2 Capture. I.
Mechanisms of Amine Degradation in the Presence of CO2,” Industrial and Engineering Chemistry Research, October 21, 2009, 48 (20) 9061–9067;
Helene Lepaumier, Dominique Picq and Pierre-Louis Carrette, “New Amines for CO2 Capture. I. Mechanisms of Amine Degradation in the Presence of O2,” Industrial and Engineering Chemistry Research, October 21, 2009, 48 (20) 68–9075;
Sandrine Martin, Helene Lepaumier, Dominique Picq, Jean Kittel, Theodorus de Bruin, Abdelaziz Faraj, and Pierre-Louis Carrette, “New Amines for CO2 Capture. IV. Degradation, Corrosion, and Quantitative Structure Property Relationship Model,” Industrial and Engineering Chemistry Research, April 8, 2012, 51 (18) 6283–6289
17 Freguia, Stefano, “Modeling of CO2 Removal from Flue Gases with Monoethanolamine,” M.S. thesis, University of Texas, 2002
18 MIT Carbon Capture & Sequestration Technologies, November 23, 2011, “Shidongkou Fact Sheet: Carbon Dioxide Capture and Storage Project,”, at http://sequestration.mit.edu/tools/projects/shidongkou.html, accessed November 8, 2012
19 China CSR, August 6, 2009, “Shanghai Lands World’s Largest Carbon Capture Project,” at http://www.chinacsr.com/en/2009/08/06/5850-shanghai-lands-worlds-largest-carbon-capture-project/, accessed November 8, 2012
20 Huang, B., et al., “Industrial test and techno-economic analysis of CO2 capture in Huaneng Beijing coal-fired power station,” Applied Energy, 87 (2010), 3347-3354