Embed Size (px)
Citation preview
Technological Advisory CouncilSharing Work Group
White PaperSpectrum Efficiency Metrics(Draft – 25 September 2011)
I. Introduction
The radio spectrum is a national (and international) resource of increasing economic and social value, and it is critical to the safety of life and property and to national defense and homeland security. Wireless systems of all types are dependent upon this resource, and the spectrum efficiencies achieved by such systems must improve at an accelerating rate if the Nation is to accommodate rapidly increasing demand for wireless systems and applications and to stimulate related job growth. Unfortunately, as discussed in more detail herein, there is no single measure of spectrum efficiency that can be applied across the myriad of different services that rely upon wireless systems.
While it does not appear possible to develop a single measure of spectrum efficiency, metrics have been developed that allow efficiency comparisons to be made across similar systems (e.g., as explained below, bits-per-second per Hertz of bandwidth per square kilometer for personal communications systems, or more accurately, information bits-per-second, since we are interested in the actual useful information and not the rate at which we can convey overhead bits). Such metrics can be a useful tool in analyzing and comparing similar systems. For example, they can be useful in assessing historical gains in efficiency, evaluating the gains that might be achieved with new or improved technologies, in identifying opportunities for evolving to more efficient systems, or even to implementing a wholesale replacement technology. It should be emphasized at the outset, however, that, although spectrum efficiency is an important factor (because it allows the maximum amount of service to be derived from the radio spectrum) it is not the only factor to be considered in spectrum management decisions. Other factors including the overall cost, the quality of service (QoS), the availability of equipment, the compatibility with existing equipment and techniques, the reliability of the system, the security afforded by the systems, and operational factors all affect the choice of the best system in a given circumstance.
With that caveat, the purpose of the Working Group’s effort and of this White Paper is to identify, analyze, and describe spectrum efficiency metrics for a taxonomy of different systems with the hope that jobs will be created immediately to design, manufacture, deploy, and maintain more spectrally efficient technologies that are “fit for purpose” and, over the longer term, to create expanded opportunities for the growth of the wireless industry and, hence, for the Nation’s economy more generally.
The balance of this report is divided into six additional sections. Section II summarizes prior work in the area of spectrum efficiency metrics while Section III identifies and describes the six classes of systems upon which the Working Group concentrated its initial effort and also identifies additional classes that may be analyzed in its future efforts. Section IV then addresses spectrum efficiency metrics for satellite systems while Section V addresses terrestrial systems.
1
Section VI offers further thoughts on spectrum efficiency metrics and in particular the importance of viewing these metrics from a systems perspective, while Section VII offers the summary and conclusions associated with the Working Group’s efforts on spectrum efficiency metrics to date. Appendix A provides a table (still largely unpopulated at this point) illustrating the use of spectrum efficiency metrics. Appendix B provides a table illustrating representative examples of spectrum sharing experience in US FCC history. Appendix C provides an initial set of case studies of instances where receiver performance played a significant role in spectrum allocation decisions and often the related inefficiencies in the current use of the spectrum.
II. Summary of Prior Work
The Working Group began its work on Spectrum Efficiency Metrics by identifying and reviewing prior work in the area. An important item in that regard was a report entitled “Definitions of Efficiency in Spectrum Use” which was prepared by Working Group 1 of the Commerce Spectrum Management Advisory Committee (CSMAC) and dated October 1, 2008.A
As touched upon above, the CSMAC report recognized that it was impossible “to establish a uniform metric for spectrum use efficiency that encompasses the wide range of services and uses for which spectrum is needed.”1 Therefore it first developed a taxonomy of spectrum use (i.e., classes of systems that had enough characteristics in common to indeed be comparable) and, second, identified and discussed possible spectrum efficiency measures for each such class. The classes addressed in the CSMAC report included the following:
Broadcast SystemsPersonal Communications SystemsPoint-to-Point SystemsRadar SystemsSatellite SystemsPassive Listeners (e.g., radio astronomy)Short Range Systems2
The CSMAC report on definitions of spectrum efficiency drew upon an earlier report/recommendation by the International Telecommunications Union entitled “Recommendation ITU-R SM.1046-2, Definition of Spectrum Use and Efficiency of a Radio System.”B,3 In developing this report, the Working Group also took note of a presentation entitled “Frequency Use Status Investigation and Spectrum Utilization Metric” by Sang Yun Lee at the International Symposium on Advanced Radio Technology (ISART) in 2008C, NTIA Report 94-311 by R.J. Matheson entitled “A Survey of Relative Spectrum Efficiency of Mobile Voice Communication Systems” and dated July 1994D, and a presentation entitled “What is Spectral Efficiency” by Dag Åkerberg of the DECT Forum in 2005E.
Importantly for the study conducted by the Working Group, ITU-R SM.1046-2 “Definition of Spectrum Use and Efficiency of a Radio System”B provides a definition of Spectrum Efficiency. 1 CSMAC, Working Group 1 “Definitions of Efficiency In Spectrum Use”, October 1, 2008, p. 2. 2 The CSMAC report also included a category labeled “Cognitive Systems” that addressed “cross application efficiencies” or inter-service efficiencies that could be produced by what it termed “cognitive adaptive spectrum use.”3 Rec. ITU-R SM.1046-2, "Definition of spectrum use and efficiency of a radio system," 2006.
2
ITU-R SM.1046-2 defines the Spectrum Utilization Efficiency, SUE, (or Spectrum Efficiency as a shortened term) of a radiocommunication system by the complex parameter:
SUE={M,U} (1)where: M: is the useful effect obtained with the system in question; and U: is the spectrum utilization factor for that system. The measure of spectrum utilization – spectrum utilization factor, U, is defined as the product of the frequency bandwidth, the geometric (geographic) space, and the time denied to other potential users:
U = B · S · T (2)
where: B: frequency bandwidth S: geometric space (usually area) and T: time.
The Working Group relied on this definition of Spectrum Utilization Efficiency for several portions of its work.
III. Proposed Taxonomy and Focus
Having reviewed the prior work described above, the Working Group studied two broad classes of systems – Satellite Systems and Terrestrial Systems – and, within those two broad categories of systems, focused its initial analytical attention on six classes of systems:
Satellite Broadcast SystemsPoint-to-Point Satellite Systems
Terrestrial Broadcast SystemsTerrestrial Personal Communication SystemsTerrestrial Point-to-Point SystemsTerrestrial Hybrid Systems
In the two sections which follow, each of these six classes of systems is discussed, and related spectrum efficiency metrics are proposed. The challenges associated with the development and usage of the associated metric is discussed, and sample calculations for each efficiency metric are supplied.
In addition to the four classes of terrestrial systems listed above, the Working Group also considered radar systems. In doing so, it concluded (as the CSMAC report on definitions of spectrum efficiency had done before) that commonly applied efficiency measures (such as bps/Hz) are not appropriate for radars since the spectrum efficiency of a radar system cannot be directly compared to the spectrum efficiency of a typical communications system. The Working
3
Group also recognized that radar systems themselves vary widely in terms of the services they provide and the technologies that they employ and that, subcategories of radar systems may be needed to properly compare them. While the Working Group took note of recent technological advances that might allow significant spectral efficiency improvements (e.g., the adoption of linear solid state Laterally Diffused Metal Oxide Silicon – LDMOS transmitter systems and advances in pulse shaping technology), it was unable to identify or evaluate suitable spectrum efficiency metrics for radar systems at this time. The Working Group also took note of the fact that the annual ISART conference held in July, 2011, was devoted almost entirely to spectrum management aspects of radar systems, and the presentations might provide a resource for developing an appropriate spectrum efficiency metric for radar systems. This is especially important as radar systems utilize a significant portion of the most desirable regions of the radio spectrum resource. In any event, the Working Group intends to continue to work on the radar issue by, among other things, incorporating results from the ISART conference and through engagement with academia.
Finally, the Working Group touched upon but did not address in any depth spectrum efficiency metrics for “passive” (mostly scientific) uses of the resource and short range systems that typically operate on an unlicensed or “licensed by rule” basis. The CSMAC referred to the former as Passive Listeners, and it includes the receive-only systems that are used to detect natural electromagnetic omissions in certain bands that have been allocated for the purpose. Perhaps the most well-known example is radio astronomy where users study radio emissions from stellar objects and distant galaxies, for example, to gain a better understanding of the universe and how it evolved. The CSMAC report noted that, while the spectrum efficiency of a passive listening system may not be a definable metric, the amount of spectrum used (the frequency range or bandwidth, the guard band size, the geographic area and the time duration of the associated measurements) can be determined. It went on to explain that, by using more directive receive antennas (at added cost of course), spectrum efficiency could be enhanced by reducing the separation distance between the passive receiving site and potentially interfering transmitters. While the Working Group has so far been unable to pursue spectrum metrics for passive uses more extensively, it did reach out to radio astronomers in the National Radio Astronomy Observatory (“NRAO”)4 in order to understand current issues associated with radio astronomy spectrum and more fully explore potential alternatives for analyzing such systems. The NRAO informed the Working Group that:
1. Appropriate dynamic spectrum sharing could work along with appropriate temporal and spatial exclusion zones. Some exclusion zones may need to be in the range of 100 miles.
2. The 1400 – 1421 MHz “H1” radio astronomy band is used only in a couple dozen areas worldwide. This band needs to be protected only around the limited number of locations where it is used.
3. The NRAO is quite concerned about consumer vehicle radar detectors in the 76 – 81 GHz band. Because these radar detectors can destroy a radio telescope sensor if they cross the telescope bore sight, it would be helpful to have on/off switches in vehicles that could be operated in conjunction with warning signs near the telescope.
4 The National Radio Astronomy Observatory, founded in 1956, is a facility of the National Science Foundation that provides state-of-the-art radio telescope facilities for use by the international scientific community. More information is available at http://www.nrao.edu/.
4
4. Bringing mobile devices into a radio astronomy site needs to be avoided because close proximity of mobile devices operating in any band will degrade radio telescope performance.
With regard to the latter, short range systems that typically operate on an unlicensed or licensed by rule basis, the Working Group noted the increased importance of unlicensed systems such as WiFi (the IEEE 802.11 family of standards) and Bluetooth (IEEE 802.15.1). The Working Group also recognized that, while systems used in consumer applications like WiFi, Bluetooth, baby monitors and cordless telephones (and even microwave ovens) garner much of the attention in terms of unlicensed, short-range spectrum uses, the same spectrum is used in a wide variety of other commercially important applications, including “off-loading” cellular data traffic from licensed systems to WiFi. While it is clear and demonstrable that WiFi systems, for example, have increased their spectrum efficiency rather dramatically over the past decade, it is far less clear how other unlicensed systems have evolved in that regard. Thus, as pointed out in the CSMAC report, while the spectrum efficiency of say a campus-wide WiFi system can be assessed using the metric of bits/sec/Hz/km2, it is far less clear how to assess the spectrum efficiency of other specialized systems for which there is little information available, nor how to assess the efficiency of the usage of an unlicensed band in total. It is also a challenge to assess the overall spectrum efficiency of a system that uses both conventional cellular technology and WiFi to provide commercial wireless data services. As in the case of passive systems, it is the intention of the Working Group to study and/or support the study of these issues in more detail by, for example, further engaging the academic research community.
IV. Spectrum Efficiency Metrics for Satellite Systems
Satellite systems encompass a significant diversity of service types5 such that it is difficult and not necessarily meaningful to establish a single spectrum efficiency metric that would apply to all service types. For example, communication satellite systems include both broadcast television systems (“DirecTV” and “Dish” in the United States), which are intended to distribute the same content to a large number of viewers, and mobile telephone systems (“Iridium”, “Globalstar”, “Terrestar”, “Inmarsat”, etc.), which operate essentially as a satellite-based cellular telephone network. Just as it has been recognized that different spectrum efficiency metrics are applicable to terrestrial broadcast television systems and personal communication systems, it is appropriate that different spectrum efficiency metrics should be applicable to satellite systems providing these different service types. For satellite systems, therefore, appropriate spectrum efficiency metrics need to be defined based on service type.
Most fundamentally, satellite system service types can be divided between those that provide communication services, which are intended to convey a communication, typically digital data, from a sender to a receiver, and non-communication services, which include a variety of non-communication applications such as navigation services, weather monitoring, earth observation research, and imaging. Within communication service types, it is useful to make the following distinctions:5 Satellite system service types include non-communication systems such as navigation systems (“Global Positioning System”), weather sensors, and imaging systems (used for Google Earth and maps), and a variety of communication systems including television broadcast systems (“DirecTV” and “Dish”) and systems providing point-to-point two-way communication links.
5
1. Broadcast systems vs. point-to-point systems, in which broadcast systems are intended to distribute identical content from one origination point to many reception points, while point-to-point systems are intended to establish many individual communication links between two points (senders and receivers).
2. Fixed service vs. mobile service, in which a fixed service uses a stationary high gain antenna that requires precise pointing to the satellite, while a mobile service allows user mobility through the use of an omni-directional antenna that does not require pointing.
An additional distinction that will be useful for metric definition is geostationary vs. non-geostationary satellite system, which specifies whether or not the satellite operates in an orbit that is geostationary. While this distinction is more of a system architecture characteristic as opposed to a service type, it does affect the amount of spectrum re-use that can be achieved between different satellite systems, so it therefore influences how spectrum efficiency is determined.
Within each service type, an appropriate spectrum efficiency metric will be proposed. As a consequence of the system design tradeoffs in satellite systems, it is sometimes possible to improve a spectrum efficiency metric by making a change within the system design that degrades a value point for the end user. For example, spectrum efficiency in terms of bits-per-second-per Hz of spectrum can be increased by increasing the size (antenna aperture diameter) of the user antenna, which enables higher order modulation to be employed. Larger antenna sizes, however, are generally undesirable, especially in consumer applications. It is therefore useful to identify additional efficiency considerations that will need to be evaluated along with the core spectrum efficiency metric to provide an overall evaluation of the spectrum efficiency so that the stand alone spectrum efficiency metric does not drive an undesirable satellite system design.
1 Communication Satellite SystemsCommunication satellite systems are those intended to convey a communication, typically digital data, from a sender to a receiver.
1.1 Broadcast SystemsA satellite broadcast system is intended to distribute identical content from one origination point to many reception points within the common program area. The satellite broadcast system may divide its total service area (coverage area) into multiple common program areas, each of which receive a common set of content. Within the United States, typical common program areas can be the time zones or local television channel broadcast areas (“local into local”).
The proposed spectrum efficiency metric is Information bits per second per Hz of allocated (licensed) spectrum within each common program area (“bits / (second – Hz)”).
The spectrum efficiency metric needs to be assessed within each common program area because the number and size (square miles) of the common program areas are determined by the intended service objective and are therefore not an appropriate driver of the spectrum efficiency. Whether a broadcast service is intended to deliver a single program, such as the Super Bowl, to the entire United States, or to deliver localized content to local areas such as individual US states is determined by the service objective and is not an appropriate measure of spectrum efficiency.
6
Rather, broadcast system spectrum efficiency is determined by how efficiently the spectrum within each common program area is utilized.6
A broadcast satellite system can deliver the same content to an arbitrarily large number of users within the common program area. Adding users does not consume any of the system capacity, as with terrestrial broadcast over-the-air television, so the number of users does not need to be considered when defining the spectrum efficiency metric.
1.2 Point-to-point SystemsPoint-to-point satellite systems are intended to establish many individual communication links between two points (senders and receivers) to allow information, typically digital data, to flow between those two points. The satellite system establishes this capability across the satellite’s service area (coverage area). Because adding users does consume system capacity, unlike broadcast satellite systems, consideration does need to be given to the system capacity per area, since the number of potential users is proportional to the size of the service area. Capacity per service area can be increased via frequency re-use, similar to terrestrial cellular systems, so the spectrum efficiency metric should give credit to higher levels of frequency re-use.Error:Reference source not found
The proposed spectrum efficiency metric is Information bits per second per Hz of allocated (licensed) spectrum per square mile (or square kilometer) of service area (“bits / (second – Hz – sq. mi.)”).
2 Additional Efficiency ConsiderationsThese additional efficiency considerations need to be evaluated in addition to the spectrum efficiency metric so that a comprehensive determination of the satellite system efficiency is properly made.
2.1 Antenna SizeSatellite system user value is enhanced when the size7 of the antenna is reduced. There is a correlation, however, between user antenna size and the spectrum efficiency metric. Within certain limits, increasing the antenna size, and hence decreasing user value, will allow greater spectrum efficiency through the use of higher order modulations (i.e., moving from QPSK to 8PSK to 16QAM etc.). In terms of overall system optimization and user value, it is not always desirable to use the largest possible antenna sizes to achieve the greatest spectrum efficiency. Antenna size must therefore be included as an additional efficiency consideration when evaluating the spectrum efficiency metric of satellite systems.
2.2 Consumed Field of View for Geostationary Satellite SystemsA given geostationary orbital position (“orbital slot”) has a potential service field of view that is the approximate one-third of the earth’s surface that is visible from that orbital position. A satellite placed at that orbital position will be designed to use a particular portion of the
6 The spectrum efficiency will increase with frequency re-use both geographically and via dual polarization, and the proposed spectrum efficiency metric will give credit for both types of frequency re-use.7 Antenna size refers to physical aperture area for a parabolic reflector or phased array antenna, physical size for a microwave feed horn antenna, and dimensions for a dipole or other omni-directional antenna.
7
frequency spectrum to provide service to a defined service area, which will be a portion (subset) of the field of view. No other satellite placed at that same orbital position can use the same portion of the frequency spectrum to provide service to the same service area. If a second satellite is placed at approximately that same orbital position to re-use the same frequency spectrum to serve a different service area within the same field of view8, there will be a service exclusion zone surrounding the defined service area of the first satellite that cannot be served by the second satellite due to inter-system RF interference.9 The size of this service exclusion zone relative to the service area and the service field of view must therefore be included as an additional efficiency consideration when evaluating the spectrum efficiency metric of satellite systems.
2.3 Consumed Orbital Arc for Geostationary Satellite SystemsWhen a geostationary satellite at a particular orbital position (“orbital slot”) is providing service to a given service area using a portion of the frequency spectrum, there is an orbital arc exclusion range surrounding that orbital position from which no other geostationary satellite can provide service to the same service area using the same frequency spectrum due to inter-system RF interference. The size of this orbital arc exclusion range must therefore be included as an additional efficiency consideration when evaluating the spectrum efficiency metric of satellite systems. The size of the orbital arc exclusion range will be substantially greater for mobile service satellite systems, in which omni-directional antennas are employed by the user terminals, relative to fixed service satellite systems, in which narrow beamwidth antennas are employed by the user terminals.
2.4 Consumed Geographic Regions for Non-geostationary Satellite SystemsA non-geostationary satellite system will have satellites in one or more orbital planes that may or may not have rotational periods that synchronize with the earth’s rotation. Based on the orbital planes and rotational periods, some percentage of the earth’s surface will be blocked from employing co-frequency satellite communications to other non-geostationary satellite systems and geostationary satellite systems. The size of the geographic region that is consumed by a non-geostationary satellite system and unavailable for other co-frequency satellite systems must therefore be included as an additional efficiency consideration when evaluating the spectrum efficiency metric of non-geostationary satellite systems.
2.5 Responsiveness for Two-way Point-to-point Satellite SystemsIn two-way point-to-point satellite systems, user value is enhanced when response time is decreased. There is a correlation, however, between response time and the spectrum efficiency metric. Within certain limits, decreasing the response time, and hence increasing user value, will reduce spectrum efficiency by reserving a greater percentage of the spectrum for the signaling associated with dynamic spectrum resource allocation. In terms of overall system optimization and user value, it is not always desirable to cause excessively long response times to achieve the greatest spectrum efficiency. Response time must therefore be included as an additional efficiency consideration when evaluating the spectrum efficiency metric of satellite systems.8 As an example, two geostationary satellites co-located at 90° west longitude could each use the same frequency spectrum so that one satellite serves the United States and the other satellite serves Brazil.9 As an example, if a satellite has the United States as its service area, there will be a portion of southern Canada and a portion of northern Mexico that cannot be served by a co-located satellite operating in the same frequency spectrum.
8
3 Non-communication Satellite SystemsNon-communication satellite systems include a variety of non-communication applications such as navigation services, weather monitoring, earth observation, and imaging. While it would be desirable to develop a set of spectrum efficiency metrics for non-communication satellite systems similar to what has been done for communication satellite systems, in fact, non-communication satellite systems are so unique that it is the Working Group’s current opinion that it is not practical to identify a spectrum efficiency metric that would be meaningfully extensible beyond any individual non-communication service or system. Across service types, it is not practical to identify a common spectrum efficiency metric that would apply, for example, to navigation satellites, weather monitoring satellites, earth observation satellites, and imaging satellites, because these applications are so fundamentally different. Within each non-communication service type, the service definition of each system will have great impact on the service capabilities and corresponding spectrum usage. For example, in a navigation satellite system, the spectrum usage will be driven by the location precision required, specification of the cold-start acquisition time of the receivers, and the incorporation of ancillary information such as absolute time and/or frequency references. Because of the vast range of specifications that is possible for each navigation service definition, a spectrum efficiency metric for a “generic” navigation satellite system would also not be meaningful or useful. As a specific example, the service definitions for the existing and planned navigation satellite systems (GPS, Galileo, GLONASS, and BeiDou) are so different that any metric including “total spectrum consumed” is not meaningful in a comparative sense because of the differing service capabilities. The Working Group recommends, therefore, that in the case of non-communication satellite systems, the designers and implementers of these systems should be encouraged to develop an appropriate spectrum efficiency metric for their particular system and use it as a guideline in the system design and license application processes with the objective of using spectrum efficiently. The Working Group is also very interested in any university research that might provide further illumination in this area.
4 Concluding Thoughts on Metrics for Satellite SystemsIn this subsection, spectrum efficiency metrics for both broadcast and point-to-point satellite communications systems have been proposed and additional efficiency considerations have been identified and discussed. Non-communications systems and applications like navigation services (e.g., global positioning systems), meteorological (e.g., weather satellites), earth observation (e.g. ocean and earth temperature and humidity observation), and remote sensing (e.g., imaging systems) have been discussed, and given their unique nature, an individualistic approach to achieving spectrum efficiency has been proposed. Finally several areas have been identified where additional academic research would be valuable to further refine these metrics and associated considerations.
V. Spectrum Efficiency Metrics for Terrestrial Systems
To an even greater degree than the satellite systems case discussed in Section IV, terrestrial systems encompass an extremely large variety of services including non-communications services such as radar systems. For the reasons explained earlier, the Working Group was unable to identify or evaluate suitable spectrum efficiency metrics for radar systems for this version of the White Paper. The Working Group was, however, able to address spectrum efficient metrics
9
for the following classes of systems: Broadcast Systems, Personal Communications Systems, Point-to-Point Systems, and Hybrid Terrestrial Systems. Each of these four classes of systems is discussed in the subsections that follow.
The working group recognized that the Commerce Spectrum Management Advisory Committee (CSMAC) had reported definitive findings for spectrum efficiency for the systems discussed here. Therefore, the material below closely follows that work and some sections of the text have been taken directly from the CSMAC report.
1 Terrestrial Communications Systems
1.1 Terrestrial Broadcast Systems
Terrestrial Broadcast systems are similar to satellite broadcast systems in that they distribute identical content from one origination point to many reception points within the common geographic area. A broadcast system can deliver the same content to an arbitrarily large number of users within the same geographic area. Adding users does not consume any of the system capacity. As the number of users increases, the spectrum efficiency improves when compared to point-to-point systems where each additional user consumes additional spectrum. Similarly, for broadcast systems there is a tradeoff between intended coverage areas and independent usage. For example, satellite systems may achieve large coverage areas but if the signal is intended as a local signal then much of the coverage may be effectively wasted. Conversely, if large coverage is desired then land based broadcast systems may need to operate using multiple frequencies with the same information content to avoid interference issues. Broadcast systems provide multiple data sets that are individually selectable by the many recipients. This may allow a definition of efficiency based on the number of independent data sets that are available per MHz.
For broadcast systems, efficiency can be defined in terms of the served audience per amount of utilized spectrum. For a national audience, a single frequency assignment carried everywhere may well be the most efficient, thus favoring systems such as satellite. For a localized but dense audience, localized reuse of spectrum may provide the most audience coverage per bandwidth, thus favoring traditional land based broadcast. For a sparse audience, some combination of broadcast with unicast with a more cellular arrangement might actually prove the most efficient, though perhaps not the most cost-effective from an overall system point of view.
Referring to formula 1 above from ITU-R SM.1046-2B, the useful effect (M) of a television broadcast is determined by the number of users (population) able to receive the broadcast. The useful effect of a television broadcasting system would vary with the population density in different parts of the geographical area in question and the number of television programs that can be received.
ITU-R SM.1046-2 provides details on how to assess the Spectral Efficiency for television broadcasting systems. The spectral efficiency of audio broadcasting systems can be similarly derived. For our purpose here, we will use the component parameters to establish a proposal for an efficiency metric.
10
The table contained in Appendix A outlines several measures for spectrum efficiency of broadcast systems.10 They include: 1) bits/Hertz 2) bits/Hertz*km2 3) bits/Hertz*users 4) bits/Hertz*km2 * duty cycle. An additional column related to spectrum use duty cycle is also listed. The proposed spectrum efficiency metric could also include the area in square kilometers served by the same information bits per second per Hz of allocated (licensed) spectrum within each common geographical area (“bits / (second – Hz)” times the average number of users simultaneously served).
Therefore, the proposed spectrum efficiency metric per user, is: Information bits per second per Hz of allocated (licensed) spectrum within each common geographic area (“bits / second / Hz)” times the average number of users simultaneously served. Consideration does need to be given to the system capacity per area, since the number of actual users is proportional to the size of the service area for typical user densities. Capacity per service area can be increased via frequency re-use, similar to terrestrial cellular systems, so the spectrum efficiency metric should consider higher levels of frequency re-use.
1.2 Personal Communications Systems
Terrestrial personal communications systems are similar to satellite point-to-point systems discussed above. They establish many individual communication links between two points (senders and receivers) to allow information, typically digital data, to flow between those two points. Adding users does consume additional system capacity, unlike broadcast systems. For this class of service we can define spectral efficiency as: Bits per second per Hertz per unit area in a fully loaded system for a given quality of service. A problem with even this practical definition is that it still must assume what an acceptable bit error rate might be (quality of service) and, also, what an acceptable coverage level might be (since there is a relationship between coverage and levels of interference or frequency reuse).
Another difficulty with this definition is that bits per second per Hz would suggest that higher degrees of modulation would always yield more efficiency. However, frequency reuse is also impacted in multi-cell systems by interference, and in practical fact, this is the ultimate limitation on the capacity and / or performance of the system and therefore its spectral efficiency. Higher order modulation might require lower channel reuse thus yielding lower efficiency in the multi cell environment. It is possible to use smaller cell sizes to increase the metric of bps/Hz/area and perhaps appear to get higher efficiency. This approach neglects the higher cost associated with an increased numbers of cells.
Despite the above, we can define efficiency practically for this class of system using equation (1) by fixing a target cell size and computing for that cell size a net bps/Hz/area value over a sufficiently large area to encompass full frequency reuse of all assigned channels.
Following Lee’s formulation:
10 Later versions of the table will include spectrum efficiency metrics proposed for other systems.
11
Spectrum Efficiency (personal com) = info rate (bps/Hz) Occupied Area
The proposed metric is: Information bits per second per Hz of allocated (licensed) spectrum per square Km of service area (“bits / (second – Hz – sq. Km.)”). Once again, it is critical to account for an occupied area that includes a full system frequency re-use pattern in order to make fair comparisons among different systems.
1.3 Point-to-Point Terrestrial Systems
These systems have efficiency considerations that are similar to the previous category. Improved modulation schemes can achieve better use of an assigned band. Thus a simple bits/hertz/area metric can be a useful indicator. In addition, in point to point systems, higher directionality has the benefit of mitigating interference among nearby installations.
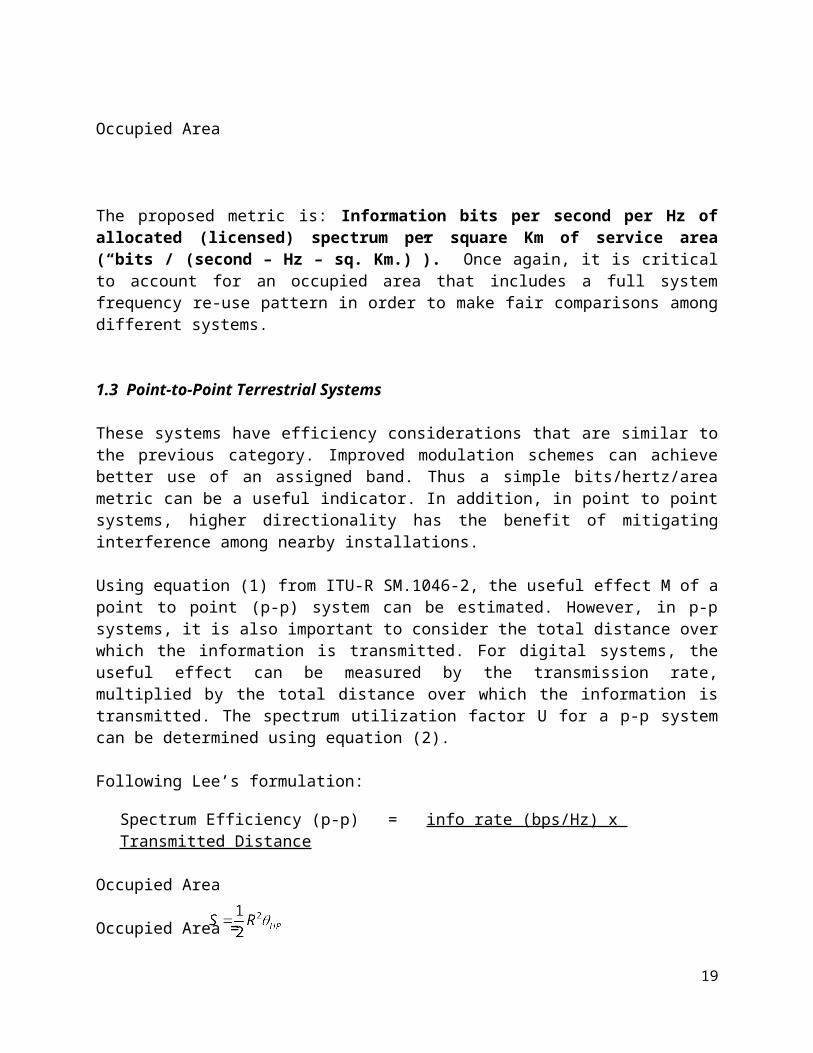
Using equation (1) from ITU-R SM.1046-2, the useful effect M of a point to point (p-p) system can be estimated. However, in p-p systems, it is also important to consider the total distance over which the information is transmitted. For digital systems, the useful effect can be measured by the transmission rate, multiplied by the total distance over which the information is transmitted. The spectrum utilization factor U for a p-p system can be determined using equation (2).
Following Lee’s formulation:
Spectrum Efficiency (p-p) = info rate (bps/Hz) x Transmitted Distance Occupied Area
Occupied Area = R : sector radius (Km) and θHP : halfpower beamwidth (rad)
The proposed metric is: (Information bits per second per Hz of allocated (licensed) spectrum) x (transmitted distance) per square Km of service area)
More details on the above parameters as well as examples of calculation of Spectral Efficiency for point to point systems can be found in ITU-R SM.1046-2. Results are sometimes expressed using the metric of number of voice channels/Hz/area for analog p-p systems and bps/Hz/area for digital p-p systems.
1.4 Hybrid Terrestrial Systems
Hybrid terrestrial systems utilize a combination of broadcast and point-to-point communications modes, typically over wide operating areas. Several other system-level considerations should be taken into account when measuring spectral efficiency for these types of systems. As mentioned above, communications systems must often meet basic user needs in a number of quality of
12
service (QoS) measures, including latency/access time, coverage/reliability, information error rates, and peak-loading requirements. Maintaining this service level or even improving it in some of these areas may have a negative impact on spectral efficiency metrics, but may be required for particular system applications. For example, mission-critical public safety systems have very rigorous QoS, coverage/reliability, and peak-loading requirements, which must be met for the system to be considered useful. Certain communications modes may have much higher QoS requirements than others (e.g., mission-critical public safety voice communications vs. consumer-grade mobile broadband internet access). Good system design practices will take these factors into account. System-level cost considerations (e.g., of backhaul, user equipment, etc.) are also important in many applications.
In general, spectrum is a limited resource with differing value based on geographic location and user density. Spectrum in densely populated urban areas is generally much more valuable than spectrum in sparsely populated rural areas. As such, it is more important to invest more resources into maximizing spectral efficiency in densely populated, high-use areas where the need for efficient spectrum use is the greatest. Maximizing spectral efficiency in sparsely populated areas generally has a lower return on investment. High spectral efficiency communications systems may be applied to low user density areas, as long as they meet all user QoS requirements, as well as any system cost constraints. Note that some communications systems (e.g., public safety, utility systems) must cover large geographic areas even though few active users may typically exist per square kilometer. Such systems should not be unduly penalized in any spectral resource optimization attempt.
Since the class of public safety / utility communications systems have many distinct requirements in the above areas, an independent public safety / utility (i.e., public good) system class is proposed to measure their spectral efficiency levels. Public good systems are typically more performance driven than revenue and throughput driven in nature (as compared to commercial cellular systems, that attempt to deliver the largest number of bits per unit area 11 in order to serve typically large numbers of users). Public good systems may need to cover large areas with very high reliability,12 and may have very high peak-loading requirements (requiring significant over-resourcing of communications capability).13
In many respects, the public safety / utility class of communications has similarities to broadcast and satellite communications (covering multiple users or groups over large geographic areas for most communications). Similar to terrestrial broadcasting systems, as the number of users increases, the spectrum efficiency improves when compared to point-to-point systems where each additional user consumes additional spectrum. Thus, a spectral efficiency metric similar to those discussed in ITU-R SM.1046-2 is proposed: Information bits per second per Hz of allocated (licensed) spectrum over the geographic area served “(info bits / second / Hz) * km2” times the average number of users simultaneously served. Note that this metric directly
11 The metric proposed above for personal communications systems (“Information bits per second per Hz of allocated (licensed) spectrum per square Km of service area”) is equivalent to a bits per unit area measure.12 For example, mission-critical public safety systems generally have at least 95% coverage reliability requirements with less than 3% bit error rates over those areas.13 For example, public safety systems generally require at least a 15:1 peak to average communications capacity (i.e., having 15 times the user capacity available for emergency situations compared to average communications needs) with less than 1% call/access blocking probability.
13
takes into account the number of users served in each possible communications mode (whether it be broadcast messaging, talk-group messaging, or individual communications). Most public safety / utility systems utilize a mix of these different communications modes, with a bias towards group communications. The same mix of communications modes should be used whenever comparing different communications systems for spectral efficiency. Also note that if a particular system solution does not meet the user QoS requirements discussed above, it is not generally useful and should be removed from consideration. Therefore, the QoS requirements form a hard constraint on system viability, regardless of the underlying communication system’s spectral efficiency levels.
VI. Further Thoughts Relating to Spectrum Efficiency Metrics
1 Factors Impacting on Spectrum Utilization
While from the outset the Working Group recognized that spectrum efficiency necessarily requires consideration of both the transmitting and receiving portions of a wireless system as well as the interaction between the two, most of the initial emphasis was on transmitters. Evaluation metrics, to be truly useful, must consider the entire end-to-end system since both transmitters and receivers use spectrum resources. Communications systems can deny the use of part of the spectrum to another system that would cause interference to, or experience from, the first system. Basically, a system consumes spectrum resources when it denies other systems the efficient and effective use of those resources.
The importance of the receiving portion of a wireless system can perhaps be best seen through an example. Imagine an ideal world in which a transmitter only occupies a single 10 MHz channel (i.e., there is no “spillover” into adjacent channels due to the use of “brickwall filters”) and further assume that the transmitter is achieving a very high level of spectrum efficiency (as measured in bits/second/Hz) in that channel. Now imagine that the distant receiver associated with the transmitter is of poor design and is unable to reject signals that occupy the adjacent 10 MHz channels on either side of the channel actually occupied by the transmitter (i.e., the desired channel). In this example, the relevant measure of the spectrum actually being consumed is not 10 MHz, rather it is 30 MHz. Viewed in this manner, the actual spectrum efficiency is much less than that calculated considering the transmitter characteristics alone.
More generally, there are several items that should be considered when evaluating spectrum utilization efficiency14 and which may be worthy of further study, perhaps in an academic research environment. As noted above, the amount of spectrum that is consumed by a radio system such that it is not available for other radio systems (i.e., the spectrum utilization factor15) is a function of both the transmitter and receiver performance. When determining the spectrum utilization factor, therefore, a complete radio system view including both the transmitters and receivers must be undertaken.
A given radio system including both transmitters and receivers may only utilize portions of the spectrum as opposed to completely consuming the spectrum. Three examples of instances where
14 “Spectrum Utilization Efficiency” is defined in section 2 of Annex 1 of ITU Recommendation ITU-R SM.1046-215 “Spectrum Utilization Factor” is defined in section 2 of Annex 1 of ITU Recommendation ITU-R SM.1046-2.
14
spectrum can be partially consumed are guard bands, spread spectrum modulation, and complex, higher order modulation schemes. In the case of guard bands, the practical limits of filter rolloff in the receivers will likely require some mitigated spectrum use in the immediately adjacent guard bands, but it may be possible to partially load the guard bands with “quieter” less interfering competing radio systems. In the case of spread spectrum modulation, by the nature of spreading carriers across a substantially greater bandwidth than theoretically necessary to support the information content, the occupied spectrum becomes partially loaded but can support, up to certain limits, additional spread spectrum carriers and/or standard, un-spread carriers from competing radio systems. In the case of radio systems using higher order modulation with high complexity, these systems require especially high signal-to-noise ratios that may make them particularly sensitive to emissions from competing radio systems in nearby geographic areas and/or adjacent spectrum. As a consequence, when determining the spectrum utilization of a given system, consideration must be given to any instance in which spectrum is partially consumed.
In certain types and architectures of radio systems, additional spectrum-related resources beyond the standard resources of frequency bandwidth, geographic area, and time may be consumed. Two such examples are orbital arc range consumed by a geostationary satellite system and spectrum available for aircraft at various altitudes consumed by a terrestrial radio system. When the spectrum utilization of a particular type of radio system is evaluated, consideration must also be given to additional spectrum-related resources that are of value to radio systems and may also be consumed.
As discussed above, there are several figures of merit associated with a radio system that can be enhanced in a manner that may cause a reduction in spectrum efficiency. These figures of merit include cost, physical size of the radio unit, physical size of the antenna, and QoS performance parameters such as bit error rate and response latency in multiple access systems. It may be the case in certain radio systems that some combination of cost reduction, size reduction, and performance improvement can be achieved along with a necessary reduction in spectrum efficiency. The impact of improving spectrum efficiency on these related figures of merit needs to be considered in making a comprehensive evaluation of the radio system.
2 Spectrum Sharing Experience in US FCC History
The US FCC has considerable experience in authorizing the sharing of the same spectrum among different applications and users via various sharing mechanisms. These sharing mechanisms generally fall into the following categories:
● Separation in frequency: One user operating near to another selects a noninterfering frequency for transmission, and incorporates sufficient filtering to reject transmissions by the other.
● Separation in time: One user operating near to another on an interfering frequency avoids transmitting at the same time as the other.
● Separation in space – static: Spectrum is re-assigned to different users operating with enough geographic separation to avoid interference among users (e.g., re-assigning the same broadcast television channel in different cities).
15
● Separation in space – dynamic: One user, operating on a frequency that would cause interference to another, avoids transmitting when near to the other.
● Separation in the receiver: One user, operating near another on an interfering frequency, selects a waveform that enables the receiver to correctly receive the desired signal despite interference from the undesired signal.
● Operational coexistence approaches: Users employ a range of coordination mechanisms among themselves for preventing interference or resolving it when it arises.
The Working Group felt it would be useful to develop a reference table of specific examples of successful sharing using these mechanisms so that it could be used as a basis for enhancing spectrum efficiency in the future by stimulating additional sharing via similar techniques. Appendix B contains this sharing experience reference table, although we have chosen not to include examples of “separation in space – static” since this sharing mechanism is relatively straightforward, well understood, and has been widely employed since the earliest days of radiocommunications.
In the future, the Working Group hopes to analyze (or support the analysis of others) the past experience presented in the Appendix B reference table in more detail and provide guidance to assist in future efforts to establish greater spectrum sharing. Additionally, the Working Group hopes to use that guidance to identify specific bands and services the Commission should investigate more closely when seeking to increase spectrum sharing.
3 Case Studies Illustrating the Importance of Receiver Performance
As the Working Group delved into its work and developed a more nuanced view of the factors that impact spectrum utilization and, in particular, the role of receiver performance, it recognized the close relationship between two of the focus topics that the group had been tasked to address: spectrum efficiency and receiver standards / guidelines or performance. As part of its efforts to address the latter – receiver performance – the Working Group developed a draft paper entitled “Case Studies: The Role of Receiver Performance in Promoting Efficient Use of the Spectrum.” The paper, included here as Appendix C, summarizes a number of recent examples where receiver performance was a significant issue affecting access to spectrum for new services. It proposes an in-depth study, perhaps by an appropriate academic institution, of the current spectrum allocation table focusing on established guard bands and the characteristics of the receivers associated with existing band edges thus contributing to a better understanding of the possible scope for spectrum reallocation, compaction and sharing.
VII. Summary and Conclusions
Spectrum efficiencies achieved by wireless systems must improve dramatically in general if the Nation is to accommodate rapidly increasing demand for the resource
Unfortunately there is no single measure of spectrum efficiency that can be applied across all services
16
Such metrics have been developed that allow efficiency comparisons across a variety of satellite and terrestrial based systems categories
These metrics can play an important role in analyzing and comparing similar systems (e.g., as in bps/Hz/sq. km. in the case of personal communications systems)
In carrying out its work, the Sharing Working Group recognized that, while spectrum efficiency is critically important, it is only one of the factor to be considered in making spectrum management decisions. A variety of system figures of merit including user QoS requirements (e.g., bit error rate, response latency in multiple access systems, and peak-to-average loading ratios), size (e.g., physical size of the radio unit and the antenna), and cost must also be met for a system to be useful.
Based upon a review of prior work, the Sharing Working Group focused its initial analytical attention on six classes of systems: Satellite Broadcast Systems, Point-to-Point Satellite Systems, Terrestrial Broadcast Systems, Terrestrial Personal Communication Systems, Terrestrial Point-to-Point Systems and Hybrid Terrestrial Systems
For each of these six classes, the Sharing Working Group developed and discussed a proposed spectrum efficiency metric and sample calculations are supplied for each metric; in doing so, because of the makeup of the Sharing Working Group, it was able to make particularly strong progress in the satellite category
The Sharing Working Group was unable, at least at this time, to identify and develop a suitable spectrum efficiency metric for radar systems, unlicensed systems, and terrestrial and satellite receive only observation systems, but it intends to continue to work on these systems as well as other system classes not addressed in this report
General References:A. Commerce Spectrum Management Advisory Committee (CSMAC), Working Group 1 “Definitions of Efficiency In Spectrum Use”, October 1, 2008 (Available at: http://www.ntia.doc.gov/advisory/spectrum/meeting_files/Spectral_Efficiency_Final.pdf)B. Rec. ITU-R SM.1046-2, "Definition of spectrum use and efficiency of a radio system," 2006 (Available at: http://www.itu.int/rec/R-REC-SM.1046-2-200605-I/en)C. Sang Yun Lee, “Frequency Use Status Investigation and Spectrum Utilization Metric” June 2, 2008D. NTIA Report 94-311, R.J. Matheson “A Survey of Relative Spectrum Efficiency of Mobile Voice Communication Systems”, July 1994E. Dag Åkerberg, “What is spectral efficiency?” January 2005
17
Appendix A: Spectrum Efficiency Metrics -- Taxonomy
18
Appendix B: Examples of Spectrum Sharing in the US
19
20
21
22
Appendix C
Case Studies: The Role of Receiver PerformanceIn Promoting Efficient Use of the Spectrum
Spectrum Management has generally focused on transmissions. The radio spectrum is allocated among various radio services as reflected in the Table of Frequency Allocations. Transmitters are subject to requirements to ensure they operate within the spectrum allocated for that service and any out-of-band and spurious emissions that might fall outside the spectrum allocated for that service are carefully controlled to minimize the risk of harmful interference to other services. One might assume that receivers abide by the same principles as the transmitters, in other words, that they only receive transmissions within the spectrum allocated for the service in which they are designed to operate. However, often that is not the case and receiver performance can dramatically affect access to and efficient use of the spectrum.16
This Appendix summarizes a number of examples of situations where receiver performance was a significant issue affecting access to the spectrum for new services. It is not intended to parcel responsibility among the various players in each case, but rather to illustrate the nature of the problem in order to develop better ways to prevent or address similar situations in the future. Some of these examples are well-known and long-standing problems that have been dealt with in various ways, such as guard bands or geographic separation, but usually at the expense of some use of the spectrum that would be possible if receiver performance were better.
Many of the potential issues relative to receiver performance and interference between services operating in adjacent spectrum might be avoided through more appropriate placement on the spectrum chart. For example, it is good practice to keep services relying on reception of weak signals in adjacent bands or high-power services in adjacent spectrum. However, services generally cannot be rearranged on the spectrum chart by simply picking them up and moving them to new bands. Often, new services must be placed snuggled into the spectrum space that is available at the time of introduction for the service. This is where the issue of receiver performance that anticipated one type of neighbor and now must deal with a new one comes into play.
Case Studies:
A) The Wireless Communications Service (WCS) was created in 1996 and included 15 MHz spectrum blocks located above and below the Satellite Digital Audio Radio Service (SDARS). The WCS allocation allowed for mobile service, but the technical rules for out-of-band emissions were impractical for mobile devices. After many years of attempting unsuccessfully to deploy a successful business model based on fixed service, the WCS licensees petitioned for rule changes to facilitate mobile service. The performance of the SDARS receivers was one of the critical areas of
16 For purposes of this discussion, receiver performance refers to the characteristics that affect the ability to reject harmful interference such as front-end filtering and not to characteristics that are effectively addressed in the marketplace such as voice or picture quality, data throughput, reliability, etc.
23
contention.17 The receivers had been designed assuming only fixed operations in the adjacent bands and therefore did not anticipate a need for strong filtering of signals in nearby adjacent spectrum. As a result, the prospects of overload interference to legacy SDARS receivers from mobile devices required application of strict technical rules and effectively created 5 MHz guard bands on each side of the SDARS spectrum.
B) The 3650-3700 MHz (50 megahertz) band was re-allocated from Federal government usage (military radars) to non-Federal use in order to meet the requirements of the 1993 budget act. This spectrum was also allocated to the fixed satellite service which had approximately 60 receive sites that could not be relocated to other spectrum. The satellite C-band downlink operates in the upper adjacent spectrum at 3700 – 4200 MHz. An issue that surfaced in the FCC rule making proceeding was that many C-band satellite earth station receivers had front ends extending well into the 3650 – 3700 MHz band. While the FCC deemed the interference risk low due to the directional nature of the satellite service and the anticipated predominant fixed use of this spectrum, the issue risked the possibility of rendering much of this federal transferred spectrum useless.18
C) Receiver performance was a major area of contention relative to potential use of the AWS-3 spectrum.19 The AWS-3 spectrum is upper adjacent to the AWS-1 spectrum. A petition was filed to use the AWS-3 spectrum for time-division duplex operation. However, the AWS-1 receivers were generally designed to operate across the AWS-3 spectrum consistent with international allocations. Incumbent AWS-1 licensees argued that the receivers were not the issue, but rather that TDD operations must not be permitted to operate adjacent to downlink FDD spectrum without a significant guard band. The potential use of the AWS-3 spectrum remains under consideration.
D) The AWS-1 downlink spectrum at 2110 – 1155 MHz is upper adjacent to the broadcast auxiliary service (BAS) band at 2025 – 2110 MHz. AWS-1 licensees were required as the newcomers to coordinate with and correct any harmful interference to
17 See Report and Order and Second Report and Order in WT Docket No. 97-293, IB Docket No. 95-91, and GEN Docket No. 90-35, In the Matter of Amendment of Part 27 of the Commission’s Rules to Govern the Operation of Wireless Communications Services in the 2.3 GHz Band and Establishment of Rules and Policies for the Digital Audio Radio Satellite Service in the 2310-2360 MHz Frequency Band at http://hraunfoss.fcc.gov/edocs_public/attachmatch/FCC-10-82A1.doc18 See Memorandum Opinion and Order in ET Docket No. 04-151, WT Docket No. 05-96 and ET Docket 02-380,In the Matter of Wireless Operations in the 3650 – 3700 MHz band, at paras.56-60, http://hraunfoss.fcc.gov/edocs_public/attachmatch/FCC-07-99A1.doc. See also NTIA Report 94-313Analysis of Electromagnetic Compatibility between Radar Stations and 4 GHz Fixed Satellite Earth Stations discussing solution of satellite receiver overload through use of filtering, http://www.its.bldrdoc.gov/pub/ntia-rpt/94-313/94-313.pdf19 See Notice of Proposed Rule Making in WT Docket No. 07-195 In the Matter of Service Rules for the 2155 – 2175 MHz band, at pars. 61 – 63, http://hraunfoss.fcc.gov/edocs_public/attachmatch/FCC-07-164A1.doc
24
the BAS operations.20 The AWS-1 band had previously been used for the fixed microwave service and so the BAS equipment had not been designed with sharp filters. As a result, AWS-1 operations were found to cause harmful interference to BAS, requiring the AWS-1 licensees to pay to purchase new filters for the BAS equipment.
E) TV Receiver performance was a significant issue for the access of unlicensed devices to the TV White Spaces. The roll-off of the TV filters is the dominant factor limiting the amount of energy that a TV White Space device may emit in the white space and therefore the potential applications for the devices.21 The issue is pending under reconsideration.
F) The performance of analog TV Receivers was a major factor in the creation of white spaces. Certain combinations of channels known as the UHF taboos were not permitted in any given market due to receiver performance issues. Interestingly, the Commission in the early 1970’s contracted with RF Monolithics to develop a TV receiver that would avoid the need for all or most of the taboos.22 However, though the contracted work was successful, no changes came of this project. DTV receivers were assumed to no longer have this need based on the established policies and the Commission did not apply the protections for the UHF taboos. This would be an excellent candidate for an academic case study.
G) Other issues have occurred through the years relative to TV receivers and services operating in adjacent spectrum: Amateur radio service operations at 50 – 54 MHz interfering with TV receiver on channel 2 at 54 – 60 MHz; mutual interference between TV and FM broadcast at the intersection between channel 6 and the FM broadcast band (largely ameliorated by using only a minimal number of DTV channel allotments on channel 6); interference from services operating in the spectrum at 216 – 220 MHz to TV channel 13 at 210 – 216 MHz; land mobile sharing in 11 major cities operating on TV channels 14 – 20; TV channel 51 operations adjacent to 700 MHz A block mobile wireless licensees -- CTIA has filed a petition asking the Commission not to assign any further TV stations to channel 5123; Garage door opener controls operating on Part 15 of the FCC rules on an unlicensed, non-
20 See Report and Order in WT Docket no.02-153 In the Matter of Service Rules for Advanced Wireless Services in the 1.7 GHz and 2.1 GHz bands at http://hraunfoss.fcc.gov/edocs_public/attachmatch/FCC-03-251A1.doc at paras. 127 - 130.21 See generally Second Memorandum opinion and Order in ET Docket No. 04-186 and ET Docket No. 02-380 In the Matter of Unlicensed Operation in the TV Broadcast Bands and Additional Spectrum for Unlicensed Devices below 900 MHz and in the 3 GHz Band, http://hraunfoss.fcc.gov/edocs_public/attachmatch/FCC-10-174A1.doc22 See http://ieeexplore.ieee.org/Xplore/login.jsp?url=http%3A%2F%2Fieeexplore.ieee.org%2Fiel5%2F5%2F31319%2F01456751.pdf%3Farnumber%3D1456751&authDecision=-20323 On March 15, 2011, CTIA - the Wireless Association (CTIA) and the Rural Cellular Association (RCA) submitted a “Petition For Rulemaking and Request for Licensing Freezes” RM-11626, wherein they requested certain actions to limit TV broadcasting on channel 51. The Commission on August 22, 2011 issued a public notice announcing a freeze on the filing and processing of applications for operation on TV channel 51. See http://transition.fcc.gov/Daily_Releases/Daily_Business/2011/db0822/DA-11-1428A1.doc
25
interference basis receiving interference from primary federal land mobile radio systems that could not be remedied easily because the garage door opener controls used super-regenerative receivers with front ends up to 10 MHz wide.24
H) Receiver performance relative to adjacent channel and intermodulation characteristics was a major element in the issue of rebanding the 800 MHz spectrum to avoid interference between Nextel and Public Safety operations on interleaved channels.25
I) LightSquared’s proposed deployment of ancillary terrestrial component (ATC) base stations as part of a hybrid terrestrial – satellite service has raised significant concerns about potential harmful interference to the GPS service operating in the upper adjacent spectrum due to the potential for receiver overload.26 GPS receiver performance has been raised as one of the elements in this debate. The FCC has not reached any conclusions on the merits nor made any decision on how to proceed in this matter. The issue of overload interference to Inmarsat from L-band ATC operations was addressed by establishing minimal guard bands for certain safety operations and advising that the Commission does not regulate the susceptibility of receivers to interference from transmissions on nearby frequencies. Rather, the Commission relies on the marketplace – manufacturers and service providers – to decide how much susceptibility to interference will be acceptable to consumers. The Commission noted that it generally does not limit one party’s ability to use the spectrum based on another party’s choice regarding receiver susceptibility.27
It is noted that universities (graduate students) might be a low cost means by which the FCC could obtain an in-depth study on the current spectrum allocation table focusing on the review of the established Guard Bands and the examination of the characteristics of the receivers associated with each of the identified “bands of interest” to determine the acceptable specifications for transmitters given the receiver characteristics in neighboring bands. This study would be enormously valuable in understanding the full scope of the opportunity for spectrum re-allocation, compaction and sharing, and in parallel might serve as an excellent learning vehicle for appropriate graduate programs. As with the rest of the Spectrum Efficiency effort, full Working Group and full TAC input on the development of appropriate company and academic R&D incentives for the creation of ever improving receiver offerings is solicited.
24 See Consumers May Experience Interference to Their Garage Door Openers Near Military Bases, February 15, 2005, http://fjallfoss.fcc.gov/edocs_public/attachmatch/DA-05-424A1.doc25 See Report and Order, Fifth Report and Order, Fourth Memorandum Opinion and Order and Order in WT Docket No. 02-55, ET Docket No. 00-258, In the Matter of Improving Public Safety Communications in the 800 MHz band, http://www.800ta.org/content/fccguidance/FCC_04-168_08.06.04.pdf26 See http://licensing.fcc.gov/cgi-bin/ws.exe/prod/ib/forms/reports/related_filing.hts?f_key=-216679&f_number=SATMOD201011180023927 See Memorandum Opinion and Order and Second Order on Reconsideration in IB Docket No. 01-185, In the Matter of Flexibility for Delivery of Communications by Mobile Satellite Service Providers in the 2 GHz band, the L-band, and the 1.6/2.4 GHz bands, at paras. 51-59, http://hraunfoss.fcc.gov/edocs_public/attachmatch/FCC-05-30A1.pdf
26