Embed Size (px)
Citation preview

Technological change and the future of work
Issu
es p
aper
A
pril
201
9

The Productivity Commission aims
to provide insightful, well-informed
and accessible advice that leads to
the best possible improvement in
the wellbeing of New Zealanders.
We want to gather ideas, opinions,
evidence and information to ensure
that this inquiry is well-informed and
relevant. The Commission is seeking
submissions on the questions
contained in this paper by
5 June 2019.

Technological change and the future of work Issues paper – April 2019

The New Zealand Productivity Commission
Te Kōmihana Whai Hua o Aotearoa1
The Commission – an independent Crown entity – completes in-depth inquiry reports on topics
selected by the Government, carries out productivity-related research, and promotes
understanding of productivity issues. The Commission aims to provide insightful, well-informed
and accessible advice that leads to the best possible improvement in the wellbeing of New
Zealanders. The New Zealand Productivity Commission Act 2010 guides and binds the
Commission.
You can find information on the Commission at www.productivity.govt.nz or by calling
+64 4 903 5150.
How to cite this document: New Zealand Productivity Commission (2019) Technological change
and the future of work: Issues Paper. Available from www.productivity.govt.nz
ISBN: 978-1-98-851930-2 (print) ISBN: 978-1-98-851931-9 (online)
This copyright work is licensed under the Creative Commons Attribution 4.0 International
License. In essence you are free to copy, distribute and adapt the work, as long as you attribute
the source of the work to the New Zealand Productivity Commission (the Commission) and abide
by the other license terms.
To view a copy of this license, visit www.creativecommons.org/licenses/by/4.0/. Please note that
this license does not apply to any logos, emblems, and/or trademarks that may be placed on the
Commission’s website or publications. Those specific items may not be reused without express
permission.
Inquiry contacts
Administration Robyn Sadlier
T: (04) 903 5167
Other matters Judy Kavanagh
Inquiry Director T: (04) 903 5165 E: [email protected]
Website www.productivity.govt.nz
Twitter @nzprocom
Linkedin NZ Productivity Commission
1 The Commission that pursues abundance for New Zealand
Disclaimer
The contents of this report must not be construed as legal advice. The Commission does not accept any responsibility or liability for an action taken as a result of reading, or reliance placed because of having read any part, or all, of the information in this report. The Commission does not accept any responsibility or liability for any error, inadequacy, deficiency, flaw in or omission from this report.

Contents
The issues paper i
Key inquiry dates ................................................................................................................... i
Contacts ................................................................................................................................. i
Making a submission ............................................................................................................ i
What the Commission will do with submissions ................................................................ ii
Other ways to participate .................................................................................................... ii
1 Approach to the inquiry 1
Technological change, productivity and living standards ................................................ 1
Two broad questions for the inquiry .................................................................................. 3
How the Commission can add value .................................................................................. 3
2 Technology and the labour market 5
How does technological change affect the labour market? ............................................. 5
Technological change benefits many, but not all ............................................................. 9
The impacts of technology depend on choices and capabilities ................................... 10
3 Looking to the future 11
Predicting the impact of technology on the future of work ........................................... 11
The impact of other factors on the future of work is uncertain ...................................... 13
Scenarios are a useful tool for dealing with uncertainty ................................................. 14
The four scenarios .............................................................................................................. 15
Policy goals for wellbeing and the future of work ........................................................... 18
4 Labour market policies and institutions 20
Employment protections ................................................................................................... 20
Income support .................................................................................................................. 25
Active labour market policies ............................................................................................ 29
Occupational regulation .................................................................................................... 31
5 Education and skills supply 32
Outcomes and performance of New Zealand’s skills system ......................................... 32
Skills supply from immigration .......................................................................................... 35

People with very low skills ................................................................................................. 36
Disjunct between education and employment ............................................................... 38
Other impacts of future scenarios on skills supply and demand ................................... 42
6 Firm and economic policies 43
Innovation and capability levels within New Zealand firms ............................................ 43
What might account for these results? ............................................................................. 47
What could be done to boost innovation levels in NZ firms? ........................................ 48
Summary of questions 53
References 57
Terms of reference 68

The issues paper i
The issues paper
This issues paper aims to assist individuals and organisations to participate in the inquiry. It
outlines the background to the inquiry, the Commission’s intended approach, and the matters
about which the Commission is seeking comment and information.
This paper contains specific questions to which responses are invited. Participants should choose
which questions are relevant to them. The questions are not intended to limit comment. The
Commission welcomes information and comment on all issues that participants consider relevant
to the inquiry’s terms of reference.
Key inquiry dates
Due date for submissions on issues paper: 5 June 2019
Release of draft reports: August – November 2019
Submissions on draft reports: December 2019
Final report to Government: 31 March 2020
Contacts
For further information about inquiry contacts, please see page ii.
Making a submission
The Commission aims to provide insightful, well-informed and accessible advice that leads to the
best possible improvement in the wellbeing of New Zealanders. Submissions help the
Commission to gather ideas, opinions and information to ensure that inquiries are well-informed
and that its advice is relevant, credible and workable.
Submissions will help shape the nature and focus of this inquiry. Inquiry reports may cite or
directly incorporate relevant information from submissions. There will be an opportunity to make
further submissions in response to subsequent reports published throughout the duration of this
inquiry.
Anyone can make a submission. It may be in written, electronic or audio format. A submission
can range from a short note on a single issue to a more substantial document covering many
issues. Please provide supporting facts, figures, data, examples and documentation where
possible. Every submission is welcome; however, identical submissions will not carry any more
weight than the merits of the arguments presented. Submissions may incorporate relevant
material provided to other reviews or inquiries.
Submissions may be lodged at www.productivity.govt.nz/make-a-submission. A searchable PDF
format is preferred. Submissions should include the submitter’s name and contact details, and
the details of any organisation represented. The Commission will not accept submissions that, in
its opinion, contain inappropriate or defamatory content.

ii Issues paper | Technological change and the future of work
What the Commission will do with submissions
The Commission seeks to have as much information as possible on the public record.
Submissions will become publicly available documents on the Commission’s website shortly after
receipt unless accompanied by a request to delay release for a short period.
The Commission is subject to the Official Information Act 1982 and can accept material in
confidence only under special circumstances. Please contact the Commission before submitting
such material.
Other ways to participate
The Commission welcomes engagement on its inquiries. Please telephone or send an email to
arrange a meeting with inquiry staff.

Approach to the inquiry 1
1 Approach to the inquiry
The Government has asked the Productivity Commission to conduct an inquiry into how
New Zealand can maximise the opportunities and manage the risks of disruptive technological
change and its impact on the future of work and the workforce.
Technological change, productivity and living standards
Technology adoption drives growth in productivity and living standards
By improving the efficiency and effectiveness through which goods and services are produced
and by creating new and better options, technological change:
has been one of the most potent forces in history in that has provided society with what
economists call a ‘free lunch’, that is, an increase in output that is not commensurate with
the increase in effort and cost necessary to bring it about. (Mokyr 1992, p. 3)
One important result of rapidly growing output has been increasing incomes for workers and
their families. In New Zealand, real per-capita incomes increased around fourfold between 1916
and 2016 (Figure 1.1).
In addition to increasing output and incomes, technological change has freed people from
onerous or physically-demanding work, especially in agriculture. And, across the developed
world, technological improvements in agriculture (eg, fertiliser, tractors, selective breeding,
cropping methods) led to dramatic falls in the share of the workforce employed in the primary
sector, while production grew. This share of the workforce in New Zealand fell from 36% in 1901
to 7% in 2013. Over time, workers moved to new and expanding opportunities in other sectors,
particularly services (Figure 1.2).
Box 1 Technological change and disruption: definitions
Technological change is the overall process of invention, innovation and diffusion of
technology or processes.
Technological disruption is “the advent of a new or existing technology that is used and/or
created in such a way that it renders the incumbent firm obsolete, over years or decades.
Often it is the business model, rather than the technology itself disturbing the existing
market or value network, creating new markets in its wake” (Sullivan 2015). Rapid or
widespread disruptive change is likely to impose significant adjustment costs for many
firms, for their employees, for households and the entire economy.

2 Issues paper | Technological change and the future of work
Figure 1.1 Real per-capita incomes in New Zealand, 1859-2018
Figure 1.2 Composition of the New Zealand workforce, 1900-2018
Source: NZIER (2018) based on Stats NZ data.
Change creates costs for some
While technological change brings significant overall benefits, it also creates frictions and costs
for particular groups in society. As Acemoglu and Robinson note, “sustained economic growth
requires innovation, and innovation cannot be decoupled from creative destruction, which
replaces the old with the new in the economic realm” (2013, p. 430). This ‘replacement of the old’
involves the devaluation of prior investments in machinery and skills, leaving the owners of older
equipment and workers who used it worse off. For some, these costs can be severe.
Successful societies manage these transitions well
Sustaining innovation and productivity growth depends on managing the costs of transitions on
individuals and their families, and ensuring that people are not left behind by technological
change. Governments have choices in the policy settings they adopt to manage these costs. In
$ 0
$10 000
$20 000
$30 000
$40 000
$50 000
$60 000
1860 1890 1920 1950 1980 2010
0%
10%
20%
30%
40%
50%
60%
70%
80%
90%
100%
1900 1910 1920 1930 1940 1950 1960 1970 1980 1990 2000 2010
Services
Goods-producing
Primary

Approach to the inquiry 3
setting these policies it is important to be aware of both current and possible future impacts of
technological change. These include
the pace of technological change and the nature of its impact on work – eg, ongoing and
incremental or radical and disruptive;
what the next step in New Zealand’s economic path might be, after the bulk of economic
activity and employment has shifted progressively towards the services sector; and
how the benefits of technological improvements can be best distributed.
Two broad questions for the inquiry
The inquiry Terms of Reference (TOR) pose two broad questions for this inquiry.
What are the current and likely future impacts of technological change and disruption on the
future of work, the workforce, labour markets, productivity and wellbeing?
How can the Government better position New Zealand and New Zealanders to take
advantage of innovation and technological change in terms of productivity, labour-market
participation and the nature of work?
In examining the first question, the Commission is conscious that it is very difficult to predict how
technology will develop, even in the short-term, and believes that it would not be useful to
predict a single future and offer corresponding policy advice. Rather, this inquiry will develop
illustrative scenarios that could play out in the near future.
To address the second question, the Commission will examine policies designed to address
concerns about the availability and nature of work, and other policies that better position
New Zealand to take advantage of innovation and technological change. The Commission will
assess policies against each scenario. Policies that work in all scenarios might be unconditionally
recommended, while others might be conditional on a particular scenario eventuating.
How the Commission can add value
The Commission has just over a year to conduct this inquiry. This timeframe affords the
opportunity to consult widely, to consider a diverse range of issues relevant to the future of work,
and to develop recommendations that will help New Zealand navigate an uncertain future.
The inquiry will draw on a substantial amount of research, both in New Zealand and
internationally, on technological change and its impact on work. The TOR notes that this inquiry
should build on previous work undertaken by the Commission, as well as other policy work being
undertaken by groups such as the AI Forum and the OECD. Box 2 provides a summary of some
current New Zealand policy initiatives relevant to technological change and the future of work.
Box 2 Recent research and policy initiatives in New Zealand
The Future of Work Tripartite Forum is composed of the Government, Business
New Zealand, and the Council of Trade Unions. It aims to jointly shape the policies needed
to equip workers and business for a rapidly changing nature of work. The Forum’s work

4 Issues paper | Technological change and the future of work
Drawing on feedback from inquiry participants, the Commission plans to publish an initial report
in mid-2019 that will examine the process by which technology diffuses through the New Zealand
economy and how it can affect and change the labour market. The report will also consider how
government has responded to technological change in the past and discuss the broad approach
government should adopt in preparing for an uncertain future. This will be followed later in the
year by three short reports covering important policy areas: labour market policy settings;
education and training; and firm and economy-wide policies for innovation. There will be
opportunity for interested parties to provide feedback on these reports, either individually or
collectively, before the Commission delivers a final report to referring Ministers in March 2020.
programme covers ‘just transitions’ (eg, to a low-emissions economy); learning for life;
technology adoption; and workplace productivity (Future of Work Tripartite Forum 2018).
The Fair Pay Agreement Working Group was set up in June 2018 to make
recommendations on the design of a sector-level bargaining system. It recommended that
workers and their union representatives should be able to initiate sector-level bargaining
provided that one of two trigger-points is met, with all workers in the defined sector or
occupation covered by the agreement (Fair Pay Agreement Working Group 2018).
The Welfare Expert Advisory Group was established in 2018 to undertake a broad-
ranging review of the welfare system and to deliver advice to the Government to ensure
people have an adequate income and are able to participate meaningfully in their
communities (Sepuloni 2018). As at April 2019, the Advisory Group’s report was being
considered by the Government.
The proposed Reform of Vocational Education recommends merging New Zealand’s
16 Institutes of Technology and Polytechnics into a single provider. It also proposes the
establishment of ‘Industry Skills Bodies’, which would set skill standards that providers must
meet and provide advice on industry needs (Ministry of Education 2019).
The review of Tomorrow’s Schools is examining the governance, administration and
management of the schooling system. The review proposes major changes including a re-
orientation of the role of school boards of trustees, and the introduction of ‘Education
Hubs’ – Crown Entities that would assume some responsibilities currently held by school
boards (Tomorrow’s Schools Independent Taskforce and Ministry of Education 2018).
The AI Forum is a non-government organisation that seeks to raise the level of awareness
and capabilities of AI in New Zealand. The Forum (2018, p. 15) did not support the view
that AI will have a major negative impact on jobs at the aggregate level, but noted the
importance of appropriate supports for displaced workers:
Widespread adoption of AI could take 20–40 years until it is expected to fully impact
employment patterns. During that time natural changes in the labour market will be
significantly larger than any expected impact from AI and existing labour market
support policies should be able to cope … However, we anticipate significant impacts
… for the individual workers affected. Government and industry must collaborate to
maintain support structures for technologically displaced workers.
Technology and the labour market 5
2 Technology and the labour market
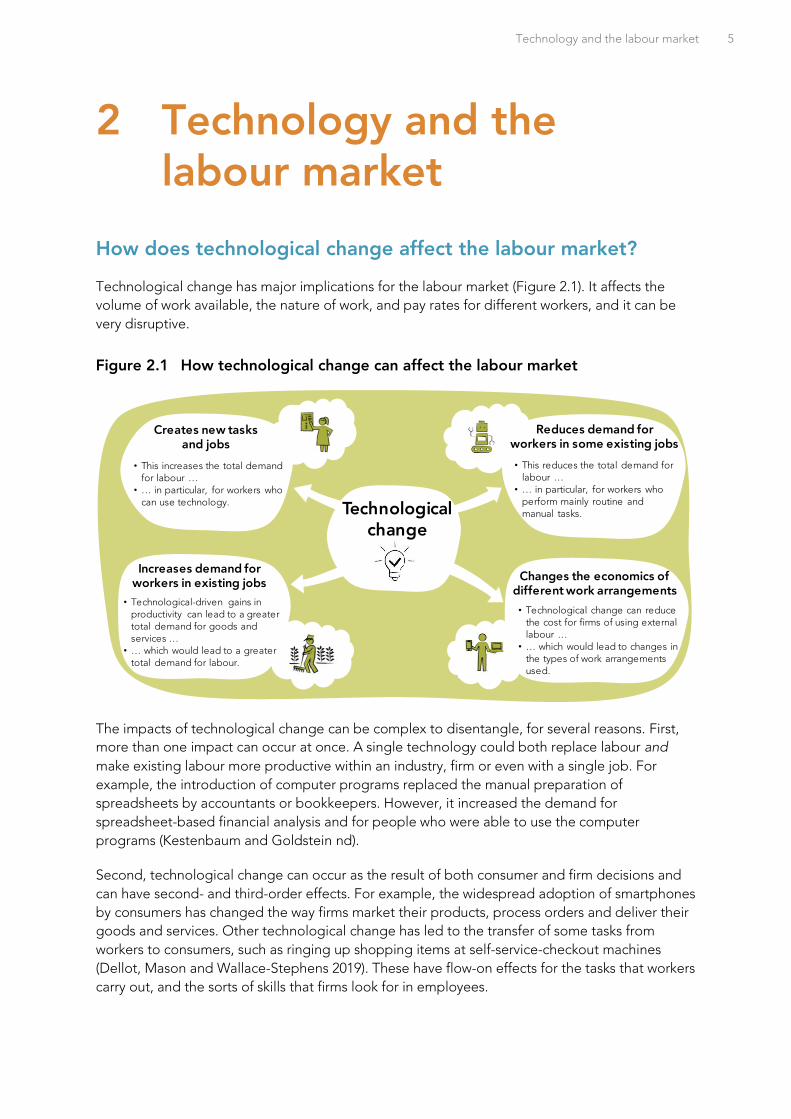
How does technological change affect the labour market?
Technological change has major implications for the labour market (Figure 2.1). It affects the
volume of work available, the nature of work, and pay rates for different workers, and it can be
very disruptive.
Figure 2.1 How technological change can affect the labour market
The impacts of technological change can be complex to disentangle, for several reasons. First,
more than one impact can occur at once. A single technology could both replace labour and
make existing labour more productive within an industry, firm or even with a single job. For
example, the introduction of computer programs replaced the manual preparation of
spreadsheets by accountants or bookkeepers. However, it increased the demand for
spreadsheet-based financial analysis and for people who were able to use the computer
programs (Kestenbaum and Goldstein nd).
Second, technological change can occur as the result of both consumer and firm decisions and
can have second- and third-order effects. For example, the widespread adoption of smartphones
by consumers has changed the way firms market their products, process orders and deliver their
goods and services. Other technological change has led to the transfer of some tasks from
workers to consumers, such as ringing up shopping items at self-service-checkout machines
(Dellot, Mason and Wallace-Stephens 2019). These have flow-on effects for the tasks that workers
carry out, and the sorts of skills that firms look for in employees.
Creates new tasks and jobs
Changes the economics of different work arrangements
• This increases the total demand for labour …
• … in particular, for workers who can use technology.
• This reduces the total demand for labour …
• … in particular, for workers who perform mainly routine and manual tasks.
Increases demand for workers in existing jobs
Technological change
• Technological-driven gains in productivity can lead to a greater total demand for goods and services …
• … which would lead to a greater total demand for labour.
Reduces demand for workers in some existing jobs
• Technological change can reduce the cost for firms of using external labour …
• … which would lead to changes in the types of work arrangements used.

6 Issues paper | Technological change and the future of work
Third, technological change can create tasks “that were never done previously by a human; more
work is done, but no human work is displaced” (Dellot, Mason and Wallace-Stephens 2019,
p. 21). One recent example is aquaculture image recognition software, which can spot salmon
infected with sea lice.
As a result, the full set of labour market and social impacts of technological change are not
always obvious. The rest of this section describes the various impacts.
Technological change could create new tasks and jobs …
Technological improvements can lead to the creation of new goods and services, which in turn
could lead firms to demand new forms of labour. For example, firms’ adoption of websites and
other online tools has created demand for social media managers, coders and web developers.
Technological change has certainly created new jobs in New Zealand. For example, since 1999,
the number of jobs classified as ‘Computer systems design and related services’ has increased
from 8 700 to 32 600.
McKinsey noted that because of the new tasks created by technology, the net effect of new
technologies can be to increase the total number of jobs.
One third of new jobs created in the United States in the past 25 years were types that did
not exist, or barely existed, in areas including IT development, hardware manufacturing, app
creation, and IT systems management. The net impact of new technologies on employment
can be strongly positive. (McKinsey Global Institute 2017, p. 3)
… and create greater demand for workers in existing jobs
Technology may reduce the cost of producing an existing good or service, which in turn may
raise demand and grow jobs. Where competition is strong, adopting a cost-reducing technology
can allow a firm to increase its market share by lowering its prices. Competitors then face
pressure to lower their prices to keep pace. Lower prices typically lead consumers to purchase
more of that good or service, spurring growth in employment to meet the increased demand.
Van Reenen (2018) described this dynamic as the ‘Uber effect’, citing the case of ridesharing
services such as Uber and Lyft, which provided a cheaper alternative to taxis. While the number
of traditional taxi trips in New York city fell between 2015–2018, this reduction was more than
offset by a dramatic increase in trips using ridesharing apps.
Technology-induced reductions in the prices of goods and services could also free up consumer
income that can be spent on other products, creating labour demand elsewhere in the economy.
Van Reenen (2018) dubbed this the ‘Walmart effect’, referring to the low-cost retail giant in the
United States, which achieved significant productivity improvements and price reductions that
gave consumers more disposable income for other goods and services in the late 1990s and
early 2000s.
Variants of this effect are business-to-business transactions, where technological improvements
in the production of goods that are used by other firms leads to employment growth in the
‘downstream’ firms. Van Reenan (2018) cited the steel industry, where productivity improvements
over 1980–2017 reduced costs and prices, thereby boosting jobs in ‘metal using’ sectors such as
manufacturing, machinery, motor vehicle and aerospace production.

Technology and the labour market 7
But technological change may reduce the demand for workers in some existing jobs …
Improvements in technology can reduce the demand for some types of jobs. This happens when
technological improvements dramatically improve the capability of capital equipment, leading
firms to invest more in equipment rather than jobs.
Technology introduced in shipping and ports has both reduced the number of jobs, and
significantly altered the nature of remaining jobs. In the early 1960s, nearly 27 000 people were
employed as “waterside workers and related freight handlers” in New Zealand. The widespread
adoption of containerisation and other technology that has enabled the automation of ports has
seen the number employed in “water transport support services” reduce to fewer than 6 000,
while the volume of freight handled has increased dramatically (NZPC 2012).
In some cases, investments in capital can completely replace some jobs. One well documented
example is the near-disappearance of typists as an occupation following the widespread
adoption of personal computers. The 1981 New Zealand census recorded nearly 35 000 people
employed as “stenographers, typists and card and tape punching machine operators”.
… and create more demand for workers who can use technology
Technologically driven improvements in the quality of capital equipment may also lead a firm to
invest more and also hire more staff with the skills required to operate the new assets. These
types of improvements are known as ‘skill-biased’ technological changes. This ‘skill-biased’
dynamic has been cited in some countries as an explanation for the growing divergence
between wages for higher-skilled workers (who are more able to use computers) and their less-
qualified counterparts (Krueger 1993; Mincer 1991).
Technology can change the economics of different work arrangements
Firms face a decision between employing staff directly and using contracted suppliers
(outsourcing). They will prefer employees when the transaction costs for incentivising and
monitoring staff are lower than those for contracted suppliers (Coase 1937). But technological
change is one factor that can shift the relative size of these costs.
A recent manifestation of this effect is the growth of internet platforms that facilitate short-term
work arrangements – often referred to as ‘gig’ work (Box 3). Although internet-enabled gig work
has attracted considerable attention in recent years, on-demand and piece-work labour
arrangements are nothing new. They were once common practice in the construction and dock
industries, and remain so for many creative tasks (eg, editing, modelling and photography).
Box 3 The ‘gig’ economy
Internet-based platforms such as Uber, Freelancer and Airtasker enable firms to break
some jobs down into specific tasks and buy in these services from on-demand labour.
Stanford identifies five features of this gig work:
1. Work is performed on an on-demand or as-needed basis. Producers only work when
their services are immediately required, and there is no guarantee of ongoing
engagement …

8 Issues paper | Technological change and the future of work
Technology-led changes to work arrangements do not inevitably mean more outsourcing or gig-
style labour. Tirole (2017, p. 419) cited the case of truckers in the United States, who are typically
independent contractors who own their own trucks because of “moral hazard” problems, that is,
“an employer needs to worry about the driver not being careful with the vehicle, whereas the
independent trucker has every incentive to take good care of it”. Tirole (2017) noted that
computerization can alleviate this problem, allowing companies to monitor drivers using
onboard computers, and reducing barriers to their hiring drivers as salaried employees.
Such technological developments, however, may increase the ability of employers to control
their staff, and reduce workers’ autonomy. One recent example is a bracelet developed by
Amazon for its warehouse staff that can “precisely track where warehouse employees are placing
their hands and use vibrations to nudge them in a different direction” (Solon 2018).
Technological change leads to the reallocation of labour
Technological change brings about a process of “creative destruction” – the failure of some
firms and the disappearance of some goods and services, as alternatives emerge that are
cheaper, more effective or preferred by consumers for some other reason. Where firms fail, their
employees need to find work elsewhere. Technological change often involves labour
displacement. But even in the normal course of events, firms are constantly being born, grow
and die. Meehan and Zheng (2015) refer to these dynamics as a “perpetual motion machine”.
When firms shrink and die, jobs are destroyed but they also give way to new firms and new jobs.
2. Producers are paid for each discrete task or unit of output, not for their time.
3. Producers are required to supply their own capital equipment. This typically includes
providing the place where work occurs (home, car, etc.), as well as any tools and
equipment utilised directly in production. Because individual workers’ financial
capacity is limited, the capital requirements of platform work (at least capital used
directly by workers) are typically relatively small (although these assets can be
significant in the lives of the workers who must purchase and maintain them).
4. The entity organising the work is distinct from the end-user or final consumer of the
output, implying a triangular relationship between the producer, the end-user and the
intermediary.
5. Some form of digital intermediation is utilised to commission the work, supervise it,
deliver it to the final customer, and facilitate payment. (2017, p. 384)
The rapid emergence of these platforms has led to concerns that they will undermine the
standard model of full-time, permanent employment, with its associated entitlements and
legal protections. Information on the extent of ‘gig’ work is limited. Available research
tends to find that ‘gig’ work has grown over the past two decades, but still remains a
relatively small part of the overall labour force.

Technology and the labour market 9
Moreover, every year thousands of New Zealanders move jobs in search of better opportunities
and more suitable matches to their skills, interests and circumstances. Looking at job mobility in
the early 2000s, Maloney (2007, p. 301) found that:
[b]etween 7.8 and 9.0 per cent of [New Zealand] workers as of March in each year had held
their jobs for less than three months. Just under one-third of workers had been in their jobs
for less than one year, and nearly one-half had been in their jobs for less than two years.
The rate of these job-to-job transitions tends to fall as people age. And overall rates have fallen
across the developed world (including in New Zealand) following the global financial crisis
(Haltiwanger, Hyatt and McEntarfer 2015; Maré 2018).
Technological change benefits many, but not all
Technological change can have a hugely positive impact on the wellbeing of New Zealanders.
The development and adoption of technologies is a fundamental driver of productivity growth,
which in turn can lead to higher wages and living standards. But the benefits from technology
are not necessarily shared evenly throughout society. For some, technological change can be
disruptive and make them worse off.
An obvious example of people who are vulnerable to technological change are those who are
displaced from their job due to automation. For instance, many New Zealanders, particularly in
low to medium skill occupations, involuntarily lost their jobs during the past few decades in part
because of advances in technology. Workers who get made redundant may struggle to cope
mentally and financially and face diminished future job prospects and earnings.
But technological change can also affect workers and work in other ways. Examples include
people who take time out of the workforce but struggle to re-gain employment as the types of
skills in demand have changed, or those who invest in learning the skills for a profession but find
it difficult to gain a job because the demand for that profession has diminished.
The impact of technological change can also differ across skill levels …
By changing the demand for different types of skills and jobs, some types of technological
change tend to increase income inequality. Autor (2019) concluded that in the United States the
changes “in the nature of work – many of which are technological in origin – have been more
disruptive and less beneficial for non-college than college workers.” Since 1970, the average
weekly earnings for US workers with graduate degrees rose markedly, while earnings for high
school graduates or drop-outs stayed relatively constant in real terms. And the share of middle-
skill jobs – production, clerical, administrative and sales jobs – saw a dramatic decline. This was
accompanied by a significant increase in the share of low-skill jobs. In New Zealand, despite a
rise in demand for high-skilled workers (relative to other workers), wage growth over the past
thirty years seems to have been more evenly distributed across skill levels compared with the
United States. The median wage for a university graduate has been rising slightly more slowly, in
percentage terms, compared with workers without a degree (Ministry of Education 2018).
Technological improvements that reduce the costs of finding the right people for a job (eg, by
providing platforms for potential workers and employers to become aware of each other, or
through the use of computer programs to screen job applicants), could also affect income
inequality. While better matching between workers and firms is beneficial for those involved, it
could see larger income disparities open up between ‘superstar’ firms and workers and the rest,

10 Issues paper | Technological change and the future of work
and between large cities and regional areas (Autor 2019; Card, Heining and Kline 2013).
Conversely, technology that complements labour may have negative impacts in future for some
higher-skilled jobs, especially where it lowers the barriers to entry into scarce and highly
esteemed roles (Dellot, Mason and Wallace-Stephens 2019).
… and across different locations
Households and firms may experience differing impacts from technological change depending
on where they are located. For example, workers and firms in smaller, more remote towns may
find it more difficult to adjust to technological change (eg, by workers re-training or workers and
firms relocating). Studying the impacts of two freezing works closures in the 1980s, Grimes and
Young (2009) found that the unemployment effects of the closure on Whakatu were mainly
temporary, reflecting its proximity to a larger city (Hastings). By contrast, the isolated town of
Patea experienced a more lasting employment shock, with an overall loss of workers and
increase in the number of people not in the labour force. That said, workers in cities are not
immune to disruption – the ‘hollowing out’ of middle skill jobs and rise in low skill work in the
United States has occurred much more acutely in denser urban areas compared with smaller
towns (Autor 2019).
Technology-driven falls in the costs of transporting goods and services to customers could result
in more centralised production of some goods and services. This could lead to fewer firms and
fewer jobs being available in smaller cities and regional centres. Alternatively, lower transport
and communication costs could result in some redistribution of work away from larger cities to
smaller and regional areas. In the recent past, New Zealand has seen a shift of many economic
activities out of smaller centres (Coleman and Zheng 2019) and there has been little change in
the share of people working remotely or from home.
The impacts of technology depend on choices and capabilities
Technology is not an external force that hits society and the economy. The speed and extent to
which technology is adopted and changes existing production processes depends on investment
decisions taken by firms. This, in turn, depends on the capabilities of firms and the nature of the
business environment; both of which are affected by government policy settings.
Firms that are willing to innovate or operate in a competitive environment are more likely to
create or take up new technologies. Firms with strong management capabilities are more likely
to effectively implement those technologies, respond effectively to competition, achieve
productivity gains and use the skills of their workforces. Conversely, less-capable firms may be
late to identify emerging technological competition or respond abruptly, with potentially
negative impacts for themselves and their workers.
Firm capability levels, the business environment and government policies that affect these are
therefore relevant to how technology affects the future of work. Chapter 6 explores these issues
in more detail.

Looking to the future 11
3 Looking to the future
The TOR ask the Commission to consider the likely future impacts of technological change and
disruption on the future of work, the workforce, labour markets, productivity and wellbeing.
Predicting the impact of technology on the future of work
Past predictions of technological impacts
Predictions that technology might take away jobs are not new. Aristotle mused in 350 BC that if
“the shuttle would weave and the plectrum touch the lyre without a hand to guide them, chief
workmen would not want servants, nor masters slaves”. And in 1978, the Australian historian Ian
Turner predicted that the world was about to enter a period of significant change and that at
least a quarter of the Australian workforce would be replaced by machines over the following
decade (Borland and Coelli 2017).
More recently, due to a growing concern about the potential impacts of emerging technologies
(eg, artificial intelligence, machine learning and big data) on the labour market, several studies
have emerged that try to forecast these future impacts. One of the most prominent was
conducted by Frey and Osborne (2013), who estimated that about 47% of total employment in
the United States was at high risk of automation and that those jobs were expected to be
“automated relatively soon, perhaps over the next decade or two” (p. 44).
Replications of Frey and Osborne’s methodology in the New Zealand context produced similar
predictions, with 46% of work deemed at high risk of automation (Kubiak and Drew 2015). The
categories of employment with the greatest risk of automation (with over 70% of jobs at high risk)
were labourers, machinery operators and drivers, and clerical and administrative workers.
More recent analysis by Nedelkoska and Quintini (2018) (Figure 3.1) indicated a small share of
jobs in New Zealand were susceptible to automation, relative to other countries. An explanation
is that New Zealand experienced a sharp rise in occupations that are less susceptible to
automation, such as professional occupations (since the early 1990s) and managerial occupations
(since 2010). Countries with a higher risk of job automation tend to have a relatively larger share
of jobs in manufacturing.
Predictions, like any other analysis, entails making assumptions. These could be over-simplistic or
incorrect. For example, critiques of Frey and Osborne’s studies have highlighted how focusing
on whole occupations rather than tasks may overplay the potential threat from automation. Using
a task-based rather than occupation-based approach, Arntz, Gregory and Zierahn (2016) found
that in the United States only 9% of jobs face a high risk of automation. Others have argued that
predictions of technology displacing occupations or tasks underestimate the extent to which the
set of tasks that a worker carries out are complementary (eg, Gorlich 2010).

12 Issues paper | Technological change and the future of work
Figure 3.1 Share of jobs at risk of automation or significant change, selected OECD countries (2016)
Source: Nedelkoska & Quintini (2018).
Note: High risk – more than 70% probability of automation; risk of significant change – between 50 and 70% probability.
Recent New Zealand data does not suggest increasing disruption …
While technological change has impacts (and can be disruptive) for individual workers and firms,
New Zealand’s relatively low unemployment rate, frequent reports of labour shortages and
growing labour market participation rates suggest that the overall availability of work is not a
serious issue at present – although not all see the available work options as attractive in terms of
pay and conditions. Available data on the share of non-permanent work (eg, gig work) does not
show a growing trend (Maddock and Genet 2019).
This is not to say that the current situation will continue, nor that emerging (and future)
technologies will not have disruptive impacts on the labour market as they are adopted. As
discussed in Chapter 2, newer technologies, such as artificial intelligence and machine learning,
may have a more dominant labour-replacing effect than earlier technologies, and result in net
job losses. They may also disrupt existing work arrangements in unprecedented ways.
… and the future adoption and impacts of technology are uncertain
Anticipating the adoption of technology requires much more than an understanding of its
technical viability. It also requires knowledge of the decision-making processes of firms and how
and when they choose to implement new technologies. Successfully adopting new technologies
often requires firms to make complementary changes to business process, skills and access to
capital (Bloom, Sadun and Van Reenen 2012; Brynjolfsson and Hitt 2000; Gali, Gretton and
0% 10% 20% 30% 40% 50% 60% 70%
Norway
New Zealand
Finland
United States
United Kingdom
Denmark
Singapore
Canada
Ireland
Korea
Israel
OECD
Austria
Russia
France
Italy
Spain
Slovenia
Germany
Japan
Turkey
Lithuania
Slovakia
High risk of automation Significant risk of change

Looking to the future 13
Parham 2004; Pilat 2004). The process of technological adoption and its subsequent flow-on
effects for workers can take many years.
Box 4 describes how the pace of technological change can be very difficult to pin down in
advance, using the example of driverless vehicles.
The impact of other factors on the future of work is uncertain
Technological change is just one of the factors that will affect the future of work. Others include:
Net migration which directly affects labour supply. Government places few limits on the free
movement of New Zealanders into and out of New Zealand. However, immigration policy can
affect the demographic profile of the country and its skills mix, and this aspect of immigration
policy is within the scope of this inquiry.
Natural demographic change and changing preferences for work and leisure will also affect
labour supply but are largely outside the control of government policy.
Responses to climate change by households and firms. Responses are likely to be heavily
influenced by government climate change policy and goals. Policies are likely to affect the
adoption of certain technologies, employment in some sectors of the economy, and travel
for work. Specific technologies, and government climate change policies, are outside the
scope of this inquiry.
Changing opportunities for, and barriers to, global trade will likely affect the opportunities
for business in New Zealand and thus the amount and type of work available. Trade policy is
outside the scope of this inquiry.
Variation in the business cycle affects both the rate of technology adoption and available
work, but business cycles are not a specific focus of this inquiry.
These factors have their own uncertainties. They will interact with technological change to
determine the actual future of work experienced by New Zealanders.
Studies of the possible effects of technology change on labour markets to date have mostly used
US data. This issues paper cites many such studies, but the Commission is mindful that they may
not generalise well to other countries. New Zealand is a small country, distant from its trading
partners but with relatively open borders. Though innovative in some areas, it is more of a
technology taker than a technology leader (APC & NZPC, 2019). It currently has low
Box 4 Predicting the uptake of driverless vehicles
In 2004, researchers concluded driving in traffic would remain a human task for the
foreseeable future (Brynjolfsson and McAfee 2014). Ten years later, Brynjolfsson and
McAfee (2014, p. 14) suggested that self-driving cars had gone from “being the stuff of
science fiction to on-the-road reality in a few short years”. But as at 2019 commentators are
reporting that progress in the development of fully autonomous vehicles is taking longer
than previously thought, noting that the “optimism that surrounded driverless cars only a
few years ago has been tempered by a slew of persistent technological challenges and big
questions about near-term business models” (Naughton 2019).
14 Issues paper | Technological change and the future of work
unemployment and high labour market participation but is suffering from an extended period of
low productivity growth (Conway 2018). This context is important: it should not be assumed that
what is happening or predicted to happen in other countries also applies to New Zealand. Nor
should it be presumed that a policy prescription designed for another country would be ideal, or
even positive, should it be adopted here.
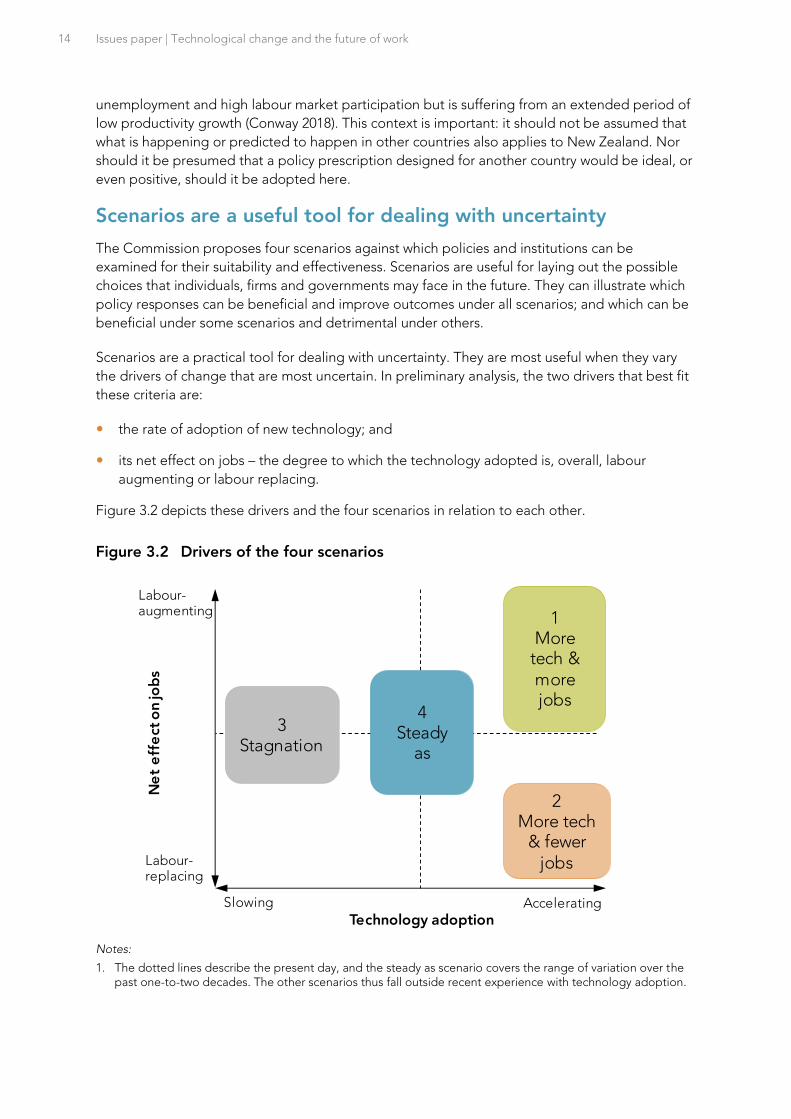
Scenarios are a useful tool for dealing with uncertainty
The Commission proposes four scenarios against which policies and institutions can be
examined for their suitability and effectiveness. Scenarios are useful for laying out the possible
choices that individuals, firms and governments may face in the future. They can illustrate which
policy responses can be beneficial and improve outcomes under all scenarios; and which can be
beneficial under some scenarios and detrimental under others.
Scenarios are a practical tool for dealing with uncertainty. They are most useful when they vary
the drivers of change that are most uncertain. In preliminary analysis, the two drivers that best fit
these criteria are:
the rate of adoption of new technology; and
its net effect on jobs – the degree to which the technology adopted is, overall, labour
augmenting or labour replacing.
Figure 3.2 depicts these drivers and the four scenarios in relation to each other.
Figure 3.2 Drivers of the four scenarios
Notes:
1. The dotted lines describe the present day, and the steady as scenario covers the range of variation over the past one-to-two decades. The other scenarios thus fall outside recent experience with technology adoption.
Labour-augmenting
Labour-replacing
Slowing AcceleratingTechnology adoption
Ne
t e
ffe
ct o
n jo
bs
2More tech
& fewerjobs
1More
tech &morejobs
4Steady
as
3 Stagnation

Looking to the future 15
The four scenarios
This section explains how the drivers interact to shape each scenario, and some of the expected
consequences. In particular, it examines likely consequential changes of capital and labour
productivity, wages, unemployment, income inequality and, more speculatively, working
arrangements. Each scenario is described relative to average conditions in the present day in
New Zealand.
Scenario 1: More tech & more jobs
Technology adoption accelerates in this scenario, and the technologies adopted create more
jobs than they replace.
Both capital and labour productivity rise in this scenario, perhaps substantially. Capital
productivity rises because the quality-adjusted price of technology falls (which is what drives
accelerating adoption), and because firms only adopt those technologies that they expect will
improve their productivity. Labour productivity rises because to extract those productivity
improvements firms also need skilled and specialised labour.
Such an economy will tend towards high levels of employment. But one concern is that
disparities in wage incomes may increase. Low-skilled labour may attract low or stagnant wages
while the wages of those with skills in demand may soar. On the plus side, in such an economy
there are more resources, in total, to enable redistribution of the benefits.
Higher levels of job churn are likely in such a labour market. This might lead to increased
demand for mid-career retraining. Jobs likely to be lost are those that are routine, and thus more
amenable to automation. Job gains will be those that are more complex, deal with unusual or
unpredictable situations, or require essentially human elements such as judgement and
compassion.
There will likely be greater demand for education and training, including from displaced workers
and those in employment, and a greater need for flexible delivery options for training. More
frequent and widespread displacement may create financial pressure for affected households,
increasing calls for wider income support measures, including for those undertaking retraining.
Scenario 2: More tech & fewer jobs
This scenario, in common with the More tech & more jobs scenario, is driven by accelerating
technology adoption. However, it differs in that the technology adopted is, overall, labour-
replacing.
Capital productivity rises substantially in this scenario, as firms increasingly adopt productivity-
enhancing technologies. Labour productivity might also rise, as lower-skilled roles are
increasingly automated.
An expected consequence of this combination of drivers is widespread unemployment. While
workers losing jobs would contribute to job churn, overall job scarcity might encourage those
with jobs to hold onto them for longer. Average wages might fall over time as labour supply
would exceed available jobs. Wage inequality for those still in employment might fall as a
consequence. However, income differences between the employed and unemployed could drive
an increase in overall rates of inequality.

16 Issues paper | Technological change and the future of work
With higher rates of unemployment, a much larger share of households will face financial
pressures, and there may be calls for more generous income support. There may also be calls
for:
direct taxation of technology (sometimes referred to as ‘robot taxes’), to fund income
support programmes and other interventions, and to discourage the replacement of labour;
increased regulation of technology, to limit its introduction and spread;
greater sharing of existing jobs (eg, through voluntary arrangements or compulsory measures
such as maximum working hours rules); and
increased employment protection for those in work.
Scenario 3: Stagnation
In this scenario, the pace of technological adoption slows. This could be due to declining
innovation, as technological bottlenecks prove harder to overcome than expected. Alternatively,
slower change could occur as technology adoption by firms slows – perhaps because newer
technologies are less productivity enhancing for firms than those of the past (Gordon 2014,
2018).
In this scenario, there will be less change in the volume, churn and nature of work, and income
and productivity growth will slow. There could be reduced opportunities for people to find jobs
that are well matched with their skills, preferences and circumstances. Slower technological
change may prompt calls for more government intervention to encourage firms to undertake
research and development (R&D) and innovate.
Scenario 4: Steady as
In this scenario, the technological drivers of labour market change over the next one-to-two
decades stay within the bounds of New Zealand experience over the past one-to-two decades.
This future offers ongoing change, but the rate of that change is roughly that which
New Zealanders are familiar with. The past two decades introduced technology including the
smartphone, eCommerce and social media. No doubt the near future will offer further
innovations.
This scenario includes the continuation of slow productivity growth and generally slow
technology adoption by New Zealand firms (though consumer technology adoption may stay
high).
This scenario is compatible with full employment and stable levels of income inequality. Actual
outcomes will vary, as other drivers of labour market change – such as variation in the business
cycle or demographic change – are likely to predominate.
Q1 Are the scenarios developed by the Commission useful for considering the
future labour market effects of technological change? How could they be
improved?

Looking to the future 17
Q2 What other consequences might be expected under each scenario?
How might the impact of each scenario vary for different groups of people?
The Commission is interested in how the impacts for each scenario might vary across different
groups in society. For example:
Are there specific groups that might be most susceptible to job loss under the More tech &
fewer jobs scenario?
Are there groups of people that stand to benefit under each future scenario? For example,
the More tech & more jobs scenario might provide new employment opportunities for older
people and those with disabilities.
In the low-employment scenarios (More tech & fewer jobs and Stagnation) would
unemployment be concentrated in particular locations?
Where future scenarios create obstacles or advantages for particular groups, the Commission is
interested in what, if any, specific forms of support should be considered.
Q3 How might the impacts of each scenario vary across different groups in
society or across different locations in New Zealand?
Changing the nature of work
Technology adoption may lead to changes to working arrangements that do not link specifically
to these scenarios.
Advances in technology could enable more jobs to be ‘unbundled’ into specific tasks that can be
bought from independent contractors. This could mean that a much smaller share of labour is
supplied through standard, permanent employment in any of the future scenarios. Those without
standard employment may need to make their own arrangements for parental leave and holidays
and juggle multiple contracts to make ends meet. For some people – especially those with skills
in high demand – a growth in freelance and independent work may bring greater choice and
flexibility, and high incomes. Others, however, may find things difficult, especially if they have
little bargaining power or other ability to affect their wages. They may also struggle to make
financial provision for their retirement or emergencies.
Greater reliance on independent work and multiple, individual contracts may make it difficult for
people to demonstrate their eligibility for income support. The need to maintain a constant flow
of work may also make it harder for some freelancers to retrain or upgrade their skills.
Keeping options open
The most suitable approach to addressing a public policy problem differs depending on how
much is known about the future.
18 Issues paper | Technological change and the future of work
For a reasonably certain future, it makes sense to pursue a well-formulated plan with explicit
goals, scheduled actions, clear assignment of responsibility, risk mitigation, cost-benefit analysis
and stakeholder support.
But dealing with an uncertain future calls for a different approach, characterised by keeping
options open, collecting and monitoring information, engaging with stakeholders, delaying
difficult-to-reverse decisions, real-options analysis, building flexible institutions and taking action
just-in-time.
The Commission’s initial view is that the second approach is better suited to the subject of this
inquiry. This leads to further questions, including what changes or impacts should be monitored,
who should be responsible for monitoring, and what are the triggers for action?
Q4 How should government monitor the impacts of technological change on
the labour market?
Policy goals for wellbeing and the future of work
Given the dynamic nature of the labour market and the difficulty of predicting how technological
change will affect employment, what labour market goals should government pursue for the
wellbeing of New Zealanders? This section posits six broad goals and seeks submitters’ views on
their relative importance and priority.
Resilience, adaptability and smooth transitions for workers
Policy areas that may assist in building resilience and preparing for change include:
a strong educational base, as it matters for the ability to gain new skills in future;
a wide range of learning options that reflect the needs of a diverse workforce; and
labour market policy and interventions geared toward supporting affected people to find
work that suits their skills and circumstances and toward reducing the harms caused by
displacement.
Protections against abuse and power imbalances
Legal protections serve two purposes. The first purpose is to reflect community expectations. As
the Australian Productivity Commission (2015) commented, labour “is not just an ordinary input.
There are ethical and community norms about the way in which a country treats its employees”
(p. 2). Protections for workers set standards for appropriate conduct.
The second purpose is to offset power imbalances. In the absence of regulation, employees may
lack the bargaining power to gain desirable terms and conditions or may be exposed to onerous
or dangerous working environments.
Flexible working conditions
Policies that allow for employers and employee to negotiate flexible working hours and
conditions can lead to better outcomes for both, and open up work opportunities for more
people, including some currently unable to participate in the labour market.

Looking to the future 19
Low barriers to participation and mobility
Labour market and other policies can be designed to minimise barriers to people shifting jobs
and to new entrants (or re-entrants) seeking work. This would most likely benefit those who are
young, lack previous experience or have taken time out of the workforce. The ability of young
people to enter the labour force, and the job options available to them, can have significant
long-term effects. The OECD (2015b) concluded that, across the developed world, “[l]ife-term
earnings differentials are largely determined in the first ten years of workers’ careers” (p. 169).
Barriers to participation and mobility include:
regulatory barriers that discourage employers from taking on additional workers;
discrimination by employers against certain groups of people;
lack of provision for people to take time out of work (eg, for raising children); and
impediments to workers changing where they live (eg, housing costs); and
entry barriers to occupations (eg, barriers to reskilling and occupational regulation that is
unduly restrictive).
A dynamic and productive economy that rewards innovation
Policies that facilitate a dynamic economy can contribute to the wellbeing of New Zealanders
through increasing productivity, creating new jobs and by further contributing to the tax base
that funds wider social policies.
Incomes that allow all to participate in society
If the future involves more frequent and widespread career changes, policies could be geared
towards greater income support for individuals and families facing those changes. Alternatively,
for a future that involves large-scale substitution of labour by technology, policies such as a
“robot tax” to fund income support have been mooted (Porter 2019).
Q5 What policy objectives should governments pursue for the labour market
of the future?
Q6 What are the potential tensions between different policy goals? How might
such tensions be best addressed?
20 Issues paper | Technological change and the future of work
4 Labour market policies and institutions
Labour market policies and institutions affect the ease with which people can gain and re-gain
employment, the incentives for firms to hire people, and the impacts of job loss on individual
and household wellbeing. This section describes some of New Zealand’s current labour market
policies, and policies common in other countries, and poses questions about their fitness for
future scenarios of technological change.
Employment protections
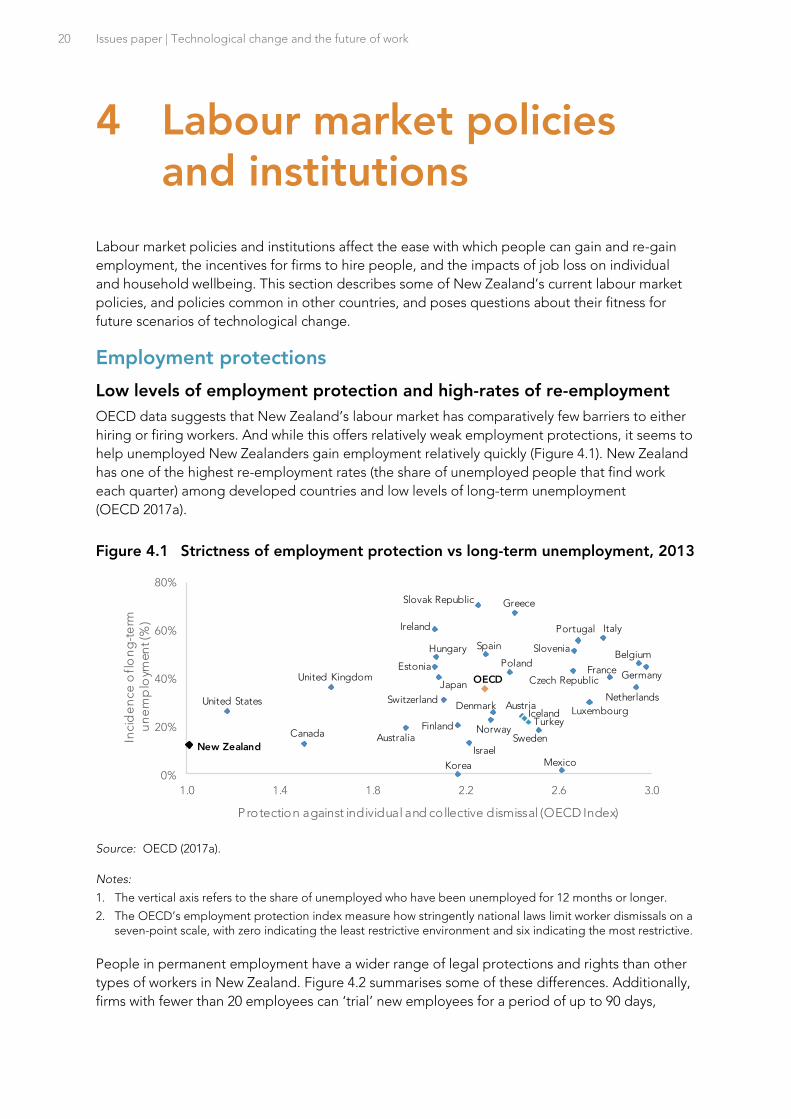
Low levels of employment protection and high-rates of re-employment
OECD data suggests that New Zealand’s labour market has comparatively few barriers to either
hiring or firing workers. And while this offers relatively weak employment protections, it seems to
help unemployed New Zealanders gain employment relatively quickly (Figure 4.1). New Zealand
has one of the highest re-employment rates (the share of unemployed people that find work
each quarter) among developed countries and low levels of long-term unemployment
(OECD 2017a).
Figure 4.1 Strictness of employment protection vs long-term unemployment, 2013
Source: OECD (2017a).
Notes:
1. The vertical axis refers to the share of unemployed who have been unemployed for 12 months or longer.
2. The OECD’s employment protection index measure how stringently national laws limit worker dismissals on a seven-point scale, with zero indicating the least restrictive environment and six indicating the most restrictive.
People in permanent employment have a wider range of legal protections and rights than other
types of workers in New Zealand. Figure 4.2 summarises some of these differences. Additionally,
firms with fewer than 20 employees can ‘trial’ new employees for a period of up to 90 days,
Australia
Austria
Belgium
Canada
Czech Republic
Denmark
Estonia
Finland
FranceGermany
Greece
Hungary
Iceland
Ireland
Israel
Italy
Japan
Korea
Luxembourg
Mexico
Netherlands
New Zealand
Norway
OECD
Poland
Portugal
Slovak Republic
SloveniaSpain
Sweden
Switzerland
Turkey
United Kingdom
United States
0%
20%
40%
60%
80%
1.0 1.4 1.8 2.2 2.6 3.0
Incid
en
ce
of l
on
g-t
erm
u
ne
mp
loym
en
t (%
)
Protection against individual and collective dismissal (OECD Index)

Labour market policies and institutions 21
during which they can dismiss them without having to provide a reason. Research focused on the
previous version of the 90-day trial policy that included larger firms, found that the policy had not
achieved its objective of encouraging firms to take on more employees (Chappell and Sin 2016).
Figure 4.2 Legal protections for different types of workers in New Zealand
Source: New Zealand Council of Trade Unions (2013) and Ministry of Business, Innovation and Employment (n.d.).
Legal protections in a future with large changes in work arrangements
Lower levels of legal protections for ‘contract for service’ arrangements may create challenges in
future, if technological changes encourage firms to make greater use of independent contractor
labour. The legal status and protection of gig workers has already been the subject of
considerable debate. For some of these workers, increasing employment protection could come
at the expense of flexibility benefits (Box 5).
Gre
ate
r pro
tect
ion
Le
ss p
rote
ctio
n
Permanent employment• Subject to unfair dismissal / disadvantage law• Good faith requirements• Eligibility for annual leave, sick leave, public holiday
pay• Eligibility for parental leave and paid parental leave
Fixed term employmentSame as permanent employment except:• Jobs finish at the end of the fixed term (any
dismissal prior to the specified end date must follow the same process as for permanent employees).
• May not qualify for some service-based leave entitlements (such as sick leave) depending on length of engagement.
Casual employmentSame as permanent employment except:• No effective protection against unjustified dismissal• No good faith requirements between periods of
work• Unlikely to qualify for service-based entitlements
(redundancy, sick leave, long service leave)
Contract for services• No protection against unjustified dismissal or
disadvantage• No good faith • Common law contractual protections only• No minimum entitlements such as minimum wage
and paid leave• No access to low-cost employment institutions
(mediation, Employment Relations Authority)
SPECIAL CATEGORIESChildren and young persons• No minimum wage payable to under 16 year olds• 16-19 year olds may be subject to starting-out wage
(80% of adult minimum wage)• But some restrictions on type of work done
Subcontracted or agency workSame as fixed-term employment except:• Triangular employment relationship may limit ability
to collectively bargain with or take personal grievance action against the ‘host’ employer
Box 5 Trading off between flexibility and protection – the case of Uber
In New Zealand, workers are classified as either an employee or an independent contractor
(ie, self-employed). Uber drivers are currently the latter classification. As such, they have
minimal legal protections but have autonomy in choosing if, when and where they work
(Hall and Fussey 2018). The extent that Uber can offer normal protections (eg, sick leave) to
drivers without triggering a reclassification of their employment status is unclear.

22 Issues paper | Technological change and the future of work
There are various ways in which employment protection policy could respond to a growing
incidence of independent contract labour.
One option would be to more tightly regulate ‘contract for service’ models, such as limiting the
circumstances in which they can be used or requiring firms to provide more generous terms.
Australian employment law prohibits ‘sham contracting’, which involves employer actions such as
misrepresenting an employment relationship as independent contracting and dismissing or
threatening to dismiss an employee for the purpose of engaging them as an independent
contractor (Australian Productivity Commission 2015). Tighter regulation could prevent firms from
shifting work from standard employment contracts to contract models, but in doing so, could
reduce the overall supply of employment and make some innovative business models unviable.
Another option would be to create new legal categories suited to gig workers and contractors.
The United Kingdom has established a new legal category of worker, between ‘employee’ and
independent contractor. This intermediate category of ‘worker’ provides additional protections
above those offered to contractors (eg, minimum wage, sick leave), but fewer than are available
to employees (eg, no redundancy or unfair dismissal rights). In a landmark ruling in 2017, a UK
employment tribunal concluded that Uber drivers were ‘workers’ rather than independent
contractors. This judgment is currently being appealed.
This approach may create incentives for firms to shift from standard employment models to less-
protected alternatives. It may also create legal uncertainty at the boundaries between the
categories and be difficult to enforce. The courts in New Zealand have already indicated a
willingness to look through contracting arrangements to protect vulnerable workers, within the
current ‘binary’ model. For example, in Prasad v LSG Sky Chiefs New Zealand Ltd [2017]
NZEmpC 150, the Employment Court decided that the independent contractors hired by labour
company Solutions Personnel Ltd were employees of the client LSG Sky Chefs.
An alternative and more far-reaching approach would be to link protections and entitlements to
work rather than employment, or reconsider the concept of an ‘employer’.
Citing the example of Australia’s health and safety regime (which regulates regardless of the
form of the working relationship), Stewart and Stanford (2017) suggested abandoning
“employment status entirely as the trigger for regulating work, and apply[ing] appropriate
protections to anyone performing ‘work’” (p. 430). This would entail moving to a ‘law of work’
or regulation of ‘personal work contracts’ but could also require redesign of existing rights
While minimal protections risk the exploitation of workers, they also can provide Uber
drivers with greater flexibility. A recent study of Uber drivers in Australia showed differing
preferences for the trade-off between protections and flexibility:
Uber’s survey of driver-partners showed that most driver-partners (61%) believe the
flexibility to determine their own working hours is more important than having
guaranteed pay and entitlements. However, there is also a cohort of driver-partners
(39%) who place less value on flexibility relative to those benefits and protections.
These driver-partners still value flexibility but they would prefer not to have to forego
the income security that comes through benefits and protections (AlphaBeta 2019,
p. 14).

Labour market policies and institutions 23
and protections (eg, minimum wage, paid leave and superannuation contributions) to fit
different types of work.
Prassl and Risak (2016) noted that law in many countries has come to recognise five distinct
functions of an employer – inception and termination of the employment relationship,
receiving labour and its fruits, providing work and pay, managing the firm’s ‘internal market’,
and managing the firm’s ‘external market’. Some internet-based platforms fulfil all five
functions, while others only carry out some. The authors argued that more clearly
distinguishing these functions in employment law could provide greater clarity and certainty
about firm obligations and worker rights in different work arrangements.
Q7 For each of the future scenarios, what policies would provide the best mix
of worker protections and low barriers to workforce participation?
Q8 What are the likely consequences of a large-scale increase in the
proportion of independent contractors in the workforce? How should
government respond to any negative consequences?
In addition to the potential for greater numbers of workers to be employed in gig work or as
independent contractors, the Commission is also interested in submitters’ views about other new
work arrangements that are emerging, or that might emerge in the near future. For example, as
noted above, one emerging trend in some workplaces is that advances in technology are
increasing the ability of employers to monitor and control their staff or contractors. This may
have positive impacts for firm profitability or productivity, and provide added protections for
some employees (eg, body cameras for police officers). However, it could also have negative
implications for workers’ sense of autonomy and wellbeing. The application of artificial
intelligence to employment (eg, screening of job applications) may also require closer regulatory
scrutiny in future to ensure such practices are not discriminatory.
Q9 What types of worker protections might be required where technology
provides employers with a growing ability to monitor staff or discriminate
against some people?
Q10 Apart from a potential increase in gig work, what other new work
arrangements are emerging, or are likely to emerge in the near-future?
What are the implications of these work arrangements, and what response
from government might be required?
Wage protections
New Zealand has three minimum wage rates – the adult rate, starting out rate and training rate.
The adult rate as a percentage of the median full-time wage is relatively high in international
comparison (Figure 4.3). Due to regular increases in the minimum wage and low inflation, the
real purchasing power of the minimum wage has steadily risen since the early 2000s. The

24 Issues paper | Technological change and the future of work
Government has announced its intention to progressively increase the adult minimum wage to
$20 per hour by 2021. As of April 2019, the rate is $17.70 per hour.
A longstanding view in economics was that minimum wages reduced aggregate employment,
especially for younger and lower-skilled workers (Brown, Gilroy and Kohen 1982; Stigler 1946).
However, more recent research has challenged some of these conclusions, with several studies
finding little to no impact on overall employment (Allegretto, Dube and Reich 2011; Card and
Krueger 2016; Dube, Lester and Reich 2010).
A recent development in the policy debate has been a concern that minimum wages increases
might encourage firms to automate lower-skill jobs at a faster rate. Lordan and Neumark (2017)
found that minimum wage increases in the United States over 1980–2015 significantly reduced
the share of automatable or routine employment carried out by low-skilled workers, particularly
in manufacturing and for older workers.
Figure 4.3 Minimum wage as a ratio of median full-time wages
Figure 4.4 Adult minimum wage, real and nominal, 1977–2018
Source: OECD (2017c) Source: NZLII (2019); Stats NZ (2019c)
Q11 How might minimum wage settings affect incentives on firms to adopt
labour-replacing technologies? What changes to minimum wage policy
might be appropriate under each of the future scenarios?
Notice periods
New Zealand employment law does not specify minimum notice periods for terminating jobs.
Notice periods are usually specified in employment contracts, but if no provision is made in
contract, “reasonable notice” is required. What counts as “reasonable” depends on factors
including the reason for the redundancy, length of the employee’s tenure, and their seniority
(OECD 2017a).
The OECD (2017) has recommended the introduction of minimum statutory notice periods to
generate more equality among workers; reduce displacement costs for affected workers and
their families; and to improve the ability of workers to prepare. Greater ability to prepare and
find alternative employment could be of particular benefit in the More tech & more jobs
scenario, where a larger share of the workforce could be expected to experience displacement.
0%
10%
20%
30%
40%
50%
60%
70%
UnitedStates
Canada Ireland Germany UnitedKingdom
Australia NewZealand
France $-
$2
$4
$6
$8
$10
$12
$14
$16
$18
1977 1982 1987 1992 1997 2002 2007 2012 2017
Min. Wage Min. Wage (real)

Labour market policies and institutions 25
Q12 What changes might be required to minimum notice periods under each of
the future scenarios?
Income support
Labour market changes, including those resulting from technological change, can lead to
negative consequences for people both in and out of the workforce. Income support is an
important mechanism for ensuring that these individuals and households are not without
adequate means. This section covers income support for people who involuntarily lose their job,
and others who are unemployed and seeking employment.
Job loss can have persistent negative impacts for New Zealanders
Although re-employment rates are high in New Zealand, involuntary job loss can still have a high
financial cost as well as severe impacts on wider wellbeing, especially for those who experience
longer periods of joblessness. The OECD (2017a) noted that the financial costs of involuntary job
loss persist even after workers regain employment:
wage losses for re-employed displaced workers [in New Zealand] reach 12% in the first year
after displacement, compared with negligible wage effects in Germany and the United
Kingdom and a loss of 6% in the United States and Portugal. (p. 14)
Involuntary job loss also has an impact on future employment. Hyslop and Townsend (2017)
matched people who had lost work in New Zealand over 2001–10 with employees that had
similar characteristics but did not lose their jobs. They found that displaced workers had an
employment rate that was “20–25% lower in the year following displacement and, although their
employment gradually improved, was still 8–12% lower five years later” (p. ii).
The current income support system for unemployed people
New Zealand’s unemployment assistance is based on means-tested social assistance benefits,
which pay a flat rate and do not have a time limit. This is unusual internationally – most OECD
countries have a mandatory unemployment insurance (UI) programme, for which benefits are
time-limited, linked to previous earnings and are not income or asset tested (Fletcher 2015).
Figure 4.5 Unemployment assistance as a percentage of an average income, 2012
Source: OECD (2015a).
Note: Calculations are based on a 40-year old worker with a long and uninterrupted employment record. Average income includes cash incomes, income taxes and social security contributions paid by employees.
0%
20%
40%
60%
80%
100%First yearof unemployment
Average over five yearsof unemployment

26 Issues paper | Technological change and the future of work
Consequently, New Zealanders who lose their jobs face a sharper financial penalty in the short
term than those in many other developed countries (Figure 4.5). Over the long term, however,
New Zealand’s unemployment assistance is comparatively generous, though most people in
New Zealand are not unemployed for longer than one year (Figure 4.1).
Box 6 sets out some common features of unemployment insurance programmes in other OECD
countries. The Danish system, in particular, provides generous levels of income support with
strict requirements for searching for work, along with relatively loose employment protections
(Kahn 2010). This combination of policies is commonly referred to as ‘flexicurity’.
Outside of a narrowly defined set of employees2, there is also no statutory requirement in
New Zealand for employers to make redundancy payments to workers who lose their job. Hence,
redundancy provisions are mostly a matter of negotiation between employers and employees.
Of the roughly 20% of New Zealand employees covered by collective agreements, the vast
majority are entitled to redundancy compensation (OECD 2017a). While information on
provisions in individual employment agreements (IEAs) is more limited, research conducted in
2 Part 6A of the Employment Relations Act (ERA) provides additional protections for employees who provide cleaning services, food catering services, and caretaking or laundry services in the education, health and residential care sectors. According to the Act, these workers were selected because restructuring of businesses occurs frequently in their sectors, employee terms and conditions “tend to be undermined” by restructuring, and they have “little bargaining power” (section 69A, ERA 2000).
Box 6 Common features of unemployment insurance programmes
Contribution- or tenure-based support: to qualify for UI, employees must work for a
specified period of time, or make financial contributions toward the scheme, or both. In
some schemes, employers pay contributions as well.
Compulsory membership: to avoid problems of adverse selection, employee participation
in UI schemes is generally compulsory. However, in some countries, casual employees,
part-time workers and the self-employed are not covered or required to join.
Payment linked to previous earnings: in most UI schemes, unemployment payments are
linked to previous earning levels, ranging from 40% in Turkey to 90% in Denmark. UI
schemes often pay an initial high rate, which then falls to a lower proportion of previous
earnings after a set period of time (Fletcher 2015).
Time-limited payments: according to Fletcher, the maximum UI “entitlement periods vary
between 5 and 36 months, with most being between 9 and 24 months” (2015, p. 4).
Depending on the jurisdiction, individuals who are still unemployed when their UI
entitlement ends either fall back on more basic social assistance payments or are left to
their own devices.
Payment determined on an individual basis: unlike social assistance benefits, eligibility
for UI payments or the level of payments is not affected by the income received by other
household members.
Payment linked to work-readiness: to receive UI payments, recipients are typically
obliged to actively search for work and accept suitable offers of employment.
Labour market policies and institutions 27
2008 found that only 20% of staff employed in small to medium-sized enterprises on IEAs were
entitled to redundancy compensation (Public Advisory Group on Restructuring and
Redundancy 2008). Lower-skilled workers, younger workers and those with shorter tenure periods
are less likely to receive redundancy payments, and the median amount paid tends to increase
with tenure and seniority (OECD 2017a).
Coverage of income support
The current reliance on means-tested unemployment benefits (and absence of a legal
requirement for redundancy compensation) means that many unemployed people may receive
little to no income support. For instance, the OECD (2017a) noted that the “majority of displaced
workers do not receive or are not covered by welfare benefits in New Zealand” (p. 69). Much of
this ineligibility is due to the partners of these workers being employed, though this does not
explain all of the coverage gap. Other possible explanations include displaced workers returning
to study, poor information on benefit eligibility, under-reporting of benefit receipt in household
surveys and the stigma attached to welfare.
While income taxes are levied on each individual worker, access to income benefits (eg, job-
seeker benefit) depends on overall household income. This makes it much more difficult for
people who are unemployed and have a working partner to access income support. Of the
roughly 290 000 recipients of benefits in 2017, only 7.7% were couples. Fletcher (2018) argued
that linking benefit eligibility to household incomes has become increasingly out of step with
how New Zealanders live and work and an increasing source of problems for those in need of
social assistance” (p .2).
It is also not clear whether the eligibility criteria for the income support system is appropriate for
people who rely on non-permanent work. The Welfare Expert Advisory Group (2018) argued that
“the welfare system assumes a labour market based on a permanent 40 hour a week job. This is
outdated in a world where many people have jobs which are part time, casual, seasonal or
uncertain” (p. 1). This would become particularly important in a future where there is a significant
increase in the share of independent contract-based work.
Q13 How effective is the income support system in assisting different groups of
people? What specific challenges might arise under the future scenarios?
What changes to the system might be needed to address these challenges?
Some policy options for future scenarios
To reduce the impact of displacement for workers, Carey (2017) and the Public Advisory Group
on Restructuring and Redundancy (2008) recommended that policy makers in New Zealand
consider some form of unemployment insurance (UI). A similar option, recommended by the
OECD (2017a) is a levy-based redundancy compensation (LRC) system, where firms would
contribute an amount based on their payroll towards a national fund that could be used to
compensate workers if they are made redundant. Both approaches would have the advantage of
guaranteeing redundancy payments to employees in the case of firm bankruptcy, which may
become more common if the rate of technology change accelerates in the future (ie, in the More
tech & fewer jobs and More tech & more jobs scenarios).
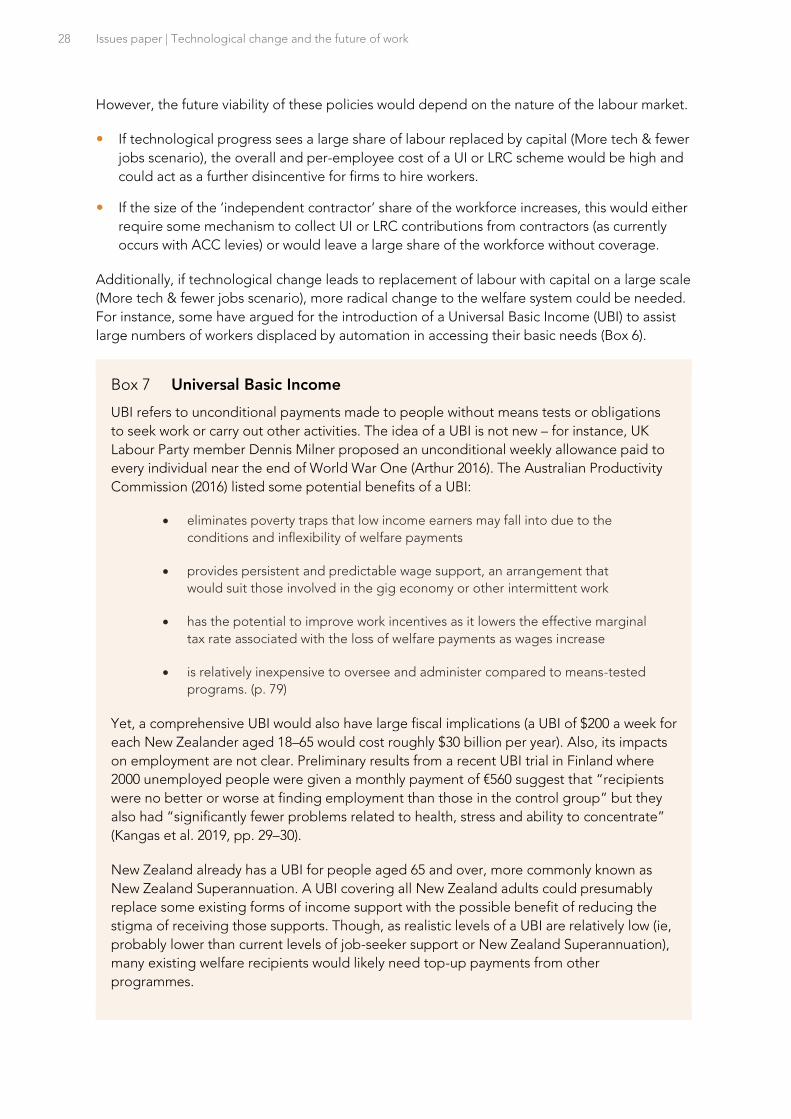
28 Issues paper | Technological change and the future of work
However, the future viability of these policies would depend on the nature of the labour market.
If technological progress sees a large share of labour replaced by capital (More tech & fewer
jobs scenario), the overall and per-employee cost of a UI or LRC scheme would be high and
could act as a further disincentive for firms to hire workers.
If the size of the ‘independent contractor’ share of the workforce increases, this would either
require some mechanism to collect UI or LRC contributions from contractors (as currently
occurs with ACC levies) or would leave a large share of the workforce without coverage.
Additionally, if technological change leads to replacement of labour with capital on a large scale
(More tech & fewer jobs scenario), more radical change to the welfare system could be needed.
For instance, some have argued for the introduction of a Universal Basic Income (UBI) to assist
large numbers of workers displaced by automation in accessing their basic needs (Box 6).
Box 7 Universal Basic Income
UBI refers to unconditional payments made to people without means tests or obligations
to seek work or carry out other activities. The idea of a UBI is not new – for instance, UK
Labour Party member Dennis Milner proposed an unconditional weekly allowance paid to
every individual near the end of World War One (Arthur 2016). The Australian Productivity
Commission (2016) listed some potential benefits of a UBI:
• eliminates poverty traps that low income earners may fall into due to the
conditions and inflexibility of welfare payments
• provides persistent and predictable wage support, an arrangement that
would suit those involved in the gig economy or other intermittent work
• has the potential to improve work incentives as it lowers the effective marginal
tax rate associated with the loss of welfare payments as wages increase
• is relatively inexpensive to oversee and administer compared to means-tested
programs. (p. 79)
Yet, a comprehensive UBI would also have large fiscal implications (a UBI of $200 a week for
each New Zealander aged 18–65 would cost roughly $30 billion per year). Also, its impacts
on employment are not clear. Preliminary results from a recent UBI trial in Finland where
2000 unemployed people were given a monthly payment of €560 suggest that “recipients
were no better or worse at finding employment than those in the control group” but they
also had “significantly fewer problems related to health, stress and ability to concentrate”
(Kangas et al. 2019, pp. 29–30).
New Zealand already has a UBI for people aged 65 and over, more commonly known as
New Zealand Superannuation. A UBI covering all New Zealand adults could presumably
replace some existing forms of income support with the possible benefit of reducing the
stigma of receiving those supports. Though, as realistic levels of a UBI are relatively low (ie,
probably lower than current levels of job-seeker support or New Zealand Superannuation),
many existing welfare recipients would likely need top-up payments from other
programmes.

Labour market policies and institutions 29
Q14 What are the advantages and disadvantages of the following policies under
each of the future scenarios – universal basic income, unemployment
insurance and redundancy compensation schemes? What other income
support policies are worth considering?
Active labour market policies
The TOR asks the Commission to look at how active labour market policies (ALMPs) can “assist
(or hinder) displaced workers to transition to different types of work and work places” (p. 4). The
primary aims of ALMPs are assisting people into work and reducing barriers to entering the
workforce. Examples include training programmes, wage subsidies and placement services.
Current expenditure on ALMPs is low by international standards …
Public expenditure on ALMPs as a share of gross domestic product (GDP) in New Zealand is
comparatively low by OECD standards (Figure 4.6). The resources committed to these
programmes have been falling over time “despite a significant increase in the number of
participants in active labour market programmes [since the global financial crisis]” (OECD 2017a,
p. 16).
Figure 4.6 Public expenditure on ALMPs as a share of GDP, 2016
Source: OECD (2017d).
A high proportion of New Zealand’s ALMP spending goes towards training programmes and
employment services, compared with other OECD countries. A comparatively small proportion is
spent on direct job creation (ie, offering temporary work, often in the public sector, to people
who are unemployed) and start-up initiatives.
Most ALMPs in New Zealand are delivered through, or on behalf of, Work and Income – a
delivery arm of the Ministry of Social Development (MSD). MSD runs several programmes with
industry and employers to help those unemployed to find work, while other projects target
specific high-needs groups such as youth, Māori, sole parents or people with health conditions
or disabilities. Box 8 describes two examples of current programmes.
0.0%
0.5%
1.0%
1.5%
2.0%
2.5%

30 Issues paper | Technological change and the future of work
… but there are mixed messages about their effectiveness and efficiency
ALMPs differ across jurisdictions, and evaluations have found mixed results. For example:
Card, Kluve and Weber’s (2010, p. 3) meta-analysis of 199 programme evaluations (covering
26 countries) concluded that job search assistance schemes had “generally positive impacts,
especially in the short run”, while subsidised public sector employment programmes were
“less likely to yield positive impacts”. Training programmes were less likely to have positive
results in the short-run but had higher impacts “after two years”.
Immervoll and Scarpetta’s (2012, p. 14) review of policies in OECD countries noted that
training schemes took time to have positive impacts on employment, and the results tended
to be “small or insignificant for men” and for basic education courses. Public-sector job
creation schemes mostly had negative effects, and evaluations of private sector job subsidies
did not “give a strong indication either way”.
Crichton and Maré (2013, p. iii) found that wage subsidies led to “significant employment and
earning benefits for assisted jobseekers [in New Zealand] over several years”. Subsidised
workers were “disproportionately hired into expanding firms”, although the authors could
not determine whether this would have occurred without the subsidy.
Since 2011, MSD has annually evaluated the effectiveness of its employment assistance
programmes and case management services, to inform purchase decisions. In its most recent
report, the Ministry found that 72% of expenditure on these services in 2016/17 went to
programmes rated as “effective or promising” (de Boer and Ku 2019).
The effectiveness of ALMPs could change under future scenarios. Under the More tech & more
jobs scenario with greater job churn and changes in the nature of work, ALMPs may be more
beneficial, as they can assist unemployed workers in finding, or gaining the necessary skills for,
work. In the More tech & fewer jobs scenario, government could consider using ALMPs to
encourage or facilitate job sharing (eg, by imposing limits on the number of hours a person
works) to maximise opportunities for people to participate in work.
Box 8 Examples of current ALMPs
Skills for Industry is one example of the programmes that MSD runs with industry and
employers in an effort to find jobs for their clients. MSD states that the programme:
allows us to work with employers to address their skill and labour requirements, while
maximising outcomes for our clients. Of the 110 clients we contracted to Accor Hotels,
74 percent were off benefit within eight weeks of completing the programme; and of
the 90 we contracted to Downer (New Zealand) Ltd, 77 percent were off benefit within
eight weeks of completing the programme. (2018, p. 60)
The $3k to Work scheme offers people on a main benefit (eg, job-seeker benefit) a
lump-sum payment of $3000 to support them in moving location for full-time work. In
2015/16, 301 people received grants (MSD 2016). Analysis by Taylor Fry (2017) “found
that 68% of grant recipients were still off benefit after four quarters. This is higher than
48% for matched sample of clients with similar backgrounds who did not receive the
grant” (p. 4).

Labour market policies and institutions 31
Q15 How might the effectiveness of active labour market policies change under
the future scenarios? What changes would be needed to the design of
active labour market policies under each scenario? What other active
labour market policies might be needed?
Occupational regulation
People are more able to adjust to technological disruption and find suitable employment if they
are able to change their occupation. In some cases, the design of occupational regulations can
influence how easy or difficult it is for workers to make this transition. According to Greenwood
and Menclova (2018), 28% of workers’ “primary occupations” are affected by occupational
regulation in New Zealand (p. 21). This is lower than comparable figures in the United States
(35%) but in line with numbers reported for the United Kingdom.
When well-designed and implemented, occupational regulation can serve many beneficial ends,
such as incentivising higher-quality service and protecting the public from harm. However, such
regulation can create wider economic costs and barriers to entering occupations. An Obama
White House policy report (2015) estimated that in the United States, licensing restrictions cost
millions of jobs nationwide and raised consumer expenses by over one hundred billion dollars.
The report suggested that barriers imposed by licensing can prevent workers from succeeding in
the best job for them which makes the labour market less efficient. It also noted that
occupational regulation may struggle to keep pace with technology-driven changes to the
nature of work and education, such as telework and distance learning.
The Commission has heard that occupational regulation can create employment barriers to
people who have had time out of employment. For example, in their submission to the tertiary
education inquiry, the New Zealand Union of Students’ Associations said that the cost of re-
registering as a teacher “represents a real barrier”.
[The] process of becoming re-registered as a teacher following time without a permanent
position was a significant cost and ‘frankly anti-women’. Teachers whose registration lapses
are required to pay $4 000 to undertake a course to be deemed competent. This $4 000 is
unable to be funded by the SLS [Student Loan Scheme] as it is not a qualification
(sub. DR139, New models of tertiary education, p. 9)
Barriers to entry created by occupational regulation could be particularly problematic in the
More tech & more jobs scenario, where there is faster depreciation of human capital and a
greater need for people to change occupations mid-career. As technology complements
workers in this scenario, the inclusion of provisions for workers to update their skills within
occupational regulation would be important. The More tech & fewer jobs scenario, where a
greater share of labour tasks are automated, may also invite regulation that specifies who can
perform a job (eg, a qualified person, a robot or a lower-skilled person with the aid of
technology).
Q16 Are there particular areas where occupational regulation makes it harder
for people to shift jobs or adjust to technological change? Would this
change under each of the future scenarios?

32 Issues paper | Technological change and the future of work
5 Education and skills supply
Whatever the future may hold, the skills of workers and managers are important for employee
adaptability, firm productivity and economic growth. Recent experience suggests that ongoing
technological change is likely to favour higher-skilled workers and tasks that are not routine or
easily automatable (Carey 2017; World Bank 2019). And as digital technology becomes more
pervasive in society, having the skills to effectively access, use and create digital content
(referred to as ‘digital literacy’) is assuming increasing importance.
How well are New Zealand’s current education and wider labour market policies supporting the
acquisition of skills that are needed to succeed in New Zealand’s workforce? And how well
positioned is the education system to respond to new demands brought about by future
technological change and new work environments, or for a future where people seek to develop
skills to compete in a world where growth is stagnant?
Outcomes and performance of New Zealand’s skills system
Secondary education
Participation in education among 15 to 19-year-olds is below the OECD average (OECD, 2018).
However a relatively large share of young people not in education are employed and the share
of 18 to 24 year-olds not in employment, education or training is well below the OECD average
(Norgrove and Scott 2017).
In 2016, 83% of 25 to 34-year-olds had attained education equivalent to a National Certificate of
Educational Achievement (NCEA) Level 2 qualification or higher. NCEA Level 2 is the
New Zealand equivalent of ‘upper secondary’ attainment, and this is generally considered a
minimum level needed to equip citizens and societies to do well. New Zealand is slightly below
the OECD average of 85% on this measure. However, attainment rates for 25 to 34-year-olds will
not fully reflect recent gains in achievement recorded among school leavers (Norgrove and
Scott 2017).
Static or declining achievement in core skills
The competence of 15-year-old New Zealanders on standardised tests of literacy, numeracy
(Figure 5.1) and science has declined over time. Although New Zealand’s mean scores on the
OECD’s Programme for International Student Assessment (PISA) tests remain above OECD
averages, this gap has closed in recent years. Large differences persist between the mean scores
of different groups of students in New Zealand.

Education and skills supply 33
Figure 5.1 PISA scores in reading and maths
Source: May, Flockton and Kirkham (2016).
Tertiary education
The overall level of tertiary attainment in the New Zealand adult population is high relative to
other OECD countries. This is largely due to the relatively high share of the population with a
Level 4 tertiary qualification.3
Figure 5.2 Tertiary education attainment rates in selected OECD countries, 2016
Source: OECD (2018)).
Note: Qualification groupings are based on the approach used by Norgrove and Scott (2017).
3 Level 4 qualifications are certificates that typically require one year of full-time study. Graduates are expected to gain broad operational or theoretical knowledge in a field of work or study.
400
420
440
460
480
500
520
540
2000 2003 2006 2009 2012 2015
Reading
New Zealand OECD
Maori Pasifika
400
420
440
460
480
500
520
540
2003 2006 2009 2012 2015
Maths
New Zealand OECD
Maori Pasifika
400
420
440
460
480
500
520
540
2006 2012
New Zealand OECD Maori Pasifika
0%
10%
20%
30%
40%
50%
60%
70%
80%
Level 4 Diploma Bachelors Degree Masters or Doctorate

34 Issues paper | Technological change and the future of work
High levels of ongoing learning
In the past decade, policy settings have oriented the tertiary system toward school leavers
studying full-time, and the share of students in this demographic has grown (NZPC 2017).
Nevertheless, participation rates among adults are high. In 2015:
4% participated in formal education (eg, a programme of study at a university or other formal
education institution);
50% participated in non-formal education (any sustained education activity outside the above
definition of formal education, such as a privately arranged on-the-job training session); and
14% participated in both formal and non-formal education (OECD 2017b).
Despite high levels of participation, 38% of adults in New Zealand stated that they wanted to
participate in more learning activities but were unable to – much higher than the OECD average
of 24%. As with most other OECD countries, the main barrier to further participation in education
(raised by 30% of New Zealanders) was being too busy at work. Family responsibilities or child
care were also reported as a barrier to further participation with 19% giving this reason
compared with the OECD average of 15% (Norgrove and Scott 2017, pp. 34–35).
New Zealand adults also have higher average literacy, numeracy and problem solving skills
compared with those in the OECD or other “Anglo” countries (Figure 5.3).
Figure 5.3 Adult proficiency in key information-processing skills selected OECD countries, 2013 and 2015
Source: OECD (2016b).
Note: The figure shows mean proficiency scores of 16–65 year-olds in literacy and numeracy, and the percentage of 16–65 year-olds scoring at Level 2 or 3 in problem solving in technology-rich environments.
Q17 How well do the current outcomes from the education and skills system
position New Zealand to respond to changing technology and different
future scenarios?
0
10
20
30
40
50
0
50
100
150
200
250
300
350
Literacy (Left axis) Numeracy (Left axis) Problem solving in technology-rich environments (Right axis)

Education and skills supply 35
Skills supply from immigration
While the domestic education and skills system is very important in equipping people to excel in
the labour market, New Zealand also gains (and loses) skills through immigration. Historically,
inward and outward migration have tracked reasonably closely. However, over the past five years
a significant gap has opened where inward migration has significantly outpaced outward
migration (Figure 5.4).
In 2018, well over 100 000 migrants (not including many temporary workers) joined
New Zealand’s working age population. This is roughly double the yearly number of domestic
New Zealand residents turning 15 (and therefore becoming part of the working age population
of the future).
Figure 5.4 Arrivals, departures and net migration, 1990–2018
Source: Stats NZ (2018).
Migrants can bring valuable skills to the workforce. For instance, migrants can temporarily fill
gaps in specific skills under New Zealand’s Essential Skills Policy. High-skilled migrants can
increase the skill composition of the workforce. When matched with the right job, they can also
encourage technological diffusion by improving firm exports and innovation (Conway 2016). Yet,
while survey data suggests that New Zealand’s overseas-born population is more skilled than
those in other OECD countries, the average migrant worker in New Zealand is less skilled than
the average domestic worker, and many migrants appear to be engaged in low to medium skill
work.
The impacts of future technological change may call for government to adjust New Zealand’s
approach to immigration. For example, in the More tech & fewer jobs scenario, where much
labour is replaced with capital leading to higher unemployment, there could be pressure on
government to limit immigration. Alternatively, under the More tech & more jobs scenario, where
there is rapid technological change but lots of new types of jobs, high-skilled immigration may
be particularly useful in industries or occupations where there are emerging skill shortages.
Q18 What changes to immigration policy to address skills needs might be
required under different future scenarios?
-20 000
0
20 000
40 000
60 000
80 000
100 000
120 000
140 000
2000 2002 2004 2006 2008 2010 2012 2014 2016 2018
Net migration Arrivals Departures

36 Issues paper | Technological change and the future of work
People with very low skills
While New Zealand ranks relatively well in measures of adult skills, a sizeable share of adults
surveyed in the OECD’s Survey of Adult Skills had very low skills. About 20% of adults scored at
or below Level 1 in either literacy, numeracy, or both. Adults at this level can successfully
complete reading tasks that involve only short and simple texts, and mathematics tasks involving
only basic operations.
This group are likely at a high risk of being marginalised in terms of both labour market
outcomes and broader participation in society, irrespective of the extent of future technological
change. Also, the OECD note that higher levels of literacy and numeracy facilitate further
learning, creating a virtuous cycle of further upskilling for adults with high proficiency. However,
lower-skilled adults risk getting trapped in a vicious cycle where “they rarely benefit from adult
learning, and their skills remain weak or deteriorate over time” (OECD 2013, p. 17).
Improving adult literacy and numeracy is listed as a priority in the 2014–2019 Tertiary Education
Strategy. The Tertiary Education Commission (TEC) is the main government agency that funds
interventions designed to improve adult literacy and numeracy. Examples include the Intensive
Literacy and Numeracy Fund ($12.6 million allocated in 2018) and the Workplace Literacy and
Numeracy Employer-led funding ($21.2 million in 2018) (TEC 2018b).
Q19 What, if any, further measures are needed to improve skills among adults
with low proficiency to enable them to successfully participate in any future
labour market?
Those without digital skills are also likely to struggle
Related to the broader issue of very low skills, is the question of how New Zealand can address
digital divides. The term ‘digital divide’ has generally been used to refer to variability in the
ability of different groups to access and use the internet and other technology. Related terms
include ‘digital literacy’ which emphasises the skills required to use the internet and ICT, and
‘digital inclusion’ which emphasises access and skills, along with motivation to use the internet
and trust in online services (Digital Inclusion Research Group 2017).
Digital skills are increasingly important as nearly all forms of work are becoming more digitalised.
One American study examined how computer use in occupations has changed over the past
15 years. Almost all occupations saw increasing use of computers, including many traditionally
viewed as low-digital such as home health aides and heavy truck drivers. The study noted that
“dramatic task change is occurring among some of the most traditionally accessible occupations
that have historically allowed new or less-skilled or -educated workers to find decent
employment” (Muro et al. 2017, p. 17).
Similar trends are evident in New Zealand, with increasing digital skill requirements in
occupations, such as dairy farming, that traditionally may have been viewed as low-skilled or non-
digital. The dairy farming industry strategy 2017–2025 noted that technology features just as
much as manual labour in modern dairy farming, and that further development of technical
expertise is essential to the success of the dairy farming sector (Dairy New Zealand, 2017).
Education and skills supply 37
The Digital Inclusion Research Group (2017) noted that unlike some other countries,
New Zealand does little to measure digital inclusion or online engagement. However, available
data points toward rapid growth in availability, uptake and use of the internet.
Improvements to the telecommunications network are being delivered through the
Government’s ultra-fast broadband programme (UFB). UFB aims to bring fibre broadband
access to 87% of the population by 2022, while the Rural Broadband and Mobile Black Spots
initiatives are improving wireless coverage in rural areas not covered by UFB. Together, these
will provide coverage to 99.8% of the population (Crown Infrastructure Partners 2018).
Household internet access is also increasing, from 37% in 2001 to 77% in 2013 – figures for
2018 will be available when the results of the 2018 census are released (Stats NZ 2019a).
Broadband data consumption increased from 13 000 terabytes in June 2011 to
292 000 terabytes in June 2018 (Stats NZ 2018b), although it is unclear how evenly use is
distributed across households and firms. 96% of firms used the internet in 2014, up from 93%
in 2008 (Stats NZ 2019b).
Despite increases in the availability and uptake of the internet and other digital technologies,
Lips (2015) argued that New Zealand continues to experience divides between digital-rich and
digital-poor people. The most digitally excluded groups were identified as adults with
disabilities, children with special needs, Pasifika, Māori, senior citizens, people from low socio-
economic backgrounds and those living in regions or communities with low internet uptake
rates. Underlying drivers of digital exclusion include cost of access, lack of knowledge or skills
(leading to low confidence and trust when using the internet), and unwillingness to provide
personal details via online channels (Lips 2015).
The Commission is aware of several initiatives aimed to reduce digital divides (Box 9) but is
interested in further information on the scale of digital divides in New Zealand, its
consequences – particularly for labour market participation – and how any divide can be closed.
Box 9 Examples of initiatives to close digital divides
Rata Street School access pilot
Rata Street School in Lower Hutt estimates that half of its students do not have internet
access at home. Te Awakairangi Access Trust is leading an initiative to give students access
to the same internet they get at school (the Managed Network) using devices supplied by
the school. The initiative is supported by Hutt City Council, the Ministry of Education, Rata
Street School, Network for Learning (N4L) and Chorus (Education Central 2018).
Manaiakalani Education Trust
Manaiakalani is an education programme achieving significant improvement in student
achievement outcomes for 12 low-decile schools in the Tamaki Basin, Auckland (Digital
Inclusion Research Group 2017). The Trust supports parents to buy a digital device for each
learner, facilitates internet access, and enables families to engage more closely in their
children’s learning (Hipkins, Whatman and MacDonald nd). Manaiakalani has developed its
own digital pedagogy and has training processes in place to upskill existing teachers and
new graduates in how to teach in digital learning environments.

38 Issues paper | Technological change and the future of work
Q20 What evidence is there of digital divides in New Zealand? What are the
consequences for labour market participation and which groups are most
disadvantaged?
Q21 What, if any, further measures are needed to address any digital divides in
New Zealand?
Disjunct between education and employment
Good matches that meet both the needs of workers and employers boost productivity, by
ensuring that workers’ skills fit well with the requirements of their roles. But available data on the
current supply and matching of skilled workers suggests that New Zealand’s education and
training system is not as well-aligned with the world of work as it could be. For example,
managers of New Zealand firms with 10 or more employees reported relatively high levels of
skills shortages compared with other Anglo countries (Figure 5.5).
Figure 5.5 Percentage of firms reporting difficulties filling vacancies, 2006–2018
Source: OECD (2016); ManpowerGroup (2018).
However, in contrast to reported shortages in skilled workers, data recently collected through
the OECD’s Survey of Adult Skills shows that New Zealand workers report being over-qualified
for their job at a high rate relative to other countries.
The survey asked workers what would be the usual qualifications, if any, “that someone would
need to get (their) type of job if applying today” (OECD, 2016c). 34% of New Zealand workers
reported holding higher qualifications than required to get their jobs (compared with an average
of 22% among participating countries). 11% reported they have lower qualifications than
required to get their jobs (compared with an average of 13%) (OECD 2016b).
The survey also measured the match between workers’ literacy skills and those required in their
work, and how closely workers’ qualifications matched their occupation in terms of field of
0%
10%
20%
30%
40%
50%
60%
70%
2008 2010 2012 2014 2016 2018
New Zealand Australia Canada United Kingdom Global total
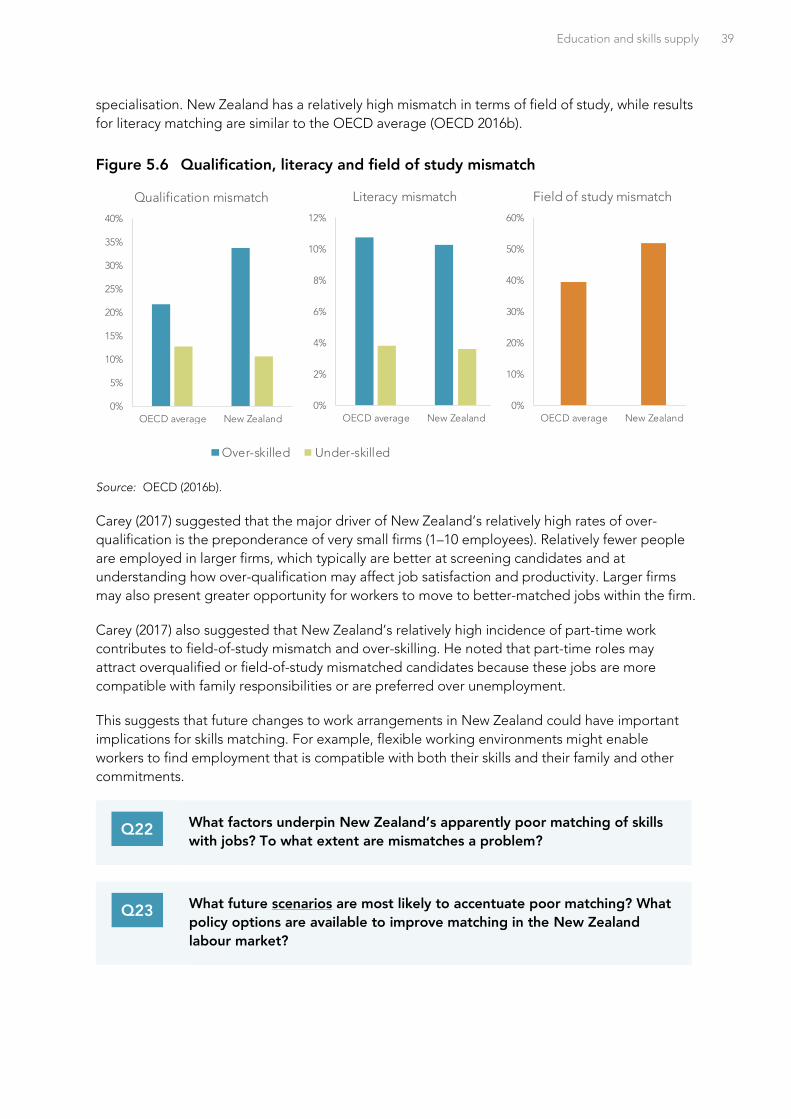
Education and skills supply 39
specialisation. New Zealand has a relatively high mismatch in terms of field of study, while results
for literacy matching are similar to the OECD average (OECD 2016b).
Figure 5.6 Qualification, literacy and field of study mismatch
Source: OECD (2016b).
Carey (2017) suggested that the major driver of New Zealand’s relatively high rates of over-
qualification is the preponderance of very small firms (1–10 employees). Relatively fewer people
are employed in larger firms, which typically are better at screening candidates and at
understanding how over-qualification may affect job satisfaction and productivity. Larger firms
may also present greater opportunity for workers to move to better-matched jobs within the firm.
Carey (2017) also suggested that New Zealand’s relatively high incidence of part-time work
contributes to field-of-study mismatch and over-skilling. He noted that part-time roles may
attract overqualified or field-of-study mismatched candidates because these jobs are more
compatible with family responsibilities or are preferred over unemployment.
This suggests that future changes to work arrangements in New Zealand could have important
implications for skills matching. For example, flexible working environments might enable
workers to find employment that is compatible with both their skills and their family and other
commitments.
Q22 What factors underpin New Zealand’s apparently poor matching of skills
with jobs? To what extent are mismatches a problem?
Q23 What future scenarios are most likely to accentuate poor matching? What
policy options are available to improve matching in the New Zealand
labour market?
0%
5%
10%
15%
20%
25%
30%
35%
40%
OECD average New Zealand
Qualification mismatch
0%
2%
4%
6%
8%
10%
12%
OECD average New Zealand
Literacy mismatch
0%
10%
20%
30%
40%
50%
60%
OECD average New Zealand
Field of study mismatch
0%
2%
4%
6%
8%
10%
12%
OECD average New Zealand
Literacy mismatch
Over-skilled Under-skilled

40 Issues paper | Technological change and the future of work
Weak links between employers and education providers
In its inquiry into new models of tertiary education, the Commission (2017) found multiple
avenues by which employers can influence what is offered by tertiary providers. These include
engagement with curriculum development and NZQA quality assurance processes, and
education providers conducting surveys of local firms.
In addition, the industry training system provides a formalised approach to learning in the
workplace. Industry training is overseen and arranged by 11 Industry Training Organisations
(ITOs), involves a mix of on-the-job training and off-job provision, and includes apprenticeships
and shorter bursts of training. The design of the industry training system encourages close links
between ITOs and employers and training is part-funded by industry.
But despite these mechanisms to facilitate employer input into the education system, there is a
long-standing perception that many parts of the tertiary education system are poorly connected
to industry. The Commission identified two significant incentives contributing to this issue:
employers had “muted” incentives to engage with education providers, because of relatively
easy access to skilled migrants (in recent years, immigration has been a much larger source of
new skills to the labour market than local population growth), and
providers lacked incentives to respond to employer input “as the majority of their revenue
comes from government” (NZPC, 2017, p. 91).
Q24 How well does New Zealand’s education and training system reflect the
changing skill needs of industry? Is the education and training system able
to effectively respond to changing technology and different future
scenarios?
Retraining and preparation for changing job requirements
Many submitters to the Commission’s inquiry into new models of tertiary education noted that
technological change will increasingly require workers to retrain and upskill throughout the
course of their life. This idea, which is sometimes referred to as ‘lifelong learning’, is not new. In
the late 1980s, a major education review set an expectation that New Zealand’s tertiary system
should have an increasing role in lifelong learning where workers “maintain their skill level,
acquire new skills to modernise methods and practices in line with technological and social
change, and retrain …” (Hawke, 1988, p. 16).
Despite widespread agreement that lifelong learning is already important, and will likely take on
even greater importance in the future, the Commission identified several barriers to mid-career
retraining. These included funding and regulatory settings for tertiary education that focus on
younger, full-time learners completing full qualifications, restrictions on the provision of short
programmes of study, the design of the student support system, and funding rules that make
recognition of prior learning difficult.
One recent change designed to address these shortcomings is NZQA’s introduction of a micro-
credential system as part of New Zealand’s regulated education and training system. Micro-
credentials are smaller than qualifications and focus on skill development opportunities not
currently catered for in the tertiary education system, and for which there is strong evidence of

Education and skills supply 41
need by industry, employers, iwi and community. One purpose of the micro-credential system is
to “help ensure that the New Zealand education and training system remains relevant in a period
of fast paced social, economic and technological changes” (NZQA 2018).
The Commission is interested to learn more about the availability and effectiveness of any
education programmes designed to upskill, retrain, or adapt to changing technology. More
broadly, the Commission is interested in feedback as to how the education and skills system
might respond to a significant increase in demand for mid-career training.
Q25 What programmes exist to support people to retrain, upskill or adapt to
changing technology, and how effective are they?
Q26 How well equipped is New Zealand’s education and skills system to
support people to adapt to technological change over the course of their
careers?
The Commission is also interested in the role of firms in upskilling staff through on-the-job
training and professional development opportunities. In particular, the Commission is interested
in how the incentives for firms to invest in staff training might change under each of the future
scenarios. For example, under the More tech & more jobs scenario, higher job churn may reduce
incentives for employers to invest in upskilling staff, meaning that the costs of upskilling
increasingly fall on the individual and the state.
Q27 How might the incentives for firms to invest in staff training change under
each of the Commission’s future scenarios? Under which scenarios would
there be a case for greater government investment in firm-based training?
Advice about careers and education
Quality information and careers advice is one factor that can improve matching and the linkages
between the education and training system, and employment. The Commission has previously
identified widespread concern about how well school leavers transition into tertiary education
and how well the compulsory education system prepares them for further learning. Concerns
have also been raised about careers advice at schools, and beyond.
We need to help young people and those within the tertiary education system itself develop
capabilities – skills, attitudes, knowledge, values – to enable lifelong and lifewide
management of work and learning. We think career management competencies would be
most effective woven throughout the school and its activities, including subject classes (ie,
not confined to the school careers department activities). (NZCER 2016, p. 1)
The need to refocus our system back to its earlier lifelong learning goals also means this
guidance must be available throughout adulthood. (Tertiary Education Union 2016, p. 4)
The TEC (whose legislative functions expanded in 2017 to include the functions and services of
Careers New Zealand) has been designing a new strategy for the whole careers system. The TEC
noted that traditionally, “career services in New Zealand have prioritised supporting young

42 Issues paper | Technological change and the future of work
people to transition from secondary to tertiary education or into the workplace” (2018a, p. 18).
The TEC’s new careers strategy recognises that “people will increasingly need the confidence,
resilience and skills to steer their careers through periods of technological disruption” (2018a, p.
18).
Q28 What changes are needed to provide prospective students, including
adults and those already part-way through a career, with the skills needed
to make informed decisions about education and careers?
Other impacts of future scenarios on skills supply and demand
The Commission has previously found that, despite the presence of many innovative teachers
and groups of teachers, the tertiary education system lacks the dynamism necessary for
innovative approaches to scale up and transform education delivery. This stemmed largely from
the pervasive control that government exerts over the tertiary system through funding and
regulatory rules. These combine to constrain the ability of providers to innovate, drive
homogeneity in provision, and limit the flexibility and responsiveness of the system as a whole
(NZPC 2017).
This diagnosis is concerning given that changes in skill demand are likely in future scenarios. As
noted above, many people already believe that the tertiary system is too heavily geared toward
‘front-loading’ skills and more retraining and upskilling models are needed. This issue would
likely amplify in the More tech & more jobs scenario.
By contrast, the Stagnation scenario, where technological change slows and income growth
stagnates, might signal a need for greater investment in a model of education where individuals
complete compulsory education and then undertake qualifications with a particular occupation
in mind. Upskilling and retraining might assume less importance.
In the More tech & fewer jobs scenario, where a much larger share of jobs are replaced by
technology, people might increasingly view education (particularly tertiary education) as an end
in itself, rather than a something that is undertaken with a specific career in mind. Accordingly,
the types of qualifications and programmes of study available would need to change to
accommodate larger numbers pursuing their personal interests and government might consider
allocating larger amounts of funding toward subject areas with minimal employment prospects.
Alternatively, a rising degree of automation may lead some people to pursue ever-higher levels
of education to distinguish themselves from others and compete for a limited number of
available jobs.

Firm and economic policies 43
6 Firm and economic policies
The impact of technological change on New Zealand’s labour market and wider society is not
pre-determined. As discussed in the previous chapters, governments have choices over the
policies and rules they set for the labour market, income support and education system.
Governments also have choices about the wider economic policies they set to encourage the
creation and adoption of new technologies, and maximise opportunities for New Zealanders.
Having a vibrant and innovative private sector matters for New Zealand’s productivity and
income growth, and for the range and quality of jobs, services and experiences it provides to
workers and consumers in the future. Greater participation in global markets also provides more
opportunities to earn incomes, allowing a small open economy like New Zealand to better
manage the transitions resulting from technological change. This section examines what is
known about innovation, technology uptake and firm capability in New Zealand, outlines some
possible grounds for New Zealand’s poor performance and asks questions about future policy
settings.
Innovation and capability levels within New Zealand firms
Many New Zealand firms are using technology to add value and grow. A few examples are
outlined in Box 10.
Box 10 Some leading New Zealand technology firms and their services
Aider is an Auckland-based artificial intelligence firm, which has developed a digital
assistant for small firms. The assistant connects to cloud services such as Xero, Google
Analytics, Facebook and staff timetables and payroll applications. Clients can talk or
have text conversations with Aider about any aspects of their business and its
performance and can organise a range of activities – such as paying invoices,
scheduling tasks, tracking and analysing sales and expenses and rostering staff.
Jade Software developed a chatbot (called ‘Alfred’) for Australian life insurance
comparison service Lifebroker. Alfred collects real-time information from clients in a
conversational manner and can provide quotes for life insurance cover within five
minutes of messaging, 24 hours a day. Another Jade Software program used a machine
learning algorithm to identify tertiary education students at risk of dropping out,
allowing educators to intervene and support those students pro-actively.
Scott Technology is a Dunedin-based advanced automation and robotics company,
providing products and services for materials handling, processing, packaging and
logistics. It has grown rapidly over the past decade with annual revenue increasing from
$31 million in 2009 to $184 million in 2018, and has expanded overseas with production
bases in the US, Germany, France, Czech Republic, Belgium, China and Australia.

44 Issues paper | Technological change and the future of work
However, based on currently available aggregate statistics, New Zealand firms appear to exhibit
low to middling levels of innovation and capability, as measured by indicators such as R&D, new
methods of operating and management practices.
Low levels of R&D
One frequently used measure of business innovation is expenditure on R&D as a share of GDP.
By international standards, government and business both spend relatively little on R&D
(Figure 6.1).
Figure 6.1 Government and business expenditure on R&D as a share of GDP, 2011 and 2015 (selected OECD countries)
Source: OECD (n.d.).
Moderate uptake of new ways of operating
Another way of assessing innovation levels in firms is to measure their uptake of new ways of
operating. The OECD outlines four types of firm-level innovation.
Product innovation: the introduction of a good or service that is new or significantly
improved with respect to its characteristics or intended uses.
Process innovation: the implementation of a new or significantly improved production or
delivery method. This includes changes in techniques, equipment and/or software.
Marketing innovation: the implementation of a new marketing method involving changes in
product design or packaging, product placement, product promotion or pricing.
Organisational innovation: the implementation of a new organisational method in the firm’s
business practices, workplace organisation or external relations. (OECD 2017e, p. 154)
New Zealand firms perform relatively poorly on these types (Figure 6.2).
0%
1%
2%
3%
4%
5%Government expenditure
2011 2015
0%
1%
2%
3%
4%
5%Business expenditure
2011 2015

Firm and economic policies 45
Figure 6.2 Percentage of total firms exhibiting innovation, by type (2017, selected OECD countries)
Source: OECD (n.d.).
Widespread use of high-performance workplace practices
The way in which firms organise their internal processes and staff can affect their productivity.
High-performance workplace practices (HPWP) refers to a set of techniques that include:
aspects of work organisation – team work, autonomy, task discretion, mentoring, job
rotation, applying new learning – and management practices – employee participation,
incentive pay, training practices and flexibility in working hours. (OECD 2016a, p. 79)
Internationally, the prevalence of HPWP varies by industry, occupation, hours worked and type of
employment contract. It is more common amongst managers and professionals, full-time and
permanent workers and in information-based industries (OECD 2016a).
According to the OECD (2016a) and Carey (2017), 31% of New Zealand workers are in jobs where
high-performance work practices are applied at least once per week, the 7th highest frequency of
29 OECD countries. Most high-performance work practices in New Zealand relate to training and
flexible working hours, with bonuses being relatively uncommon (Figure 6.3).
Research into high-performance workplace practices in New Zealand firms suggests that they
can increase employee retention, firm productivity and market share (Fabling and Grimes 2010;
Guthrie 2001), but reached mixed conclusions about its impact on firm profitability.4 In line with
international literature, the uptake and impact of these HPW practices was found to vary by
sector, firm size and age (Fabling and Grimes 2010, 2014).
4 Fabling and Grimes (2010) found a link between high performance work practices on firm profitability, but did not in later work (2014). They attributed the lack of an effect on profitability in their 2014 research in part to “the adoption of performance pay systems [which] raises average wages in the firm” (p. 1095)
0%
10%
20%
30%
40%
50%
60%
Marketing Organisation Process Product
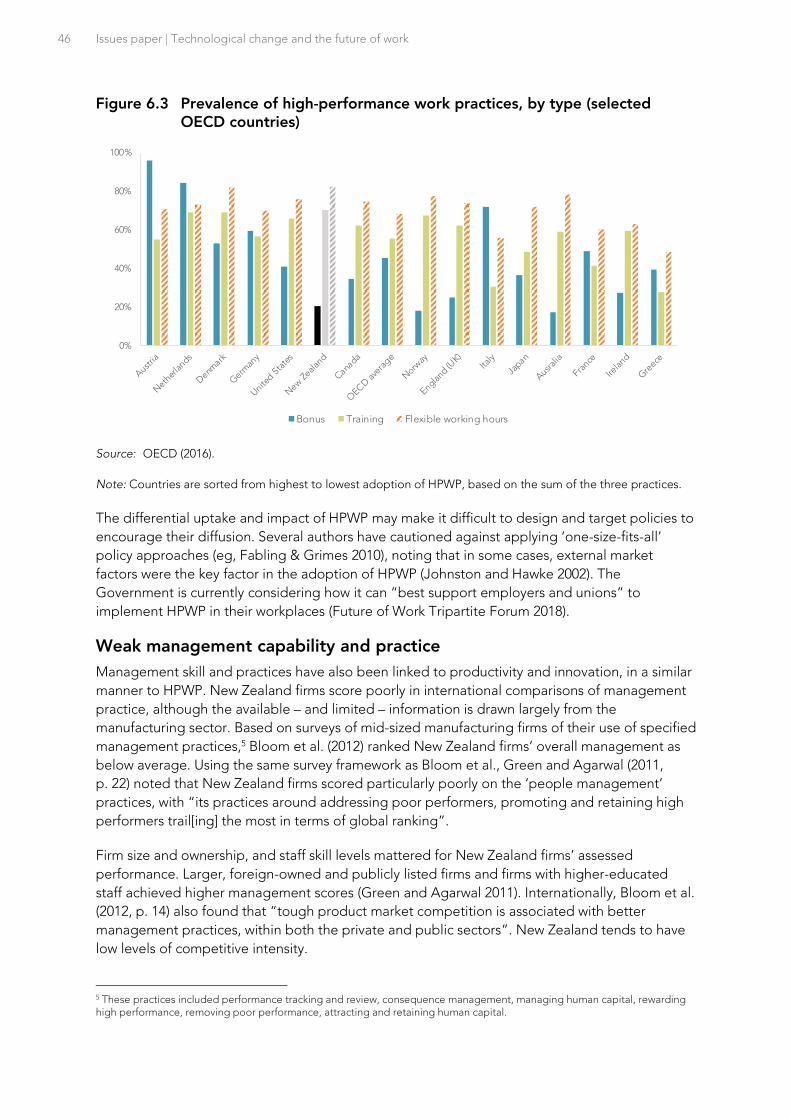
46 Issues paper | Technological change and the future of work
Figure 6.3 Prevalence of high-performance work practices, by type (selected OECD countries)
Source: OECD (2016).
Note: Countries are sorted from highest to lowest adoption of HPWP, based on the sum of the three practices.
The differential uptake and impact of HPWP may make it difficult to design and target policies to
encourage their diffusion. Several authors have cautioned against applying ‘one-size-fits-all’
policy approaches (eg, Fabling & Grimes 2010), noting that in some cases, external market
factors were the key factor in the adoption of HPWP (Johnston and Hawke 2002). The
Government is currently considering how it can “best support employers and unions” to
implement HPWP in their workplaces (Future of Work Tripartite Forum 2018).
Weak management capability and practice
Management skill and practices have also been linked to productivity and innovation, in a similar
manner to HPWP. New Zealand firms score poorly in international comparisons of management
practice, although the available – and limited – information is drawn largely from the
manufacturing sector. Based on surveys of mid-sized manufacturing firms of their use of specified
management practices,5 Bloom et al. (2012) ranked New Zealand firms’ overall management as
below average. Using the same survey framework as Bloom et al., Green and Agarwal (2011,
p. 22) noted that New Zealand firms scored particularly poorly on the ‘people management’
practices, with “its practices around addressing poor performers, promoting and retaining high
performers trail[ing] the most in terms of global ranking”.
Firm size and ownership, and staff skill levels mattered for New Zealand firms’ assessed
performance. Larger, foreign-owned and publicly listed firms and firms with higher-educated
staff achieved higher management scores (Green and Agarwal 2011). Internationally, Bloom et al.
(2012, p. 14) also found that “tough product market competition is associated with better
management practices, within both the private and public sectors”. New Zealand tends to have
low levels of competitive intensity.
5 These practices included performance tracking and review, consequence management, managing human capital, rewarding high performance, removing poor performance, attracting and retaining human capital.
0%
20%
40%
60%
80%
100%
Bonus Training Flexible working hours

Firm and economic policies 47
A growing gap between the stars and the rest
Productivity growth is driven, at least in part, by the diffusion of new technologies from the
leading ‘frontier’ innovative firms into the rest of the economy (Conway 2016). Where
technologies diffuse broadly and rapidly, productivity growth is faster. This process of diffusion
appears to have largely broken down in New Zealand.
This ‘breakdown’ has two elements. First, New Zealand’s leading firms lag behind their
equivalent international frontier firms in terms of productivity. Conway (2016) found that the
labour productivity levels of leading New Zealand firms are about one-third lower than the top
foreign firms. This suggests that world-leading technologies and practices are not being taken
up as quickly in New Zealand as they could be. Second, diffusion of technologies within
New Zealand appears to be slow. Zheng (2016) found that productivity growth in New Zealand’s
‘national frontier firms’ over 2000–12 was 2.2 times faster than ‘laggards’, leading to an increasing
productivity gap. This suggests barriers to the transmission of ideas and technology and the
reallocation of resources from low-productivity to higher-productivity firms.
What might account for these results?
A growing body of local evidence, much of it drawing off micro- and firm-level data, lays out
some of the reasons for the poor productivity and innovation performance of New Zealand firms.
New Zealand’s small size, geographic distance from other markets and the preponderance of
small firms in its economy are recognised as contributing factors.
Low tradability
Tradability refers to the “distance between where a product is produced and where it is
purchased” (Conway and Zheng 2014, p. 1). Higher levels of tradability are associated with
greater productivity growth, due to the scope for agglomeration benefits from co-location with
other firms in the same industry, and the “greater potential for increased scale and … more
intense competition from rival producers situated in other domestic and international locations”.
Tradability in New Zealand is highest in the primary sectors, followed by the goods-producing
and services sectors. Conway and Zheng (2014, p. 22) noted that the growing role of services in
the economy, and the fact that many of these firms “still produce output that is difficult to trade
over distance and export to a much smaller extent” than firms in other sectors, may have
“negative implications for scale and specialisation”. Conway, Meehan and Zheng (2015) similarly
found that firms in parts of the services sector were taking longer to catch up to leading firms at
the frontier than firms in other sectors. Part of this slowness may be due to the fact that tradable
firms have stronger incentives to adopt technologies from nationally leading firms, whereas non-
tradable firms tend to draw their examples from a smaller, local pool of experience (Zheng 2016).
Low returns to innovation
Wakeman and Conway (2017) explored the impact of innovation activities on the performance of
New Zealand firms to test whether such activities pay off (eg, in employment, value-added and
productivity). They found that, on average, while product innovating firms grew at a faster rate
than non-innovators, they did not experience productivity gains.6 This result contrasted with
similar studies conducted in Europe and Australia. Although the authors noted that
methodological differences meant that it was not possible to be conclusive, they observed that 6 That said, younger firms, manufacturing firms and firms with international connections (exporting or foreign ownership) had higher returns.

48 Issues paper | Technological change and the future of work
their results suggested “that the returns to (product) innovation for New Zealand firms are
relatively low, and so provide a potential explanation for why New Zealand firms invest relatively
little in R&D” (2017, p. 26).
Limited international connections
International connections can support greater innovation and productivity through several
avenues. Firms that export face greater competitive pressures and hence stronger incentives to
innovate. Exporters also have a larger market over which to spread the costs of innovation.
Finally, foreign-owned firms may also have better access to leading-edge technologies and
knowledge from leading global firms, and to the capital to fund innovations (NZPC et al. 2018).
The share of New Zealand firms that export is low by international standards, as is trade
exposure in the services sectors. New Zealand firms also tend not to participate in global value
chains; as Conway commented, “the share of value add in New Zealand gross exports that
comes from foreign firms in the form of intermediate inputs is among the lowest and slowest
growing in the OECD” (2016, p. 28). Outward direct investment levels are low, and inward
foreign investment has been broadly constant over 2000–12.
Limited absorptive capacity
Absorptive capacity refers to the ability of a firm to “understand external knowledge, to
assimilate it, to transform it, and to apply it” (Harris and Le 2018, p. 5). If the absorptive capacity
of firms is low, “then new strategies or technology designed to help firms become more
productive are likely to have only limited impact” (2018, p. 1). Conversely, higher levels of
absorptive capacity are associated with a greater propensity to export, innovate and undertake
R&D and with higher overall productivity. Drawing off the New Zealand Business Operations
Survey, Harris and Le found that absorptive capacity was highest amongst larger and foreign-
owned firms and lowest among domestic firms. They also found a “considerable degree of
stability”, with firms tending “to remain with high (low) absorptive capacity for long periods”
(2018, p. 16)
Capital shallowness
Finally, New Zealand firms have low levels of capital compared with Australian and British firms in
similar industries (Mason 2013; Mason and Osborne 2007). This limits productivity growth, and
may constrain the ability of firms to specialise and export. High real long-run interest rates and
expensive investment goods are partial causes of low capital intensity (Conway 2016), although
others have argued New Zealand’s low levels of multifactor productivity and a limited suite of
investment opportunities may also be contributors (New Zealand Treasury, 2008). There is not a
consensus on the causes of New Zealand’s high real interest rates, although possible
explanations include excess demand pressures caused by high net migration (Reddell 2013) and
low national savings levels (New Zealand Treasury, 2010).
What could be done to boost innovation levels in NZ firms?
Although action to lift innovation and productivity levels may be particularly important under the
Stagnation scenario, efforts to improve innovation amongst New Zealand firms will be important
under all the scenarios considered in this inquiry. Previous work by the Commission and other
scholars has identified five main areas for possible action.

Firm and economic policies 49
Reduce barriers to competition
The level of competition within an economy matters for productivity growth, technology
adoption and diffusion, the quality of firm management and keeping living costs under control.
In 2014, the Commission found that service industries in New Zealand face lower levels of
competition than goods-producing and primary sectors, and that this is particularly the case in
the finance and insurance, rental, hiring and real estate, retail and professional, scientific and
technical industries. MBIE (2016) reached broadly similar conclusions, finding that the finance
and insurance and wholesale trade sectors faced the lowest levels of competitive intensity.
The Commission (2014) recommended easing barriers to competition and market entry,
including sector-specific regulation and occupational regulation. Data portability, common data
standards and minimal barriers to digital trade could also support greater levels of competition
and innovation in New Zealand markets, especially in services industries (APC and NZPC 2019).
Q29 Which barriers to competition and investment should be priorities for
reform in a government innovation strategy?
Consider the impact of regulation on innovation
Regulation can either stimulate or hinder innovation and the uptake of new technologies. For
example, in their recent joint report on growing the digital trans-Tasman economy, the
Australian and New Zealand Productivity Commissions (2019) highlighted how obsolete
intellectual property laws could inhibit the development of artificial intelligence in the two
countries. The Commission has also heard from the motor industry that New Zealand’s land
transport laws will need to change to accommodate technological improvements in cars that
could improve safety (eg, replacing wing mirrors on vehicles with cameras). On the other hand,
regulation can also act as a spur to innovation. Porter and Linde (1995) cite several environmental
regulations that reduced the production and release of harmful materials but also increased
product quality and lowered production costs.
The impacts of regulation on incentives to innovate vary by area, and the impacts can differ over
time periods. In his meta-survey into the impacts of regulation, Blind (2012, pp. 1–2) concluded
that:
economic regulation (eg, competition policy, monopoly regulation and price controls)
encourages firms to “realise process innovations in order to succeed in price competition
and to successfully introduce new products and services into the market in order to escape
from fierce competitive pressure”, although impacts vary by sector, firm and innovation type;
studies of social regulation (product and consumer safety, health and safety, environmental
laws) initially had ambivalent results, but more recently found mainly positive impacts;
very few studies of institutional regulations (eg, liability law, bankruptcy and intellectual
property rights) “provide evidence of stronger incentives for innovation activities”; and
short-term impacts of regulation on innovation may be negative (as firms adjust), while the
longer-term impacts tend to be more positive.

50 Issues paper | Technological change and the future of work
Q30 Are there particular regulations or areas of regulation that will need to be
updated to maximise the benefits from technological change? Do these
areas differ, depending on the future scenario?
Enhance returns for innovation
Another area for possible action is policies to boost the return for firms from innovation. This
could be achieved by reducing the cost of innovation to firms, or increasing the likelihood and
scale of any returns. On the first issue, the Government currently provides (or is planning to
provide) a wide array of assistance for innovation and research activities.
There are many industry-led research support schemes funded or part-funded by the
Government that aim to lift innovation levels in specific sectors or solve specific problems,
such as the Primary Growth Partnership, New Zealand Agriculture Greenhouse Gas Research
Centre, National Science Challenges and Strategic Science Investment Fund.
Callaghan Innovation (a Crown entity that provides innovation support to selected firms)
provides targeted grants, which meet up to 40% of a recipient firm’s R&D costs, and research
and technical services for advanced manufacturing, biotechnology, advanced materials and
the Internet of Things and data solutions. According to Callaghan Innovation (2018, p. 3), 63%
of its customers “stated that the service they received … contributed to their ability to
undertake R&D” and grant recipients were 2.5 times “more likely to have maintained their
R&D investment”.
The Government is currently introducing a tax credit to strengthen incentives for firms to
carry out R&D. The planned scheme will provide a 15% credit on a firm’s annual eligible
expenditure of at least $50 000, capped at $120 million. Once the R&D tax credit is in place,
some of Callaghan’s targeted research grants will be phased out.
The second issue (increasing the likelihood and scale of the impact of innovation) implies
building stronger firm absorptive capacity (discussed below), closer links between research
organisations and firms, and refinement of R&D assistance programmes. Assessments of current
assistance programmes show mixed, but broadly positive, results.
The Ministry of Economic Development (2011) concluded that firms that receive Capability
Building assistance show significantly higher employment growth and a significant impact on
multifactor productivity four years after first assistance (compared with matched unassisted
firms). But no overall additional impacts were identified for firms that received Project
Funding (assistance for R&D projects that is provided to firms with potential for high growth).
Jaffe and Le (2015) found that receipt of an R&D grant significantly increases the probability
that a firm applied for a patent during 2005–2009, but found no positive impact on the
probability of applying for a trademark. Receiving a grant almost doubled the probability that
a firm introduces new goods and services to the world while its effects on process innovation
and any product innovation were much weaker.
Wakeman (2017) found similar results in that grant recipients are more likely to patent, to
innovate in their marketing approach and to introduce new products (but not to engage in
process innovation). Wakeman (2017) also found that in the 2–3 years after receiving a grant,
recipients experience faster employment and labour productivity growth than non-recipients.

Firm and economic policies 51
But consistent with Ministry of Economic Development (2011), receiving a grant does not
have a positive impact on multifactor productivity.
Q31 What changes, including to government funding for R&D, might be needed
to improve the returns to firms from innovation?
Enhance knowledge transfer and absorptive capacity
One response that has been considered previously by the Commission and others are greater
efforts to boost the transfer of knowledge and technology across and within New Zealand’s
borders, and enhance the ability of firms to understand and effectively absorb that knowledge.
Several government agencies may already support better knowledge transfer and absorptive
capacity.
Callaghan Innovation provides training and capability development programmes to firms
aimed at enhancing their efficiency and innovativeness, such as Better by Lean, start-up
incubator schemes, intellectual property advice, support for firms to introduce high
performance workplace practices and assistance for software firms in accelerating product
delivery. Callaghan Innovation (2018, p. 3) report that 84% of their customers said the Crown
entity’s services “directly contributed to the innovations they introduced in the last year”.
The Ministry of Business, Innovation and Employment leads a programme called ‘Innovative
partnerships’, which encourages innovative overseas firms to undertake research and
development in New Zealand.
New Zealand Trade and Enterprise (NZTE) provides services aimed at helping firms to grow
internationally or find the right investment opportunities. Although they are primarily focused
on internationalisation, these services (eg, design thinking and governance and strategic
leadership training) may also support greater absorptive capacity.
However, the reach of these services is limited, as both agencies target their assistance to a small
number of firms and focus their assistance largely on exporting and product innovation goals.
Drawing on the work of Teece (2017), Harris and Le (2018) argued that current support is too
narrow and should be broadened to build firms’ “dynamic capabilities”; that is, the skills and
abilities of firms’ leaders to “profitably build and renew resources, reconfiguring them as needed
to innovate and respond to (or bring about) changes in the market and in the business
environment more generally” (Teece 2017, p. 698).
Another option would be to establish a dedicated institution that scans internationally for
technologies to import and adapt in New Zealand firms and industries. The Commission (2018)
discussed this option in its inquiry into the low emissions economy and cited Fundación Chile, a
non-profit corporation whose mission “is to introduce innovations and to develop human capital
in the Chilean economy’s key clusters through technology management, in alliance with local
and global knowledge networks” (World Bank 2014, p. 3). Conway proposed a targeted
approach that would “focus on connecting to the global frontier in subsets of the product space
where firms have already demonstrated strengths and have global visibility” (2016, p. 61). This
model combines technology transfer with implementation assistance to firms, reflecting the fact
that “firms are unlikely to fully gain and benefit from external knowledge generated by networks
and collaboration unless they have sufficient absorptive capacity” (Harris and Le 2018, p. 30).

52 Issues paper | Technological change and the future of work
However, there are questions about how such an institution could be designed and governed,
and where it would sit in the landscape of government support for firms.
Some countries explicitly target specific sectors or technologies for government assistance to
boost innovation. For example, the United Kingdom government has announced a series of
‘Sector Deal’ partnerships, aimed at moving sectors and technologies towards desired
outcomes.7 In Singapore, the Government and industry have developed sectoral manpower
plans to identify future skill needs in specific sectors and develop policies to meet those needs.
Such approaches may lead to interventions that are well-grounded in the realities of firms and
sectors, but may encourage lobbying and distract firms from developing their own responses.
Q32 What steps should be taken to promote technology transfer and build
absorptive capacity in New Zealand firms?
Strengthen international connections
The Government provides some assistance with international connections, primarily through the
Ministry of Foreign Affairs and Trade (MFAT) and NZTE. MFAT negotiates international trade
agreements and assists services firms facing non-tariff barriers that unfairly disadvantage them in
foreign markets.8 As noted above, NZTE provides assistance, training and support to a small set
of ‘high growth’ firms aimed at improving their propensity to export and success in international
markets. Given the role that lack of market knowledge and experience play as barriers to firms
commencing exporting (Sanderson 2017), there may be a case for broader information provision
and assistance to other firms interested in expanding overseas.9
Exchange rate volatility affects export revenues and the propensity to export (Fabling and
Sanderson 2015). There are existing products in the market (eg, financial hedges) that can be
used to manage this volatility, but these may not be easily accessible to smaller and less-
experienced firms. Higher national savings rates and/or lower net migration levels may also ease
upward pressures on the exchange rate.
New Zealand has comparatively high barriers to foreign direct investment (FDI) (OECD 2019) and
according to Conway (2016, p. 60), the current screening regime is “increasingly opaque and
subject to increased scope for ministerial discretion, which adds uncertainty and cost”. The
Commission (2014, 2015) has previously found that barriers to foreign investment limit
competition, the entry of new goods and services and may unnecessarily increase the cost of
essential products, such as housing.
Q33 What steps should be taken to strengthen the international connections of
New Zealand firms?
7 UK Sector Deals have been announced in aerospace, artificial intelligence, automotive, construction, creative industries, life sciences, nuclear, offshore wind and rail.
8 The Ministry of Primary Industries is the lead agency for primary sector non-tariff barriers, and the Ministry of Business, Innovation and Employment has the lead for manufacturing and procurement barriers.
9 Sanderson (2017) noted that “entry propensity” amongst non-exporters was highest amongst firms “which stated that their interest was motivated by having reached the potential of the domestic market and those which believed that new contracts or alliances had opened up new market opportunities” (p.iii)

Summary of questions 53
Summary of questions
Q1 Are the scenarios developed by the Commission useful for considering the
future labour market effects of technological change? How could they be
improved?
Q2 What other consequences might be expected under each scenario?
Q3 How might the impacts of each scenario vary across different groups in
society or across different locations in New Zealand?
Q4 How should government monitor the impacts of technological change on
the labour market?
Q5 What policy objectives should governments pursue for the labour market of
the future?
Q6 What are the potential tensions between different policy goals? How might
such tensions be best addressed?
Q7 For each of the future scenarios, what policies would provide the best mix
of worker protections and low barriers to workforce participation?
Q8 What are the likely consequences of a large-scale increase in the proportion
of independent contractors in the workforce? How should government
respond to any negative consequences?
Q9 What types of worker protections might be required where technology
provides employers with a growing ability to monitor staff or discriminate
against some people?

54 Issues paper | Technological change and the future of work
Q10 Apart from a potential increase in gig work, what other new work
arrangements are emerging, or are likely to emerge in the near-future?
What are the implications of these work arrangements, and what response
from government might be required?
Q11 How might minimum wage settings affect incentives on firms to adopt
labour-replacing technologies? What changes to minimum wage policy
might be appropriate under each of the future scenarios?
Q12 What changes might be required to minimum notice periods under each of
the future scenarios?
Q13 How effective is the income support system set up to assist different groups
of people? What specific challenges might arise under the future scenarios?
What changes to the system might be needed to address these challenges?
Q14 What are the advantages and disadvantages of the following policies under
each of the future scenarios – universal basic income, unemployment
insurance, and redundancy compensation schemes? What other income
support policies are worth considering?
Q15 How might the effectiveness of active labour market policies change under
the future scenarios? What changes would be needed to the design of
active labour market policies under each scenario? What other active labour
market policies might be needed?
Q16 Are there particular areas where occupational regulation makes it harder for
people to shift jobs or adjust to technological change? Would this change
under each of the future scenarios?
Q17 How well do the current outcomes from the education and skills system
position New Zealand to respond to changing technology and different
future scenarios?
Q18 What changes to immigration policy to address skills needs might be
required under different future scenarios?

Summary of questions 55
Q19 What, if any, further measures are needed to improve skills among adults
with low proficiency to enable them to successfully participate in any future
labour market?
Q20 What evidence is there of digital divides in New Zealand? What are the
consequences for labour market participation and which groups are most
disadvantaged?
Q21 What, if any, further measures are needed to address any digital divides in
New Zealand?
Q22 What factors underpin New Zealand’s apparently poor matching of skills
with jobs? To what extent are mismatches a problem?
Q23 What future scenarios are most likely to accentuate poor matching? What
policy options are available to improve matching in the New Zealand labour
market?
Q24 How well does New Zealand’s education and training system reflect the
changing skill needs of industry? Is the education and training system able
to effectively respond to changing technology and different future
scenarios?
Q25 What programmes exist to support people to retrain, upskill or adapt to
changing technology, and how effective are they?
Q26 How well equipped is New Zealand’s education and skills system to support
people to adapt to technological change over the course of their careers?
Q27 How might the incentives for firms to invest in staff training change under
each of the Commission’s future scenarios? Under which scenarios would
there be a case for greater government investment in firm-based training?

56 Issues paper | Technological change and the future of work
Q28 What changes are needed to provide prospective students, including adults
and those already part-way through a career, with the skills needed to make
informed decisions about education and careers?
Q29 Which barriers to competition and investment should be priorities for
reform in a government innovation strategy?
Q30 Are there particular regulations or areas of regulation that will need to be
updated to maximise the benefits from technological change? Do these
areas differ, depending on the future scenario?
Q31 What changes, including to government funding for R&D, might be needed
to improve the returns to firms from innovation?
Q32 What steps should be taken to promote technology transfer and build
absorptive capacity in New Zealand firms?
Q33 What steps should be taken to strengthen the international connections of
New Zealand firms?

References 57
References
Acemoglu, D. and Robinson, J.A. 2013, Why nations fail: the origins of power, prosperity, and poverty, Profile Books, London.
AI Forum 2018, Artificial intelligence. Shaping a future New Zealand, https://aiforum.org.nz/wp-content/uploads/2018/07/AI-Report-2018_web-version.pdf (accessed 1 April 2019).
Allegretto, S.A., Dube, A. and Reich, M. 2011, ‘Do minimum wages really reduce teen employment? Accounting for heterogeneity and selectivity in state panel data’, Industrial Relations: A Journal of Economy and Society, vol. 50, no. 2, pp. 205–240.
AlphaBeta 2019, Flexibility and fairness: What matters to workers in the new economy, alphaBeta strategy x economics, https://ubernewsroomapi.10upcdn.com/wp-content/uploads/2019/03/Alphabeta-Report_Flexibility-and-fairness_-what-matters-to-workers-in-the-new-economy.pdf (accessed 9 April 2019).
Arntz, M., Gregory, T. and Zierahn, U. 2016, The risk of automation for jobs in OECD countries: A comparative analysis, OECD Social, Employment and Migration Working Papers, 189, OECD Publishing, Paris.
Arthur, D. 2016, Basic income: a radical idea enters the mainstream, https://www.aph.gov.au/About_Parliament/Parliamentary_Departments/Parliamentary_Library/pubs/rp/rp1617/BasicIncome#_Toc467232164 (accessed 22 March 2019).
Australian Productivity Commission 2015, Workplace relations framework: inquiry report, Australian Productivity Commission, Canberra, Australia.
—— 2016, Digital disruption: what do governments need to do? : Productivity Commission research paper., Australian Productivity Commission, Canberra, Australia.
—— and New Zealand Productivity Commission 2019, Growing the digital economy in Australia and New Zealand: maximising opportunities for SMEs, https://www.productivity.govt.nz/sites/default/files/Growing%20the%20digital%20economy%20in%20Australia%20and%20New%20Zealand_Final%20Report.pdf (accessed 6 March 2019).
Autor, D. 2019, Work of the past, work of the future, https://voxeu.org/article/work-past-work-future (accessed 22 March 2019).
Blind, K. 2012, The impact of regulation on innovation: compendium of evidence on the effectiveness of innovation policy intervention, http://www.innovation-policy.org.uk/share/02_The%20Impact%20of%20Regulation%20on%20Innovation.pdf (accessed 20 March 2019).
Bloom, N., Genakos, C., Sadun, R. and Van Reenen, J. 2012, ‘Management practices across firms and countries’, Academy of Management Perspectives, vol. 26, no. 1, pp. 12–33.
——, Sadun, R. and Van Reenen, J. 2012, ‘Americans Do IT Better: US Multinationals and the Productivity Miracle’, American Economic Review, vol. 102, no. 1, pp. 167–201.
58 Issues paper | Technological change and the future of work
de Boer, M. and Ku, B. 2019, Cost-effectiveness of MSD employment assistance: summary report for 2016/2017 financial year, https://www.msd.govt.nz/documents/about-msd-and-our-work/publications-resources/research/employment-assistance-effectiveness/ea-effectiveness-07022019.pdf (accessed 12 March 2019).
Borland, J. and Coelli, M. 2017, ‘Are robots taking our jobs?’, Australian Economic Review, vol. 50, no. 4, pp. 377–397.
Brown, C., Gilroy, C. and Kohen, A. 1982, The effect of the minimum wage on employment and unemployment: A survey, National Bureau of Economic Research Working Paper 0846, http://www.nber.org/papers/w0846.pdf (accessed 27 February 2019).
Brynjolfsson, E. and Hitt, L.M. 2000, ‘Beyond Computation: Information Technology, Organizational Transformation and Business Performance’, Journal of Economic Perspectives, vol. 14, no. 4, pp. 23–48.
—— and McAfee, A. 2014, The second machine age work, progress, and prosperity in a time of brilliant technologies, http://catalog.hathitrust.org/api/volumes/oclc/867423744.html (accessed 1 April 2019).
Callaghan Innovation 2018, Annual report 2018, Callaghan Innovation, Wellington, New Zealand, https://www.callaghaninnovation.govt.nz/sites/all/files/callaghan-innovation-annual-report-2018.pdf (accessed 6 March 2019).
Card, D., Heining, J. and Kline, P. 2013, ‘Workplace heterogeneity and the rise of West German wage inequality’, The Quarterly Journal of Economics, vol. 128, no. 3, pp. 967–1015.
——, Kluve, J. and Weber, A. 2010, Active Labor Market Policy Evaluations: A Meta-Analysis, July, w16173, National Bureau of Economic Research Working Paper 16173, http://www.nber.org/papers/w16173.pdf (accessed 17 April 2019).
—— and Krueger, A.B. 2016, Myth and measurement: the new economics of the minimum wage, Twentieth-anniversary edition, Princeton University Press, Princeton, NJ.
Carey, D. 2017, Adapting to the changing labour market in New Zealand, OECD Economics Department Working Papers, 11 October, 1420, https://www.oecd-ilibrary.org/economics/adapting-to-the-changing-labour-market-in-new-zealand_e6ced642-en (accessed 28 February 2019).
Chappell, N. and Sin, I. 2016, The effect of trial periods in employment on firm hiring behaviour, New Zealand Treasury working paper, 16/03.
Coase, R.H. 1937, ‘The nature of the firm’, Economica, vol. 4, no. 16, pp. 386–405.
Coleman, A. and Zheng, G. 2019, Job-to-job transfers and the regional job-ladder, Productivity Commission Working Paper, New Zealand Productivity Commission, Wellington, New Zealand.
Conway, P. 2016, Achieving New Zealand’s productivity potential, https://www.productivity.govt.nz/research-paper/achieving-new-zealands-productivity-potential (accessed 15 April 2019).
—— 2018, ‘Can the kiwi fly? Achieving productivity lift-off in New Zealand’, International Productivity Monitor, vol. 34, pp. 40–63.

References 59
——, Meehan, L. and Zheng, G. 2015, Do New Zealand firms catch up to the domestic productivity frontier?, https://productivity.govt.nz/sites/default/files/nzpc-working-paper-productivity-convergence-among-NZ-firms-201503.pdf (accessed 2 April 2019).
—— and Zheng, G. 2014, Trade over distance for New Zealand firms: measurement and implications, https://www.productivity.govt.nz/sites/default/files/nzpc-working-paper-2014-05-trade-over-distance-rev2.pdf (accessed 2 April 2019).
Crichton, S. and Maré, D.C. 2013, The Impact of Wage Subsidies on Jobseekers’ Outcomes and Firm Employment, Motu Working Paper, Motu Economic and Public Policy Research.
Crown Infrastructure Partners 2018, What is the Rural Broadband Initiative phase two (RBI2)?, https://www.crowninfrastructure.govt.nz/rural/what/ (accessed 20 March 2019).
Dairy New Zealand 2017, Dairy tomorrow. The future of New Zealand dairying, https://www.dairytomorrow.co.nz/wp-content/uploads/2017/12/dairy-strategy-2017-A4-booklet-Part3.pdf (accessed 11 March 2019).
Dellot, B., Mason, R. and Wallace-Stephens, F. 2019, The four futures of work: coping with uncertainty in an age of radical technologies, https://www.thersa.org/globalassets/pdfs/reports/rsa_four-futures-of-work.pdf (accessed 12 April 2019).
Department of the Treasury Office of Economic Policy, Council of Economic Advisers and Department of Labor 2015, Occupational licensing: a framework for policymakers, https://obamawhitehouse.archives.gov/sites/default/files/docs/licensing_report_final_nonembargo.pdf (accessed 13 March 2019).
Digital Inclusion Research Group 2017, Digital New Zealanders: The pulse of our nation, https://www.mbie.govt.nz/assets/218c439f72/digital-new-zealanders-the-pulse-of-our-nation.pdf (accessed 19 March 2019).
Dube, A., Lester, T.W. and Reich, M. 2010, ‘Minimum wage effects across state borders: Estimates using contiguous counties’, Review of Economics and Statistics, vol. 92, no. 4, pp. 945–964.
Education Central 2018, Bridging the digital equity divide – providing home internet access for learners, https://educationcentral.co.nz/bridging-the-digital-equity-divide-providing-home-internet-access-for-learners/ (accessed 20 March 2019).
Fabling, R. and Grimes, A. 2010, ‘HR practices and New Zealand firm performance: what matters and who does it?’, The International Journal of Human Resource Management, vol. 21, no. 4, pp. 488–508.
—— and —— 2014, ‘The “Suite” Smell of Success: Personnel Practices and Firm Performance’, ILR Review, vol. 67, no. 4, pp. 1095–1126.
—— and Sanderson, L. 2015, Exchange rate fluctuations and the margins of exports, https://treasury.govt.nz/sites/default/files/2015-06/twp15-08.pdf (accessed 4 April 2019).
Fair Pay Agreement Working Group 2018, Fair Pay Agreements, Supporting workers and firms to drive productivity growth and share the benefits, https://www.mbie.govt.nz/assets/695e21c9c3/working-group-report.pdf (accessed 4 February 2019).

60 Issues paper | Technological change and the future of work
Fletcher, M. 2015, The structure and generosity of financial assistance for beneficiaries: how New Zealand compares with other OECD countries, https://www.msd.govt.nz/documents/about-msd-and-our-work/publications-resources/research/social-assistance-international-comparisons/social-assistance-international-comparisons-publication-version.docx (accessed 4 March 2019).
—— 2018, Individualising entitlements in New Zealand’s benefit and social assistance systems: a report prepared for Superu, https://workresearch.aut.ac.nz/__data/assets/pdf_file/0006/181437/Superu-Individualisation-Report-FINAL.pdf (accessed 16 April 2019).
Frey, C.B. and Osborne, M.A. 2013, ‘The Future of Employment: How Susceptible Are Jobs to Computerisation?’, Technological Forecasting and Social Change, vol. 114, pp. 254–280.
Future of Work Tripartite Forum 2018, Proposed Work Programme for the Tripartite Future of Work Forum, https://www.beehive.govt.nz/sites/default/files/2018-08/Proposed%20work%20programme%20for%20Tripatite%20FoW%20Forum%20-%20Final.pdf (accessed 3 April 2019).
Gali, J., Gretton, P. and Parham, D. 2004, ‘The Effects of ICTs and Complementary Innovations on Australian Productivity Growth’, The Economic Impact of ICT, OECD Publishing, pp. 105–130.
Gordon, R. 2014, The Demise of U.S. Economic Growth: Restatement, Rebuttal, and Reflections, NBER Working Paper 19895, http://www.nber.org/papers/w19895.pdf (accessed 15 March 2019).
—— 2018, Why Has Economic Growth Slowed When Innovation Appears to be Accelerating?, NBER Working Paper 24554, https://www.nber.org/papers/w24554 (accessed 10 April 2019).
Gorlich, D. 2010, Complementary tasks and the limits to the division of labour, Kiel Working Paper No 1670, https://www.files.ethz.ch/isn/125951/kap1670.pdf (accessed 25 March 2019).
Green, R. and Agarwal, R. 2011, Management matters in New Zealand: how does manufactgring stack up?, http://worldmanagementsurvey.org/wp-content/images/2010/07/Report_Management-Matters-in-New-Zealand-How-does-manufacturing-measure-up.pdf (accessed 4 April 2019).
Greenwood, S.J. and Menclova, A.K. 2018, ‘Analysing the extent and effects of occupational regulation in New Zealand’, New Zealand Economic Papers, vol. 52, no. 1, pp. 21–39.
Grimes, A. and Young, C. 2009, Spatial Effects of ‘Mill’ Closures: Does Distance Matter?, Motu Working Paper 09–12, http://motu-www.motu.org.nz/wpapers/09_12.pdf (accessed 8 April 2019).
Guthrie, J.P. 2001, ‘High-Involvement Work Practices, Turnover, and Productivity: Evidence from New Zealand’, Academy of Management Journal, vol. 44, no. 1, pp. 180–190.
Hall, C. and Fussey, W. 2018, Will employees and contractors survive in the gig economy? - NZ Law Society, https://www.lawsociety.org.nz/practice-resources/practice-areas/employment-law/will-employees-and-contractors-survive-in-the-gig-economy (accessed 20 March 2019).

References 61
Haltiwanger, J., Hyatt, H. and McEntarfer, E. 2015, Cyclical Reallocation of Workers Across Employers by Firm Size and Firm Wage, NBER Working Paper 21235, http://www.nber.org/papers/w21235.pdf (accessed 15 March 2019).
Harris, R. and Le, T. 2018, Absorptive capacity in New Zealand firms: Measurement and importance, Motu Working Paper 18–01, https://motu.nz/our-work/productivity-and-innovation/firm-productivity-and-performance/absorptive-capacity-in-new-zealand-firms-measurement-and-importance (accessed 2 April 2019).
Hipkins, R., Whatman, J. and MacDonald, J. nd, Evaluation of the Manaiakalani Digital Teaching Academy, https://www.educationcounts.govt.nz/__data/assets/pdf_file/0006/169701/evaluation-of-the-manaiakalani-digital-teaching-academy2.pdf (accessed 20 March 2019).
Hyslop, D. and Townsend, W. 2017, The longer term impacts of job displacement on labour market outcomes, Motu Working Paper, 17–12.
Immervoll, H. and Scarpetta, S. 2012, ‘Activation and employment support policies in OECD countries. An overview of current approaches’, IZA Journal of Labor Policy, p. 9.
Jaffe, A. and Le, T. 2015, The impact of R&D subsidy on innovation: a study of New Zealand firms, Motu Working Paper, 15–08, Wellington, New Zealand.
Johnston, R. and Hawke, G. 2002, Case studies of organisations with established learning cultures., NCVER Research report.
Kahn, L.M. 2010, ‘Labor market policy: A comparative view on the costs and benefits of labor market flexibility’, IZA Journal of Labor Policy, no. 5100, http://repec.iza.org/dp5100.pdf (accessed 8 April 2019).
Kangas, O., Jauhiainen, S., Simanainen, M. and Ylikännö, M. 2019, The basic income experiment 2017–2018 in Finland Preliminary results, Reports and Memorandums of the Ministry of Social Affairs and Health, 2019:9.
Kestenbaum, D. and Goldstein, J. nd, ‘Episode 606: Spreadsheets!’, https://www.npr.org/sections/money/2017/05/17/528807590/episode-606-spreadsheets (accessed 15 April 2019).
Krueger, A.B. 1993, ‘How Computers Have Changed the Wage Structure: Evidence from Microdata, 1984-1989’, The Quarterly Journal of Economics, vol. 108, no. 1, pp. 33–60.
Kubiak, L. and Drew, A. 2015, Disruptive technologies risks, opportunities - can New Zealand make the most of them?, 21 October, Wellington, New Zealand, https://nzier.org.nz/publication/disruptive-technologies-risks-opportunities-can-new-zealand-make-them-most-of-them (accessed 1 April 2019).
Lips, M. 2015, The digital divides persist in New Zealand, https://www.victoria.ac.nz/sog/about/news/news-archives/2015-news/the-digital-divides-persist-in-new-zealand (accessed 20 March 2019).
Lordan, G. and Neumark, D. 2017, People Versus Machines: The Impact of Minimum Wages on Automatable Jobs, August, NBER Working Paper 23667, http://www.nber.org/papers/w23667.pdf (accessed 7 March 2019).

62 Issues paper | Technological change and the future of work
Maddock, T. and Genet, T. 2019, The Productivity Commission’s Tim Maddock and Terry Genet analyse NZ’s labour market ahead of an inquiry into technological disruption and the future of work, https://www.interest.co.nz/opinion/98536/productivity-commissions-tim-maddock-and%C2%A0terry-genet-analyse-nzs-labour-market-ahead (accessed 8 April 2019).
Maloney, T. 2007, ‘Job mobility and earnings in New Zealand’, Australian Journal of Labour Economics, vol. 10, no. 4, pp. 295–318.
ManpowerGroup 2018, 2018 Talent Shortage Survey, Global Talent Shortage, https://go.manpowergroup.com/talent-shortage-2018#shortagebycountry (accessed 4 January 2019).
Maré, D.C. 2018, ‘The labor market in New Zealand, 2000–2017’, IZA World of Labor, https://wol.iza.org/articles/the-labor-market-in-new-zealand (accessed 15 March 2019).
Mason, G. 2013, Investigating New Zealand-Australia productivity differences: new comparisons at industry level, New Zealand Productivity Commission, Wellington, NZ.
—— and Osborne, M. 2007, Productivity, capital-intensity and labour quality at sector levels in New Zealand and the UK, New Zealand Treasury working paper, 07/01, New Zealand Treasury, Wellington, New Zealand.
May, S., Flockton, J. and Kirkham, S. 2016, PISA2015: New Zealand summary report, https://www.educationcounts.govt.nz/__data/assets/pdf_file/0019/180613/PISA-2015-Summary-V2.pdf (accessed 12 March 2019).
McKinsey Global Institute 2017, Technology, jobs, and the future of work, https://www.mckinsey.com/~/media/McKinsey/Featured%20Insights/Employment%20and%20Growth/Technology%20jobs%20and%20the%20future%20of%20work/MGI-Future-of-Work-Briefing-note-May-2017.ashx (accessed 4 April 2019).
Meehan, L. and Zheng, G. 2015, Firm dynamics and job creation in New Zealand: a perpetual motion machine, https://www.productivity.govt.nz/sites/default/files/nzpc-research-note-20151-firm-dynamics-job-creation.pdf (accessed 16 April 2019).
Mincer, J. 1991, Human Capital, Technology, and the Wage Structure: What Do Time Series Show?, NBER Working Paper 3581, http://www.nber.org/papers/w3581.pdf (accessed 12 April 2019).
Ministry of Business, Innovation and Employment 2016, Competition in New Zealand industries measurement and evidence, http://www.mbie.govt.nz/publications-research/publications/economic-development/competition-in-new-zealand-industries.pdf (accessed 2 April 2019).
—— nd, Types of employee » Employment New Zealand, Types of employee, https://www.employment.govt.nz/starting-employment/who-is-an-employee/types-of-employee/ (accessed 22 March 2019).
Ministry of Economic Development 2011, Evaluation of the impacts of cross-vote government assistance on firm performance, https://www.mbie.govt.nz/dmsdocument/1383-evaluation-of-cross-vote-government-assistance-on-firm-performance-april-2011-pdf (accessed 26 March 2019).

References 63
Ministry of Education 2018, Statistics: Life after study, https://www.educationcounts.govt.nz/__data/assets/excel_doc/0008/104399/Income.xlsx (accessed 8 April 2019).
—— 2019, Reform of Vocational Education, https://conversation.education.govt.nz/assets/RoVE/Reform-of-Vocational-Education-Consultation-Discussion-Document.pdf (accessed 4 May 2019).
Ministry of Social Development 2016, Annual Report 2015/16, https://www.msd.govt.nz/documents/about-msd-and-our-work/publications-resources/corporate/annual-report/2015-2016/annual-report-2015-2016.pdf (accessed 17 April 2019).
—— 2018, Annual Report 2017/2018, https://www.msd.govt.nz/documents/about-msd-and-our-work/publications-resources/corporate/annual-report/2018/pages-from-annual-report-vol-1.pdf (accessed 8 April 2019).
Mokyr, J. 1992, The lever of riches: technological creativity and economic progress, Oxford paperbacks, Oxford University Press, New York.
Muro, M., Liu, S., Whiton, J. and Kulkarni, S. 2017, Digitalization and the American workforce, Metropolitan Policy Program at Brookings, https://www.brookings.edu/wp-content/uploads/2017/11/mpp_2017nov15_digitalization_full_report.pdf#page=15 (accessed 25 March 2019).
Naughton, K. 2019, Self-Driving Cars Keep Tapping the Brakes, Bloomberg Businessweek, https://educationcentral.co.nz/bridging-the-digital-equity-divide-providing-home-internet-access-for-learners/ (accessed 20 March 2019).
Nedelkoska, L. and Quintini, G. 2018, Automation, skills use and training, OECD Social, Employment and Migration Working Papers, 202, OECD Publishing, Paris.
New Zealand Council of Trade Unions 2013, Under pressure: insecure work in New Zealand, NZCTU, Wellington, New Zealand.
NZPC (New Zealand Productivity Commission) 2012, International freight transport services inquiry: April 2012, New Zealand Productivity Commission, Wellington, New Zealand.
—— 2014, Boosting productivity in the services sector: final report, New Zealand Productivity Commission, Wellington, New Zealand.
—— 2015, Using land for housing: final report, New Zealand Productivity Commission, Wellington, New Zealand.
—— 2017, New models of tertiary education: final report, New Zealand Productivity Commission, Wellington, New Zealand.
—— 2018, Low-emissions economy., New Zealand Productivity Commission, Wellington, New Zealand.
——, Ministry of Business, Innovation and Employment, Stats NZ and The Treasury 2018, Getting under the hood: insights from recent firm-level productivity research in New Zealand, https://productivity.govt.nz/sites/default/files/Getting%20under%20the%20hood_Insights%20from%20recent%20firm-level%20productivity%20research%20in%20New%20Zealand.pdf (accessed 2 April 2019).

64 Issues paper | Technological change and the future of work
New Zealand Treasury 2008, Investment, productivity and the cost of capital: undertstanding New Zealand’s ‘capital shallowness’, Productivity Paper, 08/03, New Zealand Treasury, Wellington, New Zealand.
—— 2010, Saving in New Zealand - issues and options, https://treasury.govt.nz/sites/default/files/2010-09/tp-savinginnz-sep10.pdf (accessed 4 April 2019).
Norgrove, A. and Scott, D. 2017, How does New Zealand’s education system compare?, https://www.educationcounts.govt.nz/__data/assets/pdf_file/0006/182535/Education-at-a-Glance-2017-New-Zealand-Summary-Report.pdf (accessed 13 March 2019).
NZCER 2016, Submission on New Models of Tertiary Education, draft report (Productivity Commission), https://www.productivity.govt.nz/sites/default/files/sub-new-models-of-tertiary-education-135-new-zealand-council-for-educational-research-318Kb.pdf (accessed 18 March 2019).
NZIER 2018, Data1850, https://data1850.nz/chart/compare/27-47-73/27-47-75 (accessed 16 April 2019).
NZLII 2019, New Zealand Regulations, http://www.nzlii.org/nz/legis/consol_reg/ (accessed 15 April 2019).
NZQA 2018, Micro-credentials system launched, https://www.nzqa.govt.nz/about-us/news/micro-credentials-system-launched/ (accessed 25 March 2019).
OECD (Organisation for Economic Co-operation and Development) 2013, Skilled for Life? Key findings from the survey of adult skills, https://www.oecd.org/skills/piaac/SkillsOutlook_2013_ebook.pdf (accessed 15 March 2019).
—— 2015a, Back to work, Canada: improving the re-employment prospects of displaced workers, OECD, Paris.
—— 2015b, OECD employment outlook 2015, OECD, Paris, France.
—— 2016a, OECD Employment Outlook 2016., OECD Publishing, Paris, France.
—— 2016b, Skills matter: further results from the survey of adult skills, OECD skills studies, OECD Publishing, Paris.
—— 2017a, Back to Work - New Zealand: Improving the Re-employment Prospects of Displaced Workers, OECD, Paris.
—— 2017b, Education at a Glance 2017, OECD, Paris.
—— 2017c, Stats: Labour: Earnings, https://stats.oecd.org/# (accessed 15 April 2019).
—— 2017d, Stats: Labour: Labour Market Programmes, https://stats.oecd.org/# (accessed 8 April 2019).
—— 2017e, The digital transformation, OECD science, technology and industry scoreboard, 2017, OECD, Paris.

References 65
—— 2018, Education at a Glance 2018, OECD Publishing, Paris, http://dx.doi.org/10.1787/eag-2018-en (accessed 13 March 2019).
—— 2019, FDI restrictiveness (indicator), https://data.oecd.org/fdi/fdi-restrictiveness.htm (accessed 4 April 2019).
—— nd, Main Science and Technology Indicators, Main Science and Technology Indicators, https://stats.oecd.org/Index.aspx?DataSetCode=MSTI_PUB (accessed 25 March 2019).
Pilat, D. 2004, ‘The ICT productivity paradox: insights from micro data’, OECD Economic Studies, vol. 38, 2004/1, pp. 37–65.
Porter, E. 2019, ‘Don’t Fight the Robots. Tax Them.’, The New York Times, 25 February, https://www.nytimes.com/2019/02/23/sunday-review/tax-artificial-intelligence.html (accessed 12 April 2019).
Porter, M.E. and Linde, C. van der 1995, ‘Toward a New Conception of the Environment-Competitiveness Relationship’, Journal of Economic Perspectives, vol. 9, no. 4, pp. 97–118.
Prassl, J. and Risak, M. 2016, ‘Uber, Taskrabbit, and co.: platforms as employers? Rethinking the legal analysis of crowdwork’, Comparative labor law and policy journal, vol. 37, pp. 619–652.
Public Advisory Group on Restructuring and Redundancy 2008, Restructuring and redundancy, https://thehub.sia.govt.nz/assets/documents/Report%20of%20the%20Public%20Advisory%20Group%20on%20Restructuring%20and%20Redundancy.pdf (accessed 5 March 2019).
Reddell, M. 2013, The long-term 'misalignment of the exchange rate" some perspectives on causes and consequences, https://www.rbnz.govt.nz/-/media/ReserveBank/Files/Publications/Seminars%20and%20workshops/Mar2013/5200823.pdf?la=en (accessed 4 April 2019).
Sanderson, L. 2017, Barriers to generating international income: evidence from the Business Operations Survey, https://www.mbie.govt.nz/assets/af7e0b8d8c/barriers-to-generating-international-income-business-operations-survey.pdf (accessed 3 April 2019).
Sepuloni, C. 2018, Expert Group established to provide independent advice on welfare system, Releases, https://www.beehive.govt.nz/release/expert-group-established-provide-independent-advice-welfare-system-improvements (accessed 4 February 2019).
Solon, O. 2018, ‘Amazon patents wristband that tracks warehouse workers’ movements’, The Guardian, 1 February, https://www.theguardian.com/technology/2018/jan/31/amazon-warehouse-wristband-tracking (accessed 9 April 2019).
Stanford, J. 2017, ‘The resurgence of gig work: Historical and theoretical perspectives’, The Economic and Labour Relations Review, vol. 28, no. 3, pp. 382–401.
Stats NZ 2018a, Infoshare - Statistics New Zealand, Permanent & long-term migration key series (Annual-Jun), http://archive.stats.govt.nz/infoshare/ (accessed 4 April 2019).
—— 2018b, Internet Service Provider Survey, Internet Service Provider Survey, https://www.stats.govt.nz/information-releases/internet-service-provider-survey-2018 (accessed 20 March 2019).

66 Issues paper | Technological change and the future of work
—— 2019a, Access to telecommunication systems (total responses), for households in occupied private dwellings, 2001, 2006, and 2013 Censuses, http://nzdotstat.stats.govt.nz/wbos/Index.aspx?DataSetCode=TABLECODE8183&_ga=2.254469057.892711413.1552879529-1858989965.1527117228# (accessed 20 March 2019).
—— 2019b, Business Operations Survey, Business Operations Tables, http://nzdotstat.stats.govt.nz/wbos/Index.aspx# (accessed 20 March 2019).
—— 2019c, Infoshare - Statistics New Zealand, CPI All Groups for New Zealand (Qrtly-Mar/Jun/Sep/Dec), http://archive.stats.govt.nz/infoshare/ (accessed 4 April 2019).
Stewart, A. and Stanford, J. 2017, ‘Regulating work in the gig economy: What are the options?’, The Economic and Labour Relations Review, vol. 28, no. 3, pp. 420–437.
Stigler, G.J. 1946, ‘The economics of minimum wage legislation’, The American economic review, vol. 36, no. 3, pp. 358–365.
Sullivan, J. 2015, What is technological disruption and how will it affect businesses and organisations?, Hamilton Hindin Greene, 25 May, https://www.hhg.co.nz/news/what-technology-disruption-will-affect-businesses-organisations/ (accessed 11 April 2019).
Taylor Fry 2017, Annual report on the benefit system for working-age adults, https://www.msd.govt.nz/documents/about-msd-and-our-work/publications-resources/evaluation/annual-report-on-the-benefit-system-for-working-age-adults-as-at-30-june-2017.pdf (accessed 8 April 2019).
Teece, D.J. 2017, ‘Towards a capability theory of (innovating) firms: implications for management and policy’, Cambridge Journal of Economics, vol. 41, no. 3, pp. 693–720.
TEC (Tertiary Education Commission) 2018a, Annual Report for the year ended 30 June 2018, https://www.tec.govt.nz/assets/Reports/8608f1b51c/TEC-Annual-Report-2017-2018.PDF (accessed 9 April 2019).
—— 2018b, Funding allocations, https://www.tec.govt.nz/funding/funding-and-performance/funding/allocations/ (accessed 15 March 2019).
Tertiary Education Union 2016, Submission on the draft report ‘New Models of Tertiary Education’, https://www.productivity.govt.nz/sites/default/files/sub-new-models-of-tertiary-education-132-tertiary-education-union-815Kb.pdf (accessed 18 March 2019).
Tirole, J. 2017, Economics for the common good, Princeton University Press, Princeton.
Tomorrow’s Schools Independent Taskforce and Ministry of Education 2018, Our schooling futures: stronger together Whiria ngā kura tūātinitini, https://conversation.education.govt.nz/assets/TSR/Tomorrows-Schools-Review-Report-13Dec2018.PDF (accessed 2 April 2019).
Van Reenen, J. 2018, ‘Digital Technologies: Economic Growth and the Future of Work’, presented at Implications of the Digital Transformation for the Business Sector, London, OECD/BEIS, 8 November, http://www.oecd.org/sti/ind/digital-transformation-business-keynote-van-reenen.pdf (accessed 24 January 2019).
Wakeman, S. 2017, The impact of R&D grants on the performance of New Zealand firms, Research Note 2017/5, https://www.productivity.govt.nz/sites/default/files/The%20impact%20of%20RD%20grant

References 67
s%20on%20the%20performance%20of%20NZ%20firms%20.pdf (accessed 26 March 2019).
—— and Conway, P. 2017, Innovation and the performance of New Zealand firms, https://www.productivity.govt.nz/sites/default/files/Innovation%20and%20the%20performance%20of%20New%20Zealand%20firms%20.pdf (accessed 2 April 2019).
Welfare Expert Advisory Group 2018, New Zealand’s labour market, http://www.weag.govt.nz/background/new-zealands-labour-market/ (accessed 8 April 2019).
World Bank 2014, Fundacion Chile incubator: Chile case study, https://openknowledge.worldbank.org/bitstream/handle/10986/20109/901220WP0Box380business.chile0.web0.pdf?sequence=1&isAllowed=y (accessed 3 April 2019).
—— (ed) 2019, The changing nature of work, World development report, 2019, World Bank Group, Washington, DC, USA.
Zheng, G. 2016, Geographic proximity and productivity convergence across New Zealand firms, Productivity Commission Working Paper 2016/04, https://www.productivity.govt.nz/sites/default/files/Productivity%20convergence%20within%20New%20Zealand%20Dec%202016_0.pdf (accessed 29 March 2019).

68 Issues paper | Technological change and the future of work
Terms of reference
New Zealand Productivity Commission Inquiry into Technological Change, Disruption and
the Future of Work
Issued by the Minister of Finance, the Minister of Education, the Minister for Economic
Development, the Minister for Workplace Relations and Safety and the Minister for Government
Digital Services (the "referring Ministers"). Pursuant to sections 9 and 11 of the New Zealand
Productivity Commission Act 2010, we hereby request that the New Zealand Productivity
Commission ("the Commission") undertake an inquiry into how New Zealand can maximise the
opportunities and manage the risks of disruptive technological change and its impact on the
future of work and the workforce.
Context
Technology, and its rapid development and adoption, is one of the critical dynamics in the
changing world of work. The transition to a low-emissions economy has begun and will
accelerate, providing scope for New Zealand to increase its focus on technology and changing
economic opportunities. While technological innovation and disruption is nothing new, the
increasingly pervasive nature of disruptive technologies and the pace of change will create
significant opportunities for New Zealand to achieve a productive, sustainable, and inclusive
economy. However, systemic, rapid change can be daunting and it is important for government
to understand and respond to this prospective change so that these opportunities are realised
and the risks managed. The opportunities and risks also need to be communicated in a clear and
accessible way to New Zealanders. Technology is changing how government interfaces with the
public and business, so government needs to be ready to respond to change in an agile and
adaptive manner.
It is difficult to predict exactly what technological change will mean for New Zealand and how
widespread disruption will be, but impacts are being felt already in the form of changing
business models and some jobs being replaced or transformed by automation. While non-
government parties (businesses, consumers and communities) will to a large extent drive change,
government also has an important role to play by actively managing the impacts on different
groups (positive and negative), and using policy and regulation to promote the innovative and
beneficial use of technology across the public, business and not-for-profit sector.
New Zealand has had much success in labour market participation and employment on the
whole but some groups are under-represented in labour market participation and employment.
While technological disruption may pose fresh challenges in terms of policy and regulatory
changes needed to help workers and firms adjust, it also provides opportunities to reduce
barriers for participation. The government must actively manage a just transition, such as through
its range of initiatives that support workplace productivity, regional labour markets and filling
skills gaps. Finally, the government has a vital role in how it chooses to promote the innovative
use of technology in the public sector and business community and to ensure a level playing
field for different technologies.

Terms of reference 69
Well-designed and coordinated government responses could allow New Zealand to:
fully realise the potential of disruptive technologies for economic productivity and social
prosperity;
improve the services provided by government and increase the efficiency and effectiveness
with which government functions; and
provide an enabling environment without unnecessary barriers to desirable change, while
effectively managing risks.
Together, these would also help to prepare New Zealand for any rapid labour displacement and
distributional impacts.
Scope and Aims
The purpose of this inquiry is to provide an independent assessment of the scale and potential
impacts of rapid technological change and its disruptive impact on the future of work and the
workforce in New Zealand. The overriding aim is to harness changes to maximise the wellbeing
of New Zealanders. The assessment should provide material for future government policy
development and other initiatives to prepare the country for a productive, sustainable, and
socially-inclusive future, despite uncertainties around the impact of technology.
For this inquiry, 'disruption' is primarily about the impacts of technological change. The inquiry
should acknowledge the potential for disruption to have both positive and negative impacts.
Two broad questions should guide the inquiry:
What are the current and likely future impacts of technological change and disruption on the
future of work, the workforce, labour markets, productivity and wellbeing?
How can the Government better position New Zealand and New Zealanders to take
advantage of innovation and technological change in terms of productivity, labour-market
participation and the nature of work?
We encourage the Commission to break the inquiry down into a series of shorter, related
reports, published throughout the term of the inquiry, with a final report summarising findings
and providing recommendations. For example, the topics could be as follows:
1. A scene setter:
- A definition of disruption;
- An analysis of the status quo in New Zealand, including the government's institutional
and regulatory ability to flexibly adapt to a rapidly changing environment, and to support
the diffusion of innovation;
- The likely nature and scale of the impact of technology change on labour market
participation, under-employment, productivity, wages, education and skill requirements,
and the nature of jobs (e.g. the gig economy);
- The likely scale and pace of technology change, including across regions and industries,
and the distributional impacts within the population; and

70 Issues paper | Technological change and the future of work
- New Zealand's distinctive features in this space, and its comparative advantages and
disadvantages (e.g. relatively flexible labour market and high employment, significant
incidence of low skills).
2. How can active labour market policies, including their interaction with the welfare system,
assist (or hinder) displaced workers to transition to different types of work and work places?
3. How can New Zealand's education and training systems be more effective in enabling
adaptation to technological disruption?
4. How can we address the digital divide in New Zealand?
5. Identifying how technological change will affect different groups of workers, and therefore
what are the appropriate types and levels of support required.
6. How can the regulatory environment enable adaptation to change, provide opportunities
for new technologies to be tested and understood in New Zealand, and become more
responsive to disruptive change?
7. How can government best encourage technology innovation and uptake, with a focus on
wage growth and the development of appropriate high-engagement, high performance
actions and behaviours in New Zealand workplaces and industries?
8. How can New Zealand firms improve their employees' management capability in terms of
adapting to technological change?
Report and Recommendations
The inquiry should explore New Zealand and international research and experience related to
the questions above. However, the focus should be on practical applications relevant to
New Zealand's circumstances.
Given the uncertainty around future technology and its impact, the inquiry is not expected to
make detailed, quantified predictions of impacts. Rather, it should give a sense of the nature and
relative scale of impacts in different scenarios.
The inquiry should have a long-term focus, with recommendations that can be implemented in
the short- to medium-term. It should provide a resource for government to develop policies and
programmes that make the most of the technological opportunities on offer and allow
New Zealanders to face an uncertain future with confidence.
The report should build on previous relevant inquiries undertaken by the Productivity
Commission.
The final report should provide recommendations for how New Zealand should manage a
transition to a more technically advanced economy in relation to both technology's upside and
downside risks, while still maintaining or improving incomes and wellbeing across all groups in
the population, through recommendations on appropriate policy settings.
Consultation
Given that technological change is an issue of national significance, the Commission should
consult with a broad range of stakeholders including: central and local government; the Future of
Work Tripartite Forum, Future of Work Ministerial Group, the Just Transitions Unit in MBIE, and

Terms of reference 71
any new Future of Work groups established in Government agencies; relevant industry and NGO
groups, including the NZCTU and Business NZ; academic bodies, businesses, lwi, and the
general public.
This inquiry is intended to complement and take account of existing policy work and other
current work by evidence-gathering groups on the future of work and the impacts of
technological change. The groups include the Law Commission, the Al Forum, and the OECD.
Timeframes
The Commission should present a final report to referring Ministers by 31 March 2020.