Embed Size (px)
Citation preview
Technology Choices for Data Technology Choices for Data Collection and Condition Collection and Condition
AssessmentAssessment
Leonard (Len) Schultz Leonard (Len) Schultz Transportation Engineer ManagerTransportation Engineer ManagerHighway Maintenance DivisionHighway Maintenance DivisionMaryland State Highway AdministrationMaryland State Highway Administration


ASSET MANAGEMENT DATA COLLECTION GUIDE
DRAFT DOCUMENT Version: June 2004
Prepared by: J. W. Bryant, Jr., Ph. D., P. E., Virginia Transportation Research Council [email protected]. D. Larson, P. E., PMP, Virginia Department of Transportation [email protected]

Asset Management PrimerAsset Management Primer

ASSET MANAGEMENT SYSTEMASSET MANAGEMENT SYSTEM(page 19)(page 19)

Maintenance Management Maintenance Management SystemsSystems

A. Module 1 – Planning A. Module 1 – Planning (page 20)(page 20)
Asset InventoryAsset Inventory Maintenance Activity GuidelinesMaintenance Activity Guidelines Customer InputCustomer Input Performance TargetsPerformance Targets Condition AssessmentsCondition Assessments
ASSET MANAGEMENT DATA COLLECTION GUIDE
DRAFT DOCUMENT Version: June 2004
Prepared by: J. W. Bryant, Jr., Ph. D., P. E., Virginia Transportation Research Council [email protected]. D. Larson, P. E., PMP, Virginia Department of Transportation [email protected]

In general the asset data collection requirements can be categorized into the following: (1) Location; (2) Physical Attributes; and (3) Condition. Locations are usually denoted by a “from – to” county-route-mile (CRM) for linear assets. Nonlinear assets are point specific and are denoted by either a single CRM or by use of landmark data. In all cases GPS coordinates and or physical landmarks can be used to acquire the location information for both linear and nonlinear assets.
The physical attributes collected will vary from asset to asset. Physical attributes are used to describe the asset in question. General attributes that are consistent across assets include: material type, size, and length.
Condition assessment is depended on the specified performance criteria for the asset.
Data for condition assessment can be broad for some assets requiring only Good, Bad or fair, while other assets may require a more detailed approach set forth by national or regional accepted practices or standards.
Table 2-1 presents the basic inventory attributes for transportation assets. Condition attributes vary greatly from asset to asset as to how they are reported; therefore they were excluded from Table 2-1.

General assets groups and associated asset types
Pavements: Flexible Pavements (HMA), PCC Pavements, Unpaved Roads; Paved Shoulders, and Unpaved Shoulders
Roadsides: Vegetation and aesthetics, Trees, Shrubs and brush, Historic Markers, and Right-of-way Fence
Drainage Structures: Cross Pipes and Box Culverts, Entrance Pipes, Curb & Gutter, Paved Ditches, Unpaved Ditches, Edge Drains and Under-drains, Storm Water Ponds, and Drop Inlets
Traffic: Attenuators, Guardrail, Pavement striping, Pavement markings, Raised pavement markers, Delineators, Signs, and Highway Lighting
Structures and Bridges: Overhead Sign Structures, Structural Culverts, Overall Bridge, Sound Barriers, and Retaining Walls
Special Facilities: Movable Bridges, Rest Areas, River and Mountain Tunnels, Weigh Stations, and Traffic monitoring Systems

Data CollectionData Collection
Data collection methods should be Data collection methods should be developed with developed with data at its core rather than data at its core rather than the applications they servethe applications they serve. Applications . Applications may go obsolete and be updated but the may go obsolete and be updated but the data collection and how it is structured data collection and how it is structured must be able to be migrated and must be able to be migrated and integrated to multiple/other systems. integrated to multiple/other systems. Therefore, the electronic collection, Therefore, the electronic collection, dissemination, and updating is critical.dissemination, and updating is critical.

What is it?What is it?
Sign Installation?Sign Installation?
Number of Signs?Number of Signs?
Type of Sign?Type of Sign?
Number of Posts?Number of Posts?
Type of Posts?Type of Posts?
All the above?All the above?

Each Installation or Location?Each Installation or Location?

Traffic Control DevicesTraffic Control Devices
Installation?
Signal Heads?
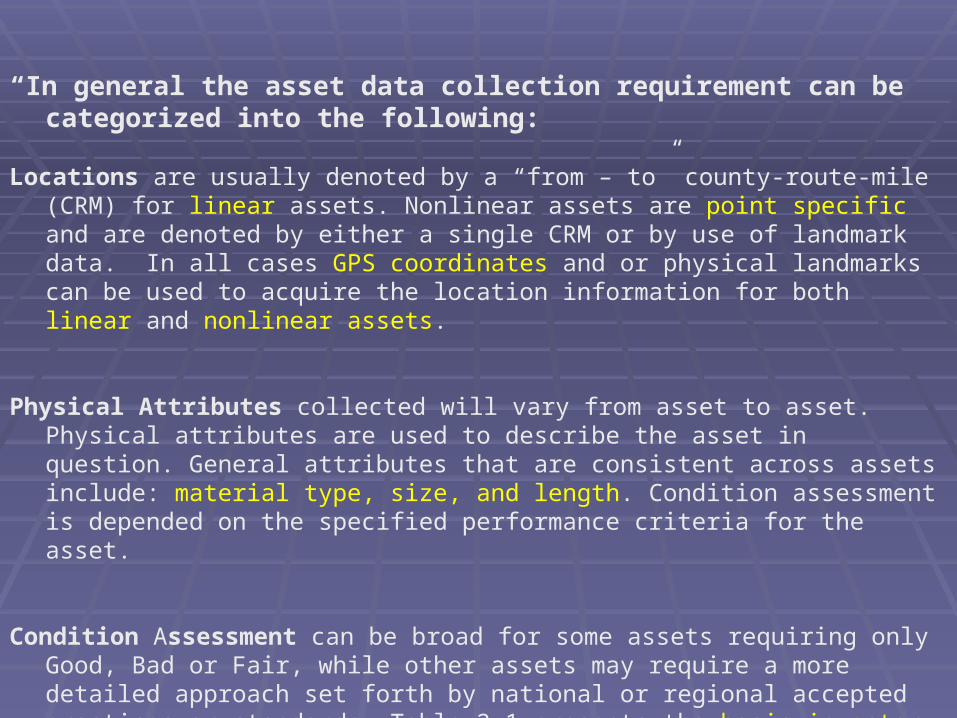
“In general the asset data collection requirement can be categorized into the following:
Locations are usually denoted by a “from – to” county-route-mile (CRM) for linear
assets. Nonlinear assets are point specific and are denoted by either a single CRM or by use of landmark data. In all cases GPS coordinates and or physical landmarks can be used to acquire the location information for both linear and nonlinear assets.
Physical Attributes collected will vary from asset to asset. Physical attributes are used to describe the asset in question. General attributes that are consistent across assets include: material type, size, and length. Condition assessment is depended on the specified performance criteria for the asset.
Condition Assessment can be broad for some assets requiring only Good, Bad or Fair, while other assets may require a more detailed approach set forth by national or regional accepted practices or standards. Table 2-1 presents the basic inventory attributes for transportation assets. Condition attributes vary greatly from asset to asset as to how they are reported; therefore they were excluded from Table 2-1.”

Asset Group
Asset Type
Poi
nt A
sset
Line
ar A
sset
Type
Line
ar D
imen
sion
Siz
e/A
rea
Mat
eria
l
Num
ber
Dep
th o
f Cov
er
Inst
all
date
/his
tory
Dir
ectio
n
Traf
fic
Drainage culvert * * * * * * * * *curb & gutter * * * *sidewalk * * * * *ditch * * * * * *drop inlet * * *storm water pond * *under drain & edge drain *
Roadside fence * * * * *grass mowing * * *brush * * *slopw (erosion control) *litter * * *landscaping * * * *sound barrier * * * * * *
Pavement shoulders * * * * * * *paved surfaces * * * * * * * * *unpaved surfaces * * * * *
Bridge bridge * * * * * * * *paint * * *joint * * *retaining wall * * * * * *
Traffic Item signal * * *sign * * * * * *pavement marking * * * * * * *pavement markers * * * *guardrail (end treatments) * * * * * *guardrail * * * * * *overhead sign structure * * * * *impact attenuator * * * *highway lighting * * * * *
Inventory Attributes
Asset
Units of Measures
Point data
Linear data
Area

Scanning Existing DocumentsScanning Existing Documents

Where is it?
Physical count of assets on the highway by:
• coordinates • milepoints • road section • geographical area • road network • maintenance section

Dynamic SegmentationDynamic Segmentation Dynamic Segmentation is a term used to describe the
process of combining data from two or more perspectives by "dynamically" creating a third set of sections that represents the smallest common denominator sections between the first two sets.
Dynamic Segmentation is useful for performing, "show me" kind of reports on a roadway database. It is not, however, very useful for sharing data across many applications.
It is easy to illustrate Dynamic Segmentation by drawing two strip maps of a road both showing the set of sections from two different section perspectives

Dynamic SegmentationDynamic Segmentation
Milepoint 0.00 1.00 2.00 3.00 4.00
ADT 10,000 5,000
Number of Lanes 4 Lane 2 Lane
Guardrail 12,000' 500'
Mowable Acres 10 25
Maintenance Cost $100 $240
Results of DS
AADT 10,000 5,000
Number of Lanes 4 2
Guardrail 4,000 8,500
Mowable Acres 10 25
Maintenance Cost $100 $240

Data Collection MethodsEfforts to streamline asset data collection have been underway since the 1960’s. The general progression of transportation asset data collection is presented below:
Photo log: Originally collected form of the data (e.g. had to be viewed through sequential image access of film). Mainly occurred through 1960’s to 1980’s. Many DOT’s had this type of program though sometimes the activity got cut in times of economic pressure.
Video log: This data collection form data could be random accessed when placed on a laser disk. Mainly occurred 1980’s to some DOT’s at present (though most converting to digital).
Regular Resolution Digital images: (i.e., 640 by 480 resolution). These are typically placed on CD’s, DVD’s or a large network server. Mainly mid-1990’s to present.
High-resolution digital images: (i.e., 1300 by 1000 resolution). Mainly later 1990’s to present. Increasingly DOT’s are looking to place the image data on a large server and make available across a network (where sufficient bandwidth and speed exist). e.g., Minnesota DOT.

Mobile data collection
Involves the use of a vehicle that is equipped with a distance measuring device and or GPS capabilities, digital video camera’s, and the appropriate computer hardware to capture, store and process the data collected.

Satellite or Aerial Imagery
High resolution images that are acquired via satellite, or plane may also be used to reference the location information for transportation assets. The individual pixels corresponding to the assets in the picture are geo-referenced with respect to ground locations. Once the image is geo-referenced the location of the assets can be extracted, manually or via a software computer package.

Data Collection Tablets and On-board ComputersData Collection Tablets and On-board Computerswith User Defined Keyswith User Defined Keys

Collection Devices for the Collection Devices for the Appropriate AssetAppropriate Asset

Handheld Data CollectorsHandheld Data Collectors
• GPS
• Touch Entry
• Voice
• Digital Camera

Condition AssessmentsCondition Assessments
Reflectometer

Condition AssessmentCondition Assessment

ARAN Automated Road Analyzer by Roadware
Skid Truck
Condition AssessmentsCondition Assessments

Sharing the PainSharing the Pain Pavements: Flexible Pavements (HMA), PCC Pavements, Unpaved
Roads; Paved Shoulders, and Unpaved Shoulders
Roadsides: Vegetation and aesthetics, Trees, Shrubs and brush, Historic Markers, and Right-of-way Fence
Drainage Structures: Cross Pipes and Box Culverts, Entrance Pipes, Curb & Gutter, Paved Ditches, Unpaved Ditches, Edge Drains and Under-drains, Storm Water Ponds, and Drop Inlets
Traffic: Attenuators, Guardrail, Pavement striping, Pavement markings, Raised pavement markers, Delineators, Signs, and Highway Lighting
Structures and Bridges: Overhead Sign Structures, Structural Culverts, Overall Bridge, Sound Barriers, and Retaining Walls
Special Facilities: Movable Bridges, Rest Areas, River and Mountain Tunnels, Weigh Stations, and Traffic monitoring Systems

Team Activity Card ( front )
Identifies:
Location
Labor
Equipment
Maintenance Activities

Team Activity Card ( back )
Identifies:
Material
Reimbursable Incidents
Remarks
Maintenance Activities


Handheld Data CollectorsHandheld Data Collectors
• GPS - location
• Touch Entry
• Voice
• payroll
• vehicle usage
• accomplishments

Clip-on scanner
Voice, Data, and Bar Code Data Capture
Fixed Scanners
Handheld Scanners
Windows CE applications
Inventory Stock Control

Digital Video ImagingDigital Video Imaging
Synchronization of multiple cameras
Safety
Posted Speed
Desktop data collection
Validation


AccuracyAccuracy

Sign Installation / Tree HeightSign Installation / Tree Height

Overview of Digital imagesOverview of Digital images
DataCaptureSession
Image MetadataGPS+DMI
Image Files
DataCollection Tools
Database
Field OperationField Operation Office OperationOffice Operation
Field DataCollection
Optional Data Collection While in the Field, or Back in the Office

Data Collection
Method of Data Collection
Asset TypeNumber of
Installations
Time to Collect
DataQA/QC
Digital Imaging Inlets 92 5 hours 2 hours
Digital Imaging Guardrail 75 (10,636 feet) 2 hours 1 hour
Digital Imaging Traffic Control Devices 40 1 hour 0.5 hours
Digital Imaging Mowing Acres 20 2 hours 0.5 hours
Digital Imaging Wildflower Beds 4 .5 hours .25 hours
Digital Imaging Signs 145 3 hours 1 hours
Field backpack/GPS Guardrail 12 4 hours 4 hours
Field backpack/GPS Inlets 94 16 hours 8 hours

Associated CostDigital Imaging
Asset TypeHours for
Asset Personnel Rate Asset Cost
Guardrail 2 Field Collection Specialist $53.72 $107.44
1 GIS Specialist $44.33 $44.33
1 Project Manager $69.89 $69.89
Sub Total $221.66
Inlets 5 Field Collection Specialist $53.72 $268.60
2 GIS Specialist $44.33 $88.66
1 Project Manager $69.89 $69.89
Sub Total $427.15
Total $648.81
Backpack/GPS
Guardrail 4 Field Collection Specialist $53.72 $214.88
4 GIS Specialist $44.33 $177.32
2 Project Manager $69.89 $139.78
Sub Total $531.98
Inlets 16 Field Collection Specialist $53.72 $859.52
8 GIS Specialist $44.33 $177.32
1 Project Manager $69.89 $69.89
Sub Total $1,284.05
Total $1,816.03

Who will collect the data?Who will collect the data?
Caution!!!!
Duplicating data for no
apparent reason.
Could I haveanother pencil,please?
Asset
s
Featu
res
Inve
ntor
y
Furnit
ure

In-House vs. OutsourcingIn-House vs. OutsourcingData CollectionData Collection
In-House:In-House: AdvantageAdvantage DisadvantageDisadvantage
Knows maintenanceKnows maintenance Less familiar to technology Less familiar to technology Knows the roadwayKnows the roadway Cost to train Cost to train No cost to Collect No cost to Collect Impedes maintenance work Impedes maintenance work Ownership/ControlOwnership/Control Cost to upgrade Cost to upgrade
Outsourcing:Outsourcing:
Knows technologyKnows technology CostCost Maintains equipmentMaintains equipment CostCost Upgrades TechnologyUpgrades Technology CostCost Does not require state resourcesDoes not require state resources n/an/a

main - te - nance \ mant - nen (t)s\ n [ME, fr. mainteni]
1; the art of preserving, protecting, restoring o repairing property - previously viewed as an incidental operation; now considered integral to well managed entities. 2: the last and most critical element in the planning, design, and construction of a facility. 3: a planned and organized effort often performed under chaotic circumstances or impossible time limits, usually without ample resources (see miracles) 4: slang : a person or group of persons reputed to be able to complete any task regardless of the circumstance or conditions placed upon that person or group of persons.
Maintenance