Embed Size (px)
Citation preview
Journal of Digital Forensics, Security and Law, Vol. 8(1)
73
TECHNOLOGY CORNER
VISUALISING FORENSIC DATA: EVIDENCE
(PART 1)
Damian Schofield
State University of New York
Department of Computer Science
+1 (410) 504 3178
Ken Fowle
Edith Cowan University
School of Computer and Security Science
+61 (8) 9370 6013
Keywords: Visualisation, Visualization, Evidence, Reconstruction, Digital
Forensics, Computer Graphics, Forensic Animation, Guidelines.
ABSTRACT
Visualisation is becoming increasingly important for understanding information,
such as investigative data (for example: computing, medical and crime scene
evidence) and analysis (for example: network capability assessment, data file
reconstruction and planning scenarios). Investigative data visualisation is used
to reconstruct a scene or item and is used to assist the viewer (who may well be
a member of the general public with little or no understanding of the subject
matter) to understand what is being presented. Analysis visualisations, on the
other hand, are usually developed to review data, information and assess
competing scenario hypotheses for those who usually have an understanding of
the subject matter.
Visualisation represents information that has been digitally recorded (for
example: pictures, video and sound), hand written and/or spoken data, to show
what may have, could have, did happen or is believed to have happened. That is
why visualising data is an important development in the analysis and
investigation realms, as visualisation explores the accuracies, inconsistencies
and discrepancies of the collected data and information.
This paper introduces some of the various graphical techniques and technology
used to display digital information in a courtroom. The advantages and
disadvantages involved in the implementation of this technology are also
Journal of Digital Forensics, Security and Law, Vol. 8(1)
74
discussed. This paper is part one of a two part series that aims to describe the use
of, and provide guidelines for, the use of graphical displays in courtrooms.
1. INTRODUCTION
At the end of the 18th Century William Playfair, a Scottish inventor, introduced
the line graph, bar chart and pie chart into statistics. He demonstrated how much
could be learned if one plotted data graphically and looked for suggestive
patterns to provide evidence for pursuing research. However, due to the novelty
of the graphical forms, Playfair had to include extensive directions for the viewer
informing them how to read the data visualised from the graphs and charts he
created (Tufte 1997). Today these graphs (and many other more complex
graphical representations) are a vital and everyday part of communication in
science and technology, business, education and the mass media (Cleveland &
McGill, 1984).
Scientists and scholars have always used graphical techniques to describe,
represent, and create knowledge. Traditionally, these techniques have focused
on the communication of quantitative data and information (e.g., graphs and
charts) although a variety of methods have also emerged to communicate more
qualitative information including behavioral maps, and perspective renderings
(Ramasubramanian and McNeil, 2004).
The human visual system has the ability to interpret and comprehend pictures,
video, and charts much faster than reading a description of the same material.
The human brain performs some processing early in the chain of processing
visual input; this process starts in the eyes. Hence, images are interpreted much
faster than textual descriptions as the brain processes the visual input much
earlier than textual input. This results in the human visual system’s ability to
examine graphics in parallel, whereas humans can only process text serially
(Teerlink and Erbacher, 2006).
A visualisation is an image, diagram, graphic or animation representing data that
is intended to give a better understanding of that data. There are many different
visualisation areas, differing mostly by the domain of the visualised information.
Examples include: mathematical & scientific visualisations (results from
equations and formulas); product visualisation and three-dimensional design
(images, photos or computer aided design software) and medical imaging
(information and images from medical machines such as magnetic resonance
imaging scanners).
Visualisation, in its broadest sense, is a communicative process that relies on
encoded meanings that can be transferred from creators and organizers of
information to users and receivers of the same information (Shannon, 1948).
Edward Tuft (1997) proposes that visualisation is as much an art as a science,
where the processes of arranging data and information in order to achieve
Journal of Digital Forensics, Security and Law, Vol. 8(1)
75
representation, communication, and explanation are consistent regardless of the
nature of substantive content or the technologies used to display the information.
Marty (2008) stated:
“It is not just the expedited browsing capabilities that
visualization has to offer, but often a visual representation—in
contrast to a textual representation”
2. VISUAL EVIDENCE
In a modern courtroom, the presentation of forensic evidence by an expert
witness can bring about the need for arduous descriptions by lawyers and experts
to get across the specific details of complicated scientific, spatial and temporal
data. Within the realms of forensic science, the use of new technologies in order
to gather, analyse and present evidence is of the utmost importance in the modern
world. Better collection and analysis of evidence from a wide range of digital
media can be achieved by the use of data from the devices of perpetrators,
victims and witnesses involved in incidents. The devices which may provide
additional evidence include mobile phones, PDAs, tablets, digital cameras,
computers and closed-circuit TV. Recent terrorist event have highlighted these
new forms of evidence as mobile phone images and video are collected from
members of the public who were at the scene of an incident (Schofield, 2007).
Digital visual evidence presentation systems (including digital displays,
computer-generated graphical presentations and three-dimension simulations)
have already been used in many jurisdictions. As courtrooms transform into
multi-media, cinematic display environments, this has enormous implications
for the legal processes taking place with them. One must ask whether the
decisions made in these visual courtrooms are affected by the manner in which
the evidence is presented, and in truth, no one really knows the answer to this
important question.
Gerald Lefcourt (2003), a criminal defence lawyer in New York, has made the
following comments about members of the public who attend court:
“These are people who by and large have grown up on
television … The day of the lawyers droning on is really gone. I
think that jurors today, particularly the young ones, expect
quickness and things they can see.”
Forensic visualisation methods for two specific areas (investigation and
presentation) have a common thread; that is, that data visualisation is still
relatively new within the forensic and evidential thematic area. There is further
research required to establish an accepted framework of what visual is suitable
and acceptable for investigation and presentation in relation to the target
audience.
Journal of Digital Forensics, Security and Law, Vol. 8(1)
76
3. WHY VISUALISE DATA
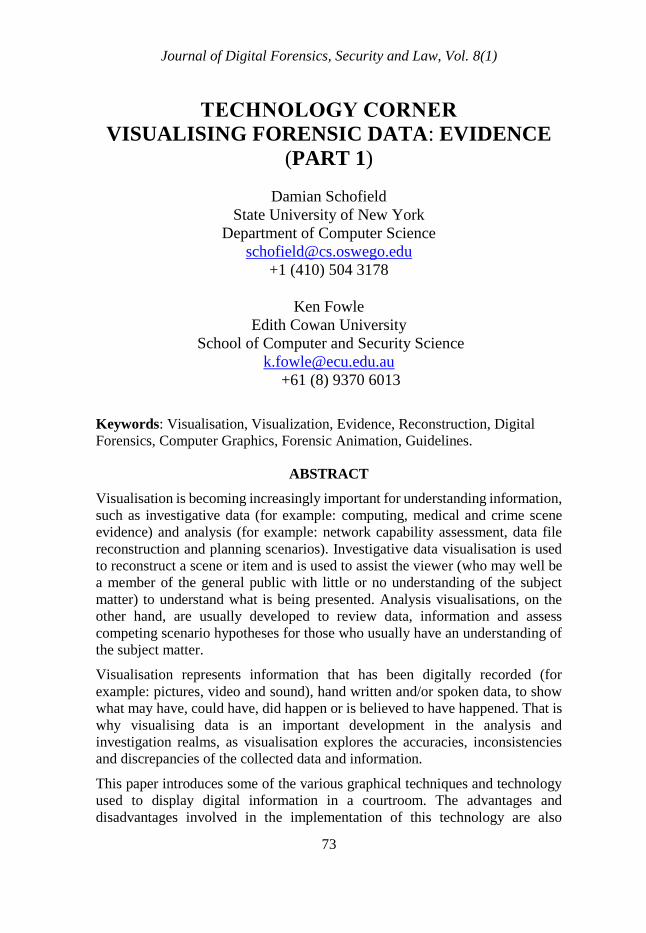
There is a famous expression that “a picture paints a thousand words” but this
epigram is only true if the viewer has some understanding of what is being
presented and why it is being presented. The inability of the general public to
understand William Playfair’s first graphs and charts is a prime example of this
problem (Tufte 1997). Consider the image shown below (Figure 1) and its
potential ability to confuse a viewer unfamiliar with the information types being
visualised.
Figure 1 Visual Representation of Computer Network Traffic (Wand n.d.)
The image above shows computer network traffic in a graphical format, the data
is captured from a live network interface, visualising the flow of network data
between hosts, providing (at a glance) information about network usage. To a
person trained in computer network traffic analysis the image has meaning and
provides displays information but to a layperson it will require the provision of
a detailed explanation. How information and data is viewed, interpreted and
understood depends on what is presented, to whom it is presented and why it is
being presented. Visualisations are only effective when the right kind of pictorial
representation is chosen and can be manipulated to show useful information
(Lowman, 2010).
Many forensic disciplines are facing an ever-growing amount of data and
information that needs to be analysed, processed, and communicated. Those who
Journal of Digital Forensics, Security and Law, Vol. 8(1)
77
have to look at, browse, or understand the data (judges, lawyers, jurors, etc.)
need ways to display relevant information graphically to assist in understanding
the data, analysing it, and remembering parts of it.
The ability of a computer to create synthetic copies of an event or issue (whether
as a static image, a plan or schematic, a computer animation or a virtual reality
simulation) provides the opportunity to enhance the viewer’s current
understanding. These visualisations allow users to learn, question and interact
within the computer-generated environment and it provides the opportunity to
make mistakes, revisit and review, without necessarily putting themselves at risk
(Fowle and Schofield, 2011).
4. INVESTIGATION VISUALISATION
Analysis of digital data storage is often a key area in modern crime scene
investigation, so much so in fact, that the computer is sometimes now considered
as a separate crime scene. The computer may hold evidence in the form of
documents, e-mail records, web history and caches, login dates and times of
access, and illegal files, to name but a few. The digital evidence process has
become so focused around this area, that disk analysis has become known, by
some authors as ‘forensic computing’ (Schofield and Mason, 2012).
Today’s digital forensic investigator has “hundreds of specific and unique
application software packages and hardware devices that could qualify as cyber
forensic tools…hundreds of utilities available for the same task” (Marcella and
Menendez, 2007). The basic requirement for a computer forensics tool is to
convert specific files into a human readable format for analysis by a forensic
investigator.
This analysis can be difficult and time-consuming and often involves trawling
through large amounts of text-based data. Efficient and effective visual
interfaces and visualisations can vastly improve the time it takes to analyse data.
These graphical tools can help users gain an overview of data, spot patterns and
anomalies, and so reduce errors and tedium (Lowman and Ferguson 2011).
In the case of a digital forensic investigation, an investigator may need to
examine the network traffic on a defendant’s computer. The investigators would
begin by investigating network traffic log files taken from the computer in
question. Marty (2008) reports that instead of showing a jury a log file that
describes how a digital event occurred, a picture or visual representation of the
log records should be used (such as the one shown in Figure 1). At one glance,
a picture such as this is potentially capable of communicating the content of this
log. So long as viewers are made aware of the context and content of the image,
most viewers can process this information in a fraction of time that it would take
them to read the original log (Fielder, 2003).

Journal of Digital Forensics, Security and Law, Vol. 8(1)
78
In the area of forensic surveying, the use of visuals to reconstruct the crime scene
from all the collected and recorded information (whether it be text, photographs,
sketches, or survey information) is invaluable. The crime scene will not be
available in its initial condition forever; evidence is often transitory and
ephemeral. Evidence and information needs to be recorded before crime scene
officers collect and remove any items of interest (thereby changing the original
condition of the crime scene).
The court is usually provided with some form of visual representation of the
crime scene. Traditionally, a hand created drawing (or map) based on the use of
traditional drafting techniques is represented as a two-dimensional (2D)
diagram, such as the one shown in Figure 2. In the past this may have been
crudely drawn or plotted to varying degrees of accuracy.
Figure 2 Hand Drawn Crime Scene Plan
(Courtesy of Mr. G. Schofield, Toronto Police)
Over the past few decades, the widespread introduction and acceptance of
computer technology has meant that courts have become used to seeing maps
and plans rendered digitally. The technology used to create these two-
dimensional displays varies, from simple freeware drafting programs to complex
mechanical engineering based drafting tools such as Autocad’s Mechanical
Desktop©. Often investigators use drafting technology that is tied to their scene-
measuring instrument; for example, many police surveyors draft plans using
software that download data from their electronic theodolites.
Currently, investigators are starting to see the use of three-dimensional laser
scanning technology for scene measurement and capture. These devices provide
Journal of Digital Forensics, Security and Law, Vol. 8(1)
79
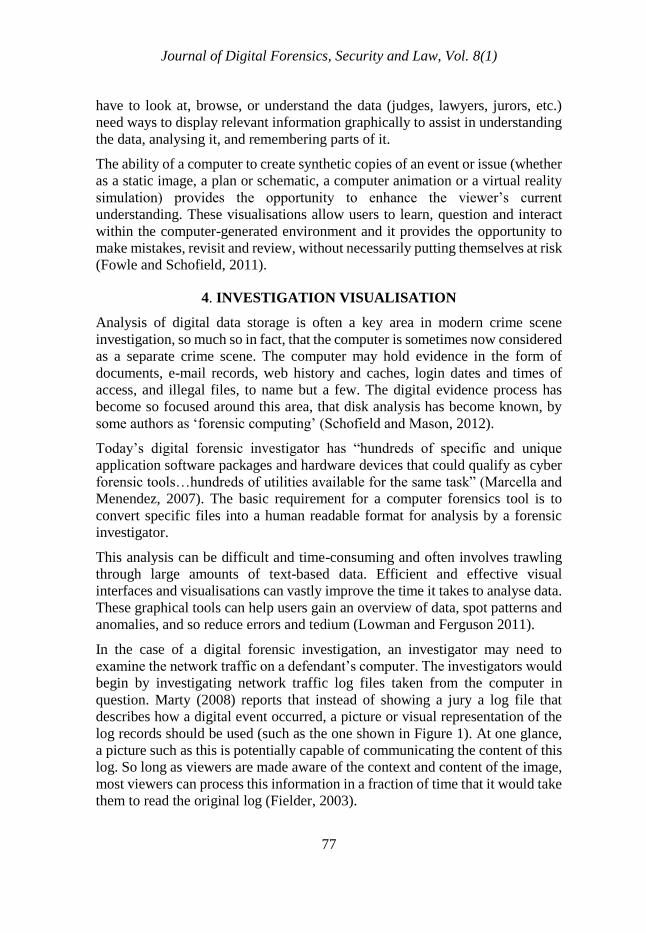
a combination of laser scanning surveying and digital photography. The
technology is capable of capturing all physical aspects of a scene in true three
dimensions (in the x, y and z planes) for accurate interrogation and analysis.
Figure 3 depicts an image of three-dimensional (3D) laser scan data; the black
spot (void) is where the scanner was placed to capture the crime scene. The three-
dimensional model represents a quantitative, objective database of
measurements, which different operators and investigators can share for
subsequent analysis.
Figure 3 A Three-Dimensional Laser Scan
(Courtesy of Mr. M. Haag, Albuquerque Police)
5. ANIMATING EVIDENCE
Computer-generated graphical evidence in the US has primarily been used in
civil cases. One of the first major uses of forensic animation took place in the
federal civil case for the Delta flight 191 crash. In August 1985 the Delta airplane
with 163 people aboard was caught in a wind vortex and crashed while
attempting to land at Dallas-Fort Worth Airport, a mile from the runway. In the
subsequent litigation the US Government offered a 55-minute computer-
generated presentation, including forensic animations to the court to explain
details pertaining to each item of evidence (Marcotte, 1989).
There is an extensive precedent concerning the use of a range of computer-
generated evidence in the United States, but very little in comparison in many
Journal of Digital Forensics, Security and Law, Vol. 8(1)
80
other jurisdictions. Consequently, judges in other jurisdictions may look to the
US for guidance in considering issues of admissibility. This has been particularly
true for the introduction of computer-generated animations and virtual
simulations in courtrooms in the UK and Australia. The legal precedents for the
admissibility of this technology into courtrooms have been extensively discussed
in other publications (Galves, 2000; Girvan, 2001; Schofield, 2007; Schofield
and Mason, 2012).
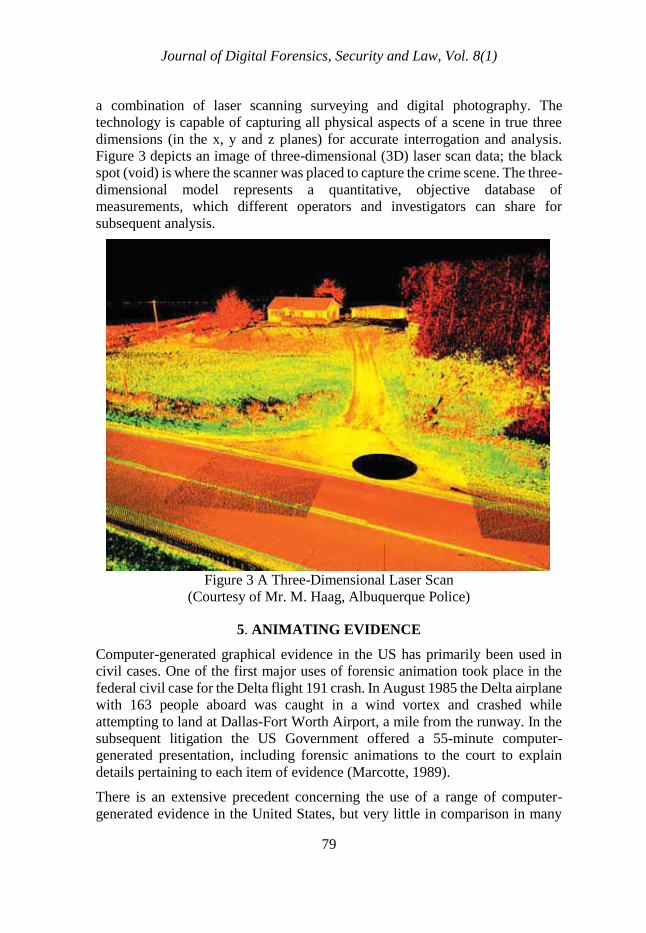
Presenting data related to road traffic accidents in the courtroom (such as the
example in Figure 4) provides is a prime example of the need to relate spatial
and temporal data, for which the use of virtual environment technology has been
extensively adopted (Schofield, et al., 2001). In such cases, a computer-
generated forensic reconstruction is built using a three-dimensional virtual
environment of a scene created from actual measurements, which are usually
taken by the police or investigators at the time of the incident.
Figure 4 An Image from a Forensic Animation of a Road Traffic Accident
Dynamic vehicle movements are often then simulated using scientific
calculations based on those measurements and the experience of the
reconstruction engineer. This computer model can then be rendered to create a
series of images and animations, which describe the scene or incident. These
virtual environments, when viewed in court, must support and corroborate
existing evidence to be admissible as substantive evidence in any courtroom
(Noond and Schofield, 2002).
Journal of Digital Forensics, Security and Law, Vol. 8(1)
81
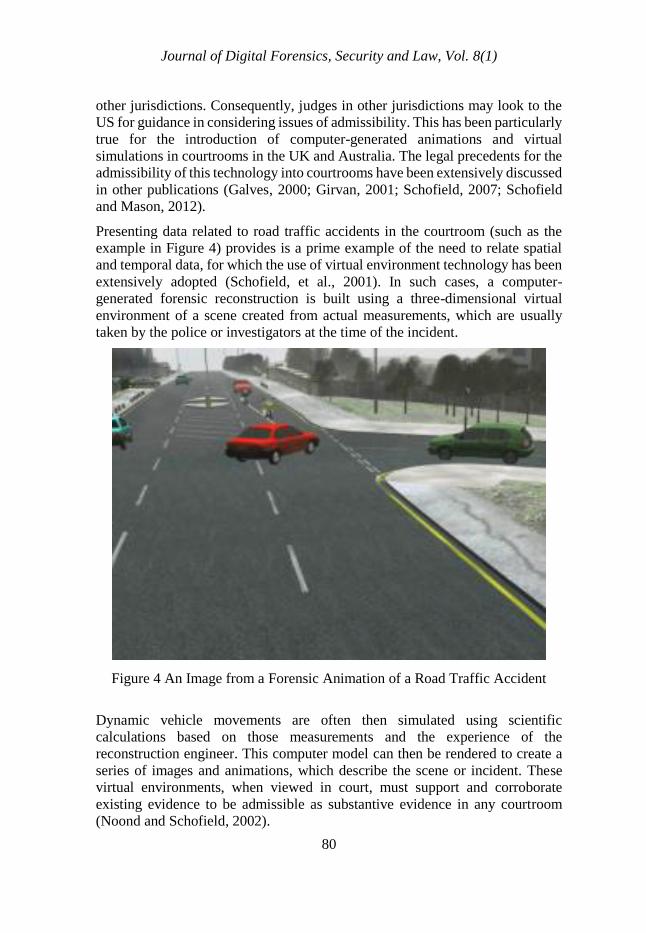
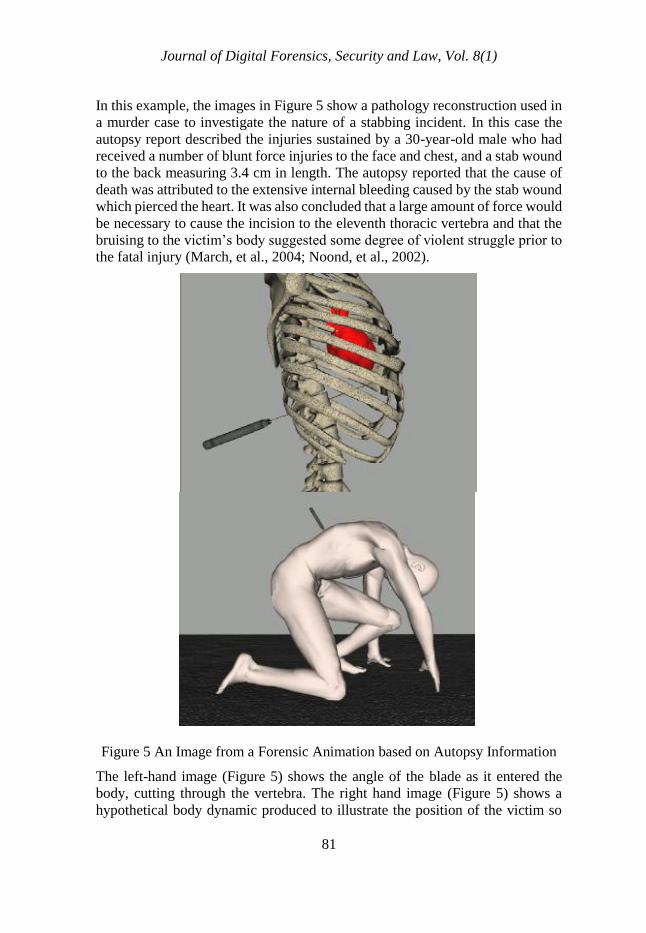
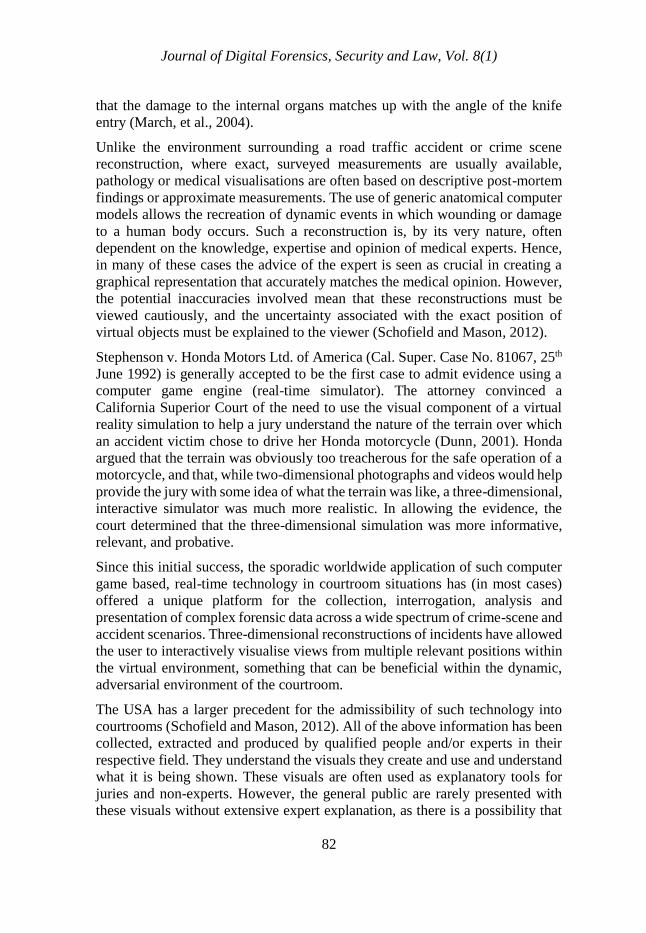
In this example, the images in Figure 5 show a pathology reconstruction used in
a murder case to investigate the nature of a stabbing incident. In this case the
autopsy report described the injuries sustained by a 30-year-old male who had
received a number of blunt force injuries to the face and chest, and a stab wound
to the back measuring 3.4 cm in length. The autopsy reported that the cause of
death was attributed to the extensive internal bleeding caused by the stab wound
which pierced the heart. It was also concluded that a large amount of force would
be necessary to cause the incision to the eleventh thoracic vertebra and that the
bruising to the victim’s body suggested some degree of violent struggle prior to
the fatal injury (March, et al., 2004; Noond, et al., 2002).
Figure 5 An Image from a Forensic Animation based on Autopsy Information
The left-hand image (Figure 5) shows the angle of the blade as it entered the
body, cutting through the vertebra. The right hand image (Figure 5) shows a
hypothetical body dynamic produced to illustrate the position of the victim so
Journal of Digital Forensics, Security and Law, Vol. 8(1)
82
that the damage to the internal organs matches up with the angle of the knife
entry (March, et al., 2004).
Unlike the environment surrounding a road traffic accident or crime scene
reconstruction, where exact, surveyed measurements are usually available,
pathology or medical visualisations are often based on descriptive post-mortem
findings or approximate measurements. The use of generic anatomical computer
models allows the recreation of dynamic events in which wounding or damage
to a human body occurs. Such a reconstruction is, by its very nature, often
dependent on the knowledge, expertise and opinion of medical experts. Hence,
in many of these cases the advice of the expert is seen as crucial in creating a
graphical representation that accurately matches the medical opinion. However,
the potential inaccuracies involved mean that these reconstructions must be
viewed cautiously, and the uncertainty associated with the exact position of
virtual objects must be explained to the viewer (Schofield and Mason, 2012).
Stephenson v. Honda Motors Ltd. of America (Cal. Super. Case No. 81067, 25th
June 1992) is generally accepted to be the first case to admit evidence using a
computer game engine (real-time simulator). The attorney convinced a
California Superior Court of the need to use the visual component of a virtual
reality simulation to help a jury understand the nature of the terrain over which
an accident victim chose to drive her Honda motorcycle (Dunn, 2001). Honda
argued that the terrain was obviously too treacherous for the safe operation of a
motorcycle, and that, while two-dimensional photographs and videos would help
provide the jury with some idea of what the terrain was like, a three-dimensional,
interactive simulator was much more realistic. In allowing the evidence, the
court determined that the three-dimensional simulation was more informative,
relevant, and probative.
Since this initial success, the sporadic worldwide application of such computer
game based, real-time technology in courtroom situations has (in most cases)
offered a unique platform for the collection, interrogation, analysis and
presentation of complex forensic data across a wide spectrum of crime-scene and
accident scenarios. Three-dimensional reconstructions of incidents have allowed
the user to interactively visualise views from multiple relevant positions within
the virtual environment, something that can be beneficial within the dynamic,
adversarial environment of the courtroom.
The USA has a larger precedent for the admissibility of such technology into
courtrooms (Schofield and Mason, 2012). All of the above information has been
collected, extracted and produced by qualified people and/or experts in their
respective field. They understand the visuals they create and use and understand
what it is being shown. These visuals are often used as explanatory tools for
juries and non-experts. However, the general public are rarely presented with
these visuals without extensive expert explanation, as there is a possibility that
Journal of Digital Forensics, Security and Law, Vol. 8(1)
83
they may not understand the raw visualisation, misconstrue the data presented,
or may infer a biased view from them.
6. ADVANTAGES AND DISADVANTAGES OF THE USE OF
THE TECHNOLOGY
By their very nature, any discussion of the issues involved in the presentation of
the whole range of digital evidence is likely to be basic and generic relating to
broad generalisations about the use of this technology across diverse courtroom
application areas. Many of the issues raised in the previous section affect the
admissibility of the reconstructions as courtroom evidence in the various global
jurisdictions. Consideration of these issues is crucial if such technology is to be
successfully used. As Wheate (2006) stated:
“It is difficult to determine how well twelve untrained,
underpaid and usually inconvenienced strangers comprehend
and utilise the evidence they hear in court, especially in cases
where the evidence is provided by highly trained experts such
as forensic scientists.”
It is possible to summarise a list of advantages and disadvantages of the use of
this technology.
Advantages of using the technology include:
Comprehension Increase – Three-dimensional reconstructions have the
ability to improve the comprehension, and the memory retention, of
complex spatial and temporal data and evidence.
Efficiency – Reconstruction technology can improve the speed with
which complex information can be imparted to a courtroom audience,
and therefore may shorten the length of a case. They may rarely, on
occasion, be responsible for extra points of confusion and cause an
increase in case length.
Persuasiveness – According to research conducted in the USA (Lederer
and Solomon, 1997) people are twice as likely to be persuaded when
arguments are supported by visual aids.
Attention Increase – People’s attention is drawn to moving objects. They
rank top on the hierarchy of methods to draw attention which spans from
actions, through objects, pictures, diagrams, written word, to spoken
word (Schofield, 2006). This increased attention should lead to the triers
of fact (usually a judge and jury) studying the evidence more intently.
Journal of Digital Forensics, Security and Law, Vol. 8(1)
84
Disadvantages of using the technology include:
Prejudice – Visual displays when used can introduce levels of prejudice,
if one side has such evidence and the other does not.
Bias – Graphics-based reconstruction technology is potentially prone to
allowing bias into the presentation, whether that is conscious bias (a
form of evidence tampering) or subconscious bias. In an attempt to
reduce this, all computer-generated graphical evidence must be backed
up with a comprehensive audit trail, and the expert witness presenting
such evidence must be able to substantiate the accuracy of the
reconstruction, both in terms of the original data used to reconstruct the
incident, and the accuracy of the reconstruction (Schofield and Mason,
2012).
Relaxation of Critical Faculties – this is an issue of the ‘persuasiveness’
of the technology. It is possible that when a subject is shown a ‘realistic’
computer-generated reconstruction of an event they may feel
mesmerised, or believe that they are seeing the actual event happen.
Jurors may hence adopt a ‘seeing is believing’ attitude, as has been
shown to sometimes be the case with television viewing (Fielder, 2003;
Schofield, 2007; Speisel and Feigenson, 2009). There is therefore a
potential reduction in their level of critical appraisal of the reconstructed
evidence.
It does not make sense to use technology just for the sake of using something
new. However, as many lawyers and expert witnesses continue to push towards
the dynamic presentations of video, text, documents and other forms of evidence,
it seems likely that these complex data visualisations and forensic virtual models
will become a more pervasive and effective alternative to the sketches, drawings
and photographs traditionally used to portray demonstrative evidence in the
courtroom (Bailenson, 2006; Galves, 2000; Girvan, 2001; O’Flaherty, 1996;
Schofield, 2011).
It could be said that when visualising data, a person must have the knowledge of
the data they are visualising, but they must also have knowledge of how to apply
the visualising techniques for their audience. Marty (2008) supports this
reasoning: he reports that most people who are trying to visualise data have
knowledge of the data itself and what it means, even if they do not necessarily
understand the visualisation. The viewer tends to visualise only the information
collected or generated by a specific solution.
The use of advanced visualization tools (specifically three-dimensional
computer models) allows for the recreation of an incident illustrating the
chronological sequence of events. However, such a reconstruction is, by its very
nature, often dependent on the knowledge, expertise and opinion of the experts.
These must be viewed cautiously and the uncertainty associated with each item’s
Journal of Digital Forensics, Security and Law, Vol. 8(1)
85
position and action within the reconstruction must be explained by the person
presenting the visual to the audience.
It should be noted that during both investigation and courtroom presentation
there should be some concern that the investigator/reviewer will be focused on
the visual images rather than the data source. This is of importance since visual
evidence has the potential to be particularly misleading and it is possible that
people may focus only on the elements that have a high degree of visual appeal.
In all these situations, new visualisation techniques and products may be used
inappropriately or used to deflect the viewer’s focus away from key evidential
issues.
In summary, the main benefit of the use of these reconstructions in the courtroom
is their ability to persuade a jury. In terms of admissibility in courtrooms around
the world, this persuasive nature may also bring about a variety of objections to
their use.
7. CONCLUSIONS
Our culture is dominated with images whose value may be simultaneously over-
determined and indeterminate, whose layers of significance can only be teased
apart with difficulty. Different academic disciplines (including critical theory,
psychology, education, media studies, art history, and semiotics) help explain
how audiences interpret visual imagery. The continuing digital revolution has
had an enormous impact on the way forensic evidence is collected, analysed,
interpreted and presented and has even led to the defining of new types of digital
evidence (for example, digital imagery and video, hard drives and digital storage
devices). Much of this digital media will end up needing to be admitted into
courtrooms as evidence. In most jurisdictions around the world technology can
be slow to become legally accepted. It is fair to say that, in general, legislation
for the admissibility of digital media usually lags behind the technological
development (Schofield and Mason, 2012). In a very real and practical sense,
the analysis of courtroom imagery and its interpretation by jurors and other
courtroom participants)is only just beginning (Speisel and Feigenson, 2009).
This paper has highlighted thematic areas where novel technologies may bring
improvement to the forensic process. It underlines the fact that, recently, three-
dimensional forensic reconstruction techniques are being increasing used (along
with other multimedia technologies) to present forensic evidence in the
courtroom. The technologies have been targeted in this area due to their success
in communicating highly complex, technical, spatial and temporal evidential
information to the general public.
Forensic science technology advances rapidly, and the public, who regularly
watch high-technology crime scene investigation on television, expect to see
their TV experience duplicated in the real courtroom environment. The public
Journal of Digital Forensics, Security and Law, Vol. 8(1)
86
expects professional visual representations illustrating complex forensic
evidence, polished digital media displays demonstrating the location of spatially
distributed evidence and dynamic animated graphics showing event
chronologies.
Modern systems for creating visualisations have evolved to the extent that non-
experts can create meaningful representations of their data. However, the process
is still not easy enough, mainly because the visual effects of processing, realising
and rendering data are not well-understood by the user, and the mechanisms used
to create visualisations can be a largely ad hoc process (Rogowitz and Treinish,
2006).
Commercial media companies often magically appear offering ‘professional
graphics’, ‘forensic animation’ and ‘crime scene reconstruction’ services similar
to those seen on the televised forensic/crime shows. In countries all around the
world, many lawyers and expert witnesses now use, and have to confront in an
adversarial manner, computer-generated animations, three-dimensional virtual
reconstructions, real time interactive environments and graphical computer
simulations (Schofield, 2007). However, there is little research being undertaken
to consider the impact this technology is having in the courtroom, in particular
how it is affecting the decisions being made (Schofield, 2011).
This concludes part one of this two part investigation into the use of digital
displays in the courtroom. Part two of this paper will analyse and discuss specific
problems in relation to the use of this technology in the courtroom.
REFERENCES
Bailenson, J. N., Blaschovich, J., Beall, A. C., & Noveck, B. (2006). Courtroom
applications of virtual environments, immersive virtual environments and
collaborative virtual environments. Law and Policy, 28(2): 249-270.
Cleveland, W. S., & McGill, R (1984). Graphical perception: Theory,
experimentation, and application to the development of graphical methods.
Journal of the American Statistical Association, 79(387): 531-554.
Dunn, J. A. (2001). Virtual reality evidence. The Electric Law Library. Retrieved
from http://www.lectlaw.com/files/lit04.htm, on 10 December 2012.
Fielder, B. (2003). Are your eyes deceiving you? The evidential crisis regarding
the admissibility of computer-generated evidence. New York Law School Law
Review, 48(1&2): 295–321.
Fowle, K., & Schofield, D. (2011). Visualising forensic data: Investigation to
court. The 9th Australian Digital Forensics Conference, 30 November–2
December 2011, Perth, Western Australia.
Journal of Digital Forensics, Security and Law, Vol. 8(1)
87
Galves, F. (2000). Where the not so wild things are: Computers in the courtroom,
the federal rules of evidence, and the need for institutional reform and more
judicial acceptance. Harvard Journal of Law and Technology, 13(2): 161–302.
Girvan, R. (2001). An overview of the use of computer-generated displays in the
courtroom. Web Journal of Current Legal Issues, 7(1).
Lederer, F. I., & Solomon, S. H. (1997). Courtroom technology–An introduction
to the onrushing future. Proceedings of Fifth National Court Technology
Conference (CTC5), National Centre for State Courts. Session no. 103:
Evidence Technology in the High-Tech Courtroom.
Lefcourt, G. (2003). The use of technology in the courtroom. New York, NY:
New York Council of Defense Lawyers.
Lowman, S. (2010). Web history visualisation for forensic investigations. MSc
Forensic Informatics Dissertation, Department of Computer and Information
Sciences, University of Strathclyde, Glasgow, UK.
Lowman, S., & Ferguson, I. (2012). Web history visualisation for forensic
investigators. Forensic Focus. Retrieved from
http://articles.forensicfocus.com/2011/07/26/web-historyvisualisation-for-
forensic-investigations/ on 10 December 2012.
Marcella, A. J., & Menendez, D. (2007). Cyber Forensics: A Field Manual for
Collecting, Examining and Preserving Evidence of Computer Crimes. CRC
Press.
March, J., Schofield, D., Evison, M., & Woodford, N. (2004). Three-
dimensional computer visualisation of forensic pathology data. American
Journal of Forensic Medicine and Pathology, 25(1): 60-70.
Marcotte, P. (1989). Animated evidence: Delta 191 crash re-created through
computer simulations at trial. Journal of the American Bar Association, 75: 52-
57.
Marty, R. (2008). Applied security visualization. Network World. Retrieved
from http://www.networkworld.com/subnets/cisco/030309-ch1-applied-
security-visualization.html?page=1 on 10 December 2012.
Noond, J., & Schofield, D. (2002). Visualising the scene–Interactive evidence:
Litigation graphics and virtual reality. Proceedings of Expert Evidence:
Causation, Proof and Presentation Conference, Prato, Italy.
O’Flaherty, D. (1996), Computer-generated displays in the courtroom: For better
or worse? Web Journal of Current Legal Issues, 2(4).
Ramasubramanian, L., & McNeil, S. (2004). Visualizing urban futures: A review
and critical assessment of visualization applications for transportation planning
Journal of Digital Forensics, Security and Law, Vol. 8(1)
88
and research. Proceedings of the City Futures Conference, 9-10 July, 2004,
Chicago, IL.
Rogowitz, B., & Treinish, L. (1996). How not to lie with vizualization.
Computers in Physics, 10: 268-274.
Schofield, D. (2006). The future of evidence: New applications of digital
technologies, forensic science: classroom to courtroom. Proceedings of 18th
International Symposium of the Forensic Sciences, 2-8 April 2006, Fremantle,
Western Australia, 2006.
Schofield, D. (2007). Animating and interacting with graphical evidence:
Bringing courtrooms to life with virtual reconstructions. Proceedings of IEEE
Conference on Computer Graphics, Imaging and Visualisation, 14-16 August
2007, Bangkok, Thailand.
Schofield, D. (2011). Playing with evidence: Using video games in the
courtroom. Journal of Entertainment Computing, Special Issue: Video Games
as Research Instruments, 2(1): 47-58.
Schofield, D., Noond, J., Goodwin, L., & Fowle, K. (2001). Accident scenarios:
Using computer generated forensic animations. Journal of Occupational Health
and Safety (Aus NZ), 17(2): 163-173.
Schofield, D., & Mason, S. (ed). (2012). Using Graphical Technology to Present
Evidence, in Electronic Evidence, 2nd ed. London, UK: Lexis-Nexis.
Shannon, C. E. (1948). A mathematical theory of communication. Bell System
Technical Journal, 27: 379-423.
Speisel, C. O., & Feigenson, N. (2009). Law on display: The digital
transformation of legal persuasion and judgement. New York, NY: New York
University Press.
Teerlink, S., & Erbacher, R. F. (2006). Foundations for visual forensic
analysis.7th IEEE Workshop on Information Assurance, 21-23 June 2006, U.S.
Military Academy, West Point, NY.
Tufte, E. (1997). Visual explanations: Images and quantities, evidence and
narrative. Cheshire, CT: Graphics Press.
Wheate, R. (2006). Australian juries and scientific evidence. Australian Journal
of Forensic Sciences, 38(2): 75.
BIOGRAPHICAL DETAILS
Dr. Schofield (PhD) is currently Director of Human Computer Interaction
(Associate Professor) at the State University of New York (SUNY) Oswego,
USA, and an Adjunct Associate Professor of Digital Forensics in the School of
Computer and Security Science at Edith Cowan University, Perth, Australia.
Journal of Digital Forensics, Security and Law, Vol. 8(1)
89
Previous to this position he held the title of Associate Professor of Computer
Games and Digital Media, in the School of Creative Media at RMIT University
in Melbourne, Australia. In his earlier career he was one of the managers of the
internationally renowned Mixed Reality Lab (MRL) at the University of
Nottingham in the UK.
Dr. Schofield has also been on the management board of both the Visual
Learning Lab (a UK HEFCE centre of excellence) and the Learning Sciences
Research Institute (UK). Dr. Schofield also remains a director and major
shareholder of Aims Solutions Ltd., a UK based company providing computer
graphics visualisation services and virtual reality based simulation training
products to a wide range of public and private sector organisations.
Dr. Schofield has been involved in developing crime scene reconstructions using
computer games/graphics technology for over 15 years. His research is
specifically concerned with representation and understanding of visual
information in the courtroom environment. The reconstructions he and his team
create cover a wide range of forensic visualisation from computational fluid
dynamics models to blood spatter patterns at crime scenes, from road traffic
accident reconstruction to post-mortem pathology visualisation. Dr. Schofield is
regularly used as an expert witness in courts all over the world and has worked
on many high profile cases.
Dr. Schofield has been involved in forensic casework in the UK, Australia, the
USA and Malaysia. A few years ago, he was responsible for the facial
reconstruction of an Egyptian mummy for a documentary called Nefertiti
Reserected on the Discovery Channel. For the last six years he has also been
working on a major facial biometric project for the FBI (Federal Bureau of
Investigation) in the USA.
Ken Fowle (PhD) is currently the Head of School (Associate Professor),
Computer and Security Science, at Edith Cowan University (ECU), Western
Australian and an Adjunct Associate Professor at the University of Western
Australia, Centre of Forensic Science (CFS). Prior to moving over to academia,
Dr Fowle was employed by the Department of Mines and Petroleum in the
Investigation Branch.
Dr Fowle’s interest in visualisation and accident reconstruct started back in
1996, when seconded to the departments Mine Safety Branch to assist with
developing computer applications for mining accident and incidents. This
interest was further enhanced in 1999 when he was seconded to Central Tafe to
establish a research and development group specifically for developing
computer graphics for the resource sectors of Western Australia. During his time
at Central Tafe, Dr Fowle undertook a PhD with the University of Nottingham’s
AIM’s research group.

Journal of Digital Forensics, Security and Law, Vol. 8(1)
90
In 2003 Dr Fowle returned to the Department of Mines and Petroleum where he
continued his research into visualisation and won funding from the WA
Government, to continue research in the use of 3D environments for accident
reconstruction. This research interest continues at ECU with collaboration with
the WA Police Service, London Metropolitan Police, Northumbria University,
State University of New York and local and national research groups such as
IVEC, CFS and ECU’s Security Research Institute.
Dr Fowle is past president of the Australian and New Zealand Forensic Science
Society and is still an active committee member, is a member of the International
Association for Forensic Survey and Metrology, American Society for Industrial
Security, Australian Computer Society and the Australian Law Enforcement
Forensic Surveying Working Group.