Embed Size (px)
Citation preview

TECHNOLOGICAL FORECASTING AND SOCIAL CHANGE 38, 223-256 (1990)
Technology Diffusion in the Coal-Mining
Industry of the USSR
An Interim Assessment
ALEXANDER ASTAKHOV, ARNULF GRijBLER, and ANDREY MOOKHIN
ABSTRACT
This article presents an analysis of technological change in the underground coal-mining industly of the
USSR. It describes within a quantitative framework first the evolution of the coal-mining industly in general,
based on macro-indicators of output, production intensity, and labor productivity. The article then discusses
qualitatively the different historical phases of technology development inside the industry and concludes by a
quantification of technological diffusion trajectories, based on standard bi- and multi-variate models of tech-
nological substitution of the Fisher-b and Marchetti-Nakicenovic type,
The paper not only provides insight into the dynamics of technological change in the coal-mining industly
of the USSR, but also illustrates the applicability of standard technology diffusion and substitution models for
the analysis of technological change in a planned economy. Although not exhaustive, the analysis presents a
first step for the development of more comprehensive models of the causal forces behind the patterns of
technological change identified, and for intemational comparisons of technology diffusion in the coal-mining
sector.
Introduction Technology diffusion in the coal-mining industry has received limited attention in
the vast body of diffusion studies. ’ Whether this situation is possibly due to the fact that
the coal industry as a mature industry sector with decreasing market shares in the total
energy supply since 1945 has not attracted the interest of researchers, it is certainly not
ALEXANDER ASTAKHOV graduated from the Moscow Mining Institute, where he also received his
PhD. In 1976, he became professor at the Department of Social and Economic Sciences at the Institute of the
Management of the National Economy and, since 1978, has beer1 head of the Department of Industrial Economics
and Organization at the Academy of the National Economy of the Council of Ministers of the USSR, Moscow.
ARNULF GRijBLER graduated from the Technical University Vienna, Austria, where he also received
his PhD. Since 1976, he has been affiliated with the International Institute for Applied Systems Analysis
(IIASA), Laxenburg, Austria. ANDREY MOOKHIN graduated from Moscow State University. Later, he worked in the Department of
Mineral Economics at the All Union Institute for Systems Studies, where he also received his PhD. He is
presently affiliated with the Commission for Natural Resources at the USSR Academy of Sciences, Moscow.
Address reprint requests to Dr. Amulf Griibler, IlASA, A-2361 Laxenburg, Austria. ‘Noteworthy exceptions are the studies by Mansfield [ 1,2] and, in the case of longwall mining, Souder
and Quaddus [3] for the United States and Ray and Uhlmarm [4] and Ray [5] for the United Kingdom. A good quantitative overview (however, outside of the statistical framework of classic diffusion studies) of technological
developments in the hard-coal-mining industry of the Federal Republic of Germany is provided by Kundel [6,
71. An overview of the long-term production and technology trends in the coal industry at the global level as
well as in the United Kingdom and Germany is given by Griibler [S].
Published 1990 by Elsevier Science Publishing Co., Inc. 0040-1625/90/$0.00

224 A. ASTAKHOV ET AL.
warranted from the viewpoint of data availability on technical change in the sector or
from the importance in terms of employment and contribution to the primary materials
sector of an economy. In addition, the quantitative description of technological diffusion
processes, or as it would be termed in the USSR, the quantitative aspects of rates and
regularities of scienttjk and technical progress, is a rather recent field in the USSR and
resulting studies are rather scarce.
The present study attempts to fill both gaps and to provide an interim assessment of
technological change in the coal-mining industry of the USSR by analyzing some of the
most important technological innovations occurring in the industry in the last 50 years
against a background of a general discussion of the evolution of the industry in terms of
output, production intensity, and labor productivity. The study is seen as a first step, in
that the present discussion of technological trends in coal mining in the USSR. although
fairly comprehensive, is by far not exhaustive and is intended to stimulate further research.
The study provides a first test of the applicability of some of the standard methodological
apparatus developed to analyze technology diffusion in market economies to the study
of technological change in planned economies. As it turns out, the methodological in-
struments appear quite applicable, thus providing the basis for a subsequent cross-national
analysis of technological change in the coal-mining industry. This follows earlier IIASA
research on a cross-national comparison of resource requirements and the economics of
the coal extraction process [9] and is intended to provide a deeper understanding of the
dynamics and impacts of technological change in the coal-mining industry.
A Brief Overview of Coal-Mining Development in the USSR
THE IMPORTANCE OF EXTERNAL FACTORS IN THE DEVELOPMENT OF THE INDUSTRY
The historic development of the coal industry in the USSR has been highly influenced
by a number of external factors, including the effects of the two world wars and of the
October Revolution and also the effects of the discovery and subsequent development of
large oil and natural gas resources, leading to a reorientation of the energy policy which
had previously been entirely concentrated on coal. These external factors have to be taken
into account in understanding the development of the USSR coal industry in general and
of technological change in coal mining in particular.
The coal-mining industry was for a long time considered as the key branch in basic
industries. The very large coal resources were basically the only base to support the
ambitious plans of rapid and autonomous development of the industry of the USSR. The
major role that technical advance had to play within this policy context was to support
these extensive development programs. “More coal” was considered synonymous for an
“improved efficiency” of the national economy. In view of the high targets to increase
coal production, the predominant objective was to overcome the main limiting factor in
this expansion of coal production, i.e., the fact, that coal mining was essentially a manual
process with hard physical working conditions, thus impeding a dramatic intensification
of coal production. This was the origin of the introduction of the first mechanization steps
at coal faces, primarily through the rapid spread of the use of pneumatic picks and
explosives for coal-winning operations.
Capital and labor constraints were not really limiting factors in these first mecha-
nization steps, because the first measures of mechanization were relatively inexpensive
and the coal industry was receiving high priority in the central allocation of investment
funds. With increasing labor productivity and a relatively large labor force, the rapid
TECHNOLOGY DIFFUSION IN COAL MINING 225
expansion of the coal industry did not face any considerable labor supply constraints.
The main drive in the development of the industry was aimed at production intensification
as reflected in its most important indices like total industry output and, in particular, coal
output per face and per mine. The most important technical innovations to reach this goal
were introduced in the areas of face and transport operations.
With the discovery of important oil and natural gas resources, the situation with
respect to coal was drastically altered. Coal demand did not decrease, however the growth
rates of the coal industry slowed down considerably. Public attention and priorities in its
development and capital investments were reduced. The main driving force for decision
making was no longer the increase of output, but production enconomics. The social
prestige of working in coal mines was also drastically lowered, particularly among the
younger generation. Thus the main driving force for technological innovation in the coal- mining industry was shifted to the realization of economic (cost reduction) and social
(safety and improvement of working conditions) goals. This period, which lasted from
about 1955 to 1975, resulted in the introduction and rapid diffusion of a number of
important technological innovations to pursue the economic and social goals and in
particular to offset the effects of continuously deteriorating geological conditions at un-
derground mines.
The time period after 1975 can again be seen as a new period in the development
of the coal-mining industry in the USSR. The potential of the technological innovations
introduced in the earlier period became progressively exhausted. While the returns of
technical innovations decreased, ever more capital was required for further improvements
of existing techniques as well as their introduction into new areas of applications. Im-
proving social conditions, both in terms of safety and working conditions, required
additional capital without resulting in a relief of the by now tight labor supply situation.
The worsening of geological conditions at greater mining depths, particularly the European
coal basins of the USSR, accelerated, and no principally new technologies were available
for widespread introduction into the industry to compensate for these effects. Consequently
the labor productivity at underground mines started to decline after 1975, and opencast mining appeared as the only main technological option available to the coal-mining
industry, especially in view of the fact that labor productivity is on average ten times
higher in opencast mines as in underground mines. Thus, while the output from under-
ground mines more or less stagnated around 430 million tons since 1965, the output from
opencast mines increased over this time period from 140 to 320 million tons.
SPECIFICS OF TECHNOLOGICAL INNOVATIONS IN THE COAL-MINING INDUSTRY
OF THE USSR
Technological innovations in the USSR coal-mining industry are characterized by a
number of rather specific features. These relate to the specific character of coal mining
as an industrial process, as well as to the specific circumstances of the industrial devel-
opment of the USSR at various historical time periods. Technological innovations thus
have to be understood within @e technological, economic, and social environments in
which they are embedded.
The technological environment of importance to the understanding of technical
change in coal mining in the USSR may be summarized as follows:
1. Coal mining in prerevolutionary Russia was essentially an entirely manual pro-
cess, with mechanization largely limited to mining support functions like ven-

226 A. ASTAKHOV ET AL.
tilation, water drainage, and transport to the surface. Thus, the main driving
force of technological change can be seen in the progressive application of mech-
anization to manual operations such as winning, loading, and transport, roof
support, and driving of development workings.
2. Coal mines are in fact very heterogeneous, because of their differences in natural
bedding conditions. Mining machinery has to be developed following the char-
acteristics of each of these different conditions (e.g., thickness of coal seams and
their inclination). Thus the life cycle of a particular innovation for a given mining
operation (e.g., transport or development) appears to be rather long, as it involves
a series of subsequent development cycles aiming at the progressive utilization
of an innovation under a wide range of geological conditions; e.g., shearers and
self-advancing roof supports were first developed for flat and medium-thickness
seams, and drastically new equipment with the same name had to be developed
for steep bedding and thin seams. This, however, happened much later.
3. The state of the art of coal-mining technologies at the world level does not propose
a large number of radically different mining technologies (in the broad sense of
the term) to result in drastically different technological solutions in different
countries. Underground and opencast mining methods are used worldwide.’ Un-
derground mining systems can be subdivided into longwall and shortwall mining
and room and pillar mining, with each of them relying on specific technologies
or, as in the case of room and pillar mining, having a specific range of geological
conditions where they can be applied, i.e., only in relatively shallow (above 300
meters depth) deposits. Opencast mining systems can also be subdivided into
three or four subvariants. Hydraulic underground mining (winning by water jet
and coal transport by gravity flow of the coal-water slurry) is listed as the third
principal technological system in Soviet statistics; however, this method is used
only on a very small scale even in the USSR, which made the largest efforts for
its introduction. Drilling technologies, e .g . , in combination with in situ coal
gasification, have to date not penetrated the coal industry. Thus, on the whole,
coal winning at the face is today based on the same basic physical principles as
it was centuries ago. No radically new technologies for practical introduction
into the sector before the year 2000 appear to be available. The historical tech-
nological development of the coal industry may thus be described as incremental
rather than as having radical breakthroughs.
4. Technological innovations in the coal-mining sector have often been incomplete,
especially in the development of the irt@im of the various coal-mining op-
erations. The separate introduction of new, highly productive equipment in a
number of different operations did not change the total technological chain, which
remained segmented. A number of auxiliary labor-intensive operations are still
unmechanized (e.g., repair and maintenance operations, and equipment instal-
lation, for which no specialized equipment has been introduced), becoming in
turn new bottlenecks in the technological chain at a coal mine.
Specific economic characteristics of coal-mining development in the USSR may be
summarized as follows:
*For a more detailed discussion of the various opencast and underground mining technologies used world-
wide, see Astakhov and Griibler [9].

TECHNOLOGY DIFFUSION IN COAL MLVING 221
1. Availability of investment capital was no practical constraint during the first phase
of mechanization, i.e., coal-winning operations. The share of face equipment in
the total capital cost of an underground mine was relatively low. This situation
changed drastically when (expensive) hydraulic self-advancing roof-support sys-
tems were introduced and the number of “completely mechanized” faces (i.e.,
with completely mechanized winning, coal-loading, transportation, and roof-
support operations) grew.
2. The economic benefits of highly productive, completely mechanized faces could
only be realized if all other underground operating systems were also reorganized.
The total reorganization of transportation and ventilation operations turned out
to be rather complicated and very capital consuming. If these reorganizations are
not managed successfully, the economic benefits of the introduction of a new
technology turn out to be worse than expected.
3. Mining activities develop under ever-worsening geological conditions of depth,
gas content, etc. All economic and productivity indices of a particular mine and
of the industry as a whole would thus deteriorate in the absence of technological
advances. Technical innovations are the only way to overcome the adverse effects
of progressive depletion of low-cost resources. Thus the real effects of techno-
logical advances in the area of coal mining are not adequately described by the
evolution of general economic or productivity indicators, as a large share of the
improvements in productivity increase and cost reduction are offset by the de-
terioration in the geology of the deposits mined. If in turn the rate of advance
of technological improvements starts to slow down, as for instance when all high- output faces are already completely mechanized and further technological im-
provement is approaching a barrier, cost and productivity indices start to decline
under the ever-deteriorating geology. This is apparently the case in the USSR
coal industry since 1975.
4. The economic effects of mechanization show decreasing rates of return in time.
At the beginning, when manual labor is substituted by machines, the economic
(and social) benefits are high. In due course the capital-labor ratio starts to
deteriorate even under further incremental improvements of the given techno-
logical generation. At the end of the diffusion process the new machinery pen-
etrates into its poorest field of application, where the economics are much worse
than in the initial field of application. Nevertheless, the application of a new
technology even under these conditions may be justified for social (work con-
ditions, safety) or other reasons.
5. Opencast mining is the most economic coal production method in the USSR.
Production costs are 4-8 times lower than for underground mines, and labor
productivity is on average ten times as high as in underground mines. The rapid
further development of opencast mines will result in significant structural changes
in the coal-mining industry of the USSR, including the geographical distribution
of production (a move to the east). Clearly the economic advantages of opencast mining are not primarily a result of technology. They are first the result of the
more advantageous and simpler bedding conditions of the deposits being mined
by opencast methods. The USSR disposes of a number of large deposits with
excellent geological conditions (e.g., the Ekibastuz deposit with seam thickness
of up to 100 meters of high-quality coal and mines with annual capacities up to
30 million tons per year); however, these deposits are located far from the main
centers of consumption (and thus entail high transportation costs) and sometimes

228 A. ASTAKHOV ET AL.
consist of low-grade resources (e.g., the brown coal in the Kansk Achinsk basin,
which would allow from the available resource base a tremendous production
level of up to 1,000 million tons per year). Still, the massive development of
such giant opencast mining operations relies first on the resolution of a number
of complex problems in the other sectors of the economy, including the devel-
opment of appropriate transport and social infrastructure, technology develop-
ments to cope with extremely harsh climatic conditions, and finally also on a
reduction of the (long) lead times for production and delivery of large-scale
opencast mining equipment. Resulting environmental problems (mine reclama-
tion, emissions from coal conversion facilities, etc.) remain also to be resolved.
The social criteria for the long-term technology development in the coal-mining
industry of the USSR are important determinants for the decision making in coal-mining
activities. Despite the fact that the criteria, as well as their relative roles have been
changing over time, it is still possible to summarize that the main role of technical
development is to ease the hard physical labor of the people working underground, to
make working conditions more comfortable and safer, and in general to minimize the
number of underground jobs as much as possible. This was and continues to be the major
social objective pursued in the mechanization process at coal mines.
A GENERAL PERIODIZATION OF THE LONG-TERM EVOLUTION OF COAL MINING
IN THE USSR
The time period from 1913 to 1986,3 considered in our analysis of the long-term
development of the USSR coal-mining industry, can be characterized by a number of
changing global situations, not only within the coal-mining industry itself, but within the
evolution of the national economy of the USSR as a whole. Among the historical events
inducing major structural changes are the October Revolution and the effects of the two
world wars. These structural change periods implied a starting point to define new ob-
jectives as well as to open new development possibilities for the coal-mining industry of
the country. Exploration opened up new coal basins for production, new mining tech-
nologies were developed and were successively introduced into the industry. These various
“turning points” in the long-term evolution can be clearly seen in all macro-indicators of
the development of the industry. It is thus useful to differentiate in the dynamic analysis
of the development of the industry between a number of historical phases of development,
within which the evolution of the general situation of the industry, of the economics of
coal mining, and of technical change should be discussed.
The starting point of our analysis period, 1913, was the last peace year of old Russia.
The effect of World War I, the October Revolution, and the following civil war resulted
in a drastic reduction of the coal production levels to less than one-third of the prewar
period. The phase of reconstruction of the coal-mining industry lasted until around 1928,
when the coal production level exceeded for the first time tht prewar level of around 30
million tons per year. The next development phase was characterized by rapid and stable
growth that lasted until 194 1. Coal prodm:tion levels rose from 35.5 to 165.9 million
tons per year (i.e., at a rate close to 14% per year) with new coal basins such as the
Kuznetsk and the Karaganda being brought into production. However, the Donbass (Donetsk basin) remained the dominant coal production area, accounting for close to 60%
of the total coal production of the USSR.
‘For statistics on the general evolution of the coal-mining indushy during this time period, see the data
ap11diX.

TECHNOLOGY DIFFUSION IN COAL MINING 229
In mid-1941, World War II spread over the Soviet Union. The mines in the Donbass
and in the Podmoskovny basin were totally destroyed. The resulting production gap was
compensated to a large extent by the rapid development of eastern coal basins, whose
output increased from around 70 million tons in 1940 to 110 million tons in 1945. After
the liberation of the occupied territories, a rapid restoration of the mines in the Donbass
and Podmoskovny basins started. By 1950, the coal production in the Donbass had again
reached the 1940 level of 95 million tons, while the production of other basins continued
to increase to a level of around 170 million tons.
The following period, 1950-1975, was characterized by a stable growth of the total
coal industry, whose output rose from 260 to 270 million tons (i.e., at an annual growth
rate of 4%). Nearly half of this growth came from increasing output of opencast mines,
whose share in the total production increased from 10% to 32% between 1950 and 1975.
After 1975, the growth in output of underground mines and in particular the pro-
duction of the Donbass started to stagnate and later declined. A similar situation can be
observed with the evolution of labor productivity of underground mines in this time
period. Only very recently can some indicators of a certain revival be observed.
GENERAL PERIODIZATION OF TECHNOLOGICAL CHANGE IN UNDERGROUND COAL MINING
IN THE USSR
The dynamics of technological change, and in particular of the mechanization in
coal mining, can be described as evolving through a number of characteristic phases.
During the period 1913-1928 coal mining was essentially a hard manual labor process.
Between 1928 and 1950, the use of explosives, pneumatic picks, and cutters diffused
throughout the industry and these became the predominant tools for winning operations.
In the early 195Os, the first coal shearers were developed and introduced into the mines;
this marked the beginning of mechanization of one of the most labor-consuming operations
at coal faces, i.e., coal loading.
The period 1955-1965 was characterized by an intensive rate of introduction and
penetration of a large number of technological improvements at coal faces. Individual
metal props replaced wooden ones for roof support. Retreating longwall faces4 and labor-
saving roof-support operations through self-advancing hydraulic roof supports found wider
application. Mechanization of coal-winning operations increased drastically: in 1955,
only about 10% of the coal output was winned by shearers; ten years later, shearers
accounted for more than 50% of coal output. On the whole, however, this period can be
characterized as a period of partial mechanization of selected operations, which did not
result in a rearrangement of face operations into a fully integrated mechanization scheme.
Such integrated face mechanization schemes consisting of high-output shearers and
chain conveyors in combination with hydraulic self-advancing roof supports started to
penetrate on a large scale in the period 19651980. The elements of these integrated
mechanization schemes had been in development since the beginning of the 1950s for
the specific conditions of the Podmoskovny coal basin and gradually became adopted for
the geological conditions of other coal basins. At the end of the 1970s about 45% of all
faces were equipped with mechanization schemes, including self-advancing roof supports.
The share of these faces in total coal output was even higher, because of the larger output
4Recall here the main features of retreating mining schemes: the headings are driven first to the end of
the mining block, thus the investment for driving the headings is concentrated prior to the start-up of mining
operations. However, the uncertainty about the detailed geology (roof and floor conditions, tectonic disturbances,
etc.) of the mining block is drastically reduced, resulting in more effective production planning, lower standing
times, and lower production costs.

230 A. ASTAKHOV ET AL.
per face of these fully mechanized faces. The penetration rate has in the last ten years
slowed down, due to the fact that these mechanization schemes had to be introduced
gradually into faces with more complex geology, which hinders the full application of
complete mechanization schemes.
In contrast to coal-mining operations, where the first mechanization measures were
taking place in the 193Os, all driving operations were practically manual until the end
of World War II. Loading machines and scrapers started to be introduced immediately
after the end of the war, and their share in the total driving work at mines increased to
a peak of around 45% in the period 1970-1975. After this period their share decreases,
as they are replaced by driving combines, which are presently the most important tech-
nology for driving operations.
About 70% of transport operations at underground horizontal main roads were
performed by manual labor and horses in the 1930s. Only by the mid-1950s had their
use, together with rope assets, disappeared for transport operations. The share of loco-
motives in transport operations increased from 12% in 1930 to over 90% in the 1950s.
Since this time they in turn are being replaced by conveyors, which presently account
for around 45% of the coal transported underground.
Mechanization of the underground mining operations discussed above took place
against the background of the rapid growth of coal production until the mid-1970s. Each
mechanization technology introduced resulted in the lowering of the labor requirements
at the appropriate operation. The new technologies were also more productive, i.e., they
helped to intensify production in raising the coal output per face and per mine. Thus the
increasing labor productivity was not only the result of the introduction of new technol-
ogies, but was also influenced by increasing economies of scale, which became possible
through the application of new technologies. The labor (and cost) productivity increase
due to the concentration of production in large output mines is a result of the reduction
of general expenditures through the sharing of infrastructures, surface operations, etc.
Another predominant feature of the development of mechanization technologies was their
gradual integration into a complete mechanization scheme. By the integration of the
individual mechanization measures at coal-winning, loading, roof support, and under-
ground transport operations, additional benefits in terms of labor productivity increases
were obtained, which exceeded the gains from the mechanization of the individual mining
operation taken separately.
The economic effects of the technological developments discussed above cannot be
exactly evaluated in cost terms, because of resource depletion, inflation, and other factors.
The best simple proxy variable to quantify the effects of technology diffusion in coal
mining is labor productivity (recall here that typically over 50% of the production costs
at underground coal mines are labor costs).
Labor productivity in the period 1913-1928 was extremely low, less than 600 kg
(raw) coal per shift.5 This figure increased by a factor of 2 in the interwar industrialization
period, decreased during the World War II period, and after 195 1 reached again its prewar
value of around 1,400 kg/shift. The average labor productivity at underground mines rose
as a result of mechanization until 1975 to a figure of around 2,800 kg/shift.
Since 1975 labor productivity decreased, to around 2,250 kg/shift in 1986. There
are a number of reasons for this decrease in labor productivity. First, deconcentration factors should be mentioned; the average output of an underground mine, which had risen
‘See also Tables 5-7 in the data appendix.

TECHNOLOGY DIFFUSION IN COAL MLVING 231
to 2,120 tons per day (see Table 4 in the data appendix), fell to around, 2000 tons/day.
Thus a higher share of the production was coming from smaller mines and negative
economies of scale, especially at the back-end (surface) operations of mining, exerted
an influence. Second, after 1975 one can observe a slowdown from the previously observed
diffusion rates of mechanization technologies. Thus it was no longer possible to com-
pensate through mechanization for the effects of continuously deteriorating geological
conditions. This slowdown of past diffusion rates can be attributed to the difficulties of
adopting certain mechanization technologies at mines with more complex geological
conditions (i.e., the field of most effective application of a technology gradually was
exhausted), to the lack of new technologies to overcome this difficulty, and finally to a
certain lack of funds to cover the expenses of further mechanization investments. Finally,
managerial problems had also an influence on this decrease of the labor productivity.
A situation similar to that for underground mines can be observed with the devel-
opment of the labor productivity at opencast mines. Since 1978, the labor productivity
has been decreasing, albeit from a much higher level than that in underground mines,
i.e., from about 24,000 kg/shift (1978) to around 22,000 kg/shift (1985/1986).
Methodology to Describe Technological Substitution
The following quantitative analysis of a number of technological substitution pro-
cesses in the USSR coal-mining industry is based on a data sample derived from official
Soviet statistics. The data sample [ 10, 1 l] was computerized at IIASA and analyzed using
standard methodologies of the analysis of technological diffusion and substitution pro-
cesses. This included in particular the approximation of the empirical data on the adoption
rates of new innovations by S-shaped curves in order to determine the underlying param-
eters to describe the substitution process, in terms of the growth rate and the parameter
to locate the process in time.6 In case a single diffusion (substitution) process is analyzed,
the theoretical curve to approximate the process is assumed to be of a logistic type.
However, the reality of technology development in the coal-mining sector (as in other
sectors) suggests that at any given point in time there are more than just two technologies
competing, thus the technology substitution process has to be analyzed as a multiple
competition case. In such a case the replacement or introduction of new technologies is
described by a set of coupled logistic equations, with a nonlogistic transition function
being introduced to describe the pattern of saturation of a particular technology, linking
its phase of (logistic) growth and (logistic) decline or replacement by newer technologies.
This transition function is calculated as a residual (to the total market of 100%) for the
oldest of all growing technologies after calculation of the logistic substitution pattern for
the remaining growing or declining technologies.
The details of the methodology as well as the algorithms used for parameter estimation
are described elsewhere [12-141 and will not be repeated here. In the figures we report
the empirical data together with the theoretical curves used to approximate the substitution
process. Note that the solid lines of these curves are plotted for the time interval of the
empirical observations used to estimate the parameters of the theoretical model;’
6The third parameter of the logistic equation, the saturation level, is in the present case known, i.e., the
market share of any particular technology cannot exceed 100%.
‘In some examples the whole empirical data base was not used to determine the parameters of the model,
only a subperiod. The period of the empirical data used for the parameter estimation is reported in the statistical
appendix: however, in the particular graphic presentation described above it can be read off directly from the
figures.

232 A. ASTAKHOV ET AL.
the dashed lines represent the model’s back- and forecasts of the substitution
process.
All technological substitution processes are described by measuring the “market
share” 8 i.e., the fractional share a particular technology accounts for in the total output
of the particular mining process being analyzed. The shares of technologies are calculated
whenever available on the basis of (raw coal) output figures, but sometimes the primary
data refer to other measures, e.g., number of faces equipped with a particular technology
or the amount of work performed, expressed with a physical indicator (e.g., the amount
of driving work in meters).
In an ideal case of analysis of the longer-term tendencies of technology development
one would analyze the technological substitution pattern using a multidimensional ap-
proach. Thus the share of a particular technology would be analyzed considering, for
instance, the number of mines and faces at which the technology is applied, share in total
output, etc. In addition, main performance indicators (e.g., output per face, labor pro-
ductivity, and so on) would also be analyzed dynamically to identify the main driving
forces and impacts of technological change.
In the present interim assessment this multidimensional approach could be followed
only to a limited degree, as the availability of the primary data determined the particular
dimension in which the share of any technology was calculated. In a further analysis
these measures would have to be complemented in order to overcome some of the
shortcomings of simple measures like counting the number of faces at which a particular
technology is applied, thus ignoring the different production intensity (output per face)
resulting from the application of different technologies. In using different measures for
determining the market share of a particular technology, a higher analytical resolution of
the timing and the dynamics of technological change in the coal-mining industry could
be achieved. For the time being, however, one has to postpone such a multidimensional
approach to a later date, once more detailed statistics become available.
The figures depict the technological changes and the various estimated parameters
are discussed in the next section and summarized in the statistical appendix. The figures
are presented both in linear form and in the logarithmic transformation log [Fl (1 - fl]
(i.e., market share a particular technology accounts for divided by the market share of
all other remaining technologies and presented on logarithmic scale) as used in the classic
work of Fisher and F’ry [ 151, converting the logistic substitution curve into a straight line.
This presentation is given in order to make the (normally turbulent) early/late phases of
the substitution process (e.g., below 10% or above 90% market share) more visible, as
well as to clearly exhibit the phases of logistic growth/decline (appearing as straight lines
on the figures) from the nonlogistic transition function, characteristic for the saturation
phase of a particular technology or any deviations of the empirical data from the assumed
logistic substitution paths.
Before turning to the more complex discussion of technological change in the coal
mining industry of the USSR, which involves normally the case of multiple technological
substitution, let us illustrate the methodology applied on basis of a simple technological
substitution pattern. Figure la and b present a case of technological substitution of an
important market outlet of the coal industry, i.e., in the transport sector.
Here we analyze the evolution of the market share of (coal-powered) steam loco-
motive against the market share of diesel and electric-powered locomotives. This particular
example was adapted from Kruglikov [ 161. The market share of steam and diesel/electric
locomotives is calculated by their respective share in the total ton-km freight turnover.
The data cover the period 1950-1980; however, only the period 1953-1972 was taken

TECHNOLOGY DIFFUSION IN COAL MINING 233
FRACTlON IF1
0.6
0.6
At = 12.6 yean
8.4
0.2
0. a 1940 1950 I960 1970 1980
lo2 0.99
I ,, xx /7 \ ~0.30
1e’ / 0.10 , \,
/ ,’ \\ f
t / ~\----
Ii2 / / \\ 0. 01
b 1940 1950 1960 1970 1980
Fig. 1. Replacement of steam locoinotives by diesel/electric locomotives, in fractional share of ton- km transported in the USSR (a: linear scale; b: logarithmic transformation). Adapted from Kruglikov
D61.
into account to calculate the parameters of the logistic substitution model.’ The parameters
are estimated using ordinary least squares regression of the transform log [F/(1 - fl]
(see Figure lb). Two parameters with the following physical interpretation are estimated
in the model.
The first parameter, cx, is the rate of growth or the substitution rate of an old
‘The cutoff points for the model calculations are by default 1% and 99% market share, respectively. Thus if data fall below or above these cutoff points (as in tbis example for the share of steam locomotives after
1972), they are not considered in the model parameter estimation and are not presented in the figures. In this particular example the period 1950.1953 also was excluded in the model parameter estimation.

234 A. ASTAKHOV ET AL.
technology by a new one. This parameter is denoted as At in the subsequent text and is
defined as the time period in years it takes a technology to increase its market share from
10% to 90% or to decrease from 90% to lo%, respectively. As the assumed substitution
function is symmetric, the total substitution time to go from 1% to 99% (or vice versa)
is two times At. Note here also that the At presented in the case of multiple substitution
refers only to the time period of the logistic growth/decline. It is thus a measure of the
“steepness” of the logistic substitution path appearing as straight line in the log [F/ (1
-F)] transformation. In case a technology starts saturating (due to the logistic growth
of a newer competitor) and starts deviating from the logistic pattern, the At measure does
not apply any longer until the point when a logistic decline pattern is reassumed, with
eventually a different At.
The second parameter, denoted as t a, locates the substitution curve in time. It is
defined as the point of inflection (year 1960 in Figure la and b), where 50% market share
is reached. The growth rate of the substitution process (first derivative of the logistic
substitution function) reaches by definition its maximum at to.
Technology Diffusion in the Coal-Mining Industry of the USSR
In this section, we present the results of the analysis of technological change in the
coal-mining industry of the USSR. Whenever possible, we tried to be as comprehensive
as possible with respect to the geographical coverage, i.e., an effort was made to analyze
the technological development for the whole industry in the USSR. For some examples,
however, data availability or significant differences in the geology of the different coal
basins restricted the analysis to a smaller sample, e.g., underground mines in the Donbass,
the most important coal basin of the USSR.
Our analysis begins with a discussion of technological change at underground mines.
First, face operations are analyzed. This is followed by a discussion of the technological
trends in driving and transport operations. Finally, an analysis of the long-term trends in
the share of opencast vs underground mining as well as a preliminary simple model of
the underlying driving force of this structural change is presented.
Three main types of operations were analyzed for coal faces: roof-control, winning,
and roof-support operations. Each of these operations depends highly on the specific
geological conditions prevailing at the coal face, which in turn are highly diverse in the
different coal basins of the USSR. Practically no single technique can be applied to all
possible ranges of geological conditions, and technology development in the coal industry
is always aimed at developing differentiated models to respond to this range of different
coal beddings. Thus it should not be surprising that technological substitution patterns
are not always regular and complete, as the introduction of a particular technology into
different geological conditions may not be always feasible and/or the diffusion pattern
may proceed under these conditions at a slower rate than that observed historically.
For an analysis of the roof-control technologies, data for the Donbass, the most
important coal basin of the USSR, with 200 million tons of coal produced each year,
were analyzed for the period 1940-1986. The two main groups of competing technologies
are stowage (as a rule, partial stowage) and artificial roof collapse, i.e., controlled caving
of the roof. Stowing was the predecessor technology to caving and resulted in high labor
requirements. For a long time the use of stowing was practically unavoidable as caving
could not manage with the hard roof conditions typical for a large number of faces. This
situation changed when new types of special metal supports were introduced in the late
1960s. Thus, caving became possible also under these conditions, and as a result the
share of coal output coming from faces with caving as roof control increased along the

TECHNOLOGY DIFFUSION IN COAL MLVING 235
FFRCTICN IF1
0. 1930 1940 1950 1960 1970 1980 I990 2000
a N. NWCENWIC 1988
F/I I-F I F!%XCTlcN IF1
10 2 0.99 _,-
.-
IO1 // CAVING Y 0.90
// ,,
1e’ STOWING 0. I0
\\
--IF
‘--. Ii2 ‘1 , 0.01
b 1930 1940 1950 19.60 1970 1980 1990 2000
Fig. 2. Evolution of coal output in the Donbass by two main types of roof control (a: linear scale; b: logarithmic transformation).
logistic substitution pattern shown in Figure 2a and b to the present dominance of around
95%.
The speed of this substitution process is estimated by the model to have a At of
around 52 years. The fit of the model of the empirical data appears reasonable, with an
R2 of .962, especially after the period starting in 1960. For the period before 1960,
however, the model fit is not particularly good. This time period was not a very ho-
mogeneous phase, as it includes the time period of World War II and the subsequent
reconstruction of the mines in the Donbass. The growth of caving in the period 1940-
1955 was actually not based on new techniques of roof control; consequently, the diffusion
rate is slower than in the period thereafter, when the substitution process was primarily
driven by the availability of new technology.
Based on the theoretical approximation of the substitution process provided by the

236 A. ASTAKHOV ET AL.
a
FRRCTION IF1
0.6
0.4
0.
I930 1940 I950 1960 I970 I980 1990 2000
N NFIKICENOVIC.19BB
F/l l-F1 FRRCTION IF1
10 2
10l
IO 0
Ii1
Ii2
0.10
0.01
b 1930 1940 1950 1960 1970 1980 1990 2000
Fig. 3. Evolution of coal output by three technologies of coal winning at coal faces in the underground coal-mining industry of the USSR (a: linear scale; b: logarithmic transformation).
model, we can make some tentative forecasts of the future possible development of roof- control techniques. If no radically new technology becomes available, (partial) stowing
techniques may eventually be totally replaced by caving techniques by the year 2000 in
the Donbass. Figure 3a and b present the results of the analysis of the mechanization of coal-
winning operations for the underground coal-mining industry of the USSR. Manual
operations for breaking the coal from the face wall were substituted first by the use of
explosives and picks and later by cutters. However, loading of the broken coal onto
conveyors remained a manual process until the introduction of shearers in the beginning
of the 1950s. The model fit to the empirical data appears satisfactory, with the very first
phase of the introduction of shearers (up to 10% of total coal output) proceeding somewhat
faster than suggested by the model. In addition, a considerable slowdown in the diffusion

TECHNOLOGY DIFFUSION IN COAL MLVING 231
rate of shearers since 1975 can be observed. Whether this is a technological problem due
to the fact that (conventional) shearer technology has already penetrated into all areas of
its most effective application and penetrations into other areas is more difficult, or whether
this may be the result of capital shortages for new investments and thus an indicator of
a certain stagnation in the industry, cannot be resolved here. The resulting model forecasts,
while realistic in the general direction, are thus rather uncertain with respect to the
continuation of the long-term diffusion rate of the introduction of shearers and it may
well be possible that shearers will not at all, or only at a later date than suggested by the
model, penetrate into the last 10% market niche of coal-winning mechanization.
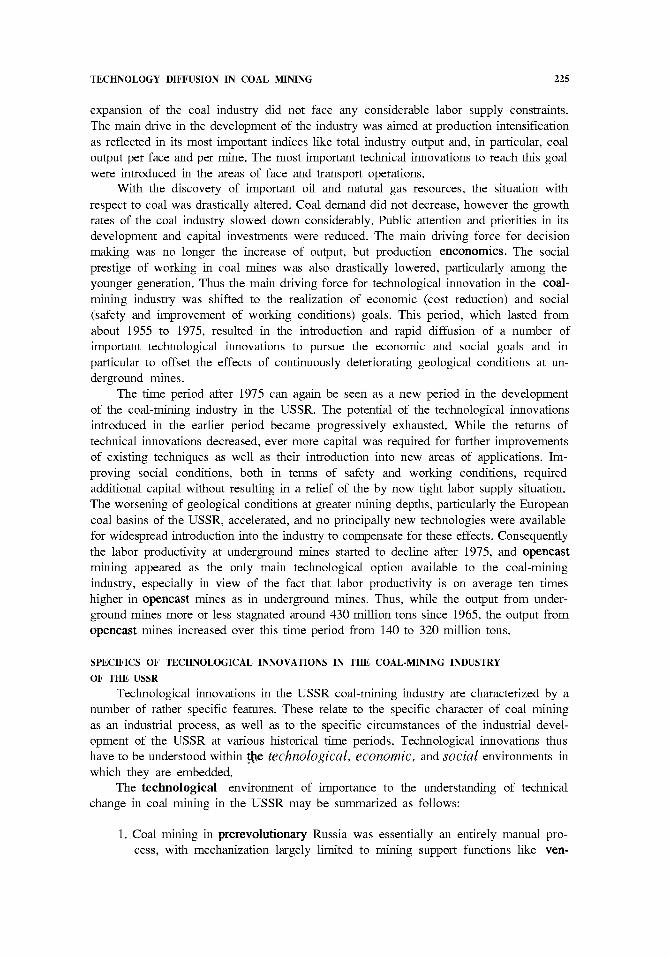
Technical advance in roof-support operations is reported in Figure 4a and b for the
underground coal-mining industry of the USSR. The data refer to the number of faces
equipped with wooden or metallic individual roof supports and self-advancing hydraulic
roof-support systems. Unfortunately no data on the share of different roof-support systems
in the total output were available, thus the data do not account for the different production
intensity achieved in highly productive, completely mechanized faces with self-advancing
hydraulic roof supports compared with the lower output at faces with individual wooden
or metallic roof supports.
Roof-support technologies are of the highest importance because they reflect a whole
complex of interrelated face operations and thus constitute a proxy for the development
of other face operations. The substitution of wooden props by metal ones was a necessary
first step in conjunction with the introduction of shearers. The integration of different
types of metallic props and supports into an integrated system enabled the development
of completely mechanized face operation schemes.
The fit of a technological diffusion model to the empirical data allows for two
conclusions. First, the fit of the model to the diffusion and substitution of wooden and
metallic individual roof supports over the period 1940-1970 is quite satisfactory. Second,
the model captures the introduction of hydraulic self-advancing roof supports and their
growth up to a 50% share of the total number of faces, i.e., the period 1960-1980.
However, this particular example demonstrates also that relatively regular diffusion pat-
terns might not persist over the whole life cycle of a particular technology. Particularly
noteworthy is the deviation in the share of faces equipped with wooden props, which
since 1970 continued to stay at around 25%. Wooden props were thus not further replaced
as indicated by the historical substitution process between 1940 and 1970. Noteworthy
also is the slowdown of the diffusion of hydraulic roof supports after 1980 and especially
the trend reversal (i.e., decline of the share of hydraulic roof supports) between 1985
and 1986.
it is at present difficult to explain this somewhat atypical deviation from the historical
diffusion pattern. The measurement problem, mentioned above, i.e., that the data do not
take into account the different production intensities at the different faces by considering
only their share in the total number of faces, is probably the most important cause of
this deviation. In considering the higher output from completely mechanized faces, the
market share of hydraulic roof-support faces should be considerably higher and the
diffusion pattern more regular. By the same token, faces equipped with wooden props,
although they still account for one quarter of all faces, will account for a significantly
smaller share in the output of the industry. One would have to analyze the same substitution
process measuring the market share of different technologies in terms of output before
reaching a definitive conclusion on the deviation from long-term technological substitution
patterns and speculating possible causes (like lack of investment funds, etc.).
Before turning to the discussion of the technological trends of driving operations,
238 A. ASTAKHOV ET AL.
I.0
0.8
0.6
0.4
0.2
0. 1930 1940 1950 1960 1970 I9B0 1990 2000
a N.MWlCEMWC 1988
F/II-F1 FRRCTION
10O
IEi’
-2 10
I //
/ ’ // \ \ \
/ \ /. \.
IF1
o.vd
0.50,
0.30
0.10
0.01
1930 1940 I950 1960 I370 1980 1990 2000
b N. NWCEIOIIC 1988
Fig. 4. Share of different roof supports in the total number of faces in the underground coal-mining industry of the USSR (a: linear scale; h: logarithmic transformation).
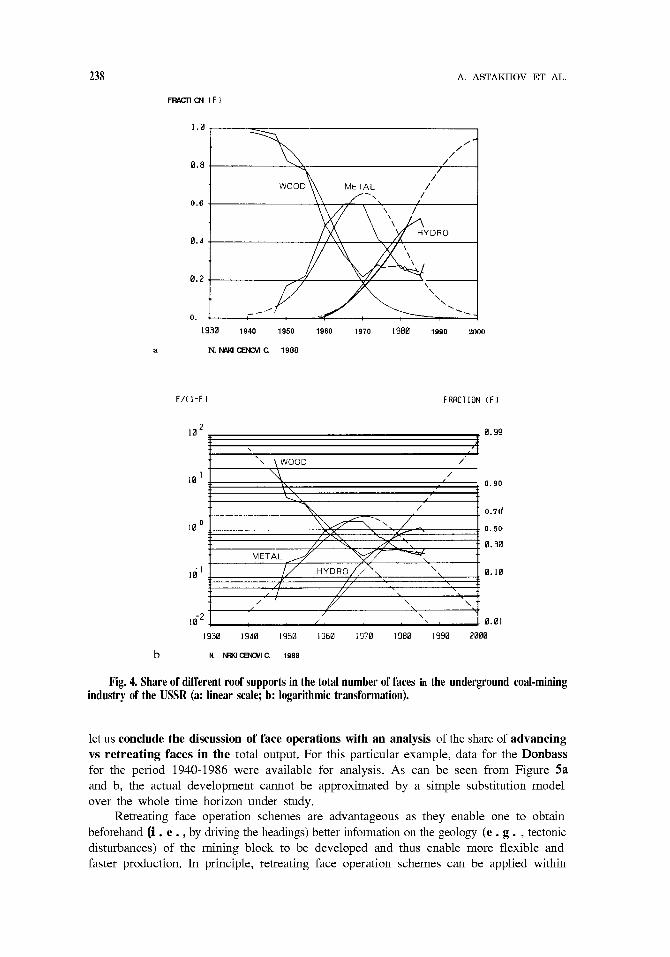
let us conclude the discussion of face operations with an analysis of the share of advancing vs retreating faces in the total output. For this particular example, data for the Donbass for the period 1940-1986 were available for analysis. As can be seen from Figure 5a and b, the actual development cannot be approximated by a simple substitution model
over the whole time horizon under study.
Retreating face operation schemes are advantageous as they enable one to obtain
beforehand (i . e . , by driving the headings) better information on the geology (e . g . , tectonic
disturbances) of the mining block to be developed and thus enable more flexible and
faster production. In principle, retreating face operation schemes can be applied within

TECHNOLOGY DIFFUSION IN COAL MINING
FRACTION IF I
a
0.
1 -I
1930 1940 I950 1960 1970 1980 1990 2000
N NRKICENOVIC. 1988
F/II-F) FRACTlON IF1
l02 0.99
10' 0.90
0.70
lgO 0.50
0.30
Ii' 0.10
239
- f Ii2 I_::~ 0.01
1940 1950 1960 1970 1960 1990 2000
b, N NWCENWC 1988
Fig. 5. Share of advancing vs retreating longwall faces in coal output in the Donbass (a: linear scale; b: logarithmic transformation).
the whole range of advancing systems applications. However, the preparation of a given
face for a retreating operating system takes much time and concentrates investments up
front, i.e., prior to production start-up.
Figure 5a and b indicate that the share of retreating face operations was remaining
at around 10% of the total coal output in the Donbass for the period 1940-1955. This
share then increased rapidly to over 30% up to 1960 in order to assume a regular logistic
substitution pattern in the period thereafter. Consequently the model estimates of the
substitution process took only the data for the time period 1960-1986 into consideration.
The reason for the deviation of the actual data with the estimated substitution model
in the time period 1940-1960 is rather obvious. In the time period up to 1955, it was
necessary to reestablish as quickly as possible the pre-World War II production level in

240 A. ASTAKHOV ET AL.
the Donbass after the destruction of the mines during World War II. It was thus much
simpler to expand the output by advancing systems of face development. After 1955, we
can observe a rapid catch-up effect, which was made possible through the availability of
loading machines and combines (speeding up driving work) and resulted in a fast re-
placement of advancing by retreating face development schemes. This process was com-
pleted by 1960, and only since that time can we consider the development following a
standard substitution process. Our simple model of technological substitution cannot
describe the historical development over the whole time horizon, as the actual development
in the period following World War II was highly influenced by external factors.
Still, the fit of the substitution model after 1960 can be considered as reasonable
and, assuming a continuation of the trend beyond 1986, one might expect that by the
year 2000 some 80% of the coal output of the Donbass will come from retreating faces.
The above-discussed innovations introduced at coal faces have resulted in a significant
improvement of the economic performance of underground mines. The daily coal output
from an operating face (see Table 3 in the data appendix) increased from 106 tons in
1940 to 454 tons in 1975 (and declined to 404 tons/day in 1986) for the industry average.
In the Donbass, it increased from 103 to 393 tons/day from 1940 to 1975 (and decreased
to 3 16 tons in 1986). Labor productivity at the coal face (see Table 6 in the data appendix)
increased from 3.92 tons/shift in 1940 to 9.7 1 in 1975 (8.62 in 1986) for the average of
all underground mines in the USSR. The figures for the Donbass (see Table 7 in the data
appendix) indicate an increase from 3.53 tons/shift in 1940 to 7.14 in 1975 (6.17 in
1986).
The innovations introduced thus increased the production intensity by a factor of
about 4 and the labor productivity at the coal face by a factor of 2.5. One can conclude
that the observed decrease in the production intensity and labor productivity since 1975
can certainly be attributed in part to the observed slowdown in the diffusion rates of the
introduction of new technologies at coal faces since 1975.
Competing technologies’ for driving operations were analyzed on basis of data for
the entire underground mining industry of the USSR (Figure 6a and b).
The share of the different technologies was measured based on their share in the
total meters driven in a particular year. The fit of the empirical data by the multiple
substitution model can be considered as quite satisfactory, with R’S ranging from .92 to
.99. Only the early introduction phase (i.e., below 10% of market share) of combines
appears to have been much faster than described by the model. Manual driving operations
are being replaced with a At of around 37 years by loading machines (e.g., scrapers) and
later combines. Loading machines like scrapers in turn appear to be in their long-run
saturation phase, so one would expect on the basis of the model forecasts an increasing
predominance of the use of combines in driving operations.
One should keep in mind when interpreting the above results that in general the type
of development workings, their crosscuts, and the geological conditions of their driving
are highly different, and one should not expect that these diverse conditions can be
satisfied by a single type of machinery like combines. In view of this, the restricting
assumption underlying our model, that any technology may eventually approach a 100%
market share (not substituted in turn by a newer technology), may not hold. Thus, one
ought to analyze each driving machinery separately (including a disaggregation in its
most important subvariants) under a given range of (rather homogeneous) geological
%ote that by the term scraper we refer to loading machines in general, in absence of any further available
disaggregation in our statistical data base.

TECHNOLOGY DIFFUSION IN COAL MINING 241
0. a 1930 1940 I950 1960 I970 I980 1990 2000
F/II-F1 FRRCTION IF1
10 2 0.99
‘1 _
10l '\ MANUAL 0.90
Ia0
Ii’
6.70
0.50
0.30
-2 I0 0. 01
1930 1940 1950 1960 1970 1980 1990 2000
Fig. 6. Evolution of shares of different driving technologies in amount of driving work in the total underground coal-mining industry of the USSR (a: linear scale; b: logarithmic transformation).
conditions (e.g., separating flat from inclined bedding conditions) to estimate the final potential field of application of a particular technology. Similar statements can be made about other mining operations (e.g., winning), however, such a detailed analysis can only be performed at a later stage, once more detailed statistical data become available.
Underground transport operations at horizontal roads are analyzed for the entire underground coal-mining industry of the USSR in Figure 7a and b. Underground transport based on horses and manual labor had disappeared by the mid-1950s. In line with rope assets, they were substituted by locomotives, which by the beginning of the 1960s became the predominant form of underground transport, with over 90% of the tonnage transported. Later on locomotives started to be replaced by conveyor transport.
This process involved a great number of different types of locomotives and conveyors, each having their own field of effective application. But in general the trend was in favor of conveyors, which increased their market share with a At of 48 years. The model fit to the actual data can be considered quite satisfactory. Based on the model projections,

242 A. ASTAKHOV ET AL.
FRACTION IF I
a
0.8
0.6
0.4
I930 1940 I950 1960 I970 I980 I990 2000
F/l 1-F) FRACTION IF I II
IO I
0.90
0.70
10 0
0.50
0.30
Iti’ 0. I0
-2 IO 0.01
b 930 19A0 1950 1960 1970 1980 1990 2000
Fig. 7. Share of different transport modes at horizontal roads in the underground coal-mining
industry of the USSR (a: linear scale; b: logarithmic transformation).
one might expect that, by the year 2000, over 70% of underground transport will be
performed by conveyors, with locomotives accounting for the remainder.
Underground transport in inclined workings is analyzed in Figure 8a and b. The
reason that transport operations were analyzed separately for flat and inclined workings
is that locomotives cannot be used in inclined workings. Under these conditions special
transport systems have to be used.
The rate of substitution of conveyors for rope assets was in fact faster (At of 34
years) in inclined workings than in flat workings. Although the fit of the substitution
model to the empirical data is not particularly accurate, the model still captures the
essential dynamics of this technological substitution process. The only uncertainty that
remains at present is related to the (future) limit in the inclination where conveyors still
can be applied, which will determine whether in the future the share of conveyor transport
in inclined workings will increase beyond its current 90% market share.
The effects of the technological trends in underground transport operations discussed

TECHNOLOGY DIFFUSION IN COAL MINING
FRRCTlON IFI
0.A
4 a 1930 1940 1950 1960 1970 1980 1990 2000
F/II-F1 FRACTlON (Fl
243
t -‘\
Ii2 0.01 b 1930 19A0 1950 1960 1970 1980 1990 2000
Fi 9. 8. Share of rope assets and conveyors at inclined workings in the underground coal-miniig industry of the USSR (a: linear scale; b: logarithmic transformation).
above can be seen clearly on their impact on the labor productivity for underground
transport operations. Labor productivity at transport operations at all underground mines
of the USSR increased from 9.3 tons/shift in 1940 to a peak of 23.8 tons/shift in 1974
(i.e., by a factor of 3). However, since 1974 it has decreased to around 17 tons/shift (see
Table 6 in the data appendix). In the Donbass the productivity increased from 7.1 to 16.7
tons/shift from 1940 to 1974 (i.e., a factor of 2.4) and decreased thereafter to 11.5
tons/shift in 1986 (see Table 7 in the data appendix). Thus, we can observe a tendency
toward reversal in labor productivity after 1975 for transport operations similar to that
observed for face operations.
We conclude our discussion on technological trends in the coal-mining industry of
the USSR by considering a technological structural change process at the highest level
of aggregation of technologies, i.e., the shift in the sham of opencast vs underground
mining in the total coal production tonnage of the USSR. The trends in the market share

244 A. ASTAKHOV ET AL.
FRRCTION IF1
a 1900 1910 1920 1930 1940 1950 1960 19701980 1990 2000
F/II-F1 FRACTION IF 1
UNDERGROUND\
IBO \
/ /
10-2 0.01
b 1900 1910 1920 1930 1940 1950 1960 1970 1980 1990 2000
Fig. 9. Share of underground and opencast mining in the total coal production of the USSR (a: linear scale; b: logarithmic transformation).
accounted for by the two methods in total coal production are presented in Figure 9a and
b. The success of opencast mining is evident from these figures.
Nevertheless, Figure 9b shows that a particular model cannot be applied over the
whole historical range of the development for opencast mining technology. Prior to World
War II opencast mining accounted for only slightly over 1% of total coal production of
the USSR. An expansion of its share in total output was physically impossible in the
absence of a sufficient resource base suitable for opencast mining. This situation changed
only with the discovery of large resources (Kansk-Achinsk and Ekibastuz basins and
some others). Once these resources had been discovered it was possible to expand pro-
duction rapidly, especially during the wartime period, where the necessity arose to move
production eastward to the nonoccupied part of the territory. Only after these two ex-
ogenous events happened can one consider that opencast mining entered in a technological
competition with traditional underground coal mining. Consequently the substitution

TECHNOLOGY DIFFUSION IN COAL MINING 245
process was analyzed using the data from 1945 to 1986 only in order to determine the
parameters of the logistic substitution model.
For this period the fit of the model appears to be excellent (R* of .98), and opencast mining is substituting for underground mining at a regular pace with At of 96 years. If
this historical trend continues, one might expect that by 1992 opencast mines will account
for half of the total coal production in the USSR. This appears not infeasible in view of
the large resources available as well as by making analogies to the case of the United
States, where opencast mines account for over 60% of total output.
Certainly the most effective direction of the long-term technological development
in the coal-mining industry of the USSR is the substitution of underground mining by
opencast mining. The principal reason for such a development was discussed above; it
lies within the comparative advantage of opencast mining (i.e., in its substantially lower
production costs) as a result of favorable geological bedding conditions enabling the use
of giant, highly productive equipment and resulting high labor productivity. Recall here
that on average the labor productivity at opencast mines is ten times higher than in
underground mines (see Table 5 in the data appendix).
This enables us to formulate a simple model on the driving force underlying such
a long-term technological substitution process. Briefly the hypothesis is that the level of
diffusion/substitution is a function of the comparative advantage of a particular new
technology over an old one. lo In fact this comparative advantage is in reality a complex
vector of a number of economic, technical, social, and other variables. For our purpose,
we will concentrate on the relative economics as one (and as it appears in this particular
case the principal) driving variable of the substitution process.
In the absence of detailed statistics on production costs, we consider the labor
productivity as a proxy variable for the production economics of the two competing
technologies. Recall here that typically over half of the production costs at underground
mines are labor costs. Under our hypothesis that the comparative (economic) advantage
is the main driving force of the long-term substitution of opencast mines for underground
mines, we perform a regression analysis of the share of opencast mining in the total coal
production over the time period 1940-1986 as a function of the comparative advantage
of opencast mines expressed as the labor productivity differential between opencast and
underground mines (derived from Table 5 in the data appendix). The regression yields
the following result:
M, = -6.027 + 4.453Prel,
where
MS is the share of opencast mining in total coal output (%)
P C?l is the productivity differential expressed as a ratio between the average labor
productivity at opencast mines over underground mines
n= 37
R2 (adjusted for degrees of freedom) = 0.951
‘@This hypothesis is in fact very similar to the comparative advantage variable as originally formulated by Mansfield [l]. Mansfield’s model relates the rate of diffusion (substitution), i.e., the At in our terminology,to
the (ex post determined) expected comparative advantage differential (profitability in his case) of technologies.
Mansfield’s model assumes, however, that the relative (expected) comparative advantage differential between technologies remains constant over the whole diffusion period. In our case, we allow the relative productivity
between opencast and underground mining to change over time and relate the achieved diffusion level (share in coal output) of opencast mining to the (changing) realized productivity differential between the two mining methods.

246 A. ASTAKHOV ET AL.
coal
f? 30.0
+ I! 25.0
E
," 20.0
15.0
OBSERVED (SHARE IN PRODUCTION, %I
Fig. 10. Scattergram of observed versus predicted market shares of opencast mining in the total production of the USSR.
t value of P,[ = 26.5.
We can conclude that above regression explains 95% of the variance in the market
share of opencast mining and that the diffusion level appears predominantly determined
by the comparative (economic) advantage of opencast mining over underground mining,
as expressed in the productivity differentials. Figure 10 is a scatter-gram of the observed
vs the predicted market shares of opencast mining showing the satisfactory fit of our
simple model.
The high explicative power of this simple model of the driving forces of a long- term structural shift in coal production technologies is not necessarily in contradiction to
the complex set of other factors influencing the development of opencast versus under-
ground coal mining in the USSR. Clearly, factors like high transport costs or consider-
ations of preserving employment at underground mines were and continue to be decisive
in the process of technological change in the coal mining industry of the USSR. We thus
interpret the above results as a consistency check, whether the relative contribution of
the two mining methods of total coal output and the evolution of their relative comparative
(economic) advantage are internally consistent and are moving along a similar pace. The
results of our simple model indicate they are. This however does not imply that we
consider that the complex set of driving variables responsible for the long-term shift from
underground to opencast mining methods can be reduced to a simple two-parameter model.
Our model indicates that in the absence of a matching technological development (as
reflected in the higher relative labor productivity of opencast mining) the observed his-
torical pattern in production shift would have been very difficult if not impossible to
achieve.
Finally, let us return to our discussion on the long-term prospects of opencast mining.
Certainly the increasing share of opencast mining in the coal production of the USSR as
suggested by Figure 9a and b will continue in the near to medium term. However, it also
appears likely that this substitution trend will not continue to the extent of a complete
replacement of underground mining. We can thus expect a similar discontinuity in the

TECHNOLOGY DIFFUSION IN COAL MINING 241
diffusion pattern, as already observed at the beginning of this process, where the avail-
ability of new, large resources enabled the long-term substitution process to begin. The
ultimate level of the share of opencast mining will to a large degree be determined by
the available resource base. The resources available for opencast mining, especially in
the eastern part of the USSR, are very large. The in situ reserves alone amount to over
166 billion tons [17,18] (compared with 320 million tons produced in 1986), which
would allow the current production level to be maintained for some 250 years, even when
considering that only half of the reserves may eventually become recoverable. Thus, it
is at present not possible to determine the ultimate limit of the share of opencast mining in the USSR. If the U.S. experience is a guide, the share of opencast mining could easily
increase to over 60% (which would be the case after the year 2000 based on our model
extrapolation) before stabilizing. Thus the prospects of opencast mining appear to be
rather promising (in contrast to underground mining in the European part of the USSR),
and further significant growth of this branch of the coal industry can be expected.
Conclusions As this article is (to the author’s knowledge) the first attempt to analyze technological
diffusion and substitution processes in an industry sector of a planned economy based
on standard models of technological diffusion/substitution developed for market econ-
omies, a number of conclusions can be drawn from such an exercise. These conclusions
deal first with the applicability and the limitations of the methodological apparatus used.
Second, the usefulness of the information gained by technological diffusion and substi-
tution analysis will be discussed. Third, some conclusions on the general state of the
industry with respect to technology diffusion and future prospects will be sketched out.
And finally, some ideas on future extensions and a deepening of this type of analysis
will be presented, which the authors consider worthwhile in view of the initial results
achieved in this interim assessment.
The first conclusion of the present study deals with the applicability of the formal
analysis instruments used in an industry sector of a planned economy. The answer is
that, despite the shortcomings of a relatively simple model, discussed in more depth
below, the model worked surprisingly well. This is noteworthy insofar as the present
study constituted an initial attempt to deploy models of technological change outside the
framework of market economies, in which they were originally developed.
Technological evolution and substitution appears, in principle, to follow a similar
technological life cycle pattern in planned economies, as amply documented for market
economies. The present study has shown that it is not only possible to model the pattern
of technological change, but also to propose and test successfully a (although simple and
preliminary) model of the driving forces of technological substitution processes in a
planned economy. Comparative (economic) advantage appears to be at work also in
planned economies, driving the diffusion of new technologies and the replacement of old
technologies. The study has also shown, that for other (external) factors, e.g., related to
the (geological) specifics of coal mining operations or other factors, planning may result
in a strong discontinuity in diffusion and substitution patterns (discussed in the example
of roof-support technologies), thus putting the preponderance of comparative technological
and economic advantages in the long-term changes in the technology base at coal mines
in the USSR into perspective.
The study revealed a number of shortcomings and limitations in the applicability of
the proposed single and multiple logistic substitution models. The examples analyzed
have shown that technological substitution patterns can show deviant behavior from the

248 A. ASTAKHOV ET AL.
assumed logistic pattern. Whereas it is not surprising that the early phase of introduction
of a technology (i.e., below 10% market share) can sometimes proceed faster than that
suggested by the model in reflecting a kind of catch-up effect due to adoption externalities
(documented often for market economies), a number of cases remain where the examples
analyzed show that a particular model of technology diffusion and substitution may only
be applicable during a certain time period of the life cycle of a given technology.
There are two reasons for this. First is the importance of external events, which has
already been mentioned. Among those discussed, we recall the effect of World War II
and the consequent rapid reconstruction of mines, which in some cases slowed down the
diffusion of more recent (and more expensive) technology, and the discovery of important
opencast mining resources, which enabled opencast mining methods to enter a phase of
(logistic) substitution with underground mining. Second, the specifics of coal mining as
an industrial process, i.e., the technology employed is first of all a result of the natural
bedding conditions of the deposit mined, have to be considered. The impact of central
planning and its different market-clearing mechanism should also be considered; this
study has shown that its influence on deviations from the basic pattern of technological
change (e.g., when compared to market economies) appears to be relatively small, at
least in the industry sector discussed herein.
The areas of application of a particular mining technology are extremely heteroge-
neous, much more than in other industrial sectors. This explains why not all technologies
can be applied in 100% of the deposits mined and why a deviation from the historically
observed logistic substitution pattern toward the end of the life cycle of a particular mining
technology (when it enters its most difficult and least advantageous areas of applications)
can sometimes be observed.
The limits of applicability of our simple model encountered in the analysis are to a
large extent the result of a certain shortcoming of the data base available for analysis. In
this study, we dealt with rather high-level aggregates. In reality, however, each technology
consists of a large number of subvariants, specifically designed to correspond to the
geological conditions of the deposit mined. In addition, the available data base did not
allow (except in one case) differentiation between different ranges of geological conditions
at underground mines. Clustering of applications of particular technologies under a range
of comparable conditions was therefore not possible, but is considered to be a necessary
step in a further analysis. It is our contention that much of the deviant behavior of
technological substitution processes observed in our analysis could be better understood
and is in fact not a deficiency of the model applied, but rather the result of too high a
level of aggregation of the available data. In the absence of a more detailed data base,
however, this contention cannot be confiied for the time being.
Related to this limitation imposed by the available data, we would like to point to
two further areas of improvement of our analysis. First, data referring to technological
change in opencast mining should be assembled, as the results of our analysis have
confiied the trend of growing importance of opencast mining in the USSR. Second,
more detailed data are needed to use a multiattribute approach and to describe technological
change using various measures. The analysis of roof-support technologies has clearly
shown, for instance, the difficulties in describing technological change simply by ana-
lyzing the number of faces where a particular technology is applied, and not also analyzing
physical output, considering the different production intensities resulting from different
technologies.
Although models of technological diffusion and substitution cannot answer questions
regarding the time and rate of introduction of new technologies not in use today (such
as in situ coal gasification), they can provide good quantitative insight into the technology

lECHNOLOGY DIFFUSION lN COAL MINING 249
dynamics of a particular industry branch, which is useful, for planning purposes, in
learning from past experience. In this context it is worthwhile to note that technological
change in the coal-mining industry is a rather slow process. Typically it takes a number
of decades for a new technology to grow from 10% to 90% market share. The analysis
has also shown that the diffusion rate is a function of the aggregation of analysis, i.e.,
technologies at a high level of aggregation (e.g., opencast vs underground mines) have
Ats in the order of 100 years, whereas penetration of technologies into smaller (sub)markets
proceeds substantially faster.
The analysis presented here and its quantitative results can therefore yield better
insights into the lead and diffusion times required for the introduction and implementation
of new technological systems, be it at the national or industry level. It provides a good
guidance framework for the long-term planning and assessment of the prospects and
impacts of technologies proposed to be introduced into the industry. Finally, as many of
the technologies are closely interrelated (for instance, shearers, hydraulic roof supports,
and conveyor transport), diffusion/substitution analysis can provide a consistency check
on the penetration of these technologies. As can be seen from the statistical appendix,
the diffusion rates and time-location parameters of the technologies are, even though they
are closely interrelated, far from synchronized or having similar time constants. This may
provide useful information for planning purposes, in terms that potential bottlenecks as
well as necessary prerequisites in the further development of a particular technology
application can be identified.
The analysis shows that the underground coal-mining industry of the USSR can be
characterized as a mature industry sector. Most new technologies have diffused beyond
the 50% market share level, and no radically new technologies that could yield similar
productivity gains appear to be readily available, like the ones resulting from the intro-
duction of (complete) mechanization schemes after World War II.
The analysis has further shown that the diffusion rates of most technologies began
to slow down after 197.5, compared to previous experience. Whether this is the result of
the progressive exhaustion of the most effective fields of application of these technologies
or whether it can be interpreted as a sign of stagnation in the technological development
of the industry (or both), cannot be resolved in detail within the context of the present
paper. The implications of this development are, however, straightforward. In the future,
it will be even more difficult to compensate for the progressive effects of deteriorating
geological conditions, due to the depletion of low-cost underground mining deposits.
Consequently, all economic indicators, including labor productivity, can be expected not
to improve, and may even deteriorate. As the data presented in the data appendix on the
general evolution of the industry show, the signs of stagnation in the technological
development of the underground mining industry are reflected in the deteriorating pro-
ductivity indicators since 1975.
The only available technological option for high productivity and low-cost coal
production appears to be further development of opencast mining. This will have sig-
nificant implications, not only on the geographical distribution of coal production but it
will also require significant investments into the infrastructure to transport additional coal
quantities to the main centers of consumption. In the opinion of the authors this option
appears quite feasible in view of the large coal reserves available as well as the still- existing expansion potential for opencast mining, which could in the future account for
more than 50% of the coal mined in the USSR.
We conclude this paper by proposing some directions for further research, which
we hope the present paper and results will help to stimulate.
One research direction would be to expand and detail the present analysis along two

250 A. ASTAKHOV ET AL.
lines. The first would be to introduce a more detailed and multidimensional approach in
the analysis of underground mining technologies in view of the conclusions presented
above. Second, the analysis should address technological trends in opencast mining
technologies. This would check both similarities and differences in the rates of techno-
logical advances in underground and opencast mining and would identify the opencast
mining technologies that still appear to have a large growth potential.
The second research direction would follow the IIASA tradition of comparative
cross-national analysis. Through the proposed uniform methodological framework, it
would be possible to assess technological change in the coal mining industry of different
countries, to compare their structural similarities, and to single out differences and spe-
cifics of technological change in different countries. Preliminary analyses performed for
the United States, and United Kingdom, and the Federal Republic of Germany (see, e.g.,
Marchetti and Nakicenovic [ 121 and Griibler [8] show encouraging results and could be
used in conjunction with the present analysis of the USSR coal-mining industry.
Finally, the driving forces and impacts of mechanization in coal mining could be
assessed. Provided sufficient data became available, this could yield a detailed model of
the underlying driving forces of technological diffusion and substitution in coal mining.
This research direction is especially challenging as one would have to integrate a model
of resource depletion to assess the benefits of mechanization. All general industry indi-
cators, while showing impressively the impact of mechanization, in fact underestimate
the impacts and benefits from this technological diffusion process, as part of the benefits
are counterbalanced by the deteriorating geology of the deposits mined.
It is only through technological change that the coal-mining industry can hope to
face the challenge of deteriorating geology in striving for economic and safe production
of coal, the fossil resource so vital in the historical development of industrialized countries.
References 1. Mansfield, E., Technical Change and the Rate of Imitation, Econometrica 29(4), 741-766 (1961). 2, Mansfield, E., Industrial Research and Technological Innovation, An Econometric Analysis, W. W. Norton,
New York, 1968. 3. Souder, W. E., and Quaddus, A., A Decision-Modeling Approach to Forecasting the Diffusion of Longwall
Mining Technologies, Technological Forecasting and Social Change 21, l-14 (1979).
4. Ray, G., and Uhhnarm, L. The Innovation Process in the Energy Industries, Cambridge University Press, Cambridge, 1979.
5. Ray, G., Energy, in Technological Trends and Employment: 2 Basic Process Industries. J. Clark, ed., Gower House, Aldershot, UK, 1985, pp. 1-69.
6. Kundel, H., Die Srebetechnii im deutschen Steinkohlenbergbau, Gliickauf 115(15), 748.758 (1979). 7. Kundel, H., Face Technology in Germany’s Coal Mines in 1984, in German Longwall Mining. R. H.
Bachstroem, ed., Verlag Glilckauf, Essen, 1985, pp. 9-21. 8. Grilbler, A., Technology of Diffusion in a Long Wave Context: The Case of the Steel and Coal Industries,
in L@ Cycle and Long Waves. T. Vasko, R. Ayres, and L. Fontvielle, eds., Lecture Notes in Economics and Mathematical Systems no. 340, Springer, Berlin, 1990, pp. 117-146.
9. Astakhov, A., and Grilbler, A., Resource Requirements and Economics of the Coal-Mining Process: A Comparative Analysis of Mines in Selected Countries, m-84-13, IIASA, Laxenburg, Austria, 1984.
10. Astakhov, A., and Mookhin, A., Technological Development of Individual Processes in the USSR Coal Mining Industly: Analysis of Some Retrospections, IIASA, Laxenburg, Austria, 1987 (mimeo).
11. Astakhov, A., and Mookhm, A., Technological Development of Individual Processes in the USSR Coal Mining Industry: Data and Industry Statistics, IIASA, Laxenburg, Austria, 1988 (mimeo).
12. Marchetti, C., and Nakicenovic, N., The Dynamics of Energy Systems and the Logistic Substitution Model, m-79-13, IIASA, Laxenburg, Austria, 1979.
13. Nakicenovic, N., Software Package for the Logistic Substitution Model, m-79-12, IIASA, Laxenburg, Austria. 1979.

TECHNOLOGY DIFFUSION IN COAL MINING 251
14. Posch, M., Griibler, A., and Nakicenovic, N., Methods of Estimating S-shaped Growth Functions: Al-
gorithms and Computer Programs, IIASA, Laxenburg, Austria, 1987.
15. Fisher, J. C., and F’ry, R. H., A Simple Substitution Model of Technological Change, Technological
Forecasting and Social Change. 3, 75-88 (1971).
16. Kmglikov, A. G., Dynamics Modeling of Technological Innovation Diffusion Processes. Paper presented
at the IIASA Task Force Meeting on Dynamizing Technology October 28-29, 1985, IlASA, Laxenburg,
Austria.
17. Kumetsov, K. K., et al., Coal Deposits for Opencast Mining, Nedra, Moscow, 1971 [in Russian].
18. Astakhov, A., The Geological-Mining Appraisal of the Major Coal Basins in the USSR: Materials for the
Coal Resources Working Group of the IIASA Energy Project, IIASA, Laxenburg, Austria 1977 (mimeo).
Received 8 December 1989

252 A. ASTAKHOV ET AL.
TABLE A-l Coal Output in the USSR, 191M986,lO‘ (metrk) tons
Undeqround Hydraulic opencast
Year Total mines ag%b mines
1913 29.2 29.0 - 0.2 1917 31.3 31.0 - 0.3
1920 a.7 8.6 - 0.1
1928 35.5 35.2 - 0.3
1930 47.8 47.4 - 0.4
1935 109.6 108.3 - 1.3
1940 165.9 159.6 - 6.3
1945 149.3 131.5 - 17.8
1950 261.1 234.0 - 27.1
1955 389.9 325.4 0.600 64.5 1960 509.6 407.6 2.600 102.0
1%5 577.7 437.2 4.700 140.5
1970 624.1 457.5 6.200 166.6
1971 640.8 461.7 a.a. 179.1
1972 655.2 465.0 190.2
1973 667.6 468.2 9:i;2 199.4
1974 684.5 471.8 9.075 212.7 1975 701.3 475.5 9.100 225.8
1976 711.5 479.9 n.a. 231.6
1977 722.1 478.1 a.a. 244.0
1978 723.6 469.7 a.a. 253.9
1979 718.7 459.9 258.8
1980 716.4 445.5 a:!& 270.9
1981 704.0 428.5 a.a. 275.5
1982 718.1 432.0 286.1
1985 726.4 421.7 a:iai 304.7
1986 751.1 429.9 a.a. 321.2
pIncluded in figures for underground mines. ba.a., data not available.
TABLE A-2
Coal Output by Basin in the USSR, 19S1986,lO‘ @etric~ tons
Year Total Doabass Kuzbass wads Ekibashu
1913 29.2 25.3 0.8 - -
1917 31.3 24.8 1.3 - -
1920 8.7 4.5 0.9 - -
1928 35.5 27.3 2.6 - -
1930 47.8 a.a. a.a. - -
1935 . 109.6 ma. - -
1940 165.9 94.3 2;:; 6.30 -
1945 149.3 38.4 30.0 11.50 -
1950 261.1 94.6 38.5 16.40 -
1955 389.9 139.2 56.9 25.80 2.30 1960 509.6 186.2 84.0 26.20 6.00
1%5 577.7 217.4 97.3 31.30 14.30
1970 624.1 223.0 113.3 38.80 22.80
1975 701.3 225.3 137.6 46.30 45.80
1979 718.7 211.5 148.1 46.80 59.20
1980 716.4 205.6 145.0 48.60 66.50
1981 704.0 202.2 142.9 48.30 67.60
1982 718.1 203.0 145.3 48.90 69.34
1985 726.4 198.7 146.2 49.80 80.45 1986 751.1 200.6 147.4 51.19 85.73
ma.. data not available.

TECHNOLOGY DIFFUSION IN COAL MINING 253
TABLE A-3 Da@ Coal Output per Operating Face in the USSR, 194th1986, todday per face
Total coal-mining
YlXC industry Donbass
1940 106 103 1950 lo7 lo6 1960 197 198 1965 253 245 1966 268 261 1%7 278 273 1968 301 295 1969 317 317 1970 331 313 1971 354 332 1972 384 358 1973 415 380 1974 440 390 1975 454 393 1979 421 339 1980 409 328 1981 395 312 1982 3% 312 1985 389 305 1986 404 316
TABLE A-4 Daily Coal Output per Miae in the USSR, 194&1986, tons per day
YW
1940 1950 1960 1%5 1966 1%7 1968 1969 1970 1971 1972 1973 1974 1975 1976 1977 1978 1979 1980 1981 1982 1985 1986
Total coal-mining
industry
738 688
1,148 1,442 1,489 1,562
1,646 1,687 1,804 1,872 1,933 2,039 2,083 2,120 2.170 2.173 2,108 2,087
1,996 1,942
1,966 1,974 2,014
Donbass
702 536 923
1,119 1,256 1,313 1,387 1,428 1,570 1,647 1,695
1,804 1,831
1,844 1,884 1,881 1,808 1,776 1,742 1,691 1,692 1,722 1.753

254
Year
A. ASTAKHOV ET AL.
TABLE A-5 Labor Productivity at coal MInea in the USSR, 1913-1986
Tons/month per person employed Tons per shift
Underground Opencast Underground Opencast Total mines mines Total mines mines
1913 12.8 12.8 1928 12.7 12.7 1932 16.2 16.2 1937 26.9 n.a. 1940 30.6 29.9 1945 23.8 21.6 1950 30.1 27.8 1951 32.4 29.8 1952 33.8 30.8 1953 34.8 31.1 1954 36.3 31.9 1955 37.6 32.5 1956 37.8 32.0 1957 38.7 32.5 1958 39.0 32.5 1959 39.8 33.2 1960 41.9 35.0 1961 43.3 35.7 1962 44.9 36.6 1963 46.7 37.9 1964 48.7 39.2 1965 50.2 40.0 1966 50.9 40.3 1967 52.0 41.0 1968 53.1 42.0 1%9 55.8 44.0 1970 57.6 44.9 1971 61.2 47.0 1972 65.0 49.4 1973 68.5 51.6 1974 71.9 53.3 1975 73.7 53.8 1976 74.4 54.1 1977 74.7 53.3 1978 72.4 50.7 1979 70.1 48.5 1980 69.1 46.2 1981 67.0 44.0 1982 66.3 43.1 1985 65.4 41.2
- - -
n.a. 65.7 86.9 96.3
105.4 118.4 132.3 150.7 174.7 197.7 209.0 210.3 209.5 213.7 214.5 220.9 230.9 238.1 255.8 260.1 264.2 264.6 279.9 303.9 324.2 347.1 372.7 400.5 425.7 434.2 451.3 456.8 447.9 455.5 438.7 427.2 417.5
0.576 0.572 0.729 1.170 1.324 0.968 1.301 1.409 1.468 1.517 1.599 1.660 1.678 1.739 1.750 1.794 1.887 1.952 2.032 2.089 2.171 2.240 2.296 2.399 2.535 2.636 2.687 2.847 3.055 2.516 3.731 3.847 3.866 3.855 3.760 3.659 3.606 3.494 3.457 3.493 3.601
0.576 0.572 0.729 n.a.
1.293 0.874 1.199 1.2% 1.337 1.357 1.406 1.433 1.421 1.462 1.460 1.497 1.573 1.609 1.655 1.693 1.746 1.781 1.815 1.888 1.997 2.067 2.081 2.172 2.305 2.642 2.763 2.807 2.809 2.746 2.632 2.532 2.411 2.293 2.246 2.000
- - - -
2.887 3.557 4.176 4.577 5.082 5.666 6.429 7.514 8.500 9.164 9.242 9.351 9.539 9.776
10.119 10.614 10.865 11.676 12.027 13.027 13.945 14.872 16.274 17.458 18.527 19.907 21.369 22.716 23.006 23.958 23.971 23.482 23.858 23.078 22.707 21.946
41.9 425.1 2.242 22.427 1986 67.4
n.a., data not available.

TECHNOLOGY DIFFUSION IN COAL MINING 255
TABLE A-6 Labor Productivity at Underground Coal hlines in the USSR, 194049%
Labor productivity, tons/shift Drivage work, Labor
Year Total Underground
1940 1.292 1.672
1950 1.202 1.582 1953 1.366 1.786 1960 1.567 2.066 1965 1.779 2.283
1970 2.083 2.695 1971 2.169 2.725 1972 2.309 2.882 1973 2.632 3.289 1974 2.762 3.448 1975 2.801 3.546 1980 2.415 3.058 1981 2.294 2.899 1982 2.252 2.849 1985 2.208 2.755 1986 2.242 2.801
n.a., Data not available.
At faces
3.922 3.425 4.115 4.902 5.556 6.897 7.246 7.692 8.621 9.259 9.709 8.621 8.197 8.333 8.197 8.621
Drivage
10.753 9.259
10.417 11.236 11.765 13.889 14.493 14.286 16.393 16.129 17.544 13.699 12.987 12.821 11.628 11.765
m/l,000 requirements ton for drivage,
Transport production shifts
9.259 n.a. n.a.
10.009 29.5 3.66 11.236 n.a. n.a. 15.625 24.9 3.57 16.129 22.8 3.73
18.868 18.0 4.00 19.608 17.5 3.94 19.231 16.7 4.19 23.810 15.7 3.89 23.810 15.1 4.11 23.256 14.5 3.93 18.519 13.8 5.29 20.000 14.7 5.24 17.857 14.8 5.27 16.949 14.3 6.01 17.241 14.2 5.99
TABLE A-7 Labor Productivity at Underground Coal Mines in the Donbass, 19404986
Drivage
Labor productivity, tons/shift work, Labor
m/l,000 reouirements
Year Total Underground
1940 1.222 1.458 1950 0.987 1.316 1953 1.090 1.486
1960 1.284 n.a. 1%5 1.468 1.818 1970 1.694 2.092 1974 2.237 2.732
1975 2.157 2.725 1979 1.850 2.304 1980 1.777 2.217 1985 1.642 2.024 1986 1.672 2.066
n.a., Data not available.
At faces
3.536 2.849 3.509
4.237 4.808 5.556 7.042 7.143 6.289 6.135 5.952 6.173
Drivage Transport
10.309 7.092 9.174 7.874
10.638 8.130
10.870 10.000 11.628 11.111 13.514 12.195 15.385 16.667
14.925 16.393 12.048 12.821 11.364 12.346 9.901 11.236 9.901 11.494
ton for drivage, production shifts
19.7 4.924 26.2 4.160 28.6 3.287 25.0 3.680 22.0 3.909 17.0 4.353 14.5 4.483 13.8 4.855 14.4 5.764 14.8 5.946 15.1 6.689 15.0 6.733

256 A. ASTAKHOV ET AL.
TABLE A-8 DtffdonParametemaudStatisticsof-ofFit
Figure Technology too
At
(yeWb
Data period used for
parameter estimation t statistic R2
8 Ropes 1966.8 1966.8
9 Underground 1991.7
steam Diesel/ electric
Stowage Caving
Manual Explosives and cutters Shearers
Wood Metal Hydraulic
Advancing Retreating
MaIlUal ScratXXs
Manual, horses, and
ropes Locomotives Conveyors
1960.5 - 12.3 1953-1972 69.5 .9% 1960.5 + 12.3 1953-1972 69.5 .996
1946.5 -51.7 1940-1986 15.0 .%2 1946.5 +51.7 1940-1986 15.0 .%2
1918.7 -34.2 1938-1955 7.6 .828 1%3.9 -26.6 1938-1975 2.5 .561
1%3.9
1962.0 1961.5 1981.3
+ 26.6
-24.2 + 22.6 +27.8
1969.6 1969.6
1968.1 1969.5 1985.5
-79.4 -I-79.4
- 36.6 + 36.4 f40.7
1939.2 -21.3
1940.2 1986.2
+28.1 193&1955 17.6 ,990 +48.5 1955-1985 18.8 .986
-34.1 1950-1986 14.5 .%8 +34.1 1950-1986 14.5 .%8
-96.5 1945-1986 30.3 ,981
1948-1975
1947-1970 1947-1965 1960-1985
1960-1986 1960-1986
1940-1986 1940-1965 1940-1986
1930-1955
17.8
10.1 5.1
11.8
8.7 8.7
18.9 14.9 10.7
.952
.945
.897
.939
,938 .938
.962
.987
.920
7.2 .945
Opencast 1991.7 +%.5 1945-1986 30.3 .981
“Inflection points (market share of 50%) refer only to phases of logistic gtowth/decliie. Tie in years to grow from 10% to 90% market share. + , growing market shares; - , declining market shares.