Embed Size (px)
Citation preview
December 2017
OIES Paper: EL 27
Electricity Networks:
Technology, Future Role and
Economic Incentives for Innovation
Rahmatallah Poudineh, Donna Peng &
Seyed Reza Mirnezami

i
The contents of this paper are the authors’ sole responsibility. They do not
necessarily represent the views of the Oxford Institute for Energy Studies or any of
its members.
Copyright © 2017
Oxford Institute for Energy Studies
(Registered Charity, No. 286084)
This publication may be reproduced in part for educational or non-profit purposes without special
permission from the copyright holder, provided acknowledgment of the source is made. No use of this
publication may be made for resale or for any other commercial purpose whatsoever without prior
permission in writing from the Oxford Institute for Energy Studies.
ISBN 978-1-78467-100-6
DOI: https://doi.org/10.26889/9781784671006
ii
Electricity Networks: Technology, Future Role and
Economic Incentives for Innovation
Rahmatallah Poudineh
Lead Senior Research Fellow, Oxford Institute for Energy Studies
Donna Peng
Research Associate, Oxford Institute for Energy Studies
Seyed Reza Mirnezami
Research Fellow - RISTIP, Sharif University of Technology
Abstract
While the economics of low carbon generation technologies is fast improving due to a mix of policy and
market driven incentives, innovation in electricity networks has been relatively sluggish. This slow
adaptation of electricity networks is challenging as they are key to the energy transition. Further
electrification of the economy requires significant investment and innovation in the grid segment of the
electricity supply chain. Traditional regulatory models of natural monopoly network utilities are designed
to incentivise cost efficiency, with the assumption that network business is costly and the task of
regulation is to encourage cost reduction subject to firm achieving a certain level of reliability. A feature
of innovation activities is that they are riskier in comparison with the business-as-usual activities of
network firms. This paper reviews the evolution of electricity grids from the technological and
organisational perspectives and analyses the efficacy of existing incentive models in encouraging
innovation. We show that incentive mechanisms that do not take uncertainty into account in the
outcome of innovation efforts divert the attention of network utilities from innovation to normal efficiency
gains. We also demonstrate that the issue of risk can distort the outcome of a competitive scheme for
innovation funds when bidders are heterogeneous in their risk tolerance. Finally, based on the results
of our analysis about the role of risk in innovation activities and a review of innovation incentive
mechanisms in the UK and Italy, we provide recommendations for addressing the problem of innovation
under regulation.
Keywords: Electricity networks, economic regulation, technology, organisation, business model,
innovation incentive, UK, Italy
iii
Contents
Abstract .................................................................................................................................................. ii
Contents ................................................................................................................................................ iii
Figures .................................................................................................................................................. iii
1. Introduction ....................................................................................................................................... 4
2. Power grid: the past, the present and the future ........................................................................... 5
2.1 A brief review of technological aspect of grid innovation ........................................................ 7
2.1.1 Transmission network ......................................................................................................... 8
2.1.2 Distribution network ........................................................................................................... 10
2.2 Organisational and business model aspect of grid innovation .............................................. 14
2.2.1 Distribution system platform .............................................................................................. 14
3. Economic incentive for grid innovation ....................................................................................... 16
3.1 Incentive for innovation versus incentive for cost efficiency: one regulation two tasks ........ 16
3.1.1 Simulation of results .......................................................................................................... 18
3.2 Competitive innovation funds and the problem of risk .......................................................... 22
3.2.1 Simulation of results .......................................................................................................... 23
3.3 Discussion ............................................................................................................................. 26
4. Innovation incentive in practice: case studies of the UK and Italy ........................................... 28
4.1 UK ......................................................................................................................................... 28
4.2 Italy ........................................................................................................................................ 30
5. Conclusions ..................................................................................................................................... 31
References ........................................................................................................................................... 33
Appendix .............................................................................................................................................. 36
Figures
Figure 1: Elements of a power distribution system ................................................................................. 8
Figure 2: The convectional grid ............................................................................................................. 13
Figure 3: Integrated grid concept .......................................................................................................... 13
Figure 4: the effect of increase in uncertainties of innovation on optimal share of firm and its effort (when there is synergy between tasks) ................................................................................................. 19
Figure 5: the effect of increase in uncertainties of innovation on the optimal share of firm and its effort (when there is no synergy between tasks) ............................................................................................ 20
Figure 6: the effect of increase in uncertainties of innovation on the optimal share of firm and its effort (when there is synergy between tasks) ................................................................................................. 21
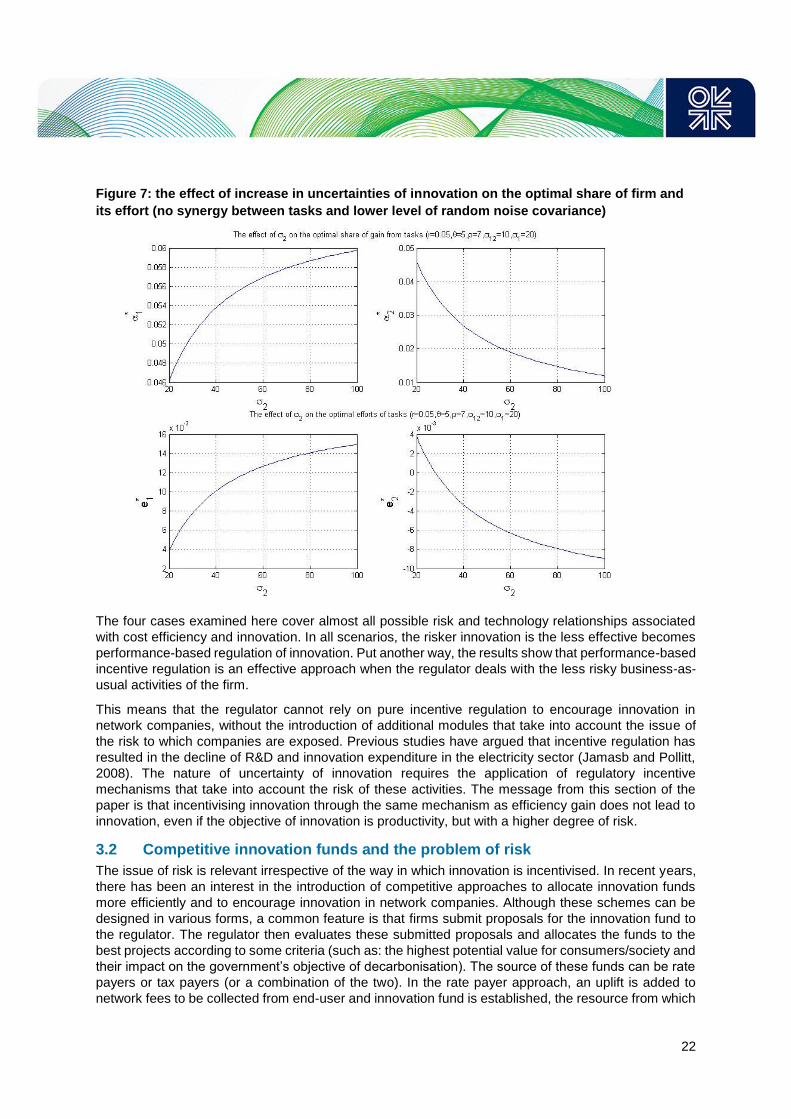
Figure 7: the effect of increase in uncertainties of innovation on the optimal share of firm and its effort (no synergy between tasks and lower level of random noise covariance) ........................................... 22
Figure 8: The effect of 𝜆𝑖 – the coefficient representing the inherent quality of the idea – on the competitive balance of the contest ........................................................................................................ 25
Figure 9: The effect of risk aversion of parties on the competitive balance of the contest (two projects have the same inherent quality of idea) ................................................................................................ 25
Figure 10: The effect of risk aversion on competitive balance when the firm which has the innovation project with higher potential value is also more risk averse .................................................................. 26
4
1. Introduction
Innovation is crucial to enable transformation of the energy sector. In Europe, this is recognised by the
European Commission and is reflected in one of the five dimensions of the Energy Union
Communication adopted in 2015 (European Commission, 2015). In relation to electricity networks,
which are at the centre of major trends in the industry (such as electrification, decentralisation, and
digitalisation) the issue of innovation is more important than ever. The power grid needs to adapt to its
changing operating environment. The electrification of the heat and transport sectors, which are
currently being pursued as a default strategy by many European countries, has serious implications for
grid infrastructure. Without intervention, the combined electrification of heat and transport can cause
the peak electricity demand of a developed economy to grow as much as 1 GW per year post 2030
(ENA, 2017). This means the electricity networks require more agility, control, automation, new
regulatory models, and innovative business models, both at transmission and distribution network
levels. The problem is even more critical at low voltages, because this is a place where most disruptive
technologies are located and this area has traditionally been managed in a passive manner.
Innovation can be defined as a process through which new methods are created or alternative methods
are adopted, with the aim of providing improved outcomes (UKRN, 2015). In the context of infrastructure
service businesses (such as: electricity, gas, and telecommunication networks) this can be expanded
into technical innovations, process innovations, and commercial innovations.
Technical innovation occurs when existing technologies are improved or new technologies are
introduced, so that goods and services can be delivered more efficiently and/or reliably.
Process innovation relates to improvements in management and the operations of organisations,
in order to lower costs.
Commercial innovation is the introduction of new business models to offer services that otherwise
would not have been commercially feasible.
These all mean that the grid requires improving not only in technological aspects but also in
organisational and business models dimensions. In recent years, efforts at the level of the low-voltage
grid have largely been focused on dealing with issues such as renewable intermittency, congestion,
load shifting, and bidirectional flow. In the future, technological innovation at the grid edge1 will facilitate
the development of markets for distributed resources, service-oriented business models, and end-to-
end integrated grid management. This implies the role of the grid is evolving beyond just supplying
electricity to consumers. There are multiple pathways here but one scenario envisions the electricity
network as a platform that also maximises the value of grid edge technologies such as distributed
generation, storage, energy efficiency, demand response, and electric vehicles. Therefore a new
paradigm (including a technical, regulatory, and business model) is required at grid level to integrate
disruptive technologies, find new ways of operating to meet customers’ expectations, and facilitate grid
edge transformation.
Innovation in the electricity industry has generally been sluggish, but it is even more so when it comes
to the network segment. This is because the capital intensive network infrastructures exhibit natural
monopoly characteristics that result from high economies of scale relative to market size. Due to the
absence of direct competition in these regulated industries, infrastructure providers rarely undertake
the appropriate level of innovation activities to optimise their operation and improve the continuity and
quality of their services. Therefore, innovation needs to be incentivised through economic regulation.
1 The terms grid edge refers to a variety of devices which are close to the end-user and connected to the grid such as
distributed generation and storage, smart meters, smart appliances and electric vehicles.
5
Traditionally, the regulatory regimes of network companies have been designed to incentivise cost
reduction in the business-as-usual activities of firms (including provision of quality of service) and
innovation was largely dealt with implicitly as part of cost reduction. An important difference between
innovation and the business-as-usual activities of a network company is that innovation is not only
costly, but is also risky as it does not always produce successful outcomes. The justification for
incorporating innovations, despite these being risky activities, is that learning can be obtained both from
successful and unsuccessful outcomes; it is thus rewarding in the long term despite being costly in the
short run. However, regulatory models of network companies in many places are still efficiency-oriented
rather than innovation-oriented. A recent report which analyses the regulatory models of distribution
network companies in 20 EU member states shows that in 2016 only seven countries had provided
explicit incentives for innovation (Eurelectric, 2016).
This paper addresses the issue of innovation in regulated electricity networks by asking the following
key questions:
(i) What technical, process, and commercial innovations are happening in electricity networks?
(ii) How can innovation be incentivised through economic regulation?
The outline of this paper is as follows. The next section provides a brief history of grid evolution and
reviews the technological as well as the organisational and business model aspects of grid innovation.
Section 3 addresses the issue of incentivising innovation through regulation. Section 4 presents two
case studies of the ways in which innovation is treated in the regulatory models of network companies
in the UK and Italy. Finally, Section 5 provides some concluding remarks.
2. Power grid: the past, the present and the future
In 2016, the continental European power transmission grid consisted of more than 490,000 km of
circuits and cables, connecting 1137 GW of generation capacity and 612 GW of demand in 35 countries
(ENTSO-E, 2017). If power distribution networks are also added to this number, it will be evident that
the size of grid is huge. Therefore, it is hardly surprising that the modern power grid, together with the
generation and load devices that it connects, has been called the largest man-made machine in the
world (Martin & Wade, 2016). How did this amazing machine come into being? The most widespread
design of existing power grids – where meshed high-voltage transmission lines transport electricity from
production to consumer hubs, while radial low-voltage distribution lines carry electricity to most
consumers – took shape in the early 20th century. However, this design was not the first form taken by
the electricity grid.
When electricity was first put to productive use in the 1880s, it was in the form of direct current (DC)
generated by dynamos powered by reciprocating steam engines. The father of incandescent lightbulbs,
Thomas Edison, was instrumental in putting in place the world’s first commercial system of electricity
transmission and conversion, based on direct current. Edison worked on improving the design and
construction of larger dynamos, which were then used in the Pearl Street Station (commissioned in
1882 in densely populated Manhattan) to power lightbulbs that replaced oil and gas-based lighting. He
also improved the design of DC transmission lines and obtained a patent for a feeder-and-main
distribution system design. By 1884, the Pearl Street station was serving more than 10,000 lamps; by
1891 more than 1300 plants of similar design were in operation in the USA (Smil, 2005).
The dominance of these early Edisonian DC power systems did not last long. Between the late 1880s
and 1900, the system of generation, transmission, and use was completely transformed by the invention
of steam turbines, transformers, and motors. Compared to steam engines, steam turbines have higher
efficiency and lower mass for the same power rating. Paired with alternators, they rapidly replaced the
engine–dynamo set to become the power generator of choice. Transmission of electricity has the
smallest losses at high voltages, but it is easiest to generate, and more convenient to use, at low
voltages. The invention of transformers provided the interface that is required to convert between
6
alternating current of high and low voltages, making long-distance transmission of electricity practical.
Finally, the advent of AC current-powered induction electric motors greatly expanded the use of
electricity beyond lighting.
In 1886, competition between DC and AC systems was perceived as evenly matched. But a few years
later, the progress made in technologies complementary to the AC system guaranteed its future
dominance (Smil, 2005). By the 1900s, the blueprint of the large-scale 20th century power grid was
already in place: high-voltage transmission of electricity from large efficient power generation units to
load centres, across vast distances (see Figure 1). Incremental innovations have taken place since then
to improve the efficiency, and increase the scale, of these operations, but the fundamental logic of
power grid operation has not changed significantly (until now).
The economies of scale made possible by the early forms of large centralised AC generation and
transmission technologies (in which the average cost of providing services at higher throughput, to more
users, is lower than at smaller scale) gave the power sector the characteristics of a natural monopoly.
Furthermore, the provision of electricity is an activity with significant positive social externalities. Hence,
the organisational arrangements that have evolved to cope with these issues were regulated or
government-owned, horizontally and vertically integrated monopolies (Joskow, 1996). However, since
the 1980s, many countries around the world have been implementing power sector reforms. Power
generation and retail functions have been liberalised and re-evaluated to perform as competitive
segments, given that small-scale power generation plants (such as combined cycle gas turbines
(CCGTs) and small-scale combined heat and power plants) have become competitive with large-scale
generation facilities (Künneke, 2008). Nevertheless, network segments of the value chain –
transmission and distribution – are still considered to be natural monopolies and thus subject to
regulation.
The operating environment of network segments was largely unchanged during the 20th century, until
the beginning of the new century when the importance of environmental policies rose in the agenda of
policy makers around the world. The Kyoto Protocol, which was adopted in 1997 and entered into force
on 16 February 2005, committed its parties to an internationally binding target for emission reduction.
In addition the Paris Accord, which came into effect in November 2016, strengthened the global
response to climate change threats through an agreement which aims to keep temperature rise this
century below 2 degrees Celsius above the preindustrial level, and encourages efforts to limit it to 1.5
degrees if possible. Meanwhile in Europe, the EU embarked on an ambitious environmental programme
to reduce greenhouse gas emissions by 80 per cent below 1990 levels by 2050, with interim milestones
of 40 per cent and 60 per cent cuts by 2030 and 2040 respectively. Although the plan envisions a
contribution from all sectors of the economy according to their technological and economic potentials,
the power sector is perceived to have the highest potential for decarbonisation. This is because
alternative energy sources (such as wind, solar, hydro, biomass, and nuclear) can replace fossil fuel
power generation (fossil fuel plants with carbon capture and storage (CCS) can also be part of the low-
carbon generation mix), thus greening the electricity grid. Furthermore, decarbonisation of the power
sector paves the way for further decarbonisation of the economy through electrification of heat and
transport. However, this requires significant investment and innovation in the power sector, specifically
at the level of delivery infrastructure – which is the grid.
Electrification of the heat sector requires the use of highly efficient heat pumps. While these will
impact the entire electricity network, their effect on the high-voltage transmission network will be much
lower than on the low-voltage distribution grid, because its ability to alleviate their impact is much more
limited. In the UK, for example, heat demand in the winter is around five times higher than electricity
demand; this means a significant surge in the electricity demand and the consequent straining of
national and local electricity grids, should electrification of the heat sector go forward (Love et al., 2017).
Overall, four potential issues, at national and local levels, can occur as a result of the mass deployment
of heat pumps.
7
The national level issues, which exacerbate the need for capacity and flexibility in the system are:
- increase in the peak demand,
- increase in the ramp rate.
At the local level challenges are:
- voltage drop beyond the statutory limits,
- insufficient thermal capacity of the low-voltage feeders and transformers.
Therefore, unless electricity networks are reinforced (both at transmission and distribution levels)
electrification of the heat sector can be hampered by the inadequacy of existing infrastructures.
Electrification of the transport sector presents a slightly different problem. Through smart charging,
part of the electric vehicle (EV) fleet can be accommodated in the existing network without any
considerable reinforcement. For example, a recent study of the Spanish electricity system shows that
off-peak charging can facilitate the roll out of a large number of EVs – enough to represent a quarter of
the current total car fleet in the country (Colmenar-Santos et al., 2017). Furthermore, EVs can be
suppliers of various services to the grid through the vehicle-to-grid (V2G) concept. Nonetheless, a full
penetration of EVs in the electricity system would not be possible without a significant reinforcement of
existing infrastructures.
The main challenges of EV penetration are the provision of charging infrastructure and improvements
in the charging time given the limited capacity of power that can be drawn at residential properties. At
the moment, the top of the range EVs available in the market, with a large battery capacity of around
90 kWh, travel around 300 miles on a single charge. With a 7 kW charger, it takes roughly around 10
hours for a battery of the aforementioned size to charge up from around 25 per cent to 100 per cent
(National Grid, 2017). Furthermore, due to limited residential power capacity, EV charging reduces the
opportunity of households to use other appliances – such a kettle, oven, or electric heaters –
simultaneously. These problems could be exacerbated in the future when the size of batteries increases
further, to deal with the issue of range anxiety.
Charging time can be reduced significantly (to the level of minutes) by the introduction of high-capacity
charging infrastructure (for example 100 kW, 350 kW, or even higher). However, both batteries and
existing network infrastructures need to withstand such charging capacity. Given that such capacity
does not exist at residential properties, there is a need to establish dedicated fast-charging stations
(similar to petrol stations) to provide users with an experience identical to conventional car re-fuelling.
This, however, requires significant investment at distribution network level. Such investment might be
necessary to encourage battery makers to invest in larger batteries.
2.1 A brief review of technological aspect of grid innovation
In the last two decades, technological progress in the generation and demand-end sectors has been
widely observed and tracked, from the growth of intermittent and/or distributed energy resources to
electrification of further energy services. Unlike previous incremental innovations, these changes
fundamentally challenge the way the centralised power grid is operated and regulated (Tuttle et al.,
2016). Increasingly, innovation in network segments is also being pursued to facilitate technological
breakthroughs at the supply and demand ends. The overall theme is one of more intelligent network
components throughout the power network, permitting more accurate, possibly automated, control
operations under various conditions. Figure 1 illustrates the main elements contained in the electric grid
at the transmission and distribution level, which are referred to throughout this section.
8
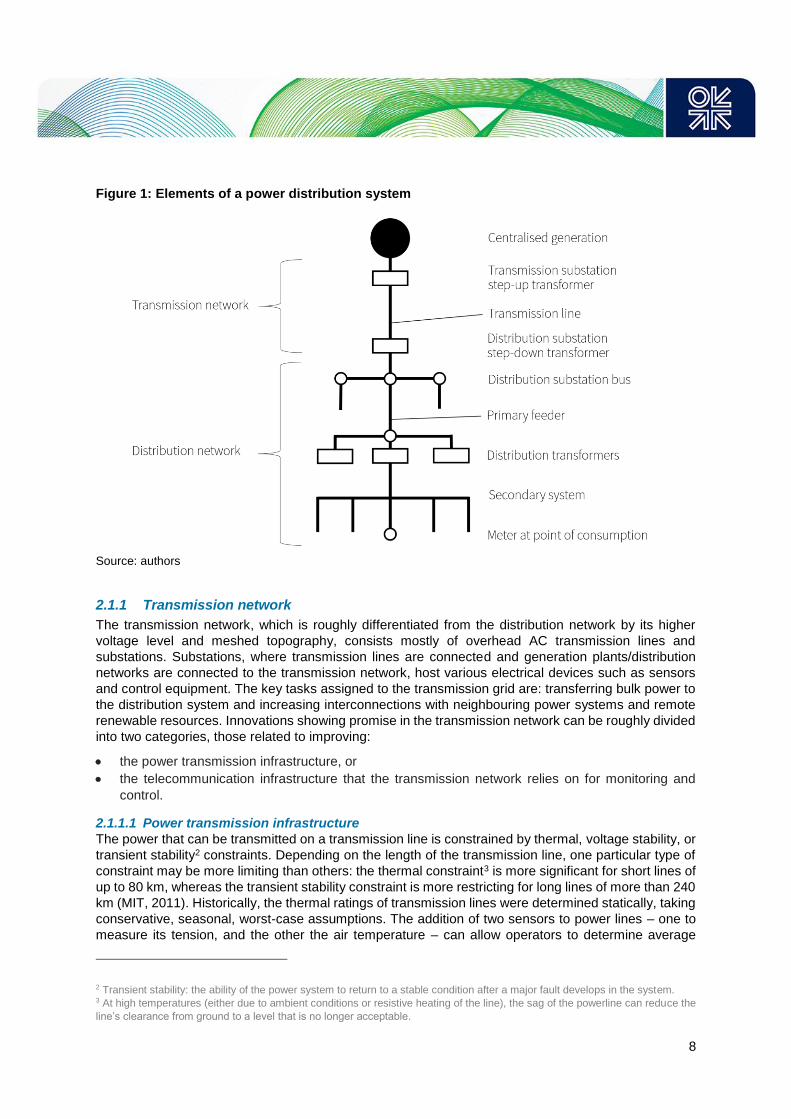
Figure 1: Elements of a power distribution system
Source: authors
2.1.1 Transmission network
The transmission network, which is roughly differentiated from the distribution network by its higher
voltage level and meshed topography, consists mostly of overhead AC transmission lines and
substations. Substations, where transmission lines are connected and generation plants/distribution
networks are connected to the transmission network, host various electrical devices such as sensors
and control equipment. The key tasks assigned to the transmission grid are: transferring bulk power to
the distribution system and increasing interconnections with neighbouring power systems and remote
renewable resources. Innovations showing promise in the transmission network can be roughly divided
into two categories, those related to improving:
the power transmission infrastructure, or
the telecommunication infrastructure that the transmission network relies on for monitoring and
control.
2.1.1.1 Power transmission infrastructure
The power that can be transmitted on a transmission line is constrained by thermal, voltage stability, or
transient stability2 constraints. Depending on the length of the transmission line, one particular type of
constraint may be more limiting than others: the thermal constraint3 is more significant for short lines of
up to 80 km, whereas the transient stability constraint is more restricting for long lines of more than 240
km (MIT, 2011). Historically, the thermal ratings of transmission lines were determined statically, taking
conservative, seasonal, worst-case assumptions. The addition of two sensors to power lines – one to
measure its tension, and the other the air temperature – can allow operators to determine average
2 Transient stability: the ability of the power system to return to a stable condition after a major fault develops in the system. 3 At high temperatures (either due to ambient conditions or resistive heating of the line), the sag of the powerline can reduce the
line’s clearance from ground to a level that is no longer acceptable.

9
conductor temperature, the main factor determining the power line’s thermal rating. This results in
transmission capacity ratings that better reflect the reality on the ground – providing a boost in line
capacity when conditions are favourable, and restricting operations in extreme weather situations.
The issues of energy loss and line capacity are ongoing areas of technology advancement in grid
infrastructure. Specifically, in recent years there has been interest in the idea of super conductors.
Superconductors are materials that have very low electrical resistance when cooled below a material-
specific critical temperature. High-temperature superconductors (HTSC) have critical temperatures
which are relatively easy to achieve. If the critical temperature is maintained through adequate cooling,
a transmission line that makes use of superconducting material can achieve much higher power
capacity than a conventional conductor of the same size. In areas where new rights-of-way are difficult
to obtain (for example, in areas of natural beauty), replacing an existing line with an HTSC cable is
particularly attractive. This is an example of adopting new technologies at transmission grid level.
Another area of development at transmission grid level is AC to DC conversion, and vice versa, together
with the ability to control a large amount of power and voltage. Development in this field has allowed
high voltage direct current (HVDC) transmission lines in niche applications where conventional AC lines
are not suitable (subsea transmission and the interconnection of asynchronous AC grids when two
interconnected countries use different grid frequencies). Moreover, because of its cost structure,
beyond a certain break-even distance, an HVDC transmission system, including the line and converters,
is always less expensive than its AC equivalent, and power flow over an HVDC line can be accurately
controlled. This makes HVDC very attractive for the connection of remote renewable resources.
However, reliable control devices for HVDC systems are not yet available, preventing the development
of meshed HVDC grids (Franck, 2011).
Similarly, another major technological development at transmission level is that of Flexible AC
Transmission Systems (FACTS). These are power electronics which are used to dynamically control
voltage and other key parameters in HVAC lines, thereby influencing power flow across the lines.
Without such devices, the power flow across an AC network follows the path of least resistance. FACT
devices are specifically helpful for cross-border trade as they can make power flow in an AC line
compatible with the result of market operation. Furthermore, the adjustments that FACT devices allow
are more rapid and precise than those enabled by conventional controllers located at substations,
providing grid services such as voltage control, reactive power control, steady-state support, and
dynamic stability more effectively.
2.1.1.2 Telecommunication infrastructure
The elements that constitute the transmission network are usually centrally monitored and controlled
from a control centre.4 Real-time information about the status of the system (power flows, substation
voltages, output of all generators, status of all transmission lines and substation circuit breakers,
transformer tap settings) are collected by special equipment and sent to the control centre, typically
being displayed via a user interface. This equipment also relays back control commands issued by
operators at the control centre. Since the 1980s, remote control devices have been equipped with
microprocessors capable of receiving control signals from, or sending data to, an external source; they
are also able to exercise distributed control, managing substations independent of the control centre
(Thomas and McDonald, 2015). This allows for a more decentralised management of electricity
networks in the power system. All these devices – including sensors/controllers, communication
channels, and user interfaces at the control centre – make up the Supervisory Control and Data
Acquisition (SCADA) system.
Given that not all power flows and voltages of interest in the system are measured, data collected is fed
into a mode-based state estimator at the control centre, which then estimates the approximate state of
4 There may be one control centre for the entire country or several.

10
the power grid based on its input. Other functions also performed by SCADA are the analysis of
operating conditions and the determination of line flows or bus voltages under various hypothetical
system contingencies.
Significant advances have been taking place in measurement devices; these were traditionally only
able to measure scalar quantities, no other specifications of electrical wave were possible (Monti et al.,
2016). The new devices can extract several useful parameters of power, following which their
measurements can be synchronised using GPS time signals. These advanced measurement devices
provide centralised and distributed controllers with superior measurements in terms of resolution and
accuracy. There are also wide area measurement systems which are capable of very rapid analysis of
anomalies over very large geographical areas (Gadde, Biswal, Brahma, & Cao, 2016).
2.1.2 Distribution network
In comparison to the transmission network, the distribution network contains many more elements
and plays a larger role in the quality of service received by electricity consumers. It consists of:
distribution substations (stepping down the voltage between the transmission network and primary
feeders – the main supply lines that connect to secondary networks),
distribution transformers (which further step down the voltage between the feeders and consumer
premises), and
all the interconnecting lines in between.
Radial systems, where consumers only have connection to one primary feeder, are common in low
load density areas. This mode of operation was prevalent due to its simplicity, the ease of coordinating
protecting devices, and overall economics. Loop systems, where consumers are connected to two
primary feeders in a closed loop, are introduced where there are higher requirements for reliability.5
While one section is out of service or being repaired, customers can be serviced by the other feeder.
Distribution network upstream of the primary feeders is monitored and controlled via SCADA systems.
In general, automated remote sensing and control here is less developed than that in the transmission
grid. Individual equipment monitoring has been seen as economically inefficient, given the large number
of distribution transformers and customers connected. Traditionally, meters located on customer
premises are used for billing, and suppliers visit the premises to read meters manually. Overall, the
main direction of innovation in the distribution network is in improving distribution monitoring, control,
and data processing/automation. This can be done at the medium-voltage level, low-voltage level, or
for islanded microgrids.
2.1.2.1 Medium-voltage level
Given that monitoring and control of networks at low-voltage levels is uncommon, the restoration of
customers after an outage can be a lengthy process: the distribution network operator is notified of the
blackout through customers’ calls, only then are crews sent out to track down and manually restore the
system. Consequently, automatic Fault Detection, Isolation, and Restoration (FDIR) is being developed
to reduce the time of outage.6 This involves more extensive deployment of smart circuit breakers,
sensors, and advanced control algorithms at the medium-voltage level.
FDIR has two main stages: fault location detection and isolation, followed by service restoration. Once
the fault is located, the smallest possible part of the network is isolated by (remotely) opening the first
upstream and downstream switches from the fault. To restore service to customers, suitable backup
feeders need to be identified and the loads in out-of-service criteria are temporarily transferred to these
5 A primary distribution network – a grid of interconnected primary feeders – offers the highest reliability in the case of a fault in
one part of the circuit, since consumers can then be served by other interconnected feeders. This network is mainly found in
downtown areas of large cities (Casazza & Delea, 2010). 6 An automated approach to network restoration is why smart grids are sometimes referred to as being ‘self-healing’.

11
feeders through switch operations, until the faulty section is completely repaired. Expert algorithms (in
which expert knowledge and experience are translated into rule-based programming logic),
mathematical programming approaches (where restoration plans are formulated as an optimisation
problem), and multi-agent based approaches (where grid components such as intelligent agents with
sensors, actuators, and processing capability have been introduced) have been used in this area (Zidan
et al., 2016).
Another area for improvement in the medium-voltage level distribution network is in voltage control.
Adjustable transformers (voltage regulators) and capacitors that can be switched in and out (capacitor
banks), as well as other devices, are used to regulate voltages within a specified range along an entire
path. These devices are controlled from the distribution substation. Voltage, the variable of interest,
declines along the distribution line. Traditionally, given limited sensing capability within the distribution
network, voltage is measured at the substation but not at the end of the line. Therefore, operators
commonly set substation voltage to the upper end of the allowable voltage range, to ensure that the
voltage at the end of the line is within limits. A new voltage/reactive regulation approach is also being
developed that relies on a voltage sensor at the end of the distribution line. It allows a tighter control of
voltage: the substation voltage can now be adjusted to maintain the line-end voltage at the lower end
of its limit. This reduces the variation of voltage and lowers the average voltage across the line. The
voltage and reactive power control applied at peak time is also known as conservation voltage
reduction. Since the same load will draw less power at a lower voltage, then if the feeder voltage is
reduced to the lowest acceptable value, the total power drawn throughout the network will decrease
(Peskin, Powell, & Hall, 2012).
2.1.2.2 Low-voltage level
Another source of innovation in the distribution network is the extension of sensing and control to the
end customers at the low-voltage level. Two types of smart meters are being rolled out across the world
to enable this process.
Automated meter reading (AMR), which broadcasts signals via short-range radio frequency. Meter
readings can be captured from the street using special vehicles.
Advanced Metering Infrastructure (AMI) represents a step above AMR. It is equipped with two-way
communication capabilities and is capable of recording near real-time data on power consumption
and reporting data to utility companies every hour, or more frequently. Utilities can communicate
with AMI meters remotely and can also make connections/disconnections.
Availability of real-time measurement from the low-voltage grid (only enabled by AMI) allows the
distribution network operator to understand customer behaviour and power quality phenomena at a
resolution unseen before. Instead of balancing the grid based on customers’ contracted power, the
distribution network can now be balanced on the basis of the actual load/generation profiles in the
network (Barbato et al., 2017). A major source of potential benefits associated with smart meters is
residential load control and demand management. Consumers now have access to real-time
information on their electricity consumption and grid status (time-of-use price or real-time prices), which
allows them to more actively manage their consumption and self-generation when savings/incentives
exist. But, smart meters by themselves cannot realise these system benefits. They must be incorporated
into an integrated system that includes:
customer-side controllers (allowing easy control of energy consumption devices),
intelligent energy management system software (partially or fully automating the control process,
taking into consideration consumer preferences), and

12
communication channel between all these elements.7
2.1.2.3 Microgrids
The rise of distributed generation, located in proximity to electricity load, makes the design and
operation of microgrids a new area of advancement in network technology. A microgrid is defined as a
group of interconnected loads and distributed energy resources which acts as a single controllable
entity with respect to the grid; it can operate in main grid-connected and in island modes (Parhizi, Lotfi,
Khodaei, & Bahramirad, 2015). Thus, in contrast to being just the last link of an extended supply chain
radiating outward from a few centres, distribution network sections which qualify as microgrids are self-
governable small power systems; they have distributed energy resources (including storage) which are
adequate to meet their own demand, and an independent control system capable of optimising between
connected and islanded modes.
The most salient feature of a microgrid is its ability to operate in island mode. In case of disturbances
upstream, the microgrid can be disconnected from the main grid, and resynchronised once the
disturbance is removed. Hence the reliability of the grid is increased, especially in situations of
significant transmission failure. Other possible benefits are the reduction of transmission and
distribution costs, by using local and potentially less costly/renewable energy resources. Improved
reliability via distribution automation, and improved efficiency through real-time sensing and control of
customer-end load (described above as innovation paths for distribution networks), can also be applied
in a microgrid setting.
2.1.2.4 Computing infrastructure and IT
For both transmission and distribution networks in the future, real-time wide-area situational awareness
of grid status through advanced metering and monitoring systems is the trend. The increased amount
of data created by smart grid devices (phasor measurement units and smart meters, for example) and
the increasingly complex models in which they are used, can overwhelm the utilities if the underpinning
data management ability and computing power have not been scaled up accordingly (Daki, El Hannani,
Aqqal, Haidine, & Dahbi, 2017; Green, Wang, & Alam, 2013). Increasing incorporation of Big Data
technologies and high-performance computing into the electricity network of the future is therefore
expected.
Another important area of technological innovation is blockchain technology and its application in
electricity network operation. Blockchain is a fundamental technology that can provide an open and
shared public network in order to execute transactions at very low costs. It is a cryptographically secure,
shared record of transactions, updated by a network of computers rather than a central authority. The
combination of blockchain technology and the Internet of Things (IoT) is likely to lead to innovation in
the operation of electricity networks. It is likely that new opportunities will arise from blockchain-based
systems which transform the way in which data are collected and shared.
Blockchain technology can impact all elements of the value chain across the electricity industry, from
generation and wholesale to grid and retailing. In the context of the grid, blockchain can act as the
backbone of the industry’s smart grid management system, in which network issues are diagnosed
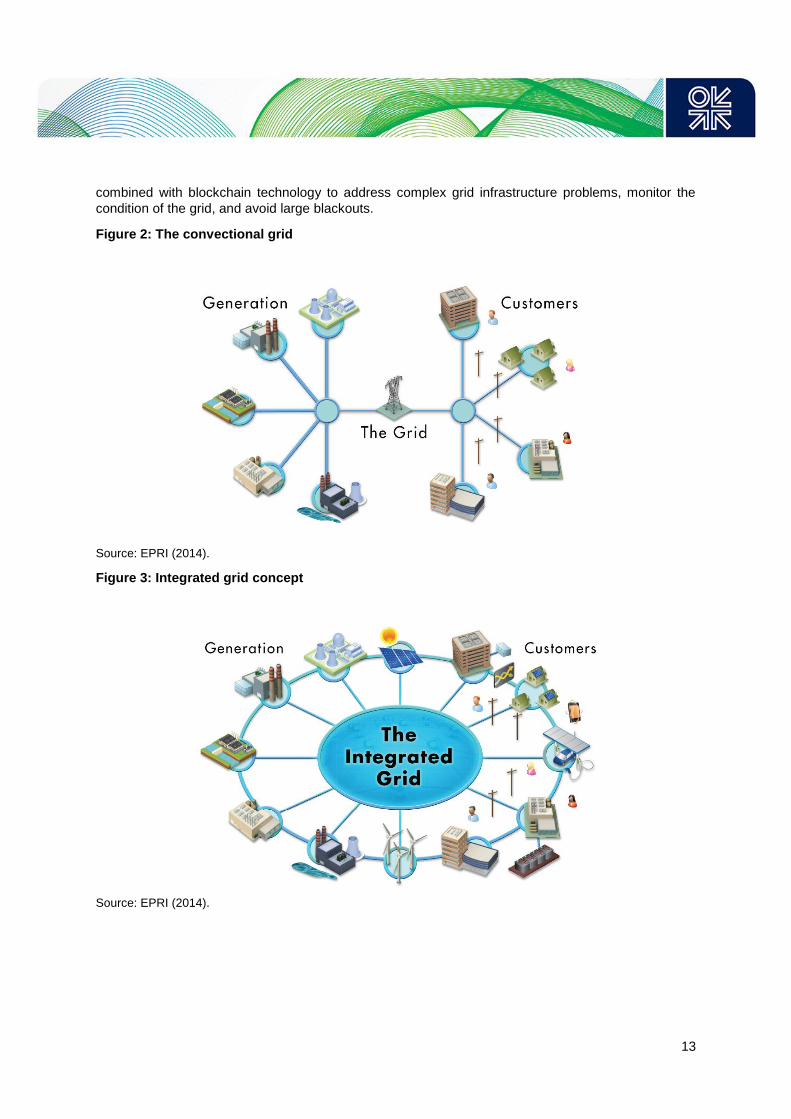
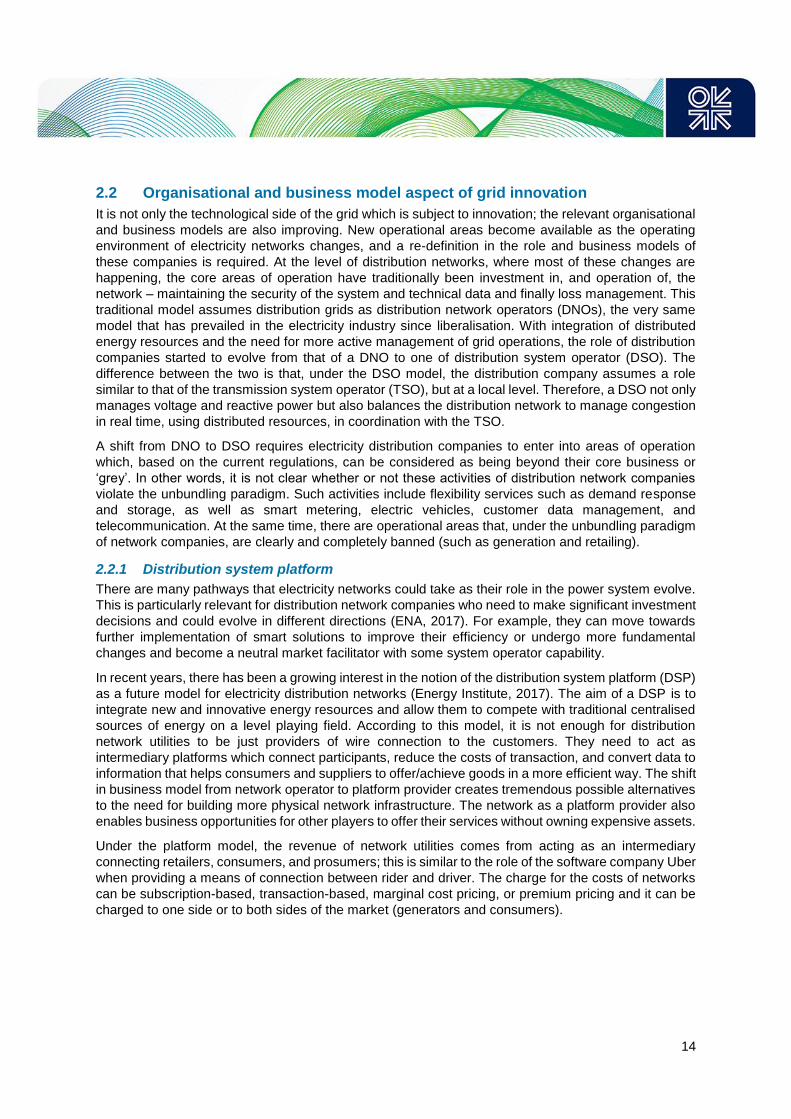
automatically and reconfigured accordingly. In relation to grid infrastructure, we have the concept of an
integrated network (see Figure 3), in which smart devices, computers, and other devices are directly
connected to each other. This is an alternative to the traditional top-down model of organising and
controlling a grid (see Figure 2) and can provide greater security and privacy, as traffic does not go
through a central system. The advance here is that the concept of an integrated network can be
7 Several types of communication schemes between smart grid devices have been proposed, such as power line
communication, wireless networks using radio waves, and virtual private networks (based on the internet infrastructure)
(Gungor & Lambert, 2006). In the home-area network, where smart meters and appliances are located, the wireless protocol
ZigBee appears to have the most momentum, but others cannot yet be ruled out.
13
combined with blockchain technology to address complex grid infrastructure problems, monitor the
condition of the grid, and avoid large blackouts.
Figure 2: The convectional grid
Source: EPRI (2014).
Figure 3: Integrated grid concept
Source: EPRI (2014).
14
2.2 Organisational and business model aspect of grid innovation
It is not only the technological side of the grid which is subject to innovation; the relevant organisational
and business models are also improving. New operational areas become available as the operating
environment of electricity networks changes, and a re-definition in the role and business models of
these companies is required. At the level of distribution networks, where most of these changes are
happening, the core areas of operation have traditionally been investment in, and operation of, the
network – maintaining the security of the system and technical data and finally loss management. This
traditional model assumes distribution grids as distribution network operators (DNOs), the very same
model that has prevailed in the electricity industry since liberalisation. With integration of distributed
energy resources and the need for more active management of grid operations, the role of distribution
companies started to evolve from that of a DNO to one of distribution system operator (DSO). The
difference between the two is that, under the DSO model, the distribution company assumes a role
similar to that of the transmission system operator (TSO), but at a local level. Therefore, a DSO not only
manages voltage and reactive power but also balances the distribution network to manage congestion
in real time, using distributed resources, in coordination with the TSO.
A shift from DNO to DSO requires electricity distribution companies to enter into areas of operation
which, based on the current regulations, can be considered as being beyond their core business or
‘grey’. In other words, it is not clear whether or not these activities of distribution network companies
violate the unbundling paradigm. Such activities include flexibility services such as demand response
and storage, as well as smart metering, electric vehicles, customer data management, and
telecommunication. At the same time, there are operational areas that, under the unbundling paradigm
of network companies, are clearly and completely banned (such as generation and retailing).
2.2.1 Distribution system platform
There are many pathways that electricity networks could take as their role in the power system evolve.
This is particularly relevant for distribution network companies who need to make significant investment
decisions and could evolve in different directions (ENA, 2017). For example, they can move towards
further implementation of smart solutions to improve their efficiency or undergo more fundamental
changes and become a neutral market facilitator with some system operator capability.
In recent years, there has been a growing interest in the notion of the distribution system platform (DSP)
as a future model for electricity distribution networks (Energy Institute, 2017). The aim of a DSP is to
integrate new and innovative energy resources and allow them to compete with traditional centralised
sources of energy on a level playing field. According to this model, it is not enough for distribution
network utilities to be just providers of wire connection to the customers. They need to act as
intermediary platforms which connect participants, reduce the costs of transaction, and convert data to
information that helps consumers and suppliers to offer/achieve goods in a more efficient way. The shift
in business model from network operator to platform provider creates tremendous possible alternatives
to the need for building more physical network infrastructure. The network as a platform provider also
enables business opportunities for other players to offer their services without owning expensive assets.
Under the platform model, the revenue of network utilities comes from acting as an intermediary
connecting retailers, consumers, and prosumers; this is similar to the role of the software company Uber
when providing a means of connection between rider and driver. The charge for the costs of networks
can be subscription-based, transaction-based, marginal cost pricing, or premium pricing and it can be
charged to one side or to both sides of the market (generators and consumers).
15
The concept of Transactive Energy (TE)8 also envisions the grid as a place that captures the benefits
of network effects. Similar to the sharing economy business models, in the TE model, distribution and
transmission companies can access reliability products (such as voltage support, supplemental reactive
power, and ancillary services) through a market place based on the grid (Energy Institute, 2017). The
term ‘transactive’ in this context indicates that decisions are made on the basis of a value. This model
relies on the high penetration of communication technologies. The demand for current and future
transactions determines the location and investment planning of distributed energy resources.
The implementation of the platform model in the context of other businesses has been easier than in
electricity networks. This is because many internet-based businesses (such as Uber and Airbnb) are
not capital intensive and are not held back by a legacy system either in physical or institutional terms.
Re-design of electricity networks as platforms can be more challenging.
Looking forward, there are still many open questions regarding the role, institutional structure, and
business model of electricity network companies. For instance, it is not clear whether the operations of
distribution companies need to be performed by an independent entity (similar to the independent
system operator in the case of transmission) or if the owners should continue the role of operatorship.
Furthermore, there are suggestions that DSOs become ‘not for profit’ organisations, as opposed to the
‘for profit’ status of current entities.
In terms of the revenue model, although platform markets are compatible with many forms of charging
strategies, it is still not clear what model works best for DSOs. Many successful platform markets charge
both sides of the market; however, given the small amount of energy involved in residential transactions,
the network utilities may struggle to recover their costs. Furthermore, a platform model grows and
becomes economic when the number of customers connected also grows. However, network utilities
are bound by their service areas. This means that for platform services, they cannot attract customers
from outside their designated area.
In terms of products and services that a platform can offer there is more flexibility. These products can
range from traditional energy and capacity to distribution-specific products such as low-voltage
congestion reduction and reactive power. There is also the possibility of specific services such as risk
management for customer bill volatility, and software programmes that free up consumers from direct
energy making decisions. However, how these services should be designed, and whether the revenue
from them will be sufficient to recover the costs of operating and maintaining the platform, is yet to be
seen. Finally, there are still important questions about how the distribution-level market model should
coordinate with the existing bulk power system so as to avoid physical and financial operational conflict.
At the moment, there are some demonstration projects around the world which try to test distribution
platform markets in order to better understand the platform concept and explore answers to questions
raised above. One such initiative is taking place in the US state of New York, which is pushing for
experimentation with DSP under Reforming the Energy Vision (REV). For instance, ConEdison is
testing the aggregation of distributed energy resources, such as solar and batteries, by creating a virtual
power plant (VPP) and connecting 300 homes. Another example along the same lines is the
Decentralised Energy Exchange project in Australia, whereby a software package reviews availability
and prices bid for demand response and other related services, and selects bids on a least cost basis
in order to deliver energy and demand reduction to the distribution network operator. Finally, the
Transactive Energy concept is being implemented in multiple pilot projects around the world. For
instance, the PowerMatching City demonstration project in the Netherlands has created an integrated
smart grid system of 25 houses in Groningen city that interconnects renewable energy generators,
8 TE is usually defined as ‘a system of economic and control mechanisms that allows the dynamic balance of supply and
demand across the entire electrical infrastructure using value as a key operational parameter’ (NIST, 2017). In other words, TE
refers to the use of a mix of economic and control techniques to improve the reliability and efficiency of the grid. These
techniques can also be used to optimise operations within customers’ premises.
16
electric vehicles, smart appliances, and smart meters. The initiative uses market platform software in
order to make real-time operational decisions based on five minute intervals, in order to match supply
and demand. The second stage of this project is expected to include 40 households and to develop
new models.
In summary, these small initiatives, which often rely on blockchain or similar technologies, herald a
change in the operation of electricity networks and highlight the importance of innovation, not only in
technological dimensions but also in the business model and organisational aspects of power grid
companies.
3. Economic incentive for grid innovation
Incentive regulation (such as price cap and revenue cap), was originally designed with the aim of
improving the efficiency of natural monopoly infrastructures. The issue of innovation was not dealt with
explicitly in regulation, as it was assumed that the incentive for cost reduction also promotes innovation.
Therefore, the standard regulatory model of network companies incentivises only cost reduction or static
efficiency gain, subject to meeting certain levels of reliability. This is usually done through sharing with
the firm a percentage of its cost reductions during the regulatory period. However, the risk profile of
innovation efforts is different from that of the normal activities of firms. This means that the conventional
efficiency-oriented model of grid regulation is inadequate to stimulate innovation. In this section we first
show the reason why a focus on costs reduction does not necessarily deliver innovation. We also
examine the effects of risk, in the context of competitive schemes for innovation funds. Finally, we
review the regulatory options for explicitly dealing with innovation in the regulatory model of network
companies.
3.1 Incentive for innovation versus incentive for cost efficiency: one regulation two tasks
Implementation of incentive regulation per se does not necessarily incentivise network companies to
undertake innovation, especially when the objective of innovation is beyond cost efficiency. This is
even true when the objective of innovation is cost efficiency but the way of achieving it is through
implementation of less certain technologies and processes. We distinguish between innovation and
normal efficiency gain based on the level of risks involved in these two activities: normal efficiency
gain is assumed to be less risky compared with innovation efforts.
In order to investigate this, let’s consider the incentive regulation model in (1):
𝑧 = 𝛽 + 𝛼1𝑥1 + 𝛼2𝑥2 (1)
Where:
𝑧: allowed compensation of the firm for its innovation and efficiency gain efforts.
𝛽: fixed part of compensation plan that is directly transferred to the consumer through an uplift in
network tariffs.
𝑥1: the normal efficiency gain of the firm from its effort.
𝑥2: the gain of the firm from its innovation effort.
𝛼1: is a number between zero and one that determines the share of the firm from its efficiency gain.
𝛼2: is a number between zero and one that determines the share of the firm from its innovation gain.
17
A firm can exert effort to reduce its costs as part of its normal operation, but cost reduction is not
guaranteed. Therefore, we assume the amount of cost reduction (𝑥1) is a function of effort of the firm
(𝑒1) and a risk parameter (𝜀1) which has a normal distribution with mean zero and constant variance 𝜎12
as in (2).
𝑥1 = 𝑒1 + 𝜀1 𝜀1~𝑁(0, 𝜎12) (2)
The size of variance (𝜀1) shows the amount of risk that the firm faces with respect to the outcome of
its cost reduction efforts.
At the same time the regulator aims to incentivise innovation as part of the regulatory model, by allowing
the firm to claim a share (0 ≤ 𝛼2 ≤ 1) of the value of its innovation outcome (𝑥2). The implicit assumption
here is that the innovation outcome is verifiable and measurable by the regulator. For example, suppose
that the firm creates a considerable level of efficiency gain, but this increased productivity is the result
of activities with a different (higher) level of risk profile. Alternatively, it creates a process or product that
has a present value of 𝑥2. (For example, the regulator has defined ex ante what counts as innovation
and how its value will be estimated. An increase in the number of distributed resources and the
utilisation of intelligent network management could be used as an innovation indicator and their value
calculated by the amount of investment deferred, and by all other savings such undertakings can
provide.)
Similar to the previous case, there is uncertainty in the outcome of innovation activities, so we assume
that innovation gain (𝑥2) is a function of the firm’s effort (𝑒2) and a risk parameter (𝜀2), which indicates
the uncertainty in the outcome of the firm’s effort, with mean zero and constant variance (𝜎22) as in (3).
𝑥2 = 𝑒2 + 𝜀2 𝜀2~𝑁(0, 𝜎22) (3)
When innovation is motivated within the existing regulatory model of network companies, incentive
regulation is supposed to fulfil an additional purpose – in other words, in addition to the normal cost
reduction, the regulatory regime needs to incentivise the firm to carry out costlier and perhaps riskier
innovation activities. This means that the optimum regulatory scheme in this case should not only
allocate the risk and compensate the firm for its effort, but also allocate attention between two tasks.
In order to analyse the behaviour of the firm under the regulatory regime presented in (1) we employ
the multi-task moral hazard model proposed in Holmstrom and Milgrom (1991). Under this setting, the
regulated firm chooses the vector of effort 𝑒 = (𝑒1𝑒2
) in order to produce the vector of outcome 𝑥 = (𝑥1𝑥2
)
which is affected by risk (𝜀) as in (4).
𝑥 = 𝑒 + 𝜀 𝜀~𝑁(0, Σ) where Σ = [𝜎1
2 𝜎12
𝜎12 𝜎22 ] (4)
The firm experiences the cost of 𝑐(𝑒) for its efforts. We assume that the regulated firm is risk averse
and that its risk preference can be represented by a Constant Absolute Risk Averse (CARA) utility
function as 𝑢(𝑧) = − exp(−𝑟𝑧 − 𝑐(𝑒)), where 𝑟 measures the degree of risk aversion.
We assume the shape of the firm’s cost function (𝑐(𝑒)) for carrying out cost-reducing efforts (𝑒1) and
innovation efforts (𝑒2) as in (5) where |𝜃| < 𝜌.
𝑐(𝑒1, 𝑒2) =1
2𝜌(𝑒1
2 + 𝑒22) + 𝜃𝑒1𝑒2 (5)
The variance matrix in (4) allows for the possibility that the risk of two activities (innovation and
efficiency) can be correlated. Likewise, the cost function in (5) allows for the possibility of shared
technological features between efficiency and innovation activities. Apart from the fact that these
assumptions can be reasonable, given that the two activities are conducted within the same firm with
the same resources, and have similar purposes, being able to make general assumptions allows for
general solutions which cover a wide range of possibilities.

18
In terms of the solution the main aim is to understand:
(i) What is the optimal level of 𝛼1 and 𝛼2?
(ii) How do the optimal values for 𝛼1 and 𝛼2 change when the risk of innovation increases compared
to the efficiency gain?
(iii) How does the effort of a firm undertaking two tasks change with increased risk of innovation activity?
The regulator (namely the principal) is assumed to be risk neutral and obtain the gain (on behalf of
consumers) equal to 𝑥 − 𝑧(𝑥) after compensating the firm according to the plan 𝑧(𝑥) = 𝛽 + 𝛼𝑇𝑥 where
𝛼𝑇 is the transposed vector of the firm’s share from efficiency and innovation gain which is represented
by vector 𝑥.
Solving equation (1) on the basis of the aforementioned assumptions leads to an expression for the
optimal share of firms from efficiency gain and innovation, as presented in A(13), and to another for the
optimal level of effort as in A(14) (see appendix for the details).
Equations A(13) and A(14) in the appendix reveal some interesting features on the structure of an
optimal compensation plan for innovation and efficiency gain when they are treated similarly despite
having different risk profiles. In order to understand what the implications of incentivising innovation
under the regulatory model in (1) are, we carry out some simple simulation analysis.
3.1.1 Simulation of results
Below we provide some simple simulated results under various scenarios with respect to cost structure
and the uncertainty of outcome of two tasks. In each case, we show what happens to optimum incentive
structure and effort, when innovation is more uncertain compared with the normal efficiency gain of the
regulated firm.
(i) In the first case we assume that the risk profiles of the two tasks are
independent (𝜎12 = 0). We also assume that there is synergy between the two
activities (doing them together is less costly than doing them separately – in
other words, 𝜃 < 0), so the shape of an optimal compensation scheme for some
chosen values that satisfy our assumptions would be as in Figure 4.
19
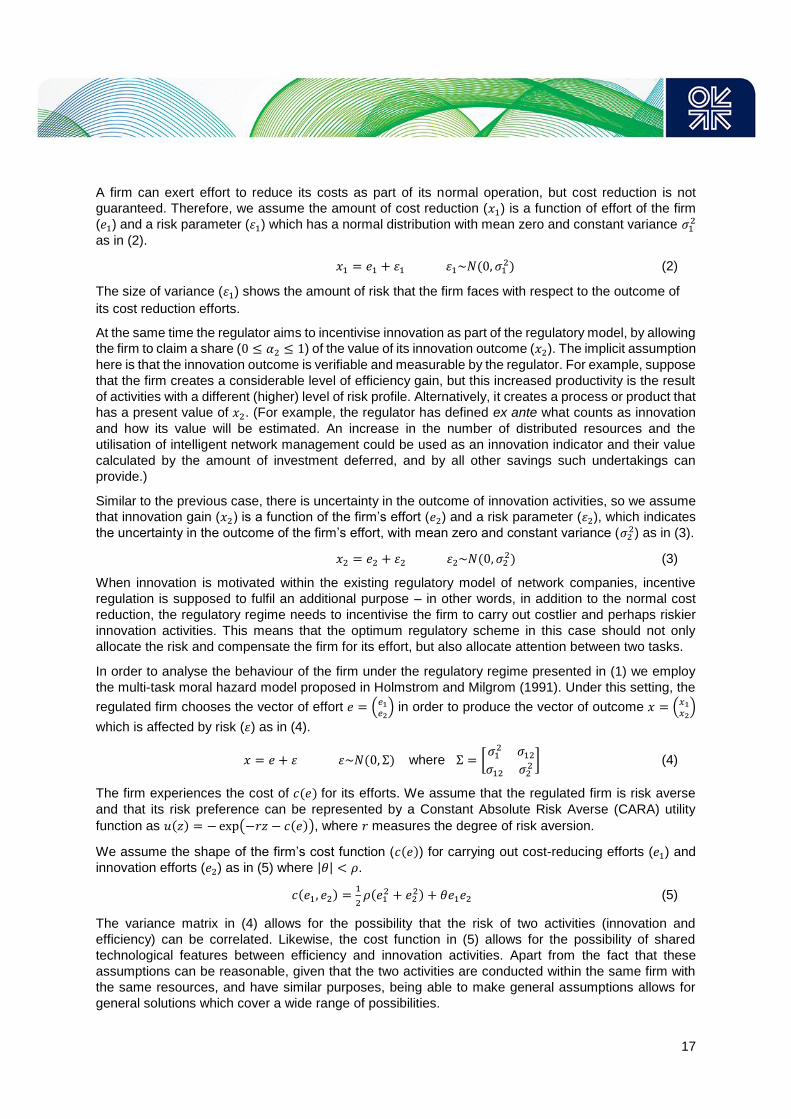
Figure 4: the effect of increase in uncertainties of innovation on optimal share of firm and its
effort (when there is synergy between tasks)
As can be seen from Figure 4, when there is synergy between tasks, the increase in uncertainty of
innovation has an increasing effect on the optimal share of the firm from its conventional efficiency gain
(meaning that the compensation for efficiency needs to be based more on outcome) but a decreasing
effect on that of innovation gain (meaning that compensation for innovation needs to reduce its reliance
on outcome). This means that although the optimal shares of the two tasks start as being of similar
magnitudes (when the risks are similar), they move in completely opposite directions as the risks of
innovation increase. However, the level of effort for both activities reduces with the increase in
uncertainties in the outcome of innovation effort. This suggests that when there is synergy between two
tasks, the risks associated with innovation negatively affect the effort not only of innovation but also of
conventional efficiency gain. This is an indication of the distortionary effect of performance-based
schemes for innovation under assumptions made about costs synergy and risk in this scenario.
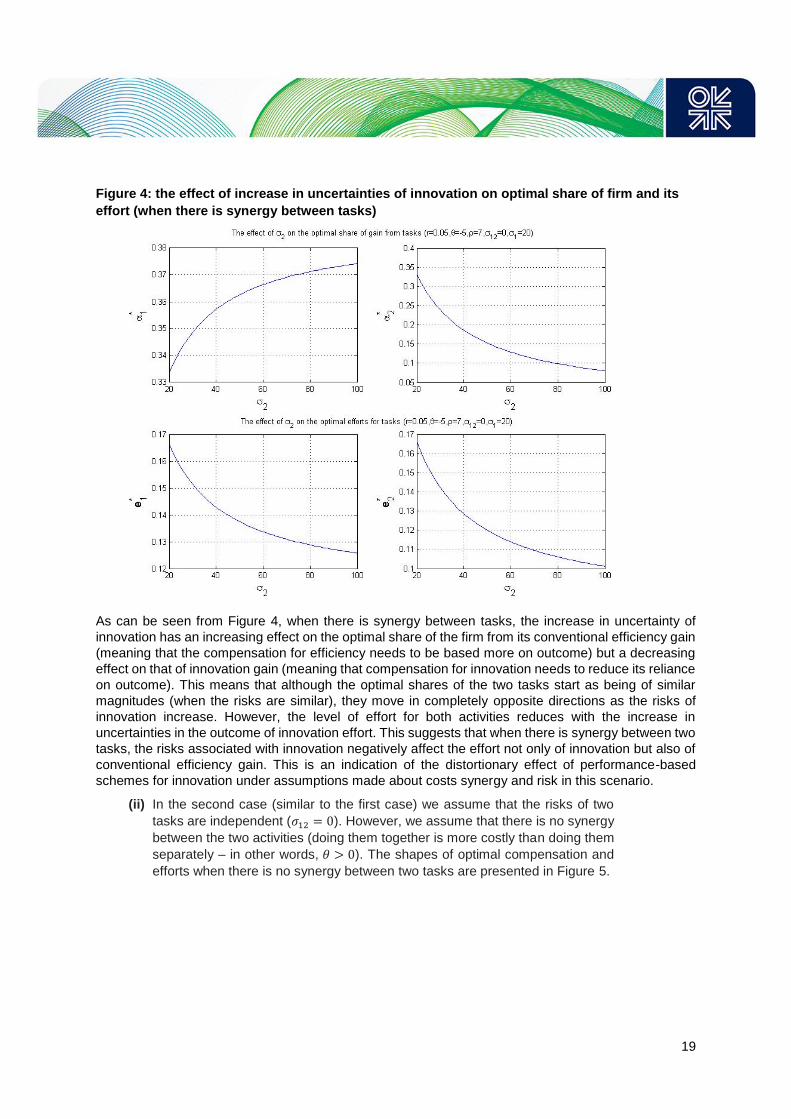
(ii) In the second case (similar to the first case) we assume that the risks of two
tasks are independent (𝜎12 = 0). However, we assume that there is no synergy
between the two activities (doing them together is more costly than doing them
separately – in other words, 𝜃 > 0). The shapes of optimal compensation and
efforts when there is no synergy between two tasks are presented in Figure 5.
20
Figure 5: the effect of increase in uncertainties of innovation on the optimal share of firm and
its effort (when there is no synergy between tasks)
As can be seen from Figure 5, an increase in uncertainty of innovation outcome leads to a reduction in
optimal share of the firm from the outcomes for both efficiency gain and innovation achievement (this
means that the regulator needs to reduce the reliance of compensation on outcome). However, the
optimal effort for the two tasks goes in opposite directions and the two tasks will become substitutes. In
other words, as the innovation becomes riskier, the firm diverts its attention from innovation to
conventional efficiency gain activities. Thus innovation effort will approach zero when it becomes
sufficiently risky (the firm will only engage in normal cost efficiency).
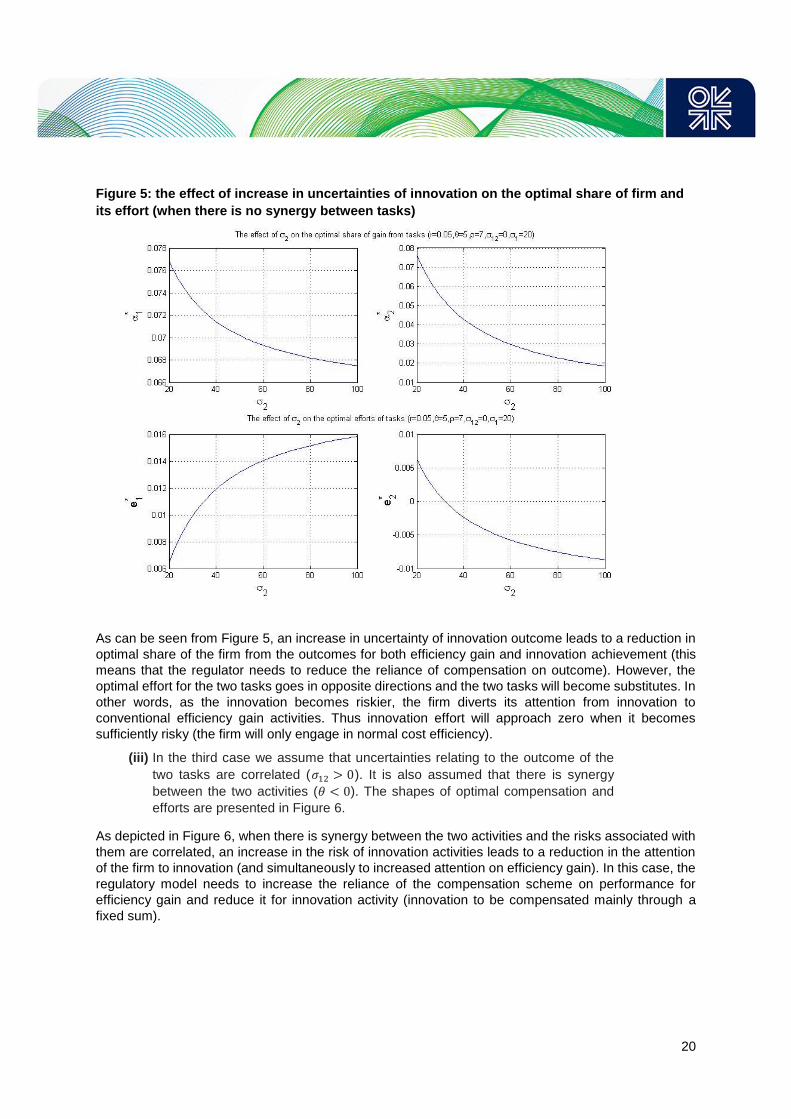
(iii) In the third case we assume that uncertainties relating to the outcome of the
two tasks are correlated (𝜎12 > 0). It is also assumed that there is synergy
between the two activities (𝜃 < 0). The shapes of optimal compensation and
efforts are presented in Figure 6.
As depicted in Figure 6, when there is synergy between the two activities and the risks associated with
them are correlated, an increase in the risk of innovation activities leads to a reduction in the attention
of the firm to innovation (and simultaneously to increased attention on efficiency gain). In this case, the
regulatory model needs to increase the reliance of the compensation scheme on performance for
efficiency gain and reduce it for innovation activity (innovation to be compensated mainly through a
fixed sum).
21
Figure 6: the effect of increase in uncertainties of innovation on the optimal share of firm and
its effort (when there is synergy between tasks)
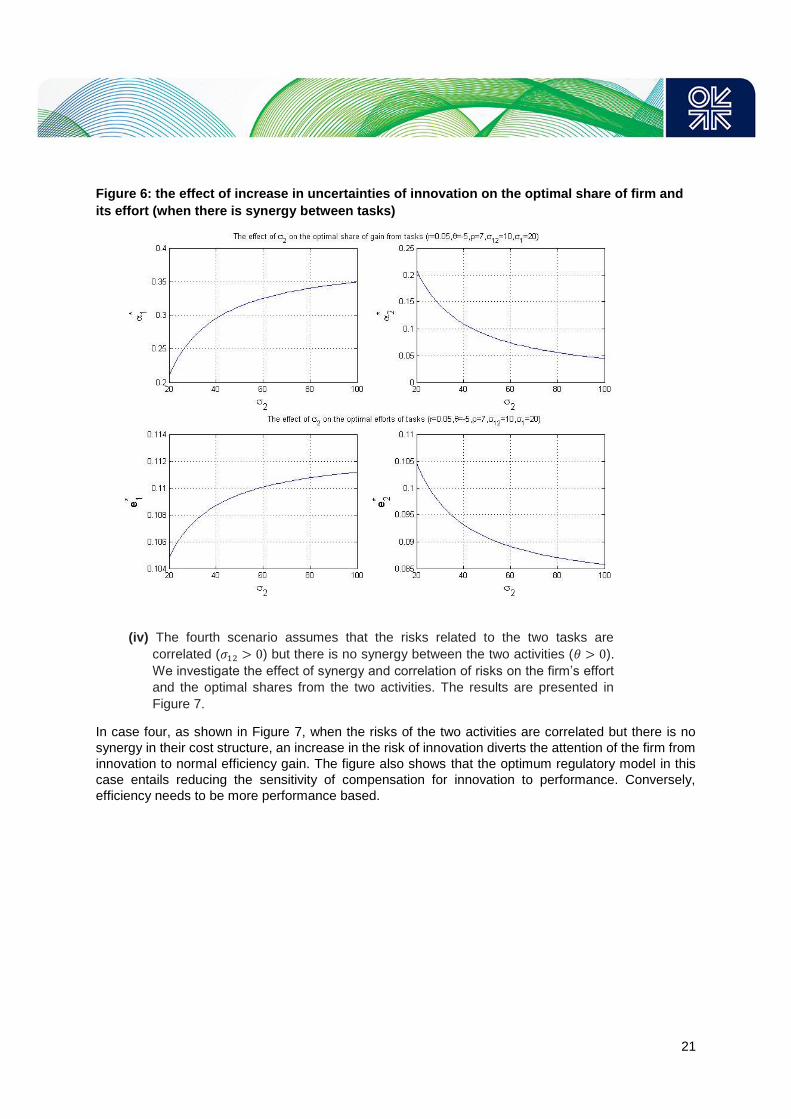
(iv) The fourth scenario assumes that the risks related to the two tasks are
correlated (𝜎12 > 0) but there is no synergy between the two activities (𝜃 > 0).
We investigate the effect of synergy and correlation of risks on the firm’s effort
and the optimal shares from the two activities. The results are presented in
Figure 7.
In case four, as shown in Figure 7, when the risks of the two activities are correlated but there is no
synergy in their cost structure, an increase in the risk of innovation diverts the attention of the firm from
innovation to normal efficiency gain. The figure also shows that the optimum regulatory model in this
case entails reducing the sensitivity of compensation for innovation to performance. Conversely,
efficiency needs to be more performance based.
22
Figure 7: the effect of increase in uncertainties of innovation on the optimal share of firm and
its effort (no synergy between tasks and lower level of random noise covariance)
The four cases examined here cover almost all possible risk and technology relationships associated
with cost efficiency and innovation. In all scenarios, the risker innovation is the less effective becomes
performance-based regulation of innovation. Put another way, the results show that performance-based
incentive regulation is an effective approach when the regulator deals with the less risky business-as-
usual activities of the firm.
This means that the regulator cannot rely on pure incentive regulation to encourage innovation in
network companies, without the introduction of additional modules that take into account the issue of
the risk to which companies are exposed. Previous studies have argued that incentive regulation has
resulted in the decline of R&D and innovation expenditure in the electricity sector (Jamasb and Pollitt,
2008). The nature of uncertainty of innovation requires the application of regulatory incentive
mechanisms that take into account the risk of these activities. The message from this section of the
paper is that incentivising innovation through the same mechanism as efficiency gain does not lead to
innovation, even if the objective of innovation is productivity, but with a higher degree of risk.
3.2 Competitive innovation funds and the problem of risk
The issue of risk is relevant irrespective of the way in which innovation is incentivised. In recent years,
there has been an interest in the introduction of competitive approaches to allocate innovation funds
more efficiently and to encourage innovation in network companies. Although these schemes can be
designed in various forms, a common feature is that firms submit proposals for the innovation fund to
the regulator. The regulator then evaluates these submitted proposals and allocates the funds to the
best projects according to some criteria (such as: the highest potential value for consumers/society and
their impact on the government’s objective of decarbonisation). The source of these funds can be rate
payers or tax payers (or a combination of the two). In the rate payer approach, an uplift is added to
network fees to be collected from end-user and innovation fund is established, the resource from which

23
will be allocated through a competitive process to the best projects (the regulator may or may not
leverage these resources). In this way, electricity customers (rate payers) pay for the cost of innovation.
The competitive scheme for innovation funds is usually implemented for large and complex projects.
The significance of the risk here is that preparing proposals for such projects is costly and usually
requires the network firm to rely on outside resources. The cost of these resources is non-recoverable
if the firm is not successful. Therefore, it is important to understand the implications of such a scheme
and the way in which the risk attitude of the firms impacts the outcome of the competition in this context.
Suppose there are two firms operating in a regulatory environment where the first contributes 𝑣1 and
the second contributes 𝑣2 to the innovation fund and so the total resource available for allocation is 𝑣1 +𝑣2 = 𝑤. Both firms prepare innovation proposals and compete for innovation funds by submitting their
proposals to the regulator. The regulator compares proposed innovation projects and the available fund
will then be allocated to the project with a higher value (only one project is selected). We assume that
the value of the project depends on the intrinsic quality of ideas and the effort of the firm in preparing a
decent proposal, responding to the questions by reviewers, and in making case for the importance of
the project. Thus the value of project (𝑓𝑖(𝑒𝑖)) can be presented by a linear function of the firm’s effort
and the quality of idea as follows:
𝑓𝑖(𝑒𝑖) = 𝜆𝑖𝑒𝑖 and 𝑖 ∈ {1,2} (6)
where 𝜆𝑖 is the coefficient representing the quality of the idea, 𝑒𝑖 is effort and 𝑖 is a subscript that refers
to the number of contestants. Therefore, equation (6) relates the value of innovation to the effort of the
firm and the characteristics of the project. We assume that the probability of wining the competition for
funds follows the following contest success function first introduced by Tullock (1980):
𝑝𝑖 =𝑓𝑖(𝑒𝑖)
𝑓1(𝑒1)+𝑓2(𝑒2) and 𝑖 ∈ {1,2} (7)
and where 𝑒1 = 𝑒2 = 0 then 𝑝𝑖 =𝜆𝑖
𝜆1+𝜆2.
Also, we also assume that the firms’ risk preferences can be presented by a CARA utility function as
follows:
𝑢𝑖(𝑧𝑖) = −exp (−𝑟𝑖𝑧𝑖) (8)
where 𝑧𝑖 = 𝐼𝑖 + 𝑤𝑖 − 𝑒𝑖 when the firm is successful and 𝑧𝑖 = 𝐼𝑖 − 𝑒𝑖 when the firm fails to win the
innovation contest. 𝐼𝑖 is the initial resource of the firm, 𝑤𝑖 is the innovation fund, and 𝑒𝑖 is the (cost of)
effort exerted by the firm to win the competition for funds.
In terms of a solution, this is a simultaneous game of complete information, in the sense that each firm
knows its own, as well as its rival’s, characteristics. The firms exert effort in order to maximise their
expected gain from competition, given the uncertainty of outcome and the cost of the effort in preparing
and submitting the proposal. We solve the maximisation problem of the firm and obtain the ratio of
success probability for the two firms (𝑞 =𝑝2
𝑝1), where 𝑞 is an indicator of the competitive balance of the
contest. The results are presented in the appendix in equation A(20) (the ratio of success probability)
and A(21) (the ratio of optimum effort for two firms).
3.2.1 Simulation of results
In this section, we simulate some results from the competitive innovation fund model that we presented
in the previous section. First we investigate the effect of quality of idea (𝜆𝑖) on the competitive balance
of the competition (𝑞). This result is illustrated in Figure 8. For a given level of risk aversion, the
probability of wining the innovation competition increases with the firm’s own quality of proposal and
reduces with an increase in the competitor’s quality of proposal. This result confirms the fact that by
proposing a better innovation idea, the firm increases its chance of winning the contest.

24
However, the outcome of the innovation contest also depends on the effort of the firm in preparing the
proposal, attending the panel of technical experts and responding to questions, and providing the
regulator with evidence about the impact and significance of its innovation project. The regulator may
not be aware of all the benefits of the proposal and thus it is incumbent upon the network company to
spend time and money in order to make a strong case for its innovation initiative. However, not only are
these efforts costly, but the outcome of the competition is uncertain. Faced with an uncertain outcome
and unrecoverable initial costs in the case of competition loss, firms may show dissimilar levels of risk
attitude (depending on their characteristics). The risk attitude, along with the quality of innovation, has
an impact on the competitive balance of the outcome.
This result is depicted in Figure 9. It shows that when two rival firms have an innovation proposal of the
same quality, the probability of winning the competition declines with an increase in the firm’s own level
of risk aversion (upper graph) but it increases with a rise in the opponent’s level of risk aversion (lower
graph). This happens because the less risk-averse firm is willing to sacrifice more resources in order to
justify its proposal and convince the regulator of the value of its project, whereas the more risk-averse
firm is acting in a conservative manner.
However, the effect of risk aversion on the competitive balance of the competition is not linear, as it
depends on the initial quality of idea (𝜆). As illustrated in Figure 10, if one of the two firms has a higher
quality innovation idea (which is reflected in a higher 𝜆), an increase in its risk aversion initially increases
its probability of success because risk aversion causes the firm to spend more resources and protect
its initial investment in preparing the proposal. This is similar to the reasoning of a person who buys a
lottery ticket, but in order to increase his probability of winning decides to buy more than one. This effect
is called ‘self-protection’. However, there is a point beyond which an increase in the risk aversion of a
firm with a higher quality proposal lowers its probability of success in the contest. This is because
beyond a certain point, the firm perceives competition as being too risky, and invests less in
demonstrating the usefulness of its project. This effect is called the ‘gambling effect’. As can be seen
from Figure 10, at some level of risk aversion, the gambling effect can dominate the self-protection
effect, such that a firm with a more innovative project can lose a competition for the innovation fund.
This result has important implications for the design of competitive innovations schemes, because it
shows that the existence of a competitive innovation fund does not necessarily lead to the selection of
more valuable projects, as the risk attitude of the firm plays a decisive role. Put another way, just by
holding a competition (irrespective of how fierce the competition is), the regulator cannot ensure that
an innovation fund will be allocated to the innovation idea that has the highest value in terms of either
consumer benefit or alignment with government objectives.
This means that the competitive approach needs to consider the difference between risk attitudes of
firms in the face of possible non-recoverable investments. The other point is that the size of fund in
competitive schemes needs to be sufficiently large to justify a company’s initial investment, otherwise
uncertainty of outcome may discourage the firm from participation in the scheme altogether. This is why
competitive schemes have been used to allocate large amount of money to large projects.
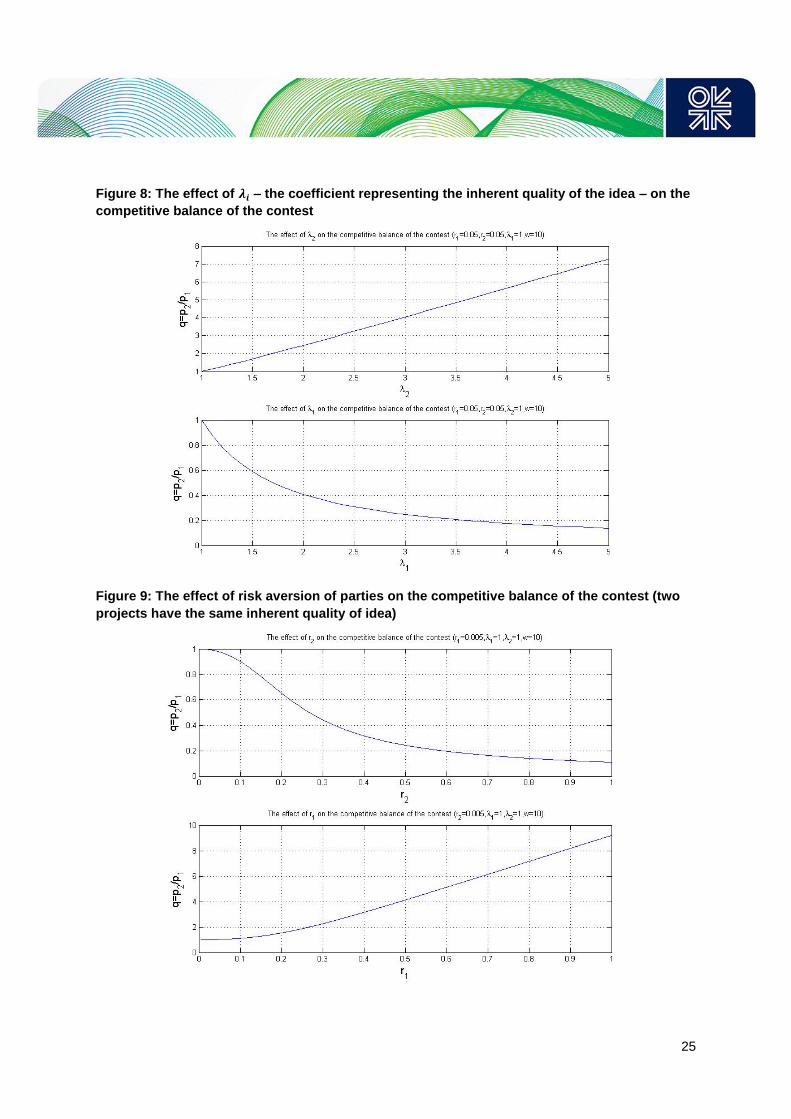
25
Figure 8: The effect of 𝝀𝒊 – the coefficient representing the inherent quality of the idea – on the
competitive balance of the contest
Figure 9: The effect of risk aversion of parties on the competitive balance of the contest (two
projects have the same inherent quality of idea)
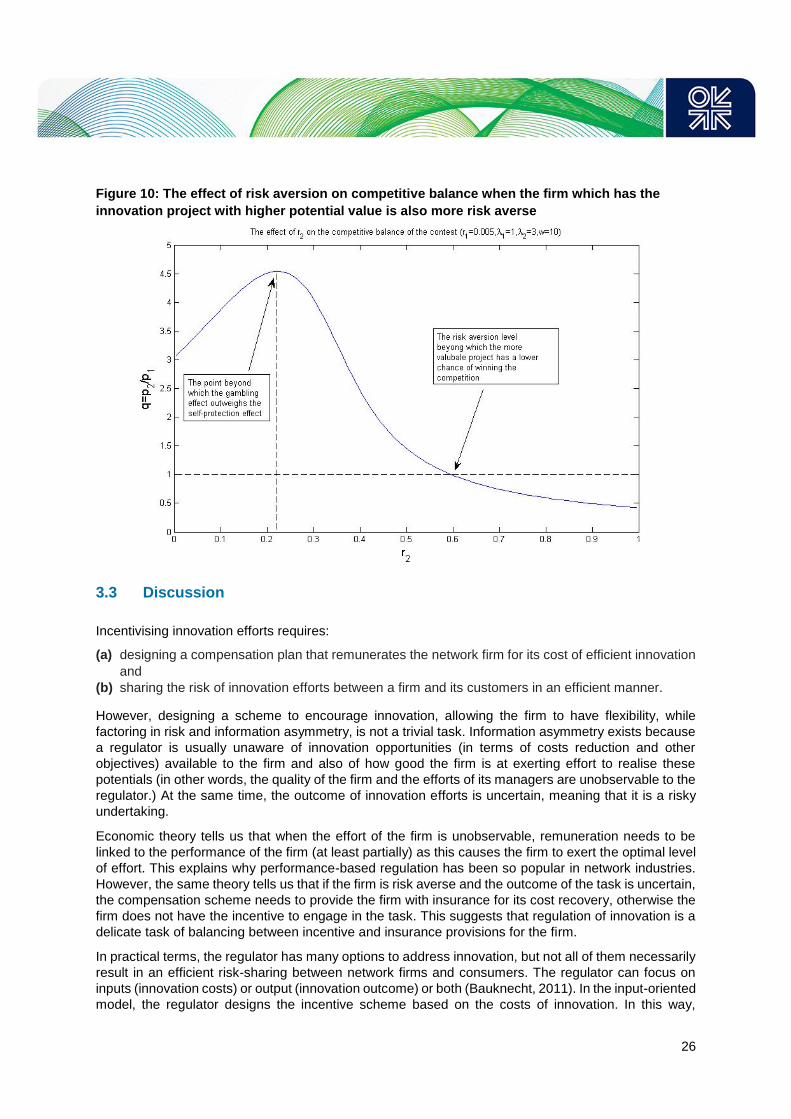
26
Figure 10: The effect of risk aversion on competitive balance when the firm which has the
innovation project with higher potential value is also more risk averse
3.3 Discussion
Incentivising innovation efforts requires:
(a) designing a compensation plan that remunerates the network firm for its cost of efficient innovation
and
(b) sharing the risk of innovation efforts between a firm and its customers in an efficient manner.
However, designing a scheme to encourage innovation, allowing the firm to have flexibility, while
factoring in risk and information asymmetry, is not a trivial task. Information asymmetry exists because
a regulator is usually unaware of innovation opportunities (in terms of costs reduction and other
objectives) available to the firm and also of how good the firm is at exerting effort to realise these
potentials (in other words, the quality of the firm and the efforts of its managers are unobservable to the
regulator.) At the same time, the outcome of innovation efforts is uncertain, meaning that it is a risky
undertaking.
Economic theory tells us that when the effort of the firm is unobservable, remuneration needs to be
linked to the performance of the firm (at least partially) as this causes the firm to exert the optimal level
of effort. This explains why performance-based regulation has been so popular in network industries.
However, the same theory tells us that if the firm is risk averse and the outcome of the task is uncertain,
the compensation scheme needs to provide the firm with insurance for its cost recovery, otherwise the
firm does not have the incentive to engage in the task. This suggests that regulation of innovation is a
delicate task of balancing between incentive and insurance provisions for the firm.
In practical terms, the regulator has many options to address innovation, but not all of them necessarily
result in an efficient risk-sharing between network firms and consumers. The regulator can focus on
inputs (innovation costs) or output (innovation outcome) or both (Bauknecht, 2011). In the input-oriented
model, the regulator designs the incentive scheme based on the costs of innovation. In this way,
27
innovation costs can be included in the regulatory expenses and be subject to the same regulatory
restriction as other costs. For example, the regulator can include them in their benchmarking practice,
to be compared with the costs of peers in the industry. Alternatively, the regulator can treat innovation
costs differently by passing them directly to consumers or including them in the regulatory asset base
of companies, which entitles the firm to a minimum rate of return. Rather than inputs, the regulator can
focus on innovation output and devise the incentive mechanism such that the firm benefits from
successful innovation. This can be done in various ways, such as: allowing for additional revenue under
a regulatory model based on the value of innovation, extending the regulatory period, and removing
regulatory restrictions for a limited period (Bauknecht, 2011).
An input-based regulation of innovation costs (where innovation costs are treated separately) insures
the firm against the downside risk of innovation, whereas an output-based regulation of innovation
allows the firm to benefit fully from the value of a successful innovation. However, an input-based
regulation, if not designed properly, can lead to overcapitalisation, whereas an output-based regulation
of innovation can expose the firm to undesired risks. Furthermore, output-based regulation can run into
the problem of verifiability and measurability. This is because innovation can be concerned with
activities other than efficiency gain – such as facilitating integration of distributed resources, improving
quality of service, reducing environmental impacts, providing resilience for service provision, enabling
new market models at the grid level, and improving the business model of network companies. If the
regulator cannot verify and measure innovation output, it cannot remunerate the company for its
activities. The approaches suggested to address this issue are: using patents registered by the network
firm as an indicator of output, or defining innovation output ex ante (for example, investment in smart
grid or distributed resources as an alternative to grid capacity enhancement).
Whether a regulator should focus on input or output to incentivise innovation depends on several factors
such as: innovation direction (namely whether the regulator wants the firm to undertake specific tasks),
the cost of monitoring input versus output, and the risk attitude of the firm. If the regulator is interested
in incentivising innovation in a particular area (such as smart grid), and inputs are observable, an input-
based regulation can be used. This also holds when the cost of monitoring inputs is lower than that of
measuring outputs, and when the firm is risk averse so that it requires a higher level of insurance against
innovation costs given the uncertain outcome of such activities.
An important point here is that the regulator needs to distinguish between types of innovation by network
firms and apply incentive instruments appropriate for the phase of innovation. There are four stages of
innovation that are relevant to regulated networks:
R&D,
piloting,
the introduction of new technologies/processes,
the commercial stage.
Risk mitigation is crucial for innovation activities that are at the early stages of the spectrum. In the case
of R&D and piloting (risky undertakings), the regulator can reduce the risk of these activities by adopting
an input-based scheme in which innovation costs are treated differently than other costs of the firm (in
other words, these costs are directly transferred to consumers). However, a separate treatment of
innovation costs, at an early stage of innovation, needs to be done on the basis of an ex ante rule which
clearly determines which expenses can be included in this category. This is to avoid strategic behaviour
in the form of cost transfer between cost categories.
For innovation activities that are related to the two later stages (introduction of new
technologies/processes and commercialisation), the regulator can adopt an output-based regulation. If
the outcome of innovation at these stages is to be an efficiency gain, a revenue-sharing mechanism
has proved to be an effective tool. This is because cost reduction can be verified and measured; sharing
a percentage of cost reduction (resulting from innovation), with a company thus creates sufficient
28
incentive and results in efficient risk sharing. However, if the outcome of innovation at these later stages
is beyond costs efficiency, the regulator can increase the cap, or remove the regulatory restriction, for
a limited period on the basis of the successful deployment or commercialisation of the
technology/process.
Finally, when the size of innovation projects is large, the incentives can be provided through a
competitive mechanism.9 This is specifically relevant to distribution network companies, given that the
number of these grids is sufficiently high to make such competition feasible (in some places such the
UK both transmission and distribution companies compete in a single competition for innovation fund).
As discussed in the previous section, one challenge of competitive schemes is that they expose the
network firms to the risk of not recovering their initial investment in the preparation of innovation
proposals, as the outcome of competition is uncertain. This risk can discourage firms from engaging in
large innovation projects. One approach to dealing with this issue is that the cost of preparing innovation
proposals, including the initial technical, economic, and feasibility studies, is covered by a separate
input-based mechanism. This means that the regulator can introduce small-scale funds for small-scale
projects (whose costs can be recovered through the network tariff), and their results can be used in the
bidding process for large complex funds in the competitive scheme.
4. Innovation incentive in practice: case studies of the UK and Italy
4.1 UK
UK is a pioneering country in the incentive regulation of electricity networks. Since the beginning of
liberalisation, it was applying RPI-X model to regulate electricity network. However, in 2013, the UK
government introduced a new performance based regulatory model known as RIIO
(Revenue=Incentives+ Innovation+Outputs) with an eight years regulatory period. According to the
regulator, RIIO model is designed to incentivise the network companies to (i) place stakeholder at the
centre of their decision-making process (ii) make efficient investment in order to ensure the continuity
and reliability of the network services (iii) innovate with the aim to reduce the cost of network services
for the current and future customers and (iv) play a complete role in realising the objective of low carbon
economy and wider environmental goals (Ofgem, 2017).
The RIIO model incentivises network companies to undertake innovation through two mechanisms: (a)
incentive as part of the price control review (b) specific innovation stimulus package (Eurelectric, 2016).
Innovation as part of price control review is promoted through long-term ex-ante output oriented
regulatory model where companies benefit from successful innovation. Innovation stimulus package,
on the other hand, is designed to facilitate achieving a sustainable energy sector. It includes three
different schemes: the network innovation competition (NIC), the network innovation allowance (NIA)
and the innovation roll out mechanism (IRM). The NIA and NIC are successors to Low Carbon Networks
Fund (LCNF), the scheme which was previously in place to encourage innovation in network
companies. The costs of incentives under innovation stimulus package is recovered through network
tariffs and companies will lose it if they do not use this fund.
As a form of incentive regulation, RIIO incentivises innovation as part of the price control review by
defining a set of outputs and targets. The regulatory model is such that the firm has both financial and
reputational motive in order to outperform these targets. The network companies need to report their
performance to the regulator for each category of output and their revenue will be adjusted upward
when they exceed the target and downward when they fail to meet the target. These rewards and
9 These projects are usually in the form of a consortium of multiple organisations including: network companies, universities,
and private firms.

29
penalties are not fixed but vary depending on case that incentives is provided for and reflect the marginal
value to the consumer. An example of these incentives is the use of non-network solutions in distribution
network congestion management which allows companies to retain a percentage of their costs savings.
A specific feature of RIIO model is that it applies a total costs approach and this directs the attention
of firm to innovation rather than capital expenditure because network utilities are always entitled to a
percentage of costs savings. The totex approach always treats a fixed percentage of total cost as
capital expenditure and the rest as operational expenditure regardless of their actual share. This is to
prevent the firm from only focusing on capital expenditure and widen the choice of firm for innovation
as many of latest innovations in the network companies are not asset based (like for example the use
of demand response as alternative to grid capacity upgrade).
Although price control review provides innovation incentive for network companies however, most
research, development and demonstration projects have uncertain outcomes and return (Ofgem,
2017b). Furthermore, shareholders are often unwilling to fund speculative projects. In addition,
commercialisation of projects that their benefits is linked to the decarbonisation of networks is often
difficult. Therefore, the UK regulator has offered a time-limited stimulus package in order to help network
companies to establish a culture, internal structures and third party contracts to facilitate innovation.
The innovation stimulus package covers eight years (2015-2023) and provides innovation-specific
incentive mechanism for network companies. One of the most important schemes in this package is
network innovation competition (NIC). Under this scheme, network companies compete annually, in a
two-stage competition process, for fund which allows them to develop and demonstrate new
technologies or implement innovative commercial and operational arrangements.
NIC began in April 2013 and will run until March 2023. A total of £70 million per year is available in this
scheme and transmission and distribution companies need to compete against each other in a single
competition (Ofgem, 2017b). Funding for this scheme is recovered through transmission network tariff
where each transmission user contributes an equal share and the learning from the project is shared
among all network companies. In this way, end users will benefit from their funding of these projects
through implementation of successful project across whole networks. This scheme assumes that even
unsuccessful projects lead to learning with potential costs saving for future consumers.
NIC is designed for large and complex project under which all types of projects including technical,
commercial and operational are eligible for funding if bidders can demonstrate their benefits to the
network and its customers. In order to be called for submission of full proposals, projects need to pass
the initial screening process (ISP). Both network and non-network licensees can participate in this
scheme however, non-network licensees need develop their project in partnership with a network
company.
The criteria used to evaluate projects in the initial screening process is multiple (Ofgem, 2017b). The
project needs to show that it
provides carbon and environmental benefits to the power system,
delivers value for money,
creates knowledge and best practices that can be shared,
is not part of the business as usual activity of the firm (is really innovative) and
it requires small scale demonstration to test its effectiveness given the risk involved in the full scale
implementation.
These criterions also will be used in the final selection process along with some other indicators such
as the project external funding level and partners’ expertise, the project relevance and timing as well as
the robustness of methodology.
As mentioned in the previous section, competition for innovation fund can expose network companies
to the risk of losing their initial investment. The NIC addresses the risk of unrecoverable investments in

30
two ways. First through initial screening process and second through allowing network firms to recover
their bid preparation and submission costs up to a certain level. The ISP provides an early indication of
which project might be eligible for funding and thus reduces the risk that network companies spending
resources and time to develop ineligible projects . In addition, for the projects that pass ISP stage, the
network companies can use up to £175000 or 5 per cent of outstanding fund required (whichever is
smaller) from their network innovation allowance (NIA) in order cover costs of preparation and
submission of bid (Ofgem, 2017b).
The network innovation allowance (NIA), which is another scheme in the innovation stimulus package,
is however not competitive and each company receives this fund as part of its price control review. This
fund, which is equal to 0.5% of allowed revenue of the company, is awarded for two main purposes: to
fund smaller scale projects with value for network and its customers and to fund the proposal
preparation for NIC scheme. The difference between NIA and NIC is that NIA is for smaller size projects
as part of the price control settlement. Unlike the NIC, NIA is not limited to innovative project with
environmental and decarbonisation benefit (ofgem, 2013). In addition, NIA is only available for network
companies, whereas NIC is also available to non-network licensees in a partnership with network
utilities. In order to receive NIA fund, network companies need to submit their innovation strategy along
with their business plan at the outset of the regulatory period.
NIA is awarded based on the quality and content of innovation strategy and can be extended to the
maximum of 1% of company’s allowed revenue, if the network firm can put forward a high quality
innovation plan. There are two sets of criteria that a project needs to meet in order become eligible for
funding under NIA. First, the proposal needs to have a direct improving effect on the operation of
network licensees or the system operator and where feasible should involve RD&D in the area of
product and process developments or adoption of new technologies and arrangement. Second, it needs
to result in learning adoptable by all network licensees, have the potential of financial benefits to the
network customers and must not lead to unnecessary duplication of existing registered projects (Ofgem,
2013).
The third incentive scheme under innovation stimulus package is innovation rollout mechanism (IRM)
whereby a network company can receive further fund to undertake innovation within the regulatory
period. This fund facilitates deployments of proven technologies. In order to receive this fund,
companies need to submit a business case to the regulator that demonstrates the value of the project
and benefit to the customers.
4.2 Italy
Since 2000, an incentive regulation regime, in the form of price cap, was being applied by the Italian
Regulatory Authority for Electricity Gas and Water (AEEGSI) which over time evolved into a hybrid
model. In the hybrid model an incentive scheme applied to tariffs components covering operational
expenditures (Opex) and a cost of service scheme was applied to the tariffs covering capital
expenditures (Capex). In 2010, AEEGSI started to incentivise deployment of pilot smart grid projects
through an input-based incentive regulation model (Eurelectric, 2016). This was done by allowing an
increase of 2% on the weighted average costs of capital for 12 years on investments made on smart
grid projects (i.e., increase in the revenue cap). The smart grid projects eligible for a higher rate of
return are selected by AEEGSI. Along with smart grid projects, storage on distribution and
transmission electricity networks are also eligible for a higher return incentive. These projects are
selected by a commission that is appointed by AEEGSI.
Since 2015, the Italian regulator (AEEGSI) introduced a new regulatory model in which the incentive
for innovation is provided in an output-based fashion. The shift from input-based to an output-based
incentive model is implemented in order to streamline the process and allow the network companies to
evaluate and quantify the benefits of projects when targets are achieved. Currently, the application of
output-based regulation is limited to two types of technologies: network observability and voltage control
31
on medium voltage networks. The network observability technologies allow for data exchange between
distribution and transmission networks. They also facilitate a precise estimation of generation and
demand. Voltage control technologies allow for an increase in the capacity of electricity network in
order to connect distributed generations without further grid reinforcement.
The Italian regulator also incentivises implementation of smart city projects with the aim to integrate
demand response, increase customer awareness and implement innovative non-network solution at
the level of distribution network. The incentive for these projects are provided through a one-off payment
along with an annual payment for two years.
The Italian regulator is planning to move towards a TOTEX approach from 2020. This is because the
current approach that allows for higher rate of return can incentivise inefficient capitalisation strategies
by network companies with the aim to maximise their profit. It is also not neutral between different
innovation solutions that can be implemented by the firm. The TOTEX approach will be implemented in
combination with the incentive menus and output based schemes.
5. Conclusions
In order to facilitate decarbonisation, digitalisation, and decentralisation of the electricity industry along
with electrification of other sectors, the power networks require significant innovation not only in their
technological dimensions but also in aspects of their organisational and business models. The results
of our review of innovations in the electricity grid show that while both transmission and distribution
networks need technological modernisation, most commercial and process innovations are needed at
the level of the low-voltage grid. This is mainly because of the rapid transformation of grid edge
technologies, which necessitates different modes of operation for electricity distribution networks.
However, network companies are regulated natural monopolies; this means that they hardly ever
undertake innovation activities in the absence of sufficient incentives. Traditional regulatory models of
network utilities are designed to incentivise cost efficiency, with the assumption that network business
is costly and the task of regulation is to lower these costs, subject to achieving a certain level of
reliability. The main challenge of incentivising innovation is that it is not only costly but also risky.
Therefore, an innovation-oriented regulatory model needs to factor in uncertainty in the outcome of
innovation efforts.
The costs and risks of innovation effort can be borne by firms, be passed to consumers, or shared
between these two. If the regulator were able to observe the firm’s effort, incentivising innovation would
be simple because the regulator could set the remuneration at a level equal to the cost of the efficient
level of effort. However, in practice there is information asymmetry between the regulator and the firm,
which means that the remuneration of firms needs to be linked to the performance of the firm. But this
is not straightforward. On the one hand, the regulator wants the firm to undertake innovation, but for
this to happen he needs to remunerate the firm for its costs when undertaking risky activity. On the
other hand, the regulator does not want to distort the firm’s incentives by giving it full insurance for
activities whose risks are actually manageable by the firm. The task of regulation is, therefore, to devise
a scheme which balances risk sharing with incentives.
We show that incentive mechanisms that do not take into account the risk profile of innovation activities
divert the attention of the network utilities from innovation to normal efficiency gain. This indicates the
importance of differentiating between cost efficiency and innovation in designing the regulation of
electricity networks. A shift from traditional models of network regulation to new models – where
innovation is the key part of the incentive structure – is crucial to facilitate the transition of the power
sector. In relation to the design of an innovation-friendly regulatory scheme, the regulator needs to

32
differentiate between types of innovation activities, as there is a different level of risk involved at each
stage of innovation. When network companies engage in R&D and piloting, an input-based regulation
(whereby the costs of these activities are transferred to consumers) has proved to be an effective
approach. For less risky activities, such as the introduction of established technologies and processes,
an output-based regulation that uses costs sharing or revenue cap adjustment leads to a more efficient
risk-sharing mechanism.
The issue of risk in regulating innovation is not confined to the actual risk of outcome. The risk attitude
of network companies is also decisive. If the scheme does not take this into account, a heterogeneous
risk attitude among bidders can distort the outcome of a competitive allocation of innovation funds. We
demonstrate that a firm with a greater level of risk tolerance but a less valuable project can win a contest
for innovation funds in competition with a risk averse firm which has a more valuable innovation project.
The risk of losing their initial investment because of the uncertain outcome of competition can
discourage network companies from entering into competition or spending resources to make a case
for their project. An approach to address this issue is to adopt a two-stage competition process in which
an initial evaluation provides an early indication of eligible projects before companies are invited for full
submission. Regulator can also offer smaller funds to be used for projects whose technical/economic
results can then be used in larger-scale innovation proposals. This eliminates the risk of losing the
upfront capital and puts network companies with different levels of risk tolerance on the same level in
the competition process.

33
References
Barbato, A., Dedè, A., Della Giustina, D., Massa, G., Angioni, A., Lipari, G., Repo, S. (2017). ‘Lessons
learnt from real-time monitoring of the low voltage distribution network’, Sustainable Energy,
Grids and Networks, 9 June 2017. http://doi.org/10.1016/j.segan.2017.05.002.
Bauknecht, D. (2011) "Incentive regulation and network innovations," EUI working papers, RSCAS
2011/2, Robert Schuman Centre for Advanced Studies, Loyola de Palacio Programme on
Energy Policy,
http://cadmus.eui.eu/bitstream/handle/1814/15481/RSCAS_2011_02.pdf?sequence=1&isAllowe
d=y
Casazza, J. and Delea, F. (2010). Understanding Electric Power Systems: An Overview of
Technology, the Marketplace, and Government Regulation (2nd ed.), Wiley-IEEE Press, 18
June 2010. http://doi.org/10.1002/9780470588475.
Colmenar-Santos A., Linares-Mena A.-R., Borge-Diez D., and Quinto-Alemany, C.-D. (2017). ‘Impact
assessment of electric vehicles on islands grids: a case study for Tenerife (Spain)’, Energy 120:
385–96.
Daki, H., El Hannani, A., Aqqal, A., Haidine, A., and Dahbi, A. (2017). ‘Big Data management in smart
grid: concepts, requirements and implementation’, Journal of Big Data, 4(1), 13.
http://doi.org/10.1186/s40537-017-0070-y.
EPRI (2014) ‘The integrated grid: realizing the full value of central and distributed energy resources’
Electric Power Research Institute, February 2014.
https://energy.gov/sites/prod/files/2015/03/f20/EPRI%20Integrated%20Grid021014_0.pdf.
ENA (2017) “Electricity Network Innovation Strategy” Energy Networks Association, 17th November
2017, retrieved from:
http://www.energynetworks.org/assets/files/electricity/futures/network_innovation/electricity_net
work_innovation_strategy/Electricity%20Network%20Innovation%20Strategy%20v3.0.pdf.
ENTSO-E (2017). Statistical Factsheet 2016. Retrieved from
https://www.entsoe.eu/Documents/Publications/Statistics/Factsheet/entsoe_sfs_2016_web.pdf.
Energy Institute (2017) ‘A Comparison of New Electric Utility Business Models,’ Lyndon B. Johnson
School of Public Affairs, Policy Research Project Report Number 191, Energy Institute of the
University of Texas. https://energy.utexas.edu/files/2017/04/UT-
Austin_FCe_UtilityBusModels_2017.pdf.
European Commission (2015). Energy Union Package: A Framework Strategy for a Resilient Energy
Union with a Forward-Looking Climate Change Policy. http://eur-
lex.europa.eu/resource.html?uri=cellar:1bd46c90-bdd4-11e4-bbe1-
01aa75ed71a1.0001.03/DOC_1&format=PDF.
Eurelectric (2016) ‘Innovation incentives for DSOs – a must in the new energy market development’,
July 2016. Retrieved from: www.eurelectric.org/media/285583/innovation_paper-2016-030-
0379-01-e.pdf.
Franck, C. M. (2011). ‘HVDC circuit breakers: A review identifying future research needs’, IEEE
Transactions on Power Delivery, 26(2), 998–1007.
http://doi.org/10.1109/TPWRD.2010.2095889.
Gadde, P. H., Biswal, M., Brahma, S., and Cao, H. (2016). ‘Efficient Compression of PMU Data in
WAMS’, IEEE Transactions on Smart Grid, 7(5), 2406–13.
http://doi.org/10.1109/TSG.2016.2536718.

34
Green, R. C., Wang, L., & Alam, M. (2013). Applications and trends of high performance computing
for electric power systems: Focusing on smart grid. IEEE Transactions on Smart Grid, 4(2),
922–31. http://doi.org/10.1109/TSG.2012.2225646.
Gungor, V. C., & Lambert, F. C. (2006). ‘A survey on communication networks for electric system
automation’, 50(7), 15 May, 877–97, Computer Networks.
http://doi.org/10.1016/j.comnet.2006.01.005.
Holmstrom, B. and Milgrom, P. (1991) “Multitask Principal-Agent Analyses: Incentive Contracts, Asset
Ownership, and Job Design” Journal of Law, Economics, & Organization, Vol. 7, pp. 24-52.
Jamasb, T. and Pollitt, M. (2008). ‘Liberalisation and R&D in network industries: The case of the
electricity industry’, Research Policy, 37(6–7), 995–1008.
Joskow, P. L. (1996). ‘Introducing Competition into Regulated Network Industries: from Hierarchies to
Markets in Electricity’, Industrial and Corporate Change, 5(2), 341–82.
http://doi.org/10.1093/icc/5.2.341.
Künneke, R. W. (2008). ‘Institutional reform and technological practice: The case of electricity’,
Industrial and Corporate Change, 17(2), 233–65. http://doi.org/10.1093/icc/dtn002.
Love J, et al. (2017). ‘The addition of heat pump electricity load profiles to GB electricity demand:
evidence from a heat pump field trial’, Applied Energy, 2017; 204:332–42.
Martin, C. and Wade, W. (2016). ‘America’s Power Grid’, Bloomberg, March. Retrieved from
https://www.bloomberg.com/quicktake/u-s-electrical-grid.
MIT (2011). The Future of the Electric Grid: An Interdisciplinary MIT Study, MIT, Boston. Retrieved
from https://energy.mit.edu/wp-content/uploads/2011/12/MITEI-The-Future-of-the-Electric-
Grid.pdf.
Monti, A., Muscas, C., Ponci, F., Monti, A., Muscas, C., and Ponci, F. (2016). Chapter 1 –
Introduction, in Phasor Measurement Units and Wide Area Monitoring Systems, Academic
Press, 1–8. http://doi.org/10.1016/B978-0-12-804569-5.00001-X.
National Grid (2017). ‘Forecourt thoughts: Mass fast charging of electric vehicles’, Our energy
insights, available online at: http://fes.nationalgrid.com/media/1221/forecourt-thoughts-v10.pdf.
NIST (2017). ‘Transactive Energy: An Overview’, National Institute of Standards and Technology, US
Department of Commerce, https://www.nist.gov/engineering-laboratory/smart-grid/transactive-
energy-overview.
Ofgem (2013) “Electricity Network Innovation Allowance Governance Document “available online at:
https://www.ofgem.gov.uk/sites/default/files/docs/2013/02/electricity-nia-governance-
document.pdf
Ofgem (2017). ‘Network regulation – the RIIO model’, https://www.ofgem.gov.uk/network-regulation-
riio-model [accessed 27 September 2017].
Ofgem (2017b) “Electricity Network Innovation Competition Governance Document” available online:
https://www.ofgem.gov.uk/system/files/docs/2017/07/electricity_network_innovation_competition
_governance_document_version_3.0.pdf.
Parhizi, S., Lotfi, H., Khodaei, A., and Bahramirad, S. (2015). ‘State of the art in research on
microgrids: A review’, IEEE Access, Vol.3, 890–925.
http://doi.org/10.1109/ACCESS.2015.2443119.

35
Peskin, M. A., Powell, P. W., and Hall, E. J. (2012). ‘Conservation Voltage Reduction with feedback
from Advanced Metering Infrastructure’, in Proceedings of the IEEE Power Engineering Society
Transmission and Distribution Conference and Exposition.
http://doi.org/10.1109/TDC.2012.6281644.
Smil, V. (2005). Creating the Twentieth Century: Technical Innovations of 1867–1914 and Their
Lasting Impact, Oxford Scholarship Online. http://doi.org/10.1093/0195168747.001.0001.
Thomas, M.S. and McDonald, J.D. (2015). Power System SCADA and Smart Grids. Power System
SCADA and Smart Grids, CRC Press, April 2015. http://doi.org/10.1201/b18338-1.
Tuttle, D. P., Gülen, G., Hebner, R., King, C. W., Spence, D. B., Andrade, J., Duncan, R. (2016). The
History and Evolution of the U.S. Electricity Industry, (one of the series of White Papers: ‘The
Full Cost of Electricity (FCe-)’), No. UTEI/2016-05-2, The University of Texas at Austin, Energy
Institute. Retrieved from
http://sites.utexas.edu/energyinstitute/files/2016/09/UTAustin_FCe_History_2016.pdf
Tullock, G. (1980). ‘Efficient rent seeking’, in J.M. Buchanan, R.D. Tollison, and G. Tullock, (eds.),
Toward a theory of the rent-seeking society, College Station: Texas A&M Press.
UKRN (2015). ‘Innovation in regulated infrastructure sectors’, Summary Report, The UK Regulators
Network, www.ukrn.org.uk/wp-content/uploads/2016/07/20150112InnovationInRegInfrSec.pdf.
Zidan, A., Khairalla, M., Abdrabou, A. M., Khalifa, T., Shaban, K., Abdrabou, A, Gaouda, A. M. (2016).
‘Fault Detection, Isolation, and Service Restoration in Distribution Systems: State-of-the- Art and
Future Trends’, IEEE Transactions on Smart Grid, 8(5), 2170–85.
http://doi.org/10.1109/TSG.2016.2517620.

36
Appendix
The optimal share and effort for the regulatory model presented in (1):
Owing to the uncertain nature of efficiency gain and innovation activities, the compensation plan of the
firm has some degree of uncertainty. Given the normal distribution of random signal and the shape of
the utility function, the certainty equivalent (CE) of allowed revenue for the firm is:
𝐶𝐸 = 𝛽 + 𝛼𝑇𝑒 − 𝑐(𝑒) −1
2𝑟𝛼𝑇Σ𝛼 (A1)
The certainly equivalent of a lottery 𝑧 is a certain payment that makes an individual indifferent between
lottery 𝑧 and its certainty equivalent 𝐶𝐸 as each gives the same level of utility
𝑢(𝐶𝐸) = 𝐸[𝑢(𝑧)]
𝐸[𝑢(𝑧)] = 𝐸{− exp[−𝑟𝑧 − 𝑐(𝑒)]}
𝐸[𝑢(𝑧)] = 𝐸{− exp[−𝑟(𝛽 + 𝛼𝑇𝑥) − 𝑐(𝑒)]} (A2)
The moment generating function for a multivariate normal variate of 𝑋~𝑁(𝜇, Σ)
𝑀(𝑡) = exp {𝜇′𝑡 +1
2𝑡′Σ𝑡} (A3)
and defining property of moment generating function is 𝐸[𝑒𝑡𝑥] = 𝑀(𝑡).
𝐸[𝑢(𝑧)] = 𝐸{− exp[−𝑟((𝛽 + 𝛼𝑇𝑥) − 𝑐(𝑒))]} = exp (−𝑟𝛽 + 𝑟𝑐(𝑒))𝐸(−𝑟𝛼𝑇𝜀)
𝐸[𝑢(𝑧)] = exp(−𝑟𝛽 − 𝑟𝛼𝑇𝑒 + 𝑟𝑐(𝑒)) exp (−1
2𝑟2𝛼𝑇Σ𝛼)
𝐸[𝑢(𝑧)] = exp (−𝑟𝛽 − 𝑟𝛼𝑇𝑒 + 𝑟𝑐(𝑒) −1
2𝑟2𝛼𝑇Σ𝛼)
𝐸[𝑢(𝑧)] = exp (−𝑟 (𝛽 + 𝛼𝑇𝑒 − 𝑐(𝑒) +1
2𝑟𝛼𝑇Σ𝛼)) (A4)
As we know that:
𝑢(𝐶𝐸) = 𝐸[𝑢(𝑧)] (A5)
Thus 𝐶𝐸 = 𝛽 + 𝛼𝑇𝑒 − 𝑐(𝑒) +1
2𝑟𝛼𝑇Σ𝛼
and for the principal (regulator) the 𝐶𝐸 gain is 𝑒 − 𝛼𝑇𝑒 − 𝛽. Following Holmstrom and Milgrom (1991)
we assume the principal maximises the total certainty equivalent:
𝑀𝑎𝑥𝑒,𝛼{ 𝑒 − 𝑐(𝑒) −1
2𝑟𝛼𝑇Σ𝛼} (A6)
subject to the firm’s incentive compatibility constraint as follows:
𝑀𝑎𝑥𝑒∗ { 𝛼𝑇𝑒 − 𝑐(𝑒)} (A7)
and its individual rationality constraint as in (A8).
𝛽 = 𝐶𝐸 − 𝛼𝑇𝑒 + 𝑐(𝑒) +1
2𝑟𝛼𝑇Σ𝛼 (A8)
The first order condition of (A7) yields: 𝛼𝑖 = 𝑐𝑖(𝑒) ∀ 𝑖 where the subscript 𝑖 on 𝐶 represents a partial
derivative with respect to elements of vector 𝑒. Differentiating the former equation will lead to:
𝜕𝛼
𝜕𝑒= 𝐶𝑖𝑗 and thus
𝜕𝑒
𝜕𝛼= [𝐶𝑖𝑗]−1 (A9)

37
The first order condition for 𝛼𝑇𝑒 − 𝑐(𝑒) is 𝛼𝑇 − 𝑐𝑖(𝑒) which appears as a constraint in the Lagrangian
function of principal maximisation problem.
ℒ = 𝑒 − 𝑐(𝑒) −1
2𝑟𝛼𝑇Σ𝛼 + 𝜇(𝛼𝑇 − 𝑐𝑖(𝑒)) (A10)
𝜕ℒ
𝜕𝛼= 0 −𝑟𝛼𝑇Σ + 𝜇 = 0
𝜕ℒ
𝜕𝑒= 0 𝑒′ − 𝑐𝑖(𝑒) − 𝜇𝐶𝑖𝑗(𝑒) = 0
𝜕ℒ
𝜕𝜇= 0 𝛼𝑇 − 𝑐𝑖(𝑒) = 0
𝑒′ − 𝑐𝑖(𝑒) − 𝑟𝛼𝑇𝐶𝑖𝑗(𝑒∗)Σ = 0
𝑒′ − 𝛼𝑇 − 𝑟𝛼𝑇𝐶𝑖𝑗(𝑒∗)Σ = 0
𝑒′ = 𝛼𝑇[𝐼 + 𝑟𝐶𝑖𝑗(𝑒∗)Σ]
𝛼∗ = (𝐼 + 𝑟[𝐶𝑖𝑗(𝑒∗)]Σ)−1𝑒′ (A11)
Given the shape of the cost function:
𝑐(𝑒1, 𝑒2) =1
2𝜌(𝑒1
2 + 𝑒22) + 𝜃𝑒1𝑒2 (A12)
We can write:
𝐶𝑖𝑗(𝑒∗) = [𝜌 𝜃𝜃 𝜌
]
𝐼 + 𝑟[𝐶𝑖𝑗(𝑒∗)]Σ = [1 00 1
] + [𝑟𝜌 𝑟𝜃𝑟𝜃 𝑟𝜌
] [𝜎1
2 𝜎12
𝜎12 𝜎22 ] = [
1 + 𝑟(𝜌𝜎12 + 𝜃𝜎12) 𝑟(𝜌𝜎12 + 𝜃𝜎2
2)
𝑟(𝜃𝜎12 + 𝜌𝜎12) 1 + 𝑟(𝜃𝜎12 + 𝜌𝜎2
2)]
[𝛼1
∗
𝛼2∗] = [
1 + 𝑟(𝜌𝜎12 + 𝜃𝜎12) 𝑟(𝜌𝜎12 + 𝜃𝜎2
2)
𝑟(𝜃𝜎12 + 𝜌𝜎12) 1 + 𝑟(𝜃𝜎12 + 𝜌𝜎2
2)]
−1
[11
]
[𝛼1
∗
𝛼2∗]
=1
1 + 𝑟(2𝜃𝜎12 + 𝜌𝜎12 + 𝜌𝜎2
2) + 𝑟2(𝜌2 − 𝜃2)(𝜎12𝜎2
2 − 𝜎122 )
[1 + 𝑟(𝜃𝜎12 + 𝜌𝜎2
2) −𝑟(𝜌𝜎12 + 𝜃𝜎22)
−𝑟(𝜃𝜎12 + 𝜌𝜎12) 1 + 𝑟(𝜌𝜎1
2 + 𝜃𝜎12)] [
11
]
[𝛼1
∗
𝛼2∗] =
1
1+𝑟(2𝜃𝜎12+𝜌𝜎12+𝜌𝜎2
2)+𝑟2(𝜌2−𝜃2)(𝜎12𝜎2
2−𝜎122 )
[1 + 𝑟(𝜎2
2 − 𝜎12)(𝜌 − 𝜃)
1 + (𝜎12 − 𝜎12)(𝜌 − 𝜃)
] (A13)
Optimum effort:
Focusing on the interior solution, from the incentive compatibility constraint (ICCs) for the two efforts
one can derive the agent’s decision regarding (𝑒1, 𝑒2):
[𝜌 𝜃𝜃 𝜌
]
𝜕𝑒
𝜕𝛼= [𝐶𝑖𝑗]−1 =
1
𝜌2 − 𝜃2[
𝜌 −𝜃−𝜃 𝜌
]
[𝑒1
∗
𝑒2∗] =
1
𝜌2 − 𝜃2[
𝜌 −𝜃−𝜃 𝜌
] [𝛼1
∗
𝛼2∗]
[𝑒1
∗
𝑒2∗] =
1
𝜌2−𝜃2 [𝜌𝛼1
∗ − 𝜃𝛼2∗
𝜌𝛼2∗ − 𝜃𝛼1
∗] (A14)

38
Solving the model presented in Section 3.2:
Given the setting of the model in Section 3.2, the expected utility of player 𝑖:
𝐸(𝑢𝑖) = 𝑝𝑖𝑢𝑖(𝐼𝑖 + 𝑤𝑖 − 𝑒𝑖) + (1 − 𝑝𝑖)𝑢𝑖(𝐼𝑖 − 𝑒𝑖) (A15)
𝐸(𝑢𝑖) = −[𝑝𝑖 exp(−𝑟𝑖(𝐼𝑖 + 𝑤𝑖 − 𝑒𝑖)) + (1 − 𝑝𝑖) exp(−𝑟𝑖(𝐼𝑖 − 𝑒𝑖))] (A16)
𝑖, 𝑗 ∈ {1,2}
The first order condition for the firm would yield:
𝑝𝑖′ =
𝑟𝑖
1−𝑒−𝑟𝑖𝑤 (𝑝𝑖𝑒−𝑟𝑖𝑤 + 1 − 𝑝𝑖) (A17)
where 𝑝𝑖′ =
𝜕𝑝𝑖
𝜕𝑒𝑖≥ 0.
𝑝𝑖 =𝜆𝑖𝑒𝑖
𝜆1𝑒1 + 𝜆2𝑒2
𝜕𝑝1
𝜕𝑒1
=𝜆1𝜆2𝑒2
(𝜆1𝑒1 + 𝜆2𝑒2)2
𝜕𝑝2
𝜕𝑒2
=𝜆1𝜆2𝑒1
(𝜆1𝑒1 + 𝜆2𝑒2)2
Setting 𝑠(𝑟𝑖) =𝑟𝑖
1−𝑒−𝑟𝑖𝑤, the ratio of first order condition for two firms leads to the following equation:
𝜕𝑝1𝜕𝑒1𝜕𝑝2𝜕𝑒2
=𝑟1
1−𝑒−𝑟1𝑤𝑟2
1−𝑒−𝑟2𝑤
(𝑝1𝑒−𝑟1𝑤+1−𝑝1)
(𝑝2𝑒−𝑟2𝑤+1−𝑝2)
𝑒2
𝑒1=
𝑟11−𝑒−𝑟1𝑤
𝑟21−𝑒−𝑟2𝑤
(𝑝1𝑒−𝑟1𝑤+1−𝑝1)
(𝑝2𝑒−𝑟2𝑤+1−𝑝2) (A18)
On the other hand, we know that:
𝑝2
𝑝1
=𝜆2
𝜆1
(𝑒2
𝑒1
)
And by substituting for 𝑒2
𝑒1 in (A18) we can write:
𝜆1𝑞
𝜆2=
𝑠(𝑟1)
𝑠(𝑟2)
(𝑒−𝑟1𝑤+𝑞)
(𝑞𝑒−𝑟2𝑤+1) (A19)
where 𝑞 =𝑝2
𝑝1 is the competitive balance of the competition, and depending whether 𝑞 < 1, 𝑞 > 1, or 𝑞 =
1, the wining probability of firm one is higher than two, lower than two, or the contest is even. Solving
(A19) for 𝑞 leads to the following:
𝑞 = √𝜆2𝑠(𝑟1)𝑒−𝑟1𝑤
𝜆1𝑠(𝑟2)𝑒−𝑟2𝑤 + (𝜆1𝑠(𝑟2)−𝜆2𝑠(𝑟1)
2𝑠(𝑟2)𝑒−𝑟2𝑤 )2 – (𝜆1𝑠(𝑟2)−𝜆2𝑠(𝑟1)
2𝜆1𝑠(𝑟2)𝑒−𝑟2𝑤 ) (A20)
The ratio of optimum effort for two firms can be presented as in (A21).

39
𝑒2
𝑒1
=𝑠(𝑟1)
𝑠(𝑟2)
(𝑝1𝑒−𝑟1𝑤 + 1 − 𝑝1)
(𝑝2𝑒−𝑟2𝑤 + 1 − 𝑝2)
𝑒2
𝑒1=
𝑠(𝑟1)
𝑠(𝑟2)
(𝑒−𝑟1𝑤+𝑞)
(𝑞𝑒−𝑟2𝑤+1) (A21)