Embed Size (px)
Citation preview
Journal of Economic Literature 2012, 50(3), 645–680http://dx.doi.org/10.1257/jel.50.3.645
645
1. Introduction
The science section of a U.S. newspa-per routinely features articles on new
surgical and pharmaceutical treatments for cancer, obesity, aging, and cardiovascular diseases, with rosy predictions of expanded
longevity and improved health functioning (Wade 2009). The business section, on the other hand, features gloomy reports of gal-loping health insurance premiums (Claxton et al. 2010), declining insurance coverage, and unsustainable Medicare and Medicaid growth leading to higher taxes (Leonhardt
Technology Growth and Expenditure Growth in Health Care
Amitabh Chandra and Jonathan Skinner*
In the United States, health care technology has contributed to rising survival rates, yet health care spending relative to GDP has also grown more rapidly than in any other country. We develop a model of patient demand and supplier behavior to explain these parallel trends in technology growth and cost growth. We show that health care productivity depends on the heterogeneity of treatment effects across patients, the shape of the health production function, and the cost structure of procedures such as MRIs with high fixed costs and low marginal costs. The model implies a typology of medical technology productivity: (I) highly cost-effective “home run” innovations with little chance of overuse, such as anti-retroviral therapy for HIV, (II) treatments highly effective for some but not for all (e.g., stents), and (III) “gray area” treatments with uncertain clinical value such as ICU days among chronically ill patients. Not surprisingly, countries adopting Category I and effective Category II treatments gain the greatest health improvements, while countries adopting ineffective Category II and Category III treatments experience the most rapid cost growth. Ultimately, economic and political resistance in the United States to ever-rising tax rates will likely slow cost growth, with uncertain effects on technology growth. (JEL H51, I11, I18, O31)
* Chandra: Harvard University and NBER. Skinner: Dartmouth College and NBER. This research was funded by the National Institute of Aging NIA P01 AG19783 and the Robert Wood Johnson Foundation. We thank David Balan, Michael Chernew, Janet Currie, David Cutler, Alan Garber, Dana Goldman, Elliott Fisher, Victor Fuchs, Roger Gordon, Daniel Lawver, Ellen Meara, Joseph Newhouse,
Gabriel Scheffler, Mark Schlesinger, Zirui Song, Douglas Staiger, Jack Wennberg, seminar participants at the University of Washington, Dartmouth, RAND, Wharton, University of California–Berkeley, Harvard, MIT, NBER, Yale, and two anonymous referees for insightful comments, and Kathy Stroffolino for research assistance. The opinions in this paper are those of the authors and should not be attributed to the NIA or the NBER.
Journal of Economic Literature, Vol. L (September 2012)646
2009) and downgraded U.S. debt (Stein 2006). Not surprisingly, there is some ambiguity as to whether these two trends, in outcomes and in expenditures, are a cause for celebration or concern.
Economists and other observers often point to technology growth as the source of both trends. Newhouse (1992) considered a wide variety of factors that could reason-ably have caused the rapid growth in health care expenditures, such as an aging popula-tion or the expansion of health insurance, and concluded that only technology growth could explain the vast majority of expendi-ture growth. Similarly, Cutler (2004) has argued that technological advances have generated both the far-reaching advances in longevity and the rapid growth in costs.1 Unfortunately, simply attaching the label of “technological growth” as the major cause of increases in health care expenditures doesn’t get us much closer to understanding either the pathology of the disease—if it is a disease—or a meaningful way to address the problem—if it is a problem. Thus the principal focus of the paper is to better understand technological growth in health care and its impact on cost-growth and pro-ductivity improvements.
As a first step, we develop a demand-side model of health care and, like Hall and Jones (2007), show that rising income levels can optimally generate rapid growth in health care costs in a model with well-functioning private insurance markets. But we also show that a rising role of govern-ment financing in health care can attenuate optimal growth as marginal tax rates rise. We then complete the supply side with a parsimonious model of physician behavior, anchored by the assumption that physicians want to do everything in their power to cure
1 Cutler (2004) writes, “Money matters in health care as it does in few other industries. Where we have spent a lot, we have received a lot in return” (xiv).
their patient, given financial, ethical, and resource constraints.
The model is then used to distin-guish among three general categories of treatments, ranked in order of their contri-bution to health care productivity, defined as the improvement in health outcomes per dollar increase in costs. (These three categories closely parallel the Wennberg, Fisher, and Skinner [2002] categorizations of effective, preference-sensitive, and sup-ply-sensitive care.) We find that the great-est health contribution occurs for low cost but highly effective treatments: antibiotics for bacterial infection, or aspirin and beta-blockers for heart attack patients. Highly productive innovations may be expen-sive—for example, anti-retroviral drugs for the treatment of people with HIV/AIDS. But the key to the high average productiv-ity of these expensive drugs is a strongly negative second derivative of the survival (or production) function, so that benefits quickly turn negative for non-HIV-infected patients. Thus, few patients are treated in a cost-ineffective way, whether because of serious adverse effects (as in the case of anti- retrovirals) or because the treatments are so inexpensive (in the case of aspirin for heart attacks).
A second broad category of medical tech-nologies includes treatments and procedures whose benefits are substantial for at least some patients, but where the second deriva-tive of the survival function is small in magni-tude, meaning there is a large population of potential patients for whom health benefits converge toward zero as costs accumulate. Angioplasties with stents are a good example. In this procedure, a catheter is used to free blockages in the heart, and the stent, a wire mesh, is inserted to maintain blood flow. For heart attack patients treated within the first twelve hours following the heart attack, the benefits of stents are substantial. But there are many more patients where the value of
647Chandra and Skinner: Technology Growth and Expenditure Growth in Health Care
angioplasty is less clear, for example among those with stable angina, or among those with little taste for the inherent risk of sur-gery. Because there are more people in the latter category than in the former and the U.S. health care system compensates gener-ously for all procedures, the marginal health benefits of this innovation are driven to zero and average productivity is diminished substantially.
The third treatment category of techno-logical innovations encompasses those treat-ments for which benefits are small or there is little scientific evidence of their value. This wide category includes treatments for which randomized trials indicate no benefit (vertebroplasty, in which cement is injected to stabilize vertebrae), as well as procedures whose effectiveness has not been evaluated (intensity-modulated radiation therapy for prostate cancer). There are also many decisions in this category that are made for the management of chronic illness. Few randomized trials have been conducted to evaluate when pneumonia patients should be admitted to the hospital, how frequently patients with chronic disease need to see a physician, or whether specialists or primary care physicians can best coordinate and provide high-quality care. Not surprisingly, much of the improved health is generated by our first category of treatments, while much of the cost growth is generated by the third.
To return to our original question, we suggest that it’s not technology per se that causes growth in health care expenditures—it’s the patients with full insurance coverage who demand the latest prosthetic hip. It’s the urologist who installs the latest 64-slice CT scanner in his office. Thus U.S. health care spending as a percentage of GDP has risen rapidly compared to other countries because the reimbursement system encour-ages the widespread diffusion of both old and new technology. This is particularly
true of the U.S. Medicare program that offers generous incentives for more inten-sive care. In some cases, this means that the United States can be the first to enjoy the benefits of as-yet unproven technology. The downside is the widespread use of treat-ments with unproven value, and the scar-city of cost-saving innovations (Nelson et al. 2009).
What are the implications for the future? In a classic 1991 article, Weisbrod sug-gested that the then-new Medicare pro-spective payment system would provide incentives to develop cost-saving technolo-gies. His prediction may have been prema-ture, but there is increasing evidence of the potential for cost-saving technologies (with equivalent or better outcomes) in the man-agement and organization of health care to yield substantial productivity gains. But these types of innovations are unlikely to diffuse widely through the U.S. health care system until there are much stronger incen-tives to do so. Whether U.S. health care reform can change these incentives remains to be seen. But ultimately, the growth in health care spending may be limited by the shrinking ability of private insurance mar-kets and tax revenues to finance ever-rising health care bills.
2. Empirical Patterns of Health Care Costs and Outcomes
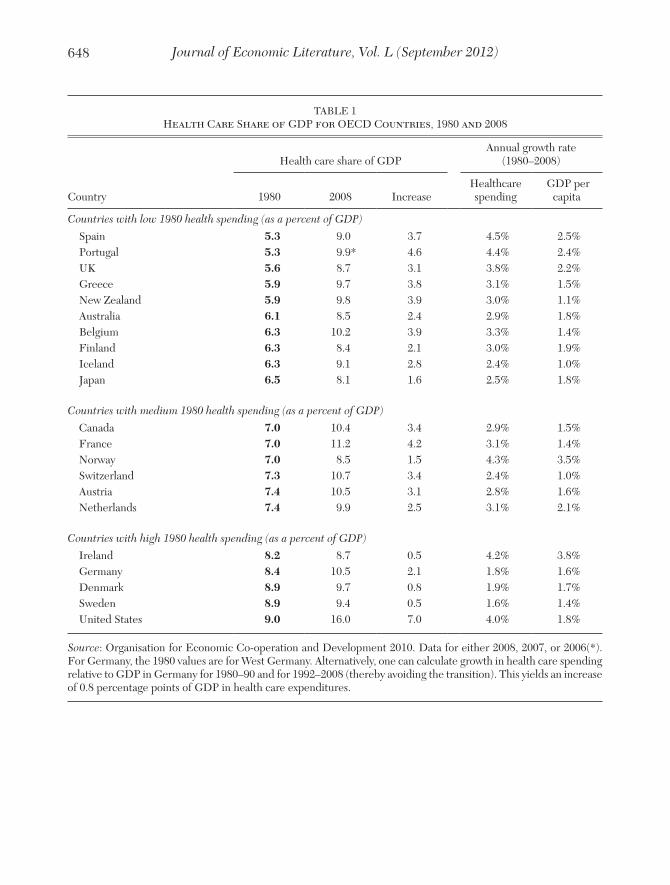
It is well understood that the United States is an outlier with respect to health care spending, whether on a per capita dol-lar basis, or with respect to the share of GDP devoted to health care, which in 2009 was 17.6 percent. But is the United States also an outlier with respect to growth in health care spending?
This question is considered in more detail using a comprehensive sample of twenty-one developed countries (table 1) and a smaller
Journal of Economic Literature, Vol. L (September 2012)648
TABLE 1 Health Care Share of GDP for OECD Countries, 1980 and 2008
Health care share of GDPAnnual growth rate
(1980–2008)
Country 1980 2008 Increase Healthcare spending
GDP per capita
Countries with low 1980 health spending (as a percent of GDP)
Spain 5.3 9.0 3.7 4.5% 2.5% Portugal 5.3 9.9* 4.6 4.4% 2.4% UK 5.6 8.7 3.1 3.8% 2.2% Greece 5.9 9.7 3.8 3.1% 1.5% New Zealand 5.9 9.8 3.9 3.0% 1.1% Australia 6.1 8.5 2.4 2.9% 1.8% Belgium 6.3 10.2 3.9 3.3% 1.4% Finland 6.3 8.4 2.1 3.0% 1.9% Iceland 6.3 9.1 2.8 2.4% 1.0% Japan 6.5 8.1 1.6 2.5% 1.8%
Countries with medium 1980 health spending (as a percent of GDP)
Canada 7.0 10.4 3.4 2.9% 1.5% France 7.0 11.2 4.2 3.1% 1.4% Norway 7.0 8.5 1.5 4.3% 3.5% Switzerland 7.3 10.7 3.4 2.4% 1.0% Austria 7.4 10.5 3.1 2.8% 1.6% Netherlands 7.4 9.9 2.5 3.1% 2.1%
Countries with high 1980 health spending (as a percent of GDP)
Ireland 8.2 8.7 0.5 4.2% 3.8% Germany 8.4 10.5 2.1 1.8% 1.6% Denmark 8.9 9.7 0.8 1.9% 1.7% Sweden 8.9 9.4 0.5 1.6% 1.4% United States 9.0 16.0 7.0 4.0% 1.8%
Source: Organisation for Economic Co-operation and Development 2010. Data for either 2008, 2007, or 2006(*). For Germany, the 1980 values are for West Germany. Alternatively, one can calculate growth in health care spending relative to GDP in Germany for 1980–90 and for 1992–2008 (thereby avoiding the transition). This yields an increase of 0.8 percentage points of GDP in health care expenditures.
649Chandra and Skinner: Technology Growth and Expenditure Growth in Health Care
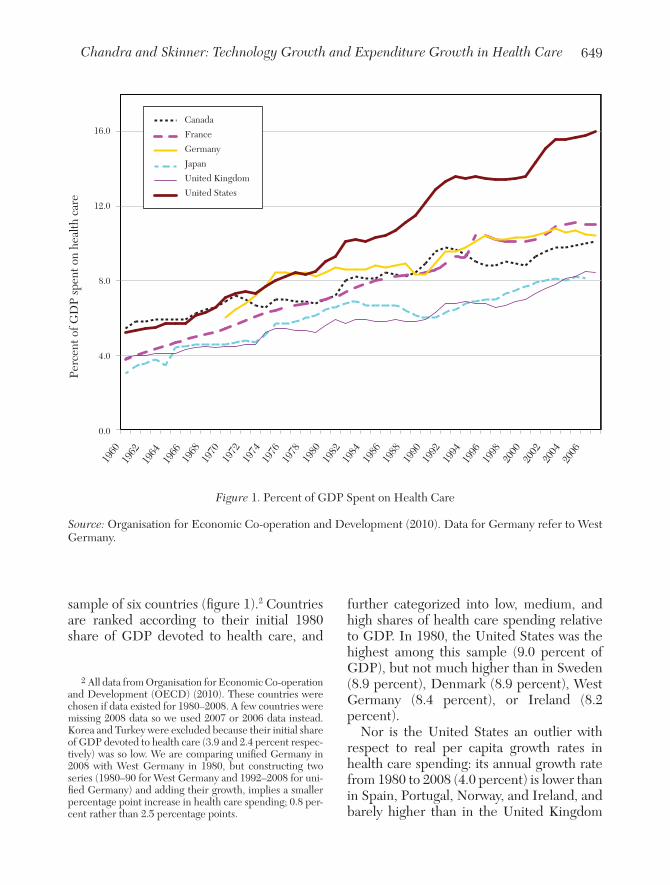
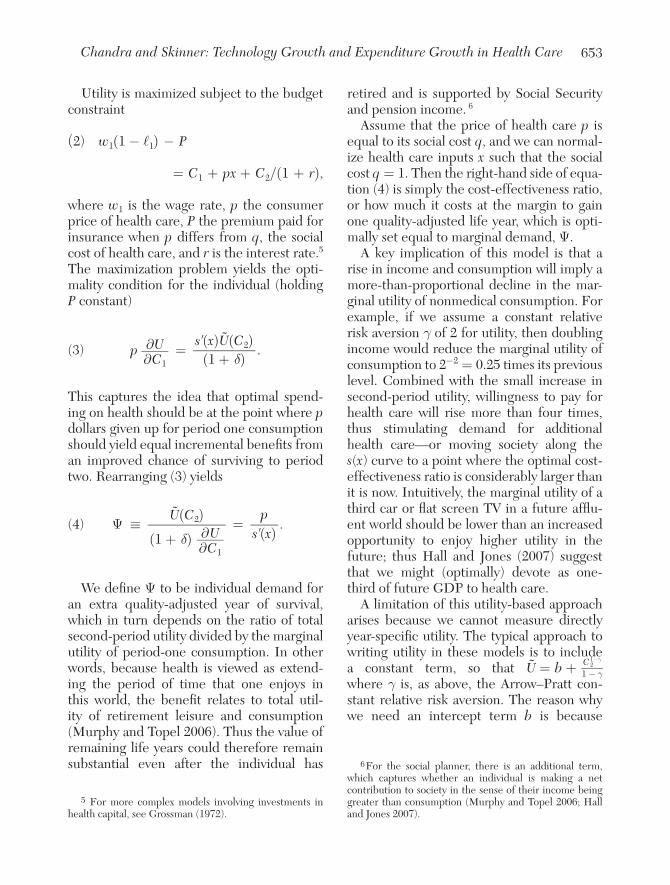
sample of six countries (figure 1).2 Countries are ranked according to their initial 1980 share of GDP devoted to health care, and
2 All data from Organisation for Economic Co-operation and Development (OECD) (2010). These countries were chosen if data existed for 1980–2008. A few countries were missing 2008 data so we used 2007 or 2006 data instead. Korea and Turkey were excluded because their initial share of GDP devoted to health care (3.9 and 2.4 percent respec-tively) was so low. We are comparing unified Germany in 2008 with West Germany in 1980, but constructing two series (1980–90 for West Germany and 1992–2008 for uni-fied Germany) and adding their growth, implies a smaller percentage point increase in health care spending; 0.8 per-cent rather than 2.5 percentage points.
further categorized into low, medium, and high shares of health care spending relative to GDP. In 1980, the United States was the highest among this sample (9.0 percent of GDP), but not much higher than in Sweden (8.9 percent), Denmark (8.9 percent), West Germany (8.4 percent), or Ireland (8.2 percent).
Nor is the United States an outlier with respect to real per capita growth rates in health care spending: its annual growth rate from 1980 to 2008 (4.0 percent) is lower than in Spain, Portugal, Norway, and Ireland, and barely higher than in the United Kingdom
Perc
ent o
f GD
P sp
ent o
n he
alth
car
e
16.0
12.0
8.0
4.0
0.0
1960
1962
1964
1966
1968
1970
1972
1974
1976
1978
1980
1982
1984
1986
1988
1990
1992
1994
1996
1998
2000
2002
2004
2006
Canada
France
Germany
Japan
United Kingdom
United States
Figure 1. Percent of GDP Spent on Health Care
Source: Organisation for Economic Co-operation and Development (2010). Data for Germany refer to West Germany.
Journal of Economic Literature, Vol. L (September 2012)650
(3.8 percent).3 Similarly, its 1.8 percent annual rate growth in real per capita GDP is roughly average among the sample of twenty-one countries.
But the United States is an outlier with respect to growth in the share of GDP devoted to health care: a growth of 7 per-centage points (from 9 to 16 percent of GDP) between 1980 and 2008, well above the average of the other OECD countries (2.7 percentage points) and the next-highest country, Portugal (4.6 percentage points). As table 1 shows, the United States particularly stands out among the countries with initially high 1980 health spending: average growth in the share of GDP devoted to health care in Sweden, Denmark, and Germany is less than one percentage point. Price differences may explain a portion of intercountry spending differences at a point in time (Anderson et al. 2003), but we do not think that U.S. price growth explains the more rapid increase in the U.S. share of health spending.
It is useful to at least check that U.S. sur-vival rates didn’t grow faster than the coun-tries with the slower-growing health care sectors. Garber and Skinner (2008) find that, over time, U.S. life expectancy growth has lagged behind a sample of five benchmark European countries. And while Preston and Ho (2009) have suggested that different trends in health behavior can explain these lagging U.S. mortality rates, Muennig and Glied (2010) find slower U.S. survival growth even after adjusting for smoking behavior and obesity trends.
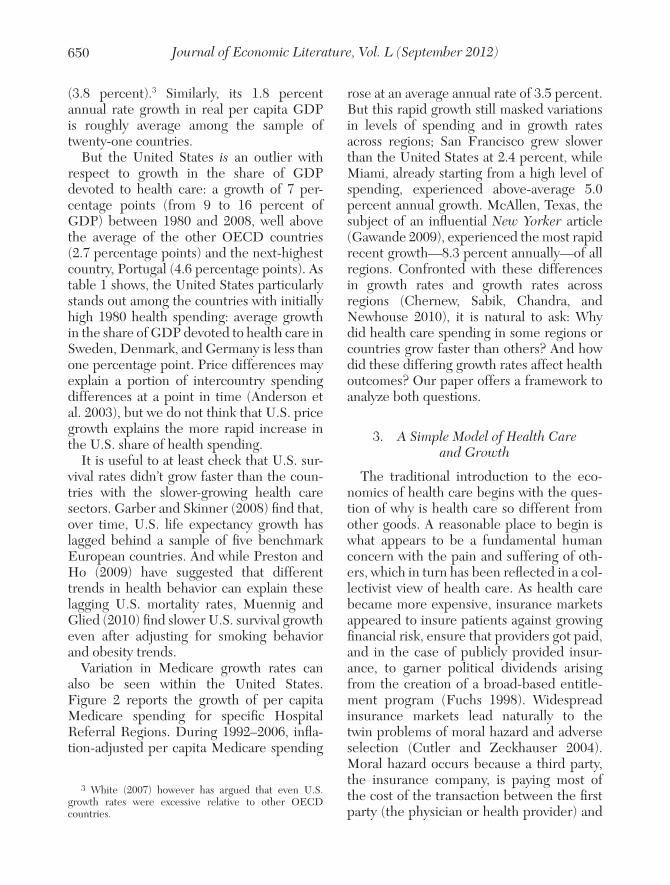
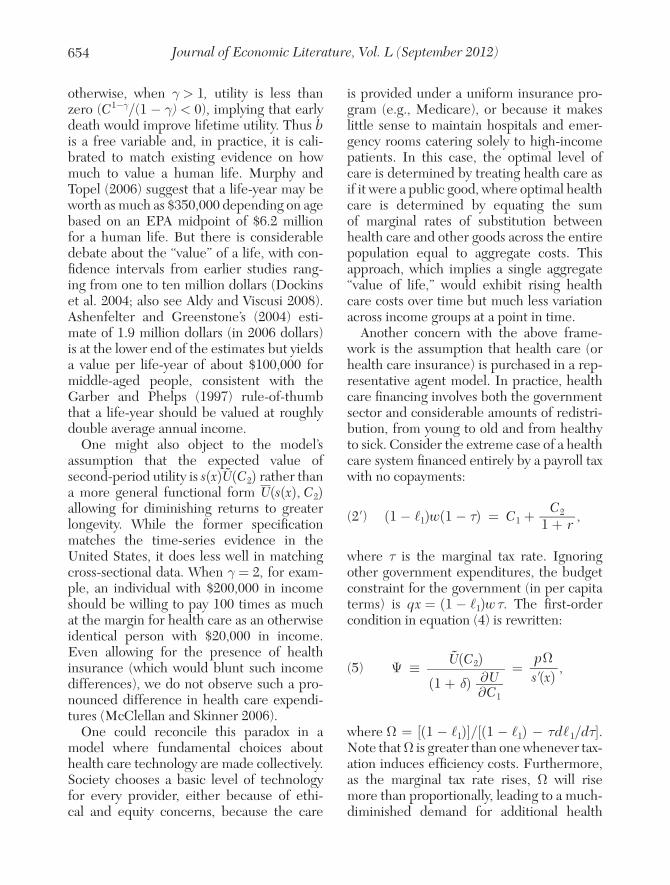
Variation in Medicare growth rates can also be seen within the United States. Figure 2 reports the growth of per capita Medicare spending for specific Hospital Referral Regions. During 1992–2006, infla-tion-adjusted per capita Medicare spending
3 White (2007) however has argued that even U.S. growth rates were excessive relative to other OECD countries.
rose at an average annual rate of 3.5 percent. But this rapid growth still masked variations in levels of spending and in growth rates across regions; San Francisco grew slower than the United States at 2.4 percent, while Miami, already starting from a high level of spending, experienced above-average 5.0 percent annual growth. McAllen, Texas, the subject of an influential New Yorker article (Gawande 2009), experienced the most rapid recent growth—8.3 percent annually—of all regions. Confronted with these differences in growth rates and growth rates across regions (Chernew, Sabik, Chandra, and Newhouse 2010), it is natural to ask: Why did health care spending in some regions or countries grow faster than others? And how did these differing growth rates affect health outcomes? Our paper offers a framework to analyze both questions.
3. A Simple Model of Health Care and Growth
The traditional introduction to the eco-nomics of health care begins with the ques-tion of why is health care so different from other goods. A reasonable place to begin is what appears to be a fundamental human concern with the pain and suffering of oth-ers, which in turn has been reflected in a col-lectivist view of health care. As health care became more expensive, insurance markets appeared to insure patients against growing financial risk, ensure that providers got paid, and in the case of publicly provided insur-ance, to garner political dividends arising from the creation of a broad-based entitle-ment program (Fuchs 1998). Widespread insurance markets lead naturally to the twin problems of moral hazard and adverse selection (Cutler and Zeckhauser 2004). Moral hazard occurs because a third party, the insurance company, is paying most of the cost of the transaction between the first party (the physician or health provider) and
651Chandra and Skinner: Technology Growth and Expenditure Growth in Health Care
the second party (the patient). This can lead to individuals not taking sufficient precau-tion against illness, or more commonly, it can cause patients and providers to con-sume and provide “too much” health care (Newhouse and the Insurance Experiment Group 1993).
Adverse selection can occur on both sides of the market. Insurance companies struc-ture contracts in a way to attract low-risk enrollees away from other firms, for example by offering managed care options that are most appealing to healthy enrollees. Adverse selection can also occur on the consumer
1992
1994
1996
1998
2000
2002
2004
2006
18,000
16,000
14,000
12,000
10,000
8,000
6,000
4,000
2,000
0
1993
1995
1997
1999
2001
2003
2005
Miami
San Francisco
East Long Island
McAllen, TX
Salem
U.S. average
Figure 2. Variations in Medicare Expenditure Growth, Selected Hospital Referral Regions 1992–2006
Source: Dartmouth Atlas of Healthcare (www.dartmouthatlas.org). Estimates are age, sex, and race adjusted, drawn from the 5 percent Continuous Medicare History Survey, and adjusted by the GDP implicit price defla-tor, with all prices in 2006 dollars.
Journal of Economic Literature, Vol. L (September 2012)652
side of the market, for example when people with higher expectations of poor health buy long-term care insurance (Finkelstein and McGarry 2006).
A third issue that arises in health care is the principal–agent problem; that because of asymmetric information, the physician is making decisions on behalf of the patient, leading to decisions that accommodate physician interests. This is the basis for a long-standing debate over the existence of “supplier-induced demand,” a literature extending back several decades that seeks to find evidence of physicians acting in their interest—to shift out demand for their ser-vices—even when it may harm, at least financially, the patient (McGuire 2000).
While each of these three issues is clearly important for health care policy, they are not equally important in explaining the twin growth rates in technological progress and health care costs. We are less concerned with the adverse-selection problem since rapid growth in spending occurs even in set-tings where adverse selection issues are less important, such as Medicare which covers nearly every elderly American. Rather, we argue that the combination of moral hazard and the principal–agent problem has pro-vided fertile ground for the particularly rapid growth in health care costs.
In our analysis, we are not thinking as much of the traditional (static) moral haz-ard problem, since typical estimates of price elasticity cannot explain more than a tiny fraction of the overall growth in health care costs (Newhouse 1992; Manning et al. 1987). The more important role of insur-ance is in financing the dramatic growth in health care expenditures through innova-tion and the rapid diffusion of technology (Finkelstein 2007). This view has its anteced-ents in Weisbrod’s (1991) classic article argu-ing that the structure of insurance coverage was an integral part of rapid cost growth. The intuition is straightforward: if you pay for it,
they will build it. This paper seeks to retain the spirit of Weisbrod’s insights as we next develop a simple model of demand (con-sumer) and supply (provider) decisions to characterize the process of growth in tech-nology and expenditures.
3.1 The Demand for Health Care
We develop intuition from the demand-side models in Hall and Jones (2007) and Murphy and Topel (2006) by collapsing the structure to a two-period model of consump-tion and leisure, where a consumer’s utility is based on consumption and leisure in the first period, and postretirement consumption in the second period.
The probability of surviving to the second period, s(x), is in turn is influenced by medi-cal spending x:
(1) V = U( C 1 , ℓ 1 ) + s(x) ̃
U ( C 2 ) _ 1 + δ ,
where Ci is consumption in period i, ℓ1 is leisure in period 1 (and retiree leisure is subsumed in the second-period utility func-tion ˜
U ), δ is the discount rate, x measures
health care inputs, and the survival function is concave, so that s′(x) ≥ 0, s′′ < 0.4 More generally, s may be viewed as a “quality of life” indicator that reflects both survival and functioning since it augments second-period consumption and leisure. Measuring quality of life, and not simply survival, is important in assessing the productivity of new innova-tions. Hip replacements, knee replacements, and back surgery for spinal stenosis are all procedures that improve the quality and not the quantity of life.
4 When the s(x) function is nonconcave, the presence of health insurance can also have a first-order impact on util-ity (Nyman 1999). This occurs in the case where insurance allows low income individuals to receive, say, a $100,000 bone marrow transplant for which there is no reasonable alternative that is slightly less effective but lower cost.
653Chandra and Skinner: Technology Growth and Expenditure Growth in Health Care
Utility is maximized subject to the budget constraint
(2) w 1 (1 − ℓ 1 ) − P
= C 1 + px + C 2 /(1 + r),
where w1 is the wage rate, p the consumer price of health care, P the premium paid for insurance when p differs from q, the social cost of health care, and r is the interest rate.5 The maximization problem yields the opti-mality condition for the individual (holding P constant)
(3) p ∂ U _ ∂ C 1 = s′(x) ̃
U ( C 2 ) _ (1 + δ) .
This captures the idea that optimal spend-ing on health should be at the point where p dollars given up for period one consumption should yield equal incremental benefits from an improved chance of surviving to period two. Rearranging (3) yields
(4) Ψ ≡ ̃
U ( C 2 ) _ (1 + δ) ∂ U _ ∂ C 1
=
p _
s′(x) .
We define Ψ to be individual demand for an extra quality-adjusted year of survival, which in turn depends on the ratio of total second-period utility divided by the marginal utility of period-one consumption. In other words, because health is viewed as extend-ing the period of time that one enjoys in this world, the benefit relates to total util-ity of retirement leisure and consumption (Murphy and Topel 2006). Thus the value of remaining life years could therefore remain substantial even after the individual has
5 For more complex models involving investments in health capital, see Grossman (1972).
retired and is supported by Social Security and pension income. 6
Assume that the price of health care p is equal to its social cost q, and we can normal-ize health care inputs x such that the social cost q = 1. Then the right-hand side of equa-tion (4) is simply the cost-effectiveness ratio, or how much it costs at the margin to gain one quality-adjusted life year, which is opti-mally set equal to marginal demand, Ψ.
A key implication of this model is that a rise in income and consumption will imply a more-than-proportional decline in the mar-ginal utility of nonmedical consumption. For example, if we assume a constant relative risk aversion γ of 2 for utility, then doubling income would reduce the marginal utility of consumption to 2−2 = 0.25 times its previous level. Combined with the small increase in second-period utility, willingness to pay for health care will rise more than four times, thus stimulating demand for additional health care—or moving society along the s(x) curve to a point where the optimal cost-effectiveness ratio is considerably larger than it is now. Intuitively, the marginal utility of a third car or flat screen TV in a future afflu-ent world should be lower than an increased opportunity to enjoy higher utility in the future; thus Hall and Jones (2007) suggest that we might (optimally) devote as one-third of future GDP to health care.
A limitation of this utility-based approach arises because we cannot measure directly year-specific utility. The typical approach to writing utility in these models is to include a constant term, so that ˜
U = b + C 2 1−γ
___ 1 − γ where γ is, as above, the Arrow–Pratt con-stant relative risk aversion. The reason why we need an intercept term b is because
6 For the social planner, there is an additional term, which captures whether an individual is making a net contribution to society in the sense of their income being greater than consumption (Murphy and Topel 2006; Hall and Jones 2007).
Journal of Economic Literature, Vol. L (September 2012)654
otherwise, when γ > 1, utility is less than zero (C1−γ/(1 − γ) < 0), implying that early death would improve lifetime utility. Thus b is a free variable and, in practice, it is cali-brated to match existing evidence on how much to value a human life. Murphy and Topel (2006) suggest that a life-year may be worth as much as $350,000 depending on age based on an EPA midpoint of $6.2 million for a human life. But there is considerable debate about the “value” of a life, with con-fidence intervals from earlier studies rang-ing from one to ten million dollars (Dockins et al. 2004; also see Aldy and Viscusi 2008). Ashenfelter and Greenstone’s (2004) esti-mate of 1.9 million dollars (in 2006 dollars) is at the lower end of the estimates but yields a value per life-year of about $100,000 for middle-aged people, consistent with the Garber and Phelps (1997) rule-of-thumb that a life-year should be valued at roughly double average annual income.
One might also object to the model’s assumption that the expected value of second-period utility is s(x) ̃
U ( C 2 ) rather than
a more general functional form _
U (s(x), C 2 ) allowing for diminishing returns to greater longevity. While the former specification matches the time-series evidence in the United States, it does less well in matching cross-sectional data. When γ = 2, for exam-ple, an individual with $200,000 in income should be willing to pay 100 times as much at the margin for health care as an otherwise identical person with $20,000 in income. Even allowing for the presence of health insurance (which would blunt such income differences), we do not observe such a pro-nounced difference in health care expendi-tures (McClellan and Skinner 2006).
One could reconcile this paradox in a model where fundamental choices about health care technology are made collectively. Society chooses a basic level of technology for every provider, either because of ethi-cal and equity concerns, because the care
is provided under a uniform insurance pro-gram (e.g., Medicare), or because it makes little sense to maintain hospitals and emer-gency rooms catering solely to high-income patients. In this case, the optimal level of care is determined by treating health care as if it were a public good, where optimal health care is determined by equating the sum of marginal rates of substitution between health care and other goods across the entire population equal to aggregate costs. This approach, which implies a single aggregate “value of life,” would exhibit rising health care costs over time but much less variation across income groups at a point in time.
Another concern with the above frame-work is the assumption that health care (or health care insurance) is purchased in a rep-resentative agent model. In practice, health care financing involves both the government sector and considerable amounts of redistri-bution, from young to old and from healthy to sick. Consider the extreme case of a health care system financed entirely by a payroll tax with no copayments:
(2′ ) (1 − ℓ 1 )w(1 − τ) = C 1 + C 2 _ 1 + r ,
where τ is the marginal tax rate. Ignoring other government expenditures, the budget constraint for the government (in per capita terms) is q x = (1 − ℓ 1 )w τ. The first-order condition in equation (4) is rewritten:
(5) Ψ ≡ ˜
U ( C 2 ) _ (1 + δ) ∂ U _ ∂ C 1
=
p Ω _
s′(x) ,
where Ω = [(1 − ℓ 1 )]/[(1 − ℓ 1 ) − τ d ℓ 1 /dτ]. Note that Ω is greater than one whenever tax-ation induces efficiency costs. Furthermore, as the marginal tax rate rises, Ω will rise more than proportionally, leading to a much-diminished demand for additional health
655Chandra and Skinner: Technology Growth and Expenditure Growth in Health Care
care.7 Thus, over time, financing constraints could act as an additional brake on health care demand (Baicker and Skinner 2011).
Despite these caveats, the implications of the model are twofold: that relative demand for health care may be expected to increase over time, and that “optimal” growth depends on how health care is financed. We next turn to the supply side of the health care market.
3.2 A Static Model of Provider Behavior
We develop a model of physician and pro-vider behavior based in a standard economic framework, but one which tries to capture what physicians say and do. The model is grounded in a single assumption about behavior:
Health care providers seek to maximize the perceived health of their patient, but may deviate from this goal because of financial incentives, resource capacity, ethical judgment, and patient demand.
That is, the vast majority of physicians and health care providers do their best to improve as many lives as they can.8 While there are always occasional rogue physi-cians who game the system at the expense of patients, 9 most physicians believe that what they are doing is best for their patient, and when unconstrained, say they’ve done
7 As Kaplow (2008) has argued, the diminished demand for health care arises not so much from the distortion of the tax per se, which in theory can be undone by appropri-ate transfers, but because of the increased requirement to redistribute resources across individuals.
8 This model is simpler in many respects than the model in Pauly (1980), where physicians provide two kinds of services (diagnostic and therapeutic), and they may adjust both prices and quality of care (e.g., accuracy of diagnosis) depending on market demand and the extent of competi-tion in the market.
9 For example, two cardiac surgeons in Redding, California, motivated by artificially high payment rates, pulled healthy patients off the golf course for emergency cardiac surgery (Enkoji 2002).
everything possible.10 While there is remark-able heterogeneity in physician beliefs, as we document below, let us for the moment assume that there is a single known survival or “production” function st(xit) for patient i at time t, and that physicians seek to maximize the value of health Ψt st(xit) by driving the marginal value of spending to zero.
In practice, there are both explicit and implicit (or hidden) constraints on health care. In the United States, explicit restrictions are rare, and they are generally restricted to gatekeeper models of health maintenance organizations (HMOs), which may require a second opinion or a sign-off for common medical procedures. Implicit restrictions are more common; the limitations of physicians who only have 24 hours in the day, a lack of diagnostic or surgical facilities (or catheter-ization labs not staffed at night), and queues for the magnetic resonance imaging (MRI) or intensive care unit (ICU) beds. Physicians often do not chafe against these implicit
10 This is illustrated in the following quotation from an ICU physician (Goertz 2004):
Here is an example I have used when teaching medical students and residents: You are taking care of a patient in the ICU. You have done every test and procedure you know to do and have done everything that all the consultants have recommended. I now tell you that you must spend another $5,000 (origi-nally I used $1,000) to improve the patient’s quality of care. What would you do with the money?
By this point the student or resident is in a bit of a quandary because they are not quite sure how to use the additional money. If there were a continuing positive linear relationship, it should be reasonably easy to suggest more things that result in improved patient care. Generally the suggestions are more, or repeated, tests and procedures. I respond to the common answers with a statement that if you do more tests or procedures, you could in fact make the patient worse. How? If you do more tests, all tests have false positives and negatives. How will you use results that contradict earlier tests? With again more tests, and the subsequent potential for much more confusion. If you repeat or do another procedure, how do you interpret the results? Also, procedures generally have potential side effects or complica-tions, so again you have a very high risk of NOT improving quality or outcome with more money.
Journal of Economic Literature, Vol. L (September 2012)656
restrictions or are even aware of them, sim-ply adjusting their “best practice” to the resources they are accustomed to using.
Physicians also care about the income they make. Let income for physician j be defined as
(6) Y jt = m jt W t + π jt x jt − R jt ,
where income comprises two parts: the sal-ary component, equal to Wt (payment per patient) times the number of patients mjt; and the business component; the number of total procedures per physician summed over their I( j) patients, xjt = ∑ i=I( j)
x ijt times
marginal profitability πjt minus fixed costs R jt Note that the price paid by the patient, p, could be quite different from the profitabil-ity of the procedure, π.11
We posit that income Y enters positively in the utility function, but allow as well for a target or reference income Zjt (see Rizzo and Zeckhauser 2003), so the income-based com-ponent of utility is Ω = Ω( Y jt − Z jt ).12 We can either interpret this as a target income “con-straint”—in which case it affects behavior through the Lagrangian—or Ω may instead reflect a conventional utility function, so that the health care provider is assumed to maxi-mize the sum Ψt st(xit) + Ω.
One factor that could affect growth dif-ferentially is the fraction of physician income derived from salary versus business sources. For example, many health care providers in the United States own or lease expensive machinery such as MRIs, 64-slice comput-erized tomography, and robotic surgical machinery. These tend to exhibit high fixed
11 While we maintain a single composite x for inputs, in practice different types of inputs exhibit much differ-ent levels of profitability, for example cardiac procedures are typically very well compensated (Hayes, Pettengill, and Stensland 2007), while others are loss leaders.
12 Target income behavior would be generated by speci-fying that Ω′ is large and positive for Yjt − Zjt < 0, and zero otherwise.
costs R and (at least in the United States) high marginal profit (π) per unit of use, up to their capacity limit; thus both income and substi-tution effects would encourage expanded use. Differences across countries in how new technologies are reimbursed should affect country-specific rates of diffusion.
Capacity constraints are more likely in countries such as the United Kingdom or other countries with centralized financing. In this case, the central health agency has a global budget used to provide inputs to individual hospitals and clinics, for example a certain number of artificial knee or hip joints devices (Aaron and Schwartz 2005). Similarly, some regions may not be allocated as many MRI machines or cardiac catheter-ization units. Typically, physicians adjust implicitly to these constraints, although wait-ing lists for surgery are often the subject of public demonstrations and political con-troversy. Alternatively, the constraint could reflect ethical norms against spending too much of the nation’s resources. Whether implicit or explicit, physicians and hospitals in these cases are operating subject to con-straints, which can be expressed as x jt ≤ X jt .
An implication of the supplier-induced demand model is that physicians will know-ingly harm their patients if they are paid enough to do so. This model, however, assumes that every physician believes their actions will benefit the patient. We there-fore include an additional constraint that the patients treated by physician j must be bet-ter off than the utility level in the absence of the treatment,
_ V jt .13 This is admittedly a
simplistic way to consider the demand side, but it is consistent with empirical evidence (e.g., Jacobson et al. 2010).
13 Note that the constraint that patients are better off does not preclude putting the patient at some risk—for example, plastic surgery carries risks, but the patient pre-fers the treatment. For the sake of simplicity, we assume a representative patient rather than multiple patients each with a binding constraint.
657Chandra and Skinner: Technology Growth and Expenditure Growth in Health Care
At a point in time, the Lagrangian for a given physician is written:
(7) ℑ = Ψ t s t ( x jt ) + Ω( m jt W t + π jt x jt − R jt )
− μ jt ( x jt − _ X jt ) − Φ jt (
_ V jt − V jt ).
The first-order condition for (7) is
(8) Ψ t s t ′ ( x jt ) + ω jt π jt = μ jt − Φ jt v jt ,
where ωjt is the derivative (or shadow price) of Ω, and vjt the total derivative of V with respect to x (including any decline in non-medical consumption as a consequence of purchasing x), evaluated for the jth physician at time t. That is, physicians spend up to the point where the combination of the social marginal value of health or functioning, and the financial reward or penalty, weighted by the importance of such rewards (ω), is lim-ited by a capacity (or knowledge) constraint μ and a demand-side constraint that insures the individual is better off with the treatment than without. It is convenient to define a vari-able λ that summarizes the overall impact of financial incentives, capacity constraints, and demand:
λ ≡ − ω jt π jt + μ jt − Φ jt v jt .
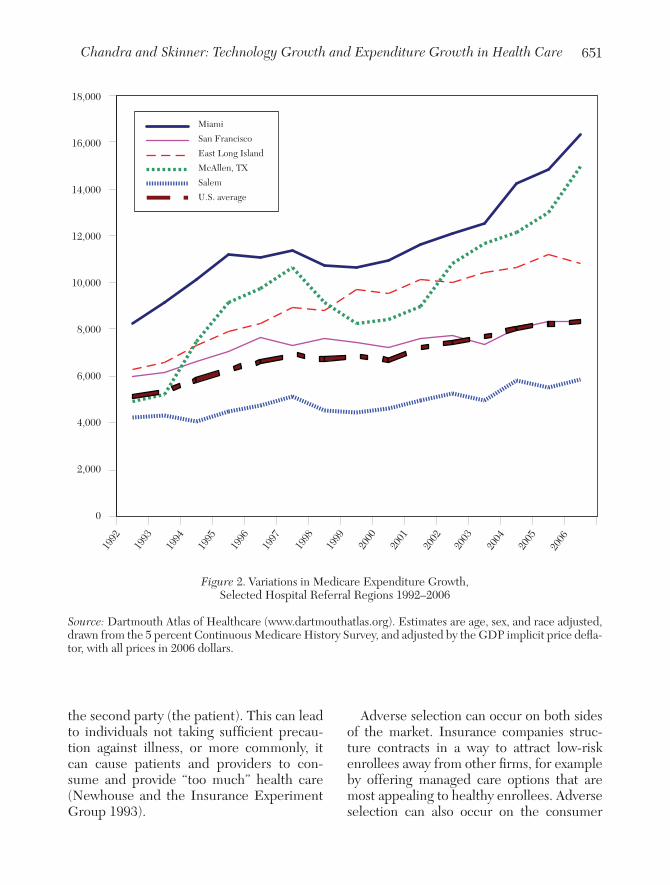
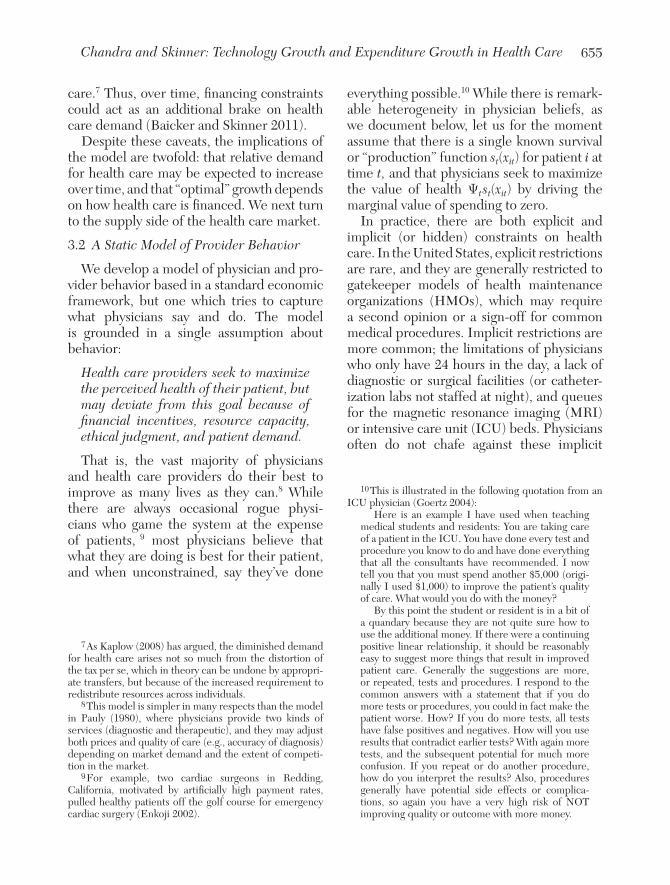
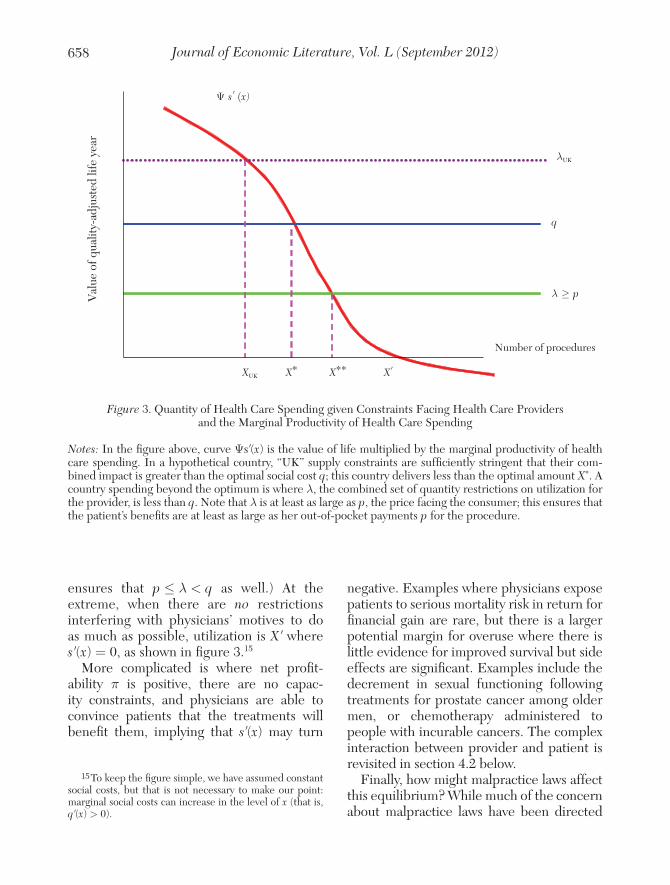
How then are supply and demand equated? Note that demand in equation (4) can be rewritten as Ψt s t ′ (x) = pt (or the price facing the consumer) while the physi-cian sets Ψt s t ′ (x) = λt. Different scenarios are illustrated in figure 3, where the model assumes that physicians are able to allocate treatments to those who would benefit most. In the framework of labor economics, this is the assumption that physicians use a Roy Model to rank patients on the basis of their benefit from a benefit and then work down
that distribution, so the marginal patient is the one with the lowest incremental benefit. This assumption is supported by empirical work for heart attacks (Chandra and Staiger 2007) and for Cesarean sections (Baicker, Buckles, and Chandra 2006).
First consider a hypothetical country arbitrarily labeled “UK” where supply con-straints are sufficiently high to exceed both out-of-pocket costs for most treatments, so that p < λ, but are also high enough so that λ exceeds the social cost q. In this case, there is too little spending on health care. (One might expect private markets to spring up in this case, where wealthy patients demand additional services even at q.) Next, consider the case where individuals face the full price of their health care q, perhaps because they lack insurance or are paying from a health savings account.14 Even when the physician makes money by doing more than the opti-mal, she will still provide at most the opti-mal quantity of health care x * because of the binding constraint that doing more than x * will make the patient worse off. The key assumption here is that the physician acts as an agent of the patient. This assumption will not hold if patients ascribe greater benefits to procedures than is justified by clinical evi-dence or physician beliefs (Rothberg et al. 2010), or if the physician does not always account for patient preferences (Pritchard et al. 1998).
Finally, we consider the more com-mon case in the United States where low out-of-pocket expenses faced by consum-ers coupled with profitable compensation for procedures results in λ < q and hence the conventional overuse of health care, as shown in figure 3. (The constraint that physicians act as the agent of their patients
14 The health savings account involves spending pretax dollars, so these accounts also help to offset preexisting tax distortions (such as the tax on labor supply), thus poten-tially moving the consumer’s choice closer to x * .
Journal of Economic Literature, Vol. L (September 2012)658
ensures that p ≤ λ < q as well.) At the extreme, when there are no restrictions interfering with physicians’ motives to do as much as possible, utilization is X ′ where s′(x) = 0, as shown in figure 3.15
More complicated is where net profit-ability π is positive, there are no capac-ity constraints, and physicians are able to convince patients that the treatments will benefit them, implying that s′(x) may turn
15 To keep the figure simple, we have assumed constant social costs, but that is not necessary to make our point: marginal social costs can increase in the level of x (that is, q′(x) > 0).
negative. Examples where physicians expose patients to serious mortality risk in return for financial gain are rare, but there is a larger potential margin for overuse where there is little evidence for improved survival but side effects are significant. Examples include the decrement in sexual functioning following treatments for prostate cancer among older men, or chemotherapy administered to people with incurable cancers. The complex interaction between provider and patient is revisited in section 4.2 below.
Finally, how might malpractice laws affect this equilibrium? While much of the concern about malpractice laws have been directed
Val
ue o
f qua
lity-
adju
sted
life
yea
r
Number of procedures
λUK
q
λ ≥ p
XUK X* X** X′
Ψ s′ (x)
Figure 3. Quantity of Health Care Spending given Constraints Facing Health Care Providers and the Marginal Productivity of Health Care Spending
Notes: In the figure above, curve Ψs′(x) is the value of life multiplied by the marginal productivity of health care spending. In a hypothetical country, “UK” supply constraints are sufficiently stringent that their com-bined impact is greater than the optimal social cost q; this country delivers less than the optimal amount X*. A country spending beyond the optimum is where λ, the combined set of quantity restrictions on utilization for the provider, is less than q. Note that λ is at least as large as p, the price facing the consumer; this ensures that the patient’s benefits are at least as large as her out-of-pocket payments p for the procedure.
659Chandra and Skinner: Technology Growth and Expenditure Growth in Health Care
toward “defensive medicine” that would tend to increase utilization, this model suggests more modest effects such as those found in Mello et al. (2010). Malpractice premiums increase fixed costs R, increasing work effort through the income effect, while the risk of malpractice should encourage more diagnos-tic tests. But malpractice liability rules also reduce utilization through the substitution effect: the incremental procedure exposes the physicians to more malpractice risk and thus raises her implicit marginal cost per pro-cedure (Currie and MacLeod 2008; Baicker, Fisher, and Chandra 2007).
3.3 A Dynamic Model of Provider Behavior
To this point, the analysis has been in a static framework. We next turn to one that attempts to model the dynamics of change (see also McGuire 2009). Our approach is to take the derivative of the first-order equa-tion (8),16 rearrange and simplify. Letting Δ xjt = xjt+1 − xjt and similarly for other vari-ables, we write:
(9) Δ x jt = [− Ψ t s′′( x jt )]−1 {Δ Ψ t s t ′ ( x jt )
+ Ψ t Δ s t ′ ( x jt ) + ω jt Δ π jt + Δ ω jt π jt
− Δ μ jt + ΔΦ v jt + Φ v jt ′ }.
Thus, the growth in health care real inputs is expressed as the sum of several compo-nents. Looking first at the numerator of (9), as income trends upward, one might expect a corresponding increase in the value of a
16 Taking the total differential of the first-order condi-tion yields the following expression:
Δ Ψ t s t ′ ( x jt ) + Ψ t Δ s t ′ ( x jt ) + Ψ t s′′( x jt )Δ x jt
=− ω jt Δ π jt − Δ ω jt π jt + μ jt Δ _ X jt + Δ μ jt − Φ
d 2 V jt _
dx jt 2 − ΔΦ
d V jt _
d x jt .
For simplicity, we assume here that Ω is a constraint in the Lagrangian and not an argument of the utility function. If we assumed the latter, there would be an additional term involving Ω″ in the denominator of equation (9) that would not affect the basic interpretation of the results.
human life ΔΨt, as noted in the demand-side model above, and hence a more than propor-tional increase in the demand for health care innovations. On the other hand, premiums for health insurance Pt (from the budget constraint in equation 2) would likely rise to maintain actuarial balance in the private insurance market; this in turn could dig into disposable income, cutting back on demand. The second term on the right-hand side of (9) captures a shift in the survival curve—technological innovations that increase sur-vival holding constant inputs; these imply movement along the survival production function to reestablish equilibrium condi-tions. For example, through either learn-ing-by-doing or knowledge spillovers, the ability of providers to use a technology may improve over time. If so, more of that tech-nology should be delivered to patients.
The primary control over U.S. health care expenditure growth is through the setting of prices, for example, through reimbursement rates for physician or inpatient services by Medicare and Medicaid (Newhouse 2002), or through the negotiation of discounts by large managed care organizations and insur-ance firms. Thus the third term reflects the substitution effects arising from changes in the profitability of health care services—lower profitability reduces use of inputs. But as the literature on physician behavior has emphasized, cutting reimbursement rates can have offsetting effects when physician or provider practices experienced reduced income, leading to the fourth term, at least for procedures or services that continue to be profitable.
The fifth term reflects changes in the shadow price of capacity or knowledge constraints. Capacity constraints are typi-cally more explicit in countries such as the United Kingdom and Canada, where quan-tity restrictions based on central decisions of the government are the primary determi-nants of changes in both outcomes and costs.

Journal of Economic Literature, Vol. L (September 2012)660
But they may also be present in the United States in the short term through shortages in resources, such as ICU hospital beds, spe-cialists, or MRIs. Changes in these resources are subject to a whole host of incentives, but changes take time, so gradual capacity adjustment could translate into short-term quantity constraints.
The final terms in equation (9) reflect the potential that individual patients are no longer better-off as a consequence of the additional health care services, and thus we assume that procedure growth would be cur-tailed or halted. This would occur, for exam-ple, when the price facing consumers p, is rising, income is falling, or if the marginal value of the procedure is fading.
A critical parameter that affects the mag-nitude and speed of the growth in x is in the denominator of equation (9), the sec-ond derivative of the production function, s″. When there are well-defined groups of people who benefit from the treatment, and where outside of that group the treatment causes harm—such as anti-retroviral therapy for people with HIV/AIDS—the magnitude of s″ is large, meaning that any changes in prices, income, or other factors has a very small impact on its expansion. By contrast, when there are a large number of people who could potentially benefit if only a small amount, then −s″ is very small, which magni-fies dramatically the potential changes over time in utilization.
4. A Typology of the Productivity of Medical Technologies
The above analysis describes the static and dynamic nature of technology use for a given physician. We aggregate both outcomes and costs across technologies to measure aggregate productivity in health care spend-ing. That is, consider equation (9) but now extended to a variety of k different techno-logical innovations or treatments. Aggregate
productivity for a given increase in spend-ing will depend on the relative diffusion of each of these specific technological innova-tions and their respective value in improving outcomes. Summing the change in expendi-tures over all treatments yields
(10a) Δ( q t x t ) ≅ q t Δ x t + x t Δ q t
= ∑ k
q kt Δ x kt + x kt Δ q kt ,
where qt is the year-specific aggregate price index and we have already summed over all j health care providers. Ignoring the “revalu-ation” of existing lifespan because of change in the marginal value of life Ψt, the change in the economywide value of the quality-adjusted survival due to health care treat-ments (x) is approximated by
(10b) Ψ t Δ s t ≅ ∑ k
{ Ψ t Λ s kt ( x kt ) x kt
+ s kt ′ ( x kt )Δ x kt },
where Λskt(xkt) is the shift in the kth input production function, evaluated at xkt.17 Combining (10a) and (10b), the net improve-ment in health outcomes relative to expendi-tures is:
(11) Ψ t Δ s t − Δ( q t x t ) ≅ ∑ k
Ψ t Λ s kt ( x kt ) x kt
− Δ q kt x kt + [ Ψ t s k ′ ( x kt−1 ) − q kt ]Δ x kt .
Thus, equation (11) can be used to parse productivity gains as the sum of three com-ponents. The first term measures in part
17 That is, Λskt is the shift in the production function from t to t + 1, holding factor inputs constant, or techno-logical progress in the absence of technical or productive inefficiency (See Jacobs, Smith, and Street 2006; also see figure 1 of Färe et al. 1994). This equation ignores poten-tial productivity spillovers, for example as was found in Chandra and Staiger (2007), or other interactive effects.
661Chandra and Skinner: Technology Growth and Expenditure Growth in Health Care
traditional technological innovation in health care as noted above; this may also include the development of complementary technol-ogies that make existing technologies more productive. But it will also reflect any secular change in relative technical inefficiency, for example if, in the aggregate, hospitals or pro-vider groups move closer to the production possibility frontier (Färe et al. 1994). The second term represents changes in the real price q of inputs x. Some view the level of q as the primary reason why health care costs so much in the United States (Anderson et al. 2003).18 More relevant here is whether q is growing more rapidly in the United States than elsewhere. While Gaynor and Vogt (2003) have shown that market consoli-dation can lead to cost increases, the mag-nitude of such effects are modest relative to aggregate trends. Conversely, technological innovations producing the same inputs x but at lower cost q could lead to productivity gains (Weisbrod 1991), a point to which we return in section 6.4.
The third term reflects the net productiv-ity benefit of the kth treatment (the term in brackets, or the difference between the value of extra health less its costs) times the speed at which the kth treatment diffuses (Δxkt, as in equation 9). While this latter term affects our overall measure of productivity, it arises because of allocative inefficiency, in that the marginal rates of substitution for each input are not equal to their marginal rates of trans-formation (Garber and Skinner 2008).19
18 Even at a point in time, the cause of price differ-ences is difficult to establish. Two nations may have the same number of hospitalization days or physician visits per capita. Because the intensity of these visits may be very different in terms of what was done and prescribed, these unmeasured differences in utilization will manifest them-selves as price differences.
19 This formulation sidesteps both the controversy sur-rounding how one accounts for future costs when a current innovation increases future survival probabilities, or future costs (e.g., Lee 2008).
At this point, we can begin to see how the nature of preexisting distortions in health care might affect the aggregate productivity of health care expenditures. First, consider a conventional competitive non-health sector of the economy where the marginal value of production always equals social cost. In this case, the third term in (11) would drop out. But in health care, there is both enormous heterogeneity in the cost-effectiveness of specific treatments, and heterogeneity in the speed at which inputs diffuse across treat-ment categories. Regions or countries will experience attenuated productivity growth (conditional on total spending) when the fastest growing treatments are also those with poor net value. This could occur both because the new technology has poor cost-effectiveness (Ψt s kt ′ − q kt < 0) or because the health care system fails to sort patients and deliver care to those who would benefit the most.
In considering medical technology, we therefore group technologies into three cat-egories based on their average cost-effec-tiveness: (I) highly effective care including “home run” treatments with cost effective-ness ratios of as little as $50 per life-year (e.g., Cutler 2004) and for whom the social productivity of expanding use is strongly positive (Ψ s k ′ is much larger than qk); (II) treatments where there are clear positive gains for a subset of people receiving treat-ment, but with considerable heterogeneity in the marginal effectiveness across the popu-lation; and (III) technology with poor cost-effectiveness for the overwhelming majority of patients or where we simply don’t know the value because of a lack of clinical studies.
4.1 Category I: “Home Run” Technologies
The first category of medical technolo-gies includes those that are cost-effective and useful for nearly everyone in the rel-evant population. Perhaps the most famous example of such an intervention is Lister’s
Journal of Economic Literature, Vol. L (September 2012)662
recommendation that surgeons wash their hands, use gloves, and swab wounds with car-bonic acid (Lister 1867).20 Improved health behaviors, arising for example from the publication of the 1964 Surgeon General’s Report on smoking, also fit into this category of innovation (Cutler and Kadiyala 2003).
Cutler, Deaton, and Lleras-Murray (2006) argue that new drugs, primarily antibiot-ics such as sulphonamide drugs, played an important role in reducing U.S. mortality between the 1930s and 1960. In particular, the development of these drugs allowed for progress against a range of bacterial killers including pneumonia, tuberculosis, dys-entery and venereal disease. Similarly, the development of low-cost antibiotic “sulfa” drugs led to remarkable improvements in outcomes following outbreaks of bacte-rial meningitis. After the 1950s, there were incremental gains in meningitis mortality, but a large portion of the new developments, such as the third-generation cephelosporins, were designed to treat infections that had developed resistance to the first- and sec-ond-generation antibiotics.
Another example of highly cost-effective interventions comes from the introduction of surfactants to treat neonatal acute respira-tory distress for newborns. In the last quarter of 1989, the Food and Drug Administration (FDA) approved the use of two new for-mulations of this class of drugs. Schwartz et al. (1994) estimated that this drug reduced the odds of in-hospital mortality for low-birthweight babies by 30 percent, leading to an overall 5 percent decline in the infant mortality rate. In addition to being a mira-cle drug for thousands of low birth-weight
20 Lister acknowledged that his research was influenced by the Austrian physician Ignaz Semmelweis. Semmelweis demonstrated that maternal mortality from puerperal fever (an infection of the genital tract after giving birth) could be reduced from 12.2 percent to 2.4 percent by making physicians wash their hands with chlorinated lime between autopsy and obstetrical rotations.
babies, surfactants also proved to be protec-tive of cost, which declined by 10 percent for survivors, and 30 percent for decedents.
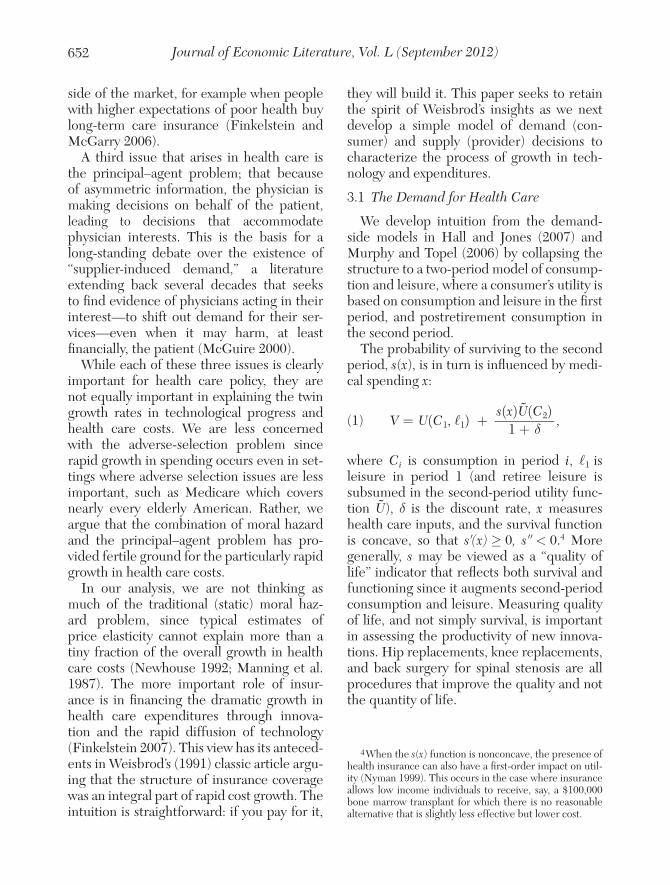
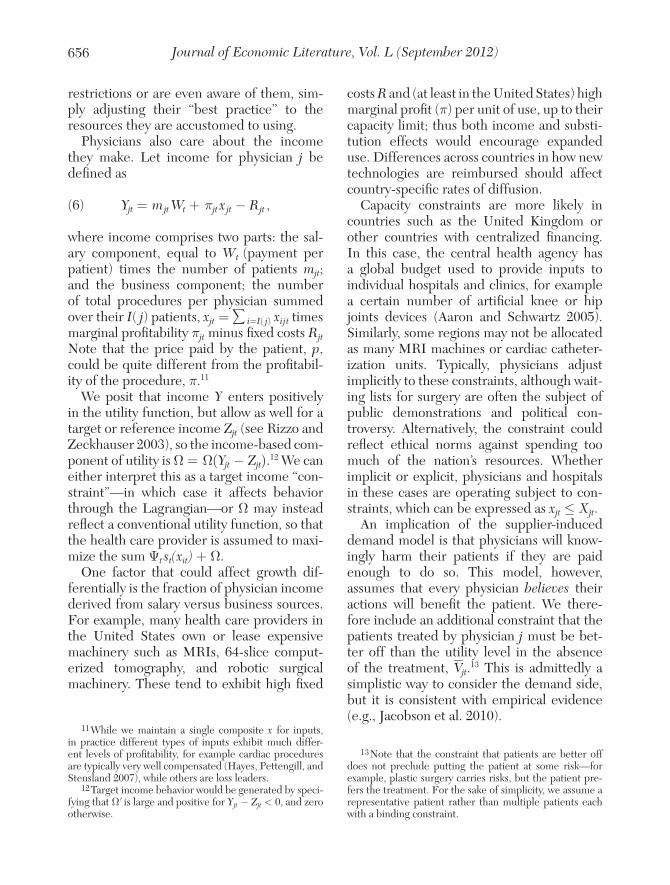
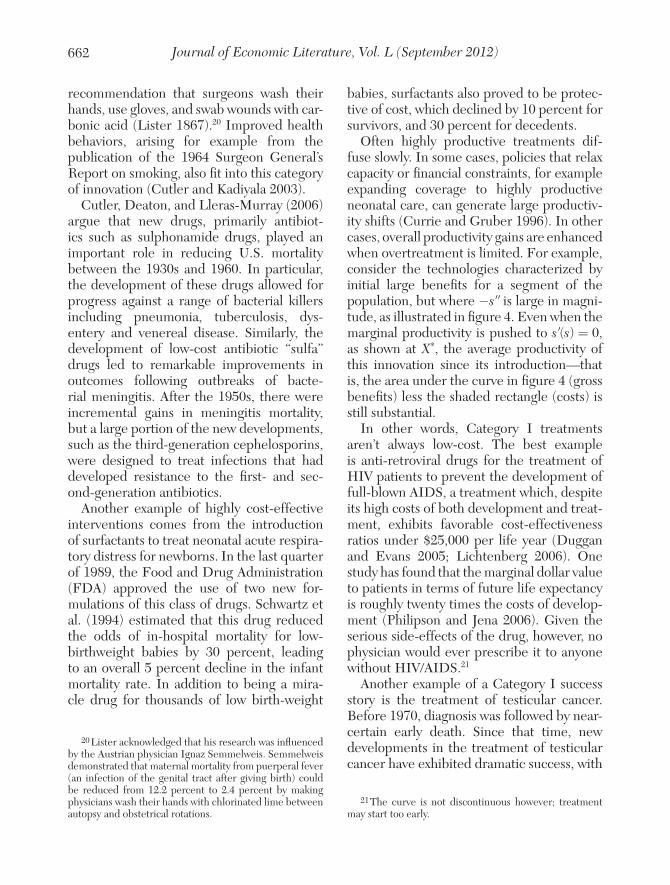
Often highly productive treatments dif-fuse slowly. In some cases, policies that relax capacity or financial constraints, for example expanding coverage to highly productive neonatal care, can generate large productiv-ity shifts (Currie and Gruber 1996). In other cases, overall productivity gains are enhanced when overtreatment is limited. For example, consider the technologies characterized by initial large benefits for a segment of the population, but where −s″ is large in magni-tude, as illustrated in figure 4. Even when the marginal productivity is pushed to s′(s) = 0, as shown at X * , the average productivity of this innovation since its introduction—that is, the area under the curve in figure 4 (gross benefits) less the shaded rectangle (costs) is still substantial.
In other words, Category I treatments aren’t always low-cost. The best example is anti-retroviral drugs for the treatment of HIV patients to prevent the development of full-blown AIDS, a treatment which, despite its high costs of both development and treat-ment, exhibits favorable cost-effectiveness ratios under $25,000 per life year (Duggan and Evans 2005; Lichtenberg 2006). One study has found that the marginal dollar value to patients in terms of future life expectancy is roughly twenty times the costs of develop-ment (Philipson and Jena 2006). Given the serious side-effects of the drug, however, no physician would ever prescribe it to anyone without HIV/AIDS.21
Another example of a Category I success story is the treatment of testicular cancer. Before 1970, diagnosis was followed by near-certain early death. Since that time, new developments in the treatment of testicular cancer have exhibited dramatic success, with
21 The curve is not discontinuous however; treatment may start too early.
663Chandra and Skinner: Technology Growth and Expenditure Growth in Health Care
remarkable cost-effectiveness or even cost-saving (Shibley et al. 1990). However, few men would agree to undergo an orchiectomy without a confirmed diagnosis, limiting the growth in expenditures on testicular cancer. And unfortunately, the AIDS and testicu-lar cancer success stories are the exception rather than the norm, limiting their use as paradigms for health care productivity.
4.2 Category II: Potentially Cost-Effective Technologies with Heterogeneous Benefits
A more interesting set of medical tech-nologies are those that are cost-effective in some patients but have declining marginal
benefits in others (so that −s″ is small). Despite clear benefits to some patients, such technologies can still exhibit modest or even poor average cost-effectiveness across all patients. 22 A leading example is angioplasty, more commonly known as PCI (percutane-ous coronary intervention), an invasive pro-cedure in which a cardiologist inserts a thin wire into the coronary arteries, and inflates a balloon at the tip of the wire to restore blood flow because of an arterial occlusion.
22 While heterogeneity in treatment effects is typically the norm, Category II treatments also include homoge-neous treatments with uniform yet similarly uninspiring cost-effectiveness ratios of (say) $200,000 per life year.
Val
ue o
f qua
lity-
adju
sted
life
yea
r
Number of procedures
Ψ s′(x)
X*
Total value of treatment
Cost per patient
Total cost
Figure 4. Benefits (area under the curve) and Costs of Category I Innovation
Note: The vertical axis is scaled to reflect a constant value per quality-adjusted live year (e.g., $100,000 per life year).
Journal of Economic Literature, Vol. L (September 2012)664
Typically a wire mesh cylinder, known as a stent, is also inserted in the artery to pre-vent blockage from occurring again. The price depends on who pays for it, but gen-erally runs above $15,000. These have been shown to dramatically improve survival following a heart attack only if performed within the first 12 or 24 hours following its onset, and it is highly cost-effective for this use (Hartwell et al. 2005; Hochman et al. 2006). Its value, as measured by sur-vival, is also higher for relatively younger patients, and is highly cost effective for this group, but it is of lesser value in older populations.23 However, for stable coronary disease, roughly one-third of all PCI proce-dures, clinical trials have found no survival
23 Chandra and Staiger (2007) note that the causal effect of intensive treatments for heart attacks improves one year survival by 18.5 percent in patients less than the age of 80, but increases one year survival by only 3.5 percent in those over the age of 80 (the latter result was not statistically dif-ferent from zero).
benefit and modest improved functioning relative to optimal medical therapy (Boden et al. 2007; Weintraub et al. 2008). Other examples of Category II innovations include the development of antidepressants (Berndt et al. 2002), and the continued diffusion of Cesarean sections.
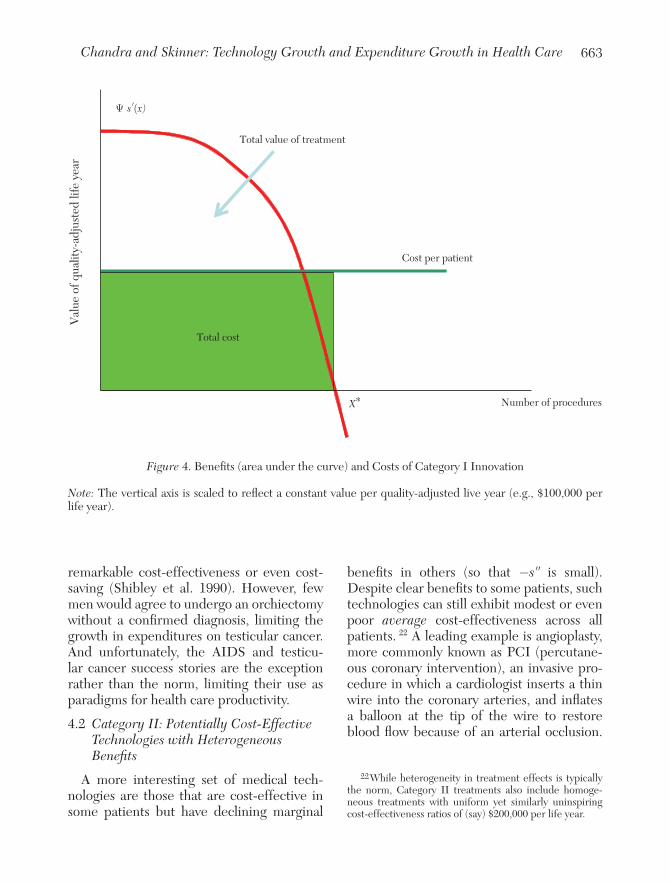
We therefore draw this innovation as having quite different characteristics from Category I advances. Figure 5 shows a hypothetical graph of Category II benefits and costs using PCI as an example. While there are some who clearly benefit (i.e., primary PCI just after a heart attack), there are many more people who gain small or near-zero benefits; on net as represented in figure 5, the average productivity of this innovation could in theory be zero or even negative.
Schwartz (1987) offers a related view of technological diffusion and cost growth. He notes that new technologies involve fewer risks, for example the use of laporoscopy rather than open surgery to remove
Val
ue o
f qua
lity-
adju
sted
life
yea
rs
Number of procedures
Ψ s′(x)
X′
Total cost
Cost per PCI
Figure 5. Benefits (area under the curve) and Costs of Category II Innovation
Note: The vertical axis is scaled to reflect a constant value per quality-adjusted live year (e.g., $100,000 per life year).
665Chandra and Skinner: Technology Growth and Expenditure Growth in Health Care
inflamed gallbladders, and therefore they increase costs not because each procedure is more expensive, but because so many more patients may now experience relative gains. As a consequence, per patient costs fall but total costs increase as the new procedure diffuses (Cutler and Huckman 2003).
It is well known that, across physicians, there are differences in the perception of benefits for specific procedures; further-more they appear to predict overall spend-ing across regions (Sirovich et al. 2005). For example, stent (PCI) rates in Elyria, Ohio, were three times the national U.S. aver-age, and nearly six times the Canadian aver-age (Abelson 2006; Lucas et al. 2006; Alter, Stukel, and Newman 2006). The higher rates arose both from the strongly held beliefs by Elyria cardiologists that a wider swath of elderly people could benefit from a stent,
and that more stents (per person) should be inserted (Abelson 2006). These beliefs would be reinforced by lower complication rates among incremental patients with mini-mal arterial blockage.
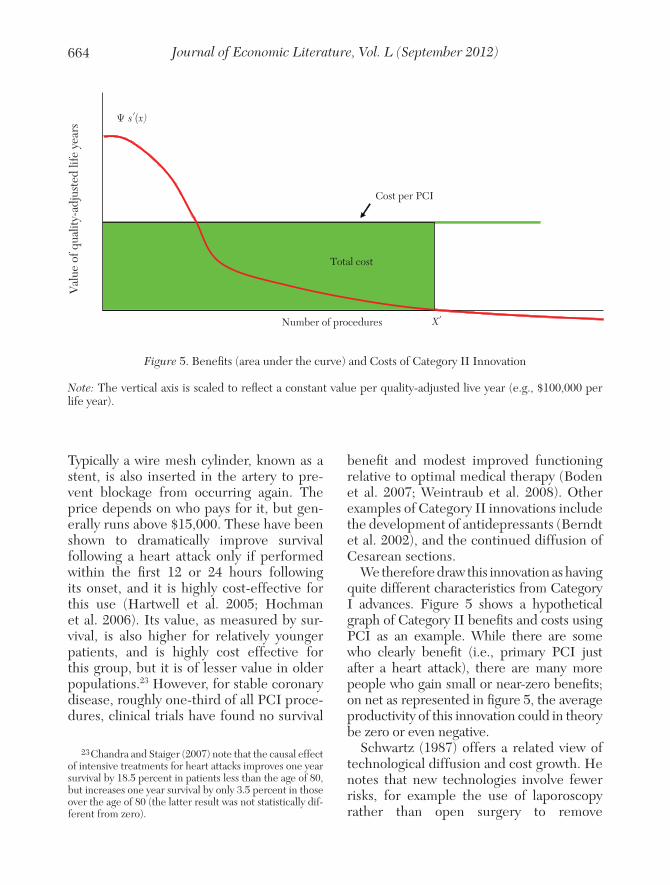
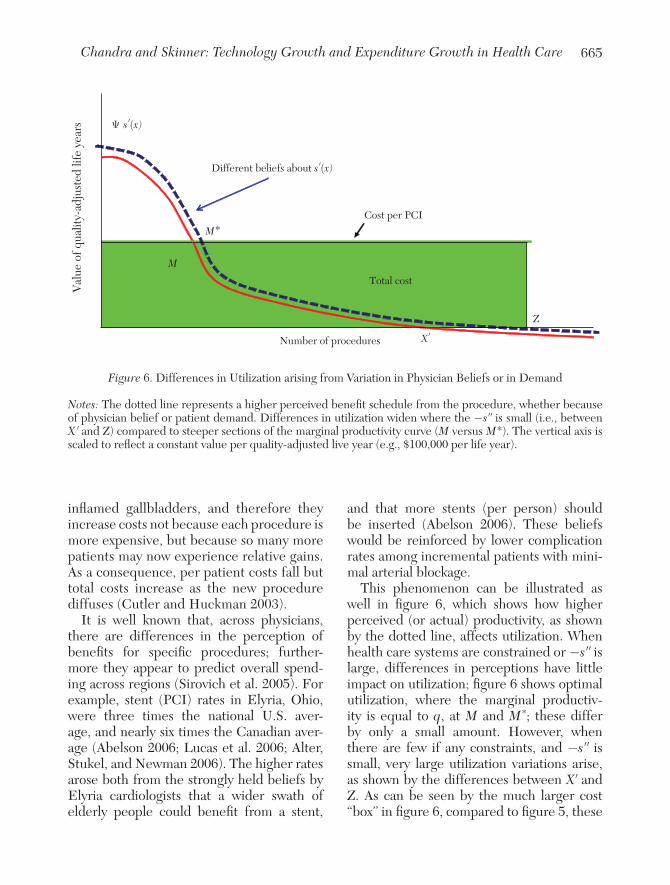
This phenomenon can be illustrated as well in figure 6, which shows how higher perceived (or actual) productivity, as shown by the dotted line, affects utilization. When health care systems are constrained or −s′′ is large, differences in perceptions have little impact on utilization; figure 6 shows optimal utilization, where the marginal productiv-ity is equal to q, at M and M *; these differ by only a small amount. However, when there are few if any constraints, and −s′′ is small, very large utilization variations arise, as shown by the differences between X′ and Z. As can be seen by the much larger cost “box” in figure 6, compared to figure 5, these
Val
ue o
f qua
lity-
adju
sted
life
yea
rs
Number of procedures
Ψ s′(x)
X′
Total cost
Cost per PCIM*
M
Z
Different beliefs about s′(x)
Figure 6. Differences in Utilization arising from Variation in Physician Beliefs or in Demand
Notes: The dotted line represents a higher perceived benefit schedule from the procedure, whether because of physician belief or patient demand. Differences in utilization widen where the −s′′ is small (i.e., between X ′ and Z) compared to steeper sections of the marginal productivity curve (M versus M *). The vertical axis is scaled to reflect a constant value per quality-adjusted live year (e.g., $100,000 per life year).
Journal of Economic Literature, Vol. L (September 2012)666
small differences in beliefs by providers can have very large effects on overall health care productivity.
Similarly, imaging technologies offer enormous incremental value for a subset of patients, but their efficacy in marginal patients is hard to establish. Iglehart (2006) notes that physicians are now using computed tomogra-phy (CT), MRIs, and even positron-emission tomography (PET) for an ever-expanding list of diseases, leading to double-digit growth rates during some years (see Baker et al. 2003). Despite this rapid growth, some sug-gest low marginal effectiveness (Medicare Payment Advisory Committee 2003; Miller 2005). In other words, there are specific uses of imaging with unequivocal value, but at the margin the value approaches zero or even becomes harmful given the risk of false positives, incidental findings unrelated to the original inquiry (“incidentalomas”) or risks of radioactive exposure.24
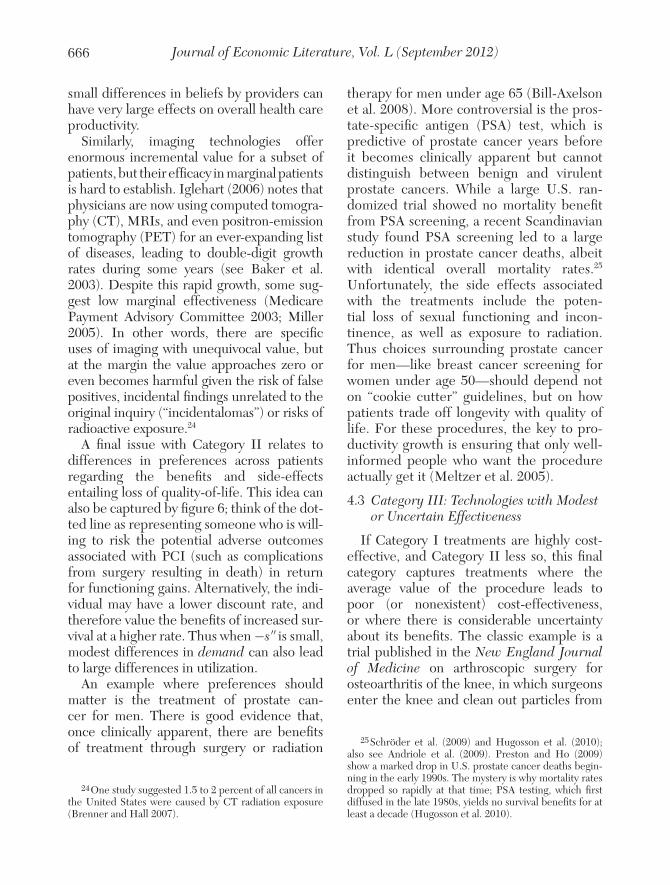
A final issue with Category II relates to differences in preferences across patients regarding the benefits and side-effects entailing loss of quality-of-life. This idea can also be captured by figure 6; think of the dot-ted line as representing someone who is will-ing to risk the potential adverse outcomes associated with PCI (such as complications from surgery resulting in death) in return for functioning gains. Alternatively, the indi-vidual may have a lower discount rate, and therefore value the benefits of increased sur-vival at a higher rate. Thus when −s′′ is small, modest differences in demand can also lead to large differences in utilization.
An example where preferences should matter is the treatment of prostate can-cer for men. There is good evidence that, once clinically apparent, there are benefits of treatment through surgery or radiation
24 One study suggested 1.5 to 2 percent of all cancers in the United States were caused by CT radiation exposure (Brenner and Hall 2007).
therapy for men under age 65 (Bill-Axelson et al. 2008). More controversial is the pros-tate-specific antigen (PSA) test, which is predictive of prostate cancer years before it becomes clinically apparent but cannot distinguish between benign and virulent prostate cancers. While a large U.S. ran-domized trial showed no mortality benefit from PSA screening, a recent Scandinavian study found PSA screening led to a large reduction in prostate cancer deaths, albeit with identical overall mortality rates.25 Unfortunately, the side effects associated with the treatments include the poten-tial loss of sexual functioning and incon-tinence, as well as exposure to radiation. Thus choices surrounding prostate cancer for men—like breast cancer screening for women under age 50—should depend not on “cookie cutter” guidelines, but on how patients trade off longevity with quality of life. For these procedures, the key to pro-ductivity growth is ensuring that only well-informed people who want the procedure actually get it (Meltzer et al. 2005).
4.3 Category III: Technologies with Modest or Uncertain Effectiveness
If Category I treatments are highly cost-effective, and Category II less so, this final category captures treatments where the average value of the procedure leads to poor (or nonexistent) cost-effectiveness, or where there is considerable uncertainty about its benefits. The classic example is a trial published in the New England Journal of Medicine on arthroscopic surgery for osteoarthritis of the knee, in which surgeons enter the knee and clean out particles from
25 Schröder et al. (2009) and Hugosson et al. (2010); also see Andriole et al. (2009). Preston and Ho (2009) show a marked drop in U.S. prostate cancer deaths begin-ning in the early 1990s. The mystery is why mortality rates dropped so rapidly at that time; PSA testing, which first diffused in the late 1980s, yields no survival benefits for at least a decade (Hugosson et al. 2010).
667Chandra and Skinner: Technology Growth and Expenditure Growth in Health Care
the joint (Moseley et al. 2002). Over 650,000 such surgeries had been performed each year at a cost exceeding $5,000 per surgery. In the study, those in the control group received “placebo surgery”—skin incisions and simulated surgery. The trial found no gain from arthroscopic surgery relative to sham surgery.
For ethical and logistical considerations, it is difficult to conduct double-blinded tri-als to establish the efficacy of every medical and surgical therapy. For many surgeries that target quality of life instead of well-defined clinical endpoints such as death or an acute hospitalization, measuring out-comes is more difficult and may be subject to patient biases, particularly where “sham” treatments would be unethical. More gen-erally, there is often considerable uncer-tainty about the benefits of a procedure for a specific patient—even if randomized trials show little average benefit, physicians may believe that because of heterogeneity in the population and the physician’s considerable skill and experience, their patients will ben-efit (Kolata 2009). While this may be true in some cases, aggregate productivity depends on the average benefit, so continued use of such procedures with zero average bene-fit—given their positive cost—is guaranteed to reduce productivity.
Other Category III intensity measures include the frequency of office visits, ICU days for the chronically ill, and referrals to specialists (see Barnato et al. 2007). Strictly speaking, these treatments do clearly benefit some patients—for example, Doyle (2011) suggested higher ICU days contributed to lower mortality for Florida tourists (but not Florida residents) admitted to emergency rooms. On the other hand, patients treated aggressively in the hospital for advanced lung cancer experienced worse quality of life and shorter life expectancy relative to pal-liative care (Temel et al. 2010). More com-monly, treatments are included in Category
III because so much of their utilization is of unknown value.
One of the real challenges in evaluating new technology is that innovations whose benefits are not well understood could be viewed initially as Category III and thus not approved for use (Schreyögg, Bäumler, and Busse 2009). It could take years for random-ized (or observational) studies to establish them as Category II or even Category I treat-ments. For example, the use of stents for recent heart attacks was once considered “off-label” until randomized trials demonstrated effectiveness. In contrast, arthroscopic sur-gery for knee osteoarthritis was a Category II technology before the Moseley et al. (2002) study moved it to Category III.
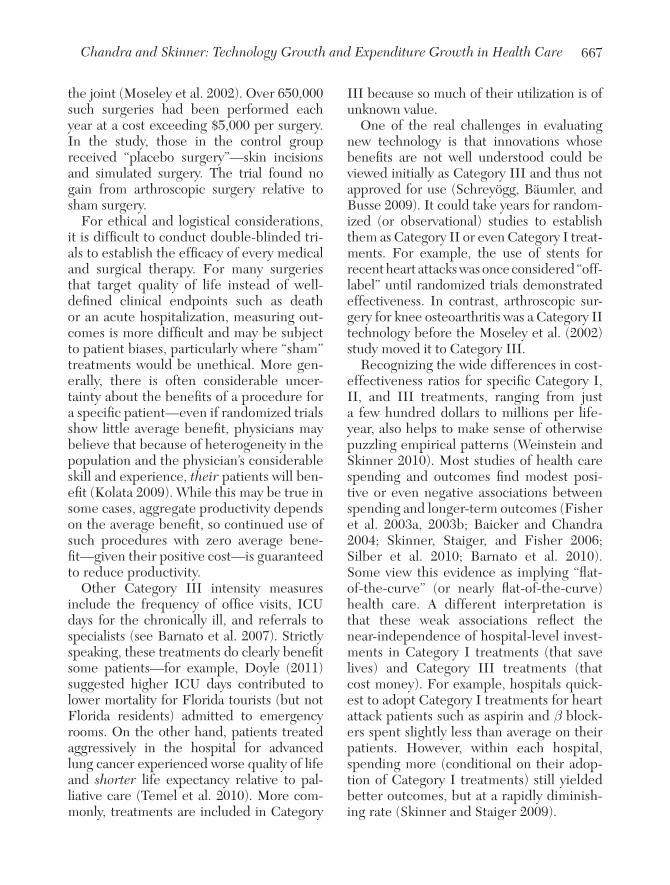
Recognizing the wide differences in cost-effectiveness ratios for specific Category I, II, and III treatments, ranging from just a few hundred dollars to millions per life-year, also helps to make sense of otherwise puzzling empirical patterns (Weinstein and Skinner 2010). Most studies of health care spending and outcomes find modest posi-tive or even negative associations between spending and longer-term outcomes (Fisher et al. 2003a, 2003b; Baicker and Chandra 2004; Skinner, Staiger, and Fisher 2006; Silber et al. 2010; Barnato et al. 2010). Some view this evidence as implying “flat-of-the-curve” (or nearly flat-of-the-curve) health care. A different interpretation is that these weak associations reflect the near-independence of hospital-level invest-ments in Category I treatments (that save lives) and Category III treatments (that cost money). For example, hospitals quick-est to adopt Category I treatments for heart attack patients such as aspirin and β block-ers spent slightly less than average on their patients. However, within each hospital, spending more (conditional on their adop-tion of Category I treatments) still yielded better outcomes, but at a rapidly diminish-ing rate (Skinner and Staiger 2009).
Journal of Economic Literature, Vol. L (September 2012)668
5. Aggregate Growth in Expenditures and Health Outcomes
Armed with typology of treatments it is natural to ask: How much of these gains in survival, and how much in costs, during the past several decades have been driven by growth and diffusion of Category I, II, and III treatments? After all, during the past several decades, the average productivity of health care spending has been found to be quite large. Murphy and Topel (2006) estimate an increase in the value of health roughly three times accumulated health care costs during 1970–2000. Similarly,
Lakdawalla et al. (2010) finds high average cost-effectiveness for cancer treatments con-ditional on the stage at which the cancer was diagnosed. These average returns reflect the weighted means of survival gains and costs across Category I, II, and III treatments.
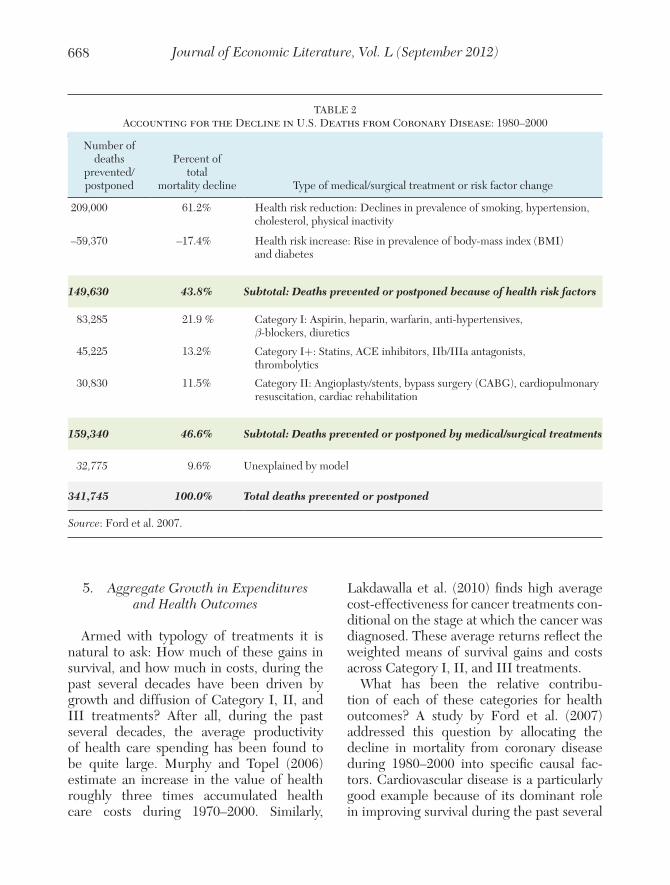
What has been the relative contribu-tion of each of these categories for health outcomes? A study by Ford et al. (2007) addressed this question by allocating the decline in mortality from coronary disease during 1980–2000 into specific causal fac-tors. Cardiovascular disease is a particularly good example because of its dominant role in improving survival during the past several
TABLE 2 Accounting for the Decline in U.S. Deaths from Coronary Disease: 1980–2000
Number of deaths
prevented/ postponed
Percent of total
mortality decline Type of medical/surgical treatment or risk factor change
209,000 61.2% Health risk reduction: Declines in prevalence of smoking, hypertension, cholesterol, physical inactivity
–59,370 –17.4% Health risk increase: Rise in prevalence of body-mass index (BMI) and diabetes
149,630 43.8% Subtotal: Deaths prevented or postponed because of health risk factors
83,285 21.9 % Category I: Aspirin, heparin, warfarin, anti-hypertensives, β-blockers, diuretics
45,225 13.2% Category I+: Statins, ACE inhibitors, IIb/IIIa antagonists, thrombolytics
30,830 11.5% Category II: Angioplasty/stents, bypass surgery (CABG), cardiopulmonary resuscitation, cardiac rehabilitation
159,340 46.6% Subtotal: Deaths prevented or postponed by medical/surgical treatments
32,775 9.6% Unexplained by model
341,745 100.0% Total deaths prevented or postponed
Source: Ford et al. 2007.
669Chandra and Skinner: Technology Growth and Expenditure Growth in Health Care
decades (Cutler, Rosen, and Vijan 2006). As shown in table 2, the study found that 61.2 percent of the drop in mortality of 340,000 deaths was the consequence of declines in smoking, physical activity, blood pressure, and cholesterol not related to medical treat-ments, but with 17.4 percent of the decline clawed back by rising obesity and diabetes rates. Thus 43.8 percent of the reduction in deaths was the consequence of changing risk factors related to behaviors rather than health care per se. 26
Table 2 further considered which medical and surgical treatments led to the remain-ing improvements. Twenty-two percent of the decline in mortality was the conse-quence of inexpensive but highly effective Category I treatments: aspirin, beta block-ers, blood-thinning drugs, anti-hyperten-sives, and diuretics. Another 13.2 percent of the gains in survival occurred because of pharmaceuticals such as ACE inhibitors, anti-cholesterol drugs (statins), and throm-bolytics (“clot-busters”); these might be classified as Category I+ because their net benefit is substantial and marginal cost of production is modest, even if overuse poses some risks. Category II treatments include surgical interventions such as angioplasty (stents), bypass surgery, and the diffusion of cardiac rehabilitation and cardiopulmonary resuscitation (such as automated defibrilla-tors); these contribute to an additional 11.5 percent of the mortality decline (Ford et al. 2007). The remaining 9.6 percent of the mortality decline is not explained by existing treatment changes, and could be attributed
26 Thus Murphy and Topel (2006) attribute too much of the overall improvement in life expectancy to health care expenditures given that behavioral factors accounted for nearly half of the survival improvement. But their conclu-sion that biomedical research exhibits extraordinarily high social returns still holds if medical research includes the landmark epidemiological studies (such as those linking tobacco to lung cancer) that provided the basis for behav-ioral changes.
to Category III treatments with benefits not yet well understood in clinical studies.
Doing this same breakdown for costs is trickier. Growth in Category I (and 1+) treatments (e.g., aspirin) accounted for only a small fraction of total growth in U.S. health care costs. The role of Category II treatments in cost growth such as stents and bypass sur-gery is much larger (e.g., Groeneveld et al. 2011) and likely to comprise a much larger fraction of growth in health care costs, but in 2000, stents and bypass surgery accounted for only about 10 percent of total spending on cardiovascular disease.27 This suggests a larger role for Category III spending to explain the unusually rapid growth in U.S. spending relative to GDP. In part, this can be inferred from the stagnation in productiv-ity growth over time. Even when averaged across all three categories of treatments, the average cost of saving an additional life-year has risen three-fold since the 1970s, to as much as $246,000 per life-year (Cutler, Rosen, and Vijan 2006; Garber and Skinner 2008).
There is also evidence that less effective Category II and III treatments in the United States have diffused more widely than in other countries, potentially explaining the much higher growth in health care spending relative to GDP. We consider four examples below. First, cardiovascular procedures in the United States (587 per 100,000) lead those in Germany (357), and are far ahead of Denmark (207) and Switzerland (115) (Peterson and Burton 2007). The greater availability of primary PCI for heart-attack
27 Using data from Holmes, Kozak, and Owings (2007), we estimate 330,000 bypass surgeries and 550,000 angio-plasty (stents) in the United States during 2000. The incre-mental cost of such surgeries is more difficult to estimate, since in some cases they replace a hospital admission with medical management, but we assume $15,000 incremen-tal costs for angioplasty and $20,000 incremental costs for bypass surgery. This yields approximately 10 percent of total costs for the treatment of heart, hypertension, and high cholesterol diseases in 2000 (Roehrig et al. 2009).
Journal of Economic Literature, Vol. L (September 2012)670
patients saves lives in the United States, but its corresponding greater use for patients with little benefit (e.g., Tu et al. 1997), atten-uates overall productivity gains.
Second, the United States is a leader in the diffusion of expensive new Category III tech-nologies with unproven benefits. One exam-ple is “robotic” surgery tools, which require an up-front investment of $1 million to $2.5 mil-lion per unit. By 2009, the leading manufac-turer of such devices had sold 1,400 units in the United States, compared to just 400 in the rest of the world, increasing costs by as much as $2.5 billion (Barbash and Glied 2010). Similarly, proton-beam therapy for prostate cancer require facilities costing up to $100 million and has experienced rapid growth in the United States, but without a consensus on its benefits relative to conventional radiation therapy (Terasawa et al. 2009).
A third example comes from the use of ICU hospital beds. In the United Kingdom, the use of ICU beds is similar to that in the United States for conditions such as cardiac surgery that clearly indicate post-surgical ICU care. However, among elderly people over 85, 1.3 percent die in an ICU in the United Kingdom, compared to 11.0 percent in the United States (Wunsch et al. 2009). This by itself does not tell us whether the United Kingdom is using too few ICU days, or the United States too many. But the rapid U.S. growth in ICU use since the 1990s, coupled with the likely cost-ineffectiveness of those incremental ICU days (Barnato et al. 2010), are consistent with poor productivity in U.S. health care spending.28
Finally, the United States often experi-ences rapid diffusion of expensive pharma-ceutical treatments with uncertain benefits. Ezetimibe, a costly ingredient in the cho-lesterol-reducing drug Vytorin, was not
28 Average ICU days per Medicare enrollee in the last six months of life increased from 1.2 days in 1994 to 3.5 days in 2005 (www.dartmouthatlas.org).
recommended as a first-line treatment, nor has it subsequently been shown to be rela-tively effective at reducing cardiovascular disease. In 2006, Ezetimibe accounted for 15 percent of U.S. cholesterol-lowering drug sales, compared to just 3 percent in Canada (Jackevicius et al. 2008). Another example comes from the FDA approval of Avastin for recurrent glioblastoma (brain tumors) in the United States based on the results of an uncontrolled trial. Citing the same results, the European Medicines Agency reached the opposite decision.29
Differences in spending growth between the United States and other countries cannot be explained simply by slower innovation in Europe: drug-eluting stents were approved for use in Italy a year before FDA approval in the United States (Schreyögg, Bäumler, and Busse 2009). And acknowledging that the United States is more likely to adopt Category II and III technologies doesn’t explain why it happens. One potential explanation stems from Weisbrod’s (1991) “induced innova-tion” hypothesis. The willingness of the U.S. insurance programs to reimburse for nearly any new innovation leads to dramatic growth in these categories of care. It is less clear whether innovation occurs differentially because of market-size, insurance expansions, or factor prices (see Acemoglu and Linn 2004; Acemoglu et al. 2006). But we should still expect a far more rapid rate of innovation when there is an implicit promise that those innovations will be reimbursed, regardless of whether the innovation yields good value for the extra cost.30
29 See the debate between American and European researchers in Wick et al. (2010) and Friedman et al. (2010).
30 And, in the longer term, the newly developed prod-uct could become cost-effective once off-patent. One could also argue that successful innovations developed in the United States benefits everyone in the world. But U.S. norms for ineffective Category II or III treatments could also diffuse to other countries, saddling them with excess costs.
671Chandra and Skinner: Technology Growth and Expenditure Growth in Health Care
Another key explanation of differences in health care spending relative to GDP growth is the ability to finance health care spend-ing, as shown originally by Getzen (1992). Recall from table 1 that all of the other high-spending countries in 1980 (except for the United States) experienced, on average, less than a one-percentage point increase in the share of GDP devoted to health care. Many of these high-spending countries began the 1980s with an already heavy tax burden (with roughly half of GDP devoted to taxation in Sweden and Denmark), limiting their ability to raise taxes further to support health care cost growth (Baicker and Skinner 2011). By contrast, the United States began the 1980s with an aggregate tax effort of about 30 per-cent, and funded much of the increase in health care costs through the less salient mechanism of rising insurance premiums reflected in sluggish take-home wage growth.
6. Future Prospects for Controlling Health Care Costs
We return to our initial question regard-ing the twin trends in technology and cost growth in health care: How can countries ensure that a rising share of GDP devoted to health care is a good thing, and not a cause for concern? We categorize potential reforms by considering each component from the model in equation (9): capacity constraints (μ), demand-side changes (p, ψ), more cost-effectiveness analysis to understand the shape of s(x), and improving incentives faced by physicians and other health care providers (π, ω). We consider approaches to improving health outcomes and reducing both the level and growth rate of inefficient spending. 31
31 We assume here that rising costs are not a symptom of “Baumol’s cost disease”: sectors of the economy that rely heavily on human interactions fail to share in overall pro-ductivity gains. Health care seems particularly well posed to enjoy large productivity gains, for example from the dif-fusion of information technology.
6.1 Capacity Constraints
In the United States, Medicare regula-tory boards evaluating new technology are concerned solely with whether drugs or procedures provide positive benefits, but rarely reference costs. Elsewhere, regulatory boards, such as England’s National Institute for Health and Clinical Excellence (NICE), use explicit cost factors in setting standards for the use of Category II or Category III treatments. In theory, these capacity con-straints (μ) should ensure that any growth in costs should be limited to cost-effective treatments. Typically these rulings are lim-ited to specific and discrete choices, for example whether specific drugs can be used for a specific disease. In practice, Category II treatments with heterogeneous benefits are more difficult to classify under “cover/not cover” decision rules.
Medicare accounts for 20 percent of total spending, but what about the larger frac-tion of health care spending (32 percent) in private insurance markets? Here the legal system—not so much malpractice per se, but the inability of private insurance com-panies to deny coverage for procedures with unproven (Category II or III) benefits—may be at fault for failing to control cost growth (Ferguson, Dubinsky, and Kirsch 1993). These pressures are strengthened by the fact that Medicare does not reimburse with regard to economic value, making it very dif-ficult for private insurers, especially a single private insurer, to use value in guiding their own coverage decisions.
As well, U.S. corporate laws make it very difficult for insurers and hospitals individu-ally to reduce the use of Category II and III technologies, even when physicians are employed by the hospital. These provi-sions prohibit any interference by insurers or hospitals with the medical judgment of physicians on the grounds that only physi-cians hold medical licenses. State laws also
Journal of Economic Literature, Vol. L (September 2012)672
require insurers to pay for any medically necessary service as determined by a phy-sician. Together, these incentives undercut the ability of an insurer to act as a residual claimant, so insurers seek to restrain spend-ing growth by negotiating lower prices with providers, rather than scaling back utilization.
Historically, the United States has not relied on quantity restrictions in health care planning, except for sometimes ineffective certificate of need programs (Ho, Ku-Goto, and Jollis 2009). In theory, regional restric-tions to discourage duplication and overbuild-ing of surgical units, MRIs, and hospital or ICU beds could control unrestricted growth in Category II or III procedures. But this approach to market-level quantity restric-tions would require a tectonic shift in the U.S. regulatory and policy environment.
6.2 Demand-Side Incentives
Economists are naturally drawn to the idea of raising the price (p) faced by con-sumers to ensure that patients truly value the treatments they receive. Consequently, there is widespread support for limiting the income-tax exclusion for employer-sponsored health insurance, thereby raising the out-of-pocket costs of health insurance (Gruber 2009). Health savings accounts (HSA), tax-preferred savings designed to be accumulated over time for health care bills, are another approach to reducing moral hazard. These are typically coupled with a catastrophic insurance cap on health care spending that may depend in turn on household income. Once above the cap, however, moral hazard still intrudes; even with a $5,000 deductible, the patient has no cost incentive to choose procedure A costing $10,000 over procedure B cost-ing $20,000. For this reason, one recent proponent of demand-side incentives sug-gested a catastrophic cap of $50,000—thus effectively dismantling the risk-sharing
component of health insurance for low and middle-income households (Goldhill 2009).
In the conventional approach to improv-ing cost-sharing, the copayment is either uniform across different types of treatment (ranging from highly effective to ineffec-tive), or is set depending on the elasticity of demand for the service. For well-informed patients who are cognizant of marginal costs and benefits, this is sufficient (Pauly and Blavin 2008). But patients may not always make appropriate decisions about the use of services when faced with higher copayments and coinsurance.32 A different approach is to use “value-based” insurance plans that have higher prices for Category III and some Category II payments, but lower prices for Category I treatments. Prices (or more generally, the size of patient-cost sharing) could be based on the results of clinical tri-als. While this approach has been applied to lowering prices of Category I treat-ments with some success (e.g., Chernew et al. 2008), insurance plans that assess sig-nificant copayments for Category II or III treatments are rare, perhaps because of the difficulty in determining the medical neces-sity of specific hospital or ICU admission, or the idiosyncratic benefit that a patient may attach to these services.
How will a demand-side approach affect the adoption or diffusion of new technology? If the expansion of health insurance cover-age under Medicare in 1966 led to rapid technological diffusion (Finkelstein 2007), then why shouldn’t cost-sharing reverse the tide? There is at least anecdotal evidence that high-income patients would just say no to cost-ineffective treatments if asked to pay out-of-pocket, suggesting that cost-sharing would discourage the most expensive new
32 Although most evidence suggests that health is not adversely affected by greater patient cost-sharing on aver-age; see Newhouse and the Insurance Experiment Group (1993) and Chandra, Gruber, and McKnight (2010).
673Chandra and Skinner: Technology Growth and Expenditure Growth in Health Care
and marginally effective technologies.33 But even with demand-side incentives for a larger fraction of the population, govern-ment agencies must decide whether (or how much) Medicaid and Medicare will cover for new treatments, or how to adopt cover-age and cost-effectiveness rules as Ψ, the implicit value of additional health benefits, evolves over time.
6.3 Comparative-Effectiveness Analysis
To the extent that inefficiency is partially caused by providers not knowing the shape of s(x), more trials or well-designed observa-tional studies could improve the productivity of health care spending (Chandra, Jena, and Skinner 2011). But many Category II and III interventions require estimating treatment effects across a wide variety of phenotypes and genotypes, requiring much larger study sample sizes and lengthier study periods than typically available. Complicating deci-sions further, the benefits of an intervention vary not only by type of patient but also by type of provider who delivers the treatment (Wennberg et al. 1998; Chandra and Staiger 2007). None of these concerns lessen the value of what can be learnt from trials and observational studies, but it does suggest that a serious attempt to embrace comparative effectiveness research would require many trials and a large budget—albeit a budget justified by the considerable worldwide ben-efits of improved physician and patient deci-sion making.
33 One former corporate finance officer whose insur-ance covered the $93,000 prostate cancer drug Provenge was explicit about his willingness-to-pay: “‘I would not spend that money,’ because the benefit doesn’t seem worth it.” (Marchione 2010). Others have pointed out the diffi-culty of judging “true” demand for health care, particularly among those near the end of life (Becker, Murphy, and Philipson 2007).
6.4 Changing Health Care Provider Incentives
Growth rates may vary because of the evolution of ω, or the marginal importance of financial factors for health care provid-ers. Certainly the rapid real growth rate in spending observed in McAllen, Texas, 8.3 percent during 1992–2006, in contrast to El Paso, Texas, which grew at just 3.4 percent, is consistent with the evidence of a growth in McAllen’s “entrepreneurial” activities during the period of analysis.34 Another cause for ω to evolve is the time-varying intensity of mar-ket competition affecting both income and prices. For example, Rau (2010) has docu-mented a very rapid growth in diagnostic and surgical facilities in Provo, Utah, during the 2000s as multiple health care providers sought to expand market share.
More generally, a change in payment incentives away from traditional fee-for-service care could also affect growth in both outcomes and costs. For example, if the incentive model were expanded to include more profitable reimbursements π for improved health outcomes, one could observe both better outcomes and lower costs. However, current incentives pro-vide little scope for this type of innovation (Cutler 2010). In one case, a back pain clinic began to steer patients to low-cost rehabilitation, rather than sending them to the hospital immediately for diagnostic tests and back surgery. Despite improved outcomes and lower costs, the hospital was forced to petition the insurance company to reimburse it for some of the lost profits on MRIs not performed (Fuhrmans 2007).
34 As Gawande (2009) characterized the change in ω: The surgeon came to McAllen in the mid-nine-ties, and since then, he said, “the way to practice medicine has changed completely. Before, it was about how to do a good job. Now it is about ‘How much will you benefit?’ ” (38)
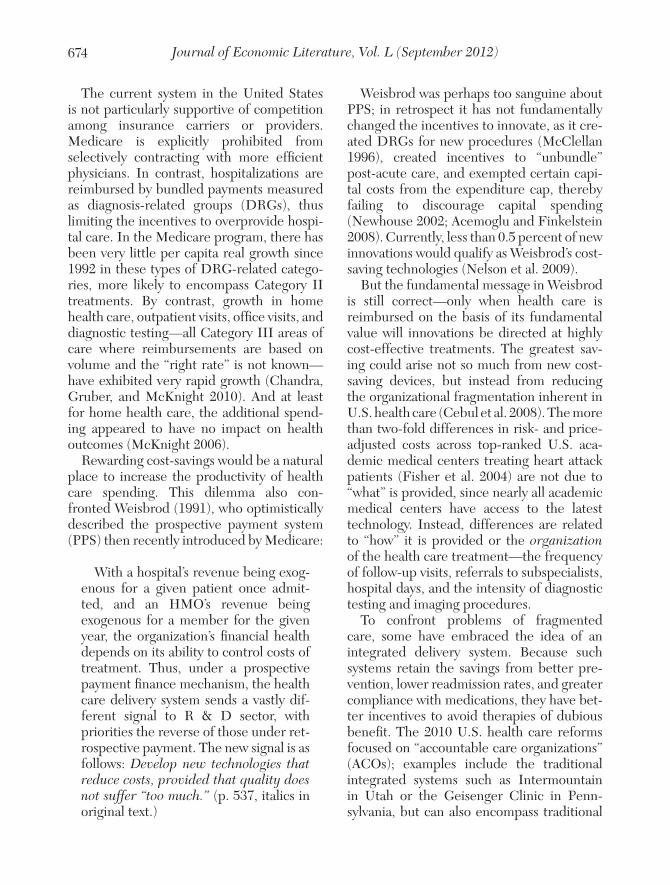
Journal of Economic Literature, Vol. L (September 2012)674
The current system in the United States is not particularly supportive of competition among insurance carriers or providers. Medicare is explicitly prohibited from selectively contracting with more efficient physicians. In contrast, hospitalizations are reimbursed by bundled payments measured as diagnosis-related groups (DRGs), thus limiting the incentives to overprovide hospi-tal care. In the Medicare program, there has been very little per capita real growth since 1992 in these types of DRG-related catego-ries, more likely to encompass Category II treatments. By contrast, growth in home health care, outpatient visits, office visits, and diagnostic testing—all Category III areas of care where reimbursements are based on volume and the “right rate” is not known—have exhibited very rapid growth (Chandra, Gruber, and McKnight 2010). And at least for home health care, the additional spend-ing appeared to have no impact on health outcomes (McKnight 2006).
Rewarding cost-savings would be a natural place to increase the productivity of health care spending. This dilemma also con-fronted Weisbrod (1991), who optimistically described the prospective payment system (PPS) then recently introduced by Medicare:
With a hospital’s revenue being exog-enous for a given patient once admit-ted, and an HMO’s revenue being exogenous for a member for the given year, the organization’s financial health depends on its ability to control costs of treatment. Thus, under a prospective payment finance mechanism, the health care delivery system sends a vastly dif-ferent signal to R & D sector, with priorities the reverse of those under ret-rospective payment. The new signal is as follows: Develop new technologies that reduce costs, provided that quality does not suffer “too much.” (p. 537, italics in original text.)
Weisbrod was perhaps too sanguine about PPS; in retrospect it has not fundamentally changed the incentives to innovate, as it cre-ated DRGs for new procedures (McClellan 1996), created incentives to “unbundle” post-acute care, and exempted certain capi-tal costs from the expenditure cap, thereby failing to discourage capital spending (Newhouse 2002; Acemoglu and Finkelstein 2008). Currently, less than 0.5 percent of new innovations would qualify as Weisbrod’s cost-saving technologies (Nelson et al. 2009).
But the fundamental message in Weisbrod is still correct—only when health care is reimbursed on the basis of its fundamental value will innovations be directed at highly cost-effective treatments. The greatest sav-ing could arise not so much from new cost-saving devices, but instead from reducing the organizational fragmentation inherent in U.S. health care (Cebul et al. 2008). The more than two-fold differences in risk- and price-adjusted costs across top-ranked U.S. aca-demic medical centers treating heart attack patients (Fisher et al. 2004) are not due to “what” is provided, since nearly all academic medical centers have access to the latest technology. Instead, differences are related to “how” it is provided or the organization of the health care treatment—the frequency of follow-up visits, referrals to subspecialists, hospital days, and the intensity of diagnostic testing and imaging procedures.
To confront problems of fragmented care, some have embraced the idea of an integrated delivery system. Because such systems retain the savings from better pre-vention, lower readmission rates, and greater compliance with medications, they have bet-ter incentives to avoid therapies of dubious benefit. The 2010 U.S. health care reforms focused on “accountable care organizations” (ACOs); examples include the traditional integrated systems such as Intermountain in Utah or the Geisenger Clinic in Penn-sylvania, but can also encompass traditional
675Chandra and Skinner: Technology Growth and Expenditure Growth in Health Care
hospital–physician networks (Fisher et al. 2009). Such a construct could come closer to the ideal expressed by Weisbrod by pro-viding incentives for cost-saving innovations. However, we do not know how well ACOs could sidestep cost-ineffective technologies, particularly if the latest shiny innovation enhanced market share (Chernew, Sabik, Chandra, Gibson, and Newhouse 2010).
7. Conclusion
There are no easy solutions to the problem of rising costs in health care, as has become evident in the political debate over the 2010 U.S. health care reform bill. Douglas Holtz-Eakin, then-director of the Congressional Budget Office put it best: “Social-Security is Grenada. Medicare is Vietnam” (Wolf 2005). Still, our lengthy survey of the econom-ics and medical literature suggests several observations.
First, attributing cost growth and improve-ments in outcomes to “technology growth” is too simplistic and tells us little about where the cost growth is occurring, whether such growth should be tamed, and if so, how it should be done. Some countries and some regions in the United States have managed to avoid the very rapid growth in expenditures that is now threatening the financial health of many federal and state budgets around the world. The key point is that U.S. growth in health care costs is neither inevitable nor necessarily beneficial for overall productivity gains. Instead, cost growth is the aggregated outcome of a large number of fragmented decisions regarding the use and spread of both old and new health technologies.
Second, there is wide heterogeneity in the productivity of medical treatments, ranging from very high (aspirin for heart attacks and surfactants for premature births) to low (stents for stable angina), or simply zero (arthroscopy for osteoarthritis of the knee). This fact motivated our distinguishing
among three different types of treatments, arrayed by their contributions to productivity gains. The Category I set of effective treat-ments appears to be the largest contributor to survival and functioning gains, while the Category III set of low-productivity group or with uncertain benefits, is most strongly asso-ciated with health care cost growth. It is per-haps tautological, but still worth noting that countries or systems of care that encourage the first group of innovations but discourage the third group are most likely to exhibit high aggregate productivity growth and a slower overall growth rate relative to GDP.
Finally, the most difficult questions relate to health care policy going forward, where there does not appear to be a single magic bullet to “solve” the health care problem. The United States and other countries are struggling with rising costs and a dimin-ished ability to raise taxes or health insur-ance premiums. As well, the United States leads the world with the extent of waste in their health care system (McKinsey Global Institute 2008). The extent of waste in the United States could, ironically, prove to be a boon if a fundamental restructuring of health care unleashed some of this lost pro-ductivity; gradually eradicating 30 percent of waste would depress cost growth rates by 1.3 percentage points over the next two decades. The alternative to not making such changes is far more worrisome: Rising political and economic resistance against tax hikes, insur-ance premium increases, or coverage expan-sion could serve as particularly inefficient brakes on both health care costs and health care innovation.
References
Aaron, Henry J., and William B. Schwartz. 2005. Can We Say No? The Challenge of Rationing Health Care. Washington, D.C.: Brookings Institution Press.
Abelson, Reed. 2006. “Heart Procedure Is Off the Charts in an Ohio City.” The New York Times, August 18, A1.
Acemoglu, Daron, David M. Cutler, Amy Finkelstein,

Journal of Economic Literature, Vol. L (September 2012)676
and Joshua Linn. 2006. “Did Medicare Induce Phar-maceutical Innovation?” American Economic Review 96 (2): 103–07.
Acemoglu, Daron, and Amy Finkelstein. 2008. “Input and Technology Choices in Regulated Industries: Evidence from the Health Care Sector.” Journal of Political Economy 116 (5): 837–80.
Acemoglu, Daron, and Joshua Linn. 2004. “Market Size in Innovation: Theory and Evidence from the Pharmaceutical Industry.” Quarterly Journal of Eco-nomics 119 (3): 1049–90.
Aldy, Joseph E., and W. Kip Viscusi. 2008. “Adjusting the Value of a Statistical Life for Age and Cohort Effects.” Review of Economics and Statistics 90 (3): 573–81.
Alter, David A., Thérèse A. Stukel, and Alice Newman. 2006. “Proliferation of Cardiac Technology in Can-ada: A Challenge to the Sustainability of Medicare.” Circulation 113 (3): 380–87.
Anderson, Gerard F., Uwe E. Reinhardt, Peter S. Hussey, and Varduhi Petrosyan. 2003. “It’s the Prices, Stupid: Why the United States Is So Different from Other Countries.” Health Affairs 22 (3): 89–105.
Andriole, Gerald L., et al. 2009. “Mortality Results from a Randomized Prostate-Cancer Screening Trial.” New England Journal of Medicine 360 (13): 1310–19.
Ashenfelter, Orley, and Michael Greenstone. 2004. “Using Mandated Speed Limits to Measure the Value of a Statistical Life.” Journal of Political Econ-omy 112 (1): S226–67.
Baicker, Katherine, Kasey S. Buckles, and Amitabh Chandra. 2006. “Geographic Variation in the Appro-priate Use of Cesarean Delivery.” Health Affairs 25 (5): W355–67.
Baicker, Katherine, and Amitabh Chandra. 2004. “Medicare Spending, the Physician Workforce, and Beneficiaries’ Quality of Care.” Health Affairs 23: W184–97.
Baicker, Katherine, Elliott S. Fisher, and Amitabh Chandra. 2007. “Malpractice Liability Costs and the Practice of Medicine in the Medicare Program.” Health Affairs 26 (3): 841–52.
Baicker, Katherine, and Jonathan Skinner. 2011. “Health Care Spending Growth and the Future of U.S. Tax Rates.” National Bureau of Economic Research Working Paper 16772.
Baker, Laurence, Howard Birnbaum, Jeffrey Geppert, David Mishol, and Erick Moyneur. 2003. “The Rela-tionship between Technology Availability and Health Care Spending.” Health Affairs 22: W537–51.
Barbash, Gabriel I., and Sherry A. Glied. 2010. “New Technology and Health Care Costs—The Case of Robot-Assisted Surgery.” New England Journal of Medicine 363 (8): 701–04.
Barnato, Amber E., Chung-Chou H. Chang, Max H. Farrell, Judith R. Lave, Mark S. Roberts, and Derek C. Angus. 2010. “Is Survival Better at Hospitals with Higher ‘End-of-Life’ Treatment Intensity?” Medical Care 48 (2): 125–32.
Barnato, Amber E., M. Brooke Herndon, Denise L.
Anthony, Patricia M. Gallagher, Jonathan Skinner, Julie P. Bynum, and Elliott S. Fisher. 2007. “Are Regional Variations in End-of-Life Care Intensity Explained by Patient Preferences?: A Study of the US Medicare Population.” Medical Care 45 (5): 386–93.
Becker, Gary, Kevin M. Murphy, and Tomas J. Philip-son. 2007. “The Value of Life Near Its End and Ter-minal Care.” National Bureau of Economic Research Working Paper 13333.
Berndt, Ernst R., Anupa Bir, Susan H. Busch, Richard G. Frank, and Sharon-Lise Normand. 2002. “The Medical Treatment of Depression, 1991–1996: Pro-ductive Inefficiency, Expected Outcome Variations, and Price Indexes.” Journal of Health Economics 21 (3): 373–96.
Bill-Axelson, Anna, et al. 2008. “Radical Prostatec-tomy versus Watchful Waiting in Localized Prostate Cancer: The Scandinavian Prostate Cancer Group-4 Randomized Trial.” Journal of the National Cancer Institute 100 (16): 1144–54.
Boden, William E., et al. 2007. “Optimal Medical Therapy With or Without PCI for Stable Coronary Disease.” New England Journal of Medicine 356 (15): 1503–16.
Brenner, David J., and Eric J. Hall. 2007. “Computed Tomography—An Increasing Source of Radiation Exposure.” New England Journal of Medicine 357 (22): 2277–84.
Cebul, Randall D., James B. Rebitzer, Lowell J. Tay-lor, and Mark E. Votruba. 2008. “Symposium: Health Care: Organizational Fragmentation and Care Qual-ity in the U.S. Healthcare System.” Journal of Eco-nomic Perspectives 22 (4): 93–113.
Chandra, Amitabh, Jonathan Gruber, and Robin McKnight. 2010. “Patient Cost-Sharing and Hos-pitalization Offsets in the Elderly.” American Economic Review 100 (1): 193–213.
Chandra, Amitabh, Anupam B. Jena, and Jonathan Skinner. 2011. “The Pragmatist’s Guide to Compara-tive Effectiveness Research.” Journal of Economic Perspectives 25 (2): 27–46.
Chandra, Amitabh, and Douglas O. Staiger. 2007. “Pro-ductivity Spillovers in Health Care: Evidence from the Treatment of Heart Attacks.” Journal of Political Economy 115 (1): 103–40.
Chernew, Michael E., Lindsay M. Sabik, Amitabh Chandra, Teresa B. Gibson, and Joseph P. New-house. 2010. “Geographic Correlation between Large-Firm Commercial Spending and Medicare Spending.” American Journal of Managed Care 16 (2): 131–38.
Chernew, Michael E., Lindsay M. Sabik, Amitabh Chandra, and Joseph P. Newhouse. 2010. “Ensur-ing the Fiscal Sustainability of Health Care Reform.” New England Journal of Medicine 362 (1): 1–3.
Chernew, Michael E., Mayur R. Shah, Arnold Wegh, Stephen N. Rosenberg, Iver A. Juster, Allison B. Rosen, Michael C. Sokol, Kristina Yu-Isenberg, and A. Mark Fendrick. 2008. “Impact of Decreas-ing Copayments on Medication Adherence within a

677Chandra and Skinner: Technology Growth and Expenditure Growth in Health Care
Disease Management Environment.” Health Affairs 27 (1): 103–12.
Claxton, Gary, Bianca DiJulio, Heidi Whitmore, Jer-emy D. Pickreign, Megan McHugh, Awo Osei-Anto, and Benjamin Finder. 2010. “Health Benefits in 2010: Premiums Rise Modestly, Workers Pay More toward Coverage.” Health Affairs 29 (10): 1942–50.
Currie, Janet, and Jonathan Gruber. 1996. “Saving Babies: The Efficacy and Cost of Recent Changes in the Medicaid Eligibility of Pregnant Women.” Jour-nal of Political Economy 104 (6): 1263–96.
Currie, Janet, and W. Bentley MacLeod. 2008. “First Do No Harm? Tort Reform and Birth Outcomes.” Quarterly Journal of Economics 123 (2): 795–830.
Cutler, David M. 2004. Your Money or Your Life: Strong Medicine for America’s Health Care System. Oxford and New York: Oxford University Press.
Cutler, David M. 2010. “Where Are the Health Care Entrepreneurs? The Failure of Organizational Inno-vation in Health Care.” In Innovation Policy and the Economy, Volume 11, edited by Josh Lerner and Scott Stern, 1–28. Chicago and London: University of Chicago Press.
Cutler, David M., Angus Deaton, and Adriana Lleras-Muney. 2006. “The Determinants of Mortality.” Journal of Economic Perspectives 20 (3): 97–120.
Cutler, David M., and Robert S. Huckman. 2003. “Technological Development and Medical Produc-tivity: The Diffusion of Angioplasty in New York State.” Journal of Health Economics 22 (2): 187–217.
Cutler, David M., and Srikanth Kadiyala. 2003. “The Return to Biomedical Research: Treatment and Behavioral Effects.” In Measuring the Gains from Medical Research: An Economic Approach, edited by Kevin M. Murphy and Robert H. Topel, 110–62. Chicago and London: University of Chicago Press.
Cutler, David M., Allison B. Rosen, and Sandeep Vijan. 2006. “The Value of Medical Spending in the United States, 1960–2000.” New England Journal of Medi-cine 355 (9): 920–27.
Cutler, David M., and Richard J. Zeckhauser. 2004. “Extending the Theory to Meet the Practice of Insur-ance.” Brookings–Wharton Papers on Financial Ser-vices: 1–47.
Dockins, Chris, Kelly Maguire, Nathalie Simon, and Melonie Sullivan. 2004. “Value of Statistical Life Analysis and Environmental Policy: A White Paper.” U.S. Environmental Protection Agency, National Center for Environmental Economics.
Doyle, Joseph J., Jr. 2011. “Returns to Local-Area Health Care Spending: Evidence from Health Shocks to Patients Far from Home.” American Eco-nomic Journal: Applied Economics 3 (3): 221–43.
Duggan, Mark G., and William N. Evans. 2005. “Esti-mating the Impact of Medical Innovation: The Case of HIV Antiretroviral Treatments.” National Bureau of Economic Research Working Paper 11109.
Enkoji, M. S. 2002. “FBI Targets 2 Heart Doctors: Reddings MDs Are Suspected of Possible Health-Care Fraud.” Sacramento Bee, November 1, A1.
Färe, Rolf, Shawna Grosskopf, Mary Norris, and
Zhongyang Zhang. 1994. “Productivity Growth, Technical Progress, and Efficiency Change in Indus-trialized Countries.” American Economic Review 84 (1): 66–83.
Ferguson, John H., Michael Dubinsky, and Peter J. Kirsch. 1993. “Court-Ordered Reimbursement for Unproven Medical Technology: Circumventing Technology Assessment.” Journal of the American Medical Association 269 (16): 2116–21.
Finkelstein, Amy. 2007. “The Aggregate Effects of Health Insurance: Evidence from the Introduction of Medicare.” Quarterly Journal of Economics 122 (1): 1–37.
Finkelstein, Amy, and Kathleen McGarry. 2006. “Mul-tiple Dimensions of Private Information: Evidence from the Long-Term Care Insurance Market.” Amer-ican Economic Review 96 (4): 938–58.
Fisher, Elliott S., Julie P. Bynum, and Jonathan Skinner. 2009. “Slowing the Growth of Health Care Costs—Lessons from Regional Variation.” New England Journal of Medicine 360 (9): 849–52.
Fisher, Elliott S., Mark B. McClellan, John Bertko, Steven M. Lieberman, Julie J. Lee, Julie L. Lewis, and Jonathan Skinner. 2009. “Fostering Accountable Health Care: Moving Forward in Medicare.” Health Affairs 28 (2): W219–31.
Fisher, Elliott S., David E. Wennberg, Thérèse A. Stukel, and Daniel J. Gottlieb. 2004. “Variations in the Longitudinal Efficiency of Academic Medical Centers.” Health Affairs 23: Var 19–32.
Fisher, Elliott S., David E. Wennberg, Thérèse A. Stukel, Daniel J. Gottlieb, F. L. Lucas, and Étoile L. Pinder. 2003a. “The Implications of Regional Varia-tions in Medicare Spending. Part 1: The Content, Quality, and Accessibility of Care.” Annals of Internal Medicine 138 (4): 273–87.
Fisher, Elliott S., David E. Wennberg, Thérèse A. Stukel, Daniel J. Gottlieb, F. L. Lucas, and Étoile L. Pinder. 2003b. “The Implications of Regional Varia-tions in Medicare Spending. Part 2: Health Out-comes and Satisfaction with Care.” Annals of Internal Medicine 138 (4): 288–98.
Ford, Earl S., Umed A. Ajani, Janet B. Croft, Julia A. Critchley, Darwin R. Labarthe, Thomas E. Kottke, Wayne H. Giles, and Simon Capewell. 2007. “Explaining the Decrease in U.S. Deaths from Coro-nary Disease, 1980–2000.” New England Journal of Medicine 356 (23): 2388–98.
Friedman, Henry S., et al. 2010. “Bevacizumab and Recurrent Malignant Gliomas: A European Perspec-tive: Reply.” Journal of Clinical Oncology 28 (12): E190–92.
Fuchs, Victor R. 1998. Who Shall Live? Health, Eco-nomics, and Social Choice. River Edge, N.J. and Sin-gapore: World Scientific Publishing Company.
Fuhrmans, Vanessa. 2007. “A Novel Plan Helps Hospi-tal Wean Itself Off Pricey Tests.” Wall Street Journal, January 12, A1.
Garber, Alan M., and Charles E. Phelps. 1997. “Eco-nomic Foundations of Cost-Effectiveness Analysis.” Journal of Health Economics 16 (1): 1–31.

Journal of Economic Literature, Vol. L (September 2012)678
Garber, Alan M., and Jonathan Skinner. 2008. “Is American Health Care Uniquely Inefficient?” Jour-nal of Economic Perspectives 22 (4): 27–50.
Gawande, Atul A. 2009. “The Cost Conundrum.” The New Yorker, June 1.
Gaynor, Martin, and William B. Vogt. 2003. “Competi-tion among Hospitals.” RAND Journal of Economics 34 (4): 764–85.
Getzen, Thomas E. 1992. “Population Aging and the Growth of Health Expenditures.” Journal of Geron-tology 47 (3): S98–104.
Goertz, Roland A. 2004. “Spending, Workforce, and Quality: A Response.” http://content.healthaf-fairs.org/content/early/2004/04/07/hlthaff.w4.184.citation/reply#healthaff_el_138.
Goldhill, David. 2009. “How American Health Care Killed My Father.” The Atlantic, September. http://www.theatlantic.com/magazine/archive/2009/09/now-american-health-care-killed-my-father/7617/.
Groeneveld, Peter W., Daniel Polsky, Feifei Yang, Lin Yang, and Andrew J. Epstein. 2011. “The Impact of New Cardiovascular Device Technology on Health Care Costs.” Archives of Internal Medicine 171 (14): 1289–91.
Grossman, Michael. 1972. “On the Concept of Health Capital and the Demand for Health.” Journal of Political Economy 80 (2): 223–55.
Gruber, Jonathan. 2009. “A Win–Win Approach to Financing Health Care Reform.” New England Jour-nal of Medicine 361 (1): 4–5.
Hall, Robert E., and Charles I. Jones. 2007. “The Value of Life and the Rise in Health Spending.” Quarterly Journal of Economics 122 (1): 39–72.
Hartwell, D., J. Colquitt, E. Loveman, A.J. Clegg, H. Brodin, N. Waugh, P. Royle, P. Davidson, L. Vale, and L. MacKenzie. 2005. “Clinical Effectiveness and Cost-Effectiveness of Immediate Angioplasty for Acute Myocardial Infarction: Systematic Review and Economic Evaluation.” Health Technology Assess-ment 9 (17): 1–99.
Hayes, Kevin J., Julian Pettengill, and Jeffrey Stensland. 2007. “Getting the Price Right: Medicare Payment Rates for Cardiovascular Services.” Health Affairs 26 (1): 124–36.
Ho, Vivian, Meei-Hsiang Ku-Goto, and James G. Jollis. 2009. “Certificate of Need (CON) for Cardiac Care: Controversy over the Contributions of CON.” Health Services Research 44 (2 Part 1): 483–500.
Hochman, Judith S., et al. 2006. “Coronary Interven-tion for Persistent Occlusion after Myocardial Infarc-tion.” New England Journal of Medicine 355 (23): 2395–2407.
Holmes, Julia S., Lola Jean Kozak, and Maria F. Owings. 2007. “Use and In-Hospital Mortality Asso-ciated with Two Cardiac Procedures, By Sex and Age: National Trends, 1990–2004.” Health Affairs 26 (1): 169–77.
Hugosson, Jonas, Sigrid Carlsson, Gunnar Aus, Svante Bergdahl, Ali Khatami, Pär Lodding, Carl-Gustaf Pihl, Johan Stranne, Erik Holmberg, and Hans Lilja. 2010. “Mortality Results from the Göteborg
Randomised Population-Based Prostate-Cancer Screening Trial.” The Lancet Oncology 11 (8): 725–32.
Iglehart, John K. 2006. “The New Era of Medical Imag-ing—Progress and Pitfalls.” New England Journal of Medicine 354 (26): 2822–28.
Jackevicius, Cynthia A., Jack V. Tu, Joseph S. Ross, Dennis T. Ko, and Harlan M. Krumholz. 2008. “Use of Ezetimibe in the United States and Canada.” New England Journal of Medicine 358 (17): 1819–28.
Jacobs, Rowena, Peter C. Smith, and Andrew Street. 2006. Measuring Efficiency in Health Care: Analytic Techniques and Health Policy. Cambridge and New York: Cambridge University Press.
Jacobson, Mireille, Craig C. Earle, Mary Price, and Joseph P. Newhouse. 2010. “How Medicare’s Pay-ment Cuts for Cancer Chemotherapy Drugs Changed Patterns of Treatment.” Health Affairs 29 (7): 1391–99.
Kaplow, Louis. 2008. The Theory of Taxation and Pub-lic Economics. Princeton and Oxford: Princeton Uni-versity Press.
Kolata, Gina. 2009. “Older Bypass Method Is Best, a Study Shows.” The New York Times, November 5, A20.
Lakdawalla, Darius N., Eric C. Sun, Anupam B. Jena, Carolina M. Reyes, Dana P. Goldman, and Tomas J. Philipson. 2010. “An Economic Evaluation of the War on Cancer.” Journal of Health Economics 29 (3): 333–46.
Lee, Robert H. 2008. “Future Costs in Cost Effective-ness Analysis.” Journal of Health Economics 27 (4): 809–18.
Leonhardt, David. 2009. “Like Having Medicare? Then Taxes Must Rise.” The New York Times, Febru-ary 25, B1.
Lichtenberg, Frank R. 2006. “The Impact of Increased Utilization of HIV Drugs on Longevity and Medical Expenditure: An Assessment Based on Aggregate US Time-Series Data.” Expert Review of Pharmacoeco-nomics and Outcomes Research 6 (4): 425–36.
Lister, Joseph. 1867. “On the Antiseptic Principle in the Practice of Surgery.” The Lancet 90 (2299): 353–56.
Lucas, F. L., Michael A. DeLorenzo, Andrea E. Siew-ers, and David E. Wennberg. 2006. “Temporal Trends in the Utilization of Diagnostic Testing and Treatments for Cardiovascular Disease in the United States, 1993–2001.” Circulation 113 (3): 374–79.
Manning, Willard G., Joseph P. Newhouse, Naihua Duan, Emmett B. Keeler, Arleen Leibowitz, and M. Susan Marquis. 1987. “Health Insurance and the Demand for Medical Care: Evidence from a Ran-domized Experiment.” American Economic Review 77 (3): 251–77.
Marchione, Marilynn. 2010. “$93,000 Cancer Drug: How Much Is a Life Worth?” http://www.cbsnews.com/stories/2010/ 09/27/health/main6905221.shtml.
McClellan, Mark B. 1996. “Medicare Reimbursement and Hospital Cost Growth.” In Advances in the Eco-nomics of Aging, edited by David A. Wise, 149–84. Chicago and London: University of Chicago Press.

679Chandra and Skinner: Technology Growth and Expenditure Growth in Health Care
McClellan, Mark B., and Jonathan Skinner. 2006. “The Incidence of Medicare.” Journal of Public Economics 90 (1–2): 257–76.
McGuire, Thomas G. 2000. “Physician Agency.” In Handbook of Health Economics, Volume 1A, edited by Anthony J. Culyer and Joseph P. Newhouse, 461–536. Amsterdam; New York and Oxford: Elsevier Sci-ence, North-Holland.
McGuire, Thomas G. 2009. “Income Effects and Health Care Cost Growth in Medicare.” Unpublished.
McKinsey Global Institure. 2008. “Accounting for the Cost of US Health Care: A New Look at Why Americans Spend More.” http://www.mckinsey.com/ insights/mgi/research/americas/accounting_for_ the_cost_of_us_health_care.
McKnight, Robin. 2006. “Home Care Reimbursement, Long-Term Care Utilization, and Health Outcomes.” Journal of Public Economics 90 (1–2): 293–323.
Medicare Payment Advisory Committee (MedPAC). 2003. “Report to the Congress: Variation and Innova-tion in Medicare.” Washington, D.C.: Medicare Pay-ment Advisory Committee.
Mello, Michelle M., Amitabh Chandra, Atul A. Gawande, and David M. Studdert. 2010. “National Costs of the Medical Liability System.” Health Affairs 29 (9): 1569–77.
Meltzer, David O., Elbert S. Huang, Sydney Brown, and Qi Zhang. 2005. “Implications of Patient Self-Selection for Preference Elicitation for Cost-Effec-tiveness Analysis.” Quality of Life Research 14 (9): 2113.
Miller, Mark E. 2005. “MedPAC Recommendations on Imaging Services.” Testimony Before the Subcom-mittee on Health, Committee on Ways and Means, U.S. House of Representatives.
Moseley, J. Bruce, Kimberly O’Malley, Nancy J. Petersen, Terri J. Menke, Baruch A. Brody, David H. Kuykendall, John C. Hollingsworth, Carol M. Ash-ton, and Nelda P. Wray. 2002. “A Controlled Trial of Arthroscopic Surgery for Osteoarthritis of the Knee.” New England Journal of Medicine 347 (2): 81–88.
Muennig, Peter A., and Sherry A. Glied. 2010. “What Changes in Survival Rates Tell Us About US Health Care.” Health Affairs 29 (11): 2105–13.
Murphy, Kevin M., and Robert H. Topel. 2006. “The Value of Health and Longevity.” Journal of Political Economy 114 (5): 871–904.
Nelson, Aaron L., Joshua T. Cohen, Dan Greenberg, and David M. Kent. 2009. “Much Cheaper, Almost as Good: Decrementally Cost-Effective Medical Inno-vation.” Annals of Internal Medicine 151 (9): 662–67.
Newhouse, Joseph P. 1992. “Medical Care Costs: How Much Welfare Loss?” Journal of Economic Perspec-tives 6 (3): 3–21.
Newhouse, Joseph P. 2002. “Medicare Policy: Medi-care.” In American Economic Policy in the 1990s, edited by Jeffrey A. Frankel and Peter R. Orszag, 899–955. Cambridge: MIT Press.
Newhouse, Joseph P., and Insurance Experiment Group. 1993. Free for All? Lessons from the RAND Health Insurance Experiment. Cambridge and
London: Harvard University Press.Nyman, John A. 1999. “The Value of Health Insurance:
The Access Motive.” Journal of Health Economics 18 (2): 141–52.
Organisation for Economic Co-operation and Develop-ment. 2010. OECD Health Data 2010. Washington, D.C.: Organisation for Economic Co-operation and Development.
Pauly, Mark V. 1980. Doctors and Their Workshops: Economic Models of Physician Behavior. Chicago and London: University of Chicago Press.
Pauly, Mark V., and Fredric E. Blavin. 2008. “Moral Hazard in Insurance, Value-Based Cost Sharing, and the Benefits of Blissful Ignorance.” Journal of Health Economics 27 (6): 1407–17.
Peterson, Chris L., and Rachel Burton. 2007. “U.S. Health Care Spending: Comparison with other OECD Countries.” Washington, D.C.: Congressio-nal Research Service.
Philipson, Tomas J, and Anupam B. Jena. 2006. “Who Benefits from New Medical Technologies? Estimates of Consumer and Producer Surpluses for HIV/AIDS Drugs.” Forum for Health Economics & Policy 9 (2).
Preston, Samuel H., and Jessica Y. Ho. 2009. “Low Life Expectancy in the United States: Is the Health Care System at Fault?” National Bureau of Economic Research Working Paper 15213.
Pritchard, R. S., Elliott S. Fisher, J. M. Teno, S. M. Sharp, D. J. Reding, W. A. Knaus, J. E. Wennberg, and J. Lynn. 1998. “Influence of Patient Prefer-ences and Local Health System Characteristics on the Place of Death: SUPPORT Investigators: Study to Understand Prognoses and Preferences for Risks and Outcomes of Treatment.” Journal of the Ameri-can Geriatric Society 46 (10): 1242–50.
Rau, Jordan. 2010. “Increase in Health Tests, Proce-dures Is Raising Costs in Frugal Utah.” Washington Post, May 18, A4.
Rizzo, John A., and Richard J. Zeckhauser. 2003. “Reference Incomes, Loss Aversion, and Physician Behavior.” Review of Economics and Statistics 85 (4): 909–22.
Roehrig, Charles, George Miller, Craig Lake, and Jenny Bryant. 2009. “National Health Spending by Medical Condition, 1996–2005.” Health Affairs 28 (2): W358–67.
Rothberg, Michael B., Senthil K. Sivalingam, Jared Ashraf, Paul Visintainer, John Joelson, Reva Klep-pel, Neelima Vallurupalli, and Marc J. Schweiger. 2010. “Patients’ and Cardiologists’ Perceptions of the Benefits of Percutaneous Coronary Intervention for Stable Coronary Disease.” Annals of Internal Medi-cine 153 (5): 307–13.
Schreyögg, Jonas, Michael Bäumler, and Reinhard Busse. 2009. “Balancing Adoption and Affordability of Medical Devices in Europe.” Health Policy 92 (2–3): 218–24.
Schröder, Fritz H., et al. 2009. “Screening and Prostate-Cancer Mortality in a Randomized European Study.” New England Journal of Medicine 360 (13): 1320–28.
Schwartz, Rachel M., Anastasia M. Luby, John W.

Journal of Economic Literature, Vol. L (September 2012)680
Scanlon, and Russell J. Kellogg. 1994. “Effect of Surfactant on Morbidity, Mortality, and Resource Use in Newborn Infants Weighing 500 to 1500 g.” New England Journal of Medicine 330 (21): 1476–80.
Schwartz, William B. 1987. “The Inevitable Failure of Current Cost-Containment Strategies: Why They Provide Only Temporary Relief.” Journal of the American Medical Association 257 (2): 220–24.
Shibley, Louise, Martin Brown, James Schuttinga, Mace Rothenberg, and Judith Whalen. 1990. “Cis-platin-Based Combination Chemotherapy in the Treatment of Advanced-Stage Testicular Cancer: Cost–Benefit Analysis.” Journal of the National Can-cer Institute 82 (3): 186–92.
Silber, Jeffrey H., Robert Kaestner, Orit Even-Shoshan, Yanli Wang, and Laura J. Bressler. 2010. “Aggressive Treatment Style and Surgical Outcomes.” Health Services Research 45 (6 Part 2): 1872–92.
Sirovich, Brenda E., Daniel J. Gottlieb, H. Gilbert Welch, and Elliott S. Fisher. 2005. “Variation in the Tendency of Primary Care Physicians to Intervene.” Archives of Internal Medicine 165 (19): 2252–56.
Skinner, Jonathan, and Douglas O. Staiger. 2009. “Tech-nology Diffusion and Productivity Growth in Health Care.” National Bureau of Economic Research Working Paper 14865.
Skinner, Jonathan , Douglas O. Staiger, and Elliott S. Fisher. 2006. “Is Technological Change in Medicine Always Worth It? The Case of Acute Myocardial Infarction.” Health Affairs 25 (2): W34–47.
Stein, Ben. 2006. “Note to the New Treasury Secretary: It’s Time to Raise Taxes.” The New York Times, June 25. http://www.nytimes.com/2006/06/25/business/yourmoney/25every.html?pagewanted=print.
Temel, Jennifer S., et al. 2010. “Early Palliative Care for Patients with Metastatic Non-small-Cell Lung Cancer.” New England Journal of Medicine 363 (8): 733–42.
Terasawa, Teruhiko, Tomas Dvorak, Stanley Ip, Gowri Raman, Joseph Lau, and Thomas A. Trikalinos. 2009. “Systematic Review: Charged-Particle Radiation Therapy for Cancer.” Annals of Internal Medicine 151 (8): 556–65.
Tu, Jack V., Chris L. Pashos, C. David Naylor, Erluo Chen, Sharon-Lise Normand, Joseph P. Newhouse, and Barbara J. McNeil. 1997. “Use of Cardiac
Procedures and Outcomes in Elderly Patients with Myocardial Infarction in the United States and Can-ada.” New England Journal of Medicine 336 (21): 1500–1505.
Wade, Nicholas. 2009. “Tests Begin on Drugs That May Slow Aging.” The New York Times, August 17, D1.
Weinstein, Milton C., and Jonathan Skinner. 2010. “Comparative Effectiveness and Health Care Spend-ing—Implications for Reform.” New England Jour-nal of Medicine 362 (5): 460–65.
Weintraub, William S., et al. 2008. “Effect of PCI on Quality of Life in Patients with Stable Coronary Dis-ease.” New England Journal of Medicine 359 (7): 677–87.
Weisbrod, Burton A. 1991. “The Health Care Quadri-lemma: An Essay on Technological Change, Insur-ance, Quality of Care, and Cost Containment.” Journal of Economic Literature 29 (2): 523–52.
Wennberg, David E., F. L. Lucas, John D. Birkmeyer, Carl E. Bredenberg, and Elliott S. Fisher. 1998. “Variation in Carotid Endarterectomy Mortality in the Medicare Population: Trial Hospitals, Volume, and Patient Characteristics.” Journal of the American Medical Association 279 (16): 1278–81.
Wennberg, John E., Elliott S. Fisher, and Jonathan Skinner. 2002. “Geography and the Debate over Medicare Reform.” http://content.healthaffairs.org/content/suppl/2003/12/02/hlthaff.w2.96v1.DC1.
White, Chapin. 2007. “Health Care Spending Growth: How Different Is the United States from the Rest of the OECD?” Health Affairs 26 (1): 154–61.
Wick, Wolfgang, Michael Weller, Martin van den Bent, and Roger Stupp. 2010. “Bevacizumab and Recur-rent Malignant Gliomas: A European Perspective.” Journal of Clinical Oncology 28 (12): E188–89.
Wolf, Richard. 2005. “A ‘Fiscal Hurricane’ on the Horizon.” USA Today, November 14. http://www.usatoday.com/news/washington/2005-11-14-fiscal-hurricane-cover_x.htm.
Wunsch, Hannah, Walter T. Linde-Zwirble, David A. Harrison, Amber E. Barnato, Kathryn M. Rowan, and Derek C. Angus. 2009. “Use of Intensive Care Services during Terminal Hospitalizations in Eng-land and the United States.” American Journal of Respiratory and Critical Care Medicine 180 (9): 875–80.