Embed Size (px)
Citation preview
Technology Impact Assessment
John M. AntleProfessor of Ag Econ & Econ
Montana State University
Roberto ValdiviaResearch Associate in Ag Econ & Econ
Montana State University
AquaFish CRSP Workshop on Investigation Discovery and Impact Assessment, San Diego, March 1, 2010
Objectives
• Motivation• Impact Assessment challenges• The Minimum Data approach to IA• Towards AquaFish CRSP Implementation
Motivation
The goal of the AquaFish CRSP is “…to develop more comprehensive, sustainable,
ecological and socially compatible, and economically viable aquaculture systems and innovative fisheries management systems in developing countries that contribute to poverty alleviation and food security.”
The Assessment Challenge• How to demonstrate that these goals have been met?
– H. Egna: “…we are more about reducing poverty than about fish.”– How can Aquafish projects demonstrate their technologies are likely to
reduce poverty and enhance sustainability of aquaculture systems?• DTAP: does income generation → poverty reduction?
• Need to quantify actual or potential impacts on populations of farm households using the improved systems made possible by the AquaFish CRSP
• Need to do this– with scientific credibility– in short amount of time at feasible cost– with sufficient accuracy to support informed decision
making
Approaches to Impact Assessment
• Observe actual impacts (ex post)– Pros: the real thing (?)– Cons
• Attribution problem• Lags in diffusion & adoption• Aggregate studies can’t measure many impacts• Data requirements, cost
• Estimate (simulate) actual and potential impacts (ex ante?)– Pros
• Solves attribution problem: simulations as “controlled experiments”• Can be applied to many populations• Can assess technologies actually in use or in development• Can link to “ex post” adoption & impact data
– Cons• Data & modeling: complex, spatially-explicit models • Ignoring key constraints to adoption could over-state impacts
– E.g., capital cost of ponds
Towards parsimonious impact assessmentMinimum-data (MD) approach• TOA-MD developed for analysis of ecosystem services
– Soil-Management CRSP Tradeoff Analysis Project– feasible with minimal population-level data– standardized model can be adapted to most systems– software in Excel, easy to learn & use
• TOA-MD extended to assess economic, environmental and social outcomes associated with technology adoption– Validated with case studies in USA, Kenya, Senegal
• MD analysis produced results within 10% of “full data” model, led to similar policy implications
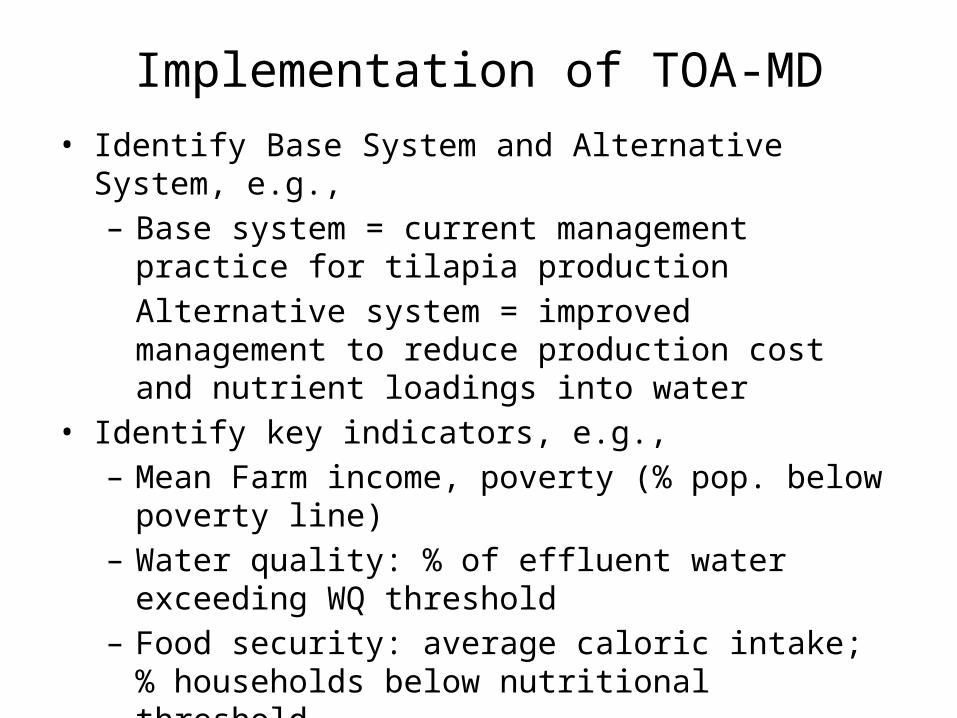
Implementation of TOA-MD• Identify Base System and Alternative System, e.g.,
– Base system = current management practice for tilapia productionAlternative system = improved management to reduce production cost and nutrient loadings into water
• Identify key indicators, e.g.,– Mean Farm income, poverty (% pop. below poverty line)– Water quality: % of effluent water exceeding WQ threshold– Food security: average caloric intake; % households below
nutritional threshold• Gender impact assessment, e.g.,
– Differentiate impacts by gender of household head– Impact on incomes of women
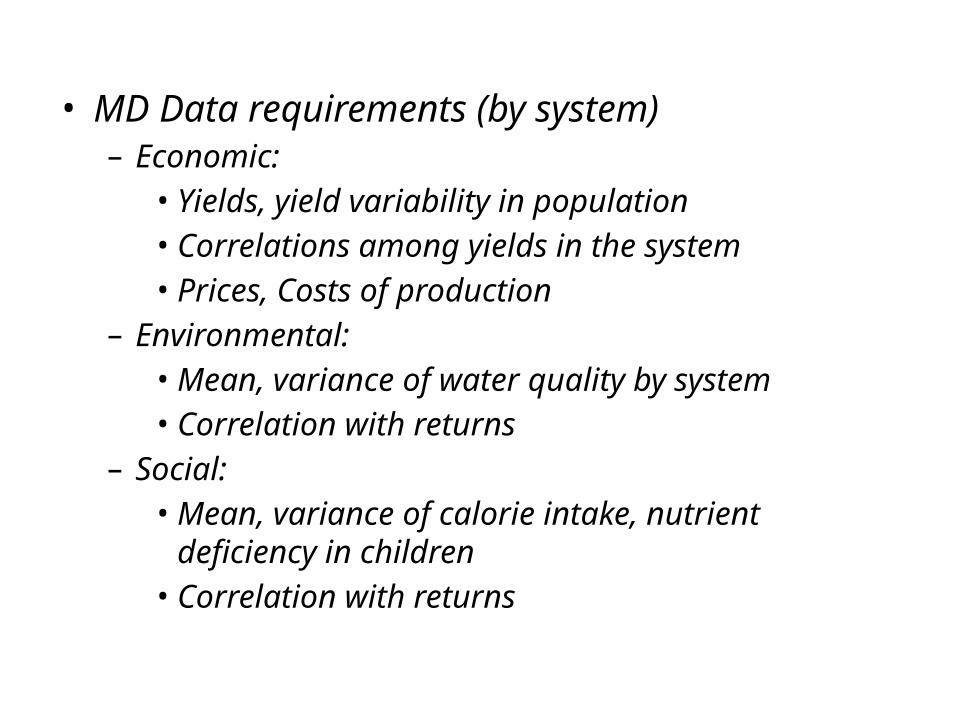
• MD Data requirements (by system)– Economic:
• Yields, yield variability in population• Correlations among yields in the system• Prices, Costs of production
– Environmental:• Mean, variance of water quality by system• Correlation with returns
– Social:• Mean, variance of calorie intake, nutrient deficiency in
children• Correlation with returns
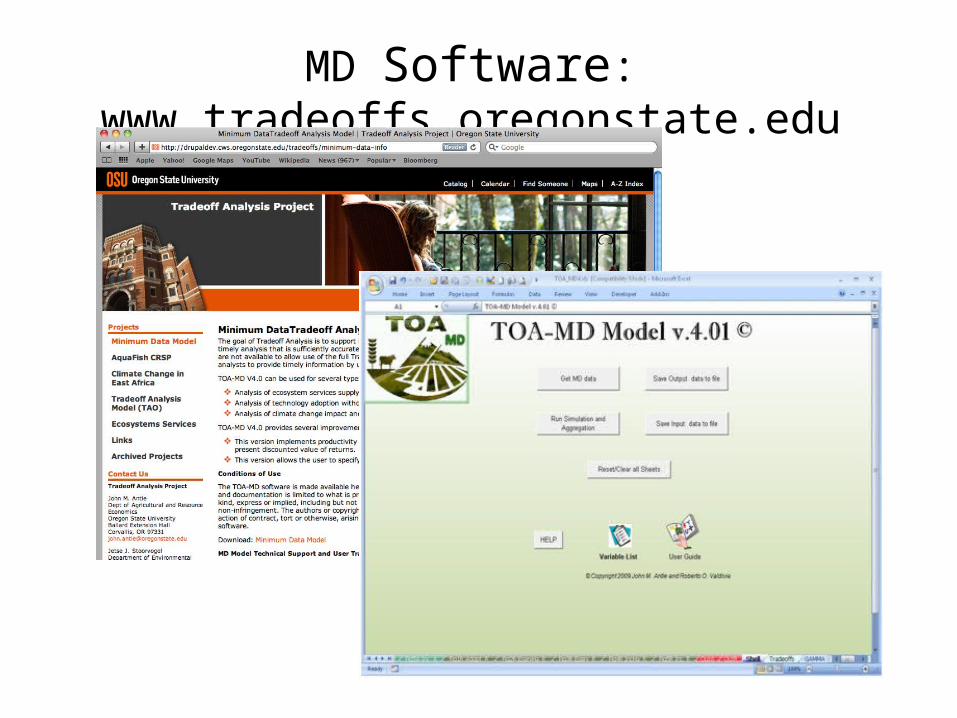
MD Software: www.tradeoffs.oregonstate.edu
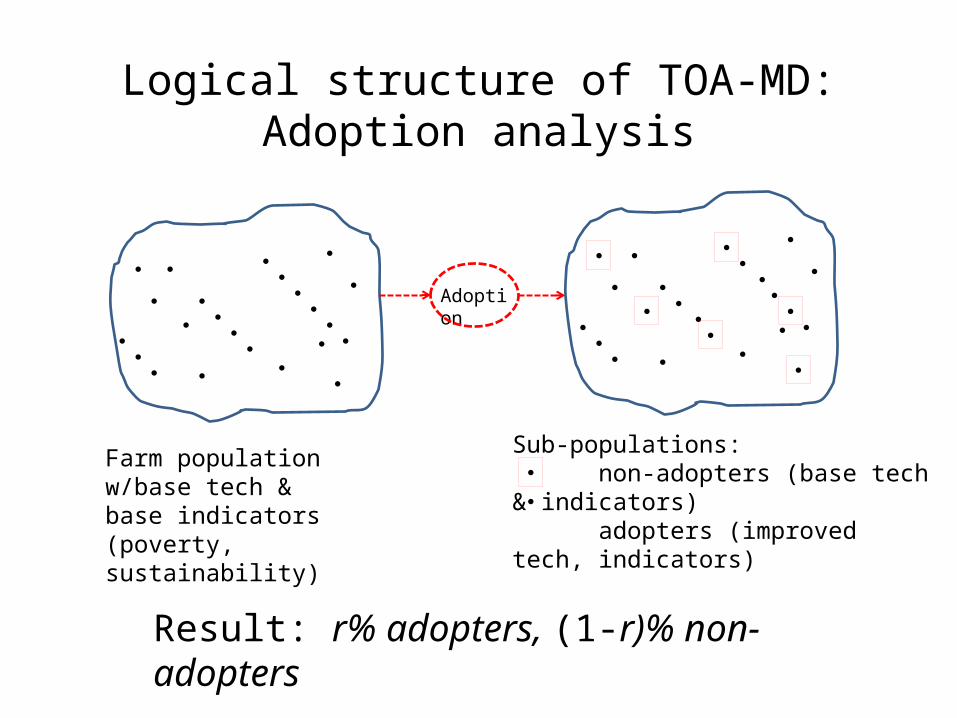
Logical structure of TOA-MD: Adoption analysis
Farm population w/base tech & base indicators (poverty, sustainability)
Sub-populations: non-adopters (base tech & indicators) adopters (improved tech, indicators)
Result: r% adopters, (1-r)% non-adopters
Adoption
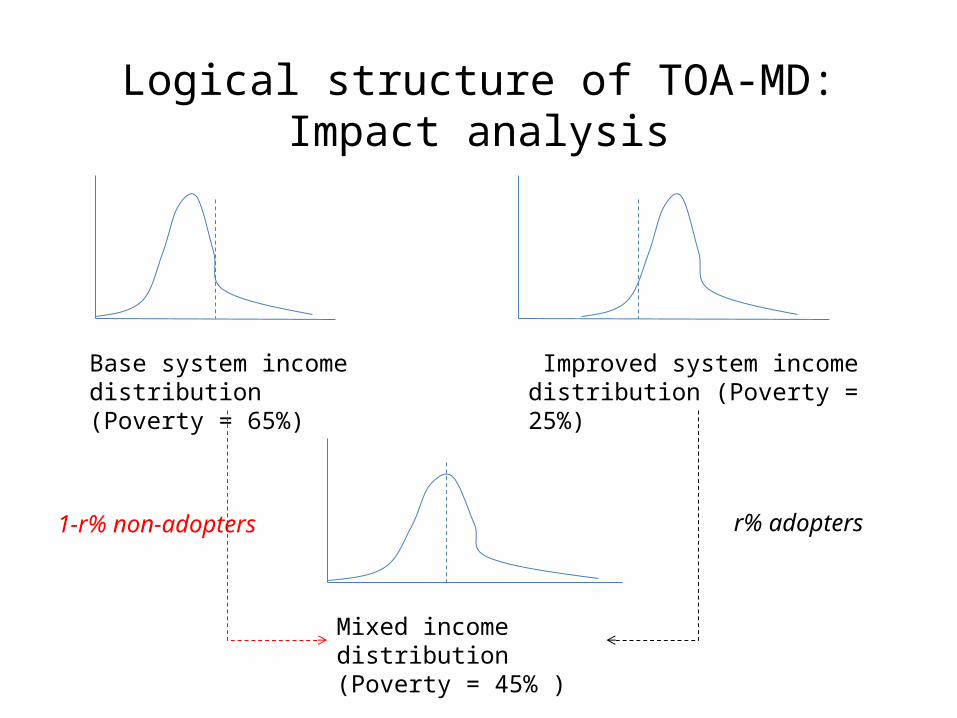
Logical structure of TOA-MD: Impact analysis
Base system income distribution (Poverty = 65%)
Improved system income distribution (Poverty = 25%)
Mixed income distribution (Poverty = 45% )
1-r% non-adopters r% adopters

Environmental /Health Parameters (means,
CVs, thresholds)
Farm Population Parameters (means and CVs of farm and family size, non-farm income)
Production system parameters (means and CVs of yield, mean cost , activity weights, within- and between-
system correlations)
Compute means and variances of returns by system, opportunity cost ,
adoption rate, ecosystem services
Tradeof f def inition (ES payment, adoption rate,
productivity change)
Compute environmental/health
indicators
Compute income distribution and poverty rate
Aggregate indicators across eco-regions
Construct regional and aggregate tradeof f
curves
Logical structure of TOA-MD analysis
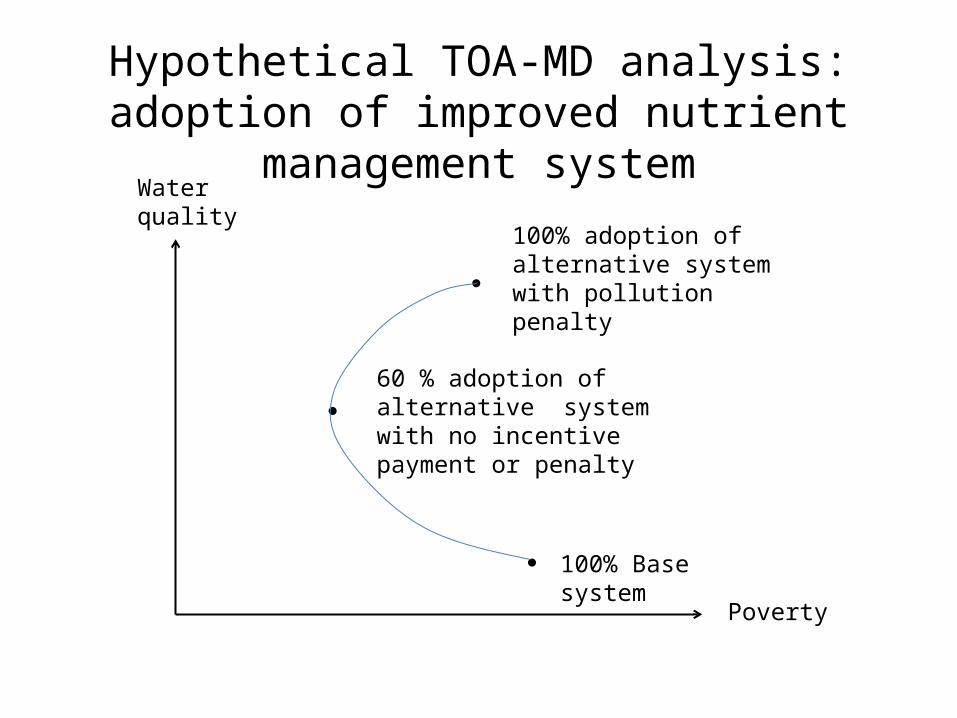
Water quality
Poverty
100% Base system
60 % adoption of alternative system with no incentive payment or penalty
100% adoption of alternative system with pollution penalty
Hypothetical TOA-MD analysis: adoption of improved nutrient management system
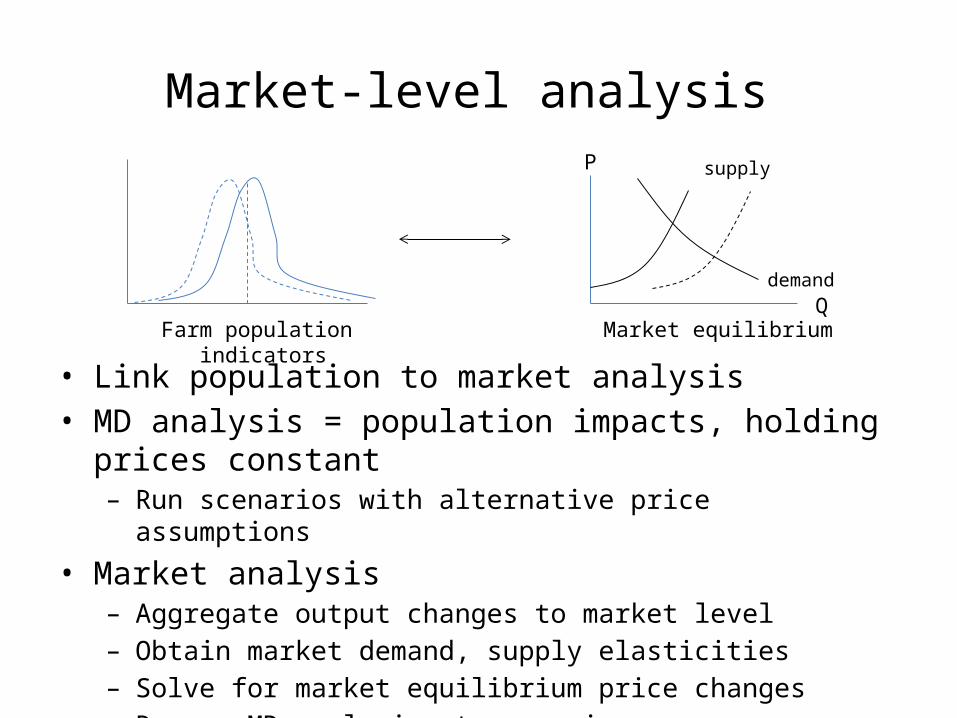
Market-level analysis
• Link population to market analysis• MD analysis = population impacts, holding prices constant
– Run scenarios with alternative price assumptions
• Market analysis– Aggregate output changes to market level– Obtain market demand, supply elasticities– Solve for market equilibrium price changes– Re-run MD analysis at new prices
Farm population indicatorsQ
P
demand
supply
Market equilibrium
Toward AquaFish CRSP Implementation
• Goal: work with projects to support technology IA• Afternoon session of this workshop:
– Existing IA plans & activities– Identify technologies and indicators– Impact Assessment Leader for each investigation
• Workshop on RD & IA• Data collection, preliminary analysis• Support from IA team• Follow-up meeting/workshop• Report results