Embed Size (px)
Citation preview
LEMLEMWORKING PAPER SERIES
Technology, profits and wages
Andrea Coveri a
Mario Pianta b
a University of Urbino, Italy.b Scuola Normale Superiore, Florence, Italy.
2019/35 November 2019ISSN(ONLINE) 2284-0400
1
Growinpro project Working Paper
Technology, profits and wages
Andrea Coveri University of Urbino
Mario Pianta Scuola Normale Superiore, Florence
Abstract
Building on a Post-Keynesian theoretical framework, integrated with an analysis of
technology, this article investigates the structural determinants of income distribution.
We develop a simultaneous model on wage and profit dynamics identifying as key
determinants productivity growth, capital-labour conflict, the relevance of trade unions
and different strategies of technological change and offshoring. We perform an industry-
level analysis on 38 manufacturing and service sectors for six major European countries
from 1994 to 2014. Wage and profit dynamics is shown to be rooted in structural change,
productivity growth and capital-labour conflict, with profits driven by product innovation
and offshoring, and wages rising faster where new products are relevant and trade unions
have a greater role.
Keywords:
Income distribution, innovation, offshoring, Europe, industries
JEL classification:
F15, J31, O33
This paper is part of the activities of the Growinpro project, funded by the European
Commission, http://www.growinpro.eu/
2
1. Introduction
The dynamics of wages and profits and the fall in the labour share have been investigated
by a large literature mainly at the macroeconomic level. In this article we explore their
complex determinants at the industry level, combining a Post-Keynesian approach on the
conflictual nature of income distribution, a focus on structural change, and consideration
of the patterns of technological change, offshoring and labour market institutions.
Our approach builds on the state of the art of this literature – that is reviewed in Section
2 below – and can be summarized as follows. First, labour productivity growth is the
fundamental driver for increases in wages and profits in industries, as it summarizes the
combination of supply and demand factors contributing to greater output.
Second, capital-labour conflict is a crucial determinant of the patterns of income
distribution. Industries’ value added is divided between wages and profits also on the
basis of this balance of power.
Third, we adopt an evolutionary perspective on the technological trajectories of
industries and their path-dependent nature. We distinguish between strategies of
technological competitiveness and cost competitiveness, exploring their distributional
implications.
Fourth, we consider how globalization has reshaped industries’ activities in advanced
countries; firms and industries are increasingly integrated in a global network of
production built along transnational value chains with extensive offshoring of production
activities. The search for greater profits is a key driver of this process and increases the
power of capital over labour with the “threat effect” that delocalization exerts on workers’
organizational capacity.

3
Fifth, the balance of power between capital and labour is fundamentally shaped by
social norms, employment protection legislation, patterns of collective bargaining and the
rise of precarious employment. The long run weakening of labour is reflected in the
decline of unionization in most advanced countries and the share of trade union
membership is considered as a relevant factor affecting wage dynamics.
The empirical investigation develops the model of Pianta and Tancioni (2008), in
which the conflictual dynamics of wages and profits and the relationships between
innovation, productivity and the distributive components are identified through panel data
estimations. We develop a simultaneous two-equation model to investigate the
determinants of the rate of growth of profits and wages. We perform an industry-level
analysis using the Sectoral Innovation Database (SID) covering 21 manufacturing and 17
service sectors for six major European countries (France, Germany, Italy, the
Netherlands, Spain and the United Kindgom) from 1994 to 2014.
Our results confirm that labour productivity growth is a key driver of both distributive
components, while a systematic negative relation between wage and profit increases is
detected. Product innovation is positively associated with both profit and wage growth;
conversely, new processes lead to a reduction of wages. Offshoring is a clear driver of
profits and a tool for reducing labour compensation. When distinguishing between high-
and low-tech offshoring strategies we find that the former contributes to profits while the
latter is detrimental for wages. Finally, union density is positively associated with wage
dynamics.
The structure of the paper is the following. Section 2 summarizes the state of the art
on the determinants of functional income distribution and presents the approach
developed here. Section 3 offers a brief description of the SID database. Section 4
4
provides descriptive evidence on the relationships between technology, offshoring, union
density and income distribution. Section 5 presents our simultaneous model on income
distribution and Section 6 discusses the estimation results. Section 7 provides an
interpretation of the main findings and draws some conclusions.
2. State of the art and proposed approach
Since the end of the Seventies a series of interrelated technological and structural factors
– together with a fundamental turning point in economic policy – have led to a greater
power of capital over labour resulting in major rise in income inequalities (Glyn, 2006;
Franzini and Pianta, 2016).
Studies on the long-term decline of the labour share of income have provided different
explanations. The neoclassical approach has identified technological progress and
globalization as the most relevant factors affecting income distribution (Bentolila &
Saint-Paul, 2003; Bassanini and Manfredi, 2014; European Commission, 2007; IMF,
2017a; Karabarbounis and Neiman, 2014; OECD, 2018a). According to these studies,
Information and Communication Technology (ICT) has led to a capital-biased
technological change, promoting both a decline in the price of capital relative to labour
and a replacement of workers (in particular those who perform routine jobs that can be
more easily automatized) with machines (Acemoglu and Restrepo, 2017, 2018). The
consequence is an increase in the capital-output ratio, which in turn reduces the labour
share to the extent that the elasticity of substitution between capital and labour is found
to be larger than one (e.g. Bassanini & Manfredi, 2014; Karabarbounis and Neiman,
2014). Moreover, the impact of internationalization of production on the wage share
emerges as crucial; in the neoclassical framework, capital-abundant countries offshore
labour-intensive tasks in labour-abundant countries. This results in a growing capital-

5
output ratio in the former ones and – whether capital acts as a gross substitute for labour
– in a declining labour share (Bassanini and Manfredi, 2014; European Commission,
2007; IMF, 2017a). Moreover, technology and trade are interrelated, since the former
may be induced by the latter (Bloom et al., 2013, 2016).
The Post-Keynesian literature pointed out the shift in the balance of power between
capital and labour as the primary factor explaining the decline of the wage share in
national income and the growth slowdown in last four decades (Onaran and Obst, 2016).
Although the role of technological change is considered in the most recent empirical
studies (Guschanski and Onaran, 2017, 2018; Stockhammer, 2017), major prominence is
given to the role of labour market institutions, globalization, financialization and welfare
state retrenchment (Stockhammer, 2009, 2013). According to this stream of research, the
change of paradigm in economic policy occurred in the Eighties has led to new
institutional arrangements harmful to workers; in particular, it resulted in a downsizing
of the welfare state and a sharp reduction of union density and collective bargaining
coverage, while labour market reforms reduced employment protection legislation and
spread precarious work (Bengtsson, 2014a; Charpe, 2011; Stockhammer, 2013).
Globalization has favored the most mobile (rather than the most abundant) production
factor, i.e. capital, and has supported offshoring practices aimed at reducing labor costs
(Jayadev, 2007; Rodrik, 1997; Stockhammer, 2017). Financialization enhanced the fall-
back options of capital and increased the shareholder value orientation of firms, with
major consequences in terms of corporate governance and workers’ bargaining capacity
(Dunhaupt, 2016; Kohler et al., 2018; Lin and Tomaskovic-Devey, 2013). One of the few
studies at the industry-level is by Guschanski and Onaran (2017), who investigated the
determinants of the wage share for 14 countries from 1970 to 2014, finding a key negative
6
role played by offshoring (mainly to emerging countries and Eastern Europe), welfare
state retrenchment, decrease of union density and rise in inequality. Moreover, they find
that Total Factor Productivity and capital intensity have a negative impact on the labour
share until the mid-Nineties, although the soundness of these relationships remains
questionable (Felipe and McCombie, 2013).
Recent studies have addressed the personal income distribution documenting the rise
in inequalities since the Eighties (Atkinson et al., 2011; Piketty and Saez, 2003; Tridico,
2018). As shown by Daudey and Garcia-Penalosa (2007) and Atkinson (2009), functional
income distribution is a key determinant of the personal distribution of income and the
rise in inequality. These findings are supported by Wolff and Zacharias (2013), who show
the crucial role of inter-class inequality in explaining the increase of personal income
inequality.
Other recent studies on the determinants of wage and profit dynamics (Abdih and
Danninger, 2018; Bogliacino, Guarascio and Cirillo, 2018; IMF, 2017b) have considered
the role of technology, offshoring and labour market institutions, issues that are examined
below.
2.1 Innovation
Following an evolutionary perspective, the diversity in the patterns of technological
change in industries are put at the centre of our investigation (Dosi, 1982, 1988; Breschi
et al., 2000); we account for the technological trajectories of sectors by using the Pavitt
(1984) taxonomy as revisited by Bogliacino and Pianta (2010, 2016).
Most important, we introduce a distinction between strategies of technological
competitiveness, based on new products, and of cost competitiveness relying on new
processes (Pianta, 2001). The former is conceived as the “high road” to competitiveness,

7
aimed at improving the quality of goods, open up new markets, and match the evolution
of effective demand (Pasinetti, 1981); such a strategy may provide room for an expansion
of both profits and wages. Furthermore, at the firm level, a technological competitiveness
strategy relies more on cooperation among workers, taking advantage of employees’
cumulative knowledge and favoring their skill upgrading that are associated to a sharing
of the rents from innovation and to higher wages (Buchele and Christiansen, 1999;
Cantwell, 2005; Kleinknecht et al., 2016).
On the other hand, a cost competitiveness strategy that replaces labour with new
machinery is likely to have a positive effect on profits due to the lower overall labour
compensation and to the possibility of reducing prices expanding market shares.
Moreover, this strategy can further depress workers’ bargaining power and wages through
the threat of automation and firing (Bogliacino, 2009; Cirillo, 2017; Vivarelli, 2014).
2.2 Offshoring
Since the Eighties, worldwide liberalization of trade and capital markets, along with the
new global strategies ny multinational corporations on location of production and the
sources of supply for intermediate goods (namely offshoring practices), has led to the
emergence of hierarchical global values chains, marked by economic and technological
asymmetries among the economic actors involved (Milberg and Winkler, 2013).
Stockhammer (2017) provides an empirical analysis for advanced and developing
countries for the period 1970-2007 and detects globalization as a prominent determinant
of the wage share. International trade has affected income distribution through a change
in the bargaining position of capital and labour; these findings support a critique of the
view of trade-distribution nexus proposed by Classical trade theory stemming from the
Stolper and Samuelson (1941) theorem. However, in this country-level investigation,
8
trade openness is used as a standard proxy for globalization (Harrison, 2005; Jayadev,
2007), not properly addressing the international fragmentation of production fostered by
the rise of intermediate inputs trade (Feenstra and Hanson, 1996; Hummels et al., 2001).
The industry-level analysis that we carry out is particularly suitable for investigating
the global flows of intermediate inputs and their effects on income distribution. First, we
capture the impact of international fragmentation of production using different offshoring
proxies developed by Feenstra and Hanson (1996, 1999). Second, we argue that the
technological capabilities of industries represent a crucial factor defining their position in
global value chains (Simonazzi et al., 2013). We distinguish between high- and low-tech
flows of imported intermediate inputs according to the knowledge base of foreign
industries which source the intermediate inputs (Guarascio et al., 2015), as their effects
on profits and wages are likely to be different.
Offshoring processes might exert a positive impact on industries’ profits for two main
reasons. First, the engagement in global supply chains provides firms with cheaper
intermediate inputs for production (especially through low-tech offshoring) and gives
access to new supply sources of commodities and non-domestically produced varieties of
goods. Second, the internationalization of business strategies may entail major
organizational improvements, the availability of advanced technologies, the indirect
access to foreign final markets and the possibility of taking advantage of international
technological spillovers (especially in high-tech offshoring-intensive industries) (Campa
and Goldberg, 1997; Colantone and Crinò, 2014; Pöschl et al., 2016; Tajoli and Felice,
2018).
On the other hand, the effect of offshoring on wages is likely to be negative. Firms
with high organizational capabilities and located in capital-abundant countries joined
9
global networks of production to localize strategically labour-intensive tasks in
developing and newly industrialized countries (including Eastern European countries,
China, Asian economies, etc.), where wages are lower and employment protection, fiscal
and environmental regulations are far less stringent (Rodrik, 1997; Feenstra, 1998). For
the same reasons, they can import low-priced intermediate inputs from abroad, ending
domestic production and laying off workers. Offshoring is thus likely to represent a
credible threat against workers’ rights and claims for higher wages (Burke and Epstein,
2001; Choi, 2001; Kramarz, 2017).
Nonetheless, all the effects potentially exerted by offshoring activities on income
distribution are conditioned by the technological and institutional characteristics of firms
and industries (Freeman and Louca, 2001). While low-tech offshoring is likely to reduce
wage growth, the foreign sourcing of high-tech inputs might instead be a signal of a more
technology-oriented competitive strategy (Guarascio et al., 2015). As far as it triggers
technological complementarities between domestic and foreign industries, of both static
(i.e. as input-output links) and dynamic nature (i.e. as interdependencies and feedbacks),
high-tech offshoring could entail a knowledge-based upgrading of firms’ productive
system, enhancing domestic workers’ skills, with a positive impact on their remuneration.
On the other hand, an increasing acquisition of high technology and external knowledge
from abroad might be the signal of a technological dependence linked to the subordinated
position occupied in the global value chain by a certain industry, thus restricting room for
wage increases.
2.3 Union density
Labour market institutions represent a further element with major impact on income
distribution. According to a Post-Keynesian perspective of labour market functioning, a
10
strong employment protection legislation is a key factor shaping workers’ bargaining
power and thus distributive patterns (Stockhammer et al., 2014; Brancaccio et al., 2018).
The limited availability of industry-level data leads us to consider industries’ union
density as a good proxy of the bargaining position of workers; the rationale is that more
unionized industries are expected to be the ones in which coordinated collective
bargaining is wider and pro-labour employment and social standards are more binding.
The evidence in this regard is significant. Bengtsson (2014b) estimated a panel model
for 16 advanced economies over the period 1960-2007, finding an overall positive
association between union density and wage share. Tridico (2018) made use of panel
estimation techniques to assess the role of financialization, labour flexibility, trade union
density and public social spending as determinants of personal income inequality for 25
OECD countries from 1990 to 2013, finding a significant negative relationship between
unionization and the Gini index. IMF researchers Jaumotte and Buitron (2015) performed
an empirical analysis for 20 developed countries over the period 1980-2010 and showed
that the long-run decline of unionization inside and outside Europe has considerably
reduced the ability of workers’ organizations to increase wages. OECD (2018b) has
recently confirmed these findings, highlighting that coordinated collective bargaining
systems are linked with better employment outcomes and lower wage inequality.
Since the time period covered by our database starts in the mid-Nineties, i.e. after a
couple of decades during which industrial relations have been reshaped and union density
has experienced a major decline, the expected positive impact of sectoral union
membership rate on labour compensation might be mitigated. A similar result would be
consistent with the one by Pontusson (2013), who finds that – since the Seventies – OECD
countries in which union density is declined strongly have experienced relatively higher
11
increases in income inequality, but this relationship seems to be weaker since the early
Nineties.
Finally, we argue that powerful trade unions and centralized collective bargaining
systems may also have a separate negative effect on profits. Insofar as unions are able to
monitor the unfolding of the working process – e.g. ensuring respect for the safety
conditions of workers in the workplace with the aim of protecting their welfare and
minimizing occupational accidents –, the “rigidities” within the production process
become more binding and the monitoring and organizational costs for firms are likely to
rise.
3. The Sectoral Innovation Database
The database we use in our analysis is the Sectoral Innovation Database (SID), which has
been developed at the University of Urbino. This dataset includes industry-level data for
six major European countries – France (FR), Germany (DE), Italy (IT), the Netherlands
(NL), Spain (ES) and the United Kingdom (UK) –, which represent a very large part of
the European economy (75% of the entire EU28’s GDP). The time span covered by the
dataset is 1994-2014.1
Data are available for the two-digit NACE Rev. 1 classification for 21 manufacturing
and 17 service sectors (listed in Appendix) and refer to total activities of industries. To
fulfill the requisite conditions for comparability, all data from 2008 onwards have been
converted into NACE Rev. 1 using the conversion matrix provided by Perani and Cirillo
(2015).2 All the monetary variables have been converted in euros and adjusted for PPP
using the index provided in Stapel et al. (2004, p. 5).
As regards the technological efforts of industries, we identify the following key
innovation variables among those included in the SID: share of firms introducing product
12
innovations, share of firms introducing process innovations, share of firms introducing
innovations to open up new markets or increase market share and the expenditure in the
acquisition of new machinery and equipment per employee. Data are drawn from the
following five European Community Innovation Surveys (CIS) collected by Eurostat:
CIS 2 (1994-1996), CIS 3 (1998-2000), CIS 4 (2002-2004), CIS 7 (2008-2010) and CIS
9 (2012-2014). The latter five survey waves are matched with economic, productive
structure and labour market data at industry level. The monetary innovation variable,
namely the expenditure in new machinery and equipment, has been deflated (base year
2000) using the aggregate value added deflator provided by OECD-STAN.
Concerning the economic and distributive dynamics of sectors, we focus on the
growth pattern of wages, profits, employment and labour productivity. Wage and
productivity variables are expressed in worked hours, whereas profits are gross operating
surplus and employment is measured as the number of employees (in thousands) at
industry level. Data are drawn from OECD-STAN and the Socio Economic Accounts
(SEA) released by the World Input-Output Database (WIOD). Value added and demand
variables – namely domestic final demand and exports – have been deflated (base year
2000) using the sectoral value added deflators provided by WIOD-SEA.
We use four different offshoring indicators built exploiting the World Input-Output
Tables (WIOT) provided by the WIOD (Timmer et al., 2016). The first one is the ‘broad’
offshoring indicator, computed as the ratio between the expenditure for the intermediate
inputs imported by a given industry from whatever foreign industries and the expenditure
for the total intermediate inputs used by that industry. The ‘narrow’ offshoring indicator
consists instead in the ratio between the expenditure of a given industry for the
intermediate inputs imported from foreign industries of the same type (corresponding to

13
the diagonal terms of the import-use matrix) and the expenditure for the total intermediate
inputs used by that industry (Feenstra and Hanson, 1996, 1999).3 Furthermore, we relate
the international fragmentation of production with its technological dimension
discriminating intermediate inputs according to their origin (domestic or imported) and
their technological content (Guarascio et al., 2015). In this regard, we build on the
Revised Pavitt Taxonomy provided by Bogliacino and Pianta (2010, 2016) and adopt the
following criterion: Science based or Specialized suppliers industries are classified as
high-tech industries (HT) and the imported intermediate inputs coming from these
industries represent the numerator of the high-tech offshoring indicator; Scale and
information intensive industries are classified as low-tech industries (LT) and the
imported intermediate inputs coming from these industries represent the numerator of the
low-tech offshoring indicator.
Finally, the role of labour market institutions is capture by union density – computed
as the share of union membership at industry level – drawn from the ICTWSS database
(Visser, 2016).
The dataset is a panel over five periods covering a time span from 1994 to 2014.
Economic, distributive and offshoring variables are computed for the periods 1996-2000,
2000-2003, 2003-2008, 2008-2012 and 2012-2014; this periodization effectively account
for business cycles in European industries. For the economic and distributive variables
we compute the compound annual growth rate that approximates the difference in
logarithmic terms, while for the offshoring indicators we take the simple difference
between the last and the first year of each period.
Innovation variables are taken from five waves of innovation survey: the first wave
(CIS 2) refers to 1994-1996 and is linked to the first period of economic variables; the

14
second wave (CIS 3) spans 1998-2000 and is linked to the second period of economic
variables; the third wave (CIS 4) refers to 2002-2004 and is linked to the third period of
economic variables); the fourth wave (CIS 7) spans 2008-2010 and is linked to the fourth
period of economic variables; the fifth wave (CIS 9) refers to 2012-2014 and is linked to
the fifth period of economic variables.4
Finally, union density refers to the first year of each of the five economic period, i.e.
1996, 2000, 2003, 2008, 2012, and are computed as the union membership rate at industry
level.5
4. Descriptive evidence
In this section we summarize the main relationships between wages, profits and their key
drivers using a set of figures where individual industries are aggregated on the basis of
their technological intensity in four Revised Pavitt classes, defined by Bogliacino and
Pianta (2010, 2016). The classes include Science based industries (SB), Specialized
suppliers industries (SS), Scale and information intensive industries (SI) and Supplier
dominated industries (SD).
In figures 2 to 5 the first two characters of each observation stand for the country (FR
stands for France, DE for Germany, IT for Italy, NL for the Netherlands, ES for Spain
and UK for the United Kingdom), while the last two ones identify the Revised Pavitt
class.
4.1 The role of technology
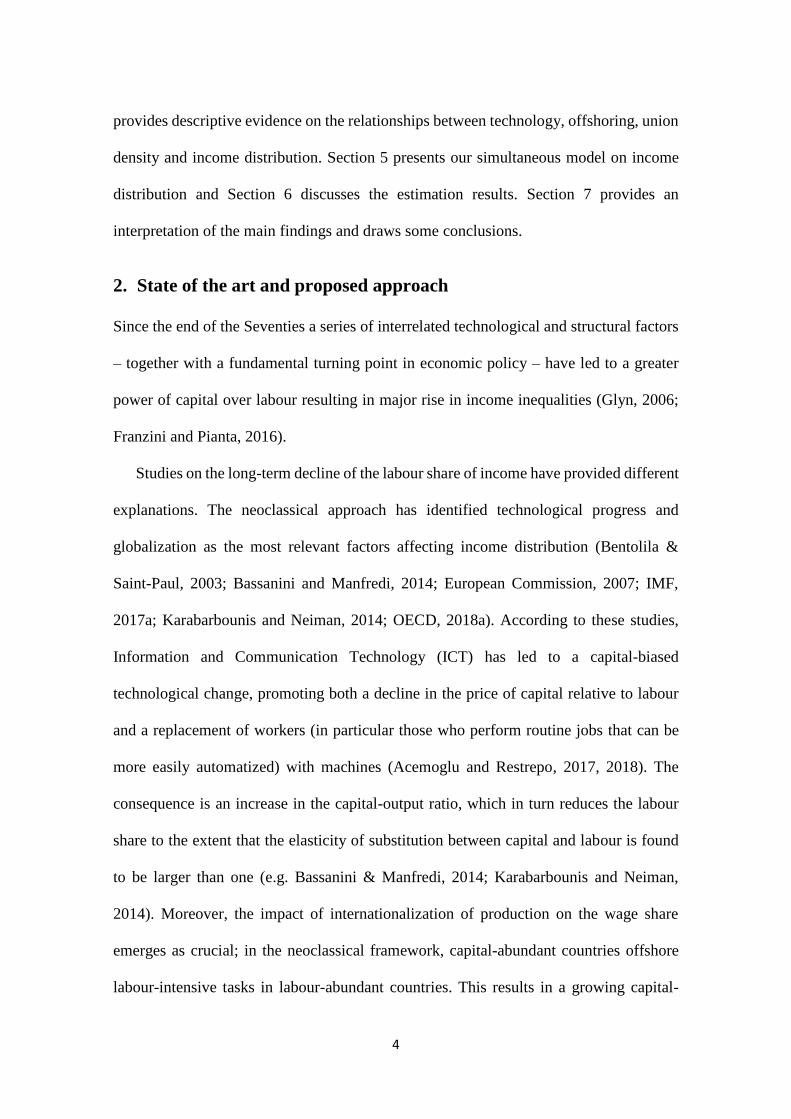
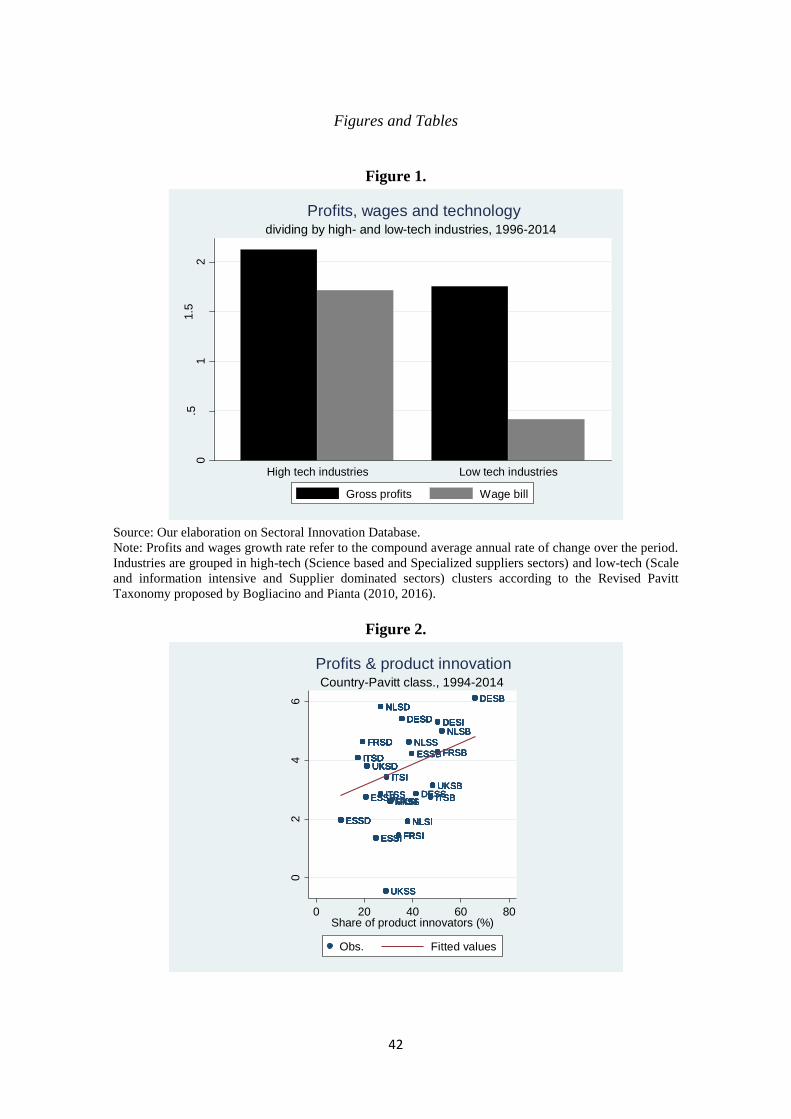
Profits have always grown faster than wages. The role of technology is shown in Figure
1 where high and low technology industries are divided. Both gross profits and the wage
bill have grown faster in industries with stronger technological activities, with a major
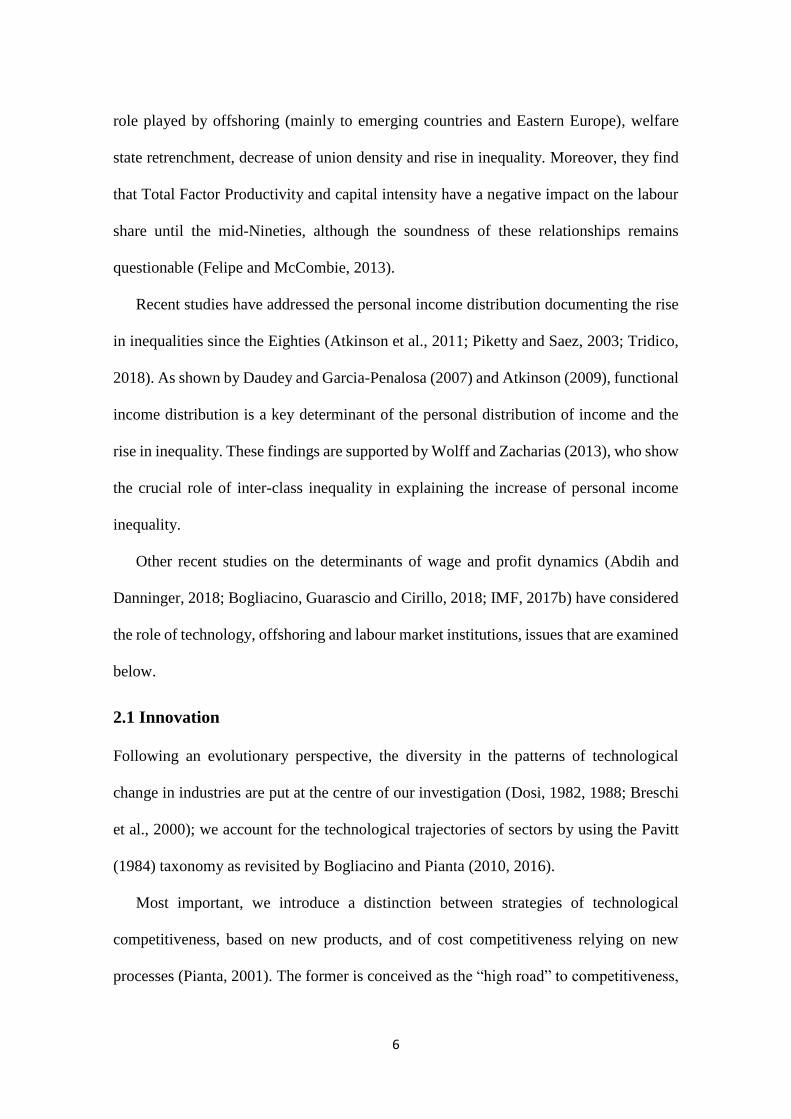
gap in the case of wages. But different technological strategies have to be considered, and

15
Figure 2 highlights the positive relationship between the introduction of product
innovation and the growth rate of profits per hour worked for the four Revised Pavitt
classes in the six countries; profits growth is associated to the capability of industries to
offer new products that capture potential demand, pursuing a technological
competitiveness strategy. More technologically advanced economies (e.g. Germany)
have greater product innovation and obtain higher profits than less dynamic economies
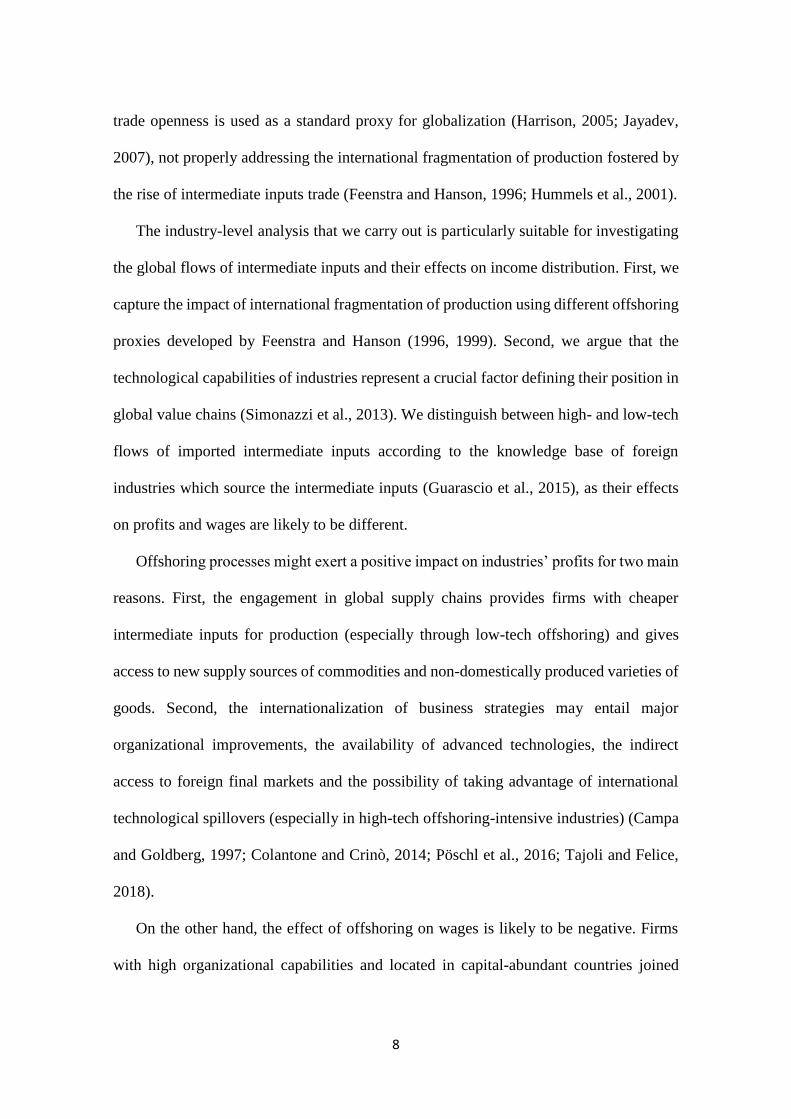
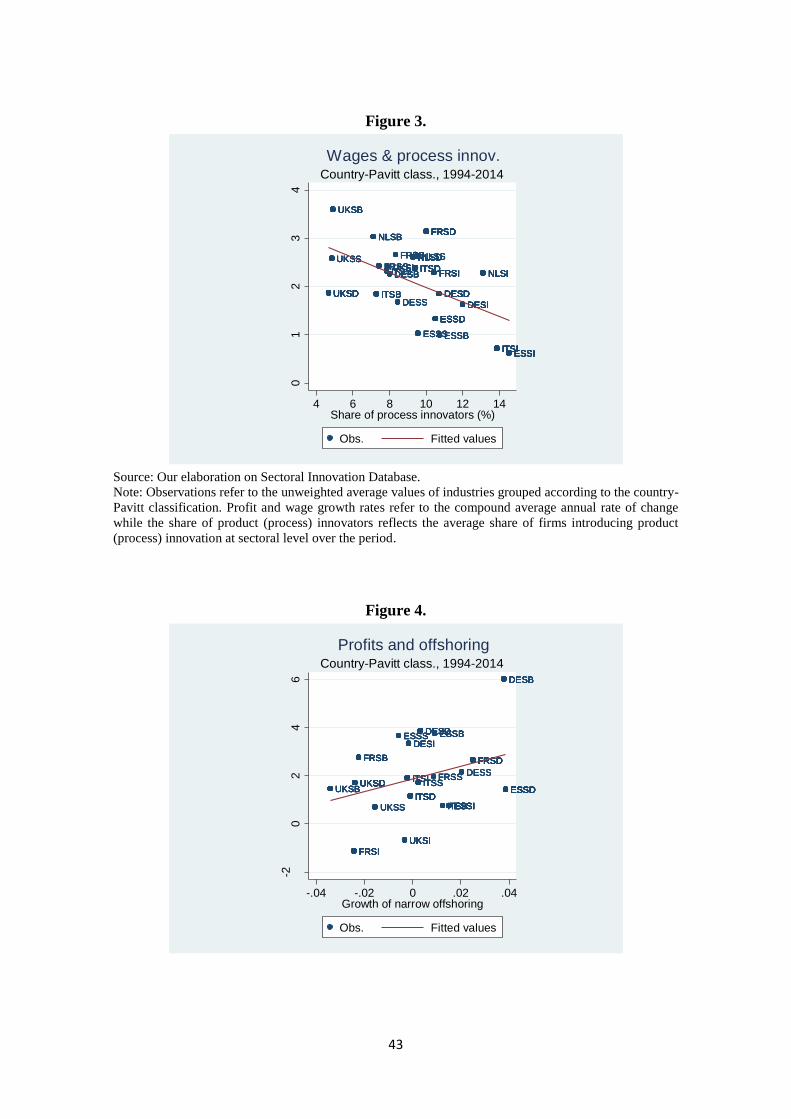
(e.g. Spain) do. In Figure 3 we find a clear negative relationship between the growth of
wages per worked hour and the intensity with which industries introduce process
innovations, showing that sectors and countries that are mainly committed to pursuing a
cost competitiveness strategy experience lower wage growth.6
[FIGURES 1, 2, 3 ABOUT HERE]
4.2 The role of offshoring
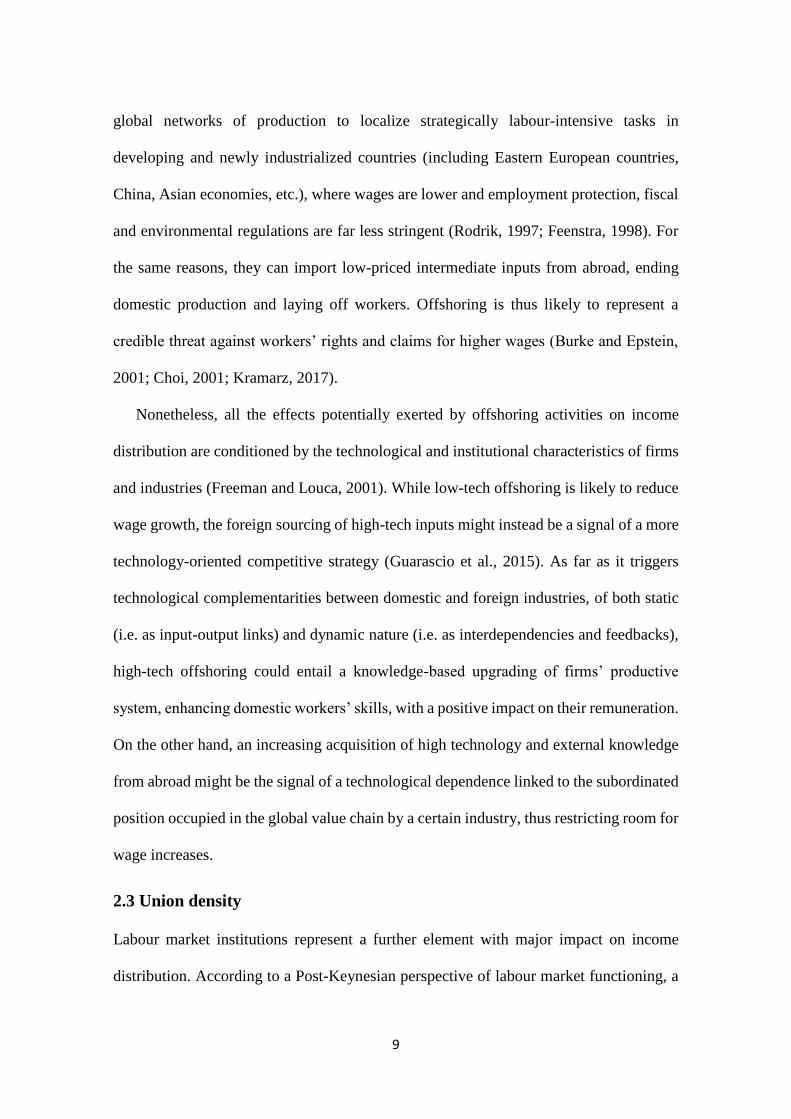
Figure 4 shows the empirical relationship between the rate of growth of gross profits and
change in ‘narrow’ offshoring intensity (the share an industry’s intermediate inputs
imported from the same industry).7 The graph shows a high heterogeneity and a broad
positive relationship between international production and profits. Conversely, Figure 5
shows the opposite, negative relationship between the change in ‘narrow’ offshoring and
the growth of wages per worked hour. Industries more exposed to international relocation
of production have a lower wage dynamics in Europe, confirming the findings of the
literature.
[FIGURES 4, 5 ABOUT HERE]

16
4.3 The role of trade unions
Figure 6 provides a summary of the effect of industries’ union membership rates on profit
and wage dynamics. For this purpose, we defined high- and low-union density industries
as those above or below the median value of this indicator. Wage growth is significantly
higher in industries characterized by a higher union membership rate, while in industries
with low union density the growth of profits is twice as high as in sectors with above-
median union density.
[FIGURE 6 ABOUT HERE]
5. A simultaneous model for the dynamics of wages and profits
In order to explain the drivers of wages and profits in European industries we build on
the approach proposed by Pianta and Tancioni (2008) and develop a simultaneous model
where changes in profits and wages are explained by labour productivity growth, capital-
labour conflict, heterogenous innovation strategies, international fragmentation of
production and labour market institutions.
- The dynamics of labour productivity is viewed as a major driver of industries’ growth
and decline (Pasinetti, 1981), capturing the effects of new capital investment, overall
demand dynamics, as well as the organizational improvements carried out by industries
(Pianta and Tancioni, 2008). In this regard, a robust labour productivity growth expands
the ‘cake’ of value added that can then be divided between profits and wages; a higher
growth of the ‘cake’ softens the distributive conflict as it allows room for expanding both
distributive components.

17
- The growth of wages is expected to be negatively affected by the dynamics of profits
and, conversely, profit growth is expected to be constrained by wages. This formulation
allows to account for the conflictual nature of income distribution.
- We distinguish the separate effects of product and process innovation as they are likely
to have different impact on wages and profits.
- The growing importance of transnational value chains and its impact on income
distribution is captured by different offshoring proxies.
- The share of unionised workers in total industry employment is used to account for the
role played by labour market institutions and for considering the bargaining power of
workers that may support higher wage dynamics or contain profits.
In section 3 on data we have already defined in detail each variable used in the
econometric analysis.
5.1 The wage equation
On the basis of the theoretical considerations provided in the previous sections, we set up
the following log-linear equation for the determination of wage dynamics:
𝑙𝑜𝑔(𝑊𝑖𝑗𝑡) = 𝛼1𝑙𝑜𝑔(𝑃𝑅𝑂𝐹𝑖𝑗𝑡) + 𝛼2𝑙𝑜𝑔(𝑃𝑅𝑂𝐷𝑖𝑗𝑡) + 𝛼3 𝑙𝑜𝑔(𝑁𝑃𝑖𝑗𝑡) +
𝛼4𝑙𝑜𝑔(𝑀𝐴𝐶𝐻𝑖𝑗𝑡) + 𝛼5𝑙𝑜𝑔(𝑂𝐹𝐹𝑆𝐻𝑖𝑗𝑡)+ 𝛼6𝑙𝑜𝑔(𝑈𝐷𝑖𝑗𝑡) + 𝑢𝑖𝑗 + 𝜀𝑖𝑗𝑡
where i, j and t identify, respectively, industry at two-digit level according to NACE (Rev.
1) classification, country and time.
Wage per worked hour is indicated by W, while PROF stands for gross profits at
sectoral level.8 Industry labour productivity is indicated by PROD. The two main
directions of technological change are represented by the importance of new products
(NP) and by the expenditure in new process-related machinery (MACH). The measures
18
of offshoring (OFFSH) include both the ‘narrow’ offshoring indicator (Feenstra and
Hanson, 1999) and the technology-based offshoring proxy developed by Guarascio et al.
(2015), distinguishing between high-tech and low-tech offshoring strategies. The role
played by labour market institutions is captured by UD, which stands for union
membership rate in industries. Finally, u controls for time-invariant fixed effects and 𝜀
represents the standard idiosyncratic error term.
By taking the first difference of the equation we get rid of time-invariant components,
reducing potential endogeneity bias. Hence the final formulation of the wage equation is
the following:
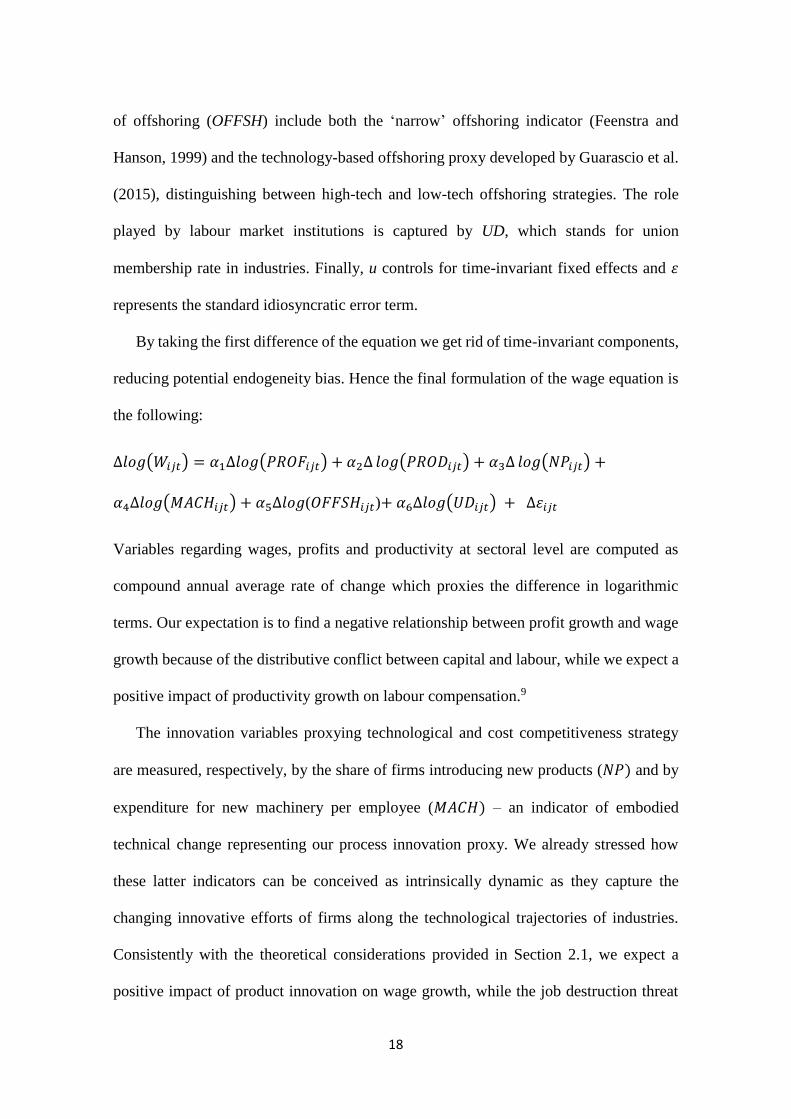
∆𝑙𝑜𝑔(𝑊𝑖𝑗𝑡) = 𝛼1∆𝑙𝑜𝑔(𝑃𝑅𝑂𝐹𝑖𝑗𝑡) + 𝛼2∆ 𝑙𝑜𝑔(𝑃𝑅𝑂𝐷𝑖𝑗𝑡) + 𝛼3∆ 𝑙𝑜𝑔(𝑁𝑃𝑖𝑗𝑡) +
𝛼4∆𝑙𝑜𝑔(𝑀𝐴𝐶𝐻𝑖𝑗𝑡) + 𝛼5∆𝑙𝑜𝑔(𝑂𝐹𝐹𝑆𝐻𝑖𝑗𝑡)+ 𝛼6∆𝑙𝑜𝑔(𝑈𝐷𝑖𝑗𝑡) + ∆𝜀𝑖𝑗𝑡
Variables regarding wages, profits and productivity at sectoral level are computed as
compound annual average rate of change which proxies the difference in logarithmic
terms. Our expectation is to find a negative relationship between profit growth and wage
growth because of the distributive conflict between capital and labour, while we expect a
positive impact of productivity growth on labour compensation.9
The innovation variables proxying technological and cost competitiveness strategy
are measured, respectively, by the share of firms introducing new products (𝑁𝑃) and by
expenditure for new machinery per employee (𝑀𝐴𝐶𝐻) – an indicator of embodied
technical change representing our process innovation proxy. We already stressed how
these latter indicators can be conceived as intrinsically dynamic as they capture the
changing innovative efforts of firms along the technological trajectories of industries.
Consistently with the theoretical considerations provided in Section 2.1, we expect a
positive impact of product innovation on wage growth, while the job destruction threat

19
stemming from the introduction of process innovation is expected to exert a negative
effect on labour compensation growth.
The variation of offshoring is computed as the simple difference in the value of the
share of imported inputs between the last and the first year of each time period under
observation.10 As discussed above, we expect to find a negative impact on wages of
‘narrow’ offshoring and of foreign sourcing from low-tech industries, while the impact
of high-tech offshoring on wages is more difficult to predict.
Finally, union density is computed as share of union members in total employment in
each industry at the beginning (i.e. in the first year) of every time windows. As our proxy
of workers’ bargaining power, we expect it to have a positive impact on wages.
5.2 The profit equation
The second equation of our model concerns the determinants of industries’ gross profits.
In particular, we introduce the following log-linear equation of profit dynamics:
𝑙𝑜𝑔(𝑃𝑅𝑂𝐹𝑖𝑗𝑡) = 𝛼1𝑙𝑜𝑔(𝑊𝑖𝑗𝑡) + 𝛼2𝑙𝑜𝑔(𝑃𝑅𝑂𝐷𝑖𝑗𝑡) + 𝛼3 𝑙𝑜𝑔(𝑁𝑃𝑖𝑗𝑡) +
𝛼4𝑙𝑜𝑔(𝑀𝐴𝐶𝐻𝑖𝑗𝑡) + 𝛼5𝑙𝑜𝑔(𝑂𝐹𝐹𝑆𝐻𝑖𝑗𝑡)+ 𝛼6𝑙𝑜𝑔(𝑈𝐷𝑖𝑗𝑡) + 𝑢𝑖𝑗 + 𝜀𝑖𝑗𝑡
where i stands for industry at two-digit level, j for country and t for time.
Profits (𝑃𝑅𝑂𝐹) are expected to be negatively associated to wages (𝑊), positively
linked to labour productivity (PROD), driven by new products (NP) and new processes
(MACH), and by offshoring strategies (𝑂𝐹𝐹𝑆𝐻), while high union membership rates 𝑈𝐷
could depress profits. Lastly, time-invariant fixed effects and the error term are captured
by 𝑢 and 𝜀, respectively.
Differentiating the equation to get rid of time-invariant unobservable effects we obtain
the following final specification for profits:
20
∆𝑙𝑜𝑔(𝑃𝑅𝑂𝐹𝑖𝑗𝑡) = 𝛼1∆𝑙𝑜𝑔(𝑊𝑖𝑗𝑡) + 𝛼2∆𝑙𝑜𝑔 (𝑃𝑅𝑂𝐷𝑖𝑗𝑡) + 𝛼3∆ 𝑙𝑜𝑔(𝑁𝑃𝑖𝑗𝑡) +
𝛼4∆𝑙𝑜𝑔(𝑀𝐴𝐶𝐻𝑖𝑗𝑡) + 𝛼5∆𝑙𝑜𝑔(𝑂𝐹𝐹𝑆𝐻𝑖𝑗𝑡)+ 𝛼6∆𝑙𝑜𝑔(𝑈𝐷𝑖𝑗𝑡) + ∆𝜀𝑖𝑗𝑡
where the way in which the variables are computed is the same explained above.
5.3 Econometric strategy
The econometric strategy adopted to estimate empirically the wage and profit equation
relies on panel data techniques suitable for dealing with datasets marked by a large cross
sectional and relatively reduced temporal dimension.
First, the estimation procedure is performed after having differentiated the equations
to get rid of any time-invariant individual effects. Considering that the latter may have a
simultaneous impact on both the dependent variable and the regressors – leading to biased
estimates – first differencing removes this source of endogeneity. Furthermore, we
calculate long differences over two- to five-year periods, softening considerably the
autoregressive character of variables.
Second, the temporal structure of the panel is designed to harmonize the different
sources of data we exploit and to account for the time needed by innovation to unfold its
economic effects. Except for the last period (for which the CIS data do not allow us to
account for a time lag), innovation variables refer to a lagged period as compared to
dependent variables. Similarly, union density refers to the first year of each period the
dependent variables are computed on. This allows us to reduce the presence of
simultaneity-related endogeneity and to account, at once, for the time required by
technological advances to impact on distributional outcomes.
Third, we include a set of time, country and sectoral (i.e. Revised Pavitt industry
groups and manufacturing) dummies as additional control, with the aim of reducing the
potential endogeneity bias which may stem from other sources of observable
21
heterogeneity. Primarily, time dummies are conceived as essential to control for the
business cycle; otherwise, time-specific effects – that likely impact on all variables under
observations – would be captured by the error term raising endogeneity problems.
Nevertheless, country and sectoral dummies are fundamental tools to control for,
respectively, national and sectoral systems of innovation (Freeman, 1995; Lundvall,
1992; Malerba, 2002). Regarding the former, the complex institutional features of
countries represent a source of heterogeneity which is likely to shape deeply the
distributive patterns between capital and labour. Revised Pavitt classes dummies account
explicitly for the technological and structural patterns of industries avoiding the risk of
multicollinearity that would be induced by the inclusion of a great number of sector-
specific dummies; moreover, too many dummy variables may prevent the model to get a
sufficient number of degrees of freedom for adequately powerful statistical tests. Finally,
since manufacturing industries experience relatively greater involvement in global value
chains than service ones (Agnese and Ricart, 2009), a manufacturing dummy is
introduced when offshoring variables are considered, removing in this way another
potential source of endogeneity.
Fourth, estimations are performed using the weighted least squares (WLS) estimator.
The reason lies in the fact that industry data are grouped data of unequal size, thus their
contribution in terms of information is asymmetric, affecting the consistency of the
estimator (Wooldridge, 2002). Following Guarascio and Pianta (2016), we achieve
consistency using the number of employees in the sectors (as observed in the first year of
each economic period) as weights, rather than industries’ value added; indeed, the latter
depends on price variations and results in a more unstable measure of sectors’ size.
22
Fifth, it is well known that industry-level data are usually affected by
heteroskedasticity and, not unexpectedly, the results of the Breusch-Pagan test performed
on baseline WLS regressions confirms that the variance of the error term differ across
observations. Therefore, we carry out all the estimations applying heteroskedasticity- and
autocorrelation-robust standard errors.11
Sixth, since industries’ evolution is shaped fundamentally by their technological
regimes and institutional setting, common factors impacting simultaneously on both
dependent variables (i.e. rate of growth of profits and wages) may occur, affecting in this
way regressions’ stochastic disturbances. In other terms, the error terms of the two
estimated equations might be correlated insofar as the equations have unobservable
omitted variables in common. Hence, in the next section we also report estimations using
the Seemingly unrelated regression estimator (SURE), which exploits correlation among
regression equations’ residuals to gain efficiency (Zellner, 1962).
Finally, we assess the resilience of our findings reporting in Appendix three tables
with the results of robustness checks. Additional tests with different variables, leading to
the same results, have been carried out and are available in Coveri and Pianta (2019).12
6. Results
6.1 The estimated wage equation
Table 1 shows the results of the wage equation, where technology variables, offshoring
and union density are introduced separately. The expected relationships are confirmed by
the findings. First, the negative impact of profit growth on wages is significant in all
specifications. Second, labour productivity growth has a strong and significant impact on
wage dynamics in all columns. Third, for the technology variables, a clear contrast
23
emerges between the positive effect on wages of new products and the negative effect of
expenditure in new machinery; these coefficients are significant in most specifications of
the model. This finding emphasizes the relevance of distinguishing between technological
and cost competitiveness strategies in explaining the wage dynamics. Fourth, the impact
of offshoring on wages is always negative and significant. We first consider the impact
of ‘narrow’ offshoring (columns 3 and 4); we then introduce simultaneously the change
in imported intermediate inputs from high- and low-technology foreign industries. The
negative effect on wage dynamics is consistent in all specifications, with stronger
coefficients for low-tech offshoring; this confirms the role of international production in
weakening labour compensation, especially when delocalization concerns low
technology activity and fosters various forms of social dumping. Finally, union density
supports the growth of wages with a positive and significant coefficient, although when
dummies for countries and industry groups are introduced its significant is lost;
nonetheless, the F-test controlling for the joint significance of Pavitt and country
dummies does not reject the null hypothesis that their coefficients are not statistically
different from zero. Therefore, we argue that results shown in columns 3 and 5 are not
fundamentally challenged.
Controls for time, manufacturing, Pavitt industry groups and countries are introduced
in turn in the different specifications reported in Table 1, without relevant changes in the
results. Our findings appear therefore robust to the consideration of structural, temporal
and national specificities. The findings of column 5, where all variables and the relevant
controls only are included, are the most important ones, confirming the expectations of
our model on the determinants of wage growth in European industries.
[TABLE 1 ABOUT HERE]
24
6.2 The estimated profit equation
Table 2 shows the results of the empirical estimation of the profit equation and
tendentially confirms our expectations. A significant and negative coefficient is always
associated to the dynamics of the dynamics of wages, while the impact of labour
productivity growth on profits is always positive and significant. The introduction of
product innovation increases profits, while expenditure in new machinery lacks
significance.13 The former finding highlights the ability of industries greatly committed
in introducing new products to obtain “Schumpeterian” temporary monopoly profits. The
labour saving and wage reducing effect of new processes appear to be captured by the
wage growth variable, leading to the lack of significance of expenditure in new
machinery.
As expected, offshoring is an important driver of profit growth both in the case of
‘narrow’ offshoring and in the case of imported intermediate inputs from high-technology
industries. Conversely, the impact of imported intermediate inputs from low-technology
sectors is not significant. Again, the acquisition of high-tech inputs contributes to the
success of a strategy of technological competitiveness, while low-tech offshoring has an
impact on wages only, as we have seen in Table 1. Finally, union density does not seem
to play any role on profit dynamics; its impact is mainly on wages (see Table 1) and its
effects in these estimations are already capture by the wage variable.
Again, controls for time, manufacturing, Pavitt industry groups and countries are
introduced; they all appear to be relevant and have no major consequences on our
estimation results. Columns 4 and 6, where all variables and controls are included, appear
to be the most relevant ones. Again, our expectations on the drivers of profit growth are
confirmed.
25
[TABLE 2 ABOUT HERE]
6.3 The wage-profit SURE model
Table 3 reports the empirical results of the simultaneous estimations of the wage and
profit equations using the Seemingly Unrelated Regression Estimation (SURE) model.
As previously mentioned, this estimation technique accounts for the common factors
which might impact simultaneously on both dependent variables, namely the wage and
profit growth rate, and exploits the correlation among them to gain efficiency (Zellner,
1962).
The baseline results of the wage-profit SURE model are reported in the first two
columns of Table 3, include controls for time and manufacturing and largely confirm the
results found for the separate estimations provided in the previous tables. The negative
relationship between profit growth and wage growth is reaffirmed and labour productivity
growth is confirmed as a major driver of both distributional variables. The coefficient
related to the introduction of new products is positive and significant for the dynamics of
both wages and profits; conversely, expenditure in new machinery is not significant, as
we already found for the profit equation.
The first indicator we adopted as a proxy of international fragmentation of production,
i.e. ‘narrow’ offshoring, confirms its positive effects on profits and its negative one on
wages. The union density coefficient turns out to be significant for the wage equation
only, as already found in the previous estimations. The overall results offer strong
confirmation of our previous findings.
In the second pair of columns in Table 4 we include the variables on high- and low-
tech offshoring, finding that the high-tech offshoring only has a negative and significant
impact on wage growth. All other variables confirm the findings of the baseline model.
26
In the third pair of columns of Table 3, all dummies for time, manufacturing, Pavitt
industry groups and countries are introduced, confirming previous results with the
exception of union density, which loses significance due to the importance of national
and structural factors.
The overall results offer a robust explanation of the key drivers of income distribution
in European manufacturing and service industries. Wages and profits can grow together
when labour productivity growth driven by the expansion of value added and new
products improve the “Schumpeterian gains” of industries. For a given labour
productivity, the capital-labour conflict remains a crucial factor shaping the distribution
between profits and wages. Profits are supported by offshoring in general and by the
acquisition of imported high-tech intermediate inputs in particular. Wage increases are
weakened by process innovation and all types of offshoring, while greater union density
provides support for labour compensation. Overall, the combination of all these
dimensions and the ability to identify the different strategies related to technology change
and offshoring provide a strong explanation of the major drivers of wages and profits in
European industries.
[TABLE 3 ABOUT HERE]
7. Conclusions
The present work has combined a Post-Keynesian approach to the conflictual relationship
between capital and labour income with a structural change perspective and attention to
the dynamics of technological change, offshoring and labour market institutions in order
to investigate income distribution at the industry level. We fully considered the diversity
of technological trajectories of industries, with a distinction between a technological
competitiveness strategy, which mainly relies on new products, and a cost
27
competitiveness strategy aimed at reducing labour costs and gaining production
efficiency through the introduction of new processes (Pianta, 2001). We have also
explored the different offshoring strategies pursued by firms, considering the relevance
of imported intermediate inputs from the same industry (‘narrow’ offshoring) as well as
the sourcing of inputs from either high or low-technology foreign industries. Finally, we
investigated the role played by union density at the industry level in shaping the power
balance between capital and labour. Our two-equation structural model is able to
effectively integrate all these drivers of income distribution and to simultaneously
determine the dynamics of wages and profits in European industries. The main lessons
we can draw from our results include the following.
First, labour productivity growth is found to have a positive impact on both wage and
profit growth; it is the driver of the expansion of industries’ value added, the ‘cake’ that
can then be divided between capital and labour; higher productivity growth allows to
weaken the conflictual nature of income distribution.
Second, the conflict over distribution does remain important; the profit growth rate of
industries is always negative correlated with the rate of growth of wages, and viceversa,
highlighting the relevance of capital-labour conflict and the possibility of getting close to
a zero-sum game in income distribution.
Third, technology is not neutral in its income distribution effects. The introduction of
new products is associated to relatively higher wages and profits, while the expenditure
in new machinery and equipment shows a negative impact on labour compensation. The
important distinction between technological and cost competitiveness strategies allows
us to understand the logic of business strategies in innovation and the resulting – mainly
pro-business - distributional outcomes.
28
Fourth, in parallel to technology, offshoring and international production have equally
relevant distributional outcomes. Greater delocalization of production abroad weakens
workers’ wage claims; the ‘narrow’ offshoring indicator is closely associated to faster
profit growth. When we distinguish offshoring on the basis of the technological level of
foreign source industries, we find that wages suffer the negative effect of low-tech
offshoring, as this intensifies worldwide competition among workers and is associated to
various forms of social dumping. Conversely, foreign sourcing of high-tech inputs has a
strong impact on profit dynamics, as industries acquire advanced intermediate products
that are not domestically produced – this is typical of electronic components for European
industries. This strategy gives industries access to new sources of knowledge and
technology and can be complementary to the development of new products.
Lastly, union density tends to have a positive impact on wage dynamics at industry
level, reasserting trade unions as relevant actors in shaping the bargaining power of
workers.
Our findings strengthen the recent political economy literature on income distribution
and the conflictual determination of the compensation of capital and labour (Dunhaupt,
2016; Guschanski and Onaran, 2017; Stockhammer, 2017). Moreover, drawing from
evolutionary approaches, we have moved beyond the undifferentiated notion of
technological change (usually proxied by partial and unconvincing measures such as
R&D, patents, total factor productivity, ICT capital stock) and we have documented the
contrasting impact of product and process innovation on wage and profit dynamics. The
same differentiation has been applied to offshoring strategies, integrating them with
technological strategies, leading to new insights on the distributional effects of
29
international production. The role of labour market institutions has also been confirmed
in our analysis, with a close link between trade union presence and higher wage dynamics.
Bibliography
Abdih, Y. and Danninger, S. 2018. ‘Understanding U.S. Wage Dynamics’, IMF Working
Paper no. 18/138
Acemoglu, D. and Restrepo, P. 2017. ‘Robots and Jobs: Evidence from US Labour
Markets’, NBER Working Paper no. 23285
Acemoglu, D. and Restrepo, P. 2018. ‘Artificial Intelligence, Automation and Work’,
NBER Working Paper no. 24196
Agnese, P. and Ricart, J.E. 2009. ‘Offshoring: Facts and Numbers at the Country Level’,
IESE Business School Working Paper no. 792
Atkinson, A.B. 2009. Factor Shares: the Principal Problem of Political Economy?, Oxford
Review of Economic Policy, vol. 25, no. 1, 3-16
Atkinson, A.B., Piketty, T. and Saez, E. 2011. Top Incomes in the Long Run of History,
Journal of Economic Literature, vol. 49, no. 1, 3-71
Bassanini, A. and Manfredi, T. 2014. Capital’s Grabbing Hand? A Cross-Industry
Analysis of the Decline of the Labor Share in OECD Countries, Eurasian Business
Review, vol. 4, no. 1, 3-30
Baum, C.F. and Schaffer, M.E. 2013. ‘ACTEST: Stata module to perform Cumby-
Huizinga general test for autocorrelation in time series’, Statistical Software
Components S457668, revised 24 January 2015
Bengtsson, E. 2014a. Labour's Share in Twentieth-Century Sweden: a Reinterpretation,
Scandinavian Economic History Review, vol. 62, no. 3, 290-314
30
Bengtsson, E. 2014b. Do Unions Redistribute Income from Capital to Labour? Union
Density and Labour’s Share since 1960, Industrial Relations Journal, vol. 45, no. 5,
389-408
Bentolila, S. and Saint-Paul, G. 2003. Explaining Movements in the Labor Share,
Contributions to Macroeconomics, vol. 3, no. 1, 1-33
Bloom, N., Draca, M. and Van Reenen, J. 2016. Trade Induced Technical Change? The
Impact of Chinese Imports on Innovation, IT and Productivity, Review of Economic
Studies, vol. 83, no. 1, 87-117
Bloom, N., Romer, P.M., Terry, S.J. and Van Reenen, J. 2013. A Trapped-Factors Model
of Innovation, American Economic Review, vol. 103, no. 3, 208-213
Bogliacino, F. 2009. Poorer Workers. The Determinants of Wage Formation in Europe,
International Review of Applied Economics, vol. 23, no. 3, 327-343
Bogliacino, F. and Pianta, M. 2010. Innovation and Employment: A Reinvestigation
using Revised Pavitt classes, Research Policy, vol. 39, no. 6, 799-809
Bogliacino, F. and Pianta, M. 2016. The Pavitt Taxonomy, Revisited: Patterns of
Innovation in Manufacturing and Services, Economia Politica: Journal of Analytical
and Institutional Economics, vol. 33, no. 2, 153-180
Bogliacino, F., Guarascio, D. and Cirillo, V. 2018. The dynamics of profits and wages:
technology, offshoring and demand, Industry and Innovation, vol. 25, no. 8, 778-808
Bound, J., Jaeger, D.A. and Bake, R.M. 1995. Problems with Instrumental Variables
Estimation When the Correlation between the Instruments and the Endogeneous
Explanatory Variable is Weak, Journal of the American Statistical Association, vol.
90, no. 430, 443-50
31
Brancaccio, E., Garbellini, N. and Giammetti, R. 2018. Structural Labour Market
Reforms, GDP Growth and the Functional Distribution of Income, Structural Change
and Economic Dynamics, vol. 44, 34-45
Breschi, S., Malerba, F. and Orsenigo, L. 2000. Technological Regimes and
Schumpeterian Patterns of Innovation, Economic Journal, vol. 110, no. 463, 388-410
Buchele, R. and Christiansen, J. 1999. Labor relations and productivity growth in
advanced capitalist economies, Review of Radical Political Economics, vol. 31, no. 1,
87-110
Burke, J. and Epstein, G. 2001. ‘Threat Effects and the Internationalization of
Production’, Working Paper no. 15, Political Economy Research Institute, University
of Massachusetts Amherst
Cantwell, J. 2005. ‘Innovation and Competitiveness’, in Fagerberg, J., Mowery, D.C. and
Nelson, R.R. (edited by), Handbook of Innovation, Oxford, Oxford University Press,
543-566
Charpe, M. 2011. The labour share of income: Determinants and potential contribution
to exiting the financial crisis, World of Work Report 2011, no. 1, 55-74
Choi, M. 2001. ‘Threat Effect of Foreign Direct Investment on Labour Union Wage
Premium’, Working Paper no. 27, Political Economy Research Institute, University
of Massachusetts Amherst
Cirillo, V. 2017. Technology, employment and skills, Economics of Innovation and New
Technology, vol. 26, no. 8, 734-754
Coveri, A. and Pianta, M. 2019. ‘The Structural Dynamics of Income Distribution:
Technology, Wages and Profits’, Working Paper WP-EMS no. 2019/01, University
of Urbino
32
Cumby, R.E. and Huizinga, J. 1990. ‘Testing the Autocorrelation Structure of
Disturbances in Ordinary Least Squares and Instrumental Variables Regressions’,
NBER Technical Working Paper no. 90
Cumby, R.E. and Huizinga, J. 1992. Testing the Autocorrelation Structure of
Disturbances in Ordinary Least Squares and Instrumental Variables Regressions,
Econometrica, vol. 60, no. 1, 185-195
Daudey, E. and Garcia-Penalosa, C. 2007. The personal and the factor distributions of
income in a cross-section of countries, Journal of Development Studies, vol. 43, no.
5, 812-829
Dosi, G. 1982. Technological paradigms and technological trajectories: A suggested
interpretation of the determinants and directions of technical change, Research Policy,
vol. 11, no. 3, 147-162
Dosi, G. 1988. Sources, procedures and microeconomic effects of innovation, Journal of
Economic Literature, vol. 26, no. 3, 1120-1171
Dunhaupt, P. 2016. Determinants of labour’s income share in the era of financialization,
Cambridge Journal of Economics, vol. 41, no. 1, 283-306
European Commission. 2007. ‘The labour income share in the European Union’, in
Employment in Europe, Brussels, European Commission, 237-272
Feenstra, R.C. 1998. Integration of Trade and Disintegration of Production in the Global
Economy, Journal of Economic Perspectives, vol. 12, no. 4, 31-50
Feenstra, R.C. and Hanson, G.H. 1996. Globalization, outsourcing and wage inequality,
American Economic Review, vol. 86, no. 2, 240-245

33
Feenstra, R.C. and Hanson, G.H. 1999. The Impact of Outsourcing and High-Technology
Capital on Wages: Estimates for the U.S., 1979-1990, Quarterly Journal of
Economics, vol. 114, no. 3, 907-940
Felipe, J. and McCombie, J.S. 2013. The aggregate production function and the
measurement of technical change, Cheltenham, Edward Elgar Publishing
Franzini, M. and Pianta, M. 2016. Explaining Inequality, London, Routledge
Freeman, C. 1995. The ‘National System of Innovation’ in historical perspective,
Cambridge Journal of Economics, vol. 19, no. 1, 5-24
Freeman, C. and Louca, F. 2001. As Time Goes by: From the Industrial Revolutions to
the Information Revolution, Oxford, Oxford University Press
Glyn, A. 2006. Capitalism Unleashed: Finance, Globalization, and Welfare, Oxford,
Oxford University Press
Guarascio, D. and Pianta, M. 2016. The gains from technology: new products, exports
and profits, Economics of Innovation and New Technology, vol. 26, no. 8, 779-804
Guarascio, D., Pianta, M., Lucchese, M. and Bogliacino F. 2015. Business cycles,
technology and exports, Economia Politica: Journal of Analytical and Institutional
Economics, vol. 32, no. 2, 167-200
Guschanski, A. and Onaran, Ö. 2017. ‘The political economy of income distribution:
industry level evidence from 14 OECD countries’, Greenwich Papers in Political
Economy, no. GPERC51, University of Greenwich
Guschanski, A. and Onaran, Ö. 2018, ‘The labour share and financialisation: Evidence
from publicly listed firms’, Greenwich Papers in Political Economy, no. GPERC59,
University of Greenwich
34
Hansen, L.P. 1982. Large sample properties of generalized method of moments
estimators, Econometrica, vol. 50, no. 4, 1029-1054
Harrison, A. 2005. ‘Has Globalization Eroded Labor’s Share? Some Cross-Country
Evidence’, MPRA Paper no. 39649
Hummels, D., Ishii, J. and Yi, K.-M. 2001. The nature and growth of vertical
specialization in world trade, Journal of International Economics, vol. 54, no. 1, 75-
96
IMF. 2017a. ‘Understanding the Downward Trend in Labor Income Shares’, in World
Economic Outlook, April, Chapter 3, Washington D.C., International Monetary Fund,
121-172
IMF. 2017b. ‘Recent Wage Dynamics in Advanced Economies: Drivers and
Implications’, in World Economic Outlook, October, Chapter 2, Washington D.C.,
International Monetary Fund, 73-116
Jaumotte, F. and Osorio Buitron, C. 2015. ‘Inequality and Labor Market Institutions’,
IMF Staff Discussion Note no. 15/14, Washington D.C., International Monetary Fund
Jayadev, A. 2007. Capital account openness and the labour share of income, Cambridge
Journal of Economics, vol. 31, no. 3, pp. 423-443
Karabarbounis, L. and Neiman, B. 2014. The global decline of the labor share, Quarterly
Journal of Economics, vol. 129, no. 1, 61-103
Kohler, K., Guschanski, A. and Stockhammer, E. 2018. ‘The impact of financialisation
on the wage share: a theoretical clarification and empirical test’, Post-Keynesian
Economics Study Group Working Paper no. 1802
Kramarz, F. 2017. ‘Offshoring, Wages, and Employment: Evidence from Data Matching
Imports, Firms, and Workers’, in Fontagné, L. and Harrison, A. (edited by), The
35
Factory-Free Economy: Outsourcing, Servitization, and the Future of Industry,
Oxford, Oxford University Press, 257-301
Lin, K.-H. and Tomaskovic-Devey, D. 2013. Financialization and U.S. Income
Inequality, 1970–2008, American Journal of Sociology, vol. 118, no. 5, 1284-1329
Lundvall, B.A. 1992. National Systems of Innovation, London, Pinter Publishers
Malerba, F. 2002. Sectoral systems of innovation and production, Research Policy, vol.
31, no. 2, pp. 247-264
Milberg, W. and Winkler, D. 2013. Outsourcing Economics: Global Value Chains in
Capitalist Development, New York, Cambridge University Press
OECD. 2018a. ‘Labour share developments over the past two decades: The role of
technological progress, globalisation and “winner takes most” dynamics’, in OECD
Employment Outlook 2018, Chapter 2, Paris, OECD Publishing, 47-72
OECD. 2018b. ‘The role of collective bargaining systems for good labour market
performance’, in OECD Employment Outlook 2018, Chapter 3, Paris, OECD
Publishing, 73-122
Onaran, Ö. and Obst, T. 2016. Wage-led growth in the EU15 member-states: the effects
of income distribution on growth, investment, trade balance and inflation, Cambridge
Journal of Economics, vol. 40, no. 6, 1517-1551
Pasinetti, L.L. 1981. Structural Change and Economic Growth: A Theoretical Essay on
the Dynamics of the Wealth of Nations, Cambridge (UK), Cambridge University Press
Pavitt, K. 1984. Sectoral patterns of technical change: Towards a taxonomy and a theory,
Research Policy, vol. 13, no. 6, 343-373
36
Perani, C. and Cirillo, V. 2015. ‘Matching industry classifications. A method for
converting Nace Rev.2 to Nace Rev.1’, Working Paper WP-EMS no. 2015/02,
University of Urbino
Pianta, M. 2001. ‘Innovation, Demand and Employment’, in Petit, P. and Soete, L. (edited
by), Technology and the future of European Employment, Cheltenham, Edward Elgar
Publishing, 142-165
Pianta, M. and Tancioni, M. 2008. Innovations, profits and wages, Journal of Post
Keynesian Economics, vol. 31, no. 1, 103-125
Piketty, T. and Saez, E. 2003. Income Inequality in the United States, 1913–1998,
Quarterly Journal of Economics, vol. 118, no. 1, 1-39
Pöschl, J., Foster-McGregor, N. and Stehrer, R. 2016. International R&D Spillovers and
Business Service Innovation, The World Economy, vol. 39, no. 12, 2025-2045
Pontusson, J. 2013. Unionization, Inequality and Redistribution, British Journal of
Industrial Relations, vol. 51, 797-825
Rodrik, D. 1997. Has Globalization Gone Too Far?, Washington D.C., Institute for
International Economics
Simonazzi, A., Ginzburg, A. and Nocella, G. 2013. Economic relations between Germany
and southern Europe, Cambridge Journal of Economics, vol. 37, no. 3, 653-675
Staiger, D. and Stock, J.H. 1997. Instrumental Variables Regression with Weak
Instruments, Econometrica, vol. 65, no. 3, 557-586
Stapel, S., Pasanen, J. and Reinecke, S. 2004. ‘Purchasing Power Parities and related
economic indicators for EU Candidate Countries and EFTA’, Statistics in Focus
53/2004, Eurostat

37
Stockhammer, E. 2009. ‘Determinants of Functional Income Distribution in OECD
Countries’, IMK Study no. 5
Stockhammer, E. 2013. ‘Why Have Wage Shares Fallen? An Analysis of the
Determinants of Functional Income Distribution’, in Lavoie, M. and Stockhammer,
E. (edited by), Wage-led Growth: An Equitable Strategy for Economic Recovery,
London, Palgrave Macmillan, 40-70
Stockhammer, E. 2017. Determinants of the Wage Share: A Panel Analysis of Advanced
and Developing Economies, British Journal of Industrial Relations, vol. 55, 3-33
Stockhammer, E., Guschanski, A. and Kohler, K. 2014. Unemployment, capital
accumulation and labour market institutions in the Great Recession, European
Journal of Economics and Economic Policies: Intervention, vol. 11, no. 2, 182-194
Stolper, W. and Samuelson, P. 1941. Protection and real wages, Review of Economic
Studies, vol. 9, 58-73
Tajoli, L. and Felice, G. 2018. Global Value Chains Participation and Knowledge
Spillovers in Developed and Developing Countries: An Empirical Investigation, The
European Journal of Development Research, vol. 30, no. 3, 505-532
Timmer, M.P., Los, B., Stehrer, R. and de Vries, G.J. 2016. ‘An Anatomy of the Global
Trade Slowdown based on the WIOD 2016 Release’, GGDC Research Memorandum
no. 162, University of Groningen
Tridico, P. 2018. The determinants of income inequality in OECD countries, Cambridge
Journal of Economics, vol. 42, no. 4, 1009-1042
Vivarelli, M. 2014. Innovation, Employment and Skills in Advanced and Developing
Countries: A Survey of Economic Literature, Journal of Economic Issues, vol. 48, no.
1, 123-154
38
Wolff, E.N. and Zacharias, A. 2013. Class structure and economic inequality, Cambridge
Journal of Economics, vol. 37, no. 6, 1381-1406
Wooldridge, J.M. 1995. ‘Score diagnostics for linear models estimated by two stage least
squares’, in Maddala, G.S., Phillips, P.C.B. and Srinivasan, T.N. (edited by),
Advances in Econometrics and Quantitative Economics: Essays in Honor of Professor
C. R. Rao, Oxford, Blackwell, 66-87
Wooldridge, J.M. 2002. Econometric Analysis of Cross Section and Panel Data,
Cambridge (USA), MIT Press
39
Appendix
Table A.1 and Table A.2 provide robustness checks related to the estimation results of
the baseline wage equation and profit equation reported in the first and second column of
Table 1 and Table 2, respectively.
The test proposed by Cumby and Huizinga (1990, 1992) and developed for STATA
by Baum and Schaffer (2013) does not reject the null hypothesis of serially uncorrelated
residuals of the estimated wage equation while rejects the null hypothesis for profit
equation. Nonetheless, for the wage equation the p-value of the test is quite low (equal to
0,1146) while the Breusch-Pagan test and the White test strongly reject the null
hypothesis of homoskedasticity for both equations. It follows that using Huber-White
standard errors robust to heteroskedasticity and autocorrelation of residuals is the best
choice.
Notwithstanding the inclusion of time, Pavitt and country dummies, the Variance
Inflation Factor (VIF) value ranges from 2,31 to 2,77 for wage equation and from 2,43 to
2,86 for profit equation, below 4 and much below 10 (the thresholds usually taken as
reference in the literature). Therefore, multicollinearity is not a cause for concern.
Finally, we apply a control function approach test the endogeneity of labour
productivity growth in the wage equation. The F-test of the first step is equal to 60,81 –
well above the “rule of thumb” of 10, which would be the minimum threshold above
which the weakness of instruments can be considered not an issue (see Bound et al., 1995;
Staiger and Stock, 1997) – and the p-value rejects the null hypothesis of weak
instruments. In the second step we regress our wage equation including the residuals
predicted in the first stage as additional covariate. A test on the latter becomes an
40
endogeneity test under the null hypothesis of labour productivity exogeneity. The test
returns a “borderline” result – as the p-value is equal to 0,082 – weakly supporting the
exogeneity of labour productivity growth in the wage equation.
[TABLE A.1 ABOUT HERE]
[TABLE A.2 ABOUT HERE]
Table A.3 reports five post-estimation tests to check the exogeneity of labour productivity
growth in the profit equation using as main instruments the share of workers belonging
to four different occupation categories resulting from the aggregation of the ISCO
professional classification (Cirillo, 2017). The first column shows the test performed, the
second column the variable whose exogeneity has to be checked, the third column the
variables used as instruments, the fourth column the estimator employed for the
diagnostic test, the fifth column the results concerning the relevance and validity of the
instruments, the sixth column the results of the endogeneity tests performed and the last
column summarizes the final outcome.
The F-statistic related to the first stage of the test performed following a control
function approach is equal to 147,14 – again well above the “rule of thumb” of 10.
Regarding the last four endogeneity tests, note that the F-statistic performed in the first
stage always rejects the null hypothesis of weak instruments, while the Hansen (1982)
test – which applies to estimation with robust standard error – does not reject the null
hypothesis of valid instruments (i.e. uncorrelated with the error term).
The Wooldridge’s (1995) robust score test performed using the third set of
instruments (i.e. share of managers, share of manual workers and lagged growth rate of
value added) is the only one over five tests that weakly rejects (at a significance level of

41
10%) the null hypothesis of exogeneity of labour productivity growth. Therefore, the
overall outcome of Table A.3 provides fairly support to our econometric strategy.
[TABLE A.3 ABOUT HERE]
42
Figures and Tables
Figure 1.
Source: Our elaboration on Sectoral Innovation Database.
Note: Profits and wages growth rate refer to the compound average annual rate of change over the period.
Industries are grouped in high-tech (Science based and Specialized suppliers sectors) and low-tech (Scale
and information intensive and Supplier dominated sectors) clusters according to the Revised Pavitt
Taxonomy proposed by Bogliacino and Pianta (2010, 2016).
Figure 2.
0.5
11.5
2
Rate
of
gro
wth
(%
)
High tech industries Low tech industries
dividing by high- and low-tech industries, 1996-2014
Profits, wages and technology
Gross profits Wage bill
DESDDESDDESDDESDDESD DESIDESIDESI
DESB
DESIDESIDESIDESD
DESS
DESB
DESS
DESBDESB
DESI
DESS
DESDDESDDESDDESDDESDDESDDESDDESDDESD
DESB
DESIDESIDESI
DESSDESS
DESBDESB
DESS
ESSDESSDESSDESSDESSD
ESSIESSIESSI
ESSB
ESSIESSIESSI
ESSD
ESSS
ESSB
ESSS
ESSBESSB
ESSI
ESSS
ESSDESSDESSDESSDESSDESSDESSDESSDESSD
ESSB
ESSIESSIESSI
ESSSESSS
ESSBESSB
ESSS
FRSDFRSDFRSDFRSDFRSD
FRSIFRSIFRSI
FRSB
FRSIFRSIFRSI
FRSD
FRSS
FRSB
FRSS
FRSBFRSB
FRSI
FRSS
FRSDFRSDFRSDFRSDFRSDFRSDFRSDFRSDFRSDFRSB
FRSIFRSIFRSI
FRSSFRSS
FRSBFRSB
FRSS
ITSDITSDITSDITSDITSD
ITSIITSIITSI
ITSB
ITSIITSIITSI
ITSD
ITSS ITSBITSS ITSBITSB
ITSI
ITSS
ITSDITSDITSDITSDITSDITSDITSDITSDITSD
ITSB
ITSIITSIITSI
ITSSITSS ITSBITSBITSS
NLSDNLSDNLSDNLSDNLSD
NLSINLSINLSI
NLSB
NLSINLSINLSI
NLSD
NLSS
NLSB
NLSS
NLSBNLSB
NLSI
NLSS
NLSDNLSDNLSDNLSDNLSDNLSDNLSDNLSDNLSD
NLSB
NLSINLSINLSI
NLSSNLSS
NLSBNLSB
NLSS
UKSDUKSDUKSDUKSDUKSD
UKSIUKSIUKSI
UKSB
UKSIUKSIUKSI
UKSD
UKSS
UKSB
UKSS
UKSBUKSB
UKSI
UKSS
UKSDUKSDUKSDUKSDUKSDUKSDUKSDUKSDUKSD
UKSB
UKSIUKSIUKSI
UKSSUKSS
UKSBUKSB
UKSS
02
46
Rate
of
gro
wth
of pro
fits
per
wo
rked h
our
(%)
0 20 40 60 80Share of product innovators (%)
Obs. Fitted values
Country-Pavitt class., 1994-2014
Profits & product innovation
43
Figure 3.
Source: Our elaboration on Sectoral Innovation Database.
Note: Observations refer to the unweighted average values of industries grouped according to the country-
Pavitt classification. Profit and wage growth rates refer to the compound average annual rate of change
while the share of product (process) innovators reflects the average share of firms introducing product
(process) innovation at sectoral level over the period.
Figure 4.
DESDDESDDESDDESDDESD
DESIDESIDESI
DESB
DESIDESIDESI
DESDDESS
DESB
DESS
DESBDESB
DESIDESSDESDDESDDESDDESDDESDDESDDESDDESDDESD
DESB
DESIDESIDESIDESSDESS
DESBDESB
DESS
ESSDESSDESSDESSDESSD
ESSIESSIESSI
ESSB
ESSIESSIESSI
ESSD
ESSSESSBESSSESSBESSB
ESSI
ESSS
ESSDESSDESSDESSDESSDESSDESSDESSDESSD
ESSB
ESSIESSIESSI
ESSSESSSESSBESSBESSS
FRSDFRSDFRSDFRSDFRSD
FRSIFRSIFRSI
FRSB
FRSIFRSIFRSI
FRSD
FRSS
FRSB
FRSS
FRSBFRSB
FRSIFRSS
FRSDFRSDFRSDFRSDFRSDFRSDFRSDFRSDFRSD
FRSB
FRSIFRSIFRSIFRSSFRSS
FRSBFRSB
FRSS ITSDITSDITSDITSDITSD
ITSIITSIITSI
ITSB
ITSIITSIITSI
ITSDITSS
ITSB
ITSS
ITSBITSB
ITSI
ITSS ITSDITSDITSDITSDITSDITSDITSDITSDITSD
ITSB
ITSIITSIITSI
ITSSITSS
ITSBITSB
ITSS
NLSDNLSDNLSDNLSDNLSD
NLSINLSINLSI
NLSB
NLSINLSINLSI
NLSDNLSS
NLSB
NLSS
NLSBNLSB
NLSI
NLSSNLSDNLSDNLSDNLSDNLSDNLSDNLSDNLSDNLSD
NLSB
NLSINLSINLSI
NLSSNLSS
NLSBNLSB
NLSS
UKSDUKSDUKSDUKSDUKSD
UKSIUKSIUKSI
UKSB
UKSIUKSIUKSI
UKSD
UKSS
UKSB
UKSS
UKSBUKSB
UKSIUKSS
UKSDUKSDUKSDUKSDUKSDUKSDUKSDUKSDUKSD
UKSB
UKSIUKSIUKSIUKSSUKSS
UKSBUKSB
UKSS
01
23
4
Rate
of
gro
wth
of w
ag
es p
er
work
ed h
ou
r (%
)
4 6 8 10 12 14Share of process innovators (%)
Obs. Fitted values
Country-Pavitt class., 1994-2014
Wages & process innov.
DESDDESDDESDDESDDESD
DESIDESIDESI
DESB
DESIDESIDESI
DESD
DESS
DESB
DESS
DESBDESB
DESI
DESS
DESDDESDDESDDESDDESDDESDDESDDESDDESD
DESB
DESIDESIDESI
DESSDESS
DESBDESB
DESS
ESSDESSDESSDESSDESSD
ESSIESSIESSI
ESSB
ESSIESSIESSI
ESSD
ESSS ESSBESSS ESSBESSB
ESSI
ESSS
ESSDESSDESSDESSDESSDESSDESSDESSDESSD
ESSB
ESSIESSIESSI
ESSSESSS ESSBESSBESSS
FRSDFRSDFRSDFRSDFRSD
FRSIFRSIFRSI
FRSB
FRSIFRSIFRSI
FRSD
FRSS
FRSB
FRSS
FRSBFRSB
FRSI
FRSS
FRSDFRSDFRSDFRSDFRSDFRSDFRSDFRSDFRSDFRSB
FRSIFRSIFRSI
FRSSFRSS
FRSBFRSB
FRSS
ITSDITSDITSDITSDITSD
ITSIITSIITSI
ITSB
ITSIITSIITSI
ITSD
ITSS
ITSB
ITSS
ITSBITSB
ITSIITSS
ITSDITSDITSDITSDITSDITSDITSDITSDITSDITSB
ITSIITSIITSIITSSITSS
ITSBITSB
ITSSUKSDUKSDUKSDUKSDUKSD
UKSIUKSIUKSI
UKSB
UKSIUKSIUKSI
UKSD
UKSS
UKSB
UKSS
UKSBUKSB
UKSI
UKSS
UKSDUKSDUKSDUKSDUKSDUKSDUKSDUKSDUKSDUKSB
UKSIUKSIUKSI
UKSSUKSS
UKSBUKSB
UKSS
-20
24
6
Gro
wth
rate
of
gro
ss p
rofits
(%
)
-.04 -.02 0 .02 .04Growth of narrow offshoring
Obs. Fitted values
Country-Pavitt class., 1994-2014
Profits and offshoring
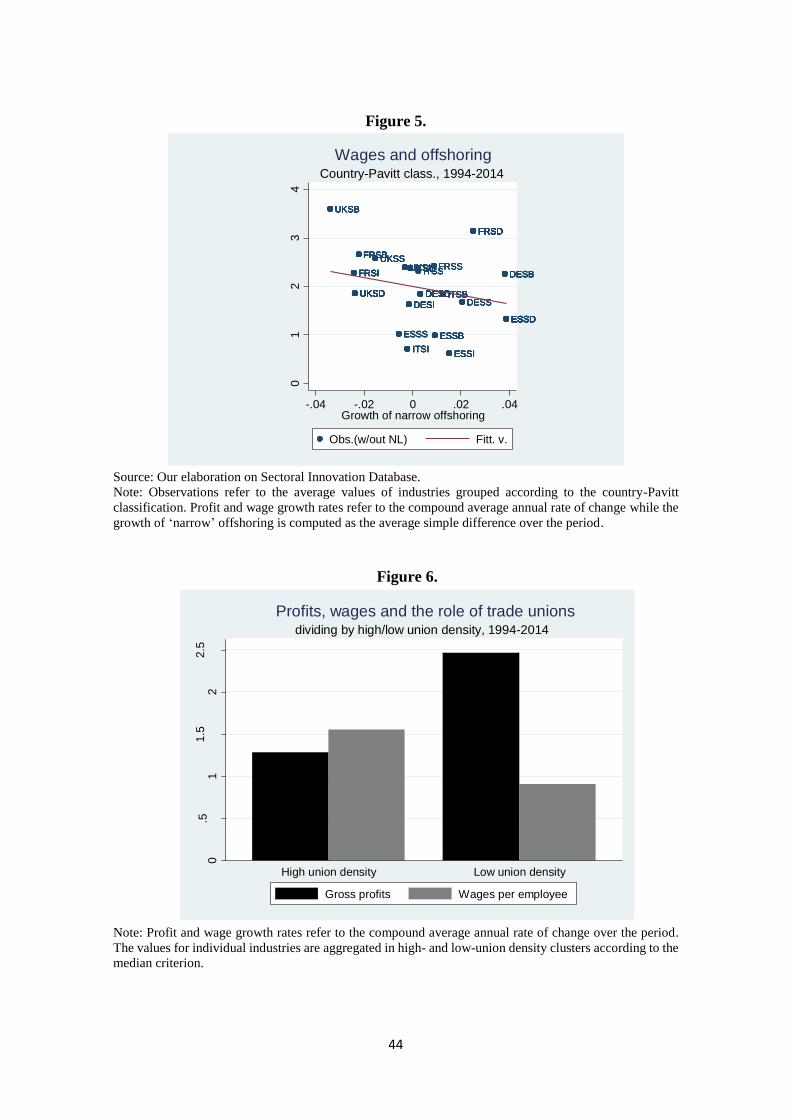
44
Figure 5.
Source: Our elaboration on Sectoral Innovation Database.
Note: Observations refer to the average values of industries grouped according to the country-Pavitt
classification. Profit and wage growth rates refer to the compound average annual rate of change while the
growth of ‘narrow’ offshoring is computed as the average simple difference over the period.
Figure 6.
Note: Profit and wage growth rates refer to the compound average annual rate of change over the period.
The values for individual industries are aggregated in high- and low-union density clusters according to the
median criterion.
DESDDESDDESDDESDDESD
DESIDESIDESI
DESB
DESIDESIDESI
DESDDESS
DESB
DESS
DESBDESB
DESI DESSDESDDESDDESDDESDDESDDESDDESDDESDDESD
DESB
DESIDESIDESI DESSDESS
DESBDESB
DESS
ESSDESSDESSDESSDESSD
ESSIESSIESSI
ESSB
ESSIESSIESSI
ESSD
ESSS ESSBESSS ESSBESSB
ESSI
ESSS
ESSDESSDESSDESSDESSDESSDESSDESSDESSD
ESSB
ESSIESSIESSI
ESSSESSS ESSBESSBESSS
FRSDFRSDFRSDFRSDFRSD
FRSIFRSIFRSI
FRSB
FRSIFRSIFRSI
FRSD
FRSS
FRSB
FRSS
FRSBFRSB
FRSIFRSS
FRSDFRSDFRSDFRSDFRSDFRSDFRSDFRSDFRSD
FRSB
FRSIFRSIFRSIFRSSFRSS
FRSBFRSB
FRSSITSDITSDITSDITSDITSD
ITSIITSIITSI
ITSB
ITSIITSIITSI
ITSDITSS
ITSB
ITSS
ITSBITSB
ITSI
ITSSITSDITSDITSDITSDITSDITSDITSDITSDITSD
ITSB
ITSIITSIITSI
ITSSITSS
ITSBITSB
ITSS
UKSDUKSDUKSDUKSDUKSD
UKSIUKSIUKSI
UKSB
UKSIUKSIUKSI
UKSD
UKSS
UKSB
UKSS
UKSBUKSB
UKSIUKSS
UKSDUKSDUKSDUKSDUKSDUKSDUKSDUKSDUKSD
UKSB
UKSIUKSIUKSIUKSSUKSS
UKSBUKSB
UKSS
01
23
4
Rate
of g
row
th o
f w
age
s p
er
wo
rked
hou
r (%
)
-.04 -.02 0 .02 .04Growth of narrow offshoring
Obs.(w/out NL) Fitt. v.
Country-Pavitt class., 1994-2014
Wages and offshoring
0.5
11.5
22.5
Rate
of
gro
wth
(%
)
High union density Low union density
dividing by high/low union density, 1994-2014
Profits, wages and the role of trade unions
Gross profits Wages per employee
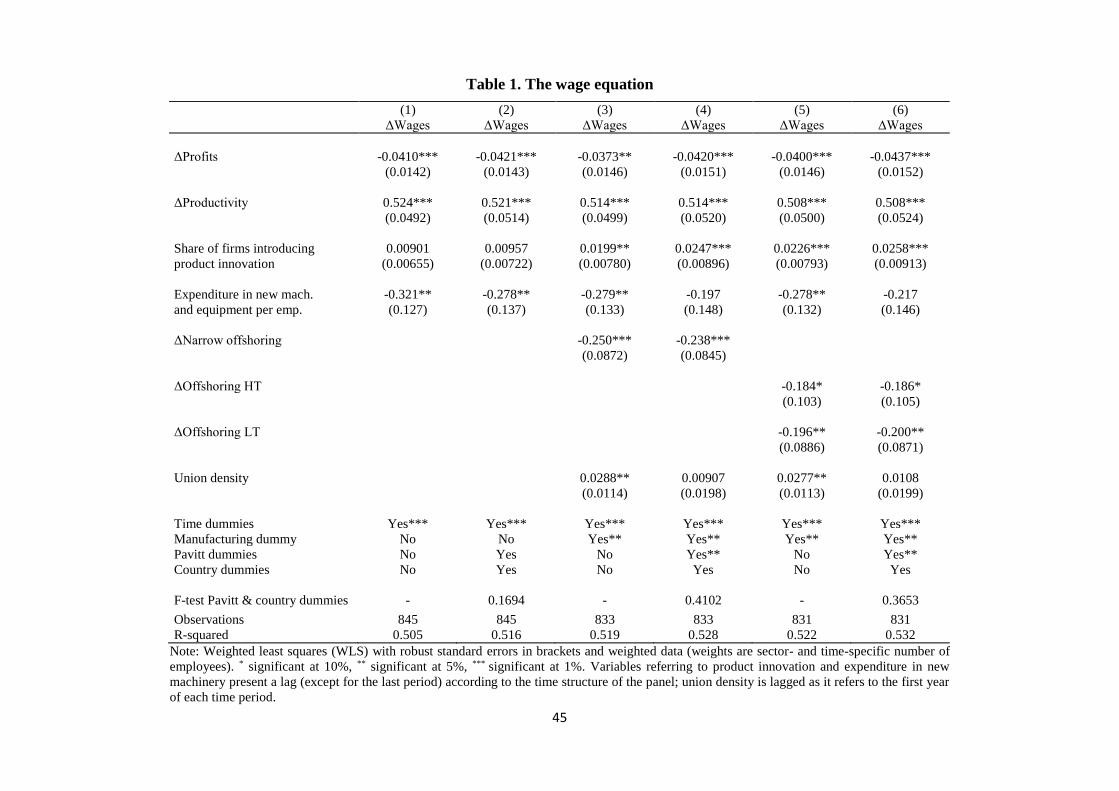
45
Table 1. The wage equation
Note: Weighted least squares (WLS) with robust standard errors in brackets and weighted data (weights are sector- and time-specific number of
employees). * significant at 10%, ** significant at 5%, *** significant at 1%. Variables referring to product innovation and expenditure in new
machinery present a lag (except for the last period) according to the time structure of the panel; union density is lagged as it refers to the first year
of each time period.
(1) (2) (3) (4) (5) (6)
ΔWages ΔWages ΔWages ΔWages ΔWages ΔWages
ΔProfits -0.0410*** -0.0421*** -0.0373** -0.0420*** -0.0400*** -0.0437***
(0.0142) (0.0143) (0.0146) (0.0151) (0.0146) (0.0152)
ΔProductivity 0.524*** 0.521*** 0.514*** 0.514*** 0.508*** 0.508***
(0.0492) (0.0514) (0.0499) (0.0520) (0.0500) (0.0524)
Share of firms introducing 0.00901 0.00957 0.0199** 0.0247*** 0.0226*** 0.0258***
product innovation (0.00655) (0.00722) (0.00780) (0.00896) (0.00793) (0.00913)
Expenditure in new mach. -0.321** -0.278** -0.279** -0.197 -0.278** -0.217
and equipment per emp. (0.127) (0.137) (0.133) (0.148) (0.132) (0.146)
ΔNarrow offshoring -0.250*** -0.238***
(0.0872) (0.0845)
ΔOffshoring HT -0.184* -0.186*
(0.103) (0.105)
ΔOffshoring LT -0.196** -0.200**
(0.0886) (0.0871)
Union density 0.0288** 0.00907 0.0277** 0.0108
(0.0114) (0.0198) (0.0113) (0.0199)
Time dummies Yes*** Yes*** Yes*** Yes*** Yes*** Yes***
Manufacturing dummy No No Yes** Yes** Yes** Yes**
Pavitt dummies No Yes No Yes** No Yes**
Country dummies No Yes No Yes No Yes
F-test Pavitt & country dummies - 0.1694 - 0.4102 - 0.3653
Observations 845 845 833 833 831 831
R-squared 0.505 0.516 0.519 0.528 0.522 0.532
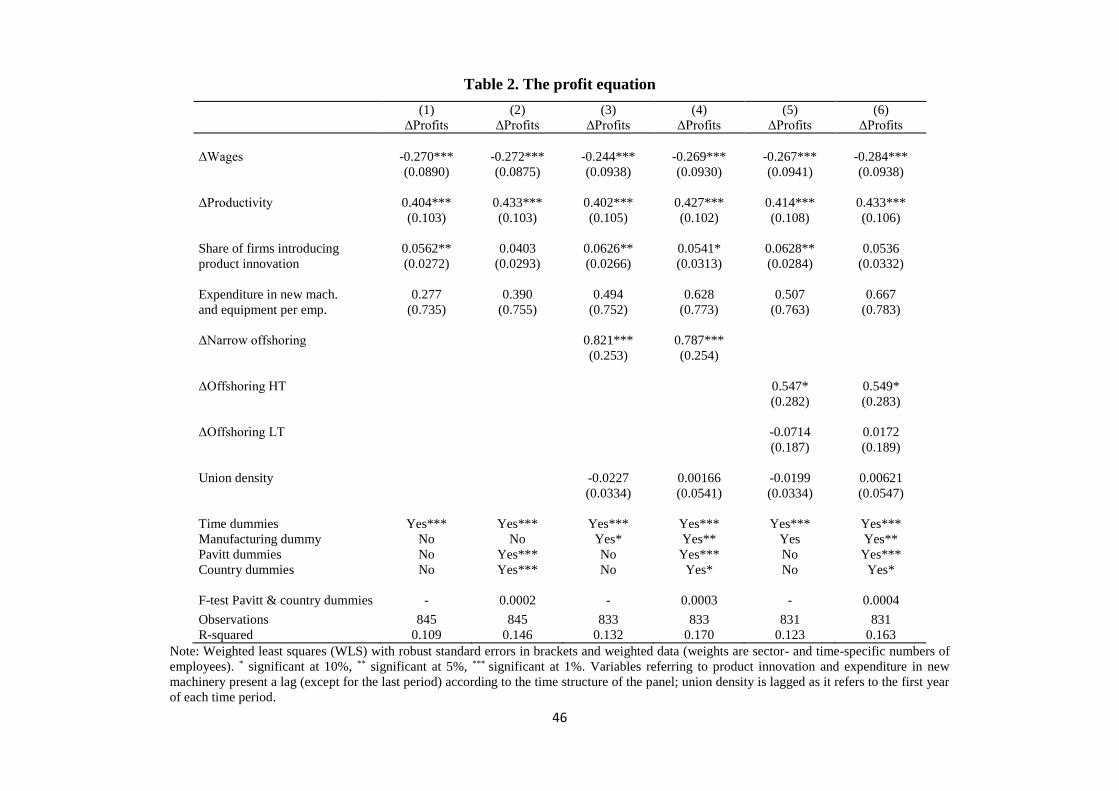
46
Table 2. The profit equation
(1) (2) (3) (4) (5) (6)
ΔProfits ΔProfits ΔProfits ΔProfits ΔProfits ΔProfits
ΔWages -0.270*** -0.272*** -0.244*** -0.269*** -0.267*** -0.284***
(0.0890) (0.0875) (0.0938) (0.0930) (0.0941) (0.0938)
ΔProductivity 0.404*** 0.433*** 0.402*** 0.427*** 0.414*** 0.433***
(0.103) (0.103) (0.105) (0.102) (0.108) (0.106)
Share of firms introducing 0.0562** 0.0403 0.0626** 0.0541* 0.0628** 0.0536
product innovation (0.0272) (0.0293) (0.0266) (0.0313) (0.0284) (0.0332)
Expenditure in new mach. 0.277 0.390 0.494 0.628 0.507 0.667
and equipment per emp. (0.735) (0.755) (0.752) (0.773) (0.763) (0.783)
ΔNarrow offshoring 0.821*** 0.787***
(0.253) (0.254)
ΔOffshoring HT 0.547* 0.549*
(0.282) (0.283)
ΔOffshoring LT -0.0714 0.0172
(0.187) (0.189)
Union density -0.0227 0.00166 -0.0199 0.00621
(0.0334) (0.0541) (0.0334) (0.0547)
Time dummies Yes*** Yes*** Yes*** Yes*** Yes*** Yes***
Manufacturing dummy No No Yes* Yes** Yes Yes**
Pavitt dummies No Yes*** No Yes*** No Yes***
Country dummies No Yes*** No Yes* No Yes*
F-test Pavitt & country dummies - 0.0002 - 0.0003 - 0.0004
Observations 845 845 833 833 831 831
R-squared 0.109 0.146 0.132 0.170 0.123 0.163
Note: Weighted least squares (WLS) with robust standard errors in brackets and weighted data (weights are sector- and time-specific numbers of
employees). * significant at 10%, ** significant at 5%, *** significant at 1%. Variables referring to product innovation and expenditure in new
machinery present a lag (except for the last period) according to the time structure of the panel; union density is lagged as it refers to the first year
of each time period.
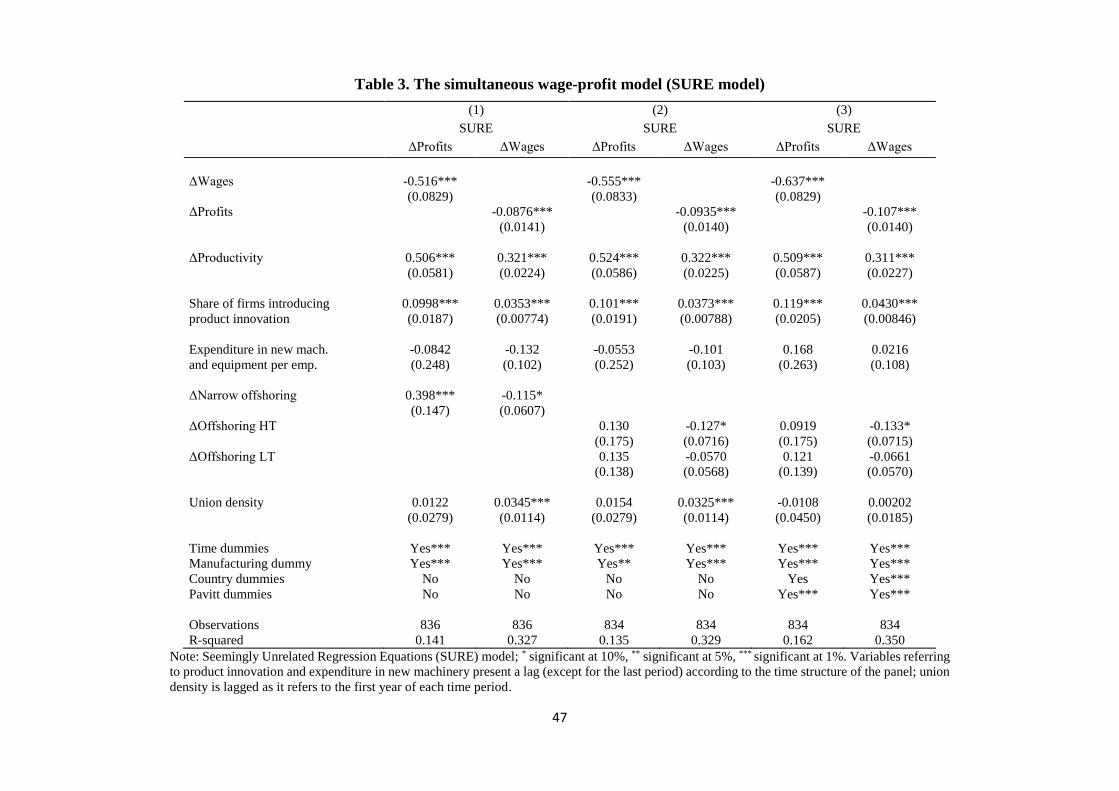
47
Table 3. The simultaneous wage-profit model (SURE model)
(1) (2) (3)
SURE SURE SURE
ΔProfits ΔWages ΔProfits ΔWages ΔProfits ΔWages
ΔWages -0.516*** -0.555*** -0.637***
(0.0829) (0.0833) (0.0829)
ΔProfits -0.0876*** -0.0935*** -0.107***
(0.0141) (0.0140) (0.0140)
ΔProductivity 0.506*** 0.321*** 0.524*** 0.322*** 0.509*** 0.311***
(0.0581) (0.0224) (0.0586) (0.0225) (0.0587) (0.0227)
Share of firms introducing 0.0998*** 0.0353*** 0.101*** 0.0373*** 0.119*** 0.0430***
product innovation (0.0187) (0.00774) (0.0191) (0.00788) (0.0205) (0.00846)
Expenditure in new mach. -0.0842 -0.132 -0.0553 -0.101 0.168 0.0216
and equipment per emp. (0.248) (0.102) (0.252) (0.103) (0.263) (0.108)
ΔNarrow offshoring 0.398*** -0.115*
(0.147) (0.0607)
ΔOffshoring HT 0.130 -0.127* 0.0919 -0.133*
(0.175) (0.0716) (0.175) (0.0715)
ΔOffshoring LT 0.135 -0.0570 0.121 -0.0661
(0.138) (0.0568) (0.139) (0.0570)
Union density 0.0122 0.0345*** 0.0154 0.0325*** -0.0108 0.00202
(0.0279) (0.0114) (0.0279) (0.0114) (0.0450) (0.0185)
Time dummies Yes*** Yes*** Yes*** Yes*** Yes*** Yes***
Manufacturing dummy Yes*** Yes*** Yes** Yes*** Yes*** Yes***
Country dummies No No No No Yes Yes***
Pavitt dummies No No No No Yes*** Yes***
Observations 836 836 834 834 834 834
R-squared 0.141 0.327 0.135 0.329 0.162 0.350
Note: Seemingly Unrelated Regression Equations (SURE) model; * significant at 10%, ** significant at 5%, *** significant at 1%. Variables referring
to product innovation and expenditure in new machinery present a lag (except for the last period) according to the time structure of the panel; union
density is lagged as it refers to the first year of each time period.

48
Table A.1 Robustness checks for the baseline wage equation
Heteroskedasticity (Breusch-Pagan test)
WLS regression (time, Pavitt and country dummies included)
Ho: constant variance (homoskedasticity)
F(16, 828) = 11,93
Prob > F = 0,0000
Heteroskedasticity (White test)
OLS regression (time, Pavitt and country dummies included)
Ho: homoskedasticity
Ha: unrestricted heteroskedasticity
chi2(121) = 335,34
Prob > chi2 = 0,0000
Autocorrelation of residuals (Cumby-Huizinga test)
WLS regression (time dummies included)
Ho: variable is MA process up to order q (with q = 0: serially uncorrelated)
Ha: serial correlation present at specified lags >q
chi2 = 2,490
p-value = 0,1146
Multicollinearity (Variance Inflation Factor)
WLS regression (time, Pavitt and country dummies included)
Mean VIF = 2,31
Endogeneity of labour productivity growth (Control function approach)
WLS with robust standard errors (time, Pavitt and country dummies included)
Endogenous: labour productivity growth
Instruments: first lag of labour productivity growth, share of managers, share of manual workers
First stage: test F(3, 726) = 60,81
Prob > F = 0,0000
Second stage: significance of residuals predicted in the first stage
p-value = 0,082
Multicollinearity for specification of Table 1, column 6 (Variance Inflation Factor)
WLS regression (time, manufacturing, Pavitt and country dummies included)
Mean VIF = 2,77
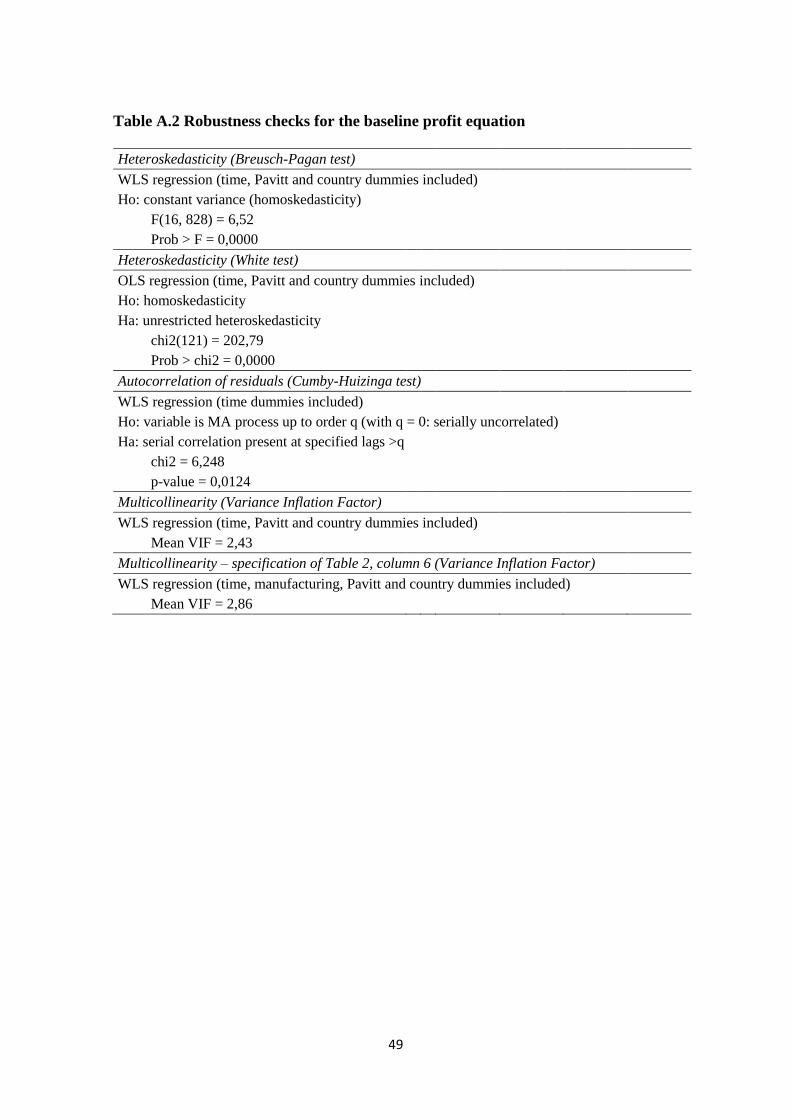
49
Table A.2 Robustness checks for the baseline profit equation
Heteroskedasticity (Breusch-Pagan test)
WLS regression (time, Pavitt and country dummies included)
Ho: constant variance (homoskedasticity)
F(16, 828) = 6,52
Prob > F = 0,0000
Heteroskedasticity (White test)
OLS regression (time, Pavitt and country dummies included)
Ho: homoskedasticity
Ha: unrestricted heteroskedasticity
chi2(121) = 202,79
Prob > chi2 = 0,0000
Autocorrelation of residuals (Cumby-Huizinga test)
WLS regression (time dummies included)
Ho: variable is MA process up to order q (with q = 0: serially uncorrelated)
Ha: serial correlation present at specified lags >q
chi2 = 6,248
p-value = 0,0124
Multicollinearity (Variance Inflation Factor)
WLS regression (time, Pavitt and country dummies included)
Mean VIF = 2,43
Multicollinearity – specification of Table 2, column 6 (Variance Inflation Factor)
WLS regression (time, manufacturing, Pavitt and country dummies included)
Mean VIF = 2,86

50
Table A.3 Baseline profit equation: endogeneity tests
Test Endogenous
variable Instruments Estimator
Test F (first stage) and
overidentification tests
Final test (second stage) and
endogeneity test Result
Control function
approach Productivity
QCLE,
QCWO, QMWO WLS, robust s.e.
F(9, 719) = 147.14
Prob > F = 0.0000
Ho: variables are exogenous
P-val > |t| = 0.37
(test on the residuals
predicted in the first stage)
exogenous (same results with
lagged SIZE as instrument)
Wooldridge's (1995)
robust score test
and
robust regression-
based test after 2sls
Productivity QCLE,
QCWO, QMWO
2SLS weighted,
with robust s.e.
(ivregress 2sls
Stata's command)
F(10, 695) = 119.95
Prob > F = 0.0000
_____________________
Test of overidentifying
restrictions:
Hansen’s (1982) J statistic:
Score chi2(1) = 0.738166
P-val = 0.6914
Tests of endogeneity
Ho: variables are exogenous
Wooldridge's (1995) robust
score test = 0.613604
P-val = 0.4334
Robust regression-
based test
F(1,696) = 0.492114
P-val = 0.4832
exogenous
exogenous
Wooldridge's (1995)
robust score test
and
robust regression-
based test after 2sls
Productivity QMAN, QMWO,
lagged RVA
2SLS weighted,
with robust s.e.
(ivregress 2sls
Stata's command)
F(10, 598) = 128.92
Prob > F = 0.0000
_____________________
Test of overidentifying
restrictions:
Hansen’s (1982) J statistic:
Score chi2(1) = 1.8427
P-val = 0.3980
Tests of endogeneity
Ho: variables are exogenous
Wooldridge's (1995) robust
score test = 2.767
P-val = 0.0962
Robust regression-
based test
F(1,696) = 2.39478
P-val = 0.1223
weakly
endogenous
exogenous
Note: QMAN=share of managers; QCLE=share of clerks; QCWO=share of craft workers; QMWO=share of manual workers; RVA=growth rate of value added; SIZE=average firm
size. Variables referring to the share of managers, clerks, craft and manual workers over the total number of employees in the sector, as well as size, present a lag as they refer to the
first year of each time period. Growth rate of value added of sectors is computed as the compound average annual rate of change over five periods (1996-2000, 2000-2003, 2003-2008,
2008-2012, 2012-2014) according to the time structure of the panel.

51
Endnotes
1 The selection of countries and sectors has been made in order to avoid limitations in access to data (due
to the low number of firms in a given sector of a given country, or to the policies on data release by National
Statistical Institutes).
2 Since the conversion procedure might result in some data distortions, implausibly large values (in absolute
terms) which appeared for some industries have been excluded.
3 It is worth noting that Feenstra and Hanson (1999) stress the reliability of ‘narrow’ offshoring indicator
since it is conceived to capture better the definition of production fragmentation, an event which mostly
occurs within industries.
4 The variable related to the expenditure for new machinery and equipment contains missing values for the
first two CIS waves by construction. However, missing values are homogeneously distributed across
countries in service industries.
5 The temporal structure of the database is firstly due to the frequency according to which Eurostat collects
the innovation surveys and makes them available. Secondly, the surveys’ innovation-related questions are
partially changed over the time, forcing us to select consistently the CIS containing the variables of our
interest. Finally, we matched the economic and innovation variables so that the latter are lagged relative to
the former, bearing in mind the time needed by technological efforts to display their effects.
6 Nonetheless, it is worth noting that in Figure 3 Germany observations are below the fitted values line,
providing evidence about the slow German wage growth and pointing out a limited sharing of the rents
generated by innovation. It should be also noted the poor performance of Spain in terms of technological
capabilities and related low growth of labour and capital compensation compared to the other European
countries.
7 Figure 7 and 8 exclude the Netherlands from the sample. From a descriptive point of view, the
Netherlands’ offshoring observations are misleading because of the small dimension of this country
(compared to the others) and for the “seaport effect” which stems from being a trade hub.
8 Following Pianta and Tancioni (2008), we use total sectoral profit as a proxy of capital compensation,
although the investigation of rate of return on capital would be the most proper variable for our analysis.
Unfortunately, missing data on industries’ capital fixed assets makes such analysis unfeasible. However,
considering that capital stock does not change rapidly at industry level, assuming total profit as a good

52
return of capital proxy appears to be reasonable. Conversely, sectoral wage bill depends directly on the
number of workers or, more accurately, on the working time performed by employees (given the
widespread use of precarious and part time jobs nowadays). Hence, wage per worker hour is considered a
more appropriate measure to capture the distributional impact of our covariates and the relationship between
labour and capital remuneration.
9 Along the structural change process of the economies, we observe sectors that experience high growth
rate alongside others which decline. We might thus witness a contemporary growth of both profits and
wages in the former and the opposite dynamics in the latter.
10 Values of all offshoring variables have been multiplied by 100.
11 An extensive diagnostic concerning variables endogeneity and specifications’ robustness is provided in
Appendix, Table A.1-A.3. Our robustness checks confirm the appropriateness of our estimation strategy,
the only reason which might raise concerns being the one regarding the endogeneity tests on labour
productivity growth.
12 We also accounted for another potential omitted variable bias in the wage equation controlling for the
employment structure of industries as a factor which might reasonably impact on the level of wage in the
sector. For this purpose, we included the share of managers and the share of manual workers – classified
according to the ISCO professional groups (Cirillo, 2017) – as covariates in the wage equation. The
introduction of the share of managers and of manual workers in the wage equation does not change
considerably our estimation results insofar as their effects do not turn out to be significant in explaining the
wage dynamics. Furthermore, we tested the robustness of our findings even using a different product
innovation variable, namely the share of firms which innovate with the aim of opening new markets in the
sector, whose design and time structure is the same of previously employed innovation proxies insofar as
it is likewise drawn from the CIS provided by Eurostat. The results stemming from both the equation-by-
equation estimates and the simultaneous model estimation substantially confirm our present findings about
the heterogenous impact of innovation, offshoring and union density on the growth rate of wages and
profits. As regards these additional checks see Coveri and Pianta (2019).
13 In column 6 our product innovation proxy turns out with a positive but not significant coefficient, while
all the other coefficients do not change considerable their sign, significance and magnitude. This outcome
stems from the inclusion of country dummies in column 6, as far as the inclusion of Pavitt dummies does

53
not turn out insignificant the coefficient related to product innovation (Coveri and Pianta, 2019). Whether
the joint significance of Pavitt and country dummies is confirmed by the reported p-value of the F-test in
column 6, it is worth noting that country dummies are very slightly significant; using Germany as reference
(i.e. excluding the dummy for Germany to avoid multicollinearity), only the dummy for Italy results
significant at 10%. Hence, we hold that the statistical relevance of the variable proxying product innovation
in the profit equation is not fundamentally questioned.