Embed Size (px)
Citation preview

Technology Market Research & Technology Market Research & Technology ValuationTechnology ValuationTechnology ValuationTechnology Valuation
Sze Tiam Lin PhD, CLPDirector IPI SingaporeDirector, IPI Singapore
EXCO Member, LES Singapore
18 April 2012
11

About the Speaker
DR. TIAM‐Lin SZE is the Director at IPI, a company setup under the national Research,I ti & E t i 2015 (RIE 2015) Pl t b th f t i tInnovation & Enterprise 2015 (RIE 2015) Plan, to be the nexus for enterprise to access,acquire and capitalize on IP to innovate and succeed in the global economy.
Prior to IPI, Dr Sze held several Senior Vice Presidents appointments at ExploitTechnologies Pte Ltd, the commercialisation arm of A*STAR and involved in numerousroles including IP management and strategy, technology intelligence and competitiveintelligence, commercialization and licensing. He has successfully commercialized newtechnologies ranging from IT, communications, manufacturing, semiconductors,materials, chemicals, nanotechnologies to medical devices. Dr Sze is a CertifiedLicensing Professional (CLP) and a member of the Executive Committee of theLicensing Executive Society (LES), Singapore. He has two granted patents. He is a panelmember in the National Research Foundation (NRF) POC Committee and a reviewmember of the A*STAR Biomedical Engineering Programme (BEP) POC grant.
Dr. Sze holds a Ph.D and B.Eng in Automatic Control & Systems Engineering from theUniversity of Sheffield, UK and received an executive education in Strategic R&DManagement at INSEAD, Fontainebleau.
2
g ,

OUTLINE OF PRESENTATION
1. Introduction to Technology Valuation2 Market Approach2. Market Approach3. Cost Approach
h4. Income Approach5. Rules of Thumb (The 25% Rule)6. Additional Methods7 Technology & Market Research7. Technology & Market Research
3
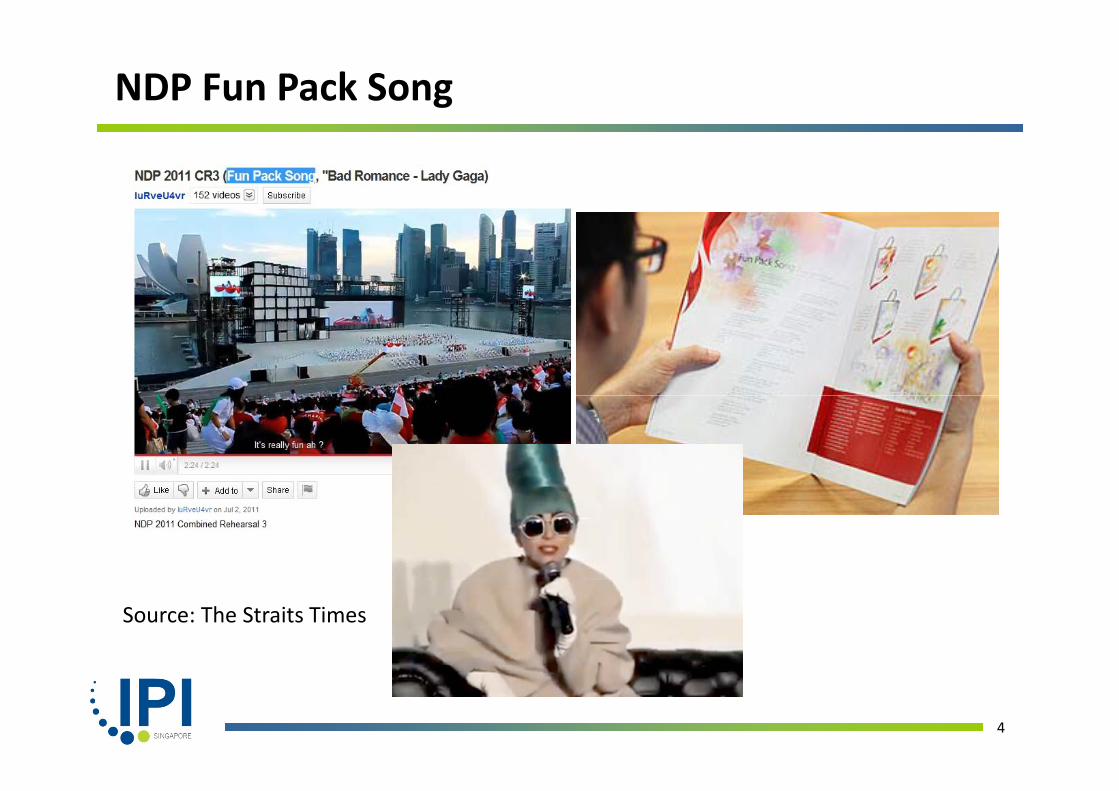
NDP Fun Pack Song
Source: The Straits Times
4

INTRODUCTION
‐ The Value of IP and Technology in Business
Block competitors Exploit new market opportunitiesCreate Competitive Exploit new market opportunities Reduce risks Create loyalty
Improve Financial
Advantage
Tap IP for new revenues Reduce cost Attract additional capital
Improve Financial Performance
Protect technologies & business methods Boost R&D and branding effectiveness
Establish Proprietary (Special) Knowledge
Anticipate market & technology shifts
5

INTRODUCTION
‐ How to extract value from IP?
Strategic Alliances & Divestments Collaborations & Spin‐Offs
Licensing & Franchising
Merger & Acquisition
Financing Strategies
6

TECHNOLOGY VALUATION METHODS
1. Introduction to Technology Valuation2 Market Approach2. Market Approach3. Cost Approach
h4. Income Approach5. Rules of Thumb (The 25% Rule)6. Additional Methods7 Technology & Market Research7. Technology & Market Research
7

1. MARKET APPROACH#
Concept of Value:
“Prices from previous transactions provide empirical evidence for the indicated value of anempirical evidence for the indicated value of an asset”
Courtesy: Google Map
8
# Comparables or Industry Standards

1. MARKET APPROACH
PriceWaterHouse Coopers
‐ Comparables (survey or industry experts)
PriceWaterHouse Coopers …
9

1. MARKET APPROACH
‐ Other Sources
AUS Consultants – www.RoyaltySource.com
Royalty Stat ‐ www.RoyaltyStat.com
Royalty Rates for Technology, 2nd Edition (IP Research Associates)
Securities & Exchange Commission (SEC) – www.sec.orgSecurities & Exchange Commission (SEC) www.sec.org
Association of University Technology Transfer (AUTM) Professionals –www.autm.net
Licensing Executive Societies (LES) Professionals ‐ www.les.org Early‐Stage Technologies: Valuation & Pricing – Richard Razgaitis (John Wiley, 1999)
10

2. COST APPROACH
Concept of Value:p
“An investor will pay no more for an IP asset than the cost to purchase or construct an asset of equal use”cost to purchase or construct an asset of equal use
11

2. COST APPROACH
1. Cost method can be based on:a) Replacement costb) lb) Development cost
2. There are some concerns expressed in using the Cost Method, citing royalty rates are a representation of value and costs have very little to do with value, e.g., lottery ticket?
3. Attempt to calculate an investment rate of return on the R&D costs associated with developing an invention, again cost does not reflect well the p g , gvalue of an invention, e.g., 3M?
4. Why not? – High R&D cost can be result of poor project or investment management on the seller & cost depends on start date poor start date willmanagement on the seller & cost depends on start date, poor start date will affect cost. What about inefficient way of creating technology?
5. Buyer is looking for forward opportunity, not to undo the misfortunes of the seller if anyseller, if any.
6. Exception, using cost analysis to argue ROI for seller, what about outsource R&D effort/cost to others, i.e., buyer’s alternatives. Can be useful for buyer to d i h i i f i i i h
12
determine the starting point for estimating associate cost to recreate the technology.

3. INCOME APPROACH
Concept of Value:p
“An IP asset is what it can earn in the future!”
13

3. INCOME APPROACH#
‐ Basic Concept
Courtesy: Deloitte Touche Tohmatsu 2008
14
# Discounted Cash Flow (DCF)

3. INCOME APPROACH
B A (1 + k)n
‐ Also known as Discounted Cash Flow (DCF). Basic concept:
B = A (1 + k)n
A = present value (e.g., $1,000)B f t l ( 3 @ k 5%) l d t $1 050B = future value (e.g., n=3 yrs @ k = 5%) leads to $1,050k = Risk-Adjusted Hurdle Rate (RAHR), e.g.,
Seed stage (k>80%);Seed stage (k>80%); Startup (50% <k<70%); 1st Stage – limited customer (40%<k<60%); 2nd Stage – growth (30%<k<40%)
A or DCF B /(1 + k)n
“Bridge” financing – to IPO (20%<k<35%)e.g., payback? Microsoft (400), 10 – 40, etc.
A or DCF = B /(1 + k)n
B/A = (1+k)n ~ “payback”
15

3. INCOME APPROACH
YEAR 1 2 3 4 5 6Number of Units Sold 100 200 300 350 400 400Average Selling Price $10,000 $10,000 $9,500 $9,000 $8,000 $8,000
Revenues (Sales) $1,000,000 $2,000,000 $2,850,000 $3,150,000 $3,200,000 $3,200,000Cost of Good Solds (COGS) $600,000 $1,200,000 $1,710,000 $1,890,000 $1,920,000 $1,920,000Gross Profit $400,000 $800,000 $1,140,000 $1,260,000 $1,280,000 $1,280,000Gross Margin 40% 40% 40% 40% 40% 40%
Operating Expenses:General Overhead & Admin $50,000 $100,000 $142,500 $157,500 $160,000 $160,000R&D $70,000 $140,000 $199,500 $220,500 $224,000 $224,000Marketing $80,000 $160,000 $228,000 $252,000 $256,000 $256,000Selling $30,000 $60,000 $85,500 $94,500 $96,000 $96,000Operating Profit $170,000 $340,000 $484,500 $535,500 $544,000 $544,000Operating Margin 17% 17% 17% 17% 17% 17%
Income Taxes $34,000 $68,000 $96,900 $107,100 $108,800 $108,800Net Income $136,000 $272,000 $387,600 $428,400 $435,200 $435,200Net Profit Margin 14% 14% 14% 14% 14% 14%
Cash Flow:Depreciation $30,000 $60,000 $85,500 $94,500 $96,000 $96,000Gross Cash Flow (GCF) $166,000 $332,000 $473,100 $522,900 $531,200 $531,200Increase in Investment $100,000 $85,000 $30,000 $5,000 $0 $0Net Cash Flow $66,000 $247,000 $443,100 $517,900 $531,200 $531,200
RAHR (k) @ 25%
16
( ) @DCF(k) $59,032 $176,739 $253,645 $237,171 $194,609 $155,687NPV(k) $1,076,883
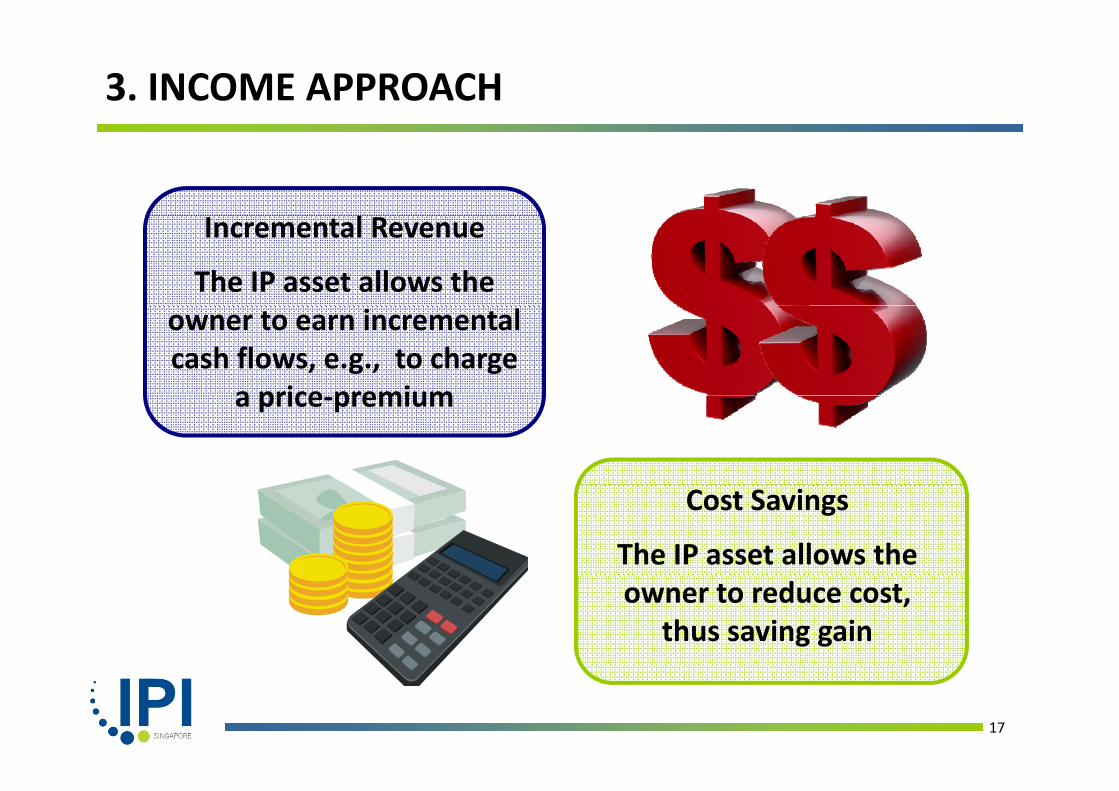
3. INCOME APPROACH
lIncremental Revenue
The IP asset allows the owner to earn incremental cash flows, e.g., to charge
a price premiuma price‐premium
Cost Savings
The IP asset allows the owner to reduce cost,
thus saving gain
17

4. THE 25% RULE
Value‐Chain of Activities and Contributions
TECHNOLOGY PRODUCT DEVELOPMENT
MANUFACTURING& DISTRIBUTION
MARKETING (SELLING)
18
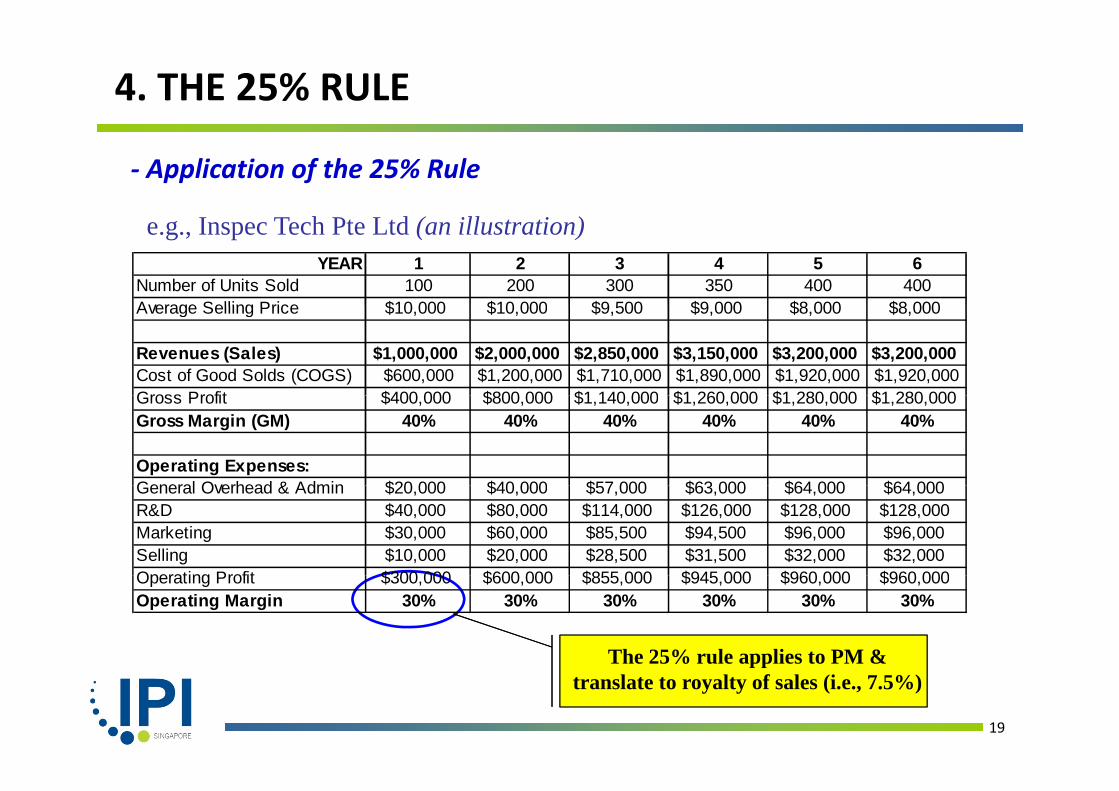
4. THE 25% RULE
‐ Application of the 25% Rule
e.g., Inspec Tech Pte Ltd (an illustration)YEAR 1 2 3 4 5 6
Number of Units Sold 100 200 300 350 400 400Average Selling Price $10 000 $10 000 $9 500 $9 000 $8 000 $8 000Average Selling Price $10,000 $10,000 $9,500 $9,000 $8,000 $8,000
Revenues (Sales) $1,000,000 $2,000,000 $2,850,000 $3,150,000 $3,200,000 $3,200,000Cost of Good Solds (COGS) $600,000 $1,200,000 $1,710,000 $1,890,000 $1,920,000 $1,920,000Gross Profit $400 000 $800 000 $1 140 000 $1 260 000 $1 280 000 $1 280 000Gross Profit $400,000 $800,000 $1,140,000 $1,260,000 $1,280,000 $1,280,000Gross Margin (GM) 40% 40% 40% 40% 40% 40%
Operating Expenses:General Overhead & Admin $20 000 $40 000 $57 000 $63 000 $64 000 $64 000General Overhead & Admin $20,000 $40,000 $57,000 $63,000 $64,000 $64,000R&D $40,000 $80,000 $114,000 $126,000 $128,000 $128,000Marketing $30,000 $60,000 $85,500 $94,500 $96,000 $96,000Selling $10,000 $20,000 $28,500 $31,500 $32,000 $32,000Operating Profit $300 000 $600 000 $855 000 $945 000 $960 000 $960 000
The 25% rule applies to PM &
Operating Profit $300,000 $600,000 $855,000 $945,000 $960,000 $960,000Operating Margin 30% 30% 30% 30% 30% 30%
19
pptranslate to royalty of sales (i.e., 7.5%)

5. ADDITIONAL METHODS
(a) Comparable Licenses (Rating/Ranking) Scoring criteria (market size, patent protection, stage of development, etc.) Scoring system (1 – 5 where 5 is best) Scoring scale (subjective and objective – experts/metric) Weighting factors Decision TableDecision Table
(b) Auction(c) Monte Carlo Method – a probabilistic approach
(i) UniformUnit Selling Price
$8,000 $10,000$9,000
(ii) TriangularCOGS
(ii) Triangular
40%30% 50%
SG&A + R&D
20
30% 40%
(iii) Normal SG&A + R&D
20%
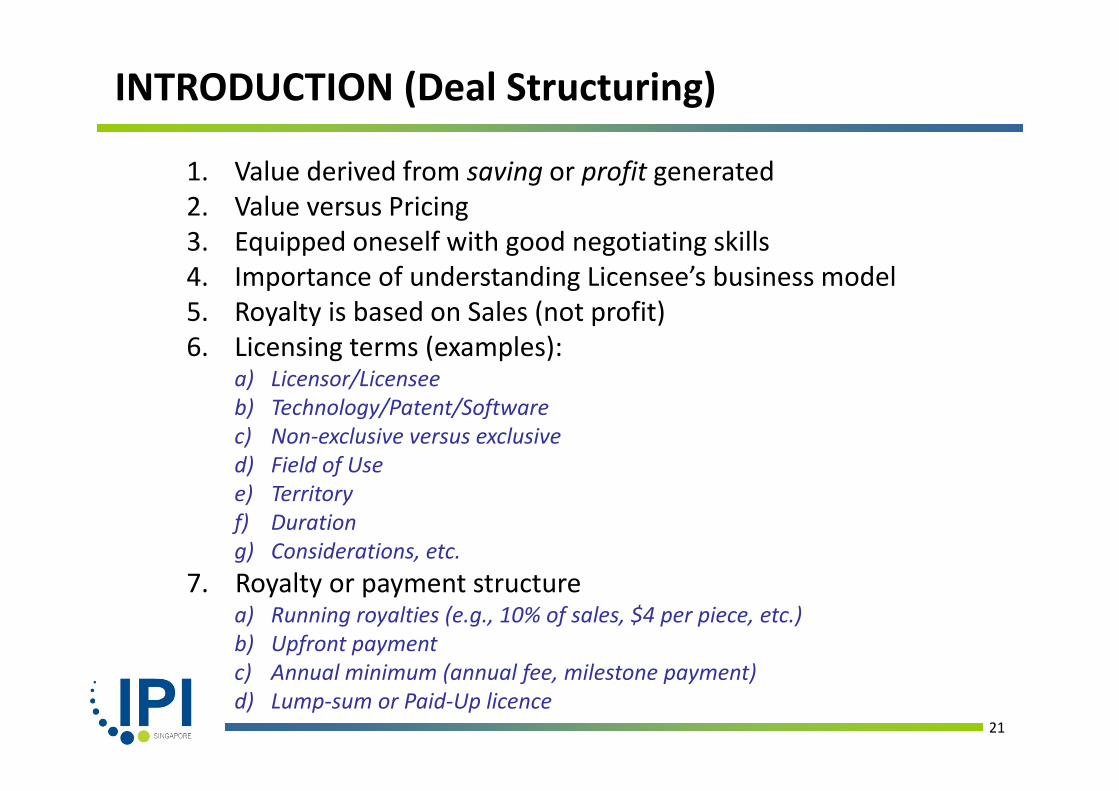
INTRODUCTION (Deal Structuring)
1. Value derived from saving or profit generated2. Value versus Pricingg3. Equipped oneself with good negotiating skills4. Importance of understanding Licensee’s business model5 R lt i b d S l ( t fit)5. Royalty is based on Sales (not profit)6. Licensing terms (examples):
a) Licensor/Licenseeb) Technology/Patent/Softwarec) Non‐exclusive versus exclusived) Field of Use)e) Territoryf) Durationg) Considerations, etc.
7 R lt t t t7. Royalty or payment structurea) Running royalties (e.g., 10% of sales, $4 per piece, etc.)b) Upfront payment) A l i i ( l f il )
21
c) Annual minimum (annual fee, milestone payment)d) Lump‐sum or Paid‐Up licence

TECHNOLOGY & MARKET RESEARCH
KNOW YOURSELF
KNOW YOUR TARGET MARKETS Identify the countries for your business
concept Know your business
model Know your strengths &
concept Gather market information such as
market size and share, market readiness, etc
weakness Develop a strong
business concept and
etc. Develop appropriate tactics to penetrate
the market
value propositions that could be licensed
Have a well considered business expansion plan
Identify sufficient resources to support l
KNOW YOUR COMPETITORS Know their strengths & weakness
plang
Know their products, services, customers, cost structure, etc.
Formulate your own strategies on how
22
best to tackle the competition
NDP Fun Pack Song
Source: The Straits Times
23
24

a channel for Singapore Enterprises to acquire and capitalize on technologies and know-howq p g
to grow their business
25

Our ApproachOur Approach
SourceEngage technology owners with strong value
ScanScan and search for available expertise
ScopeTranslate innovation objectives into specific IP owners with strong value
proposition to seek out licensing, acquisition or JV opportunities
and technologies from reputable local and overseas sources to meet your technology
i t
and technology requirements to optimize your business processes, products and services.
requirements.
26
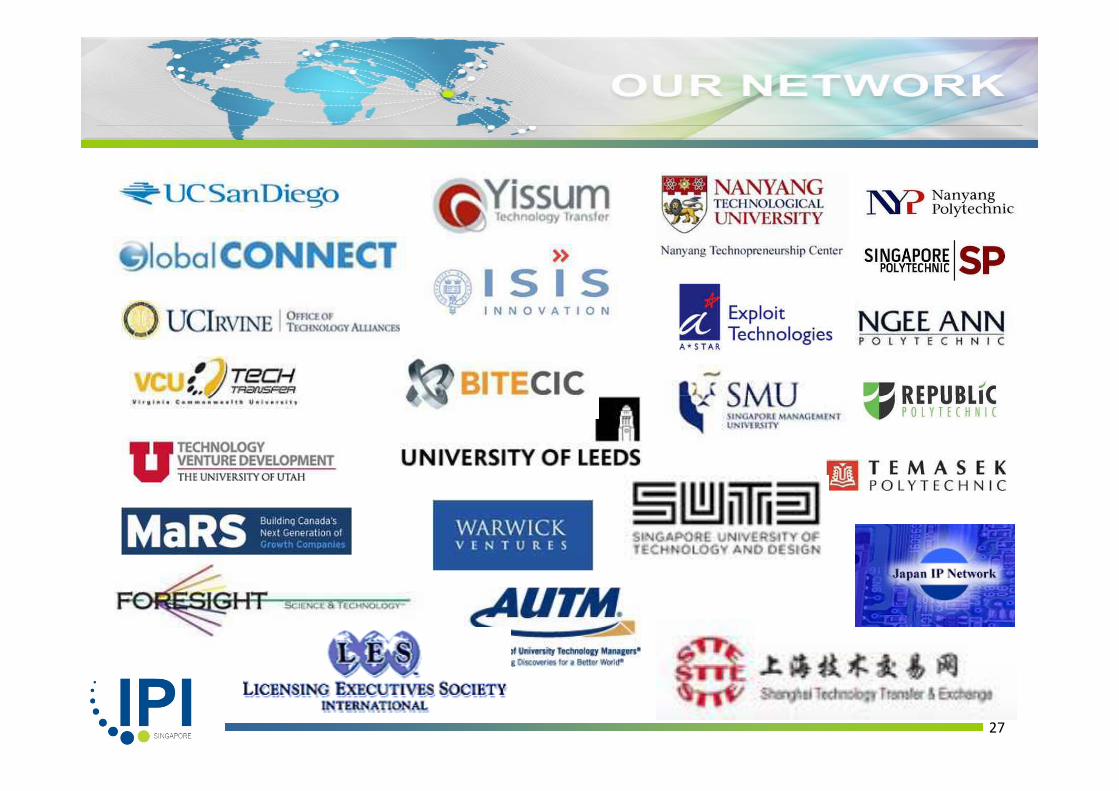
Well‐Served by Global Network of Partners
27

Search Search h lh l
Post Post TechnologiesTechnologies TechNeedsTechNeeds
INDUSTRYINDUSTRYSME & SGSME & SG‐‐based Enterprisebased Enterprise
TECH PARTNERSTECH PARTNERSLocal, Overseas & IP PartnersLocal, Overseas & IP Partners
TECH PARTNERSTECH PARTNERSLocal, Overseas & IP PartnersLocal, Overseas & IP Partners
Tech AlertsTech Alerts Extend Reach Extend Reach of IPI Networkof IPI Network
28
Thank You for ListeningThank You for Listening
For further information, contact:
Dr Sze Tiam LinDirector IPIDirector, IPI
Phone: 65‐64196601Email: tlsze@ipi‐singapore.org
Office: 61, Biopolis Drive, #01‐02,
2929
Singapore 138673