Embed Size (px)
Citation preview
ABB Review 3/2002 57
nyone who has ever walked
along a street filled with restau-
rants on a summer’s evening will know
the feeling. Choice is a great thing, but it
can also be a dilemma. Eager restaurant
staff try to entice you to enter their
establishments, promising you the best
food and service in town. As you listen
to their pitch, inspect the menu and look
at the restaurant, the chances are you
will be influenced by one or the other of
these factors.
Getting you to the table is one thing,
ensuring the promised good food and
good service quite another. If the restau-
rant can’t deliver on either, you won't be
going back to that restaurant, and neither
will anyone you know. None of this is
good for business.
Now let’s stretch our imagination and
suppose that the restaurant has to pay a
penalty if the food arrives late or isn’t as
good as promised – suddenly the idea of
offering incentives to attract customers
becomes a gamble that could make or
break the restaurant owner.
And so it is in the industrial world.
Companies compete with each other to
secure business by offering attractive
contract tenders to potential customers.
One way to substantially reduce the
contract bidding price is to consider the
profit margin in terms of performance-
related bonuses. This means that the
contract includes clauses specifying a
bonus or penalty for exceeding or
missing certain targets. Sometimes,
however, in trying to make a tender
attractive certain risks are not properly
RiBAMichal Orkisz, Andreas Poncet, Zbigniew Korendo,
Michal Kreft, Jörg Holle
Risk-taking might imply the possibility of
losing, but does there have to be a loser? The
answer is no. As more and more service and
retrofit projects become performance-based,
risk assessment is developing into a valuable
bidding instrument for ABB and its customers.
RiBA (Risk-Based Assessment) is a
software tool developed by ABB to provide a
sound platform for risk management and the
development of mitigation strategies for
competitive projects.
A
A quantitative riskassessment and tracking tool
Technology Review
58 ABB Review 3/2002
identified and quantified, while some
may even be overlooked, with costly
consequences later. So doing this is safe
only if the associated risks (eg, schedule
risks and liquidated damages that could
result) are well understood and project
plans are adjusted accordingly.
Risk analysis for project planning
generally requires skillful, expert analysts
on the one hand and sound software
tools on the other. An experienced
analyst may be able to do the job, but
expert resources are usually limited. For
an efficient analysis a sound risk analysis
software tool is a must.
‘Win-win’ performance contracts
Performance-based contracts benefit
customers and ABB alike. They are good
for customers because they lift the
burden of uncertainty from their shoul-
ders; and they are good for ABB because
risk mitigation has a financial value. ABB
companies therefore consider it very
important to be able to produce truly
competitive contract tenders in which
bonus and penalty clauses constitute an
integral part of the contract value.
A good example of a performance-
type contract is one recently awarded to
ABB by a US utility for a retrofit project
covering five high-voltage substations in
a busy industrial area. The project was
managed by ABB Utility Services in the
USA. More than 30 other companies
contributed to the project as subcontrac-
tors and subsuppliers, and past experi-
ence indicated that they might introduce
project delays. During the contract
planning the expected performance of
each of them was therefore estimated on
the basis of reliability, experience and
the type of work to be performed. This
estimate was then taken into account
when evaluating the project risk.
Originally, the utility company
proposed a contract value that would
have reduced ABB’s margin to less than
1%! The compromise eventually reached
by the parties was a performance-based
contract containing performance-related
financial clauses that made the margin
dependent on ABB being able to earn
several bonuses. On the other hand,
losses could be incurred if certain
penalty clauses were triggered due to
delays or outages. It created conditions
for a ‘win-win’ situation in which ABB’s
interest in generating a high margin was
closely tied to the utility’s desire to have
the project completed as soon as possi-
ble, without any inconvenience to its
customers. The actual contract proposal
had to be drawn up in just four
workdays.
Working out this win-win situation is
significantly easier with RiBA (Risk-Based
Assessment). The result of collaboration
between the Polish and Swiss ABB Cor-
porate Research Centers, with active par-
ticipation by Business Area Utility project
managers, this state-of-the-art, web-based
project assessment tool is unique in that
it combines the analysis of schedule,
financial impact and quality risks.
RiBA – general overview
RiBA was developed to quantify risk,
develop risk mitigation plans (before
bidding on performance contracts, eg in
the service and retrofit business) and
allow continuous tracking of projects. It
is a project simulator that describes a
project as a set of interdependent tasks
whose duration is known to be uncer-
tain within given limits, and whose
completion before or after a specified
deadline may carry a prescribed bonus
or penalty. The tool sets up a large
number of different (stochastic) possible
scenarios according to the probability
distributions of the uncertain variables.
The results are consolidated as his-
tograms (of time and costs), which are
then smoothed to reduce the effect of
the statistical dispersion.
As mentioned, the strength and
uniqueness of RiBA comes from the
combined analysis of schedule, financial
impact and quality risks. It is a client-
server software tool with a central
subcontractor and project models
database and a risk calculation engine
that uses a combination of numerical
methods such as Monte Carlo simulation
and software components (eg, the
MATLAB calculation engine and JAVA
Enterprise Beans technology). An
essential feature of RiBA is that its front
end is seamlessly integrated with
Microsoft Project, a universally recog-
nized environment for project modeling
Technology Review
“The risk analysis results produced by RiBA are asound basis for contract optimization andnegotiations with the customer”. RiBA pilot user
ABB Review 3/2002 59
and management. In the future it will
also interface with other project model-
ing software.
The development objective, success-
fully embodied in RiBA, was to create
a tool for easy and efficient ‘what-if’
scenario analyses. Another prerequisite
was that it should allow project schedule
planning and risk analysis to be
performed in a common software
environment.
The principal features of RiBA are:
n Schedule-oriented risk assessment
based on the duration uncertainty for
project tasks.
n Value-oriented risk assessment based
on task- or milestone-related perform-
ance clauses (bonus/penalty).
n Inclusion of quality risk factors.
n Modeling and web-sharing of
performance profiles of subcontractors
and subsuppliers.
n Database of web-shared project
templates.
n Schedule and cost sensitivity analysis.
This set of features makes RiBA a sound
platform for risk management and the
development of mitigation strategies for
competitive projects, eg during contract
planning and negotiations, when
executing the project and for handling
suppliers and subcontractors.
Modeling with RiBA
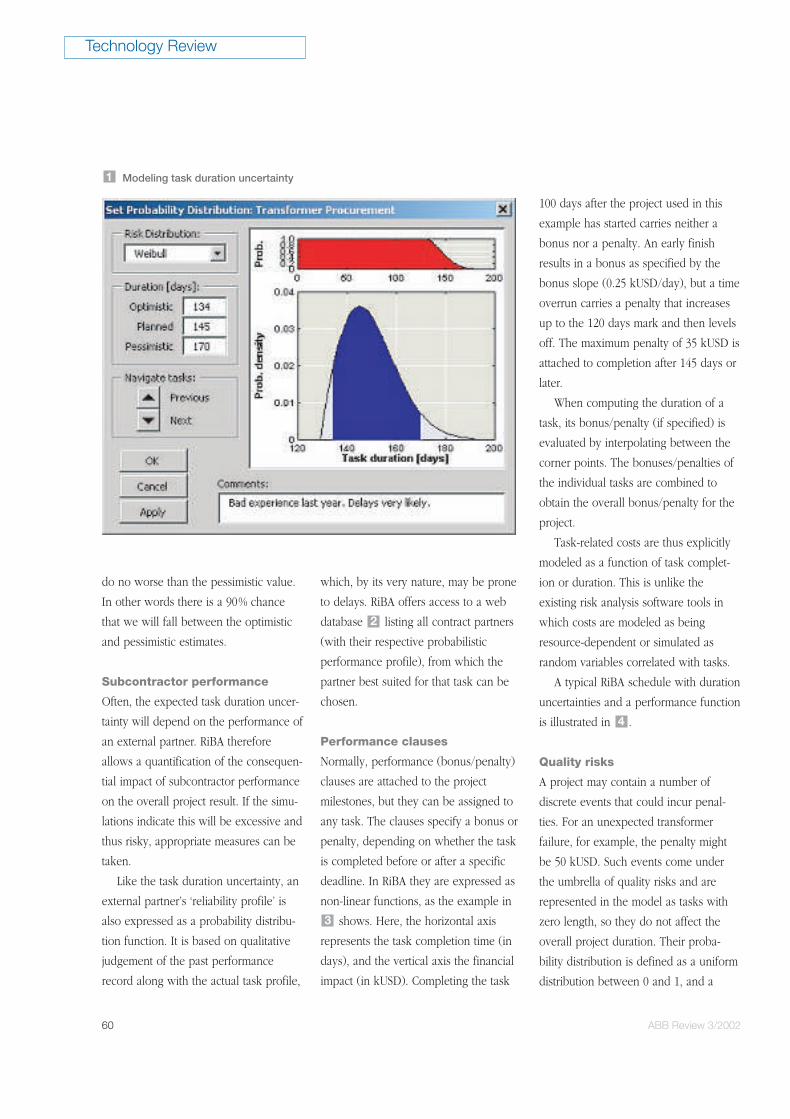
Duration uncertainty
To keep things simple for users, the
probability density functions used in
RiBA are expressed in terms of five para-
meters: upper and lower percentiles,
upper and lower quantiles and mode.
Fixing the lower and upper percentiles
(eg, to 5% and 95%, respectively) further
reduces the number of parameters to be
entered. In fact, RiBA users only have to
enter three parameters per task, called
planned, optimistic and pessimistic
estimates . Planned means ‘according
to schedule’, optimistic means that (for
the figures given above) there is only a
5 % chance that ABB will do better than
the optimistic value, and pessimistic
means that in 95% of the cases ABB will
1
Probability distributions and Monte Carlo simulations
Monte Carlo (MC) methods belong to numerical simulation techniques thatutilize sequences of random numbers to model complex systems withoutthe need to formulate a physical description (eg, differential equations) ofthe system’s behavior. Instead, they require that the system be describedby a set of probability density functions (pdf – also known as distributions),such as a Weibul pdf. Using MC simulations RiBA evaluates a largenumber of project realizations according to the specified probabilitydistributions of the task durations. The resulting project evolution in eachcase is simulated by drawing each task’s duration from that task’sprobability distribution or, more generally, from the joint distribution ifconditional dependencies between durations need to be introduced. Thetotal project duration is evaluated using the task interdependence rules(eg, task A cannot start before task B has been completed). Penalties arecalculated for each task and summed to obtain the overall projectbonus/penalty value. Thus, for each realization there are two results: thetotal project duration and the total project penalty. The results from all thedifferent realizations are combined to produce two histograms: the overallproject duration distribution and the overall project value distribution.
Sensitivity analysis
The sensitivity calculation function allows RiBA users to visualize how theuncertainty of a particular task affects the overall project completion timeand value. In other words, it shows how much the project depends on theunknown outcome of each task. This is possible as the actual impact ofevery task's duration distribution is considered.
In this scheme a task on the critical path but having no uncertainty haszero sensitivity, even if it is a ‘critical task’. The rationale is that if thedistribution is deterministic (certain) there is no room to improve it further.A task with a very broad distribution can, on the other hand, have asignificant sensitivity (even a critical one in some iterations). Separatesensitivities are computed for the project duration distribution and projectvalue distribution.
60 ABB Review 3/2002
do no worse than the pessimistic value.
In other words there is a 90% chance
that we will fall between the optimistic
and pessimistic estimates.
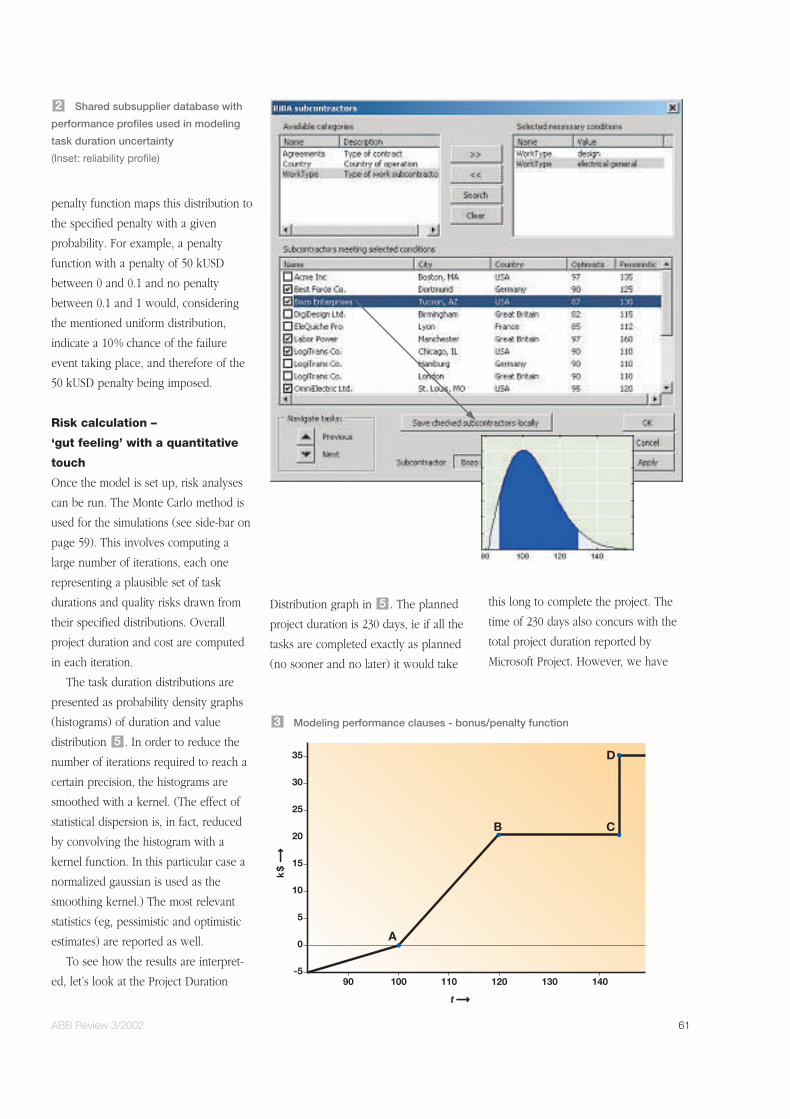
Subcontractor performance
Often, the expected task duration uncer-
tainty will depend on the performance of
an external partner. RiBA therefore
allows a quantification of the consequen-
tial impact of subcontractor performance
on the overall project result. If the simu-
lations indicate this will be excessive and
thus risky, appropriate measures can be
taken.
Like the task duration uncertainty, an
external partner’s ‘reliability profile’ is
also expressed as a probability distribu-
tion function. It is based on qualitative
judgement of the past performance
record along with the actual task profile,
which, by its very nature, may be prone
to delays. RiBA offers access to a web
database listing all contract partners
(with their respective probabilistic
performance profile), from which the
partner best suited for that task can be
chosen.
Performance clauses
Normally, performance (bonus/penalty)
clauses are attached to the project
milestones, but they can be assigned to
any task. The clauses specify a bonus or
penalty, depending on whether the task
is completed before or after a specific
deadline. In RiBA they are expressed as
non-linear functions, as the example in
shows. Here, the horizontal axis
represents the task completion time (in
days), and the vertical axis the financial
impact (in kUSD). Completing the task
3
2
100 days after the project used in this
example has started carries neither a
bonus nor a penalty. An early finish
results in a bonus as specified by the
bonus slope (0.25 kUSD/day), but a time
overrun carries a penalty that increases
up to the 120 days mark and then levels
off. The maximum penalty of 35 kUSD is
attached to completion after 145 days or
later.
When computing the duration of a
task, its bonus/penalty (if specified) is
evaluated by interpolating between the
corner points. The bonuses/penalties of
the individual tasks are combined to
obtain the overall bonus/penalty for the
project.
Task-related costs are thus explicitly
modeled as a function of task complet-
ion or duration. This is unlike the
existing risk analysis software tools in
which costs are modeled as being
resource-dependent or simulated as
random variables correlated with tasks.
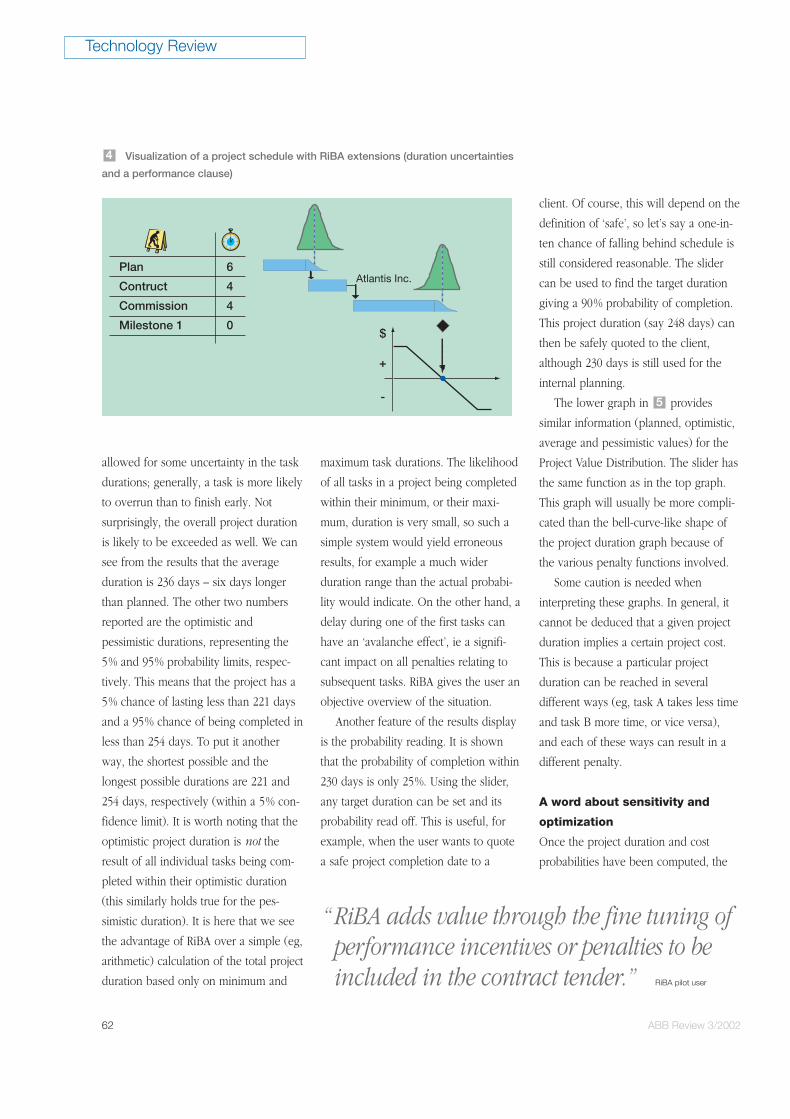
A typical RiBA schedule with duration
uncertainties and a performance function
is illustrated in .
Quality risks
A project may contain a number of
discrete events that could incur penal-
ties. For an unexpected transformer
failure, for example, the penalty might
be 50 kUSD. Such events come under
the umbrella of quality risks and are
represented in the model as tasks with
zero length, so they do not affect the
overall project duration. Their proba-
bility distribution is defined as a uniform
distribution between 0 and 1, and a
4
Technology Review
Modeling task duration uncertainty1
penalty function maps this distribution to
the specified penalty with a given
probability. For example, a penalty
function with a penalty of 50 kUSD
between 0 and 0.1 and no penalty
between 0.1 and 1 would, considering
the mentioned uniform distribution,
indicate a 10% chance of the failure
event taking place, and therefore of the
50 kUSD penalty being imposed.
Risk calculation –
‘gut feeling’ with a quantitative
touch
Once the model is set up, risk analyses
can be run. The Monte Carlo method is
used for the simulations (see side-bar on
page 59). This involves computing a
large number of iterations, each one
representing a plausible set of task
durations and quality risks drawn from
their specified distributions. Overall
project duration and cost are computed
in each iteration.
The task duration distributions are
presented as probability density graphs
(histograms) of duration and value
distribution . In order to reduce the
number of iterations required to reach a
certain precision, the histograms are
smoothed with a kernel. (The effect of
statistical dispersion is, in fact, reduced
by convolving the histogram with a
kernel function. In this particular case a
normalized gaussian is used as the
smoothing kernel.) The most relevant
statistics (eg, pessimistic and optimistic
estimates) are reported as well.
To see how the results are interpret-
ed, let’s look at the Project Duration
5
Distribution graph in . The planned
project duration is 230 days, ie if all the
tasks are completed exactly as planned
(no sooner and no later) it would take
5 this long to complete the project. The
time of 230 days also concurs with the
total project duration reported by
Microsoft Project. However, we have
Shared subsupplier database with
performance profiles used in modeling
task duration uncertainty
(Inset: reliability profile)
2
90 100 110 120 130 140-5
0
5
10
15
20
25
30
35
A
B C
D
t
k$
Modeling performance clauses - bonus/penalty function 3
ABB Review 3/2002 61
62 ABB Review 3/2002
allowed for some uncertainty in the task
durations; generally, a task is more likely
to overrun than to finish early. Not
surprisingly, the overall project duration
is likely to be exceeded as well. We can
see from the results that the average
duration is 236 days – six days longer
than planned. The other two numbers
reported are the optimistic and
pessimistic durations, representing the
5% and 95% probability limits, respec-
tively. This means that the project has a
5% chance of lasting less than 221 days
and a 95% chance of being completed in
less than 254 days. To put it another
way, the shortest possible and the
longest possible durations are 221 and
254 days, respectively (within a 5% con-
fidence limit). It is worth noting that the
optimistic project duration is not the
result of all individual tasks being com-
pleted within their optimistic duration
(this similarly holds true for the pes-
simistic duration). It is here that we see
the advantage of RiBA over a simple (eg,
arithmetic) calculation of the total project
duration based only on minimum and
maximum task durations. The likelihood
of all tasks in a project being completed
within their minimum, or their maxi-
mum, duration is very small, so such a
simple system would yield erroneous
results, for example a much wider
duration range than the actual probabi-
lity would indicate. On the other hand, a
delay during one of the first tasks can
have an ‘avalanche effect’, ie a signifi-
cant impact on all penalties relating to
subsequent tasks. RiBA gives the user an
objective overview of the situation.
Another feature of the results display
is the probability reading. It is shown
that the probability of completion within
230 days is only 25%. Using the slider,
any target duration can be set and its
probability read off. This is useful, for
example, when the user wants to quote
a safe project completion date to a
client. Of course, this will depend on the
definition of ‘safe’, so let’s say a one-in-
ten chance of falling behind schedule is
still considered reasonable. The slider
can be used to find the target duration
giving a 90% probability of completion.
This project duration (say 248 days) can
then be safely quoted to the client,
although 230 days is still used for the
internal planning.
The lower graph in provides
similar information (planned, optimistic,
average and pessimistic values) for the
Project Value Distribution. The slider has
the same function as in the top graph.
This graph will usually be more compli-
cated than the bell-curve-like shape of
the project duration graph because of
the various penalty functions involved.
Some caution is needed when
interpreting these graphs. In general, it
cannot be deduced that a given project
duration implies a certain project cost.
This is because a particular project
duration can be reached in several
different ways (eg, task A takes less time
and task B more time, or vice versa),
and each of these ways can result in a
different penalty.
A word about sensitivity and
optimization
Once the project duration and cost
probabilities have been computed, the
5
Technology Review
Plan 6Atlantis Inc.
Contruct 4
Commission
0Milestone 1
4
$
+
-
Visualization of a project schedule with RiBA extensions (duration uncertainties
and a performance clause)
4
“RiBA adds value through the fine tuning ofperformance incentives or penalties to beincluded in the contract tender.” RiBA pilot user
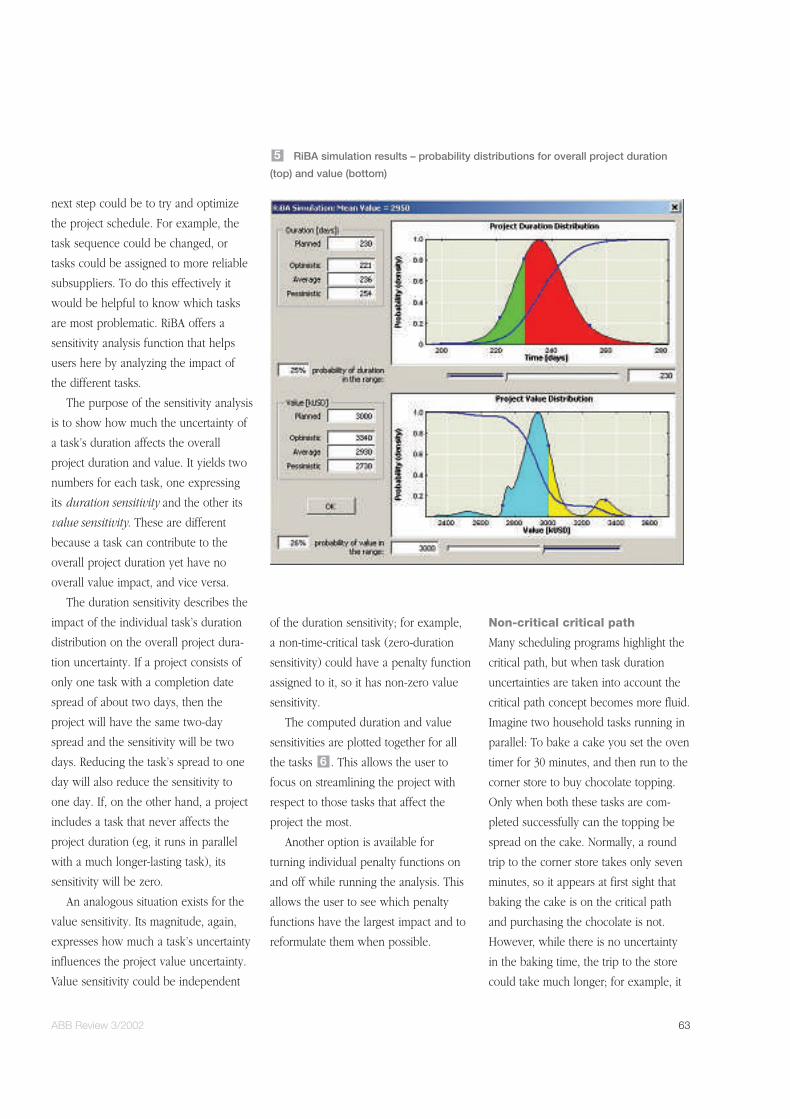
ABB Review 3/2002 63
next step could be to try and optimize
the project schedule. For example, the
task sequence could be changed, or
tasks could be assigned to more reliable
subsuppliers. To do this effectively it
would be helpful to know which tasks
are most problematic. RiBA offers a
sensitivity analysis function that helps
users here by analyzing the impact of
the different tasks.
The purpose of the sensitivity analysis
is to show how much the uncertainty of
a task’s duration affects the overall
project duration and value. It yields two
numbers for each task, one expressing
its duration sensitivity and the other its
value sensitivity. These are different
because a task can contribute to the
overall project duration yet have no
overall value impact, and vice versa.
The duration sensitivity describes the
impact of the individual task’s duration
distribution on the overall project dura-
tion uncertainty. If a project consists of
only one task with a completion date
spread of about two days, then the
project will have the same two-day
spread and the sensitivity will be two
days. Reducing the task’s spread to one
day will also reduce the sensitivity to
one day. If, on the other hand, a project
includes a task that never affects the
project duration (eg, it runs in parallel
with a much longer-lasting task), its
sensitivity will be zero.
An analogous situation exists for the
value sensitivity. Its magnitude, again,
expresses how much a task’s uncertainty
influences the project value uncertainty.
Value sensitivity could be independent
of the duration sensitivity; for example,
a non-time-critical task (zero-duration
sensitivity) could have a penalty function
assigned to it, so it has non-zero value
sensitivity.
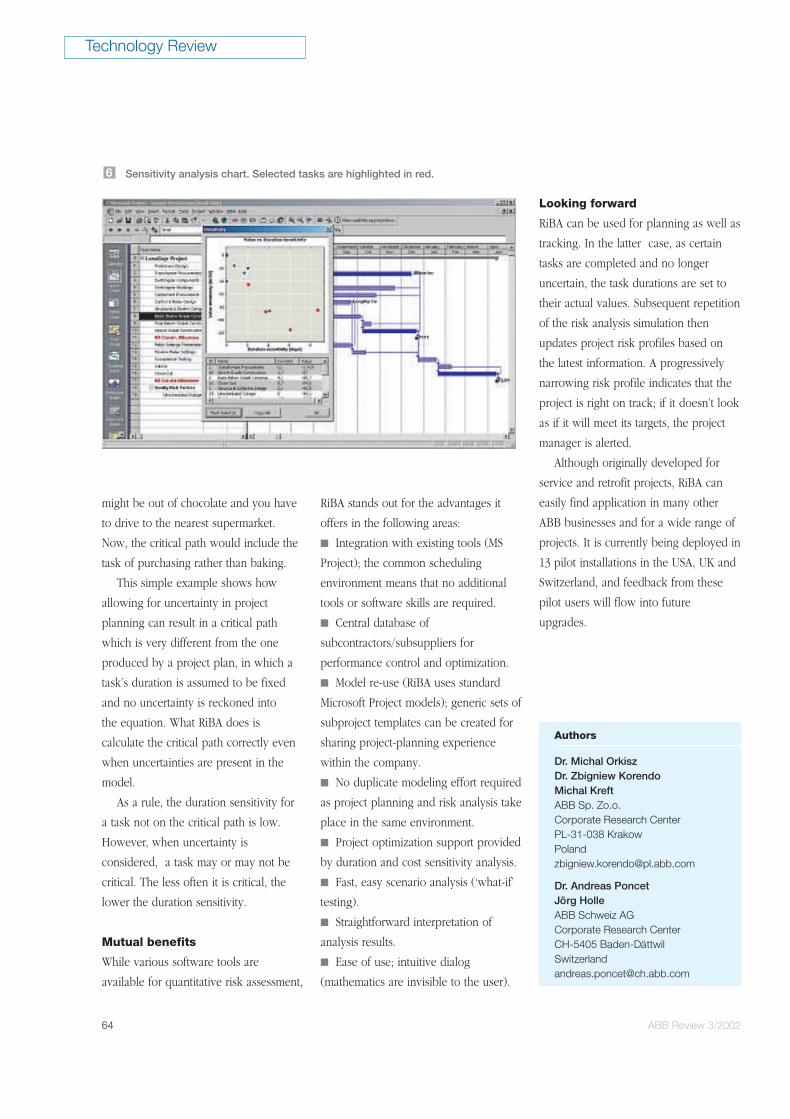
The computed duration and value
sensitivities are plotted together for all
the tasks . This allows the user to
focus on streamlining the project with
respect to those tasks that affect the
project the most.
Another option is available for
turning individual penalty functions on
and off while running the analysis. This
allows the user to see which penalty
functions have the largest impact and to
reformulate them when possible.
6
Non-critical critical path
Many scheduling programs highlight the
critical path, but when task duration
uncertainties are taken into account the
critical path concept becomes more fluid.
Imagine two household tasks running in
parallel: To bake a cake you set the oven
timer for 30 minutes, and then run to the
corner store to buy chocolate topping.
Only when both these tasks are com-
pleted successfully can the topping be
spread on the cake. Normally, a round
trip to the corner store takes only seven
minutes, so it appears at first sight that
baking the cake is on the critical path
and purchasing the chocolate is not.
However, while there is no uncertainty
in the baking time, the trip to the store
could take much longer; for example, it
RiBA simulation results – probability distributions for overall project duration
(top) and value (bottom)
5
64 ABB Review 3/2002
might be out of chocolate and you have
to drive to the nearest supermarket.
Now, the critical path would include the
task of purchasing rather than baking.
This simple example shows how
allowing for uncertainty in project
planning can result in a critical path
which is very different from the one
produced by a project plan, in which a
task’s duration is assumed to be fixed
and no uncertainty is reckoned into
the equation. What RiBA does is
calculate the critical path correctly even
when uncertainties are present in the
model.
As a rule, the duration sensitivity for
a task not on the critical path is low.
However, when uncertainty is
considered, a task may or may not be
critical. The less often it is critical, the
lower the duration sensitivity.
Mutual benefits
While various software tools are
available for quantitative risk assessment,
RiBA stands out for the advantages it
offers in the following areas:
n Integration with existing tools (MS
Project); the common scheduling
environment means that no additional
tools or software skills are required.
n Central database of
subcontractors/subsuppliers for
performance control and optimization.
n Model re-use (RiBA uses standard
Microsoft Project models); generic sets of
subproject templates can be created for
sharing project-planning experience
within the company.
n No duplicate modeling effort required
as project planning and risk analysis take
place in the same environment.
n Project optimization support provided
by duration and cost sensitivity analysis.
n Fast, easy scenario analysis (‘what-if’
testing).
n Straightforward interpretation of
analysis results.
n Ease of use; intuitive dialog
(mathematics are invisible to the user).
Looking forward
RiBA can be used for planning as well as
tracking. In the latter case, as certain
tasks are completed and no longer
uncertain, the task durations are set to
their actual values. Subsequent repetition
of the risk analysis simulation then
updates project risk profiles based on
the latest information. A progressively
narrowing risk profile indicates that the
project is right on track; if it doesn’t look
as if it will meet its targets, the project
manager is alerted.
Although originally developed for
service and retrofit projects, RiBA can
easily find application in many other
ABB businesses and for a wide range of
projects. It is currently being deployed in
13 pilot installations in the USA, UK and
Switzerland, and feedback from these
pilot users will flow into future
upgrades.
Technology Review
Authors
Dr. Michal OrkiszDr. Zbigniew KorendoMichal KreftABB Sp. Zo.o.Corporate Research CenterPL-31-038 [email protected]
Dr. Andreas PoncetJörg Holle ABB Schweiz AGCorporate Research CenterCH-5405 Baden-Dä[email protected]
Sensitivity analysis chart. Selected tasks are highlighted in red. 6


![[11] ABB Review 3_2008](https://img.pdfslide.net/doc/110x75/5527a726550346c3358b4854/11-abb-review-32008.jpg)