Embed Size (px)
Citation preview
Department of Trade and Industry
Technology Study on Consumer Energy Devices
Tender Ref # DTI/RSP/RMU 10/12-13
Confidential to the Department of Trade and Industry
2
This document contains
1. The project’s Inception Report
2. The findings from Stage 1: International Best Practice Analysis
3. The findings from Stage 2: International EE Technology Scan
4. The findings from Stage 3: Local Manufacturing Capability Scan
5. The findings from Stage 4: Local Manufacturing Transition Analysis
6. The findings from Stage 5: Recommendations and Implementation Assistance
7. Addendum
TABLE OF CONTENTS
Inception Report ................................................................................................................................................... 4
1.1 Project Introduction ............................................................................................................................. 5
1.2 Project Objectives ................................................................................................................................ 5
1.3 Project Scope........................................................................................................................................ 6
1.4 Sources of the Literary Review ............................................................................................................. 6
1.5 High Level Project Approach to Project Analysis ................................................................................. 7
1.6 Detailed Methodology of the Primary Data Collection ........................................................................ 8
1.7 Project Methodology and Associated Outcomes / Deliverables ......................................................... 8
1.8 Timelines and Milestones .................................................................................................................. 12
1.9 Project Team ...................................................................................................................................... 19
1.10 Project Schedule- Introduction .......................................................................................................... 19
Executive Summary ............................................................................................................................................. 27
Stage 1 ............................................................................................................................................................ 27
Stage 2 ............................................................................................................................................................ 28
Stage 3 ............................................................................................................................................................ 28
Stage 4 ............................................................................................................................................................ 30
Stage 5 ............................................................................................................................................................ 30
Stage 1: International Best Practice Analysis ...................................................................................................... 32
Stage 2: International EE Technology Scan ......................................................................................................... 61

Confidential to the Department of Trade and Industry
3
Stage 3: Local Manufacturing Capability Scan .................................................................................................... 71
Stage 4: Local Manufacturing Transition Analysis .............................................................................................. 92
Stage 5: Recommendations & Implementation Assistance .............................................................................. 125
References ........................................................................................................................................................ 152
Addendum ........................................................................................................................................................ 154
Confidential to the Department of Trade and Industry
4
Inception Report Inception Report
Technology Study on Consumer Energy Devices
Tender Ref # DTI/RSP/RMU 10/12-13
7 September, 2012
Confidential to the Department of Trade and Industry
5
1.1 Project Introduction The Department of Trade and Industry (DTI) is a government institution tasked with expanding the economic activity within South Africa through economic empowerment, SMME development, industrial development, trade – export and investment, financial assistance and legislation through one of the many DTI agencies.
In order to meet these objectives, the DTI is continuously seeking to identify and support opportunities for local firms in order to stimulate economic activity through sustainable development and help in creating jobs.
Globally there is increased awareness of the need to become and remain sustainable. One area where there is considerable time and resources being deployed is in the development of more efficient products that can perform the same functions (or even more) than standard products – but use less energy to do so.
Since it has become generally accepted that our fossil energy resources is finite, various countries and companies have been exploring ways to do more with the same resources – and hence the strong emphasis on energy efficiency.
South Africa is no different – and with an ever looming electricity crisis as well as increasing electricity prices the demand for more efficient technologies at an affordable price is driving manufacturers to investigate and develop more efficient product.
Frost & Sullivan has a wealth of experience in supporting its clients in the development and implementation of policy to support the development of new industries – or improve existing industries, and our analyst teams in Africa are extremely well positioned to support the DTI on this initiative.
This inception report outlines the scope, approach, deliverables and timeframe that we feel closely meets the stated requirements of the DTI.
1.2 Project Objectives The overall objectives of this project are as follows:
To identify global and local technological trends of new energy saving technologies that will be competitive and influence the future development in South African firms, as well as
To gather related data for effective policy and strategy formulation and implementation.
The specific objectives (which should be read in the context of the main objectives as per the Terms of Reference) of this project are as follows:
1. Identification and evaluation of the current international and national conventional consumer Energy Saving technologies.
2. Energy efficiency comparison between current consumer energy devices and new technological energy devices.
3. An assessment of the technological competency and capability levels of South African firms (public and private) in order to develop and locally manufacture these identified products.
4. Identify international and technology support strategies, practices and incentives in relation to energy savings technologies.
5. Identify the impact of introducing Energy Saving Devices on the local industrial development as well as the general impact on socio-economic environmental conditions.

Confidential to the Department of Trade and Industry
6
6. Assessment of possible co-development and manufacturing capabilities of such new products with the foreign OEM’s.
1.3 Project Scope
Geographic Scope: The project will focus on global energy efficient manufactured goods and opportunities. The focus will subsequently be on how to facilitate the same in South Africa
Product Scope
The project will focus on a variety of manufactured products including:
Accumulators with charging equipment, Energy saving lamps, Photo voltaic devices, Household applications (geysers, heating/cooling apparatus, fridges, washing machines etc.), Pumps, HVAC, Fans, Compressors, Other devices as uncovered by the research,
The above list of manufactured products could be expanded as more information become available
Application Scope
The application scope of this project is on the manufacturing of energy efficient products – and specifically identifying the possibility of transferring IP and patents for manufacturing in South Africa
1.4 Sources of the Literary Review
Frost & Sullivan will make use of various sources (international and national) during the completion of this study. The initial literature review list below is for illustrative purposes and is not exhaustive. The list of secondary sources will further populated throughout the course of the project based on the input of the DTI and other industry stakeholders:
www.frost.com – Frost & Sullivan’s proprietary database on global market, technical, and economic research with 2000+ new reports published per year
Various national government publications, for example: StatsSA, Department of Energy websites, Industrial Development Corporation, The IRP2010 document as a guide for national energy efficiency planning, South Africa's National Energy Efficiency Agency SANEDI, Technology Innovation Agency
Various international government publications, for example: o World Bank, UNIDO, African Development Bank, International Energy Agency, OECD
Academic papers from leading South African Universities, e.g.
South
Africa
Confidential to the Department of Trade and Industry
7
o University of Cape Town’s Energy Research Centre (http://www.erc.uct.ac.za/)
Business Industry and Trade websites, such as: o 25degrees (www.25degrees.net), Engineering News (www.engineeringnews.co.za)
Case studies and white papers published by interested stakeholders, such as: o Power utilities, End Users, Trade Associations
Market Insights from manufacturers’ desk
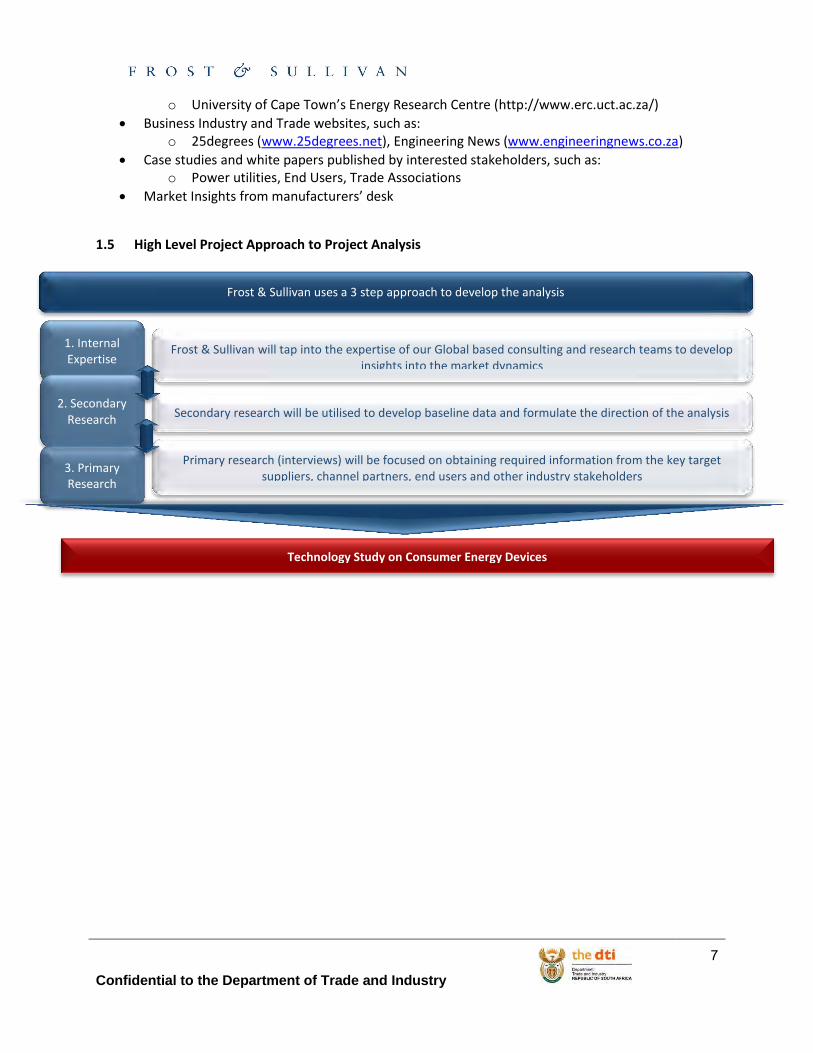
1.5 High Level Project Approach to Project Analysis
Frost & Sullivan uses a 3 step approach to develop the analysis
3. Primary Research
Primary research (interviews) will be focused on obtaining required information from the key target suppliers, channel partners, end users and other industry stakeholders
1. Internal Expertise
Frost & Sullivan will tap into the expertise of our Global based consulting and research teams to develop insights into the market dynamics
2. Secondary Research
Secondary research will be utilised to develop baseline data and formulate the direction of the analysis
Technology Study on Consumer Energy Devices
Confidential to the Department of Trade and Industry
8
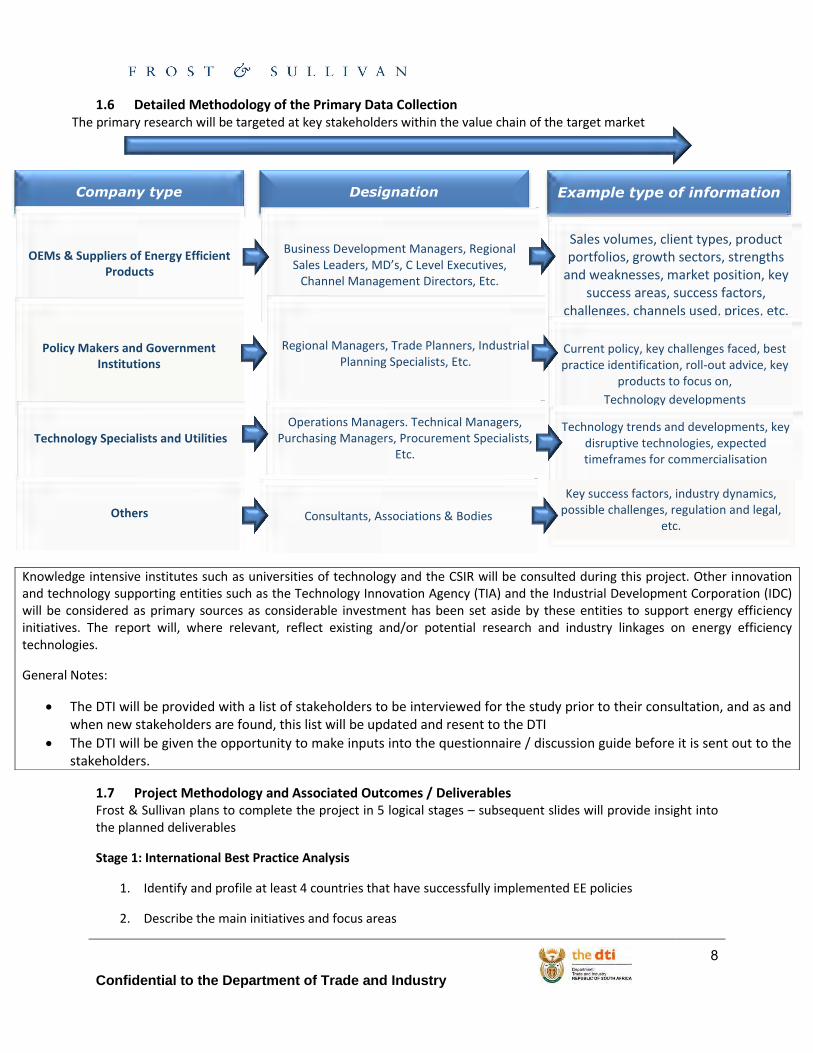
1.6 Detailed Methodology of the Primary Data Collection The primary research will be targeted at key stakeholders within the value chain of the target market
1.7 Project Methodology and Associated Outcomes / Deliverables Frost & Sullivan plans to complete the project in 5 logical stages – subsequent slides will provide insight into the planned deliverables
Stage 1: International Best Practice Analysis
1. Identify and profile at least 4 countries that have successfully implemented EE policies
2. Describe the main initiatives and focus areas
Knowledge intensive institutes such as universities of technology and the CSIR will be consulted during this project. Other innovation and technology supporting entities such as the Technology Innovation Agency (TIA) and the Industrial Development Corporation (IDC) will be considered as primary sources as considerable investment has been set aside by these entities to support energy efficiency initiatives. The report will, where relevant, reflect existing and/or potential research and industry linkages on energy efficiency technologies.
General Notes:
The DTI will be provided with a list of stakeholders to be interviewed for the study prior to their consultation, and as and when new stakeholders are found, this list will be updated and resent to the DTI
The DTI will be given the opportunity to make inputs into the questionnaire / discussion guide before it is sent out to the stakeholders.
Company type Designation Example type of information
OEMs & Suppliers of Energy Efficient Products
Business Development Managers, Regional Sales Leaders, MD’s, C Level Executives,
Channel Management Directors, Etc.
Sales volumes, client types, product portfolios, growth sectors, strengths
and weaknesses, market position, key success areas, success factors,
challenges, channels used, prices, etc.
Policy Makers and Government Institutions
Regional Managers, Trade Planners, Industrial Planning Specialists, Etc.
Current policy, key challenges faced, best practice identification, roll-out advice, key
products to focus on, Technology developments
Others Consultants, Associations & Bodies
Key success factors, industry dynamics, possible challenges, regulation and legal,
etc.
Technology Specialists and Utilities Operations Managers. Technical Managers,
Purchasing Managers, Procurement Specialists, Etc.
Technology trends and developments, key disruptive technologies, expected timeframes for commercialisation
Confidential to the Department of Trade and Industry
9
3. Describe the main challenges faced and how they were overcome (from a policy perspective)
4. Describe the impact on local manufacturing
Component Outcomes: Provide the DTI with base information on the best practice and policy drivers for Energy Efficient Technology
Profile at least 4 countries that have successfully rolled out EE programmes (specific countries to be confirmed through discussion between Frost & Sullivan and the DTI)
Highlight specific policy drivers that created the success
Identify the main products to be focused on
Quantify the energy savings
Describe the main challenges faced during roll out and the successful actions taken
Describe the impact on local manufacturers and describe the main changes equipment suppliers had to make
Quantify the benefit to the economy
Determine the new jobs created as a result of roll out
Describe key supporting mechanism used to help manufacturers convert from old to new technologies
Describe the level of import versus locally manufactured goods
Stage 2: International EE Technology Scan
1. Identify main EE technologies (categorise by application) currently marketed globally
2. Identify the main manufacturing locations and manufacturers (OEM’s)
3. Determine the level of manufacturing sophistication required
4. Compare various technologies and provide technology road maps for newer technologies
Component Outcome: Provide the DTI with a clear view on where various EE products are manufactured
Do an international technology scan to identify the main manufacturers of EE goods
Identify the main product categories where significant energy savings can be made
Compare the EE products to standard products available
Profile the main suppliers (global footprint, manufacturing capability, types of technologies focussed on, IP rights, patents held etc.)
Determine the level of automation used as well as the number of jobs created per company
Confidential to the Department of Trade and Industry
10
Determine the level of manufacturing sophistication required
Compare various technologies and provide technology road maps for newer technologies
Stage 3: Local Manufacturing Capability Scan
1. Describe the current landscape in South Africa for the technologies as per stage 2
2. Identify suitable manufacturers that could manufacture related EE technologies
3. Identify where the patent or IP for each product is located
4. Determine the level of support needed by local manufacturers to produce more EE technologies
5. Describe the technical and technological readiness within the South African manufacturing environment
Component Outcome: Provide the DTI with intelligence on the local manufacturing capability for EE products
Identify the level of technical and competency capability of firms in South Africa (specifically looking at the main products identified in stage 2 of the analysis)
Profile the main manufacturers in South Africa currently supplying related products
Determine if South Africa has any world leading EE manufacturing capability and profile industry leaders
Determine and describe the IP and patents South African manufacturers hold
Quantify the level of support needed for local manufacturers to produce more energy efficient products
Describe the manufacturing maturity in South Africa to produce EE products
Determine the level of skills gap for companies to manufacture energy efficient goods
Provide insight on the direction of the South African manufacturing industry
Stage 4: Local Manufacturing Transition Analysis
1. Identify specific technologies that can be developed locally
2. Describe the level of support needed to convert to newer technologies
3. Engage with patent holders to determine their willingness to invest in SA
4. Determine the local appetite to manufacture more EE products
5. Identify potential companies who require minimal support to transit to EE manufactured goods
Component Outcome: Provide the DTI with clear direction on the key manufacturers in South Africa who want to manufacture EE products
Confidential to the Department of Trade and Industry
11
Based on the work completed in stages 2 and 3 Frost & Sullivan will perform a GAP analysis to determine how South African manufacturing companies can move to producing more competitive energy efficient goods
Describe the steps that needs to be taken to take specific product manufacturers to EE product manufacturing leadership
Based on the work done in Stage 2 – identify specific products where patents could be bought and localised in South Africa
Further identify potential investors in South Africa and quantify the level of support global manufacturers would need to invest in local manufacturing capability
Determine the apatite of local manufacturers to become more EE product focussed
Determine the potential price impact on their current product range and how that would impact their overall competitiveness
Quantify the potential jobs created / lost through EE product manufacturing capability
Stage 5: Recommendations & Implementation Assistance
1. Identify the most appropriate technologies for the local market
2. Provide a road-map for the development of each relevant technology
3. Determine the impact to other local manufacturers (top level analysis
4. Provide DTI with concrete recommendations as to the technologies to promote
5. Identify the main manufacturers that could benefit from DTI support
6. Identify key patent holders interested in roll-out in South Africa
7. Provide the DTI with a high level technology commercialisation analysis enabling the energy efficiency technologies to be moved from the research phase into the market phase.
8. Industry multiplier effects and beneficiation options of the targeted industries will be examined, as well as indicating benefits and demand from industries outside the core industry on a best effort basis.
Component Outcome: Provide the DTI with clear recommendations to have the highest impact on local EE manufacturing at the least cost
Make clear recommendations on the most appropriate products to focus on from a South African context
Provide short, medium and long term goals for the DTI and industry
Provide insight into the overall competitiveness if companies were to engage in more EE product manufacturing
Provide insight into specific manufacturers in South Africa that could benefit from DTI support (either technical or financial)

Confidential to the Department of Trade and Industry
12
Link potential international patent holders with related manufacturers in South Africa
Provide a road map and high level scenario analysis for the establishment of a sustainable EE product manufacturing industry in South Africa
Determine specific policy support mechanisms the DTI should develop to support manufacturing expansion in SA
Provide specific insight into the level of support needed within each selected industry where SA could benefit for expanded EE product manufacturing
Note: The above structure is illustrative. As the project unfolds, amendments to this structure may be appropriate and agreed with the DTI through the scheduled project update sessions
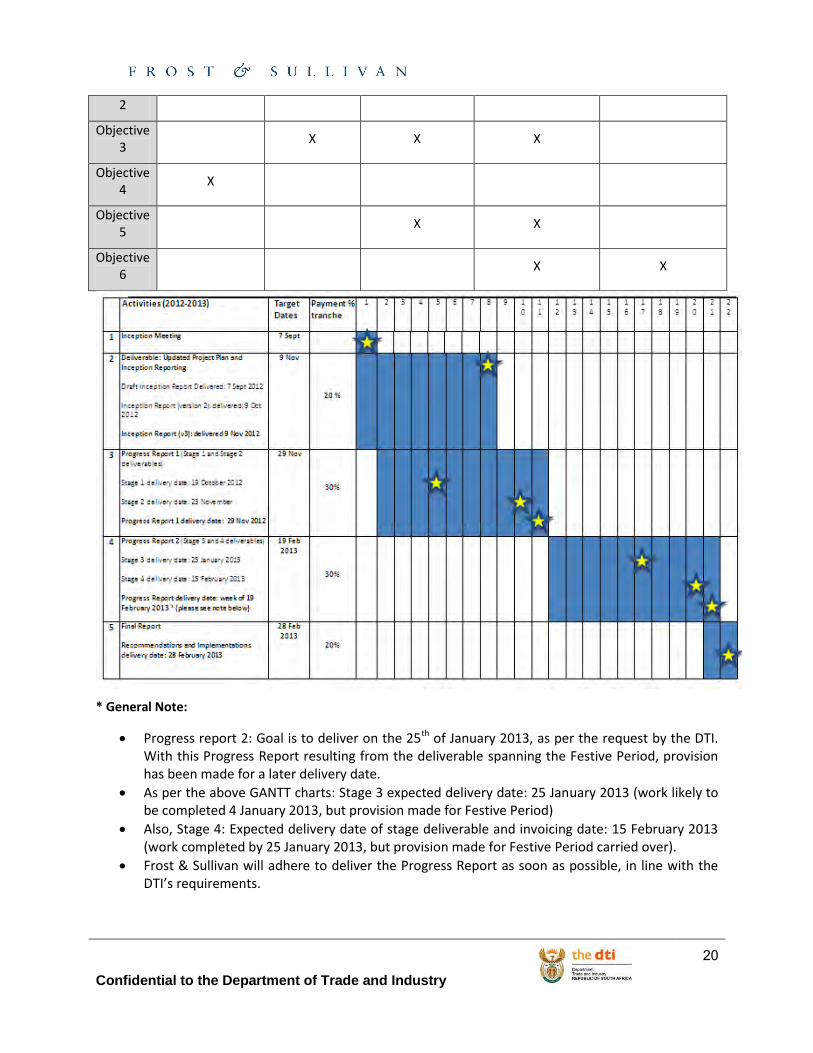
1.8 Timelines and Milestones Below are proposed timelines and milestones for the project. Due to the international component of this project, and the fact that a great deal of data points are dependent on input from overseas stakeholders, the project might experience slight delays. This will however not affect the total cost of the project to the DTI. Frost & Sullivan will keep the DTI updated on all relevant project challenges as and when experienced.
Component Name
Delivery Date Invoice Date Percentage of Project Value
Inception Report / Project Plan
Draft Inception Report Delivered: 7 September 2012
Inception Report (version 2): delivered: 9 October 2012
Inception Report (version 3): delivered 9 November 2012
15 November 2012
20%
Progress Report (Stage 1 and Stage 2 deliverables)
Stage 1 delivery date: 19 October 2012
Stage 2 delivery date: 23 November
Progress Report 1 delivery date: 29 November 2012
29 November 2012
30%
Progress Report 2 (Stage 3 and 4 deliverables)
Stage 3 delivery date: 25 January 2013
Stage 4 delivery date: 15 February 2013
Progress Report delivery date: week of 18-22 February 2013
19 February 2012
30%
Final Report Recommendations and Implementations delivery date: 28 February 2013
28 February 2013
20%
Summary of the project deliverable timeline and GANTT chart outcomes:
Confidential to the Department of Trade and Industry
13
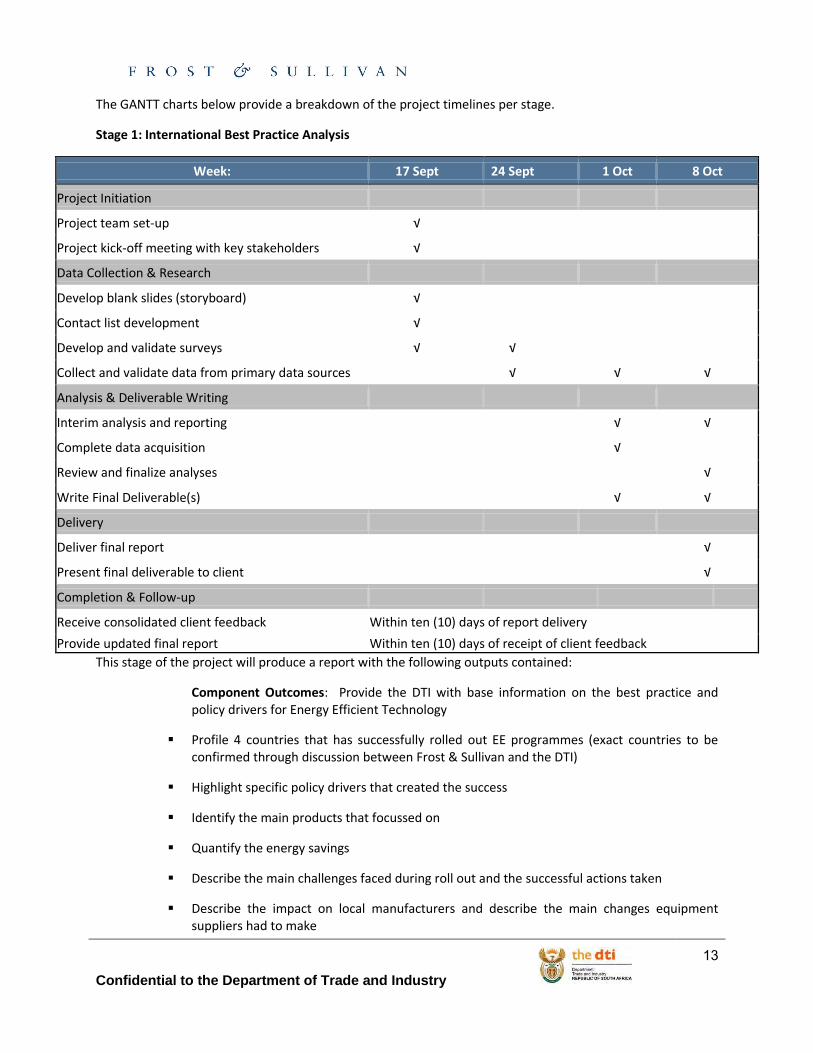
The GANTT charts below provide a breakdown of the project timelines per stage.
Stage 1: International Best Practice Analysis
Week: 17 Sept 24 Sept 1 Oct 8 Oct
Project Initiation
Project team set-up √
Project kick-off meeting with key stakeholders √
Data Collection & Research
Develop blank slides (storyboard) √
Contact list development √
Develop and validate surveys √ √
Collect and validate data from primary data sources
√ √ √
Analysis & Deliverable Writing
Interim analysis and reporting
√ √
Complete data acquisition
√
Review and finalize analyses
√
Write Final Deliverable(s)
√ √
Delivery
Deliver final report
√
Present final deliverable to client
√
Completion & Follow-up
Receive consolidated client feedback Within ten (10) days of report delivery
Provide updated final report Within ten (10) days of receipt of client feedback
This stage of the project will produce a report with the following outputs contained:
Component Outcomes: Provide the DTI with base information on the best practice and policy drivers for Energy Efficient Technology
Profile 4 countries that has successfully rolled out EE programmes (exact countries to be confirmed through discussion between Frost & Sullivan and the DTI)
Highlight specific policy drivers that created the success
Identify the main products that focussed on
Quantify the energy savings
Describe the main challenges faced during roll out and the successful actions taken
Describe the impact on local manufacturers and describe the main changes equipment suppliers had to make
Confidential to the Department of Trade and Industry
14
Quantify the benefit to the economy
Determine the new jobs created as a result of roll out
Describe key supporting mechanism used to help manufacturers convert from old to new technologies
Describe the level of import versus locally manufactured goods
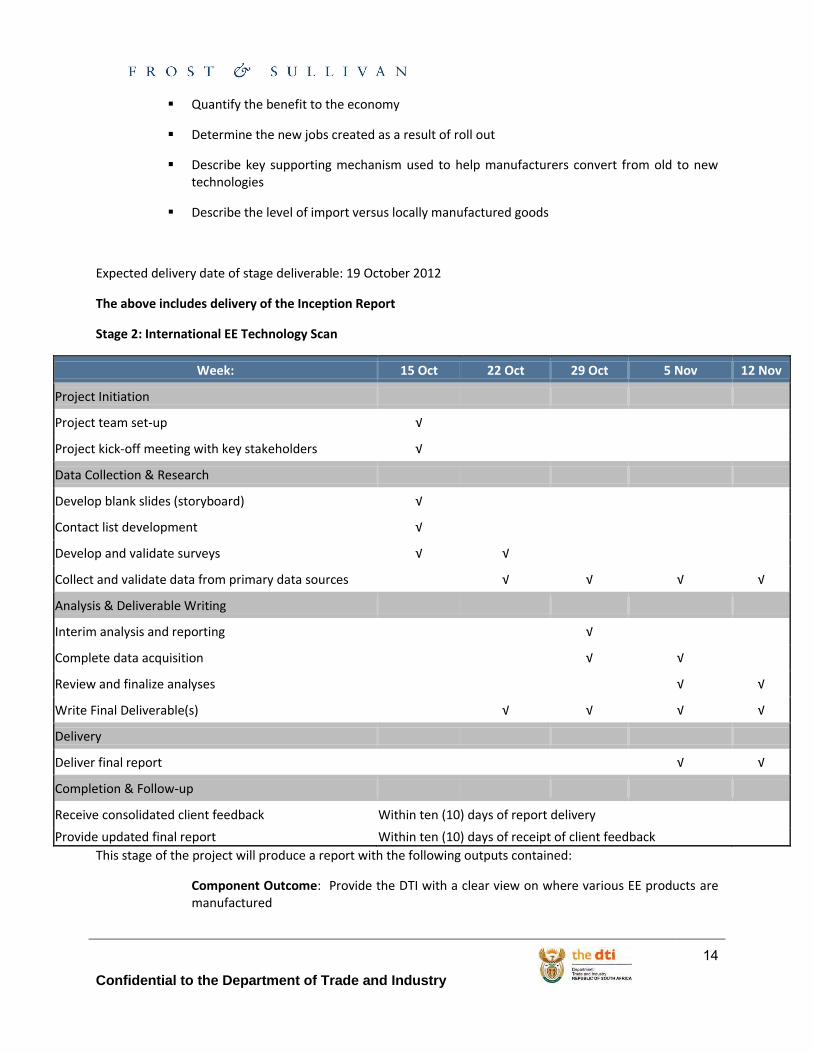
Expected delivery date of stage deliverable: 19 October 2012
The above includes delivery of the Inception Report
Stage 2: International EE Technology Scan
Week: 15 Oct 22 Oct 29 Oct 5 Nov 12 Nov
Project Initiation
Project team set-up √
Project kick-off meeting with key stakeholders √
Data Collection & Research
Develop blank slides (storyboard) √
Contact list development √
Develop and validate surveys √ √
Collect and validate data from primary data sources
√ √ √ √
Analysis & Deliverable Writing
Interim analysis and reporting
√
Complete data acquisition
√ √
Review and finalize analyses
√ √
Write Final Deliverable(s)
√ √ √ √
Delivery
Deliver final report
√ √
Completion & Follow-up
Receive consolidated client feedback Within ten (10) days of report delivery
Provide updated final report Within ten (10) days of receipt of client feedback
This stage of the project will produce a report with the following outputs contained:
Component Outcome: Provide the DTI with a clear view on where various EE products are manufactured
Confidential to the Department of Trade and Industry
15
Do an international technology scan to identify the main manufacturers of EE goods
Identify the main product categories where significant energy savings can be made
Compare the EE products to standard products available
Profile the main suppliers (global footprint, manufacturing capability, types of technologies focussed on, IP rights, patents held etc.)
Determine the level of automation used as well as the number of jobs created per company
Determine the level of manufacturing sophistication required
Compare various technologies and provide technology road maps for newer technologies
Expected delivery date of stage deliverable: 23 November 2012
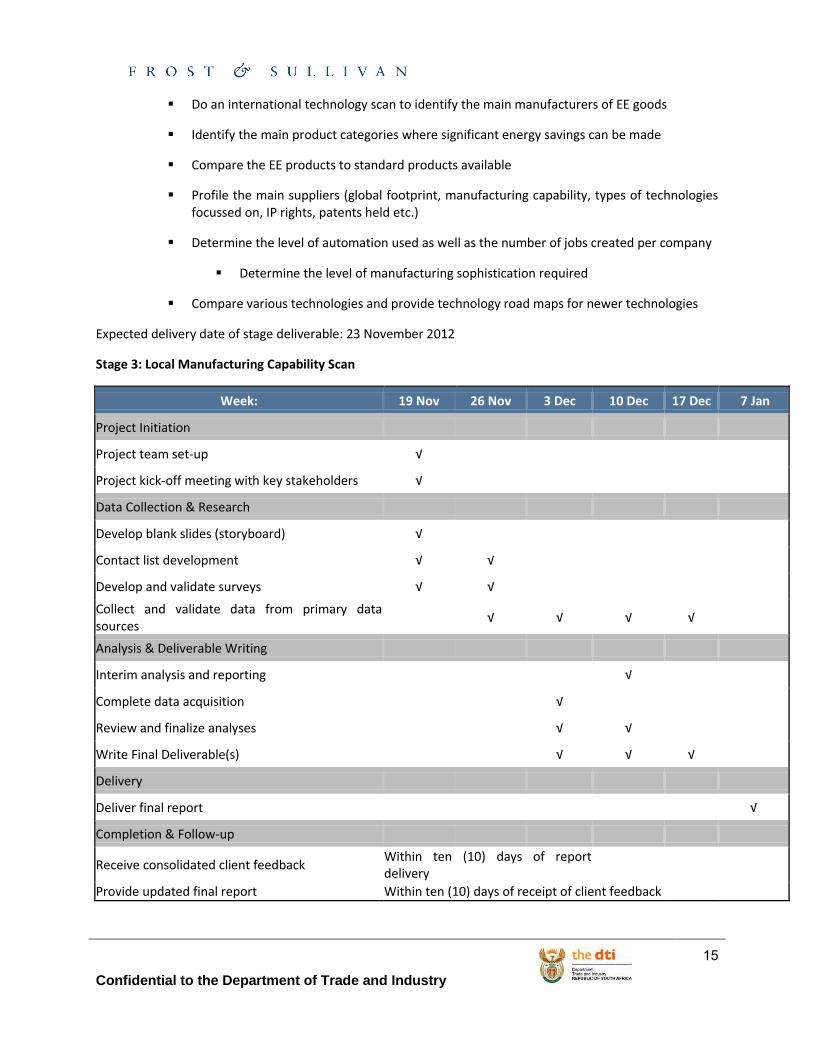
Stage 3: Local Manufacturing Capability Scan
Week: 19 Nov 26 Nov 3 Dec 10 Dec 17 Dec 7 Jan
Project Initiation
Project team set-up √
Project kick-off meeting with key stakeholders √
Data Collection & Research
Develop blank slides (storyboard) √
Contact list development √ √
Develop and validate surveys √ √
Collect and validate data from primary data sources
√ √ √ √
Analysis & Deliverable Writing
Interim analysis and reporting
√
Complete data acquisition
√
Review and finalize analyses
√ √
Write Final Deliverable(s)
√ √ √
Delivery
Deliver final report
√
Completion & Follow-up
Receive consolidated client feedback Within ten (10) days of report delivery
Provide updated final report Within ten (10) days of receipt of client feedback
Confidential to the Department of Trade and Industry
16
This stage of the project will produce a report with the following outputs contained:
Component Outcome: Provide the DTI with intelligence on the local manufacturing capability for EE products
Identify the level of technical and competency capability of firms in South Africa (specifically looking at the main products identified in stage 2 of the analysis)
Profile the main manufacturers in South Africa currently supplying related products
Determine if South Africa has any world leading EE manufacturing capability and profile industry leaders
Determine and describe the IP and patents South African manufacturers hold
Quantify the level of support needed for local manufacturers to produce more energy efficient products
Describe the manufacturing maturity in South Africa to produce EE products
Determine the level of skills gap for companies to manufacture energy efficient goods
Provide insight on the direction of the South African manufacturing industry
Expected delivery date of stage deliverable: 25 January 2013 (work likely to be completed 4 January 2013, but provision made for Festive Period)
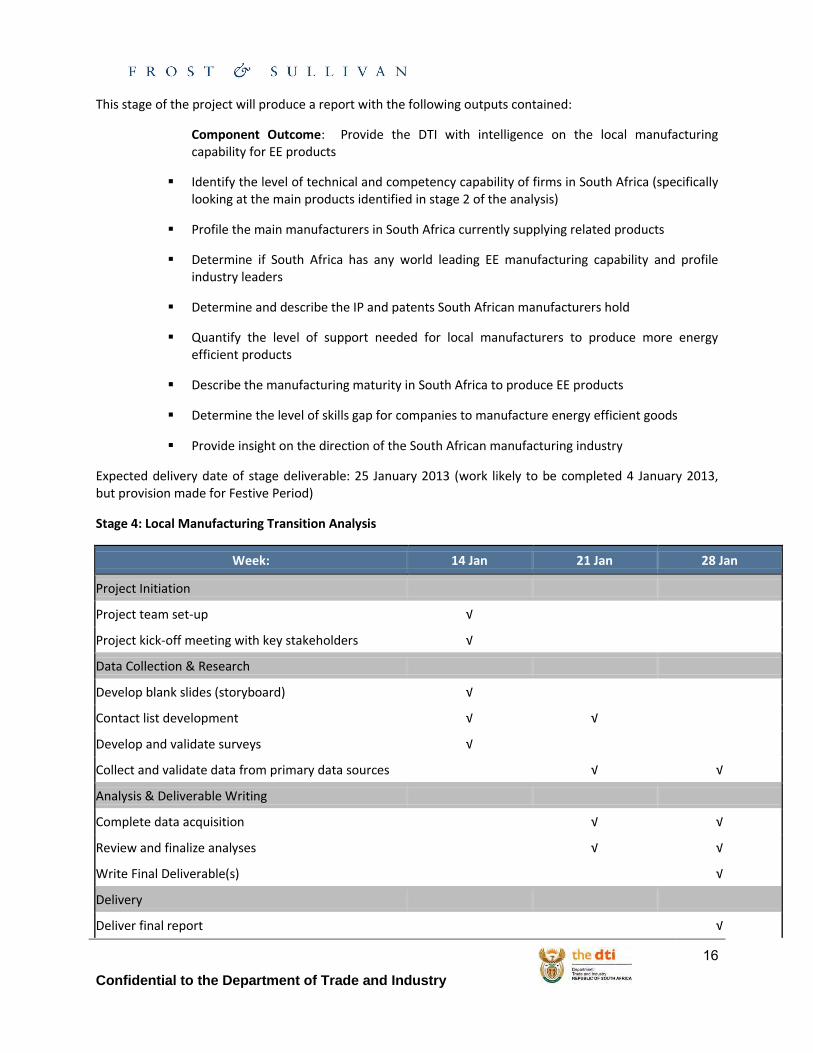
Stage 4: Local Manufacturing Transition Analysis
Week: 14 Jan 21 Jan 28 Jan
Project Initiation
Project team set-up √
Project kick-off meeting with key stakeholders √
Data Collection & Research
Develop blank slides (storyboard) √
Contact list development √ √
Develop and validate surveys √
Collect and validate data from primary data sources
√ √
Analysis & Deliverable Writing
Complete data acquisition
√ √
Review and finalize analyses
√ √
Write Final Deliverable(s)
√
Delivery
Deliver final report
√

Confidential to the Department of Trade and Industry
17
Completion & Follow-up
Receive consolidated client feedback Within ten (10) days of report delivery
Provide updated final report Within ten (10) days of receipt of client feedback
This stage of the project will produce a report with the following outputs contained:
Component Outcome: Provide the DTI with clear direction on the key manufacturers in South Africa who want to manufacture EE products
Based on the work completed in stages 2 and 3 Frost & Sullivan will perform a GAP analysis to determine how South African manufacturing companies can move to producing more competitive energy efficient goods
Describe the steps that needs to be taken to take specific product manufacturers to EE product manufacturing leadership
Based on the work done in Stage 2 – identify specific products where patents could be bought and localised in South Africa
Further identify potential investors in South Africa and quantify the level of support global manufacturers would need to invest in local manufacturing capability
Determine the apatite of local manufacturers to become more EE product focussed
Determine the potential price impact on their current product range and how that would impact their overall competitiveness
Quantify the potential jobs created / lost through EE product manufacturing capability
Expected delivery date of stage deliverable and invoicing date : 15 February 2013 (work completed by 25 January 2013, but provision made for Festive Period carried over).
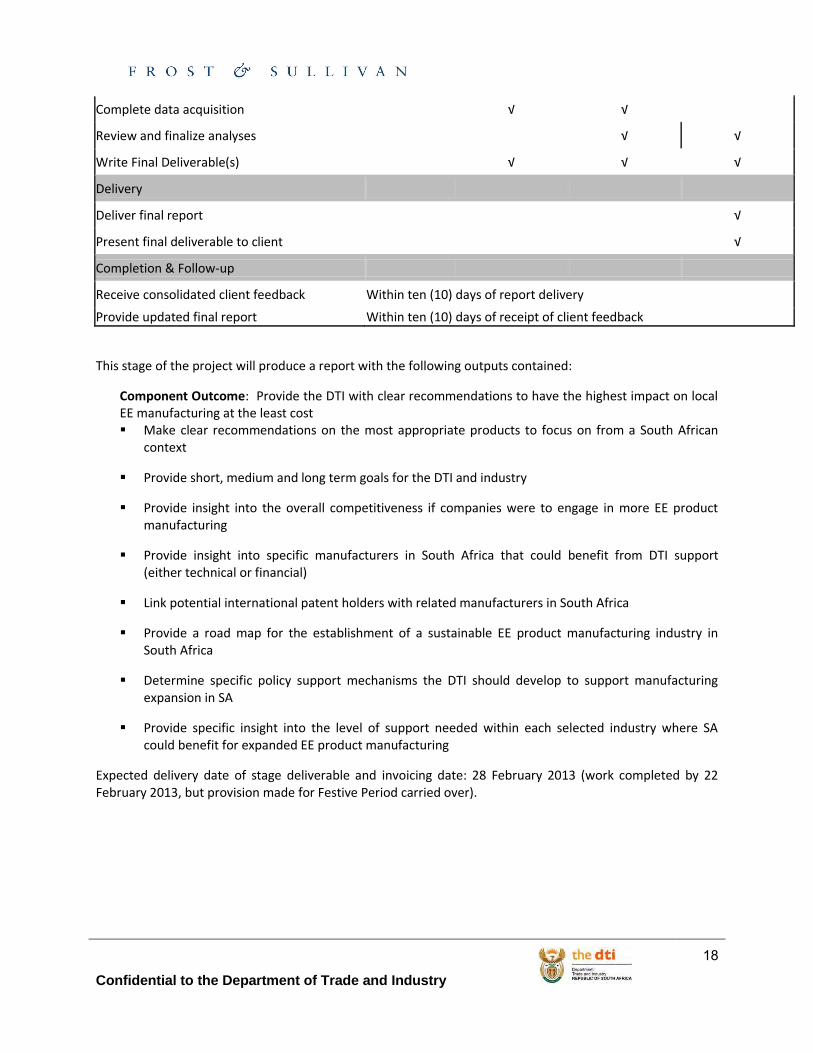
Stage 5: Recommendations & Implementation Assistance
Week: 4 Feb 11 Feb 18 Feb 25 Feb
Project Initiation
Project team set-up √
Project kick-off meeting with key stakeholders √
Data Collection & Research
Develop blank slides (storyboard) √
Contact list development √
Review Collected Data √ √
Analysis & Deliverable Writing
Interim analysis and reporting
√ √ √
Confidential to the Department of Trade and Industry
18
Complete data acquisition
√ √
Review and finalize analyses
√ √
Write Final Deliverable(s)
√ √ √
Delivery
Deliver final report
√
Present final deliverable to client
√
Completion & Follow-up
Receive consolidated client feedback Within ten (10) days of report delivery
Provide updated final report Within ten (10) days of receipt of client feedback
This stage of the project will produce a report with the following outputs contained:
Component Outcome: Provide the DTI with clear recommendations to have the highest impact on local EE manufacturing at the least cost Make clear recommendations on the most appropriate products to focus on from a South African
context
Provide short, medium and long term goals for the DTI and industry
Provide insight into the overall competitiveness if companies were to engage in more EE product manufacturing
Provide insight into specific manufacturers in South Africa that could benefit from DTI support (either technical or financial)
Link potential international patent holders with related manufacturers in South Africa
Provide a road map for the establishment of a sustainable EE product manufacturing industry in South Africa
Determine specific policy support mechanisms the DTI should develop to support manufacturing expansion in SA
Provide specific insight into the level of support needed within each selected industry where SA could benefit for expanded EE product manufacturing
Expected delivery date of stage deliverable and invoicing date: 28 February 2013 (work completed by 22 February 2013, but provision made for Festive Period carried over).
Confidential to the Department of Trade and Industry
19
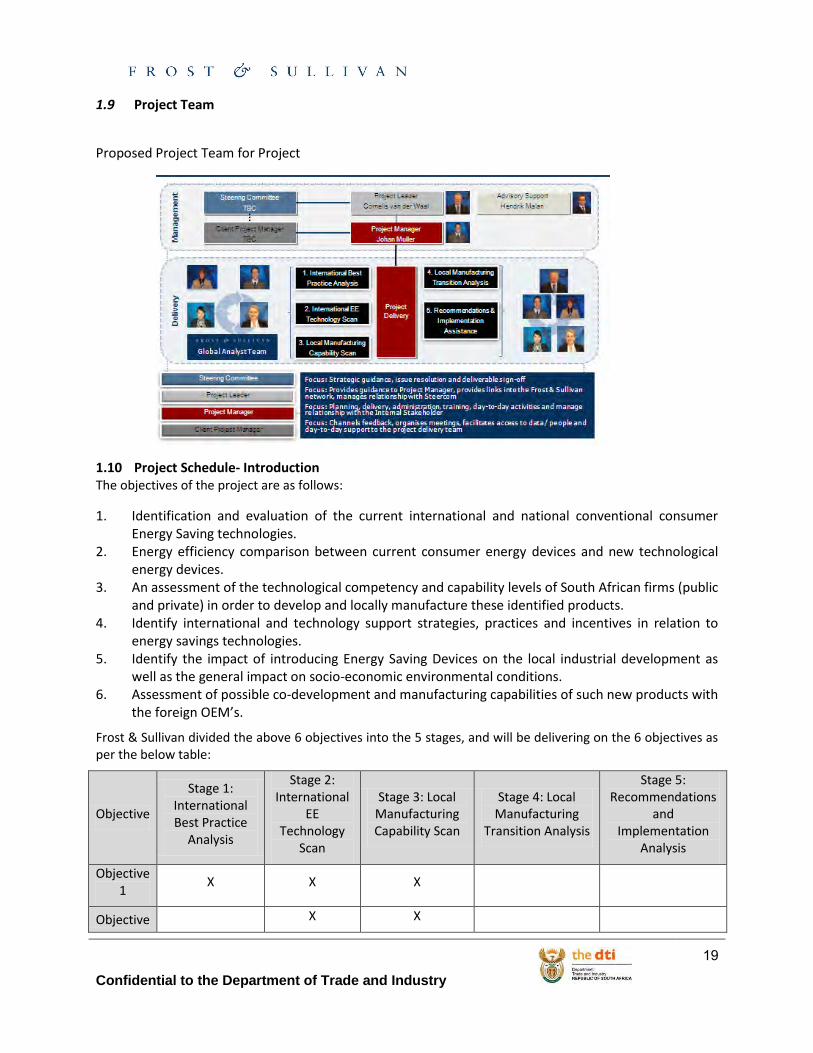
1.9 Project Team
Proposed Project Team for Project
1.10 Project Schedule- Introduction The objectives of the project are as follows:
1. Identification and evaluation of the current international and national conventional consumer Energy Saving technologies.
2. Energy efficiency comparison between current consumer energy devices and new technological energy devices.
3. An assessment of the technological competency and capability levels of South African firms (public and private) in order to develop and locally manufacture these identified products.
4. Identify international and technology support strategies, practices and incentives in relation to energy savings technologies.
5. Identify the impact of introducing Energy Saving Devices on the local industrial development as well as the general impact on socio-economic environmental conditions.
6. Assessment of possible co-development and manufacturing capabilities of such new products with the foreign OEM’s.
Frost & Sullivan divided the above 6 objectives into the 5 stages, and will be delivering on the 6 objectives as per the below table:
Objective
Stage 1: International Best Practice
Analysis
Stage 2: International
EE Technology
Scan
Stage 3: Local Manufacturing Capability Scan
Stage 4: Local Manufacturing
Transition Analysis
Stage 5: Recommendations
and Implementation
Analysis
Objective 1
X X X
Objective X X
Confidential to the Department of Trade and Industry
20
2
Objective 3
X X X
Objective 4
X
Objective 5
X X
Objective 6
X X
* General Note:
Progress report 2: Goal is to deliver on the 25th of January 2013, as per the request by the DTI. With this Progress Report resulting from the deliverable spanning the Festive Period, provision has been made for a later delivery date.
As per the above GANTT charts: Stage 3 expected delivery date: 25 January 2013 (work likely to be completed 4 January 2013, but provision made for Festive Period)
Also, Stage 4: Expected delivery date of stage deliverable and invoicing date: 15 February 2013 (work completed by 25 January 2013, but provision made for Festive Period carried over).
Frost & Sullivan will adhere to deliver the Progress Report as soon as possible, in line with the DTI’s requirements.
Confidential to the Department of Trade and Industry
21
Technology Study on Consumer Energy Devices
F r o s t & S u l l i v a n

Confidential to the Department of Trade and Industry
22
Abbreviations
AC – air conditioner
AD - accelerated depreciation for energy efficient equipment/investments
AIAC – Airedale International Air
ARRA - American Recovery and Reinvestment Act
CCFL – Cold Cathode Fluorescent Lights
CFL – Compact Fluorescent Lamp
CSIR – Council for Scientific and Industrial Research
DoE – Department of Energy
DSM – Demand Side Management
DST- Department of Science and Technology
DTI – Department of Trade and Industry
DVM - Digital Variable Multisystems
EA - energy audits
EE – energy efficiency
EIA – Energy Information Administration
EMEA – Europe, Middle East and Africa
EPA – United States Environmental Protection Agency
ESCO – energy service company
EWH – Efficient Water Heaters
FDI – Foreign Direct Investment
HP – Heat Pump
HVAC – heating, ventilation and air conditioning equipment
IDM- Integrated Demand Management
IEA - International Energy Association
IP – Intellectual Property
ITAC- International Trade Association Commission of South Africa
NRCS – National Regulator for Compulsory Specifications
NSWH – National Solar Water Heater
OEM – Original Equipment Manufacturer
OLED- Organic Light Emitting Diode
PC – Personal Computer
PCB – Printed Circuit Boards
PT - purchase tax
PV – Photovoltaic
QA- Quality Assurance
R&D – Research and Development
S - subsidies
SA- South Africa
SAARP – South African Audience Research Foundation
SABS – South African Bureau of Standards
SANS – South African National Standards
SL - soft loans
SPII – Support Program for Industry Innovation
SSL – solid-state lighting
Stats SA – Statistics South Africa
SWH – Solar Water Heaters
SWOT – Strengths, Weaknesses Opportunities, Threats
TC - tax credit or deduction
TIA – Technology Innovation Agency
TIAP - Tax Incentives Assistance Project
TOM – Target Operating Model
TRE - tax reduction for energy/CO2 efficient equipment/investments
TRT - tax reduction on energy tax in exchange of energy

Confidential to the Department of Trade and Industry
23
Ktoe – thousand tons of oil equivalent
kWh – kilowatt hours
LB - labelling
LCD – Liquid Cristal Display
LED – light emitting diode
LSM – Living Standards Measurements
MD- Managing Director
MEPS - minimum energy performance standards
MIP – Manufacturing Investment Programme
MTC – United States Advanced Energy Manufacturing Tax Credit
NERSA-National Energy Regulator of South Africa
efficient investment
TV – Television
UK – United Kingdom
UNFCC - United Nations Framework Convention on Climate Change
UPS – uninterrupted power supply
USA – United States of America
VSD- Variable Speed Drive
WTO - World Trade Organisation
Confidential to the Department of Trade and Industry
24
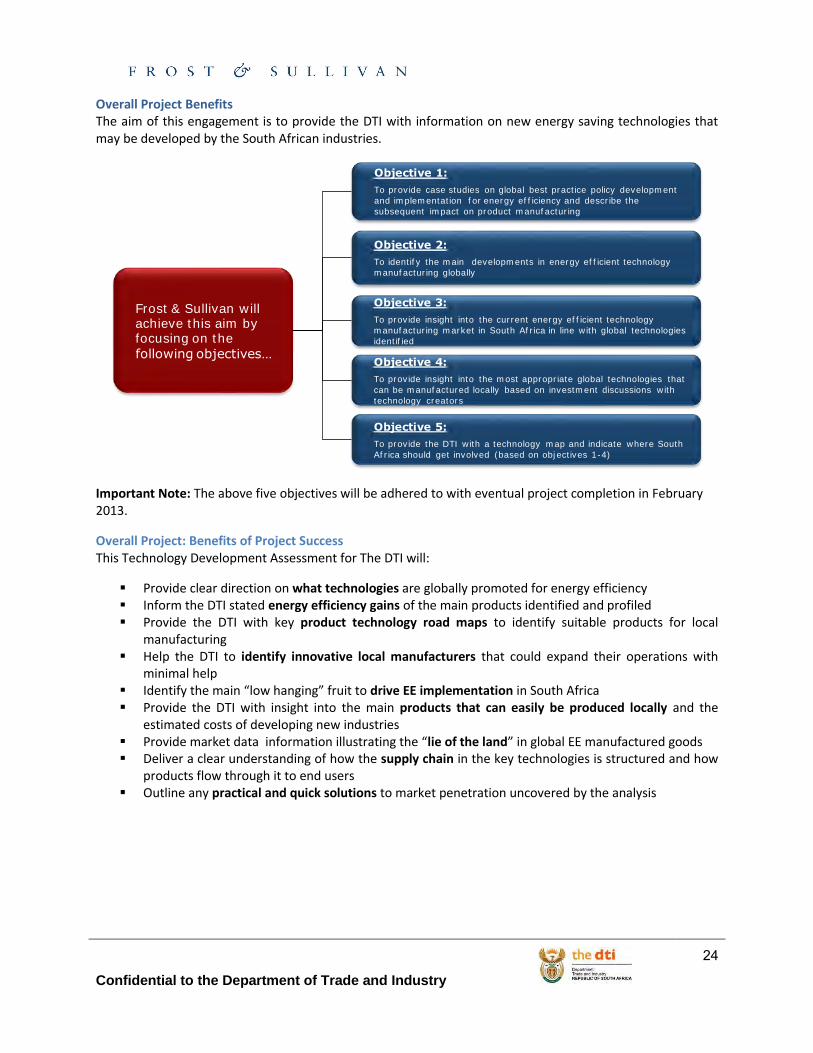
Overall Project Benefits The aim of this engagement is to provide the DTI with information on new energy saving technologies that may be developed by the South African industries.
Important Note: The above five objectives will be adhered to with eventual project completion in February 2013.
Overall Project: Benefits of Project Success This Technology Development Assessment for The DTI will:
Provide clear direction on what technologies are globally promoted for energy efficiency Inform the DTI stated energy efficiency gains of the main products identified and profiled Provide the DTI with key product technology road maps to identify suitable products for local
manufacturing Help the DTI to identify innovative local manufacturers that could expand their operations with
minimal help Identify the main “low hanging” fruit to drive EE implementation in South Africa Provide the DTI with insight into the main products that can easily be produced locally and the
estimated costs of developing new industries Provide market data information illustrating the “lie of the land” in global EE manufactured goods Deliver a clear understanding of how the supply chain in the key technologies is structured and how
products flow through it to end users Outline any practical and quick solutions to market penetration uncovered by the analysis
Frost & Sullivan will achieve this aim by focusing on the following objectives…
Objective 2:
To identify the main developments in energy eff icient technology
manufacturing globally
Objective 3:
To provide insight into the current energy eff icient technology
manufacturing market in South Africa in line with global technologies
identif ied
Objective 4:
To provide insight into the most appropriate global technologies that
can be manufactured locally based on investment discussions with
technology creators
Objective 1:
To provide case studies on global best practice policy development
and implementation for energy eff iciency and describe the
subsequent impact on product manufacturing
Objective 5:
To provide the DTI with a technology map and indicate where South
Africa should get involved (based on objectives 1-4)
Confidential to the Department of Trade and Industry
25
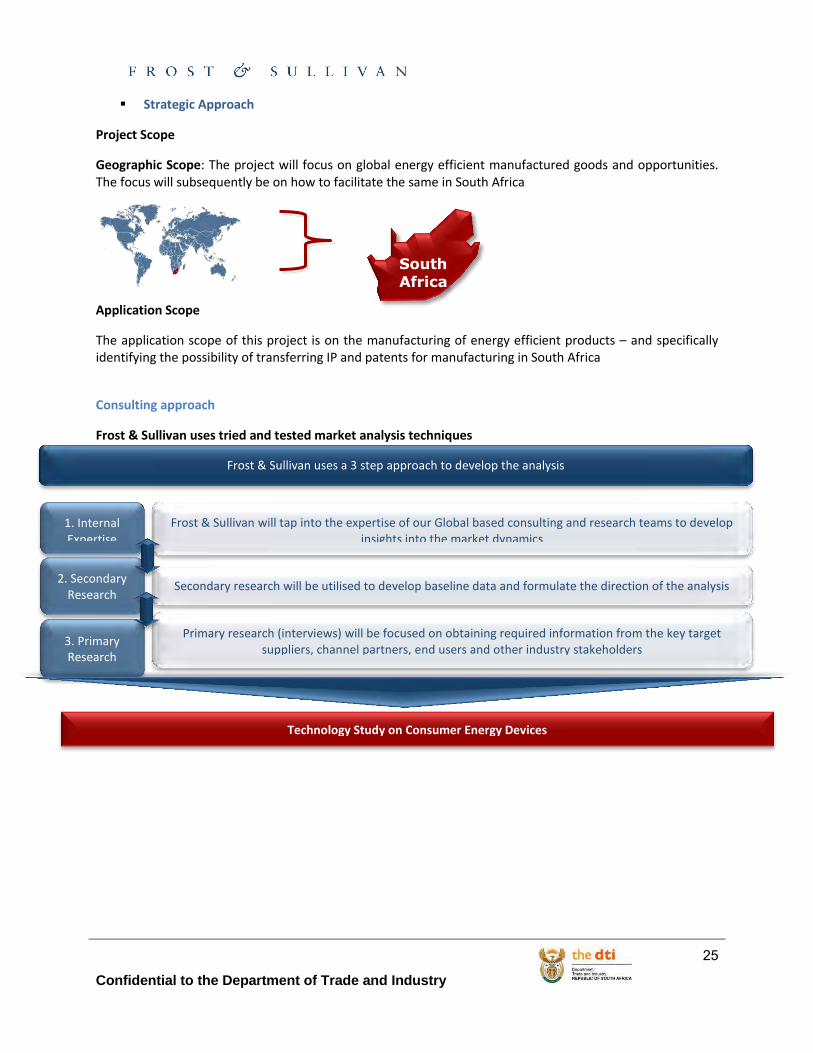
Strategic Approach
Project Scope
Geographic Scope: The project will focus on global energy efficient manufactured goods and opportunities. The focus will subsequently be on how to facilitate the same in South Africa
Application Scope
The application scope of this project is on the manufacturing of energy efficient products – and specifically identifying the possibility of transferring IP and patents for manufacturing in South Africa
Consulting approach
Frost & Sullivan uses tried and tested market analysis techniques
South
Africa
Frost & Sullivan uses a 3 step approach to develop the analysis
3. Primary Research
Primary research (interviews) will be focused on obtaining required information from the key target suppliers, channel partners, end users and other industry stakeholders
1. Internal Expertise
Frost & Sullivan will tap into the expertise of our Global based consulting and research teams to develop insights into the market dynamics
2. Secondary Research
Secondary research will be utilised to develop baseline data and formulate the direction of the analysis
Technology Study on Consumer Energy Devices
Confidential to the Department of Trade and Industry
26
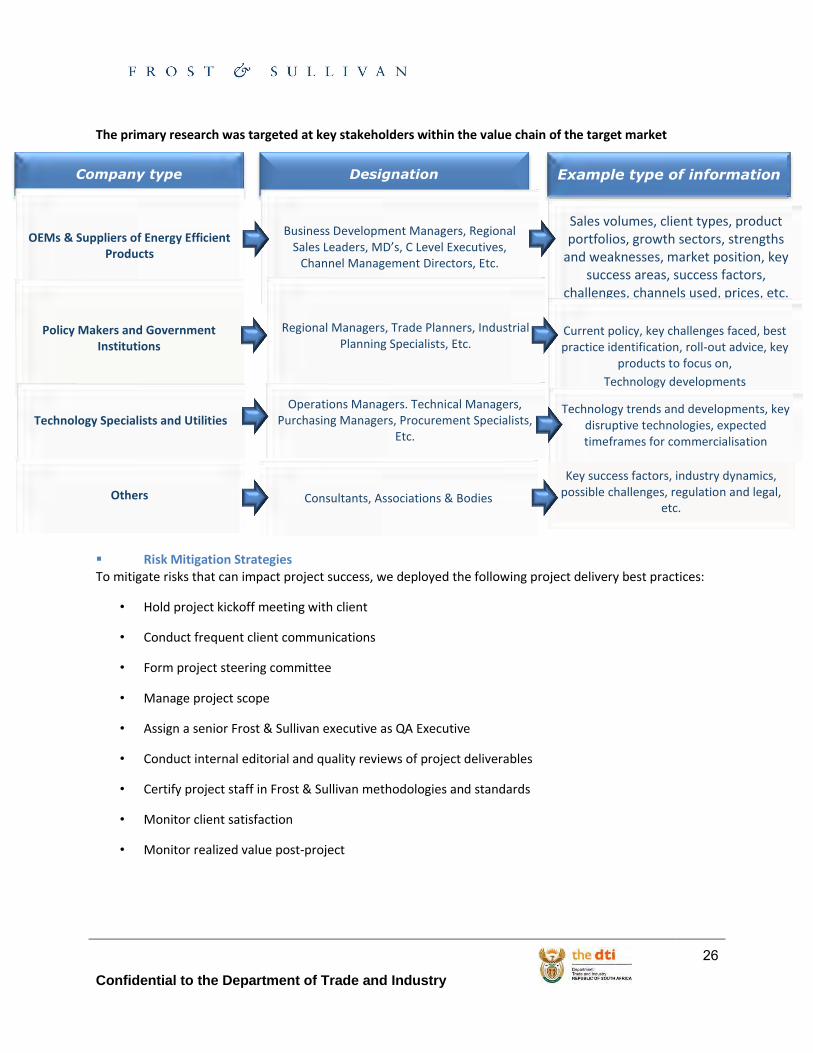
The primary research was targeted at key stakeholders within the value chain of the target market
Risk Mitigation Strategies To mitigate risks that can impact project success, we deployed the following project delivery best practices:
• Hold project kickoff meeting with client
• Conduct frequent client communications
• Form project steering committee
• Manage project scope
• Assign a senior Frost & Sullivan executive as QA Executive
• Conduct internal editorial and quality reviews of project deliverables
• Certify project staff in Frost & Sullivan methodologies and standards
• Monitor client satisfaction
• Monitor realized value post-project
Company type Designation Example type of information
OEMs & Suppliers of Energy Efficient Products
Business Development Managers, Regional Sales Leaders, MD’s, C Level Executives,
Channel Management Directors, Etc.
Sales volumes, client types, product portfolios, growth sectors, strengths
and weaknesses, market position, key success areas, success factors,
challenges, channels used, prices, etc.
Policy Makers and Government Institutions
Regional Managers, Trade Planners, Industrial Planning Specialists, Etc.
Current policy, key challenges faced, best practice identification, roll-out advice, key
products to focus on, Technology developments
Others Consultants, Associations & Bodies
Key success factors, industry dynamics, possible challenges, regulation and legal,
etc.
Technology Specialists and Utilities Operations Managers. Technical Managers,
Purchasing Managers, Procurement Specialists, Etc.
Technology trends and developments, key disruptive technologies, expected timeframes for commercialisation
Confidential to the Department of Trade and Industry
27
Executive Summary Note: There is a stand-alone power point document for each individual stage of this project; presentations of each individual stage were held as well which included a detailed question and answer segment. For more detailed information and context, please refer to the mentioned documents as well as the delegates that attended these presentations.
Please further note that for the purposes of this analysis and keeping in line with the scope of the project, the following definitions apply:
Manufacturing: The construction of components using raw materials and the subsequent assembly of these components to produce a fully-built up device.
Component Assembly: Assembly of ready-made components (outsourced) to produce a fully-built up device.
Local Manufacturers: 100 per cent South African owned manufacturing companies currently manufacturing and or assembling components to produce fully-built up devices; international manufacturers with established manufacturing and/or component assembly are excluded. With the overall objective of this analysis being to stimulate South African manufacturers, international manufacturers are classified as competitors of South African owned manufacturing companies in this study.
Stage 1 Frost & Sullivan conducted research into more than a dozen countries to identify and recommend best practice case studies based on tangible success in energy efficient policies used in selected countries. Ten countries were shortlisted for further analysis based on an overview of key policy mechanisms used to engineer tangible benefits to the economy and energy savings by the EE governance in these select countries (USA, UK, Germany, France, Spain, Hungary, Brazil, South Korea, Japan and Australia).
The United States, Australia, Spain and South Korea were selected as best practice case examples of countries that implement and currently coordinate energy efficient policies that have been tried and tested for more than five years with proven results. These best practice case studies reveal that a combination of different types of policy mechanisms aimed at different sectors of the economy and products respectively, coordinated under an overseeing framework, attains the best results for EE savings and product penetration.
Analysis reveals that the most successful policy measure has been minimum energy performance standards (MEPS), that eliminate worst practice and promote best practice for product manufacturing, whether manufactured locally or abroad.
MEPS or mandatory labelling have been best used in conjunction with a handful of policies, namely, tax credits or deductions for manufacturers, subsidies for products purchased, soft loans, retailer incentives and, marketing and advertising.
Confidential to the Department of Trade and Industry
28
Stage 2 Consumer energy device manufacturing in South Africa is a relatively small industry and almost insignificant in terms of its employment. This is due to the fact that energy efficient consumer energy device manufacturing is not very employment intensive, as production is highly automated.
Several local manufacturers have either downsized or closed their manufacturing operations in the past few years due, in large part, to rising input and labour costs reducing their competitiveness with products manufactured overseas, particularly in the East. The size of operations was rated as a key success factor in the manufacturing of many of the products, in order to provide economies of scale.
Product selection for this research was based on the most prevalent consumer energy devices. Products that are the most intensive consumers of electricity and that are manufactured on large scale were chosen due to their pervasiveness and high potential for future uptake across all sectors of the market.
Through incentivised energy efficiency programmes, there has already been considerable uptake of energy efficient lighting and water heaters. Further incentive programmes are key to ensuring faster replacement of less energy efficient consumer energy devices and promoting local manufacturing.
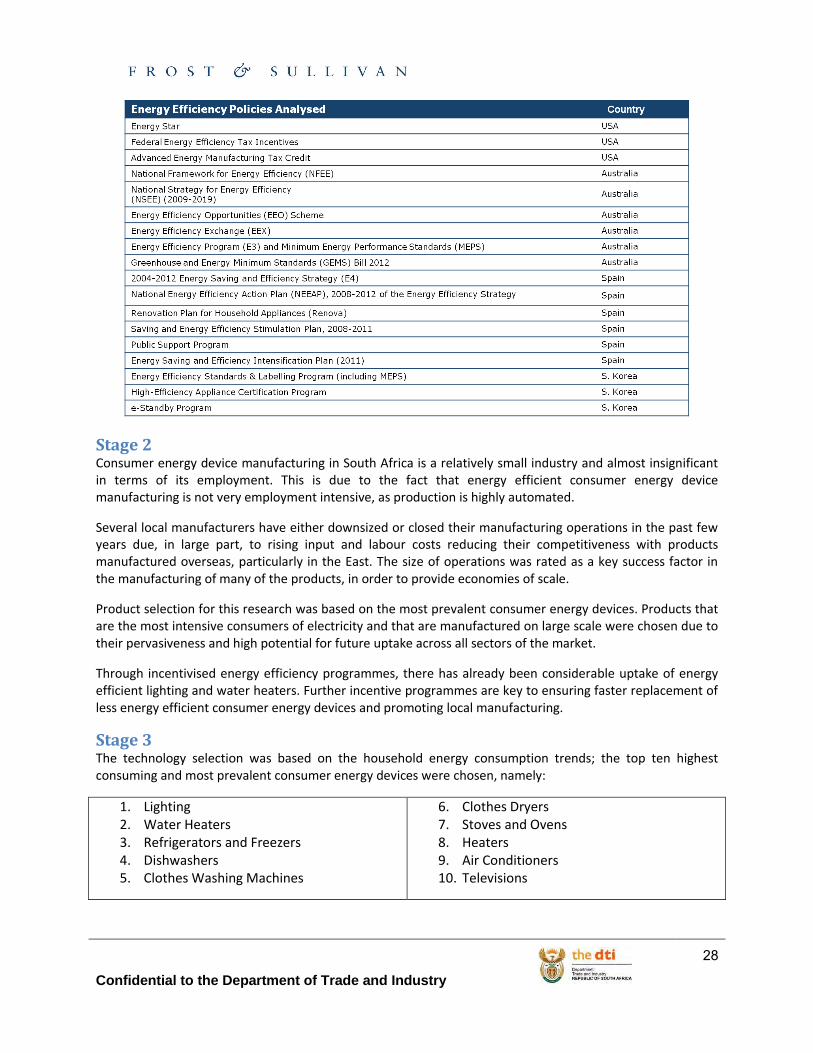
Stage 3 The technology selection was based on the household energy consumption trends; the top ten highest consuming and most prevalent consumer energy devices were chosen, namely:
1. Lighting 2. Water Heaters 3. Refrigerators and Freezers 4. Dishwashers 5. Clothes Washing Machines
6. Clothes Dryers 7. Stoves and Ovens 8. Heaters 9. Air Conditioners 10. Televisions
Confidential to the Department of Trade and Industry
29
Note: Due to the technical nature of refrigerators & freezers, dishwashers, clothes washing machines, clothes dryers and stoves, ranges & ovens, these appliances are categorised as Large Household Appliances by industry and hence this report will follow industry norms.
The South African manufacturing industry is in a better shape than other countries that have completely renounced production to China. Local manufacturers have production facilities that have both manufacturing and component assembly capabilities. The technical and competency levels of the country’s manufacturing industry, with particular emphasis on the ten focus technologies of this project, vary. Of the ten focus technologies, the local lighting, heaters and water heaters manufacturing industries are the most technologically advanced with production facilities that rival those of their international counterparts.
Approximately 65.0 per cent of large household appliances (stoves, ranges, ovens, refrigerators, freezers, dish washers, washing machines and tumble dryers) are imported as whole products. Most international manufacturers do not manufacture products locally in South Africa but source these from their international operations. As is the case with manufacturers of large household appliances such as Defy and Hisense, most air conditioner manufacturers assemble imported components sourced either from international suppliers or from their international operations in the case of international manufacturers. Government measures such as the reinstatement of import duty on whole television in 2010 has led to the revival of the television manufacturing industry which had all but come to a standstill after 1994. Major manufacturers and component assemblers of television sets in South Africa include Hisense and Tellumat who is contracted to manufacture and assemble Sony Bravia, Toshiba and Teledex television sets. The market demand for energy efficient televisions is almost non-existent and this is not expected to change in the medium to long term.
Very few patents are held in South Africa, with regards to the ten focus technology, Frost & Sullivan was able to identify only one patent currently held in South Africa, namely that of space heating manufacturer ECONO-HEAT, patents of the other nine focus technologies are held internationally.
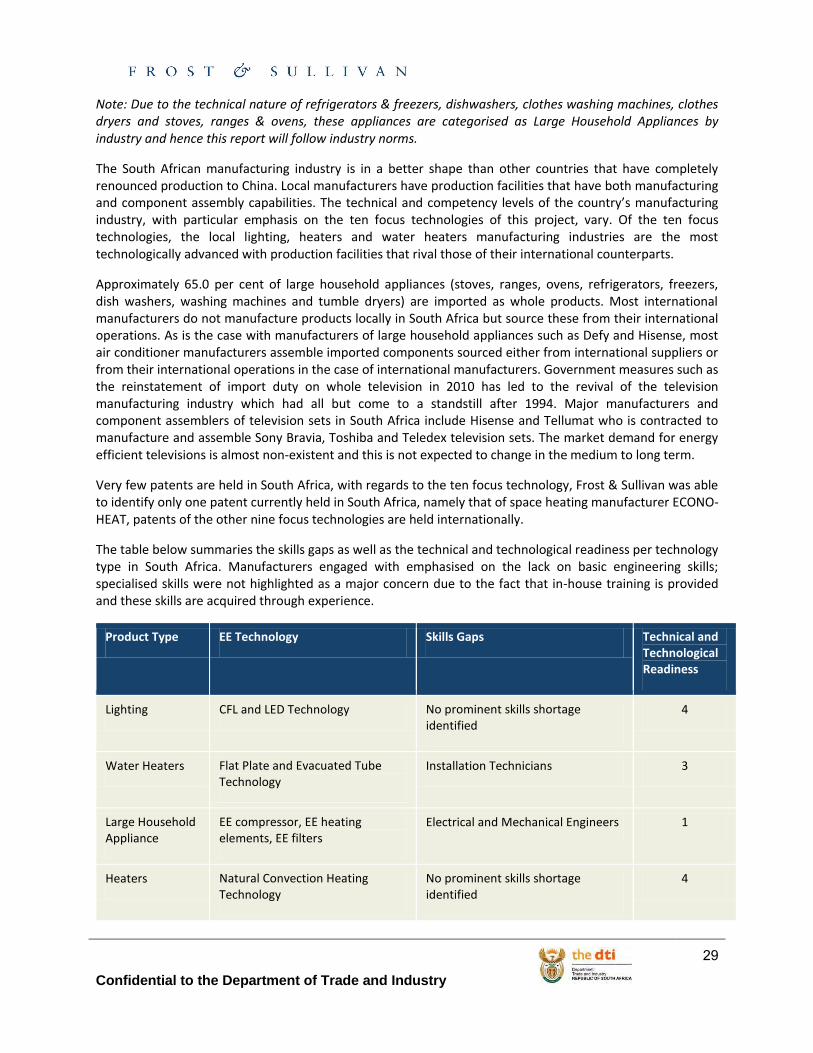
The table below summaries the skills gaps as well as the technical and technological readiness per technology type in South Africa. Manufacturers engaged with emphasised on the lack on basic engineering skills; specialised skills were not highlighted as a major concern due to the fact that in-house training is provided and these skills are acquired through experience.
Product Type EE Technology Skills Gaps Technical and Technological Readiness
Lighting CFL and LED Technology No prominent skills shortage identified
4
Water Heaters Flat Plate and Evacuated Tube Technology
Installation Technicians 3
Large Household Appliance
EE compressor, EE heating elements, EE filters
Electrical and Mechanical Engineers 1
Heaters Natural Convection Heating Technology
No prominent skills shortage identified
4
Confidential to the Department of Trade and Industry
30
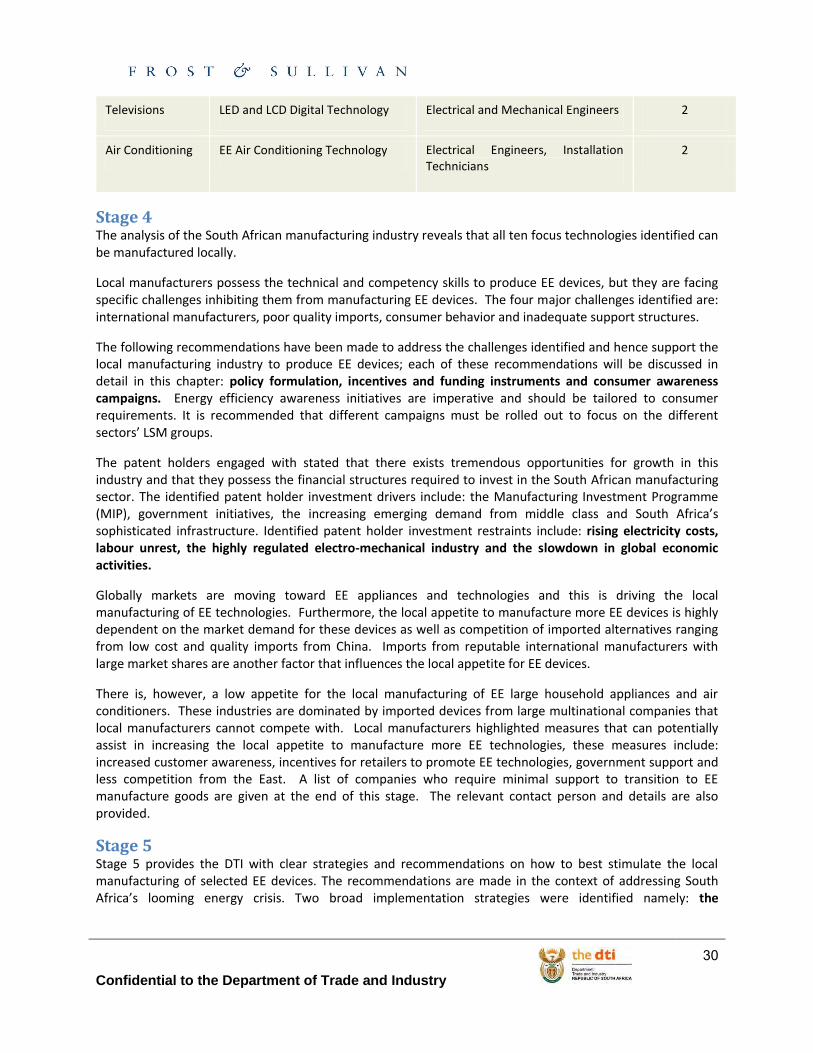
Televisions LED and LCD Digital Technology Electrical and Mechanical Engineers 2
Air Conditioning EE Air Conditioning Technology Electrical Engineers, Installation Technicians
2
Stage 4 The analysis of the South African manufacturing industry reveals that all ten focus technologies identified can be manufactured locally.
Local manufacturers possess the technical and competency skills to produce EE devices, but they are facing specific challenges inhibiting them from manufacturing EE devices. The four major challenges identified are: international manufacturers, poor quality imports, consumer behavior and inadequate support structures.
The following recommendations have been made to address the challenges identified and hence support the local manufacturing industry to produce EE devices; each of these recommendations will be discussed in detail in this chapter: policy formulation, incentives and funding instruments and consumer awareness campaigns. Energy efficiency awareness initiatives are imperative and should be tailored to consumer requirements. It is recommended that different campaigns must be rolled out to focus on the different sectors’ LSM groups.
The patent holders engaged with stated that there exists tremendous opportunities for growth in this industry and that they possess the financial structures required to invest in the South African manufacturing sector. The identified patent holder investment drivers include: the Manufacturing Investment Programme (MIP), government initiatives, the increasing emerging demand from middle class and South Africa’s sophisticated infrastructure. Identified patent holder investment restraints include: rising electricity costs, labour unrest, the highly regulated electro-mechanical industry and the slowdown in global economic activities.
Globally markets are moving toward EE appliances and technologies and this is driving the local manufacturing of EE technologies. Furthermore, the local appetite to manufacture more EE devices is highly dependent on the market demand for these devices as well as competition of imported alternatives ranging from low cost and quality imports from China. Imports from reputable international manufacturers with large market shares are another factor that influences the local appetite for EE devices.
There is, however, a low appetite for the local manufacturing of EE large household appliances and air conditioners. These industries are dominated by imported devices from large multinational companies that local manufacturers cannot compete with. Local manufacturers highlighted measures that can potentially assist in increasing the local appetite to manufacture more EE technologies, these measures include: increased customer awareness, incentives for retailers to promote EE technologies, government support and less competition from the East. A list of companies who require minimal support to transition to EE manufacture goods are given at the end of this stage. The relevant contact person and details are also provided.
Stage 5 Stage 5 provides the DTI with clear strategies and recommendations on how to best stimulate the local manufacturing of selected EE devices. The recommendations are made in the context of addressing South Africa’s looming energy crisis. Two broad implementation strategies were identified namely: the

Confidential to the Department of Trade and Industry
31
encouragement of established international manufacturers to manufacture locally and the stimulation of local manufacturers.
In order to provide the DTI with clear recommendations to have the highest impact at the least cost, a weighting tool was developed to rank the ten focus technologies. The results show that DTI is likely to be most effective at stimulating the local manufacturing of: lighting, space heating and water heating.
The major challenges for local manufacturing include but are not limited to: energy costs, the lack of funding and industry dominance by international manufacturers.
Customised action steps for the stimulation of the local manufacturing of EE lighting technology, EE water heating technology and EE space heating technology include:
Technology Step 1 Step 2 Step 3 Step 4
EE Lighting Engagement with Relevant Stakeholders
Make Funding Structures Available
Improved Policy Implementation
Consumer Awareness Campaigns
EE water heating
Engagement with Relevant Stakeholders
Incentives for Both Manufacturers and End-users
Improved Policy Implementation and Skills Development
Consumer Awareness Campaigns
EE space heating
Engagement with Relevant Stakeholders
Funding Incentives and Structures
Implement and Enforce Policies
Consumer Awareness Campaigns
In summary, the action steps required to stimulate the local manufacturing of EE large household appliances and EE air conditioners involve the establishment of local manufacturing and component assembly facilities by established international manufacturers. The television manufacturing industry is highly saturated leaving minimal room for expansion and introduction of new local manufacturers.
The impact of the stimulation of EE technology manufacturing in South Africa is expected to have the following impacts on other local manufacturers currently manufacturing conventional devices: financial impact, technical and technological impact, consumer impact and skills availability impact.
There are specific challenges in the local manufacturing of EE technology within the lighting, water heating and space heating industries. These challenges and proposed mitigation strategies are discussed in this section.
There is currently a lack of sufficient R&D and innovation facilities for EE technologies in South Africa. Moving a product or technology from the R&D phase to the market takes between 3-5 years, depending on the project specifications. Throughout this process, support is needed and the following strategies are suggested to ensure commercialisation of EE technologies: financial Support, technical support, dedicated effort to link private sector with universities and the encouragement of smart partnerships.
The overall industry multiplier effects and beneficiation options of the industries include: economic growth, job creation and skills development, industry competitiveness, stimulation of the demand for local products and services and the reducing carbon emissions.
Confidential to the Department of Trade and Industry
32
Stage 1: International Best Practice Analysis Introduction to Energy Efficiency Policies and Governance
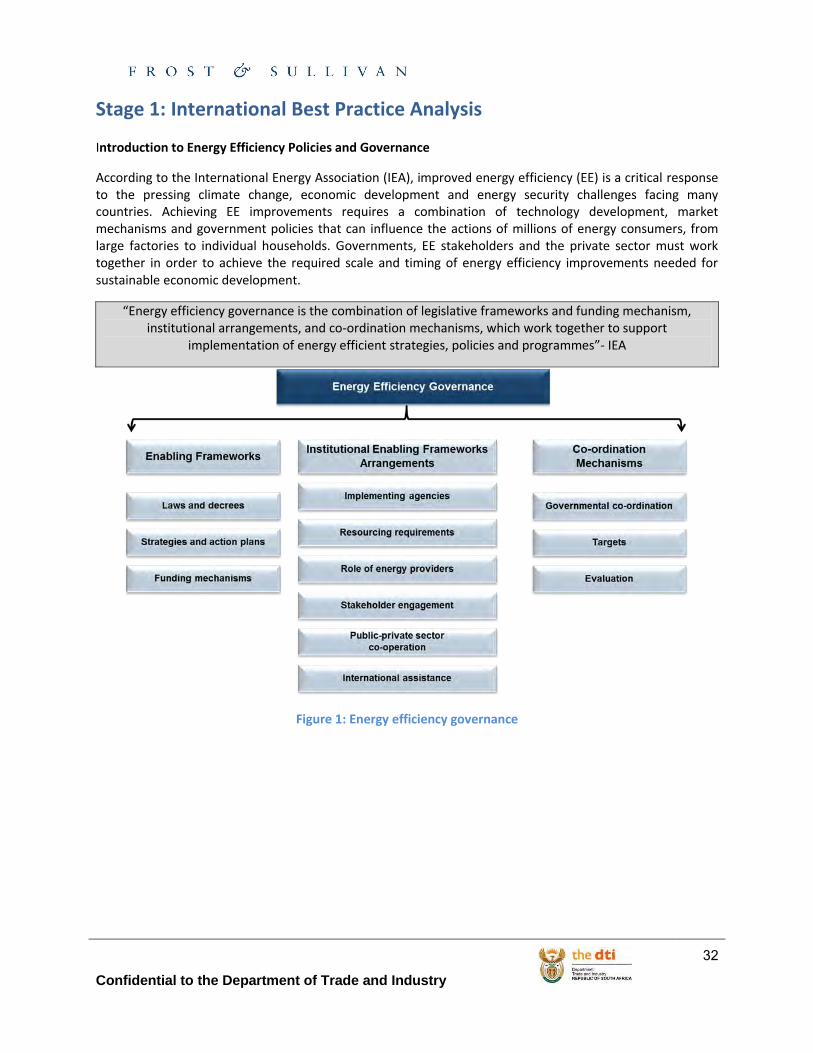
According to the International Energy Association (IEA), improved energy efficiency (EE) is a critical response to the pressing climate change, economic development and energy security challenges facing many countries. Achieving EE improvements requires a combination of technology development, market mechanisms and government policies that can influence the actions of millions of energy consumers, from large factories to individual households. Governments, EE stakeholders and the private sector must work together in order to achieve the required scale and timing of energy efficiency improvements needed for sustainable economic development.
“Energy efficiency governance is the combination of legislative frameworks and funding mechanism, institutional arrangements, and co-ordination mechanisms, which work together to support
implementation of energy efficient strategies, policies and programmes”- IEA
Figure 1: Energy efficiency governance
Confidential to the Department of Trade and Industry
33
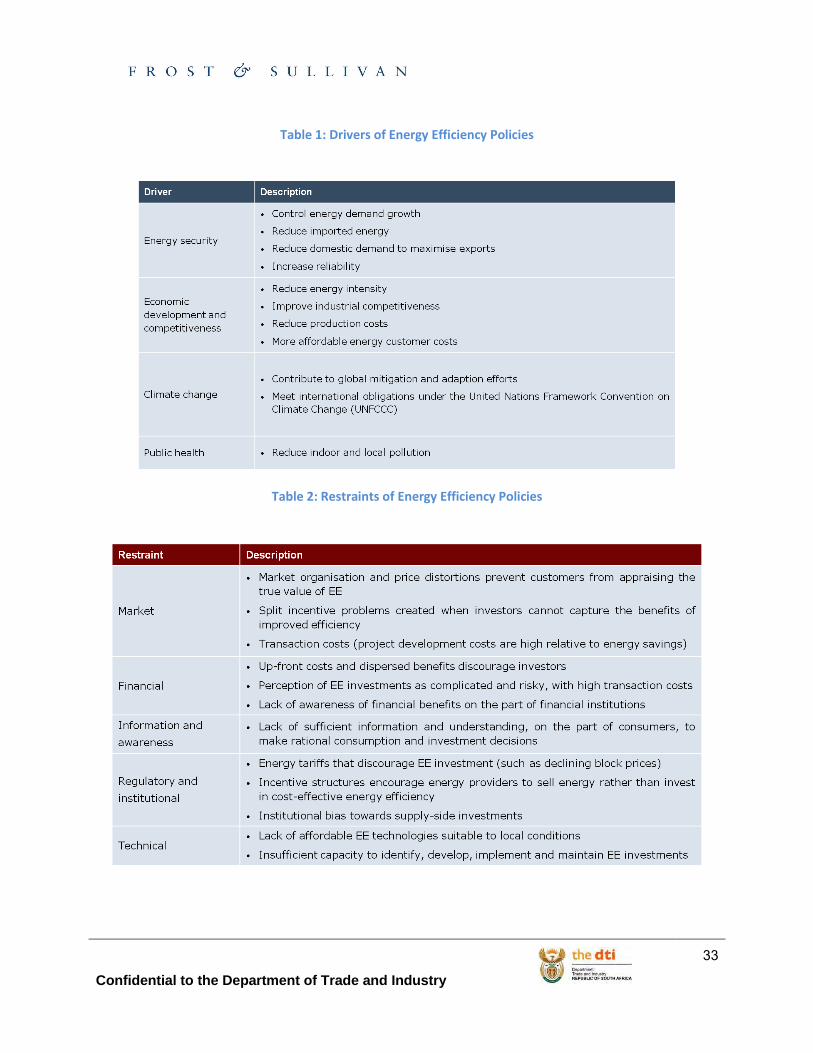
Table 1: Drivers of Energy Efficiency Policies
Table 2: Restraints of Energy Efficiency Policies
Confidential to the Department of Trade and Industry
34
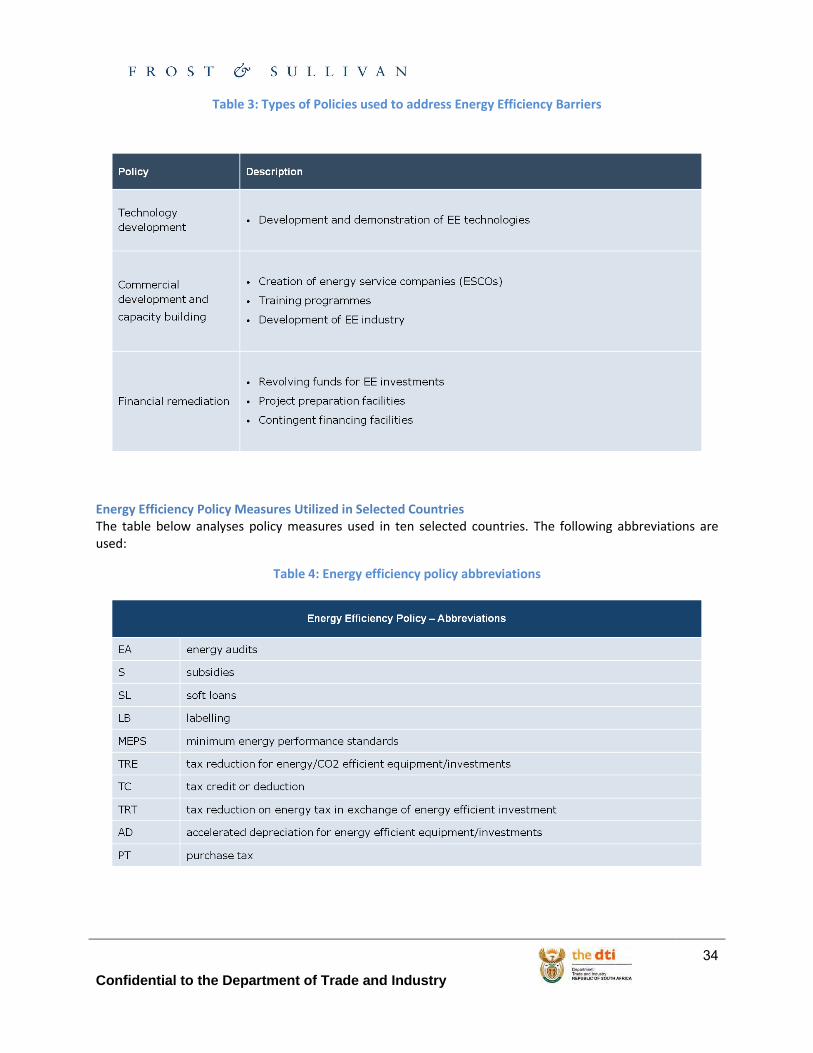
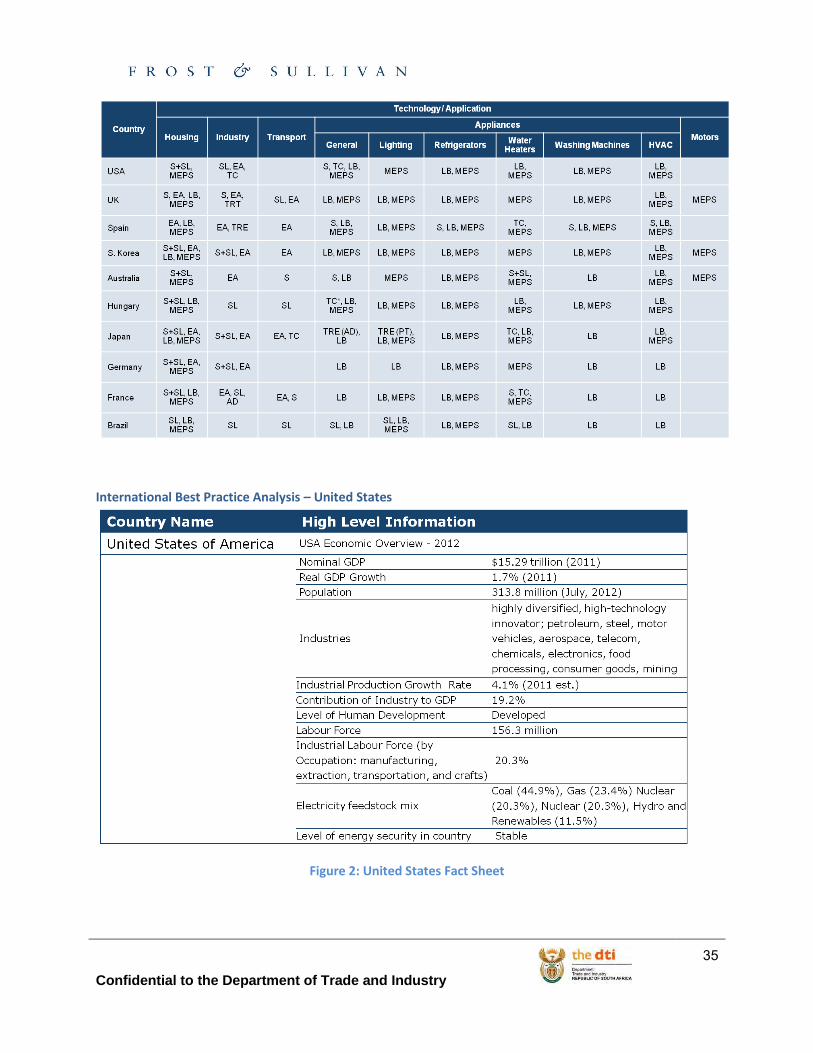
Table 3: Types of Policies used to address Energy Efficiency Barriers
Energy Efficiency Policy Measures Utilized in Selected Countries The table below analyses policy measures used in ten selected countries. The following abbreviations are used:
Table 4: Energy efficiency policy abbreviations
Confidential to the Department of Trade and Industry
35
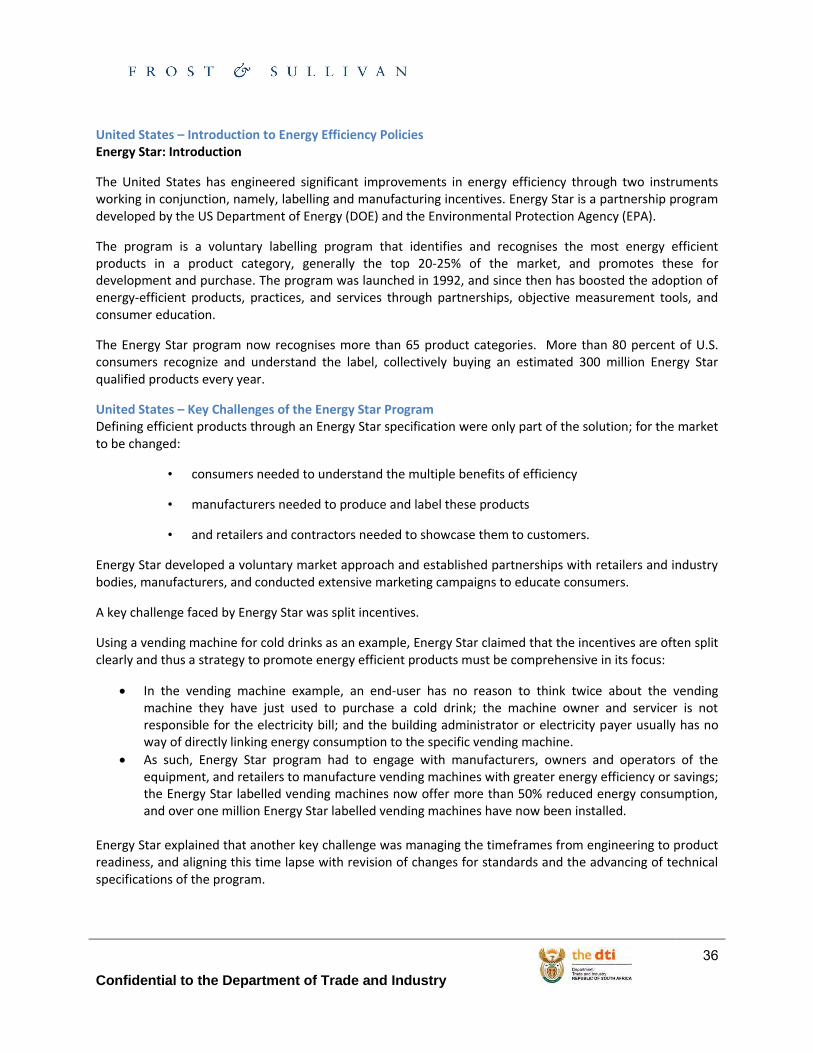
International Best Practice Analysis – United States
Figure 2: United States Fact Sheet
Confidential to the Department of Trade and Industry
36
United States – Introduction to Energy Efficiency Policies Energy Star: Introduction
The United States has engineered significant improvements in energy efficiency through two instruments working in conjunction, namely, labelling and manufacturing incentives. Energy Star is a partnership program developed by the US Department of Energy (DOE) and the Environmental Protection Agency (EPA).
The program is a voluntary labelling program that identifies and recognises the most energy efficient products in a product category, generally the top 20-25% of the market, and promotes these for development and purchase. The program was launched in 1992, and since then has boosted the adoption of energy-efficient products, practices, and services through partnerships, objective measurement tools, and consumer education.
The Energy Star program now recognises more than 65 product categories. More than 80 percent of U.S. consumers recognize and understand the label, collectively buying an estimated 300 million Energy Star qualified products every year.
United States – Key Challenges of the Energy Star Program Defining efficient products through an Energy Star specification were only part of the solution; for the market to be changed:
• consumers needed to understand the multiple benefits of efficiency
• manufacturers needed to produce and label these products
• and retailers and contractors needed to showcase them to customers.
Energy Star developed a voluntary market approach and established partnerships with retailers and industry bodies, manufacturers, and conducted extensive marketing campaigns to educate consumers.
A key challenge faced by Energy Star was split incentives.
Using a vending machine for cold drinks as an example, Energy Star claimed that the incentives are often split clearly and thus a strategy to promote energy efficient products must be comprehensive in its focus:
In the vending machine example, an end-user has no reason to think twice about the vending machine they have just used to purchase a cold drink; the machine owner and servicer is not responsible for the electricity bill; and the building administrator or electricity payer usually has no way of directly linking energy consumption to the specific vending machine.
As such, Energy Star program had to engage with manufacturers, owners and operators of the equipment, and retailers to manufacture vending machines with greater energy efficiency or savings; the Energy Star labelled vending machines now offer more than 50% reduced energy consumption, and over one million Energy Star labelled vending machines have now been installed.
Energy Star explained that another key challenge was managing the timeframes from engineering to product readiness, and aligning this time lapse with revision of changes for standards and the advancing of technical specifications of the program.
Confidential to the Department of Trade and Industry
37
In the past year, the Energy Star program has moved from self-declaration to a third party certification program with independent and in-depth review of data. Energy Star currently aims to develop a more robust verification program that continues to meet efficiency.
Another challenge mentioned was the fact that some product categories are approaching the technical limit to operational efficiency; thus for some products, only small incremental improvements will continue before efficiency levels are reached.
Energy Star: Policy Drivers that Created the Success As mentioned in the challenges section, defining efficient products through an Energy Star specification was only part of the solution; Energy Star had to engage with all sides of the industry to achieve successful results.
At consumer level, Energy Star implemented large-scale advertising campaigns to change the minds of Americans and their purchasing habits.
Energy Star has three key messages that it used in media, packaging and advertising campaigns:
Energy Star saves you money and protects the environment. Use of qualified products in your home can ensure up to 30 percent savings.
The second is price tag. Products have two price tags: the purchase price plus the cost of electricity needed to use the product over its lifetime.
An easy choice. Either the product is energy efficient because it displays the Energy Star label, or it is not.
Energy Star program coordinators engaged with leading manufacturers to include Energy Star in their own product advertising campaigns.
In the beginning of the program, Sears*’ endorsement of Energy Star, in the company’s own advertising campaigns, gave Energy Star labelled products a boost, which was followed by other key manufacturers in different product categories.
By 2000, 40 percent of U.S. households were aware of the Energy Star label, and the program was producing tremendous, measurable results—cumulatively saving $5 billion in utility bills and preventing GHG emissions equivalent to the emissions from 10 million vehicles. In 2012, more than 80 percent of Americans now recognize the Energy Star label. 30-45 percent of households report purchasing an Energy Star qualified product in a given year. Importantly, almost 85 percent of purchasers would recommend Energy Star to a friend.
At a retailer level, Energy Star products at a cost premium were suitable for “up-selling” these more expensive products.
Successful partnerships in the retail sector enabled Energy Star products to gain significant floor space in their stores to be showcased.
The Energy Star products still comply with industry standards, and they are more energy efficient.
United States – Product Categories Energy Star Products
In the USA about 280 million Energy Star qualified products were sold in 2011 in over 65 categories. A cumulative total of almost 3.5 billion products since 2000 have been sold through Energy Star. These
Confidential to the Department of Trade and Industry
38
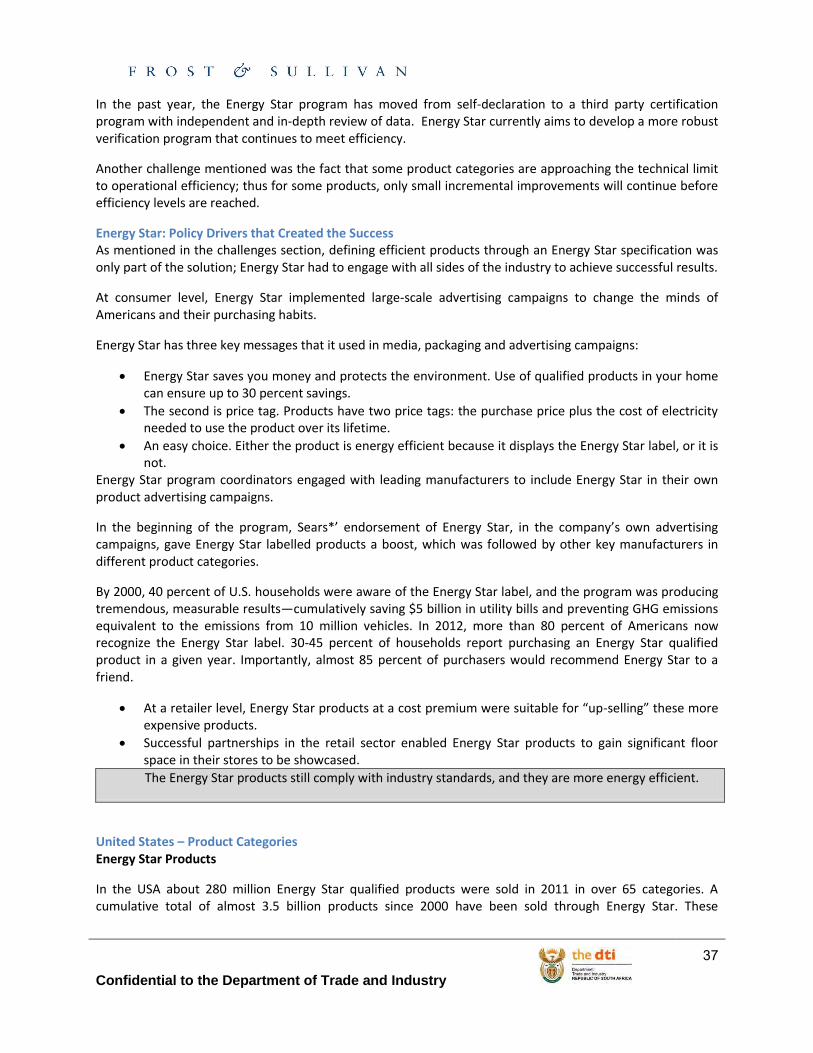
products range from 20–65 percent more efficient than their industry norm, without comparative decreases in operating efficiency.
Figure 3: Energy Star product categories
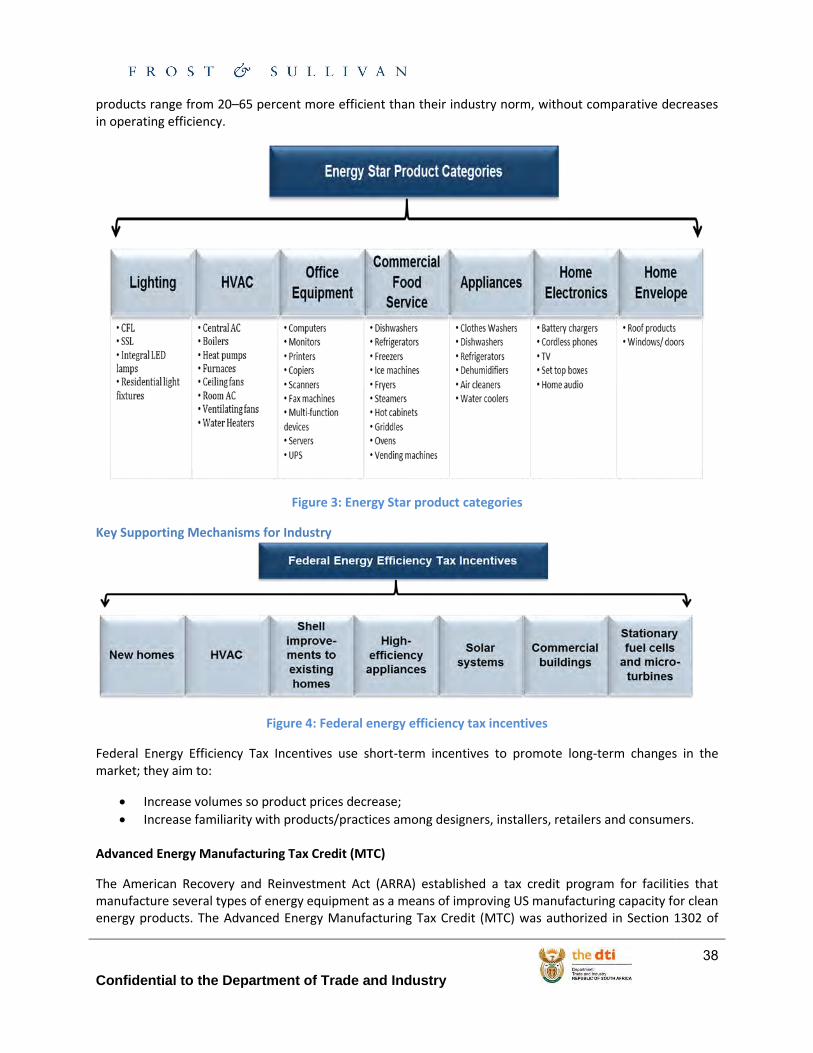
Key Supporting Mechanisms for Industry
Figure 4: Federal energy efficiency tax incentives
Federal Energy Efficiency Tax Incentives use short-term incentives to promote long-term changes in the market; they aim to:
Increase volumes so product prices decrease;
Increase familiarity with products/practices among designers, installers, retailers and consumers.
Advanced Energy Manufacturing Tax Credit (MTC)
The American Recovery and Reinvestment Act (ARRA) established a tax credit program for facilities that manufacture several types of energy equipment as a means of improving US manufacturing capacity for clean energy products. The Advanced Energy Manufacturing Tax Credit (MTC) was authorized in Section 1302 of
Confidential to the Department of Trade and Industry
39
ARRA, and is also referred to as Section 48C of the Internal Revenue Code. The MTC provides a 30 percent tax credit for investments in 183 manufacturing facilities in 43 states, allocated on a competitive basis depending on a range of criteria (this includes renewable energy technologies as well as energy efficiency).
The deadline for applications was October 16, 2009 - over 500 applications were received, totalling $8 billion. Due to the level of interest, Congress is currently considering renewing the program, with a proposed extra $5 billion for renewal.
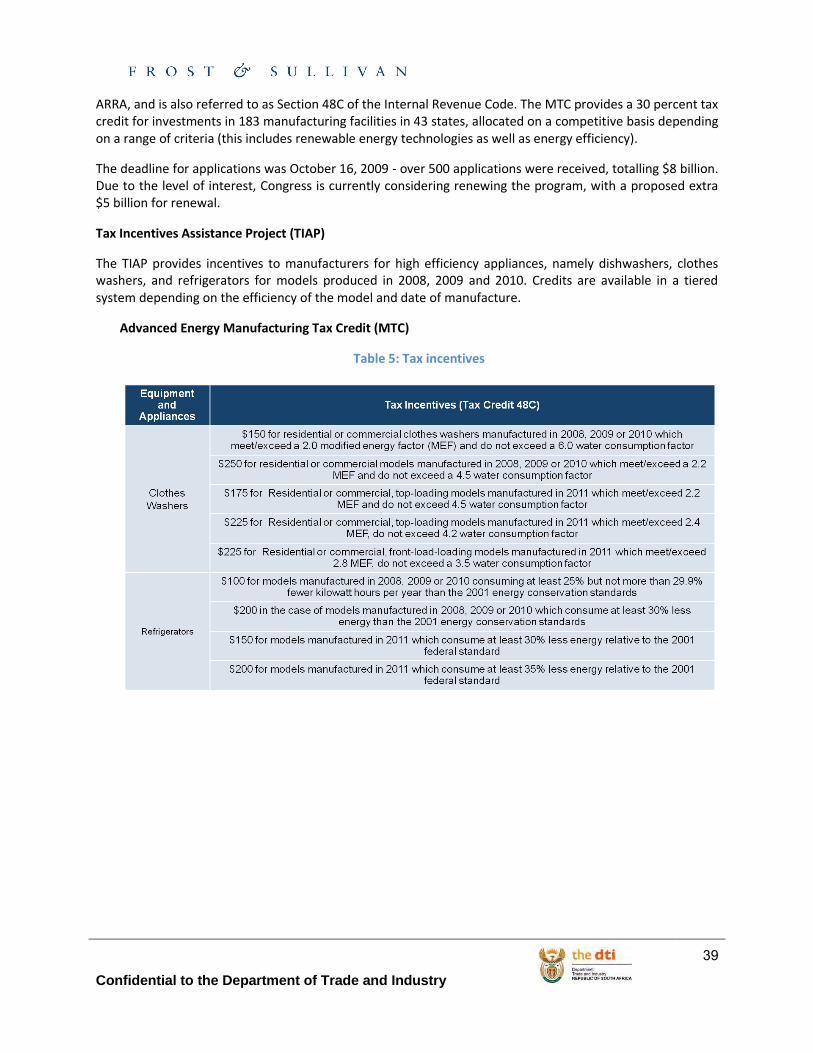
Tax Incentives Assistance Project (TIAP)
The TIAP provides incentives to manufacturers for high efficiency appliances, namely dishwashers, clothes washers, and refrigerators for models produced in 2008, 2009 and 2010. Credits are available in a tiered system depending on the efficiency of the model and date of manufacture.
Advanced Energy Manufacturing Tax Credit (MTC)
Table 5: Tax incentives
Confidential to the Department of Trade and Industry
40
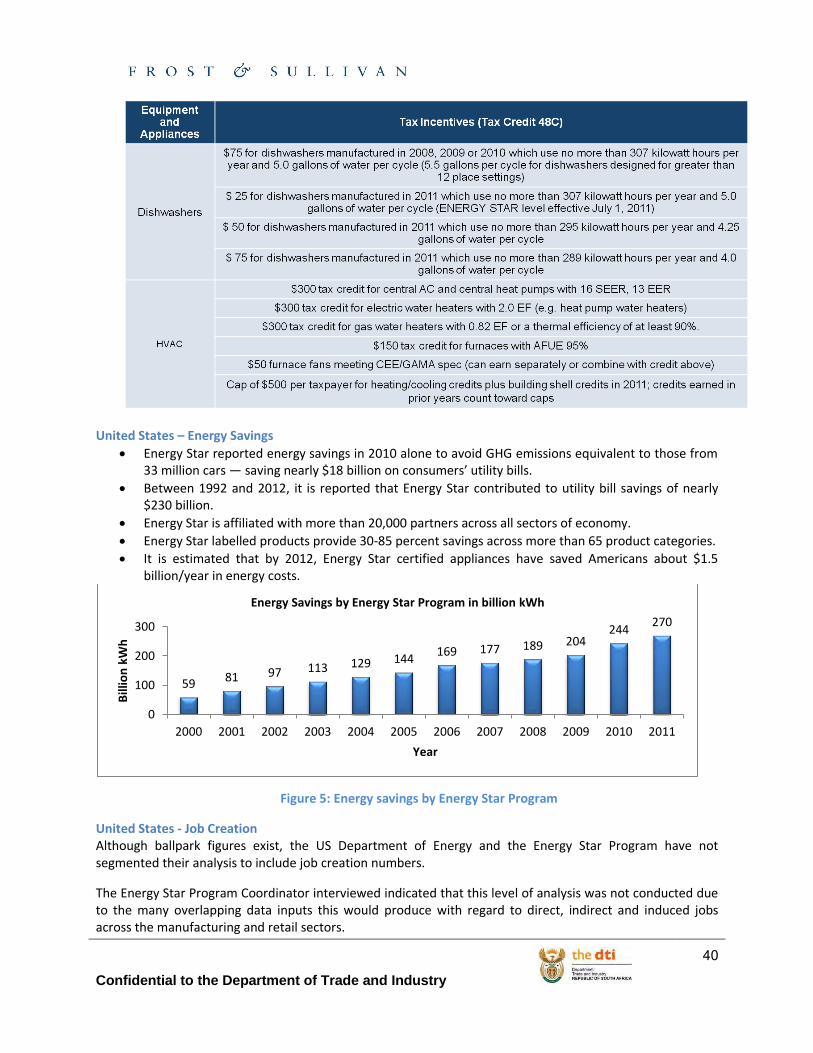
United States – Energy Savings
Energy Star reported energy savings in 2010 alone to avoid GHG emissions equivalent to those from 33 million cars — saving nearly $18 billion on consumers’ utility bills.
Between 1992 and 2012, it is reported that Energy Star contributed to utility bill savings of nearly $230 billion.
Energy Star is affiliated with more than 20,000 partners across all sectors of economy.
Energy Star labelled products provide 30-85 percent savings across more than 65 product categories.
It is estimated that by 2012, Energy Star certified appliances have saved Americans about $1.5 billion/year in energy costs.
Figure 5: Energy savings by Energy Star Program
United States - Job Creation Although ballpark figures exist, the US Department of Energy and the Energy Star Program have not segmented their analysis to include job creation numbers.
The Energy Star Program Coordinator interviewed indicated that this level of analysis was not conducted due to the many overlapping data inputs this would produce with regard to direct, indirect and induced jobs across the manufacturing and retail sectors.
59 81 97 113 129 144 169 177 189 204
244 270
0
100
200
300
2000 2001 2002 2003 2004 2005 2006 2007 2008 2009 2010 2011
Bill
ion
kW
h
Year
Energy Savings by Energy Star Program in billion kWh
Confidential to the Department of Trade and Industry
41
United States - Level of Import vs. Manufactured Products Many US-based manufacturers have manufacturing facilities abroad and their headquarters in the US; Energy Star indicated that analysis has not been conducted with regard to the segmentation of imported versus locally manufactured EE products, largely due to the intangible and inconsequential data that this would produce.
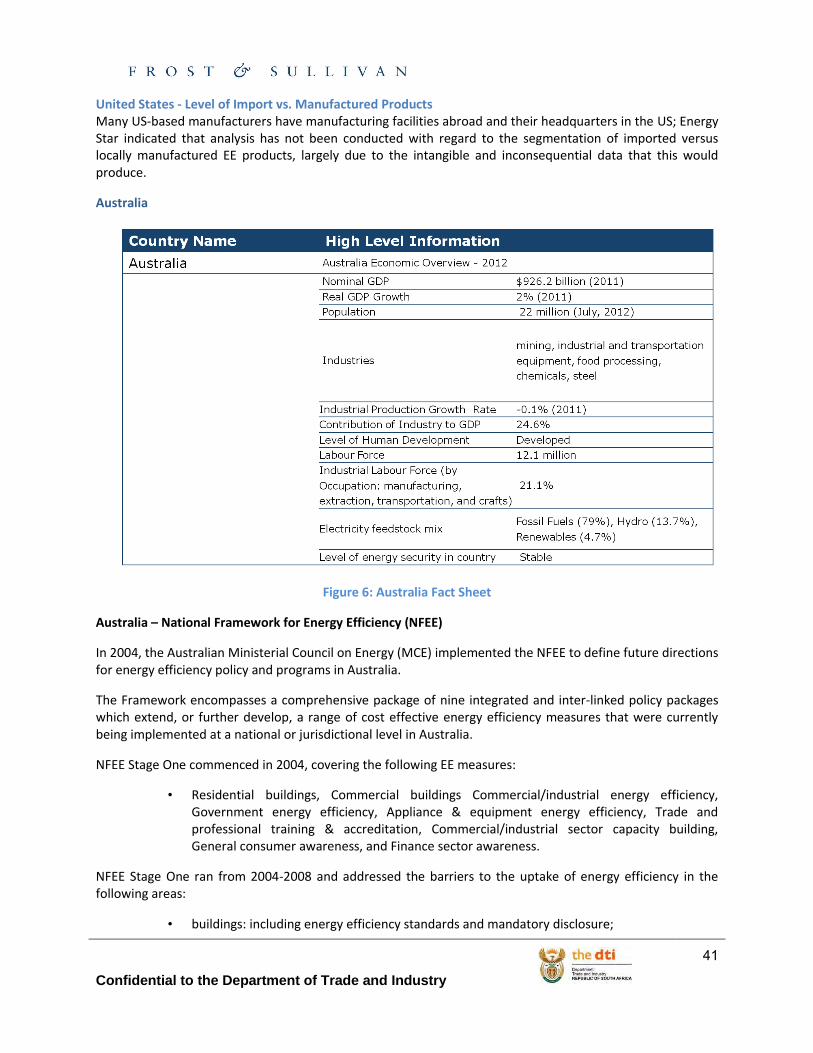
Australia
Figure 6: Australia Fact Sheet
Australia – National Framework for Energy Efficiency (NFEE)
In 2004, the Australian Ministerial Council on Energy (MCE) implemented the NFEE to define future directions for energy efficiency policy and programs in Australia.
The Framework encompasses a comprehensive package of nine integrated and inter-linked policy packages which extend, or further develop, a range of cost effective energy efficiency measures that were currently being implemented at a national or jurisdictional level in Australia.
NFEE Stage One commenced in 2004, covering the following EE measures:
• Residential buildings, Commercial buildings Commercial/industrial energy efficiency, Government energy efficiency, Appliance & equipment energy efficiency, Trade and professional training & accreditation, Commercial/industrial sector capacity building, General consumer awareness, and Finance sector awareness.
NFEE Stage One ran from 2004-2008 and addressed the barriers to the uptake of energy efficiency in the following areas:
• buildings: including energy efficiency standards and mandatory disclosure;
Confidential to the Department of Trade and Industry
42
• appliances and equipment: including minimum energy performance standards (MEPS) and labelling;
• industry: including the Australian Government’s Energy Efficiency Opportunities (EEO) scheme; and
• capacity building: including training and accreditation and information provision.
In 2006, NFEE and Allen Consulting Group estimated that in 2015, the projected impact of Stage One measures would be a GDP benefit of AUS$ 380 million/annum. This translates to 7.8 Mt CO2-e /annum in GHG emissions reduction and 42 PT/annum of energy savings.
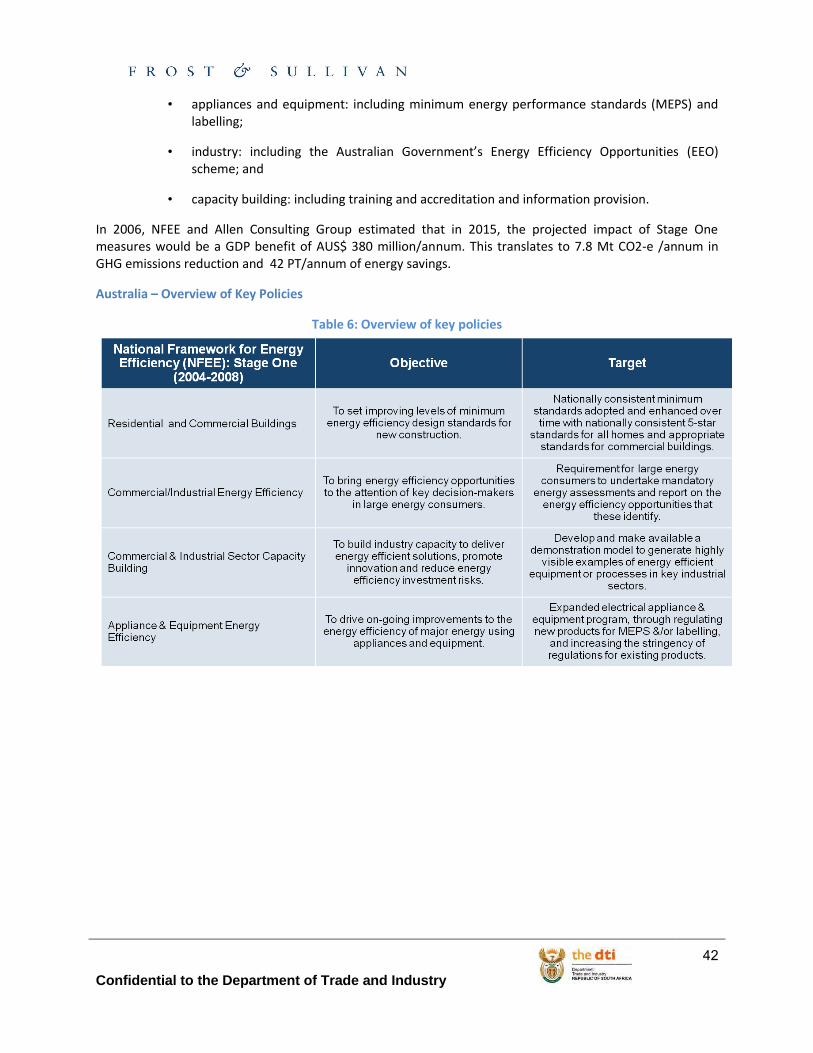
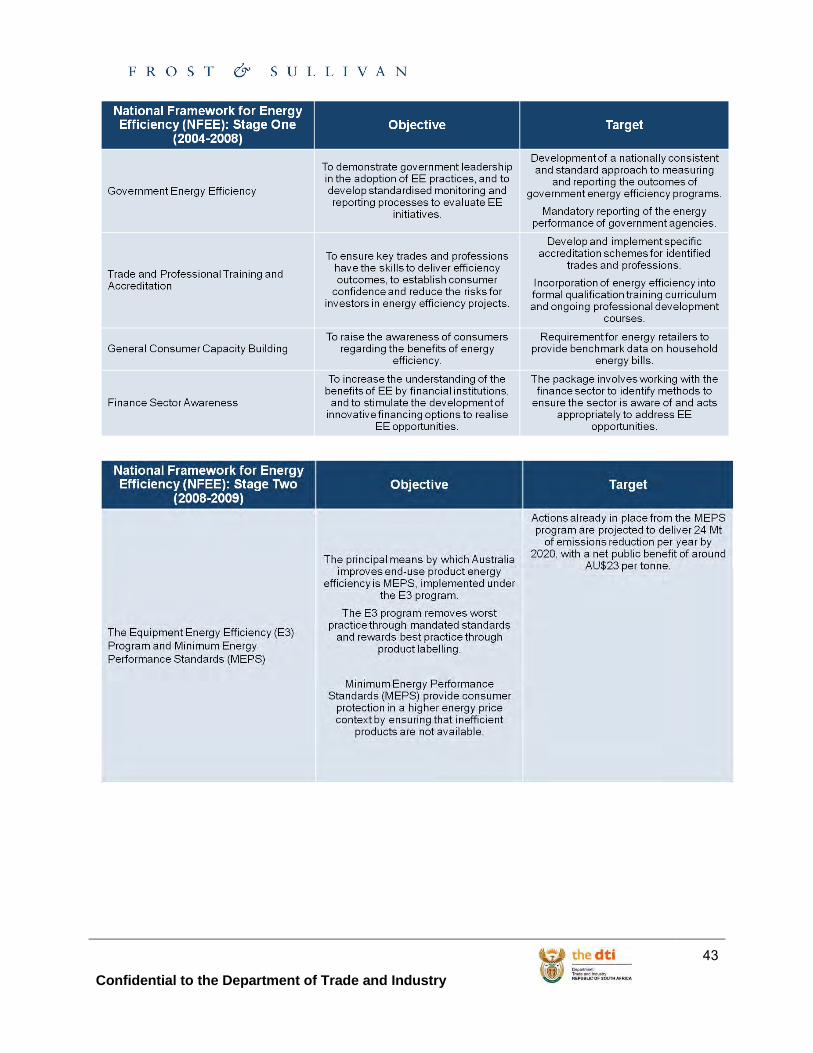
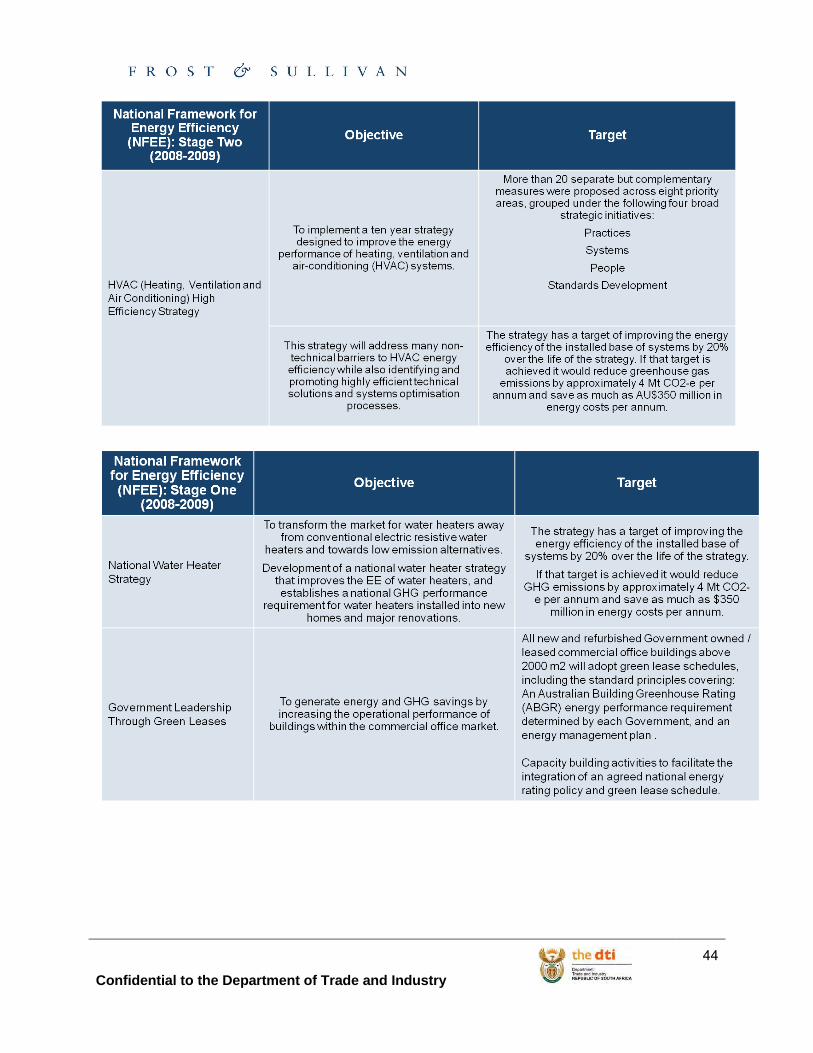
Australia – Overview of Key Policies
Table 6: Overview of key policies
Confidential to the Department of Trade and Industry
43
Confidential to the Department of Trade and Industry
44
Confidential to the Department of Trade and Industry
45
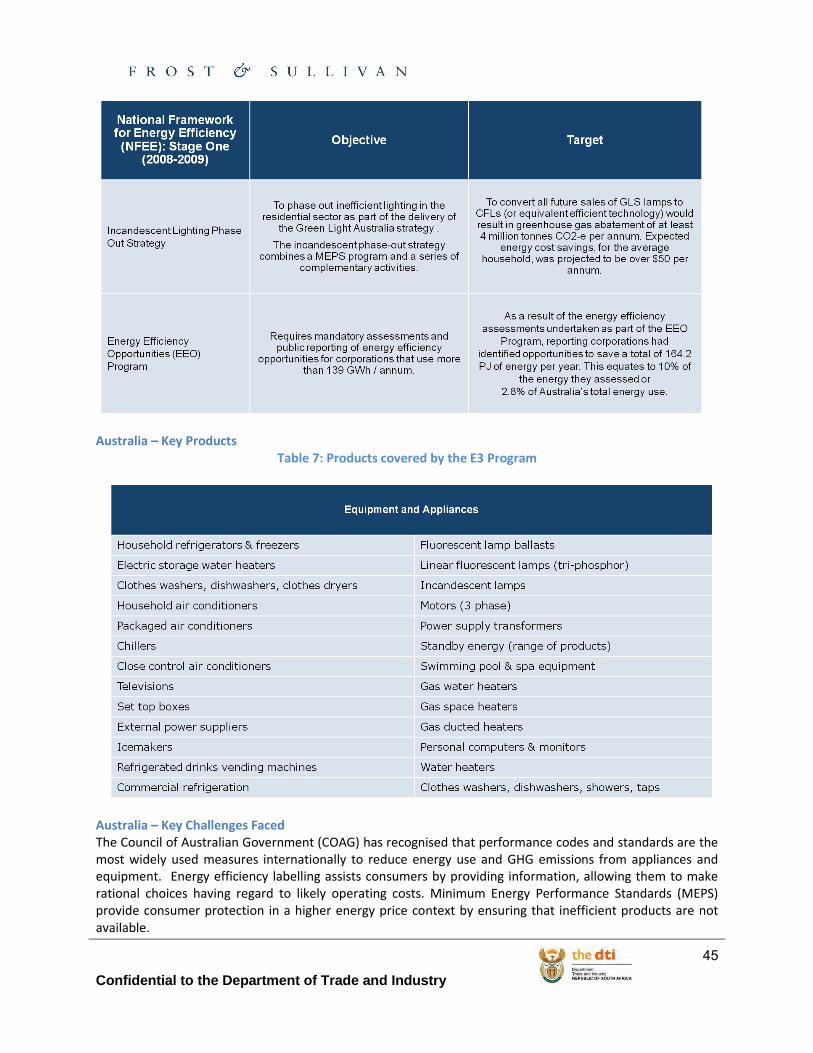
Australia – Key Products Table 7: Products covered by the E3 Program
Australia – Key Challenges Faced The Council of Australian Government (COAG) has recognised that performance codes and standards are the most widely used measures internationally to reduce energy use and GHG emissions from appliances and equipment. Energy efficiency labelling assists consumers by providing information, allowing them to make rational choices having regard to likely operating costs. Minimum Energy Performance Standards (MEPS) provide consumer protection in a higher energy price context by ensuring that inefficient products are not available.
Confidential to the Department of Trade and Industry
46
In the Australian context, impediments arise from a range of market failures and barriers but primarily result from information failures and split incentives.
Imperfect information - markets may under-supply energy efficient technologies and services because consumers (and sometimes vendors) do not have access to sufficient or accurate information about their energy efficiency options.
Without the correct information buyers are not able to make fully informed choices.
Split incentives - markets may under-supply technologies and services because the person purchasing an energy using technology is different from the person who benefits from its use.
Therefore the incentives facing the purchaser differ from those of the user; a landlord for example, may not take full account of the running costs when making decisions about the installation of appliances and equipment.
Bounded rationality - in an ideal world, individual consumers and producers would have sufficient information and the ability to process that information, to make the most appropriate decisions.
But individuals are limited in their ability to obtain and process complex information and to handle the uncertainties that invariably arise in a dynamic and evolving operating environment.
Australia – Key Challenges Faced and Lessons Learned Lessons learned from a retrospective review of the E3 Program note the following findings:
• The energy efficiency of appliances on the market increased sharply at the times of first implementation of labelling and MEPS, and when MEPS levels increased, directly demonstrating the effect of the measures.
• The cost-effectiveness of regulatory action for both product types was significantly higher than originally projected - approximately twice as much energy was saved by householders at less cost than projected in the Regulation Impact Statements (RISs).
• There is no evidence that the real price of appliances increased at all as a result of the rise in energy efficiency.
• There was no evidence of a reduction in the number of brands or models available, or any other evidence of reduced market competition as a result of the rise in energy efficiency imposed by regulation.
Australia – Impact on Manufacturers EES (2010) detected sharp upward movements in product energy efficiency trends in response to both the 1999 and 2005 MEPS.
The study was also able to detect a sharp increase in the energy efficiency of refrigerators and freezers in the early 1980s, as suppliers removed their least efficient appliances from the market in anticipation of labelling.
In that respect, the initial introduction of labelling can be seen to act on product suppliers in the same way as MEPS, and produced a similar upward movement in efficiency even before consumers become aware of the energy label.
Confidential to the Department of Trade and Industry
47
Australia - Benefit to the Economy In 2006, the NFEE and Allen Consulting Group estimated that in 2015, the projected impact of NFEE Stage One measures would be a GDP benefit of AU$ 380 million/annum. For appliance and equipment efficiency, economic benefits to Australia were estimated at a total value of AU$4.8 billion by 2020 (2007 projection: delivered at a consumer benefit, not cost).
For Australian energy users as a whole, the entire E3 Program is projected to return net benefits of AU$22,437 million (NPV in 2008, at a discount rate of 7.5%) over the 16 years 2009-2024. As a point of comparison to past studies, the program will save the community AU$5,200 million (NPV) in the year 2020 alone.
Australia – Energy Savings Total electricity savings from all sectors targeted by the E3 Program are projected to exceed 32,000 GWh per annum by 2020. The residential sector will account for more than two thirds of total energy savings.
Almost 80 per cent of the energy savings will come from pure MEPS programs, and the other 20 per cent from labelling or labelling combined with MEPS. Actions already in progress from the MEPS program are projected to deliver 24 Mt of emissions reduction per year by 2020, with a net public benefit of around AU$23 per tonne.
For the EE3 Program, in the residential sector, energy savings are projected to be nearly 22,000 GWh per annum by 2020. E3 measures already implemented will reduce household electricity use in 2020 by about 13 per cent compared with business as usual (BAU), and measures currently planned could bring about a further reduction of nearly 15 per cent.
For the non-residential sector, electricity savings below BAU are projected to reach about 10,300 GWh per annum by 2020. Lighting products will account for nearly 30% of the projected electricity savings between 2009 and 2020, followed by transformers (22 per cent), HVAC products (20 per cent), motors (14 per cent) and computers and electronic devices (9 per cent).
As of June 2011, under the EEO Program, the 252 reporting corporations had identified opportunities to save 164.2 PJ of energy per year, equivalent to 2.8 per cent of Australia’s energy use or the energy use of 3.28 million Australian households. This is a 15.7 per cent increase on the 141.9 PJ of savings reported in June 2010.
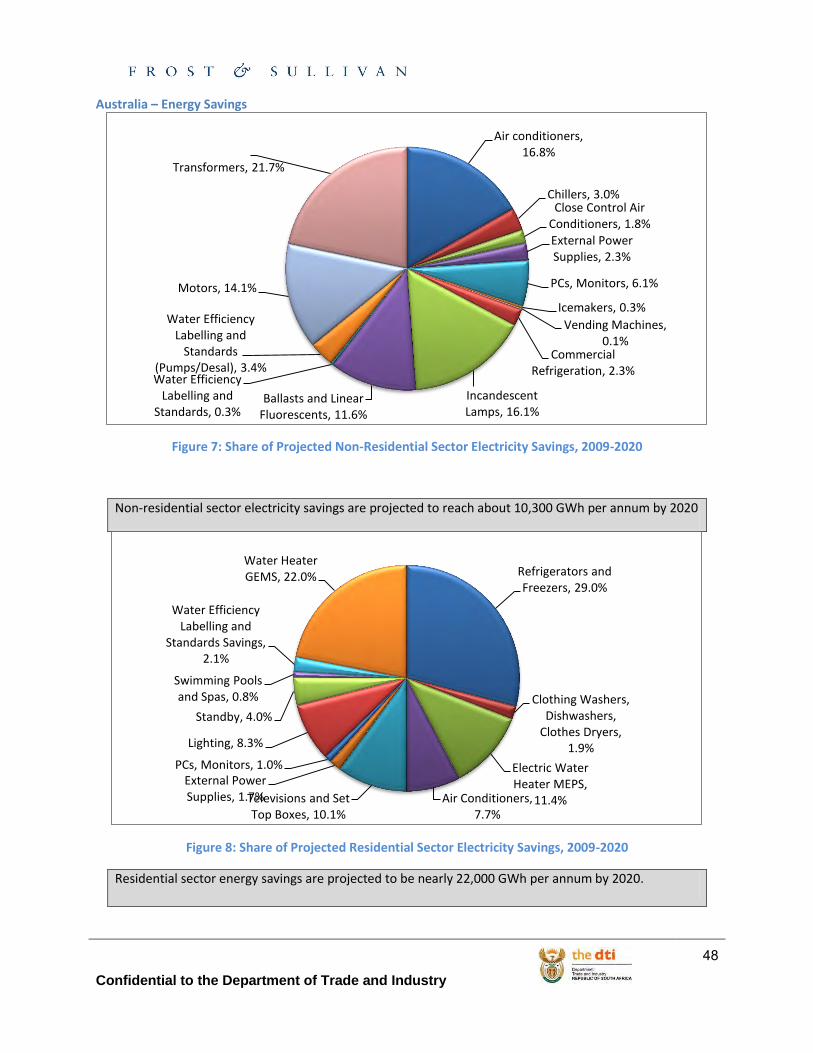
Confidential to the Department of Trade and Industry
48
Australia – Energy Savings
Figure 7: Share of Projected Non-Residential Sector Electricity Savings, 2009-2020
Non-residential sector electricity savings are projected to reach about 10,300 GWh per annum by 2020
Figure 8: Share of Projected Residential Sector Electricity Savings, 2009-2020
Residential sector energy savings are projected to be nearly 22,000 GWh per annum by 2020.
Air conditioners, 16.8%
Chillers, 3.0% Close Control Air
Conditioners, 1.8%
External Power Supplies, 2.3%
PCs, Monitors, 6.1%
Icemakers, 0.3%
Vending Machines, 0.1%
Commercial Refrigeration, 2.3%
Incandescent Lamps, 16.1%
Ballasts and Linear Fluorescents, 11.6%
Water Efficiency Labelling and
Standards, 0.3%
Water Efficiency Labelling and
Standards (Pumps/Desal), 3.4%
Motors, 14.1%
Transformers, 21.7%
Refrigerators and Freezers, 29.0%
Clothing Washers, Dishwashers,
Clothes Dryers, 1.9%
Electric Water Heater MEPS,
11.4% Air Conditioners, 7.7%
Televisions and Set Top Boxes, 10.1%
External Power Supplies, 1.7%
PCs, Monitors, 1.0%
Lighting, 8.3%
Standby, 4.0%
Swimming Pools and Spas, 0.8%
Water Efficiency Labelling and
Standards Savings, 2.1%
Water Heater GEMS, 22.0%
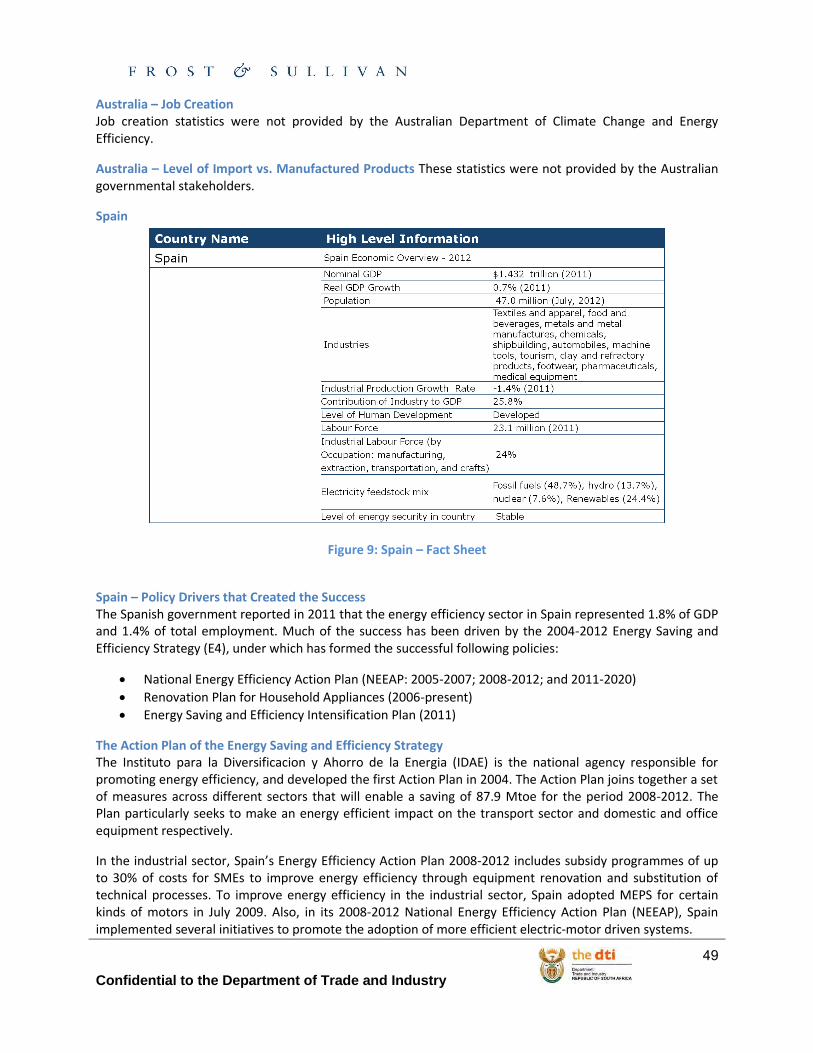
Confidential to the Department of Trade and Industry
49
Australia – Job Creation Job creation statistics were not provided by the Australian Department of Climate Change and Energy Efficiency.
Australia – Level of Import vs. Manufactured Products These statistics were not provided by the Australian governmental stakeholders.
Spain
Figure 9: Spain – Fact Sheet
Spain – Policy Drivers that Created the Success The Spanish government reported in 2011 that the energy efficiency sector in Spain represented 1.8% of GDP and 1.4% of total employment. Much of the success has been driven by the 2004-2012 Energy Saving and Efficiency Strategy (E4), under which has formed the successful following policies:
National Energy Efficiency Action Plan (NEEAP: 2005-2007; 2008-2012; and 2011-2020)
Renovation Plan for Household Appliances (2006-present)
Energy Saving and Efficiency Intensification Plan (2011)
The Action Plan of the Energy Saving and Efficiency Strategy The Instituto para la Diversificacion y Ahorro de la Energia (IDAE) is the national agency responsible for promoting energy efficiency, and developed the first Action Plan in 2004. The Action Plan joins together a set of measures across different sectors that will enable a saving of 87.9 Mtoe for the period 2008-2012. The Plan particularly seeks to make an energy efficient impact on the transport sector and domestic and office equipment respectively.
In the industrial sector, Spain’s Energy Efficiency Action Plan 2008‐2012 includes subsidy programmes of up to 30% of costs for SMEs to improve energy efficiency through equipment renovation and substitution of technical processes. To improve energy efficiency in the industrial sector, Spain adopted MEPS for certain kinds of motors in July 2009. Also, in its 2008‐2012 National Energy Efficiency Action Plan (NEEAP), Spain implemented several initiatives to promote the adoption of more efficient electric‐motor driven systems.
Confidential to the Department of Trade and Industry
50
The Action Plan has effectively implemented more than 1,325,500 actions, with measures such as the Renovation Plan for Household Appliances involving 1.25 million operations, the 53,500 actions of the transport sector, the 15,000 of the buildings sector; 3,000 operations in the industrial sector; over 500 actions in agriculture, and another 500 in energy transformation.
Renovation Plan for Household Appliances (Plan Renove de Electrodomésticos) The Renove Plan subsidizes the replacement of inefficient appliances with efficient new ones (labelled A or higher). The Plan commenced in 2006, and by 2008 had replaced 1.8 million appliances, such as washing machines, fridges, freezers, dishwashers and ovens. Depending on the province, the Renove Plan subsidizes between €80-145 per appliance for end-users and €2.50 per sale for retailers.
In 2012, the Renove Plan is expanding to include additional appliances such as gas ovens, hobs, and potentially air conditioners. To date, the Renove Plan has enabled the substitution of more than 3 million appliances, the electricity savings equivalent of 4% of Spanish households.
Spain – Challenges The IDAE faces the challenge of mobilizing more than 30 different measures in a coordinated and simultaneous manner, stimulating the wide spectrum of sectors of the economy, using new and innovative measures to achieve their objectives.
The Plan of Intensification of Energy Saving and Efficiency includes a financial line of €600 million to ESCOs, through the Institute of Official Credit (ICO). IDAE contributes €30 million for insurance. This financing line has overcome a main barrier to ESCOs’ project development.
While most energy efficiency‐related EU directives have been transposed in the Spanish legislation, a sustained policy implementation effort is needed. Enforcement is particularly important to ensure both the maximisation of energy savings and the credibility of the schemes Comprehensive legal and physical capacity will be needed to adequately enforce policy measures and maximise their effectiveness
Spain could further examine barriers to the optimisation of energy efficiency in electric motor‐driven systems and implement comprehensive policy portfolios aimed at overcoming such barriers. Other policies to help industrial energy efficiency include implementing formalised energy management policies at the company level.
Spain – Energy Savings and Benefit to the Economy Between 2005 and 2010, the Spanish EE sector, under the IDAE, received a budget of €1.5 billion. This resulted in a saving of 2,305 ktoe/year in final energy and 3,221 ktep/year in primary energy consumption. The Energy Saving and Efficiency Intensification Plan (2011) implies a yearly energy saving of 3,241 ktep.
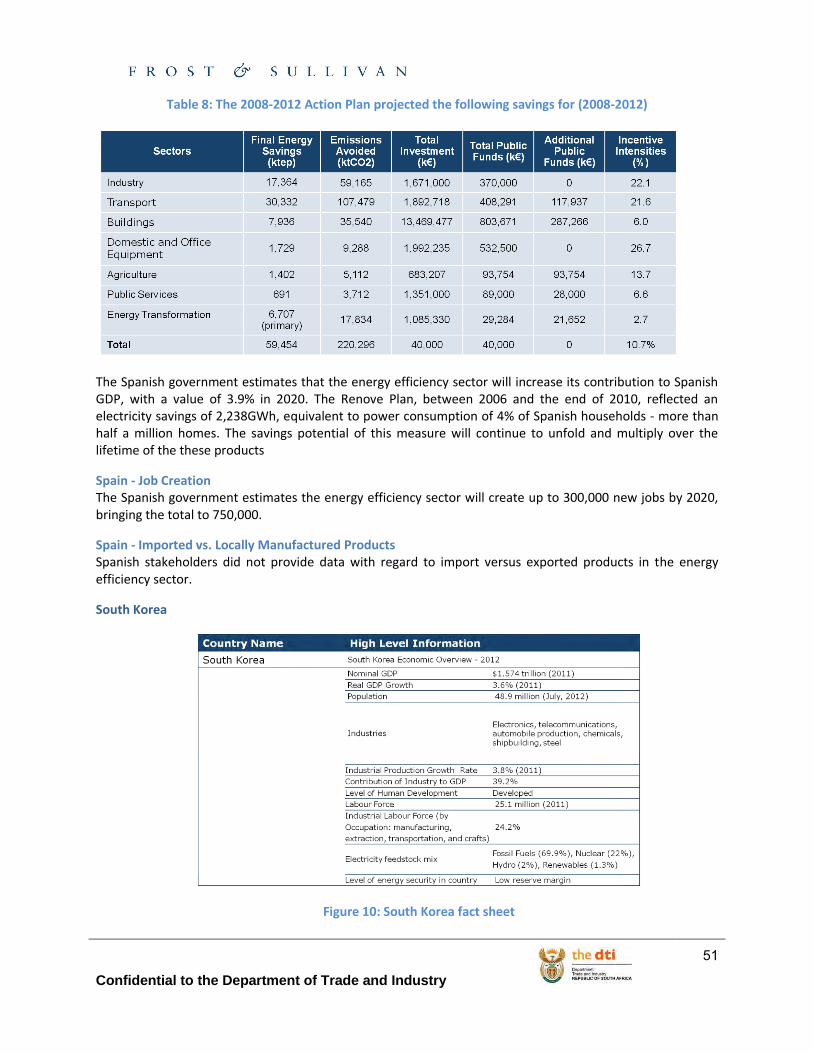
Confidential to the Department of Trade and Industry
51
Table 8: The 2008-2012 Action Plan projected the following savings for (2008-2012)
The Spanish government estimates that the energy efficiency sector will increase its contribution to Spanish GDP, with a value of 3.9% in 2020. The Renove Plan, between 2006 and the end of 2010, reflected an electricity savings of 2,238GWh, equivalent to power consumption of 4% of Spanish households - more than half a million homes. The savings potential of this measure will continue to unfold and multiply over the lifetime of the these products
Spain - Job Creation The Spanish government estimates the energy efficiency sector will create up to 300,000 new jobs by 2020, bringing the total to 750,000.
Spain - Imported vs. Locally Manufactured Products Spanish stakeholders did not provide data with regard to import versus exported products in the energy efficiency sector.
South Korea
Figure 10: South Korea fact sheet

Confidential to the Department of Trade and Industry
52
South Korea – Introduction National efforts for energy efficiency improvements in South Korea have been focused on four major sectors: industry, transportation, buildings and appliances and equipment.
In particular, energy efficiency in the Appliances and Equipment sector is seen as critical, as these items are seen as the base of all energy efficiency.
The Ministry of Commerce, Industry and Energy (MOCIE), through the Korea Energy Management Corporation (KEMCO), operates three primary energy efficiency schemes that are employed with the aim of ensuring energy efficiency improvements in the Appliances and Equipment sector in South Korea: the Energy Efficiency Standards and Labelling Program, the High-Efficiency Appliance Certification Program and the e-Standby Program.
The objective of these programs is to stimulate manufacturers to improve their products' efficiency by giving incentives and to induce consumers to purchase more energy efficient products available in the market place.
South Korea – Policies and Programs Minimum Energy Performance Standards (MEPS)
The Minimum Energy Performance Standards (MEPS) are the minimum energy efficiency standards suggested by Government. Products which fall below the minimum energy performance requirement, as set out by the MEPS, are not permitted to be manufactured or sold. The purpose of the MEPS is to halt the spread of low efficiency products and promote manufacturers’ technical development by controlling the minimum required efficiency standard. In the case of a violation, a fine may be levied.
Energy Efficiency Standards & Labelling Program
Initiated in 1992, the Energy Efficiency Standards and Labelling Program targets products with high energy consumption. High energy consuming products are rated from grade 5 to 1, and the production and sale of products that fall below the 5th grade, as determined by MEPS, is prohibited. 1st grade products save approximately 30 to 40% more energy than 5th grade products.
The purpose of the program is to encourage energy saving by enabling consumers to easily identify high energy efficiency products. It also encourages manufacturers and importers to produce and sell energy efficient products. This program is South Korea’s core energy efficiency management scheme and all domestic manufacturers and importers must adhere to this program. The Energy Efficiency label is attached to products, enabling consumers to easily identify energy efficient products.
The Korea Energy Management Corporation (KEMCO), delegated by the Ministry of Knowledge Economy (MKE), operates the program in partnership with 500 household appliance, lighting equipment and automobile manufacturers. Currently, 32 products with over 20,000 models are registered.
High-Efficiency Appliance Certification Program
The High-Efficiency Appliance Certification Program is an efficiency certification system that certifies products that meet a set standard, as a means to encourage the supply of high efficiency energy appliances. Initiated in 1996, this system is operated by attaching a High-Efficiency Appliance label to the certificated product and issuing a High-Efficiency Appliance certificate.
Financial support is provided for high-efficiency LED lighting and few other high-efficiency appliances. In order to qualify, products must satisfy the energy efficiency and quality certification standards of designated testing institutes. The Korea Energy Management Corporation (KEMCO), delegated by Ministry of Knowledge
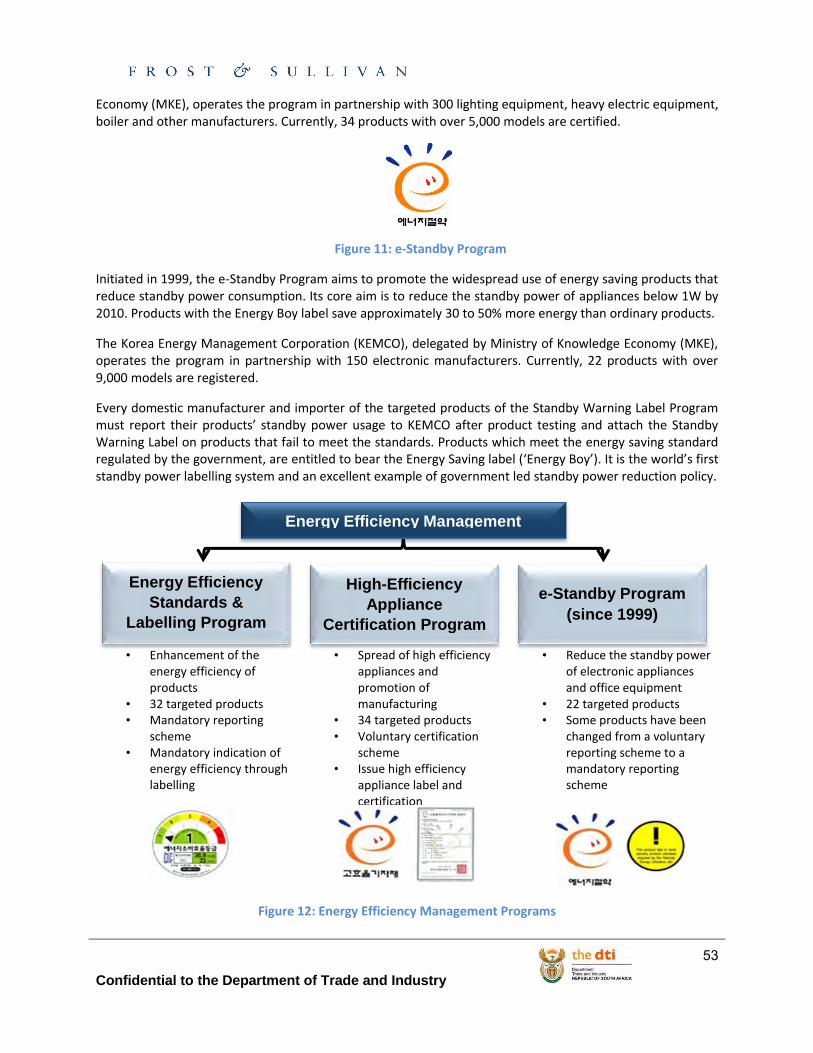
Confidential to the Department of Trade and Industry
53
Economy (MKE), operates the program in partnership with 300 lighting equipment, heavy electric equipment, boiler and other manufacturers. Currently, 34 products with over 5,000 models are certified.
Figure 11: e-Standby Program
Initiated in 1999, the e-Standby Program aims to promote the widespread use of energy saving products that reduce standby power consumption. Its core aim is to reduce the standby power of appliances below 1W by 2010. Products with the Energy Boy label save approximately 30 to 50% more energy than ordinary products.
The Korea Energy Management Corporation (KEMCO), delegated by Ministry of Knowledge Economy (MKE), operates the program in partnership with 150 electronic manufacturers. Currently, 22 products with over 9,000 models are registered.
Every domestic manufacturer and importer of the targeted products of the Standby Warning Label Program must report their products’ standby power usage to KEMCO after product testing and attach the Standby Warning Label on products that fail to meet the standards. Products which meet the energy saving standard regulated by the government, are entitled to bear the Energy Saving label (‘Energy Boy’). It is the world’s first standby power labelling system and an excellent example of government led standby power reduction policy.
Figure 12: Energy Efficiency Management Programs
Energy Efficiency Management
Programs
Energy Efficiency
Standards &
Labelling Program
(including MEPS)
e-Standby Program (since 1999)
High-Efficiency
Appliance
Certification Program (since 1996)
• Enhancement of the energy efficiency of products
• 32 targeted products • Mandatory reporting
scheme • Mandatory indication of
energy efficiency through labelling
• Spread of high efficiency appliances and promotion of manufacturing
• 34 targeted products • Voluntary certification
scheme • Issue high efficiency
appliance label and certification
• Reduce the standby power of electronic appliances and office equipment
• 22 targeted products • Some products have been
changed from a voluntary reporting scheme to a mandatory reporting scheme
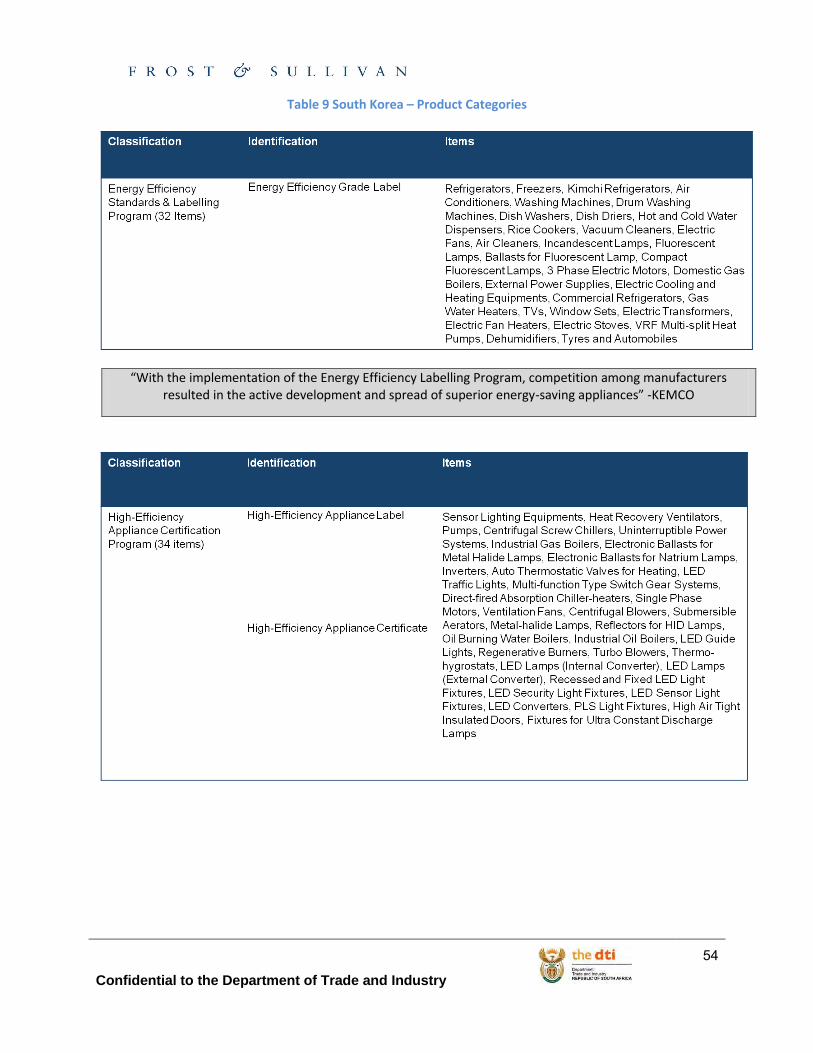
Confidential to the Department of Trade and Industry
54
Table 9 South Korea – Product Categories
“With the implementation of the Energy Efficiency Labelling Program, competition among manufacturers resulted in the active development and spread of superior energy-saving appliances” -KEMCO
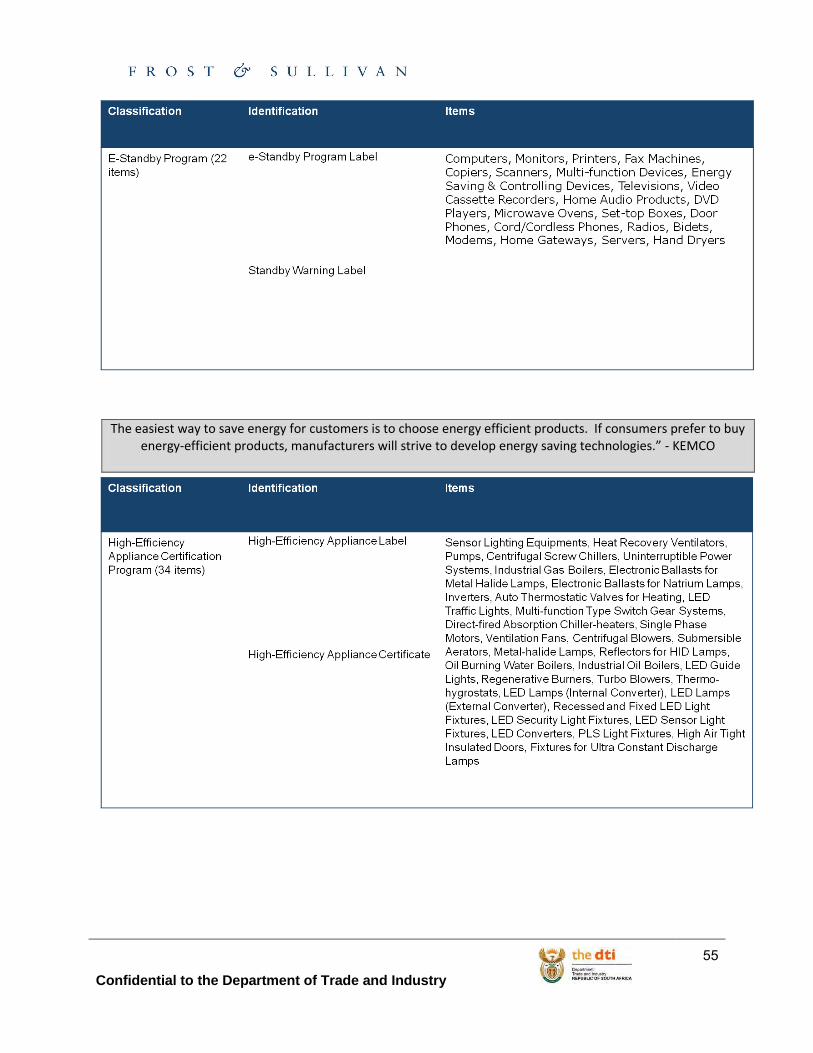
Confidential to the Department of Trade and Industry
55
The easiest way to save energy for customers is to choose energy efficient products. If consumers prefer to buy energy-efficient products, manufacturers will strive to develop energy saving technologies.” - KEMCO

Confidential to the Department of Trade and Industry
56
South Korea – Policies and Programs Project on supplying one million Green Homes
This project has been implemented in order to reach the target of 1 million ‘renewable energy’ houses (green homes) by 2020.
Specifically, part of the installation costs are subsidized when any renewable energy sources are installed in a house/apartment.
Table 10: South Korea- Key Supporting Mechanisms for Industry
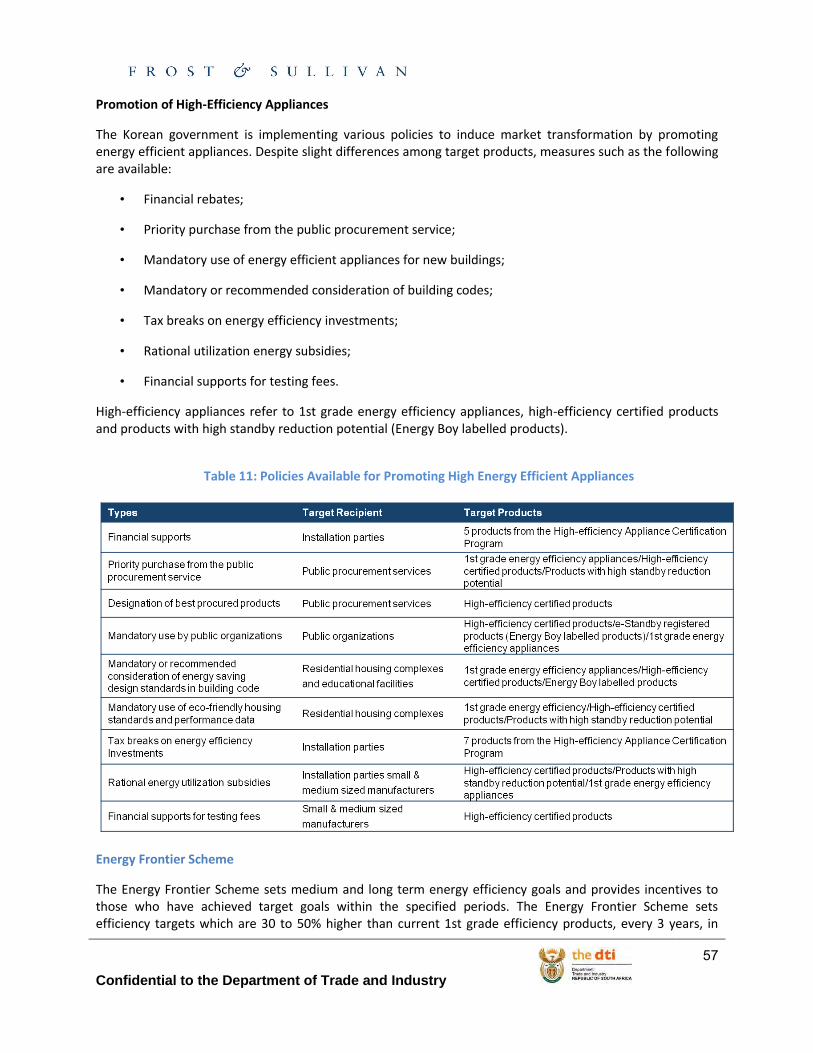
Confidential to the Department of Trade and Industry
57
Promotion of High-Efficiency Appliances
The Korean government is implementing various policies to induce market transformation by promoting energy efficient appliances. Despite slight differences among target products, measures such as the following are available:
• Financial rebates;
• Priority purchase from the public procurement service;
• Mandatory use of energy efficient appliances for new buildings;
• Mandatory or recommended consideration of building codes;
• Tax breaks on energy efficiency investments;
• Rational utilization energy subsidies;
• Financial supports for testing fees.
High-efficiency appliances refer to 1st grade energy efficiency appliances, high-efficiency certified products and products with high standby reduction potential (Energy Boy labelled products).
Table 11: Policies Available for Promoting High Energy Efficient Appliances
Energy Frontier Scheme
The Energy Frontier Scheme sets medium and long term energy efficiency goals and provides incentives to those who have achieved target goals within the specified periods. The Energy Frontier Scheme sets efficiency targets which are 30 to 50% higher than current 1st grade efficiency products, every 3 years, in
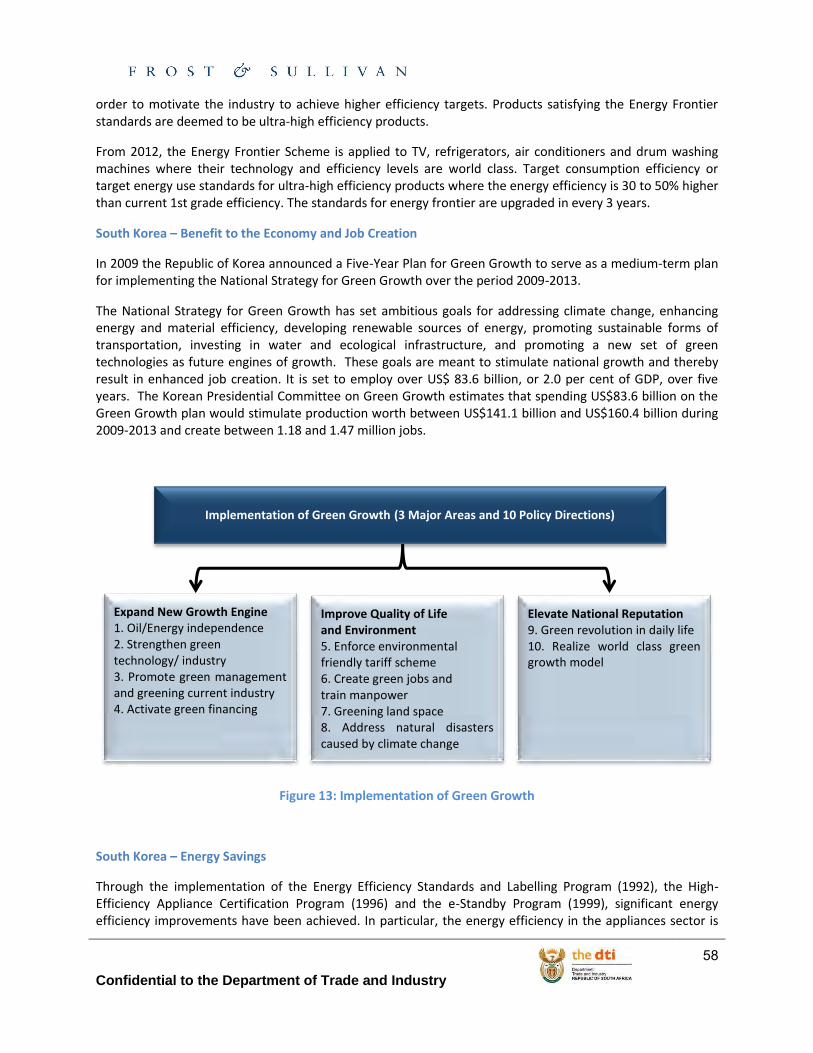
Confidential to the Department of Trade and Industry
58
order to motivate the industry to achieve higher efficiency targets. Products satisfying the Energy Frontier standards are deemed to be ultra-high efficiency products.
From 2012, the Energy Frontier Scheme is applied to TV, refrigerators, air conditioners and drum washing machines where their technology and efficiency levels are world class. Target consumption efficiency or target energy use standards for ultra-high efficiency products where the energy efficiency is 30 to 50% higher than current 1st grade efficiency. The standards for energy frontier are upgraded in every 3 years.
South Korea – Benefit to the Economy and Job Creation
In 2009 the Republic of Korea announced a Five-Year Plan for Green Growth to serve as a medium-term plan for implementing the National Strategy for Green Growth over the period 2009-2013.
The National Strategy for Green Growth has set ambitious goals for addressing climate change, enhancing energy and material efficiency, developing renewable sources of energy, promoting sustainable forms of transportation, investing in water and ecological infrastructure, and promoting a new set of green technologies as future engines of growth. These goals are meant to stimulate national growth and thereby result in enhanced job creation. It is set to employ over US$ 83.6 billion, or 2.0 per cent of GDP, over five years. The Korean Presidential Committee on Green Growth estimates that spending US$83.6 billion on the Green Growth plan would stimulate production worth between US$141.1 billion and US$160.4 billion during 2009-2013 and create between 1.18 and 1.47 million jobs.
Figure 13: Implementation of Green Growth
South Korea – Energy Savings
Through the implementation of the Energy Efficiency Standards and Labelling Program (1992), the High-Efficiency Appliance Certification Program (1996) and the e-Standby Program (1999), significant energy efficiency improvements have been achieved. In particular, the energy efficiency in the appliances sector is
Implementation of Green Growth (3 Major Areas and 10 Policy Directions)
Expand New Growth Engine 1. Oil/Energy independence 2. Strengthen green technology/ industry 3. Promote green management and greening current industry 4. Activate green financing
Elevate National Reputation 9. Green revolution in daily life 10. Realize world class green growth model
Improve Quality of Life and Environment 5. Enforce environmental friendly tariff scheme 6. Create green jobs and train manpower 7. Greening land space 8. Address natural disasters caused by climate change
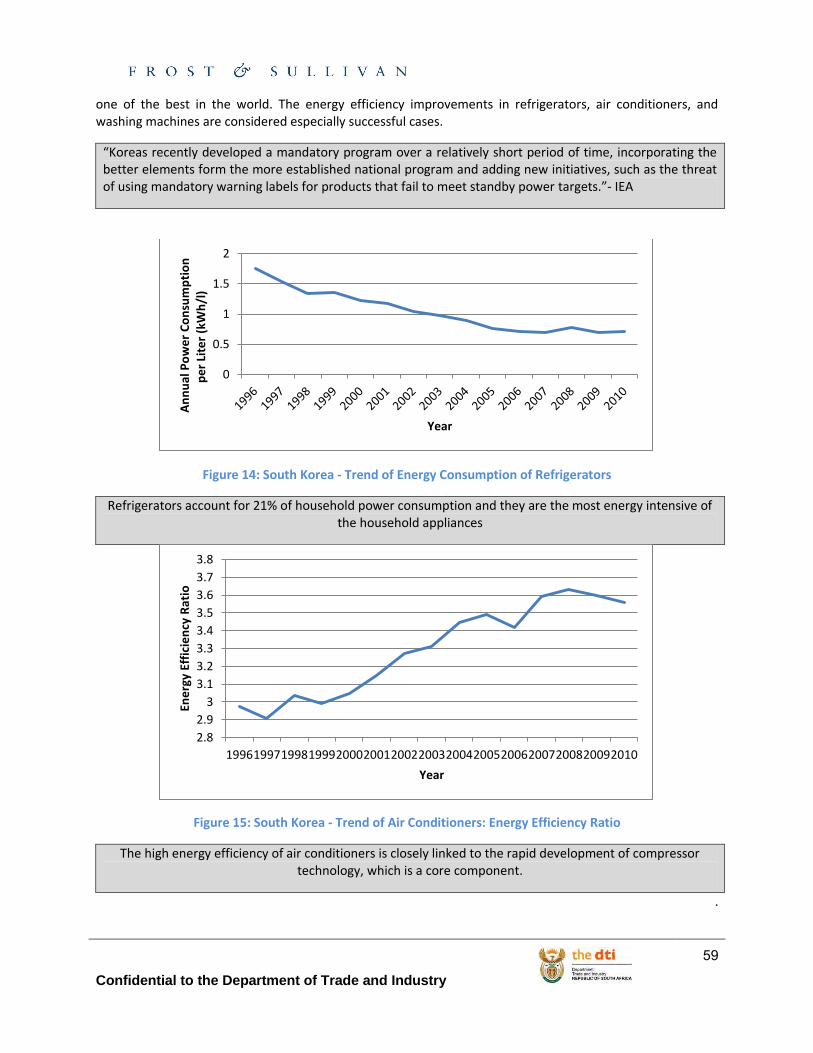
Confidential to the Department of Trade and Industry
59
one of the best in the world. The energy efficiency improvements in refrigerators, air conditioners, and washing machines are considered especially successful cases.
“Koreas recently developed a mandatory program over a relatively short period of time, incorporating the better elements form the more established national program and adding new initiatives, such as the threat of using mandatory warning labels for products that fail to meet standby power targets.”- IEA
Figure 14: South Korea - Trend of Energy Consumption of Refrigerators
Refrigerators account for 21% of household power consumption and they are the most energy intensive of the household appliances
Figure 15: South Korea - Trend of Air Conditioners: Energy Efficiency Ratio
The high energy efficiency of air conditioners is closely linked to the rapid development of compressor technology, which is a core component.
.
0
0.5
1
1.5
2
An
nu
al P
ow
er
Co
nsu
mp
tio
n
pe
r Li
ter
(kW
h/l
)
Year
2.8
2.9
3
3.1
3.2
3.3
3.4
3.5
3.6
3.7
3.8
199619971998199920002001200220032004200520062007200820092010
Ene
rgy
Effi
cie
ncy
Rat
io
Year
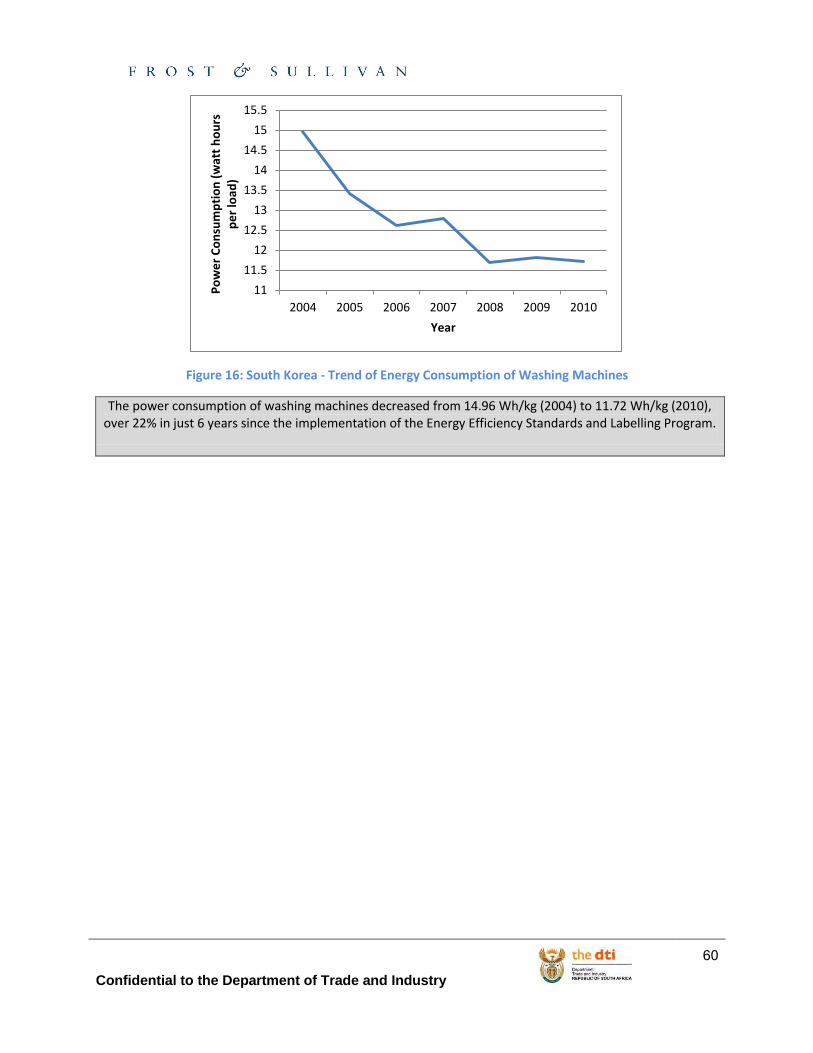
Confidential to the Department of Trade and Industry
60
Figure 16: South Korea - Trend of Energy Consumption of Washing Machines
The power consumption of washing machines decreased from 14.96 Wh/kg (2004) to 11.72 Wh/kg (2010), over 22% in just 6 years since the implementation of the Energy Efficiency Standards and Labelling Program.
11
11.5
12
12.5
13
13.5
14
14.5
15
15.5
2004 2005 2006 2007 2008 2009 2010
Po
we
r C
on
sum
pti
on
(w
att
ho
urs
p
er
load
)
Year
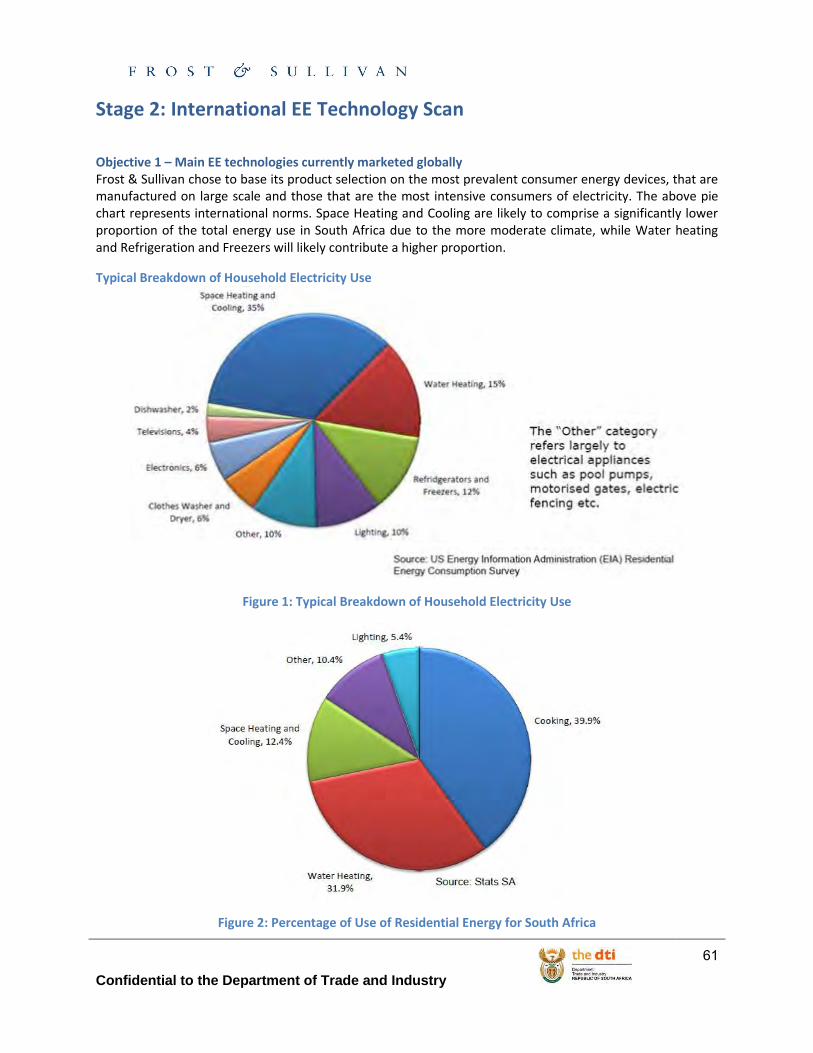
Confidential to the Department of Trade and Industry
61
Stage 2: International EE Technology Scan
Objective 1 – Main EE technologies currently marketed globally Frost & Sullivan chose to base its product selection on the most prevalent consumer energy devices, that are manufactured on large scale and those that are the most intensive consumers of electricity. The above pie chart represents international norms. Space Heating and Cooling are likely to comprise a significantly lower proportion of the total energy use in South Africa due to the more moderate climate, while Water heating and Refrigeration and Freezers will likely contribute a higher proportion.
Typical Breakdown of Household Electricity Use
Figure 1: Typical Breakdown of Household Electricity Use
Figure 2: Percentage of Use of Residential Energy for South Africa
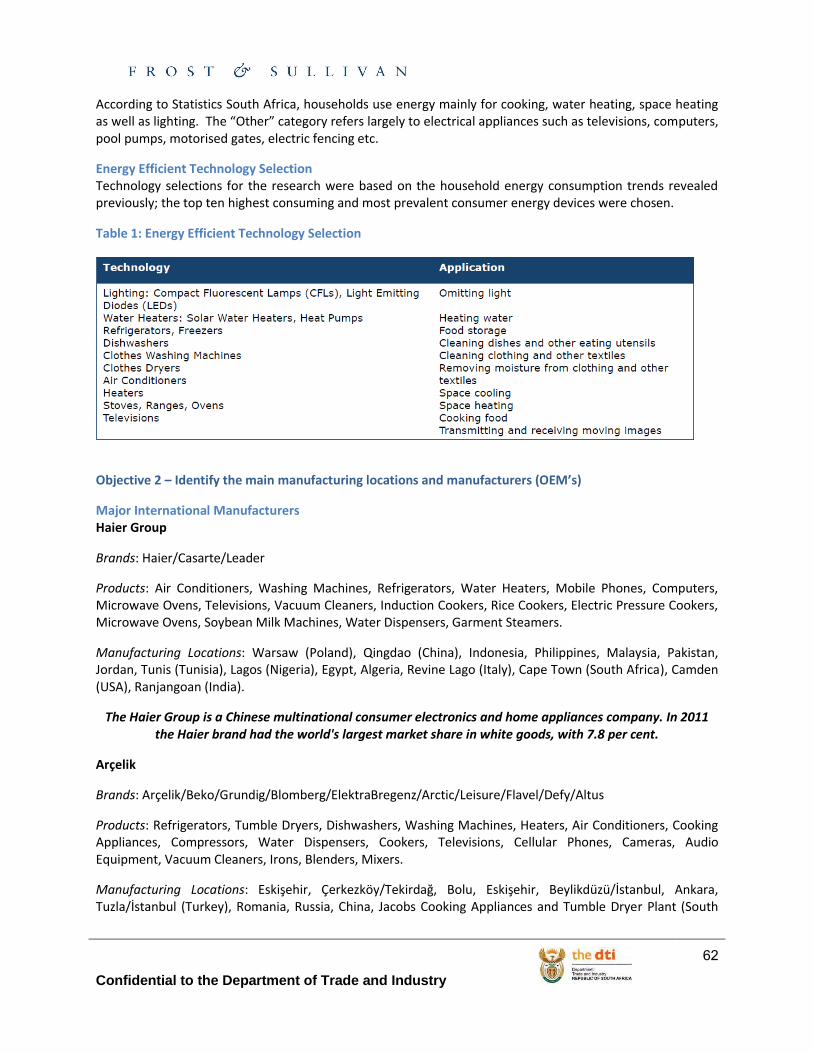
Confidential to the Department of Trade and Industry
62
According to Statistics South Africa, households use energy mainly for cooking, water heating, space heating as well as lighting. The “Other” category refers largely to electrical appliances such as televisions, computers, pool pumps, motorised gates, electric fencing etc.
Energy Efficient Technology Selection Technology selections for the research were based on the household energy consumption trends revealed previously; the top ten highest consuming and most prevalent consumer energy devices were chosen.
Table 1: Energy Efficient Technology Selection
Objective 2 – Identify the main manufacturing locations and manufacturers (OEM’s)
Major International Manufacturers Haier Group
Brands: Haier/Casarte/Leader
Products: Air Conditioners, Washing Machines, Refrigerators, Water Heaters, Mobile Phones, Computers, Microwave Ovens, Televisions, Vacuum Cleaners, Induction Cookers, Rice Cookers, Electric Pressure Cookers, Microwave Ovens, Soybean Milk Machines, Water Dispensers, Garment Steamers.
Manufacturing Locations: Warsaw (Poland), Qingdao (China), Indonesia, Philippines, Malaysia, Pakistan, Jordan, Tunis (Tunisia), Lagos (Nigeria), Egypt, Algeria, Revine Lago (Italy), Cape Town (South Africa), Camden (USA), Ranjangoan (India).
The Haier Group is a Chinese multinational consumer electronics and home appliances company. In 2011 the Haier brand had the world's largest market share in white goods, with 7.8 per cent.
Arçelik
Brands: Arçelik/Beko/Grundig/Blomberg/ElektraBregenz/Arctic/Leisure/Flavel/Defy/Altus
Products: Refrigerators, Tumble Dryers, Dishwashers, Washing Machines, Heaters, Air Conditioners, Cooking Appliances, Compressors, Water Dispensers, Cookers, Televisions, Cellular Phones, Cameras, Audio Equipment, Vacuum Cleaners, Irons, Blenders, Mixers.
Manufacturing Locations: Eskişehir, Çerkezköy/Tekirdağ, Bolu, Eskişehir, Beylikdüzü/İstanbul, Ankara, Tuzla/İstanbul (Turkey), Romania, Russia, China, Jacobs Cooking Appliances and Tumble Dryer Plant (South
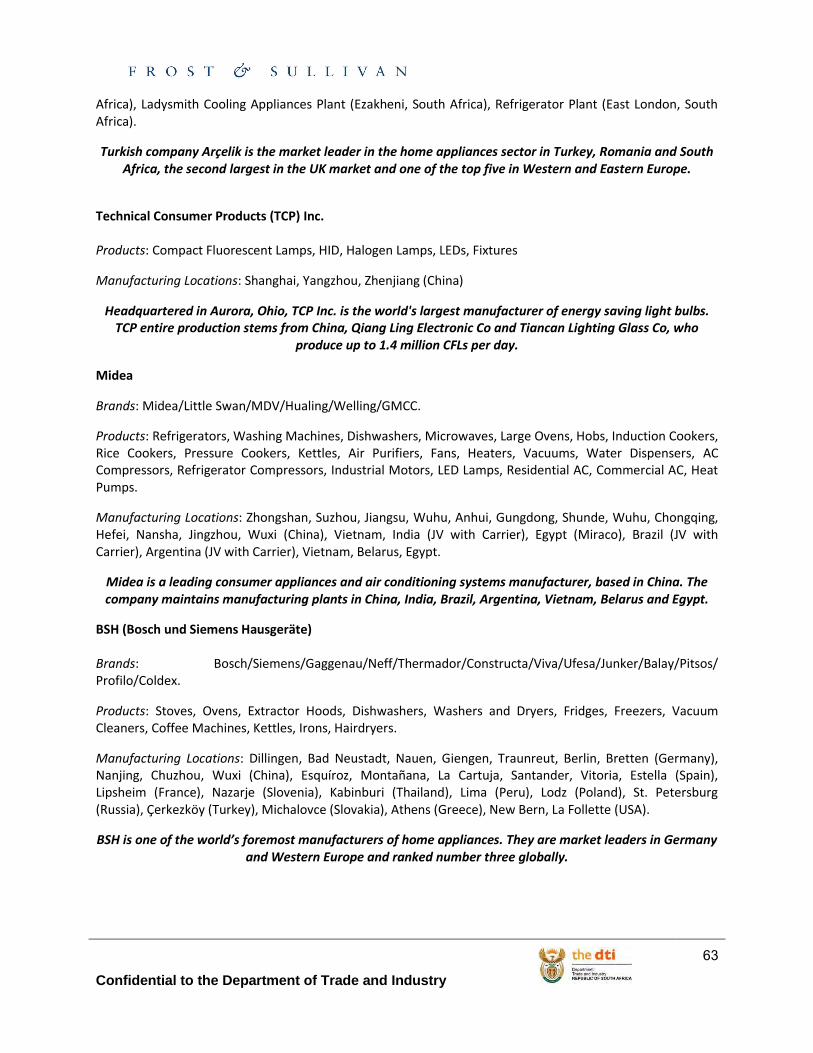
Confidential to the Department of Trade and Industry
63
Africa), Ladysmith Cooling Appliances Plant (Ezakheni, South Africa), Refrigerator Plant (East London, South Africa).
Turkish company Arçelik is the market leader in the home appliances sector in Turkey, Romania and South Africa, the second largest in the UK market and one of the top five in Western and Eastern Europe.
Technical Consumer Products (TCP) Inc. Products: Compact Fluorescent Lamps, HID, Halogen Lamps, LEDs, Fixtures
Manufacturing Locations: Shanghai, Yangzhou, Zhenjiang (China)
Headquartered in Aurora, Ohio, TCP Inc. is the world's largest manufacturer of energy saving light bulbs. TCP entire production stems from China, Qiang Ling Electronic Co and Tiancan Lighting Glass Co, who
produce up to 1.4 million CFLs per day.
Midea
Brands: Midea/Little Swan/MDV/Hualing/Welling/GMCC.
Products: Refrigerators, Washing Machines, Dishwashers, Microwaves, Large Ovens, Hobs, Induction Cookers, Rice Cookers, Pressure Cookers, Kettles, Air Purifiers, Fans, Heaters, Vacuums, Water Dispensers, AC Compressors, Refrigerator Compressors, Industrial Motors, LED Lamps, Residential AC, Commercial AC, Heat Pumps.
Manufacturing Locations: Zhongshan, Suzhou, Jiangsu, Wuhu, Anhui, Gungdong, Shunde, Wuhu, Chongqing, Hefei, Nansha, Jingzhou, Wuxi (China), Vietnam, India (JV with Carrier), Egypt (Miraco), Brazil (JV with Carrier), Argentina (JV with Carrier), Vietnam, Belarus, Egypt.
Midea is a leading consumer appliances and air conditioning systems manufacturer, based in China. The company maintains manufacturing plants in China, India, Brazil, Argentina, Vietnam, Belarus and Egypt.
BSH (Bosch und Siemens Hausgeräte) Brands: Bosch/Siemens/Gaggenau/Neff/Thermador/Constructa/Viva/Ufesa/Junker/Balay/Pitsos/ Profilo/Coldex.
Products: Stoves, Ovens, Extractor Hoods, Dishwashers, Washers and Dryers, Fridges, Freezers, Vacuum Cleaners, Coffee Machines, Kettles, Irons, Hairdryers.
Manufacturing Locations: Dillingen, Bad Neustadt, Nauen, Giengen, Traunreut, Berlin, Bretten (Germany), Nanjing, Chuzhou, Wuxi (China), Esquíroz, Montañana, La Cartuja, Santander, Vitoria, Estella (Spain), Lipsheim (France), Nazarje (Slovenia), Kabinburi (Thailand), Lima (Peru), Lodz (Poland), St. Petersburg (Russia), Çerkezköy (Turkey), Michalovce (Slovakia), Athens (Greece), New Bern, La Follette (USA).
BSH is one of the world’s foremost manufacturers of home appliances. They are market leaders in Germany and Western Europe and ranked number three globally.
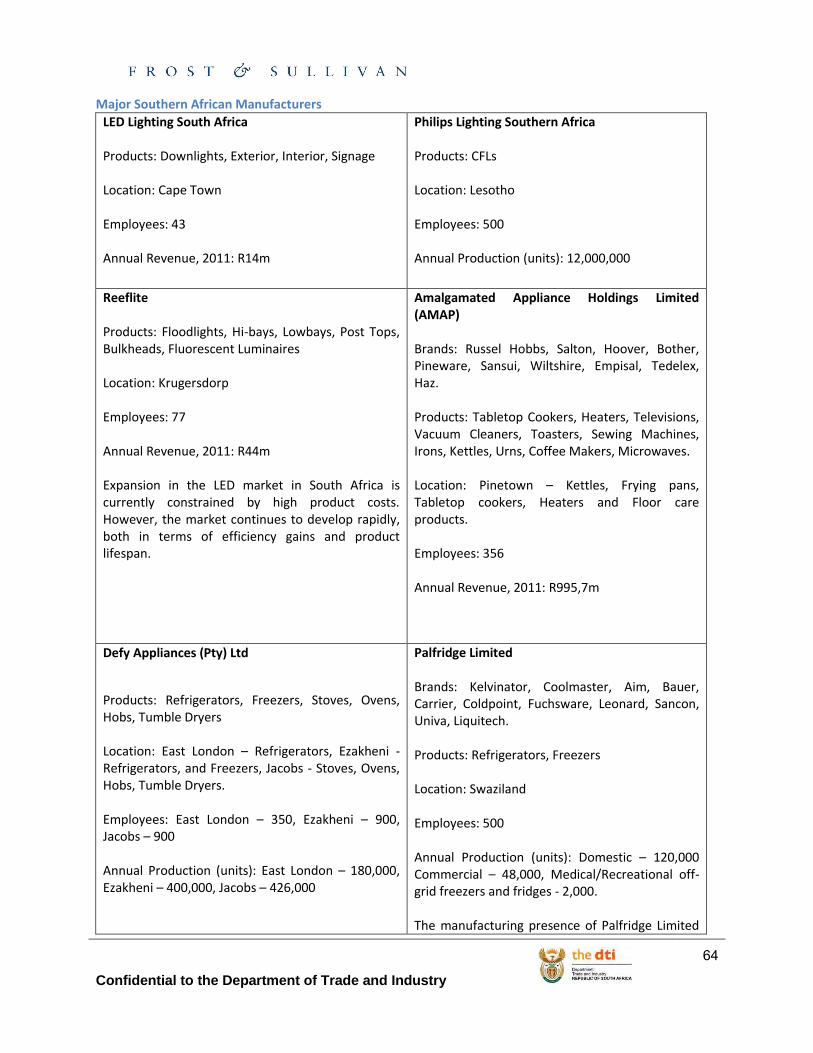
Confidential to the Department of Trade and Industry
64
Major Southern African Manufacturers
LED Lighting South Africa Products: Downlights, Exterior, Interior, Signage Location: Cape Town Employees: 43 Annual Revenue, 2011: R14m
Philips Lighting Southern Africa Products: CFLs Location: Lesotho Employees: 500 Annual Production (units): 12,000,000
Reeflite Products: Floodlights, Hi-bays, Lowbays, Post Tops, Bulkheads, Fluorescent Luminaires Location: Krugersdorp Employees: 77 Annual Revenue, 2011: R44m Expansion in the LED market in South Africa is currently constrained by high product costs. However, the market continues to develop rapidly, both in terms of efficiency gains and product lifespan.
Amalgamated Appliance Holdings Limited (AMAP) Brands: Russel Hobbs, Salton, Hoover, Bother, Pineware, Sansui, Wiltshire, Empisal, Tedelex, Haz. Products: Tabletop Cookers, Heaters, Televisions, Vacuum Cleaners, Toasters, Sewing Machines, Irons, Kettles, Urns, Coffee Makers, Microwaves. Location: Pinetown – Kettles, Frying pans, Tabletop cookers, Heaters and Floor care products. Employees: 356 Annual Revenue, 2011: R995,7m
Defy Appliances (Pty) Ltd
Products: Refrigerators, Freezers, Stoves, Ovens, Hobs, Tumble Dryers Location: East London – Refrigerators, Ezakheni -Refrigerators, and Freezers, Jacobs - Stoves, Ovens, Hobs, Tumble Dryers. Employees: East London – 350, Ezakheni – 900, Jacobs – 900 Annual Production (units): East London – 180,000, Ezakheni – 400,000, Jacobs – 426,000
Palfridge Limited Brands: Kelvinator, Coolmaster, Aim, Bauer, Carrier, Coldpoint, Fuchsware, Leonard, Sancon, Univa, Liquitech. Products: Refrigerators, Freezers Location: Swaziland Employees: 500 Annual Production (units): Domestic – 120,000 Commercial – 48,000, Medical/Recreational off-grid freezers and fridges - 2,000. The manufacturing presence of Palfridge Limited
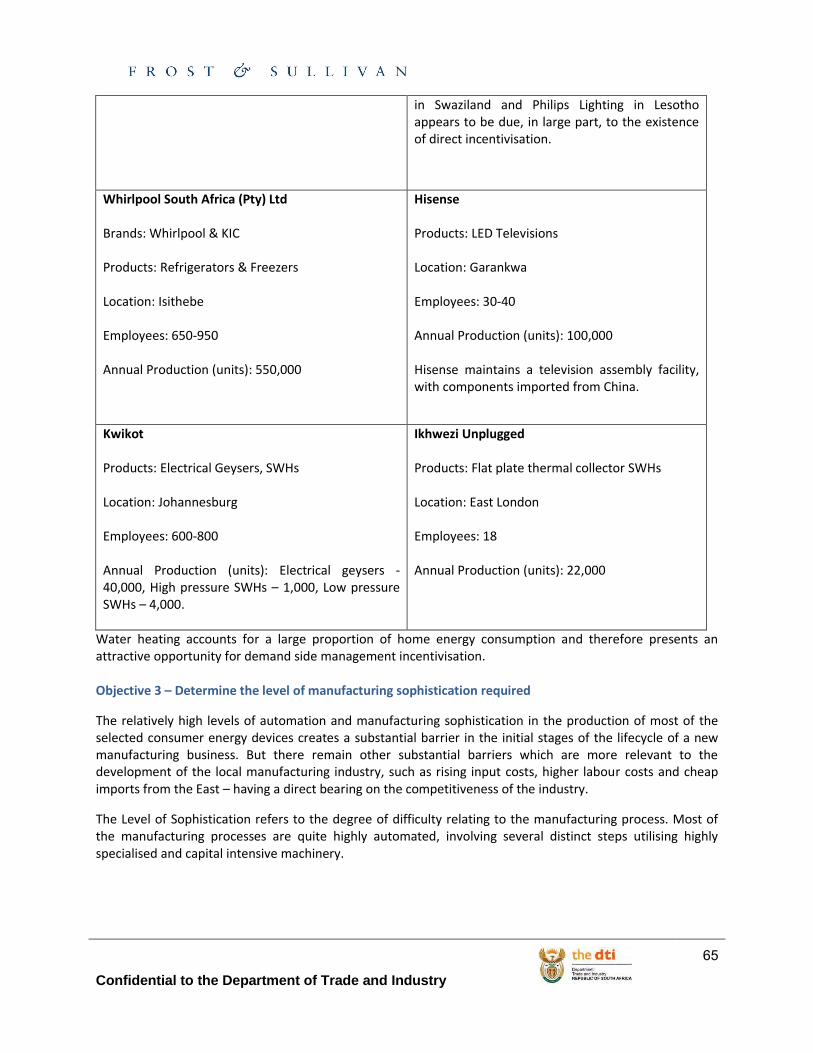
Confidential to the Department of Trade and Industry
65
in Swaziland and Philips Lighting in Lesotho appears to be due, in large part, to the existence of direct incentivisation.
Whirlpool South Africa (Pty) Ltd Brands: Whirlpool & KIC Products: Refrigerators & Freezers Location: Isithebe Employees: 650-950 Annual Production (units): 550,000
Hisense Products: LED Televisions Location: Garankwa Employees: 30-40 Annual Production (units): 100,000 Hisense maintains a television assembly facility, with components imported from China.
Kwikot Products: Electrical Geysers, SWHs Location: Johannesburg Employees: 600-800 Annual Production (units): Electrical geysers -40,000, High pressure SWHs – 1,000, Low pressure SWHs – 4,000.
Ikhwezi Unplugged Products: Flat plate thermal collector SWHs Location: East London Employees: 18 Annual Production (units): 22,000
Water heating accounts for a large proportion of home energy consumption and therefore presents an attractive opportunity for demand side management incentivisation. Objective 3 – Determine the level of manufacturing sophistication required
The relatively high levels of automation and manufacturing sophistication in the production of most of the selected consumer energy devices creates a substantial barrier in the initial stages of the lifecycle of a new manufacturing business. But there remain other substantial barriers which are more relevant to the development of the local manufacturing industry, such as rising input costs, higher labour costs and cheap imports from the East – having a direct bearing on the competitiveness of the industry.
The Level of Sophistication refers to the degree of difficulty relating to the manufacturing process. Most of the manufacturing processes are quite highly automated, involving several distinct steps utilising highly specialised and capital intensive machinery.
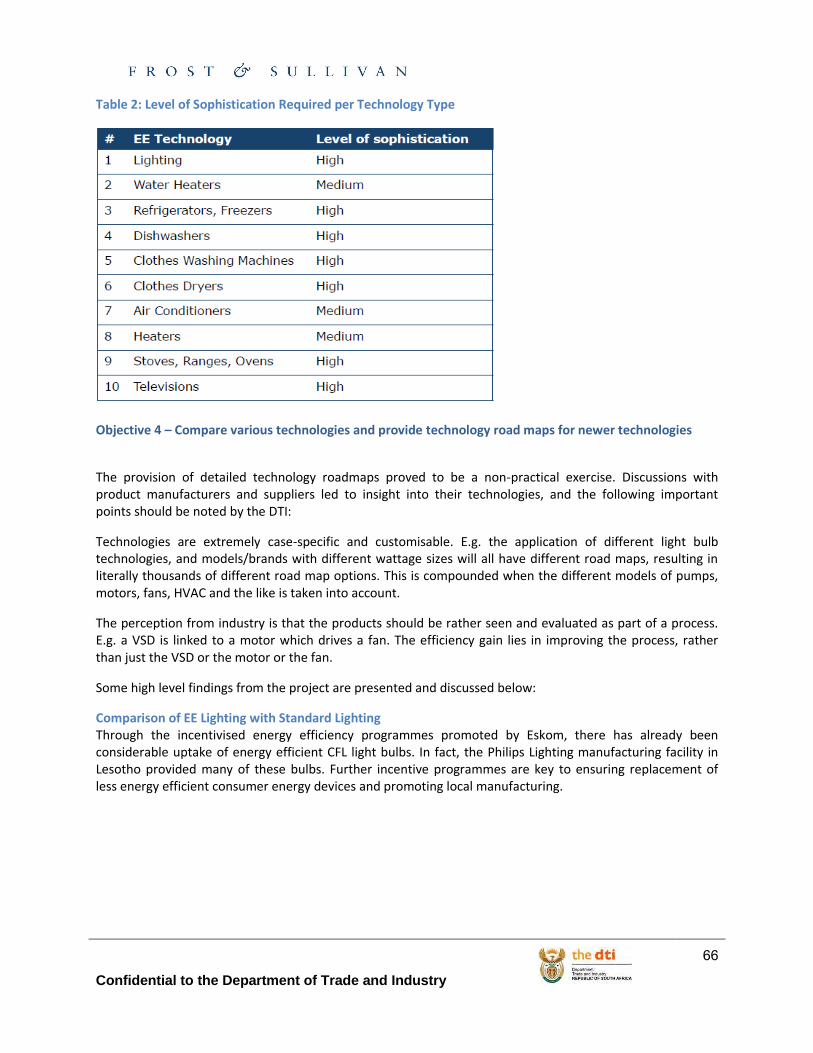
Confidential to the Department of Trade and Industry
66
Table 2: Level of Sophistication Required per Technology Type
Objective 4 – Compare various technologies and provide technology road maps for newer technologies
The provision of detailed technology roadmaps proved to be a non-practical exercise. Discussions with product manufacturers and suppliers led to insight into their technologies, and the following important points should be noted by the DTI:
Technologies are extremely case-specific and customisable. E.g. the application of different light bulb technologies, and models/brands with different wattage sizes will all have different road maps, resulting in literally thousands of different road map options. This is compounded when the different models of pumps, motors, fans, HVAC and the like is taken into account.
The perception from industry is that the products should be rather seen and evaluated as part of a process. E.g. a VSD is linked to a motor which drives a fan. The efficiency gain lies in improving the process, rather than just the VSD or the motor or the fan.
Some high level findings from the project are presented and discussed below:
Comparison of EE Lighting with Standard Lighting Through the incentivised energy efficiency programmes promoted by Eskom, there has already been considerable uptake of energy efficient CFL light bulbs. In fact, the Philips Lighting manufacturing facility in Lesotho provided many of these bulbs. Further incentive programmes are key to ensuring replacement of less energy efficient consumer energy devices and promoting local manufacturing.
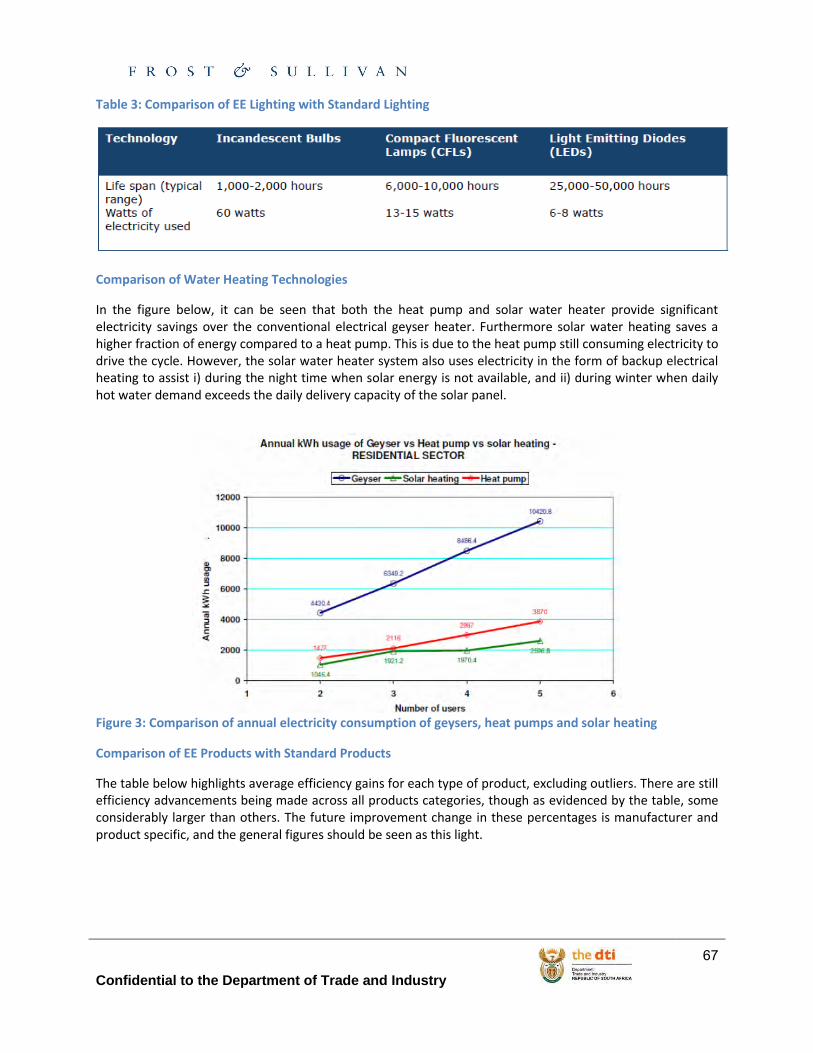
Confidential to the Department of Trade and Industry
67
Table 3: Comparison of EE Lighting with Standard Lighting
Comparison of Water Heating Technologies
In the figure below, it can be seen that both the heat pump and solar water heater provide significant electricity savings over the conventional electrical geyser heater. Furthermore solar water heating saves a higher fraction of energy compared to a heat pump. This is due to the heat pump still consuming electricity to drive the cycle. However, the solar water heater system also uses electricity in the form of backup electrical heating to assist i) during the night time when solar energy is not available, and ii) during winter when daily hot water demand exceeds the daily delivery capacity of the solar panel.
Figure 3: Comparison of annual electricity consumption of geysers, heat pumps and solar heating
Comparison of EE Products with Standard Products
The table below highlights average efficiency gains for each type of product, excluding outliers. There are still efficiency advancements being made across all products categories, though as evidenced by the table, some considerably larger than others. The future improvement change in these percentages is manufacturer and product specific, and the general figures should be seen as this light.
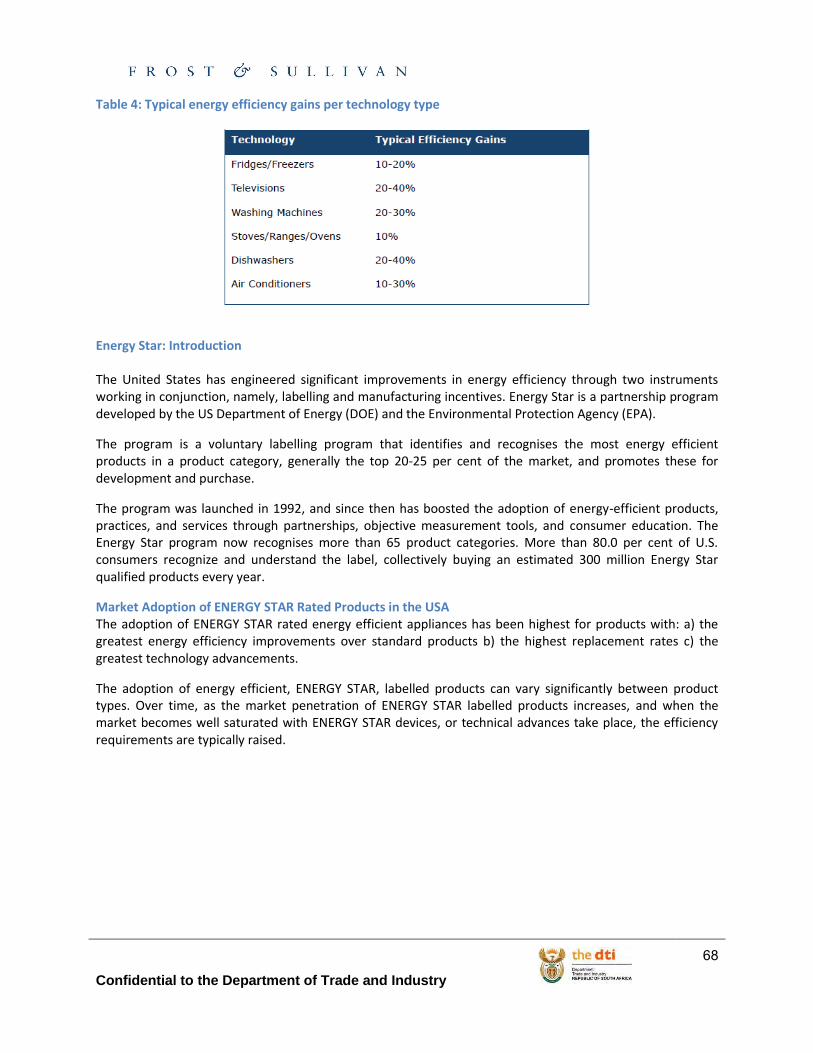
Confidential to the Department of Trade and Industry
68
Table 4: Typical energy efficiency gains per technology type
Energy Star: Introduction The United States has engineered significant improvements in energy efficiency through two instruments working in conjunction, namely, labelling and manufacturing incentives. Energy Star is a partnership program developed by the US Department of Energy (DOE) and the Environmental Protection Agency (EPA).
The program is a voluntary labelling program that identifies and recognises the most energy efficient products in a product category, generally the top 20-25 per cent of the market, and promotes these for development and purchase.
The program was launched in 1992, and since then has boosted the adoption of energy-efficient products, practices, and services through partnerships, objective measurement tools, and consumer education. The Energy Star program now recognises more than 65 product categories. More than 80.0 per cent of U.S. consumers recognize and understand the label, collectively buying an estimated 300 million Energy Star qualified products every year.
Market Adoption of ENERGY STAR Rated Products in the USA The adoption of ENERGY STAR rated energy efficient appliances has been highest for products with: a) the greatest energy efficiency improvements over standard products b) the highest replacement rates c) the greatest technology advancements.
The adoption of energy efficient, ENERGY STAR, labelled products can vary significantly between product types. Over time, as the market penetration of ENERGY STAR labelled products increases, and when the market becomes well saturated with ENERGY STAR devices, or technical advances take place, the efficiency requirements are typically raised.
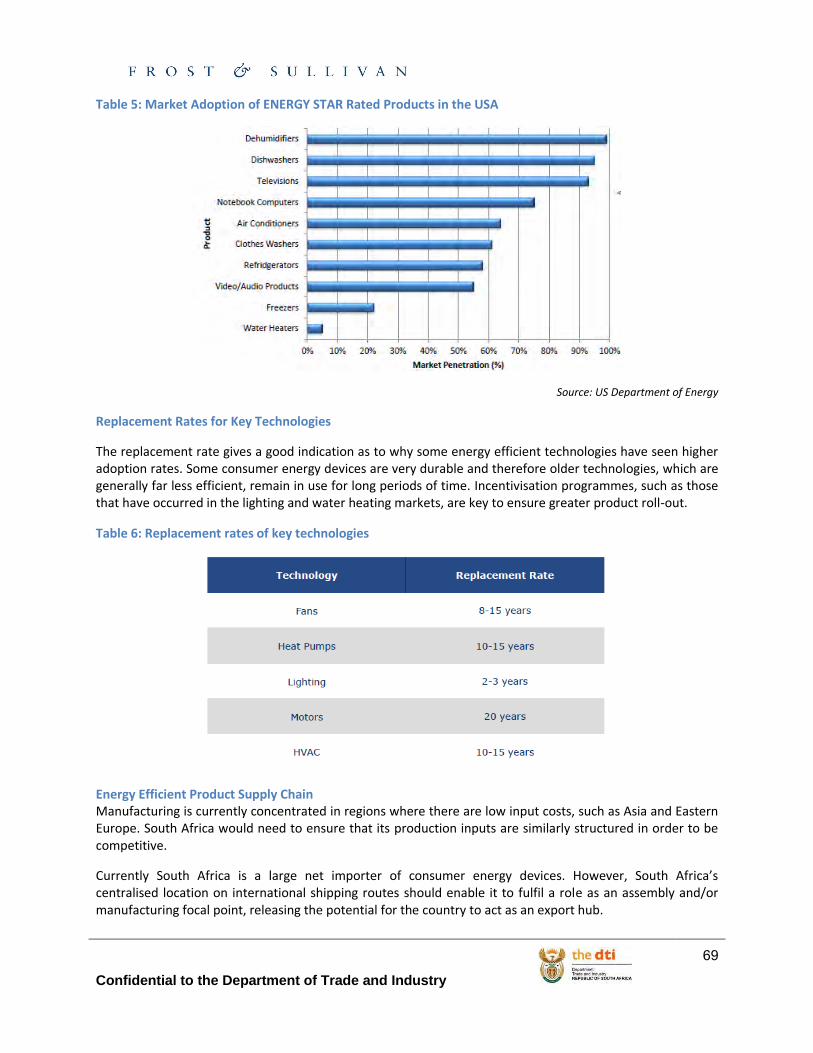
Confidential to the Department of Trade and Industry
69
Table 5: Market Adoption of ENERGY STAR Rated Products in the USA
Source: US Department of Energy
Replacement Rates for Key Technologies
The replacement rate gives a good indication as to why some energy efficient technologies have seen higher adoption rates. Some consumer energy devices are very durable and therefore older technologies, which are generally far less efficient, remain in use for long periods of time. Incentivisation programmes, such as those that have occurred in the lighting and water heating markets, are key to ensure greater product roll-out.
Table 6: Replacement rates of key technologies
Energy Efficient Product Supply Chain Manufacturing is currently concentrated in regions where there are low input costs, such as Asia and Eastern Europe. South Africa would need to ensure that its production inputs are similarly structured in order to be competitive.
Currently South Africa is a large net importer of consumer energy devices. However, South Africa’s centralised location on international shipping routes should enable it to fulfil a role as an assembly and/or manufacturing focal point, releasing the potential for the country to act as an export hub.
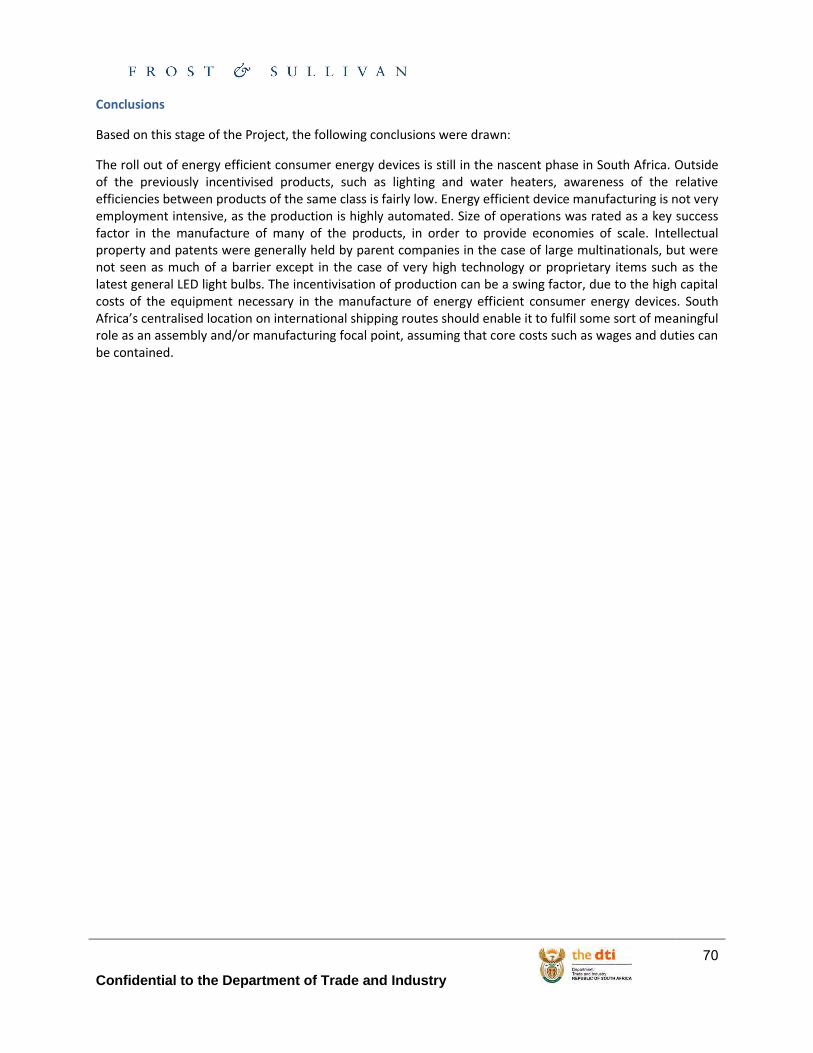
Confidential to the Department of Trade and Industry
70
Conclusions
Based on this stage of the Project, the following conclusions were drawn:
The roll out of energy efficient consumer energy devices is still in the nascent phase in South Africa. Outside of the previously incentivised products, such as lighting and water heaters, awareness of the relative efficiencies between products of the same class is fairly low. Energy efficient device manufacturing is not very employment intensive, as the production is highly automated. Size of operations was rated as a key success factor in the manufacture of many of the products, in order to provide economies of scale. Intellectual property and patents were generally held by parent companies in the case of large multinationals, but were not seen as much of a barrier except in the case of very high technology or proprietary items such as the latest general LED light bulbs. The incentivisation of production can be a swing factor, due to the high capital costs of the equipment necessary in the manufacture of energy efficient consumer energy devices. South Africa’s centralised location on international shipping routes should enable it to fulfil some sort of meaningful role as an assembly and/or manufacturing focal point, assuming that core costs such as wages and duties can be contained.
Confidential to the Department of Trade and Industry
71
Stage 3: Local Manufacturing Capability Scan For the purposes of this analysis and keeping in line with the scope of the project, the following definitions apply:
Manufacturing: The construction of components using raw materials and the subsequent assembly of these components to produce a fully-built up device.
Component Assembly: Assembly of ready-made components (outsourced) to produce a fully-built up device.
Local Manufacturers: 100 per cent South African owned manufacturing companies currently manufacturing and or assembling components to produce fully-built up devices; international manufacturers with established manufacturing and/or component assembly are excluded. With the overall objective of this analysis being to stimulate South African manufacturers, international manufacturers are classified as competitors of South African owned manufacturing companies in this study.
Current Manufacturing Landscape in South Africa for the Focus Technologies
Overview of the South African Manufacturing Industry The general consensus amongst industry stakeholders engaged with in this analysis is that the South African manufacturing industry is in a better state than that of countries that have completely abdicated production to China. The technical and competency levels of South Africa’s manufacturing industry, with particular emphasis on the ten focus technologies of this project are, however, varied. Of the ten focus technologies, the local lighting, space heating and water heating manufacturing industries are the most technologically advanced with production facilities rivalling those of their international counterparts. Over 80.0 per cent of local lighting manufacturers currently manufacture EE lighting devices and only import one or two patented components such as the lighting component. Eskom’s CFLs rollout program, initiated in 2004, has been instrumental in stimulating consumer uptake of EE light bulbs.
A significant portion of the local manufacturing of water heating technology in South Africa consists of component assembly. Local manufacturing capacity for solar water heaters is able to meet future demand. Local manufacturing for flat plate solar water heaters is currently internationally competitive. The choice of locally manufacturing, importing, or component assembling is thus a choice pertaining to individual suppliers’ set of preferences. With regards to evacuated tubes solar water heaters, the chemical process necessary is not available in South Africa, despite the potential glass facilities to do so. Economies of scale warrant the importation of these tubes to be more economical than starting a manufacturing process locally. All manufacturers manufacture products in compliance with established South African Bureau of Standards (SABS) minimum performance standards. Since the initiation of the Eskom rebate scheme in 2007, it has become mandatory for companies to be a member of the Sustainable Energy Society of Southern Africa (SESSA). In 2003 SESSA had approximately 9 members, by 2006 there were approximately 45 suppliers in industry. After the implementation of the rebate, Eskom insisted that the demand would be so great that approximately 500 suppliers would be required to meet the high demand. By mid-2010, the amount of suppliers registered with SESSA had increased to a total of approximately 700. SESSA currently has approximately 300 members.
Approximately 40.0 per cent of local space heating manufacturers manufacture EE heating appliances such as wall panel heaters and oil-filled radiator heaters that utilise the principle of natural convection to circulate heat. The remaining 60.0 per cent of local manufacturers still manufacture traditional heaters.
Confidential to the Department of Trade and Industry
72
Of the ten focus technologies analysed, the local lighting, heaters and water heaters manufacturing industries in South Africa are the most technologically advanced
Approximately 65.0 per cent of large household appliances (stoves, ranges, ovens, refrigerators, freezers, dish washers, washing machines and tumble dryers) are imported as whole products. Most international manufacturers do not manufacture products locally in South Africa but source from their international operations. Defy, Whirlpool and AEG are the only manufacturers and component assemblers of large household appliances in South Africa with production focused more on component assembly sourced from their international operations. These manufacturers only manufacture the metal and plastic casings of their appliances.
As is the case with manufacturers of large household appliances, most air conditioner manufacturers assemble imported components sourced either from international suppliers or from their international operations in the case of international manufacturers.
The South African television manufacturing industry has gained significant momentum after government imposed higher import duties on imported televisions in 2010. Companies that import fully built up or semi knock down television sets pay duties of up to 25% whereas companies that manufacture locally are exempt. International companies such as Sony, Samsung and Toshiba now find it more profitable to manufacture televisions locally and have outsourced the services of local manufacturers and government is considering extending duty protection to include LCD screens for monitors.
Production facilities of most local manufacturers have both manufacturing and component assembly capabilities
Insights from Retail Stakeholders Retailers estimate that the lighting devices product mix is currently at approximately 50.0 per cent EE lighting devices. Different retailers focus on different markets and this can be seen as the product mix of EE lighting products and conventional lighting products differ.
EE Labelling of lighting products does exist in South Africa, but this is done at the discretion of individual manufacturers. Labels display the amount of energy the consumer uses against that of the equivalent conventional lighting device. The price difference between conventional light bulbs and EE light bulbs has decreased as a direct result of the July/August 2012 price increase of conventional light bulbs; this is in line with the DoE’s aim to completely phase out conventional light bulbs by 2016. Due to pressure from industry, this phase out program is expected to commence at the end of 2013.
The in-store opinion of floor managers is that not enough is done by retailers and government to actively market, promote and sell EE products. Strategies like the replacement of conventional light bulbs with EE light bulbs by Eskom are viewed as a quick fix and not sustainable as consumers in the low LSM bracket revert back to purchasing conventional light bulbs when the Eskom installed EE light bulbs need replacement.
EE technologies are currently manufactured in South Africa but more still has to be done to improve consumer awareness of the benefits of EE technology
Market demand for EE large household appliances products is high and this is a key selling point in combination with brand type, price and functionality. Retail store managers expect this trend to continue in the medium to long term and it will be a key feature in the extended product design. Fortunately, the general perception of consumers is that large appliances consume more electricity hence the reason why electricity efficiency is one of their selection criterion. Suppliers that are well promoted and available in all large retailers include but are not limited to LG, KIC, DEFY, Samsung, Whirlpool and Hisense. There are currently no
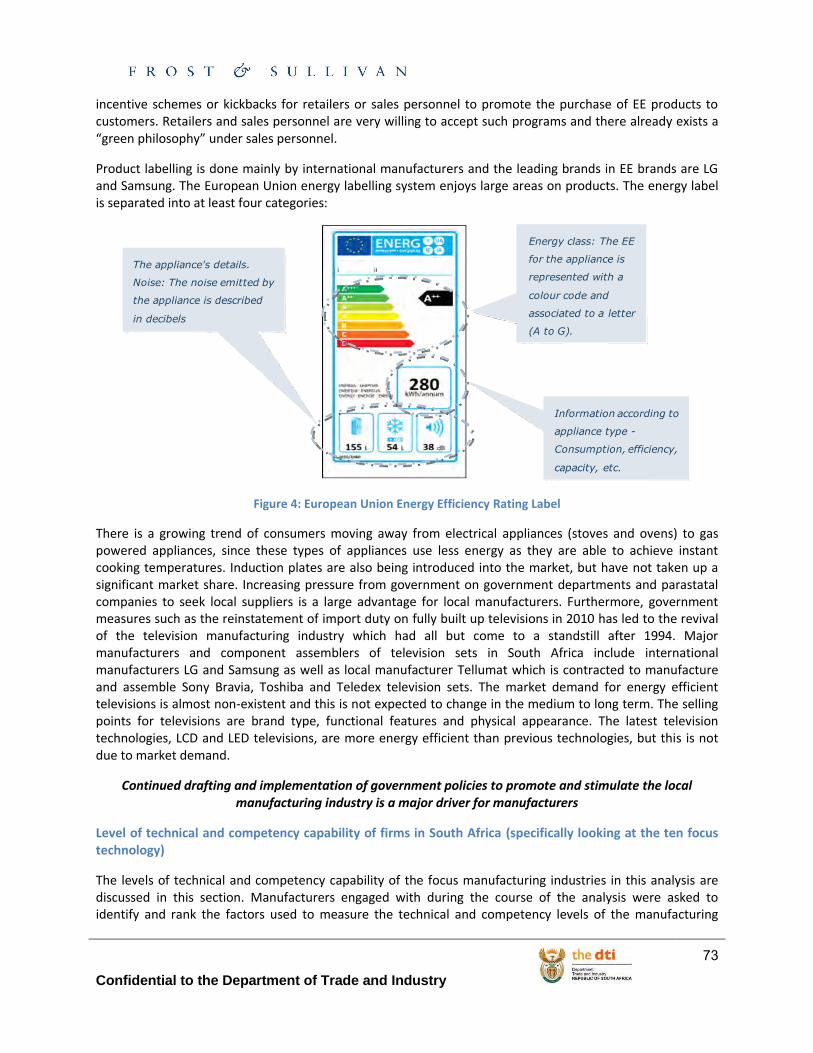
Confidential to the Department of Trade and Industry
73
incentive schemes or kickbacks for retailers or sales personnel to promote the purchase of EE products to customers. Retailers and sales personnel are very willing to accept such programs and there already exists a “green philosophy” under sales personnel.
Product labelling is done mainly by international manufacturers and the leading brands in EE brands are LG and Samsung. The European Union energy labelling system enjoys large areas on products. The energy label is separated into at least four categories:
Figure 4: European Union Energy Efficiency Rating Label
There is a growing trend of consumers moving away from electrical appliances (stoves and ovens) to gas powered appliances, since these types of appliances use less energy as they are able to achieve instant cooking temperatures. Induction plates are also being introduced into the market, but have not taken up a significant market share. Increasing pressure from government on government departments and parastatal companies to seek local suppliers is a large advantage for local manufacturers. Furthermore, government measures such as the reinstatement of import duty on fully built up televisions in 2010 has led to the revival of the television manufacturing industry which had all but come to a standstill after 1994. Major manufacturers and component assemblers of television sets in South Africa include international manufacturers LG and Samsung as well as local manufacturer Tellumat which is contracted to manufacture and assemble Sony Bravia, Toshiba and Teledex television sets. The market demand for energy efficient televisions is almost non-existent and this is not expected to change in the medium to long term. The selling points for televisions are brand type, functional features and physical appearance. The latest television technologies, LCD and LED televisions, are more energy efficient than previous technologies, but this is not due to market demand.
Continued drafting and implementation of government policies to promote and stimulate the local manufacturing industry is a major driver for manufacturers
Level of technical and competency capability of firms in South Africa (specifically looking at the ten focus technology)
The levels of technical and competency capability of the focus manufacturing industries in this analysis are discussed in this section. Manufacturers engaged with during the course of the analysis were asked to identify and rank the factors used to measure the technical and competency levels of the manufacturing
Information according to
appliance type -
Consumption, efficiency,
capacity, etc.
The appliance's details.
Noise: The noise emitted by
the appliance is described
in decibels
Energy class: The EE
for the appliance is
represented with a
colour code and
associated to a letter
(A to G).
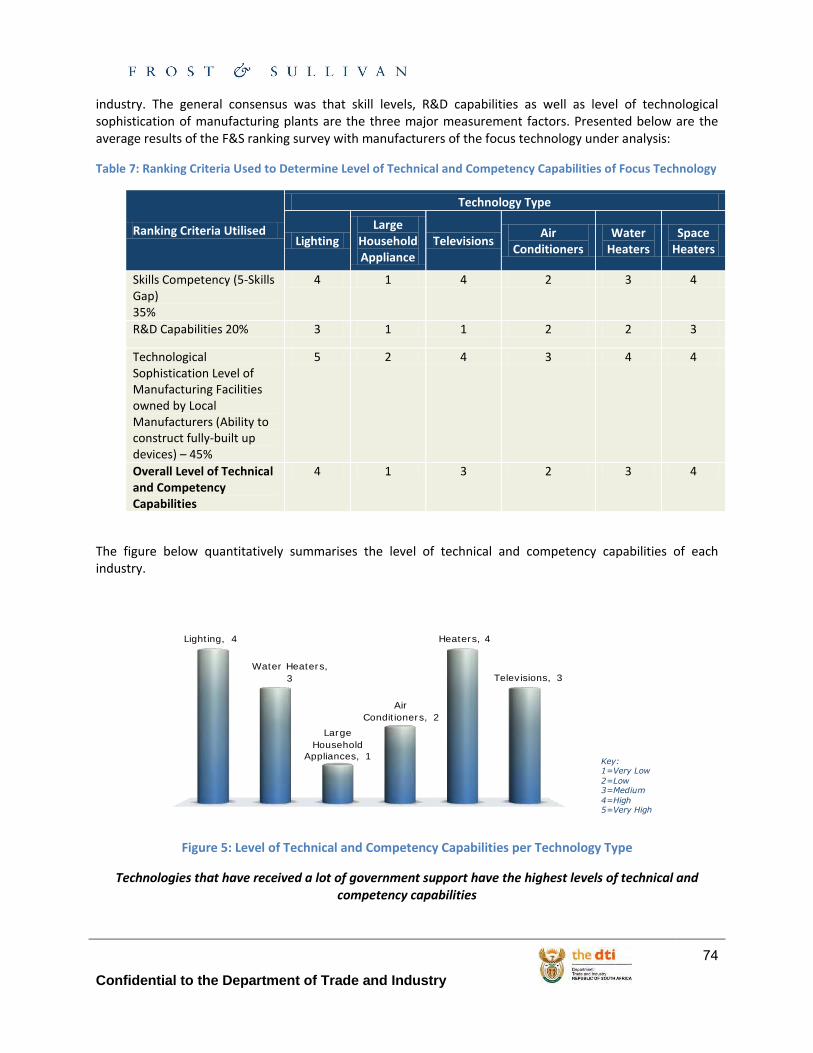
Confidential to the Department of Trade and Industry
74
industry. The general consensus was that skill levels, R&D capabilities as well as level of technological sophistication of manufacturing plants are the three major measurement factors. Presented below are the average results of the F&S ranking survey with manufacturers of the focus technology under analysis:
Table 7: Ranking Criteria Used to Determine Level of Technical and Competency Capabilities of Focus Technology
Ranking Criteria Utilised
Technology Type
Lighting Large
Household Appliance
Televisions Air
Conditioners Water
Heaters Space
Heaters
Skills Competency (5-Skills Gap) 35%
4 1 4 2 3 4
R&D Capabilities 20% 3 1 1 2 2 3
Technological Sophistication Level of Manufacturing Facilities owned by Local Manufacturers (Ability to construct fully-built up devices) – 45%
5 2 4 3 4 4
Overall Level of Technical and Competency Capabilities
4 1 3 2 3 4
The figure below quantitatively summarises the level of technical and competency capabilities of each industry.
Figure 5: Level of Technical and Competency Capabilities per Technology Type
Technologies that have received a lot of government support have the highest levels of technical and competency capabilities
Lighting, 4
Water Heaters,
3
Large
Household
Appliances, 1
Air
Conditioners, 2
Heaters, 4
Televisions, 3
Key: 1=Very Low
2=Low3=Medium
4=High5=Very High
Confidential to the Department of Trade and Industry
75
Product Type: Lighting Despite incandescent light bulbs still being widely used, there is a growing focus on LED and CFL lighting by local lighting manufacturers. This is due to growing market demand as a result of Eskom’s CFL lighting rollout program which was initiated in 2004 and the South African government’s plans to completely phase out incandescent light bulbs starting end 2013. One of the major determinants of a manufacturer’s technical and competency capabilities is its research and development (R&D) capabilities and its production facilities. Most local manufacturers have production facilities that rival those of their international counterparts and that can manufacture a wide range of products. Parts of the manufacturing process such as the construction of printed circuit boards and the population of these boards are very specific enterprises that are often outsourced to other local manufacturers. Local lighting manufacturers, however, tend to have very poor R&D capabilities due to lack of funding and this is a major challenge for most manufacturers. The local industry is dominated by international lighting companies such as Phillips, Osram and Eurolux and it is very difficult for local manufacturers to compete with the R&D abilities of their international counterparts. Furthermore, local manufacturers find the risk associated with R&D too high and prefer to use their available capital for operational costs. Often, despite there being excellent prospects for a product, local manufacturers find it too risky to plough available capital into R&D preferring to use it for very important on-going business requirements. Over 80 per cent of local lighting manufacturers prefer to design and manufacture most of the products they produce with economies of scale being one of the major determining factors. However, some components including the lighting component, i.e., the LED and CFL component, are imported from international operations or international suppliers in China, Germany, USA, etc. Depending on the manufacturer’s range of lighting products, completed products are only imported where:
Equivalent products are made in large volumes abroad such that it is impossible for manufacturers to compete on cost
An excellent product exists abroad that manufacturers cannot produce due to technical reasons There are significant upfront costs involved in bringing a product to market, e.g., casting moulds and
initial stock purchasing. It can cost over R500, 000 to effectively bring a product to market
Fortunately, the skills gap in the lighting manufacturing industry is not significant as most local manufacturers have good relationships with the companies from whom they buy the lighting components. Manufacturers obtain a great deal of information from their suppliers regarding the market and the product, this in turn enables them to effectively conduct in-house training.
Product Type: Water Heaters The water heating market for both residential and commercial/industrial applications in South Africa is moving away from conventional water heating methods towards more energy efficient solutions. Eskom and the DoE have supported efficient water heating mechanisms and demand-side management by developing an Eskom rebate program for solar water heaters, which is currently gaining momentum. The water heaters manufacturing industry manufactures products in compliance with established South African Bureau of Standards (SABS) performance standards, these standards include minimum energy efficiency requirements and the latest publication of SANS 151 includes energy labelling. This standard is currently out for public comment to become a VC (compulsory specification regulated by the NRCS).
The majority of manufacturers currently have technical and technological expertise to comply with current and future manufacturing requirements. However, manufacturing capacity for solar water heaters in South Africa is fragmented, with facilities located in Gauteng, the Eastern Cape, the Western Cape and Kwa-Zulu Natal. In 2008 a rebate system was initiated by Eskom as part of a National Solar Water Heater (NSWH) framework. The rebate was developed with an accreditation system in place for both suppliers and installers. Eskom’s initiative was implemented according to each supplier’s unique products and their efficiencies. Rebates were thus ascertained for each system in terms of their Q factor, or efficiency, with relevance to
Confidential to the Department of Trade and Industry
76
their price, to formulate the value of the rebate. Systems had to comply with the SABS and SANS tests, for mechanical and thermal safety, in order to be accredited and qualify for the rebate. Many end-users preference remains with imports however, with low price as a key selection criteria on the one side, and high quality and reputability on the other side, for products distributed from global leading manufacturers. Materials required for SWH differ depending on product type and application. In addition to manufacturing, a range of materials are also needed in the installation sphere, such as mounting brackets. For the manufacturing of a flat plate SWH collector, materials needed include glass, copper, aluminium. Price intensity is approximately as follows:
Glass (40.0 per cent) Copper (35.0 per cent) Aluminium (20.0 per cent)
A key question is to evaluate whether the cost of manufacturing locally can be competitive to imported products. Several manufacturers are currently manufacturing SWH from solely locally sourced parts; however, the majority of manufacture and assembly plants import some components, the most widely sourced are pumps (55.0 per cent), and evacuated tubes (36.0 per cent). The key selection factor determining imported components is availability, followed by price then quality. Flat plate glass is manufactured locally with no supply shortages foreseeable whereas evacuated tubes for SWH collectors are almost entirely imported, due to price and availability, as well as complexities in the chemical process needed in their manufacture.
Product Type: Large Household Appliances The manufacturing of large household appliances is very limited in South Africa and is dominated by large manufacturers such as Defy (stoves, ovens, clothing dryers and refrigerators), Whirlpool (refrigerators and freezers including KIC) and Univa (manufacture stoves for AEG/Electrolux’s brand Kelvinator) are the only manufacturing and component assembly plants in South Africa. The Fridge Factory is situated in Swaziland and produces a range of freezers and refrigerators; please note that industry is dominated by international manufacturers. Local manufacturing and assembly of dishwashers, clothing washing machines, clothing dryers, stoves and ovens are limited to Defy which manufactures certain parts (metal and plastic casings of products) and imports parts such as compressors for refrigerators and raw materials such as metal and plastic. Specific attention will be given to refrigerators as this is currently the only manufacturing capability in South Africa.
The South African manufacturing environment is currently not conducive for the local manufacturing of large household appliances due to:
Labour uncertainties: manufacturers find it increasingly difficult not only to maintain their current level of employment on an economical basis, but also to expand, thereby really creating jobs and growth. This is mainly due to the globalization of the white goods industry and the current contracted spending by consumers. The current unstable labour situation, due to increasing strike occurrences and unclear labour laws, creates uncertainty in foreign investors to invest in South Africa.
Increasing electricity prices: electricity costs account for over 60.0 per cent of operational costs in most manufacturing operations. Increased electricity prices by Eskom are set to further affect local manufacturers’ ability to be competitive. Nu World Holdings Ltd, a former manufacturer of small household appliances, states that one of the main reasons why it made the decision to suspend all manufacturing in September 2011 and only import products was due to the increases in electricity prices. The industry is already under enormous pressure to be competitive, due to globalisation, and cannot withstand rising input costs.
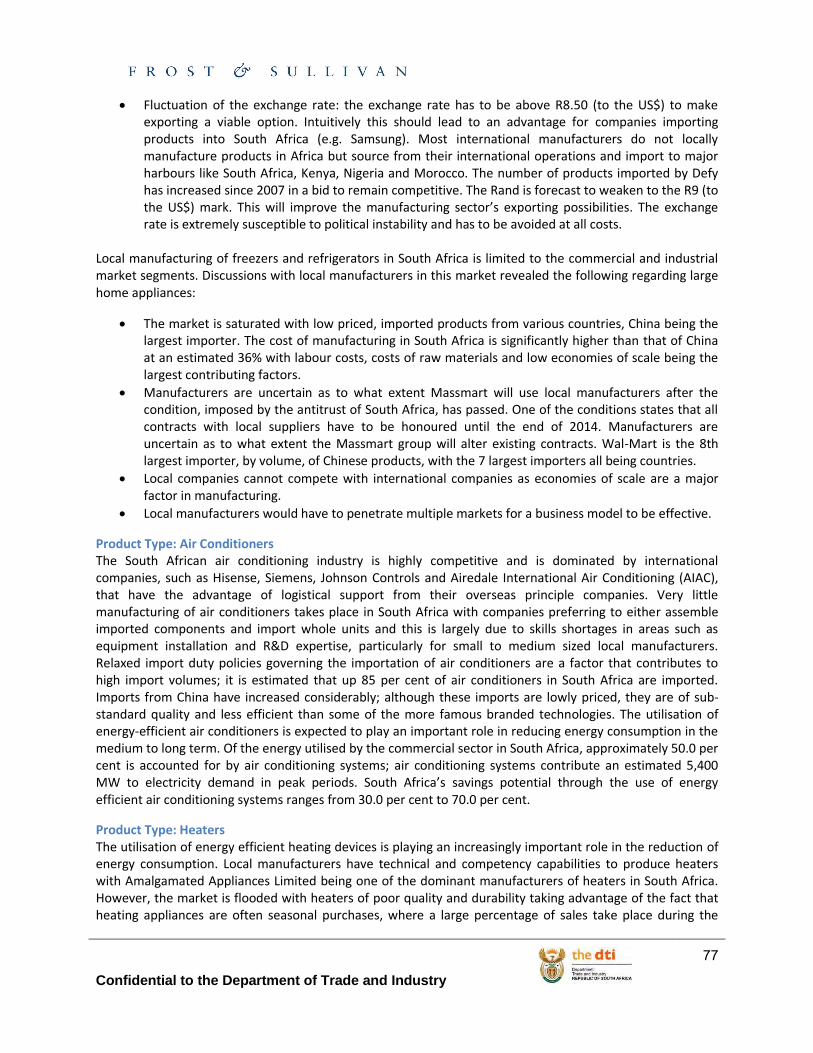
Confidential to the Department of Trade and Industry
77
Fluctuation of the exchange rate: the exchange rate has to be above R8.50 (to the US$) to make exporting a viable option. Intuitively this should lead to an advantage for companies importing products into South Africa (e.g. Samsung). Most international manufacturers do not locally manufacture products in Africa but source from their international operations and import to major harbours like South Africa, Kenya, Nigeria and Morocco. The number of products imported by Defy has increased since 2007 in a bid to remain competitive. The Rand is forecast to weaken to the R9 (to the US$) mark. This will improve the manufacturing sector’s exporting possibilities. The exchange rate is extremely susceptible to political instability and has to be avoided at all costs.
Local manufacturing of freezers and refrigerators in South Africa is limited to the commercial and industrial market segments. Discussions with local manufacturers in this market revealed the following regarding large home appliances:
The market is saturated with low priced, imported products from various countries, China being the largest importer. The cost of manufacturing in South Africa is significantly higher than that of China at an estimated 36% with labour costs, costs of raw materials and low economies of scale being the largest contributing factors.
Manufacturers are uncertain as to what extent Massmart will use local manufacturers after the condition, imposed by the antitrust of South Africa, has passed. One of the conditions states that all contracts with local suppliers have to be honoured until the end of 2014. Manufacturers are uncertain as to what extent the Massmart group will alter existing contracts. Wal-Mart is the 8th largest importer, by volume, of Chinese products, with the 7 largest importers all being countries.
Local companies cannot compete with international companies as economies of scale are a major factor in manufacturing.
Local manufacturers would have to penetrate multiple markets for a business model to be effective.
Product Type: Air Conditioners The South African air conditioning industry is highly competitive and is dominated by international companies, such as Hisense, Siemens, Johnson Controls and Airedale International Air Conditioning (AIAC), that have the advantage of logistical support from their overseas principle companies. Very little manufacturing of air conditioners takes place in South Africa with companies preferring to either assemble imported components and import whole units and this is largely due to skills shortages in areas such as equipment installation and R&D expertise, particularly for small to medium sized local manufacturers. Relaxed import duty policies governing the importation of air conditioners are a factor that contributes to high import volumes; it is estimated that up 85 per cent of air conditioners in South Africa are imported. Imports from China have increased considerably; although these imports are lowly priced, they are of sub-standard quality and less efficient than some of the more famous branded technologies. The utilisation of energy-efficient air conditioners is expected to play an important role in reducing energy consumption in the medium to long term. Of the energy utilised by the commercial sector in South Africa, approximately 50.0 per cent is accounted for by air conditioning systems; air conditioning systems contribute an estimated 5,400 MW to electricity demand in peak periods. South Africa’s savings potential through the use of energy efficient air conditioning systems ranges from 30.0 per cent to 70.0 per cent.
Product Type: Heaters The utilisation of energy efficient heating devices is playing an increasingly important role in the reduction of energy consumption. Local manufacturers have technical and competency capabilities to produce heaters with Amalgamated Appliances Limited being one of the dominant manufacturers of heaters in South Africa. However, the market is flooded with heaters of poor quality and durability taking advantage of the fact that heating appliances are often seasonal purchases, where a large percentage of sales take place during the
Confidential to the Department of Trade and Industry
78
winter period. This industry is highly competitive with international manufacturers opting to import whole products from their international operations.
Product Type: Televisions Before 1994, South Africa was a prominent manufacturer of television sets and exported to neighbouring African countries; the television technology that was manufactured was analog. At the peak of its operations, Amalgamated Appliances’ television manufacturing factory employed approximately 1,500 people. After 1994, import duties on television sets were lifted and this led to the introduction of digital television technology; This led to the gradual decline of the local manufacturing companies as market demand for analog television sets declined and manufacturers did not have the skills and financial base required to manufacture this new technology. Dutch manufacturer Philips was amongst other international television manufacturers that had local manufacturing plants. However, the withdrawal of duty protection after 1994 led to the gradual demise of these businesses. The South African television manufacturing industry has gained significant momentum after the government imposed higher import duties on imported televisions in 2010. Companies that import fully built up or semi knock down television sets pay duties of up to 25% whereas companies that manufacture locally are exempt. International companies such as Sony, Samsung and Toshiba now find it more profitable to manufacture televisions locally and have outsourced the services of local manufacturers and government is considering extending duty protection to include LCD screens for monitors. Locally based television manufacturer, Tellumat, has made use of the Department of Trade and Industry’s manufacturing incentive programme; this program returns a percentage of capital invested in expanding a manufacturing facility and employment, to the company in the form of a grant. There are a handful of local television manufacturers that manufacture fully built up television units currently present in South Africa and several manufacturers that focus solely on the manufacturing of television components. Existing manufacturers have the necessary technology required to manufacture televisions; this is largely due to the support obtained from the international manufacturers they are in partnership with.
For example, Tellumat produces television sets for Sony, Toshiba and Teledex for the furniture store Lewis whereas Anyview Technology produces television sets and LED monitors 21 inches and above for Samsung.
Profiles of the main manufacturers in South Africa currently supplying related products
This section profiles the main manufacturers in South currently supplying the ten focus technologies under analysis in South Africa. Prominent manufacturers were selected based on the size of their local manufacturing operations (annual production rate) as well as the level of technological sophistication of their production facilities.
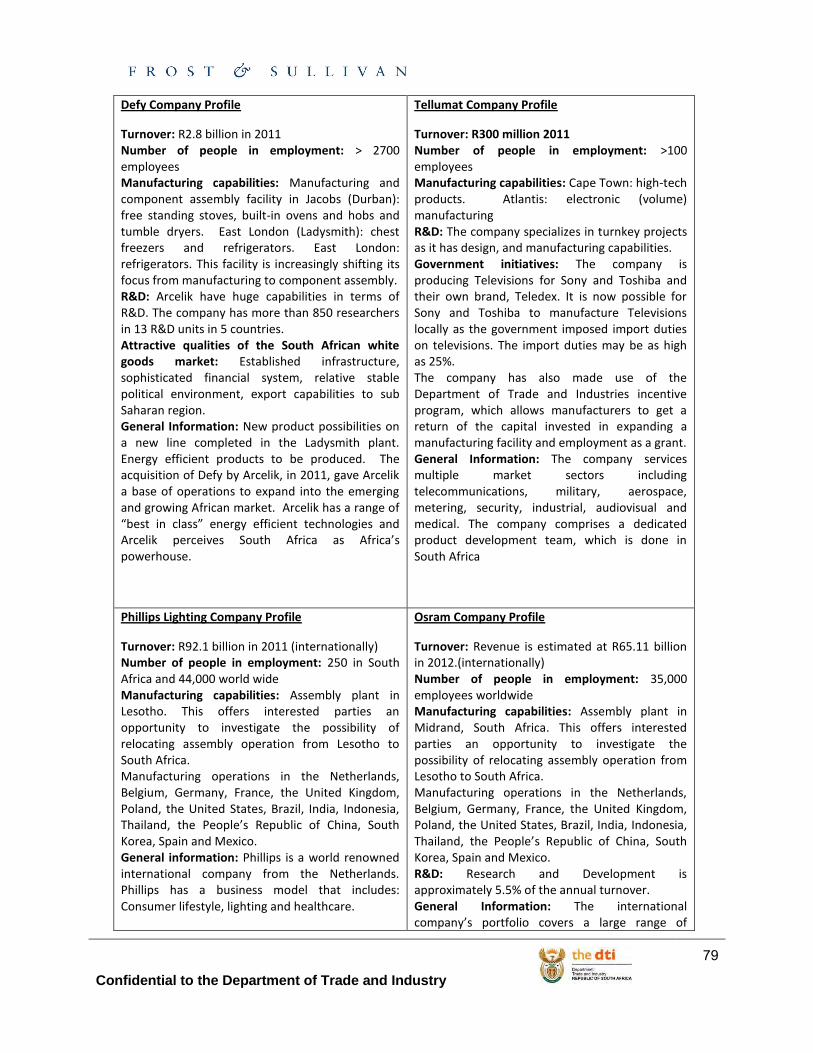
Confidential to the Department of Trade and Industry
79
Defy Company Profile
Turnover: R2.8 billion in 2011 Number of people in employment: > 2700 employees Manufacturing capabilities: Manufacturing and component assembly facility in Jacobs (Durban): free standing stoves, built-in ovens and hobs and tumble dryers. East London (Ladysmith): chest freezers and refrigerators. East London: refrigerators. This facility is increasingly shifting its focus from manufacturing to component assembly. R&D: Arcelik have huge capabilities in terms of R&D. The company has more than 850 researchers in 13 R&D units in 5 countries. Attractive qualities of the South African white goods market: Established infrastructure, sophisticated financial system, relative stable political environment, export capabilities to sub Saharan region. General Information: New product possibilities on a new line completed in the Ladysmith plant. Energy efficient products to be produced. The acquisition of Defy by Arcelik, in 2011, gave Arcelik a base of operations to expand into the emerging and growing African market. Arcelik has a range of “best in class” energy efficient technologies and Arcelik perceives South Africa as Africa’s powerhouse.
Tellumat Company Profile
Turnover: R300 million 2011 Number of people in employment: >100 employees Manufacturing capabilities: Cape Town: high-tech products. Atlantis: electronic (volume) manufacturing R&D: The company specializes in turnkey projects as it has design, and manufacturing capabilities. Government initiatives: The company is producing Televisions for Sony and Toshiba and their own brand, Teledex. It is now possible for Sony and Toshiba to manufacture Televisions locally as the government imposed import duties on televisions. The import duties may be as high as 25%. The company has also made use of the Department of Trade and Industries incentive program, which allows manufacturers to get a return of the capital invested in expanding a manufacturing facility and employment as a grant. General Information: The company services multiple market sectors including telecommunications, military, aerospace, metering, security, industrial, audiovisual and medical. The company comprises a dedicated product development team, which is done in South Africa
Phillips Lighting Company Profile
Turnover: R92.1 billion in 2011 (internationally) Number of people in employment: 250 in South Africa and 44,000 world wide Manufacturing capabilities: Assembly plant in Lesotho. This offers interested parties an opportunity to investigate the possibility of relocating assembly operation from Lesotho to South Africa. Manufacturing operations in the Netherlands, Belgium, Germany, France, the United Kingdom, Poland, the United States, Brazil, India, Indonesia, Thailand, the People’s Republic of China, South Korea, Spain and Mexico. General information: Phillips is a world renowned international company from the Netherlands. Phillips has a business model that includes: Consumer lifestyle, lighting and healthcare.
Osram Company Profile
Turnover: Revenue is estimated at R65.11 billion in 2012.(internationally) Number of people in employment: 35,000 employees worldwide Manufacturing capabilities: Assembly plant in Midrand, South Africa. This offers interested parties an opportunity to investigate the possibility of relocating assembly operation from Lesotho to South Africa. Manufacturing operations in the Netherlands, Belgium, Germany, France, the United Kingdom, Poland, the United States, Brazil, India, Indonesia, Thailand, the People’s Republic of China, South Korea, Spain and Mexico. R&D: Research and Development is approximately 5.5% of the annual turnover. General Information: The international company’s portfolio covers a large range of
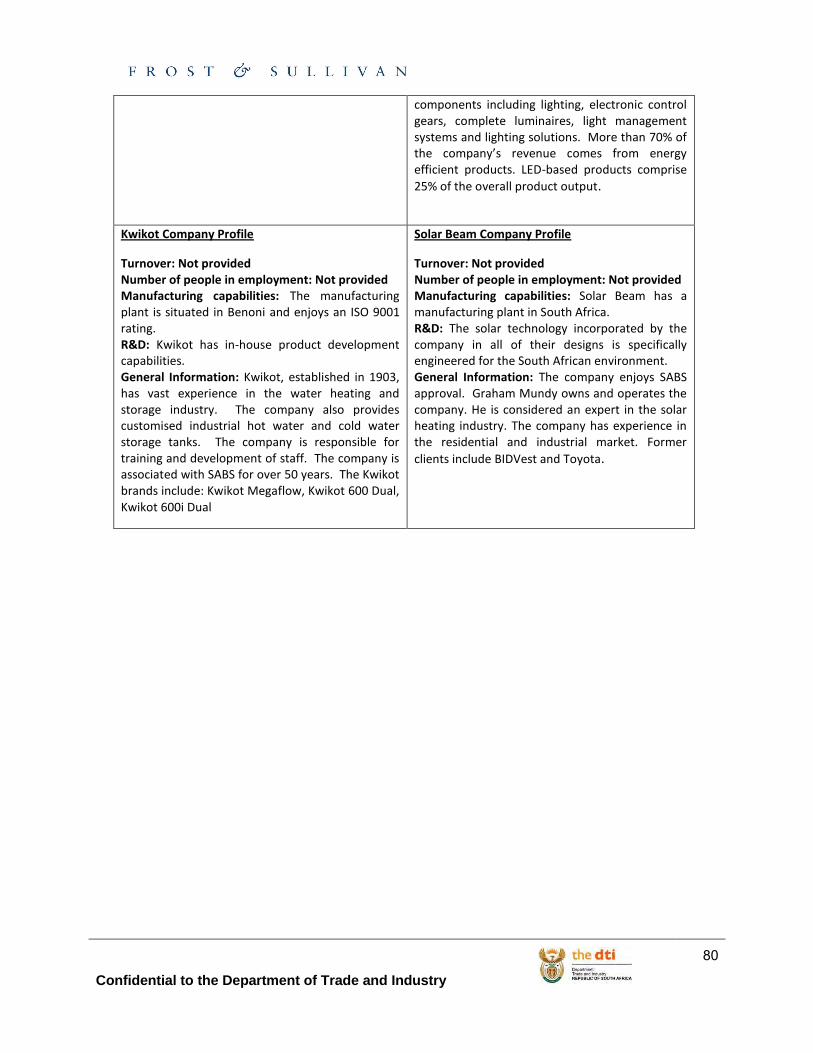
Confidential to the Department of Trade and Industry
80
components including lighting, electronic control gears, complete luminaires, light management systems and lighting solutions. More than 70% of the company’s revenue comes from energy efficient products. LED-based products comprise
25% of the overall product output.
Kwikot Company Profile
Turnover: Not provided Number of people in employment: Not provided Manufacturing capabilities: The manufacturing plant is situated in Benoni and enjoys an ISO 9001 rating. R&D: Kwikot has in-house product development capabilities. General Information: Kwikot, established in 1903, has vast experience in the water heating and storage industry. The company also provides customised industrial hot water and cold water storage tanks. The company is responsible for training and development of staff. The company is associated with SABS for over 50 years. The Kwikot brands include: Kwikot Megaflow, Kwikot 600 Dual, Kwikot 600i Dual
Solar Beam Company Profile
Turnover: Not provided Number of people in employment: Not provided Manufacturing capabilities: Solar Beam has a manufacturing plant in South Africa. R&D: The solar technology incorporated by the company in all of their designs is specifically engineered for the South African environment. General Information: The company enjoys SABS approval. Graham Mundy owns and operates the company. He is considered an expert in the solar heating industry. The company has experience in the residential and industrial market. Former
clients include BIDVest and Toyota.
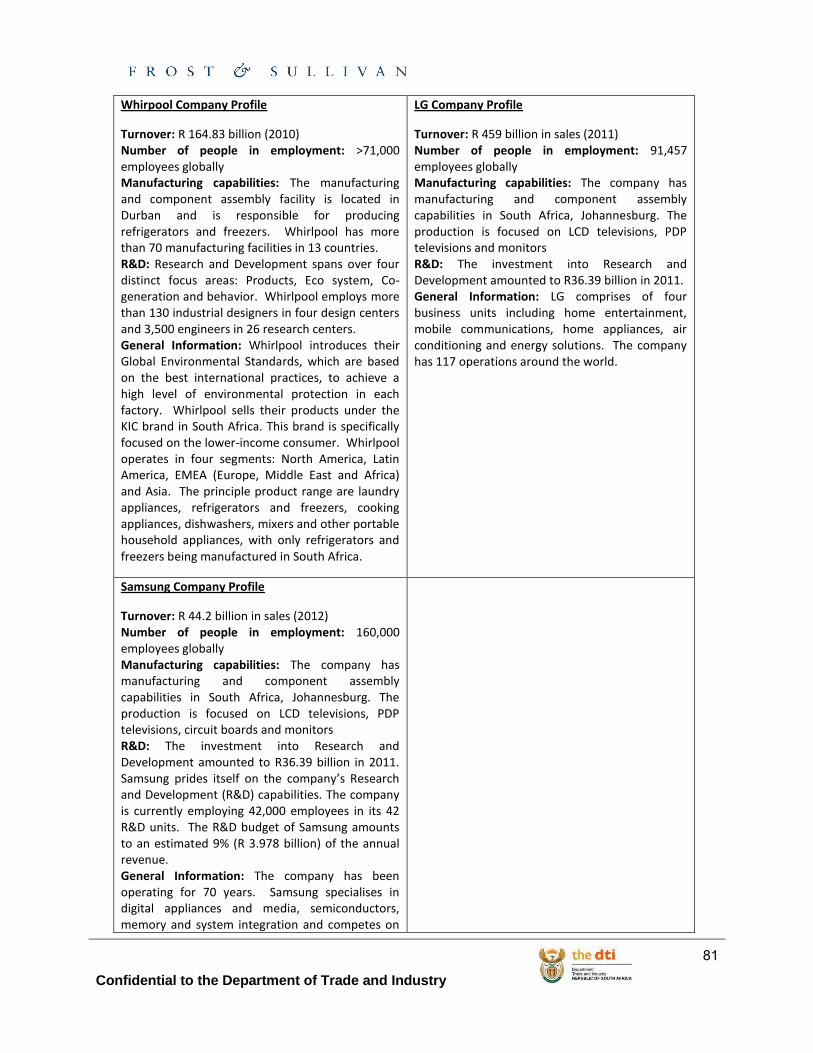
Confidential to the Department of Trade and Industry
81
Whirpool Company Profile
Turnover: R 164.83 billion (2010) Number of people in employment: >71,000 employees globally Manufacturing capabilities: The manufacturing and component assembly facility is located in Durban and is responsible for producing refrigerators and freezers. Whirlpool has more than 70 manufacturing facilities in 13 countries. R&D: Research and Development spans over four distinct focus areas: Products, Eco system, Co-generation and behavior. Whirlpool employs more than 130 industrial designers in four design centers and 3,500 engineers in 26 research centers. General Information: Whirlpool introduces their Global Environmental Standards, which are based on the best international practices, to achieve a high level of environmental protection in each factory. Whirlpool sells their products under the KIC brand in South Africa. This brand is specifically focused on the lower-income consumer. Whirlpool operates in four segments: North America, Latin America, EMEA (Europe, Middle East and Africa) and Asia. The principle product range are laundry appliances, refrigerators and freezers, cooking appliances, dishwashers, mixers and other portable household appliances, with only refrigerators and freezers being manufactured in South Africa.
LG Company Profile
Turnover: R 459 billion in sales (2011) Number of people in employment: 91,457 employees globally Manufacturing capabilities: The company has manufacturing and component assembly capabilities in South Africa, Johannesburg. The production is focused on LCD televisions, PDP televisions and monitors R&D: The investment into Research and Development amounted to R36.39 billion in 2011. General Information: LG comprises of four business units including home entertainment, mobile communications, home appliances, air conditioning and energy solutions. The company has 117 operations around the world.
Samsung Company Profile
Turnover: R 44.2 billion in sales (2012) Number of people in employment: 160,000 employees globally Manufacturing capabilities: The company has manufacturing and component assembly capabilities in South Africa, Johannesburg. The production is focused on LCD televisions, PDP televisions, circuit boards and monitors R&D: The investment into Research and Development amounted to R36.39 billion in 2011. Samsung prides itself on the company’s Research and Development (R&D) capabilities. The company is currently employing 42,000 employees in its 42 R&D units. The R&D budget of Samsung amounts to an estimated 9% (R 3.978 billion) of the annual revenue. General Information: The company has been operating for 70 years. Samsung specialises in digital appliances and media, semiconductors, memory and system integration and competes on
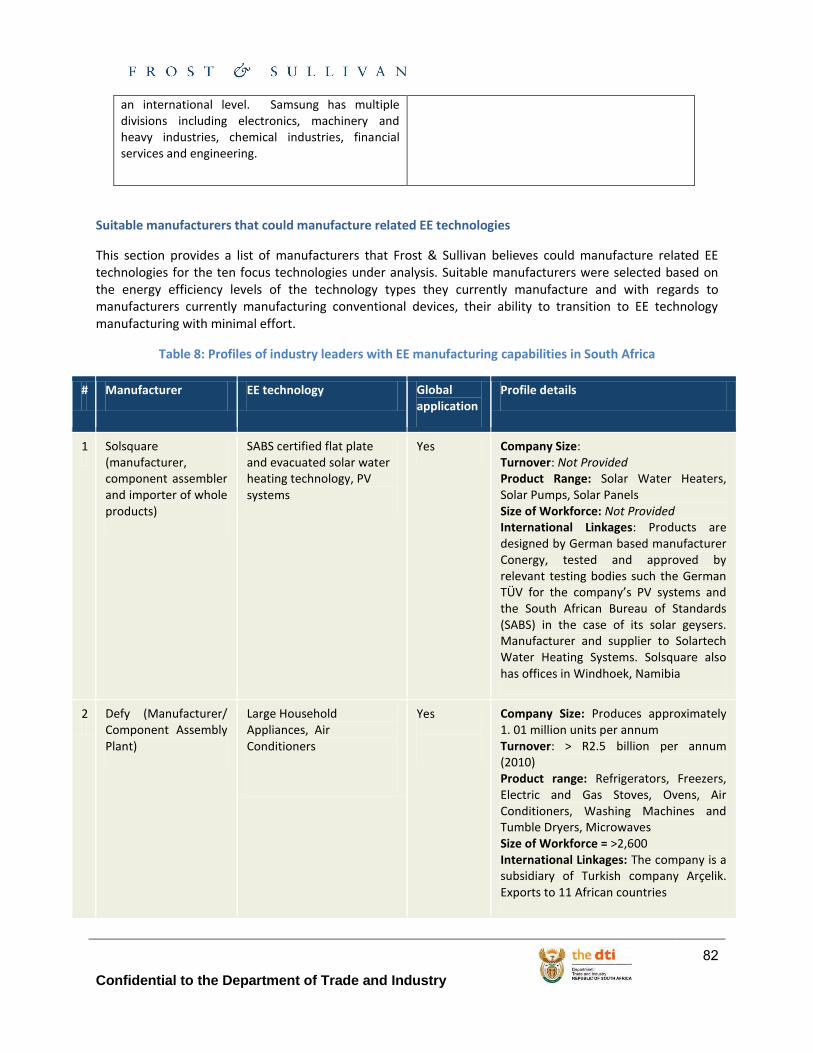
Confidential to the Department of Trade and Industry
82
an international level. Samsung has multiple divisions including electronics, machinery and heavy industries, chemical industries, financial services and engineering.
Suitable manufacturers that could manufacture related EE technologies
This section provides a list of manufacturers that Frost & Sullivan believes could manufacture related EE technologies for the ten focus technologies under analysis. Suitable manufacturers were selected based on the energy efficiency levels of the technology types they currently manufacture and with regards to manufacturers currently manufacturing conventional devices, their ability to transition to EE technology manufacturing with minimal effort.
Table 8: Profiles of industry leaders with EE manufacturing capabilities in South Africa
# Manufacturer EE technology Global application
Profile details
1 Solsquare (manufacturer, component assembler and importer of whole products)
SABS certified flat plate and evacuated solar water heating technology, PV systems
Yes Company Size: Turnover: Not Provided Product Range: Solar Water Heaters, Solar Pumps, Solar Panels Size of Workforce: Not Provided International Linkages: Products are designed by German based manufacturer Conergy, tested and approved by relevant testing bodies such the German TÜV for the company’s PV systems and the South African Bureau of Standards (SABS) in the case of its solar geysers. Manufacturer and supplier to Solartech Water Heating Systems. Solsquare also has offices in Windhoek, Namibia
2 Defy (Manufacturer/ Component Assembly Plant)
Large Household Appliances, Air Conditioners
Yes
Company Size: Produces approximately 1. 01 million units per annum Turnover: > R2.5 billion per annum (2010) Product range: Refrigerators, Freezers, Electric and Gas Stoves, Ovens, Air Conditioners, Washing Machines and Tumble Dryers, Microwaves Size of Workforce = >2,600 International Linkages: The company is a subsidiary of Turkish company Arçelik. Exports to 11 African countries
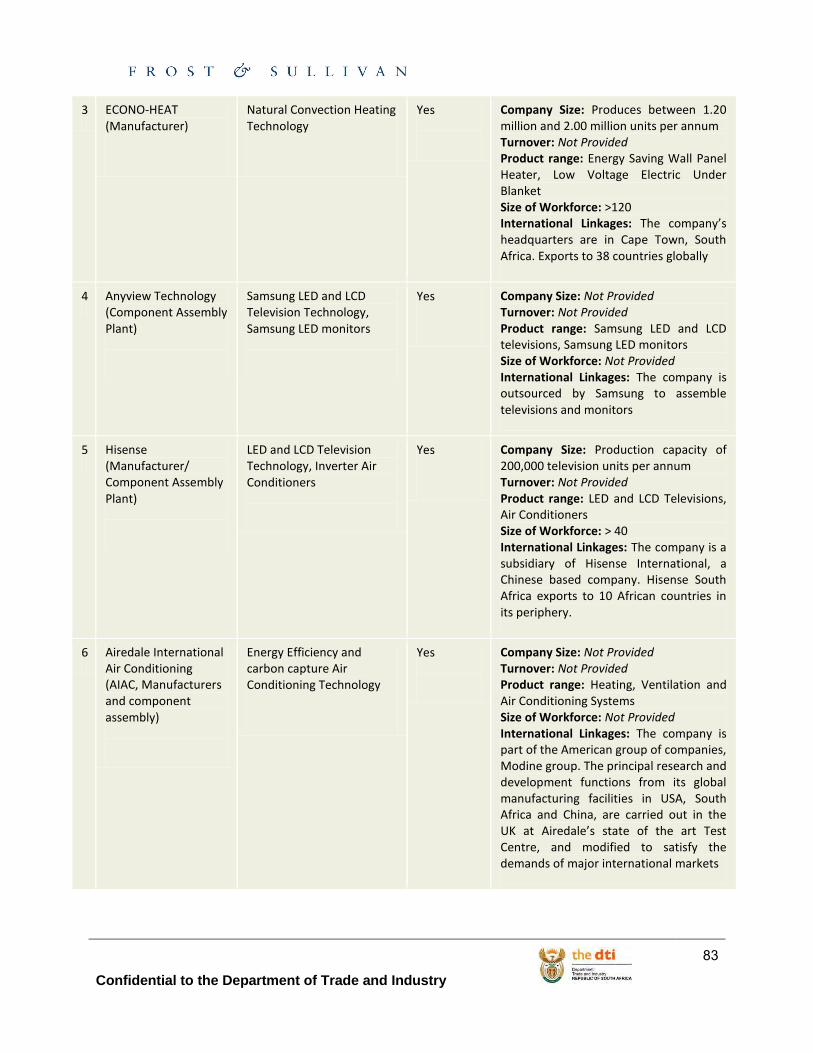
Confidential to the Department of Trade and Industry
83
3 ECONO-HEAT (Manufacturer)
Natural Convection Heating Technology
Yes
Company Size: Produces between 1.20 million and 2.00 million units per annum Turnover: Not Provided Product range: Energy Saving Wall Panel Heater, Low Voltage Electric Under Blanket Size of Workforce: >120 International Linkages: The company’s headquarters are in Cape Town, South Africa. Exports to 38 countries globally
4 Anyview Technology (Component Assembly Plant)
Samsung LED and LCD Television Technology, Samsung LED monitors
Yes
Company Size: Not Provided Turnover: Not Provided Product range: Samsung LED and LCD televisions, Samsung LED monitors Size of Workforce: Not Provided International Linkages: The company is outsourced by Samsung to assemble televisions and monitors
5 Hisense (Manufacturer/ Component Assembly Plant)
LED and LCD Television Technology, Inverter Air Conditioners
Yes
Company Size: Production capacity of 200,000 television units per annum Turnover: Not Provided Product range: LED and LCD Televisions, Air Conditioners Size of Workforce: > 40 International Linkages: The company is a subsidiary of Hisense International, a Chinese based company. Hisense South Africa exports to 10 African countries in its periphery.
6 Airedale International Air Conditioning (AIAC, Manufacturers and component assembly)
Energy Efficiency and carbon capture Air Conditioning Technology
Yes
Company Size: Not Provided Turnover: Not Provided Product range: Heating, Ventilation and Air Conditioning Systems Size of Workforce: Not Provided International Linkages: The company is part of the American group of companies, Modine group. The principal research and development functions from its global manufacturing facilities in USA, South Africa and China, are carried out in the UK at Airedale’s state of the art Test Centre, and modified to satisfy the demands of major international markets
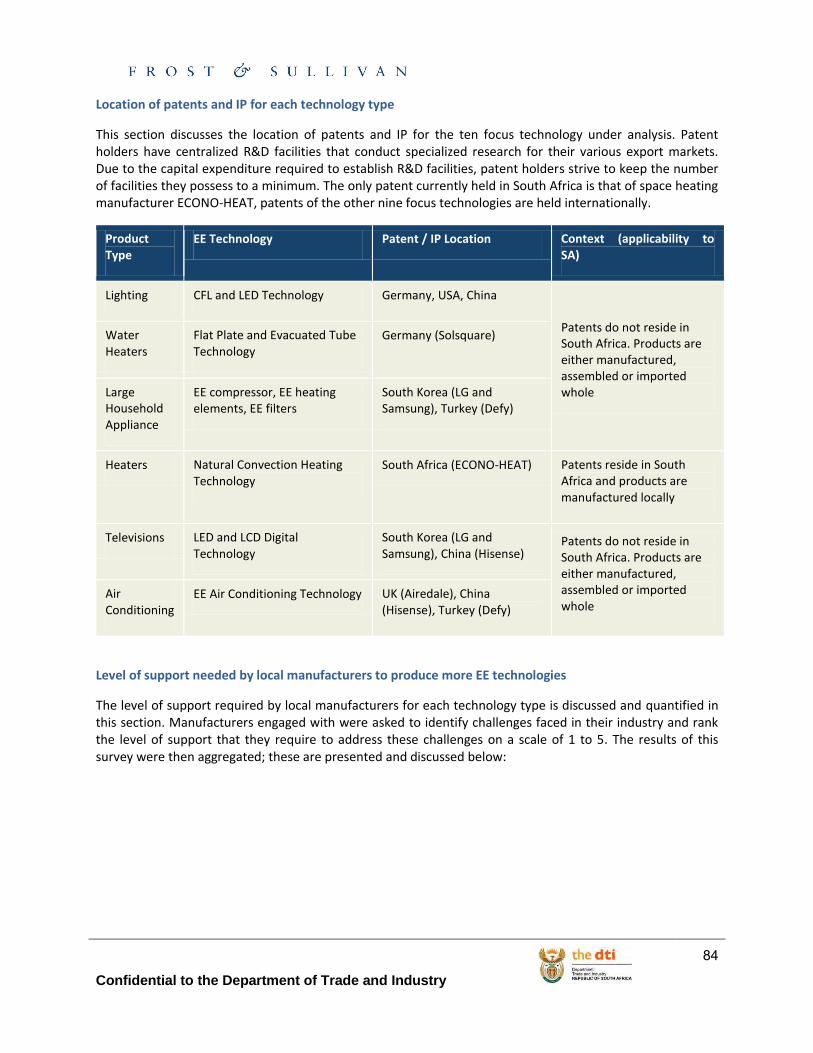
Confidential to the Department of Trade and Industry
84
Location of patents and IP for each technology type
This section discusses the location of patents and IP for the ten focus technology under analysis. Patent holders have centralized R&D facilities that conduct specialized research for their various export markets. Due to the capital expenditure required to establish R&D facilities, patent holders strive to keep the number of facilities they possess to a minimum. The only patent currently held in South Africa is that of space heating manufacturer ECONO-HEAT, patents of the other nine focus technologies are held internationally.
Product Type
EE Technology Patent / IP Location Context (applicability to SA)
Lighting CFL and LED Technology Germany, USA, China
Patents do not reside in South Africa. Products are either manufactured, assembled or imported whole
Water Heaters
Flat Plate and Evacuated Tube Technology
Germany (Solsquare)
Large Household Appliance
EE compressor, EE heating elements, EE filters
South Korea (LG and Samsung), Turkey (Defy)
Heaters Natural Convection Heating Technology
South Africa (ECONO-HEAT) Patents reside in South Africa and products are manufactured locally
Televisions LED and LCD Digital Technology
South Korea (LG and Samsung), China (Hisense)
Patents do not reside in South Africa. Products are either manufactured, assembled or imported whole
Air Conditioning
EE Air Conditioning Technology UK (Airedale), China (Hisense), Turkey (Defy)
Level of support needed by local manufacturers to produce more EE technologies
The level of support required by local manufacturers for each technology type is discussed and quantified in this section. Manufacturers engaged with were asked to identify challenges faced in their industry and rank the level of support that they require to address these challenges on a scale of 1 to 5. The results of this survey were then aggregated; these are presented and discussed below:
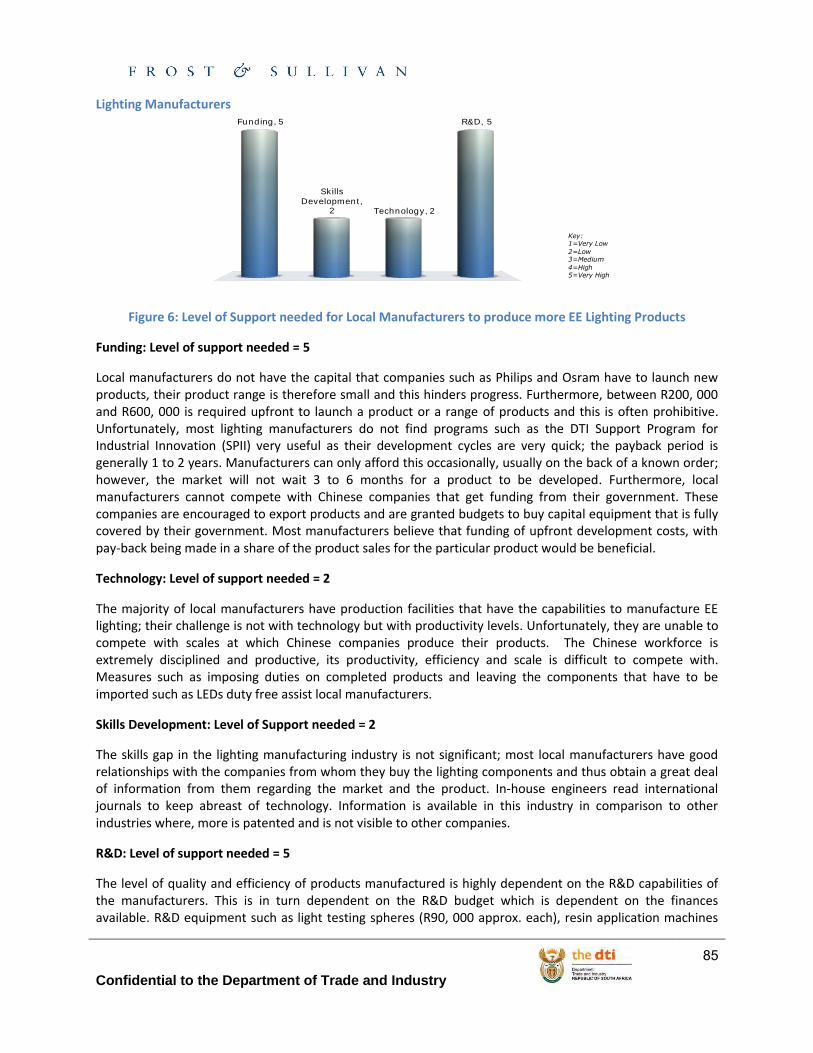
Confidential to the Department of Trade and Industry
85
Lighting Manufacturers
Figure 6: Level of Support needed for Local Manufacturers to produce more EE Lighting Products
Funding: Level of support needed = 5
Local manufacturers do not have the capital that companies such as Philips and Osram have to launch new products, their product range is therefore small and this hinders progress. Furthermore, between R200, 000 and R600, 000 is required upfront to launch a product or a range of products and this is often prohibitive. Unfortunately, most lighting manufacturers do not find programs such as the DTI Support Program for Industrial Innovation (SPII) very useful as their development cycles are very quick; the payback period is generally 1 to 2 years. Manufacturers can only afford this occasionally, usually on the back of a known order; however, the market will not wait 3 to 6 months for a product to be developed. Furthermore, local manufacturers cannot compete with Chinese companies that get funding from their government. These companies are encouraged to export products and are granted budgets to buy capital equipment that is fully covered by their government. Most manufacturers believe that funding of upfront development costs, with pay-back being made in a share of the product sales for the particular product would be beneficial.
Technology: Level of support needed = 2
The majority of local manufacturers have production facilities that have the capabilities to manufacture EE lighting; their challenge is not with technology but with productivity levels. Unfortunately, they are unable to compete with scales at which Chinese companies produce their products. The Chinese workforce is extremely disciplined and productive, its productivity, efficiency and scale is difficult to compete with. Measures such as imposing duties on completed products and leaving the components that have to be imported such as LEDs duty free assist local manufacturers.
Skills Development: Level of Support needed = 2
The skills gap in the lighting manufacturing industry is not significant; most local manufacturers have good relationships with the companies from whom they buy the lighting components and thus obtain a great deal of information from them regarding the market and the product. In-house engineers read international journals to keep abreast of technology. Information is available in this industry in comparison to other industries where, more is patented and is not visible to other companies.
R&D: Level of support needed = 5
The level of quality and efficiency of products manufactured is highly dependent on the R&D capabilities of the manufacturers. This is in turn dependent on the R&D budget which is dependent on the finances available. R&D equipment such as light testing spheres (R90, 000 approx. each), resin application machines
Key: 1=Very Low
2=Low3=Medium
4=High5=Very High
Funding, 5
Skills Development,
2 Technology, 2
R&D, 5
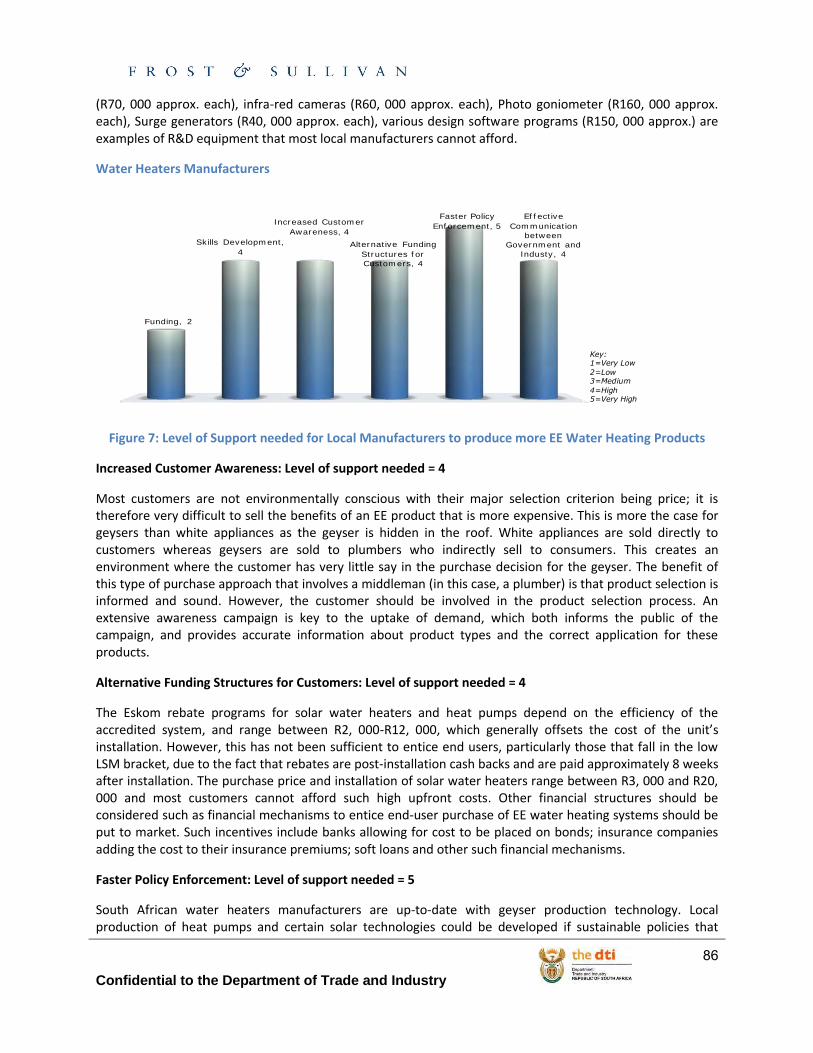
Confidential to the Department of Trade and Industry
86
(R70, 000 approx. each), infra-red cameras (R60, 000 approx. each), Photo goniometer (R160, 000 approx. each), Surge generators (R40, 000 approx. each), various design software programs (R150, 000 approx.) are examples of R&D equipment that most local manufacturers cannot afford.
Water Heaters Manufacturers
Figure 7: Level of Support needed for Local Manufacturers to produce more EE Water Heating Products
Increased Customer Awareness: Level of support needed = 4
Most customers are not environmentally conscious with their major selection criterion being price; it is therefore very difficult to sell the benefits of an EE product that is more expensive. This is more the case for geysers than white appliances as the geyser is hidden in the roof. White appliances are sold directly to customers whereas geysers are sold to plumbers who indirectly sell to consumers. This creates an environment where the customer has very little say in the purchase decision for the geyser. The benefit of this type of purchase approach that involves a middleman (in this case, a plumber) is that product selection is informed and sound. However, the customer should be involved in the product selection process. An extensive awareness campaign is key to the uptake of demand, which both informs the public of the campaign, and provides accurate information about product types and the correct application for these products.
Alternative Funding Structures for Customers: Level of support needed = 4
The Eskom rebate programs for solar water heaters and heat pumps depend on the efficiency of the accredited system, and range between R2, 000-R12, 000, which generally offsets the cost of the unit’s installation. However, this has not been sufficient to entice end users, particularly those that fall in the low LSM bracket, due to the fact that rebates are post-installation cash backs and are paid approximately 8 weeks after installation. The purchase price and installation of solar water heaters range between R3, 000 and R20, 000 and most customers cannot afford such high upfront costs. Other financial structures should be considered such as financial mechanisms to entice end-user purchase of EE water heating systems should be put to market. Such incentives include banks allowing for cost to be placed on bonds; insurance companies adding the cost to their insurance premiums; soft loans and other such financial mechanisms.
Faster Policy Enforcement: Level of support needed = 5
South African water heaters manufacturers are up-to-date with geyser production technology. Local production of heat pumps and certain solar technologies could be developed if sustainable policies that
Funding, 2
Skills Development,
4
Increased Customer
Awareness, 4
Alternative Funding
Structures for
Customers, 4
Faster Policy
Enforcement, 5
Effective
Communication
between
Government and
Industy, 4
Key: 1=Very Low
2=Low3=Medium
4=High5=Very High
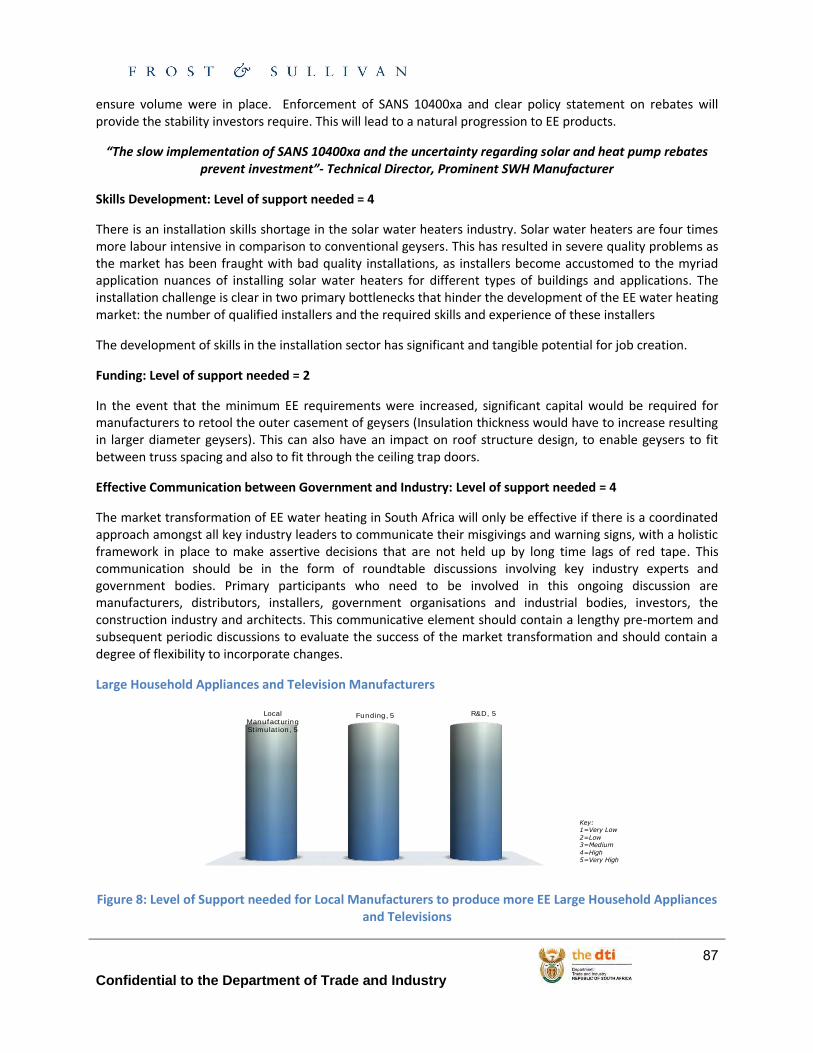
Confidential to the Department of Trade and Industry
87
ensure volume were in place. Enforcement of SANS 10400xa and clear policy statement on rebates will provide the stability investors require. This will lead to a natural progression to EE products.
“The slow implementation of SANS 10400xa and the uncertainty regarding solar and heat pump rebates prevent investment”- Technical Director, Prominent SWH Manufacturer
Skills Development: Level of support needed = 4
There is an installation skills shortage in the solar water heaters industry. Solar water heaters are four times more labour intensive in comparison to conventional geysers. This has resulted in severe quality problems as the market has been fraught with bad quality installations, as installers become accustomed to the myriad application nuances of installing solar water heaters for different types of buildings and applications. The installation challenge is clear in two primary bottlenecks that hinder the development of the EE water heating market: the number of qualified installers and the required skills and experience of these installers
The development of skills in the installation sector has significant and tangible potential for job creation.
Funding: Level of support needed = 2
In the event that the minimum EE requirements were increased, significant capital would be required for manufacturers to retool the outer casement of geysers (Insulation thickness would have to increase resulting in larger diameter geysers). This can also have an impact on roof structure design, to enable geysers to fit between truss spacing and also to fit through the ceiling trap doors.
Effective Communication between Government and Industry: Level of support needed = 4
The market transformation of EE water heating in South Africa will only be effective if there is a coordinated approach amongst all key industry leaders to communicate their misgivings and warning signs, with a holistic framework in place to make assertive decisions that are not held up by long time lags of red tape. This communication should be in the form of roundtable discussions involving key industry experts and government bodies. Primary participants who need to be involved in this ongoing discussion are manufacturers, distributors, installers, government organisations and industrial bodies, investors, the construction industry and architects. This communicative element should contain a lengthy pre-mortem and subsequent periodic discussions to evaluate the success of the market transformation and should contain a degree of flexibility to incorporate changes.
Large Household Appliances and Television Manufacturers
Figure 8: Level of Support needed for Local Manufacturers to produce more EE Large Household Appliances and Televisions
Local Manufacturing Stimulation, 5
Funding, 5 R&D, 5
Key: 1=Very Low
2=Low3=Medium
4=High5=Very High
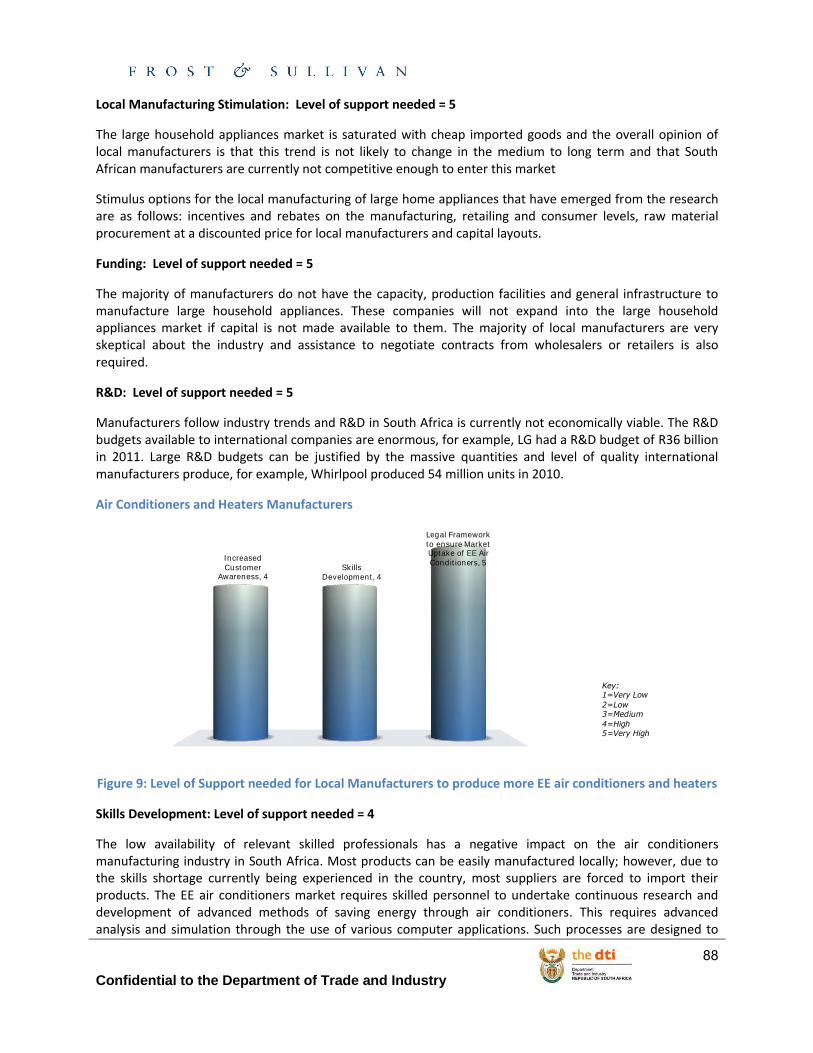
Confidential to the Department of Trade and Industry
88
Local Manufacturing Stimulation: Level of support needed = 5
The large household appliances market is saturated with cheap imported goods and the overall opinion of local manufacturers is that this trend is not likely to change in the medium to long term and that South African manufacturers are currently not competitive enough to enter this market
Stimulus options for the local manufacturing of large home appliances that have emerged from the research are as follows: incentives and rebates on the manufacturing, retailing and consumer levels, raw material procurement at a discounted price for local manufacturers and capital layouts.
Funding: Level of support needed = 5
The majority of manufacturers do not have the capacity, production facilities and general infrastructure to manufacture large household appliances. These companies will not expand into the large household appliances market if capital is not made available to them. The majority of local manufacturers are very skeptical about the industry and assistance to negotiate contracts from wholesalers or retailers is also required.
R&D: Level of support needed = 5
Manufacturers follow industry trends and R&D in South Africa is currently not economically viable. The R&D budgets available to international companies are enormous, for example, LG had a R&D budget of R36 billion in 2011. Large R&D budgets can be justified by the massive quantities and level of quality international manufacturers produce, for example, Whirlpool produced 54 million units in 2010.
Air Conditioners and Heaters Manufacturers
Figure 9: Level of Support needed for Local Manufacturers to produce more EE air conditioners and heaters
Skills Development: Level of support needed = 4
The low availability of relevant skilled professionals has a negative impact on the air conditioners manufacturing industry in South Africa. Most products can be easily manufactured locally; however, due to the skills shortage currently being experienced in the country, most suppliers are forced to import their products. The EE air conditioners market requires skilled personnel to undertake continuous research and development of advanced methods of saving energy through air conditioners. This requires advanced analysis and simulation through the use of various computer applications. Such processes are designed to
Increased Customer
Awareness, 4Skills
Development, 4
Legal Framework to ensure Market Uptake of EE Air Conditioners, 5
Key: 1=Very Low
2=Low3=Medium
4=High5=Very High
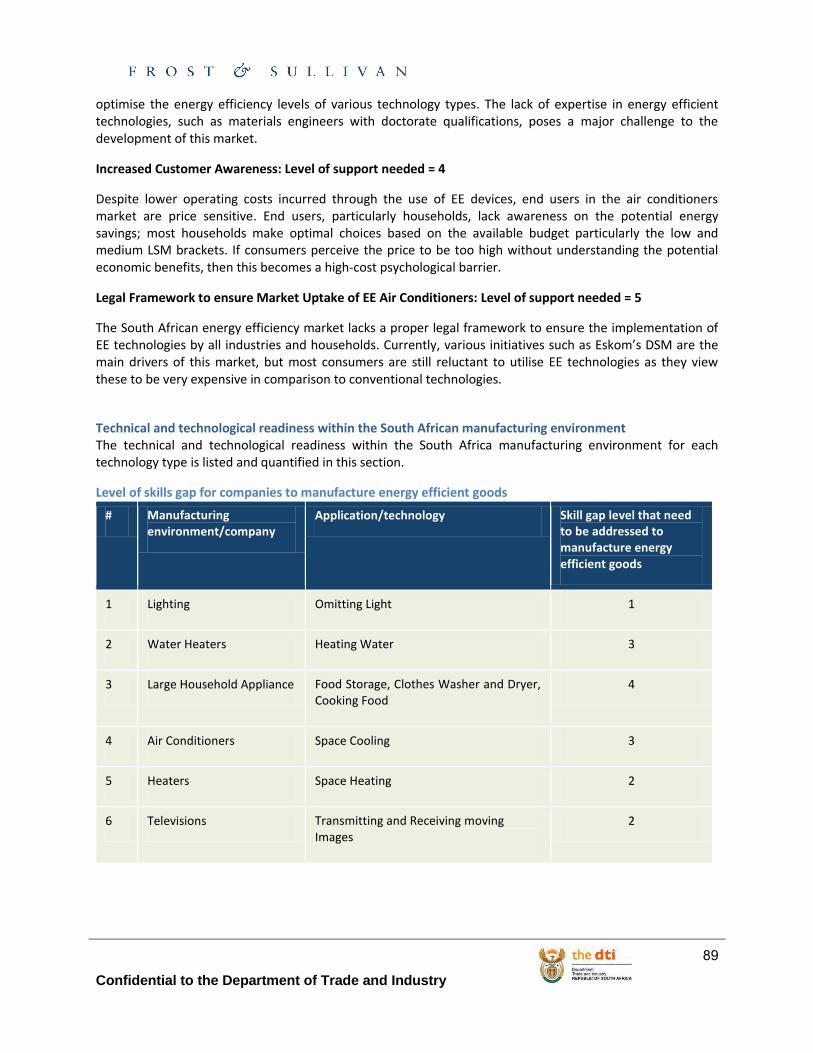
Confidential to the Department of Trade and Industry
89
optimise the energy efficiency levels of various technology types. The lack of expertise in energy efficient technologies, such as materials engineers with doctorate qualifications, poses a major challenge to the development of this market.
Increased Customer Awareness: Level of support needed = 4
Despite lower operating costs incurred through the use of EE devices, end users in the air conditioners market are price sensitive. End users, particularly households, lack awareness on the potential energy savings; most households make optimal choices based on the available budget particularly the low and medium LSM brackets. If consumers perceive the price to be too high without understanding the potential economic benefits, then this becomes a high-cost psychological barrier.
Legal Framework to ensure Market Uptake of EE Air Conditioners: Level of support needed = 5
The South African energy efficiency market lacks a proper legal framework to ensure the implementation of EE technologies by all industries and households. Currently, various initiatives such as Eskom’s DSM are the main drivers of this market, but most consumers are still reluctant to utilise EE technologies as they view these to be very expensive in comparison to conventional technologies.
Technical and technological readiness within the South African manufacturing environment The technical and technological readiness within the South Africa manufacturing environment for each technology type is listed and quantified in this section.
Level of skills gap for companies to manufacture energy efficient goods
# Manufacturing environment/company
Application/technology Skill gap level that need to be addressed to manufacture energy efficient goods
1 Lighting Omitting Light 1
2 Water Heaters Heating Water 3
3 Large Household Appliance Food Storage, Clothes Washer and Dryer, Cooking Food
4
4 Air Conditioners Space Cooling 3
5 Heaters Space Heating 2
6 Televisions Transmitting and Receiving moving Images
2
Confidential to the Department of Trade and Industry
90
Conclusions
Analysis of the South African manufacturing industry reveals that production facilities comprise of a combination of manufacturing and component assembly in varying degrees. The local industry has the technical and technological capabilities to manufacture energy efficient lighting, water heating, televisions and space heating devices. The market currently has energy efficient air conditioners and large household appliances; however, minimal local manufacturing of these devices takes place.
Challenges The manufacturing industry has come under a lot of pressure due to labour unrest, electricity price increments and fierce competition from imported goods. The leading international companies focus on the export market. This justifies the massive volumes of production that is needed in the large household appliances, air conditioners and television sector and large research and development (R&D) budgets. Most of the international companies are importing products either whole or as built up units. This is due to products being sourced cheaper from outside of South Africa. “It is cheaper to import steel and plastic than to buy it from the local suppliers 80 km from the manufacturing plant.”
Market increase Market uptake for energy efficient products is expected to increase in the large household appliance sector, lighting, water heaters, air conditioners and heaters. The only market whose uptake of energy efficient products is not expected to increase notably is that of the televisions manufacturing sector.
Energy efficiency attractiveness Energy efficiency is fast becoming one of the main selling points of electricity appliances, but the prominent selling points still remain price and brand. Despite the increase in consumer awareness of the benefits of energy efficiency devices over the past 10 years, government and industry still have to implement more strategies to further increase consumer awareness and hence EE product uptake to levels that make increased manufacturing of EE devices economically viable.
Energy efficient product awareness Labelling of energy efficient products have also had a major impact on increasing consumer awareness, but there exist more opportunities to widen the market influence of these labels. These labels are currently still widely unrecognised and only appear on a small number of the focus technologies under analysis. Clothing washing machines, dishwashers, clothing dryers use the European Union Energy labelling system whereas lighting and air conditioners use independent labelling. The majority of consumers view large appliances as an investment and small, inexpensive products as an expense. The benefits of EE labelling are extensive and international best practice cases presented in Stage 1 of this analysis discuss these benefits in detail.
Mind-set shift Focus should be shifted from manufacturing more energy efficient products in the large household appliance sector to the manufacturing of energy efficient components. There are only four manufacturers of large household appliances in South Africa (Defy, Univa, Bauer and Whirlpool).
In a bid to achieve a 10% reduction in energy demand in the residential sector by 2015, the DTI and the DoE have developed a common energy-efficiency action plan for household appliances that stipulates the implementation of a mandatory standards and labeling programme in the next two years for 12 appliances initially. This coupled with massive awareness campaigns and engagement of manufacturers and retailers should assist in ensuring mind-set shifts in consumers.
Confidential to the Department of Trade and Industry
91
Globalisation Globalisation has brought the consumer a greater selection of goods and has been the driving force behind lower prices. It has increased the level of competitiveness in South Africa. Local suppliers and manufacturers compete against international companies with large product ranges and massive producing capacity. The need for countries to keep a strong industrial sector is vital. This is even more important when taking into consideration emerging economy such as South Africa. Emerging economies need to move from being producers of raw materials to being producers of higher-value manufacturing or finished goods. An estimated decrease of 20,000 jobs in the white goods manufacturing sector took place in the last decade. Many of the raw materials, except steel, needed for white goods manufacturing are not produced in South Africa as international companies are more competitive than local companies. Local white goods manufacturers need to manufacture on the scale of the international companies to negotiate the cost of raw materials and components with suppliers.
“Local manufacturers have a responsibility to pay a fair wage and the ethics to produce safe, quality products, but they must do so with none of the rebates and incentives offered to their competitors in Asian and other countries. This makes it very difficult to compete on price.” – Dave McDonald
Government initiatives have to be implemented to level the playing field of the white goods manufacturer sector. This will allow the white goods and other manufacturing sectors in the country to strengthen.
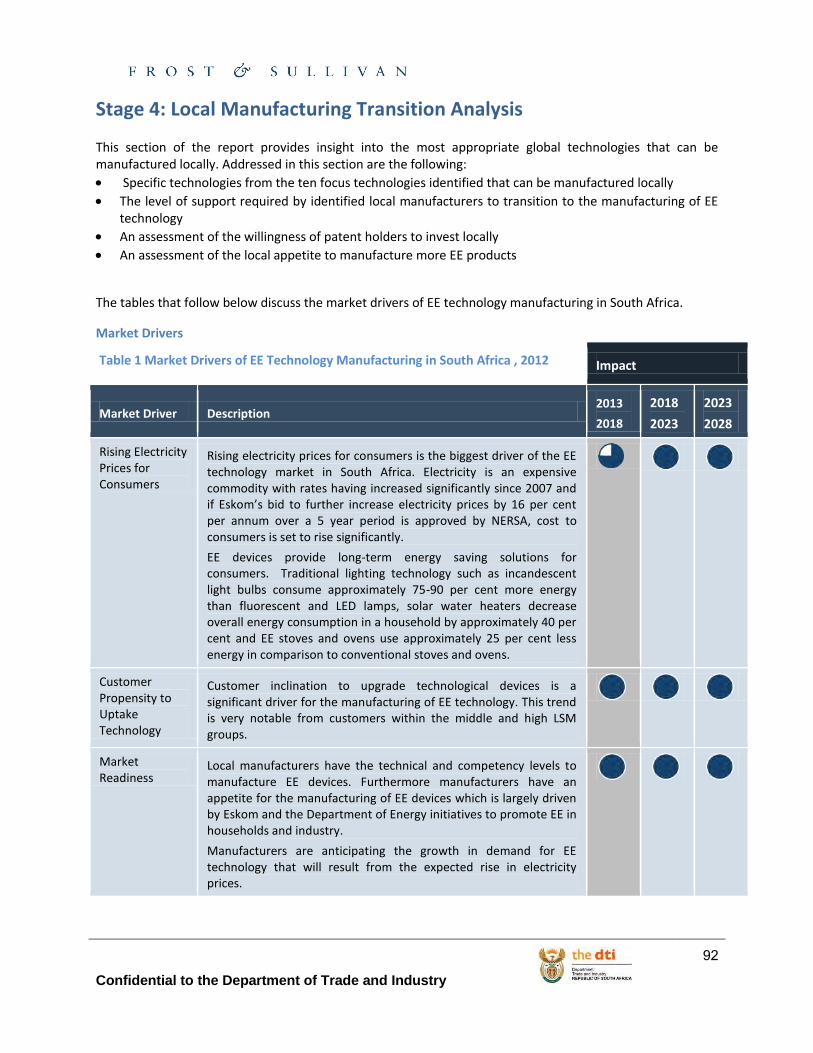
Confidential to the Department of Trade and Industry
92
Stage 4: Local Manufacturing Transition Analysis This section of the report provides insight into the most appropriate global technologies that can be manufactured locally. Addressed in this section are the following:
Specific technologies from the ten focus technologies identified that can be manufactured locally
The level of support required by identified local manufacturers to transition to the manufacturing of EE technology
An assessment of the willingness of patent holders to invest locally
An assessment of the local appetite to manufacture more EE products
The tables that follow below discuss the market drivers of EE technology manufacturing in South Africa.
Market Drivers
Table 1 Market Drivers of EE Technology Manufacturing in South Africa , 2012 Impact
Market Driver Description 2013
2018
2018
2023
2023
2028
Rising Electricity Prices for Consumers
Rising electricity prices for consumers is the biggest driver of the EE technology market in South Africa. Electricity is an expensive commodity with rates having increased significantly since 2007 and if Eskom’s bid to further increase electricity prices by 16 per cent per annum over a 5 year period is approved by NERSA, cost to consumers is set to rise significantly.
EE devices provide long-term energy saving solutions for consumers. Traditional lighting technology such as incandescent light bulbs consume approximately 75-90 per cent more energy than fluorescent and LED lamps, solar water heaters decrease overall energy consumption in a household by approximately 40 per cent and EE stoves and ovens use approximately 25 per cent less energy in comparison to conventional stoves and ovens.
Customer Propensity to Uptake Technology
Customer inclination to upgrade technological devices is a significant driver for the manufacturing of EE technology. This trend is very notable from customers within the middle and high LSM groups.
Market Readiness
Local manufacturers have the technical and competency levels to manufacture EE devices. Furthermore manufacturers have an appetite for the manufacturing of EE devices which is largely driven by Eskom and the Department of Energy initiatives to promote EE in households and industry.
Manufacturers are anticipating the growth in demand for EE technology that will result from the expected rise in electricity prices.
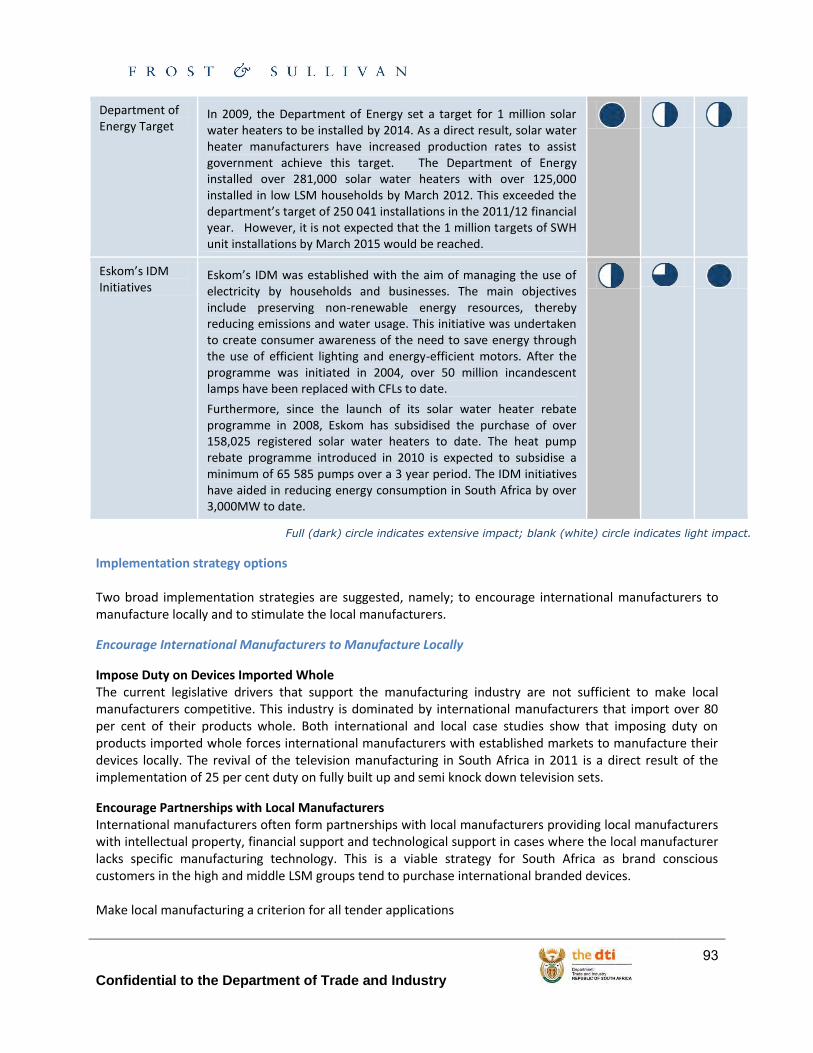
Confidential to the Department of Trade and Industry
93
Department of Energy Target
In 2009, the Department of Energy set a target for 1 million solar water heaters to be installed by 2014. As a direct result, solar water heater manufacturers have increased production rates to assist government achieve this target. The Department of Energy installed over 281,000 solar water heaters with over 125,000 installed in low LSM households by March 2012. This exceeded the department’s target of 250 041 installations in the 2011/12 financial year. However, it is not expected that the 1 million targets of SWH unit installations by March 2015 would be reached.
Eskom’s IDM Initiatives
Eskom’s IDM was established with the aim of managing the use of electricity by households and businesses. The main objectives include preserving non-renewable energy resources, thereby reducing emissions and water usage. This initiative was undertaken to create consumer awareness of the need to save energy through the use of efficient lighting and energy-efficient motors. After the programme was initiated in 2004, over 50 million incandescent lamps have been replaced with CFLs to date.
Furthermore, since the launch of its solar water heater rebate programme in 2008, Eskom has subsidised the purchase of over 158,025 registered solar water heaters to date. The heat pump rebate programme introduced in 2010 is expected to subsidise a minimum of 65 585 pumps over a 3 year period. The IDM initiatives have aided in reducing energy consumption in South Africa by over 3,000MW to date.
Implementation strategy options
Two broad implementation strategies are suggested, namely; to encourage international manufacturers to manufacture locally and to stimulate the local manufacturers.
Encourage International Manufacturers to Manufacture Locally
Impose Duty on Devices Imported Whole The current legislative drivers that support the manufacturing industry are not sufficient to make local manufacturers competitive. This industry is dominated by international manufacturers that import over 80 per cent of their products whole. Both international and local case studies show that imposing duty on products imported whole forces international manufacturers with established markets to manufacture their devices locally. The revival of the television manufacturing in South Africa in 2011 is a direct result of the implementation of 25 per cent duty on fully built up and semi knock down television sets.
Encourage Partnerships with Local Manufacturers International manufacturers often form partnerships with local manufacturers providing local manufacturers with intellectual property, financial support and technological support in cases where the local manufacturer lacks specific manufacturing technology. This is a viable strategy for South Africa as brand conscious customers in the high and middle LSM groups tend to purchase international branded devices. Make local manufacturing a criterion for all tender applications
Full (dark) circle indicates extensive impact; blank (white) circle indicates light impact. Source: Frost & Sullivan

Confidential to the Department of Trade and Industry
94
The market is saturated with low priced, poor quality Chinese products. This poses a challenge for local manufacturers regardless of their target customers. Through making local manufacturing a criterion for all tender applications, the local market can be stimulated. Analysis of the South African manufacturing industry reveals that all ten focus technologies identified can be manufactured locally. Stimulate Local Manufacturers
Favourable Funding Structures It is suggested that local manufacturers could be supported with upfront development costs for machinery, equipment and facility development. Frost & Sullivan recommends that the DTI set up a task team to engage with financial institutions and service providers to identify alternative funding structures and develop an understanding of the way these instruments work on a practical level.
Skills Development In general, in the local manufacturing industry, there are no major technical skill gaps. In-house training is recommended to fill the operational gaps that exist. Furthermore, support for R&D activities to obtain granular information on the most recent technology and process available in the market and those most relevant to the South African market is suggested.
Government Support Government can support the local manufacturing of EE devices through initiatives to create end user awareness. EE awareness initiatives are needed and should be tailored to the market needs. Different campaigns must be used to focus on the different sectors and LSM groups (household, residential, agricultural and commercial).
Financial Incentives Financial incentives, including tax breaks will further stimulate the market. Grants, subsidies, soft loans and subsidies will incentivise the manufacturing of EE technologies. Frost & Sullivan recommends that the DTI set up a task team to engage with financial institutions and service providers to identify alternative funding structures and develop an understanding of the way these instruments work on a practical level.
Tax breaks Lowering the tax brackets that EE manufacturers fall under is likely to encourage increased manufacturing of EE devices. Objective 2: Describe the level of support needed to convert to newer technologies There are some general trends that have been identified throughout the different technologies in terms of the support needed to convert to newer technologies. These trends will be discussed in this section, followed by the specific support needed for each individual technology.
General Trends
Stimulate the end user market EE awareness initiatives are needed to stimulate the end user market. The average South African consumer is not aware of the concept of energy efficiency and there is still a large part of the end-user market that is unaware of EE technologies and the potential energy savings. EE awareness initiatives need to be tailored to the market needs. Different campaigns must be used to focus on the different sectors and LSM groups (household, residential, agricultural and commercial).
Confidential to the Department of Trade and Industry
95
Furthermore, consumers should not only be informed, but the focus must also be to change the selection criteria of consumers when purchasing relevant technology. It was found that residential consumers reverted back to incandescent light bulbs even after an Eskom CFL light bulb drive (during 2006/07), due to mainly cost and functionality drivers.
It is predicted that the increasing tariffs might effectively force market participants to become less energy intensive and switch to EE devices.
EE awareness initiatives for end users can include:
Two price system One example of an EE awareness initiative is a two price system. This is a system where the first price on the technology applies to the technology cost (capital cost), and the second price on the technology applies to the overall technology cost (similar to a levelised cost) which includes the energy savings built into the cost.
Energy labeling system An energy labeling system includes a label on the technology or process which ensures the market participant that the technology has not only passed the relevant industry standards, but also that the technology is “green”. This means that it is seen as energy efficient. An example is the Energy Star labeling system in the USA.
It is important to note that only providing information (in the absence of incentives) can result in no real change thus, a combination of information and incentives should be considered. A voluntary appliance labeling programme for refrigerators was introduced in South Africa in 2005. This voluntary programme, however, failed in the implementation stage due to the following reasons:
The initiative was launched when electricity price increments were still in line with inflation, therefore households paid minimal attention to running costs of appliances
The initiative did not have sufficient funds for an effective communication and awareness campaign; the limited expose the initiative received was disorganized
Training and motivation of retail personnel was not conducted
As a direct result, manufacturers, importers, wholesalers and retailers did not buy into this scheme. This was exacerbated by the fact that the program was voluntary; suppliers based their decision to participate in this initiative on for consumer feedback. This in turn, served to further hamper consumer public awareness as consumers barely saw these labels on devices in retail outlets.
In a bid to achieve a 10% reduction in energy demand in the residential sector by 2015, the DTI and the DoE have developed a common energy-efficiency action plan for household appliances that stipulates the implementation of a mandatory standards and labeling programme in the next two years for 12 appliances initially. In order to allow manufacturers, importers, wholesalers and retailers to time accordingly for this change, a voluntary system will be introduced initially followed by a mandatory system in 2014. This is further meant to allow government to introduce awareness programmes to inform consumers on the features and benefits of purchasing appropriate energy efficient devices.
The SABS has already drafted a number of standards for this purpose and the NRCS is set to introduce compulsory specifications to ensure that these standards are enforced. This initiative is expected to be more effective that the initiative attempted in 2005 as manufacturers will be forced to adhere to this initiative and consumers are now very sensitive to electricity costs.
Confidential to the Department of Trade and Industry
96
Financial Support
End User Support It is suggested that government provide funds for loans to be allocated to households or industries to encourage the purchase of EE products. Fiscal measures and tax incentives include grants, subsidies and soft loans for EE investments or the direct procurement of EE goods and devices.
Manufacturers Support The best way to sustainably support local manufacturers would be to set up legislation. Furthermore, local manufacturers could be supported with upfront development cost for machinery, equipment and facility development.
Technology Development Financial support specifically for the development and demonstration of EE technologies is needed. It is suggested that research and development activities to obtain granular information on the most recent technology and processes available in the market should be initiated. Investment into those most relevant to the South African market should be made.
Where the technology or process is lacking or insufficient to satisfy the specific market participant or sectors’ needs, then product development could be considered.
It is important to note that there are not specific quantitative data available for all the individual technologies to give an idea of the level of financial support needed. The level of financial support needed will vary for each individual case over all the different technologies. It is suggested that detailed studies into the different technologies should be done to determine the specific investment needed to stimulate market growth.
Environmental awareness initiatives Increasing the environmental awareness of the general public, will drive market participants to enhance their “green conscience” activities and facilitate the move towards EE technologies.
The government can consider providing home energy audit services for higher income end users. Interested households could be provided with information and measures to increase EE and this will stimulate the market. This will, however, lead to the need to invest in local skills development, as individuals should be trained in energy auditing.
Policy Formulation It is suggested that import duties could be imposed and that regulations should be developed to manage the influx of products from the East. Various market participants purchased products from China and other Eastern regions as they are mainly driven by cost factors. These products have often not been tested to SABS or other industry standards, resulting in sub-standard products flooding the market and leading to a decline in consumer satisfaction and propensity to uptake EE technologies (due to negative experiences on the side of the consumer).
Furthermore, the aftermarket service is often lacking, with service providers and manufacturers not having a local footprint.
Technology Specific Trends The level of financial, technological, skills development and government support needed over all the different technologies will be discussed.
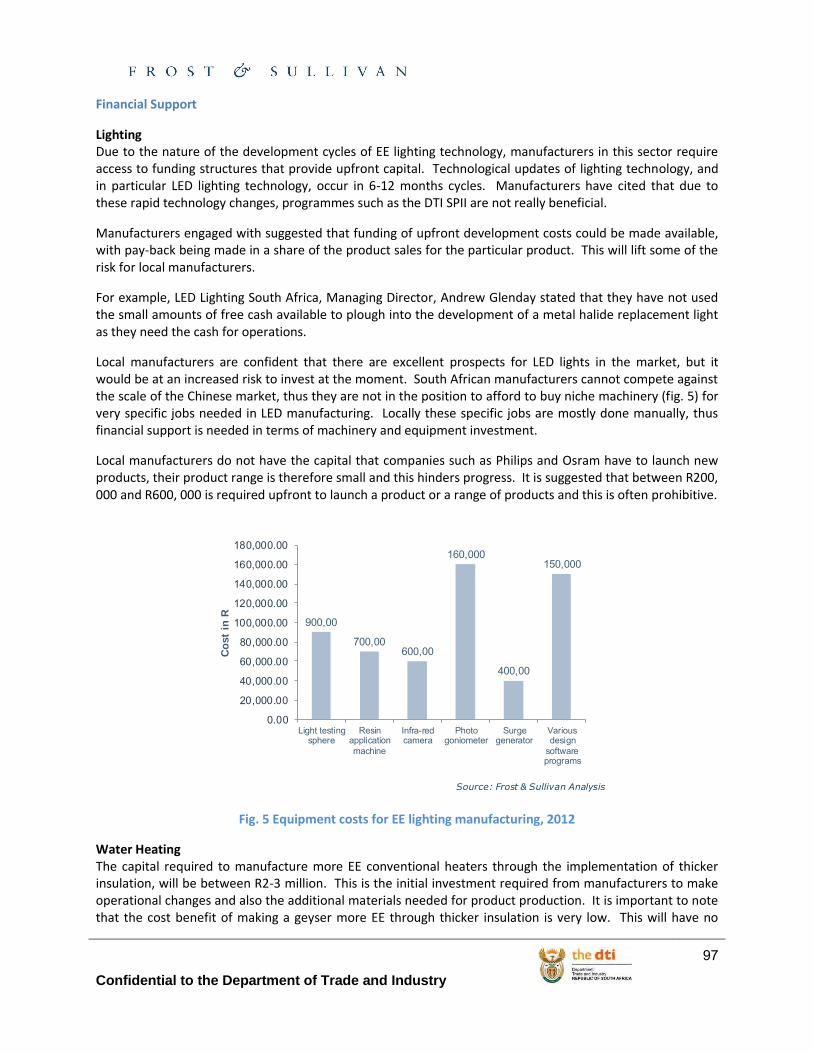
Confidential to the Department of Trade and Industry
97
Financial Support
Lighting Due to the nature of the development cycles of EE lighting technology, manufacturers in this sector require access to funding structures that provide upfront capital. Technological updates of lighting technology, and in particular LED lighting technology, occur in 6-12 months cycles. Manufacturers have cited that due to these rapid technology changes, programmes such as the DTI SPII are not really beneficial.
Manufacturers engaged with suggested that funding of upfront development costs could be made available, with pay-back being made in a share of the product sales for the particular product. This will lift some of the risk for local manufacturers.
For example, LED Lighting South Africa, Managing Director, Andrew Glenday stated that they have not used the small amounts of free cash available to plough into the development of a metal halide replacement light as they need the cash for operations.
Local manufacturers are confident that there are excellent prospects for LED lights in the market, but it would be at an increased risk to invest at the moment. South African manufacturers cannot compete against the scale of the Chinese market, thus they are not in the position to afford to buy niche machinery (fig. 5) for very specific jobs needed in LED manufacturing. Locally these specific jobs are mostly done manually, thus financial support is needed in terms of machinery and equipment investment.
Local manufacturers do not have the capital that companies such as Philips and Osram have to launch new products, their product range is therefore small and this hinders progress. It is suggested that between R200, 000 and R600, 000 is required upfront to launch a product or a range of products and this is often prohibitive.
Fig. 5 Equipment costs for EE lighting manufacturing, 2012
Water Heating The capital required to manufacture more EE conventional heaters through the implementation of thicker insulation, will be between R2-3 million. This is the initial investment required from manufacturers to make operational changes and also the additional materials needed for product production. It is important to note that the cost benefit of making a geyser more EE through thicker insulation is very low. This will have no
900,00
700,00600,00
160,000
400,00
150,000
0.00
20,000.00
40,000.00
60,000.00
80,000.00
100,000.00
120,000.00
140,000.00
160,000.00
180,000.00
Light testingsphere
Resinapplicationmachine
Infra-redcamera
Photogoniometer
Surgegenerator
Variousdesign
softwareprograms
Co
st
in R
Source: Frost & Sullivan Analysis
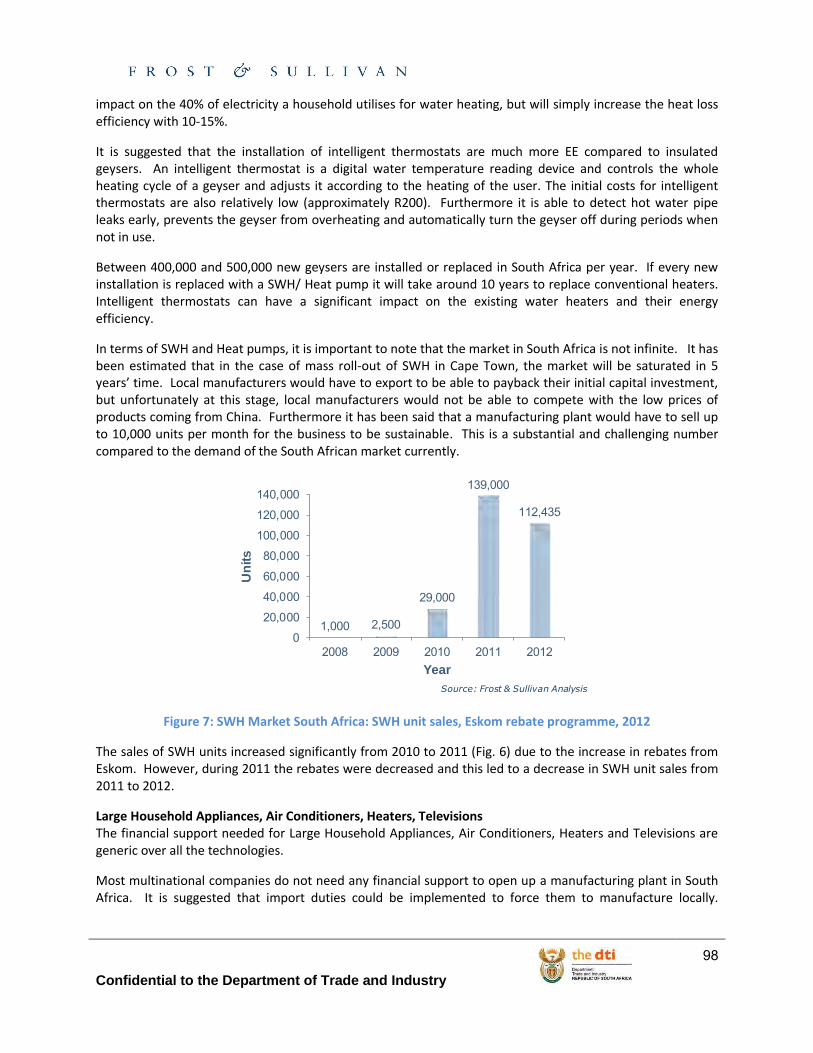
Confidential to the Department of Trade and Industry
98
impact on the 40% of electricity a household utilises for water heating, but will simply increase the heat loss efficiency with 10-15%.
It is suggested that the installation of intelligent thermostats are much more EE compared to insulated geysers. An intelligent thermostat is a digital water temperature reading device and controls the whole heating cycle of a geyser and adjusts it according to the heating of the user. The initial costs for intelligent thermostats are also relatively low (approximately R200). Furthermore it is able to detect hot water pipe leaks early, prevents the geyser from overheating and automatically turn the geyser off during periods when not in use.
Between 400,000 and 500,000 new geysers are installed or replaced in South Africa per year. If every new installation is replaced with a SWH/ Heat pump it will take around 10 years to replace conventional heaters. Intelligent thermostats can have a significant impact on the existing water heaters and their energy efficiency.
In terms of SWH and Heat pumps, it is important to note that the market in South Africa is not infinite. It has been estimated that in the case of mass roll-out of SWH in Cape Town, the market will be saturated in 5 years’ time. Local manufacturers would have to export to be able to payback their initial capital investment, but unfortunately at this stage, local manufacturers would not be able to compete with the low prices of products coming from China. Furthermore it has been said that a manufacturing plant would have to sell up to 10,000 units per month for the business to be sustainable. This is a substantial and challenging number compared to the demand of the South African market currently.
Figure 7: SWH Market South Africa: SWH unit sales, Eskom rebate programme, 2012
The sales of SWH units increased significantly from 2010 to 2011 (Fig. 6) due to the increase in rebates from Eskom. However, during 2011 the rebates were decreased and this led to a decrease in SWH unit sales from 2011 to 2012.
Large Household Appliances, Air Conditioners, Heaters, Televisions The financial support needed for Large Household Appliances, Air Conditioners, Heaters and Televisions are generic over all the technologies.
Most multinational companies do not need any financial support to open up a manufacturing plant in South Africa. It is suggested that import duties could be implemented to force them to manufacture locally.
1,000 2,500
29,000
139,000
112,435
0
20,000
40,000
60,000
80,000
100,000
120,000
140,000
2008 2009 2010 2011 2012
Un
its
Year
Source: Frost & Sullivan Analysis
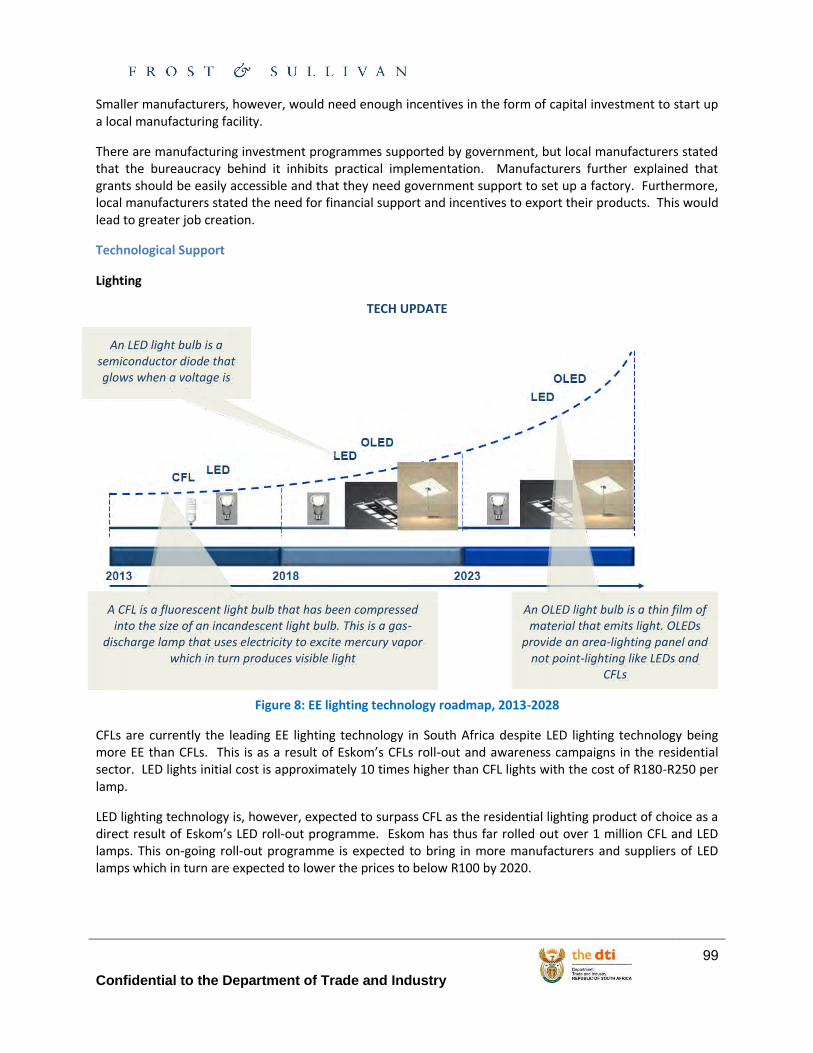
Confidential to the Department of Trade and Industry
99
Smaller manufacturers, however, would need enough incentives in the form of capital investment to start up a local manufacturing facility.
There are manufacturing investment programmes supported by government, but local manufacturers stated that the bureaucracy behind it inhibits practical implementation. Manufacturers further explained that grants should be easily accessible and that they need government support to set up a factory. Furthermore, local manufacturers stated the need for financial support and incentives to export their products. This would lead to greater job creation.
Technological Support
Lighting
TECH UPDATE
Figure 8: EE lighting technology roadmap, 2013-2028
CFLs are currently the leading EE lighting technology in South Africa despite LED lighting technology being more EE than CFLs. This is as a result of Eskom’s CFLs roll-out and awareness campaigns in the residential sector. LED lights initial cost is approximately 10 times higher than CFL lights with the cost of R180-R250 per lamp.
LED lighting technology is, however, expected to surpass CFL as the residential lighting product of choice as a direct result of Eskom’s LED roll-out programme. Eskom has thus far rolled out over 1 million CFL and LED lamps. This on-going roll-out programme is expected to bring in more manufacturers and suppliers of LED lamps which in turn are expected to lower the prices to below R100 by 2020.
A CFL is a fluorescent light bulb that has been compressed into the size of an incandescent light bulb. This is a gas-
discharge lamp that uses electricity to excite mercury vapor which in turn produces visible light
An LED light bulb is a semiconductor diode that glows when a voltage is
applied
An OLED light bulb is a thin film of material that emits light. OLEDs
provide an area-lighting panel and not point-lighting like LEDs and
CFLs
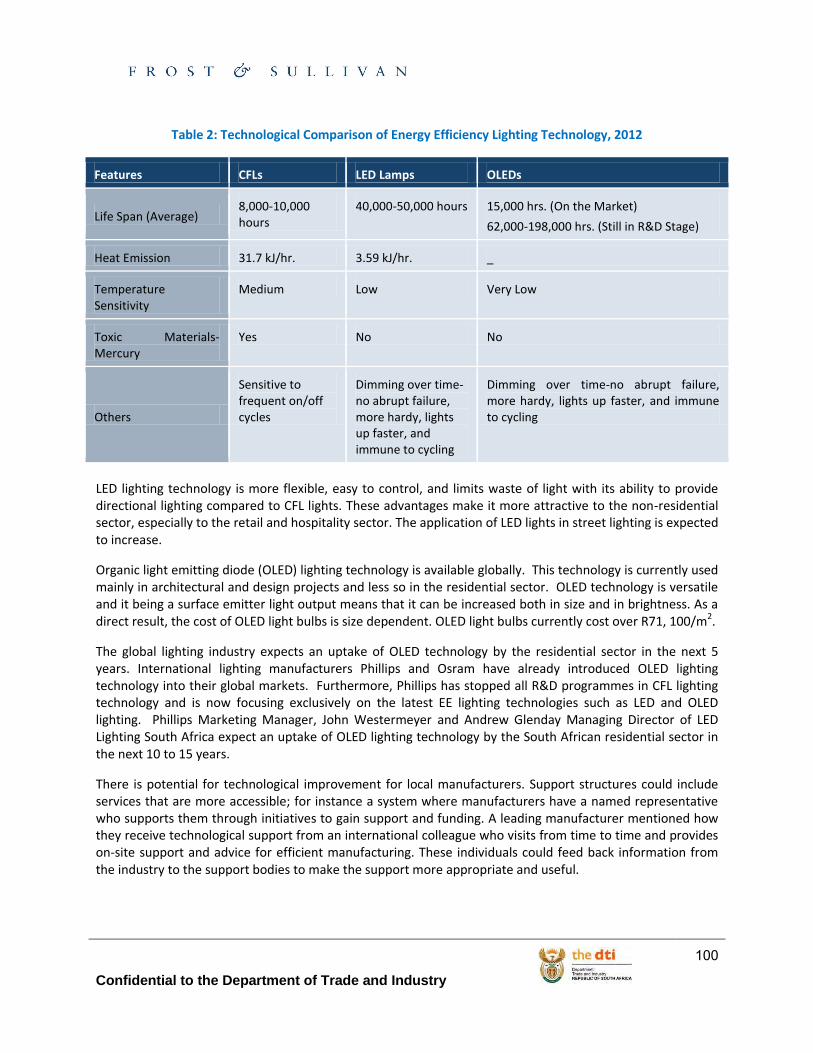
Confidential to the Department of Trade and Industry
100
Table 2: Technological Comparison of Energy Efficiency Lighting Technology, 2012
Features CFLs LED Lamps OLEDs
Life Span (Average) 8,000-10,000 hours
40,000-50,000 hours 15,000 hrs. (On the Market)
62,000-198,000 hrs. (Still in R&D Stage)
Heat Emission 31.7 kJ/hr. 3.59 kJ/hr. _
Temperature Sensitivity
Medium Low Very Low
Toxic Materials-Mercury
Yes No No
Others
Sensitive to frequent on/off cycles
Dimming over time-no abrupt failure, more hardy, lights up faster, and immune to cycling
Dimming over time-no abrupt failure, more hardy, lights up faster, and immune to cycling
LED lighting technology is more flexible, easy to control, and limits waste of light with its ability to provide directional lighting compared to CFL lights. These advantages make it more attractive to the non-residential sector, especially to the retail and hospitality sector. The application of LED lights in street lighting is expected to increase.
Organic light emitting diode (OLED) lighting technology is available globally. This technology is currently used mainly in architectural and design projects and less so in the residential sector. OLED technology is versatile and it being a surface emitter light output means that it can be increased both in size and in brightness. As a direct result, the cost of OLED light bulbs is size dependent. OLED light bulbs currently cost over R71, 100/m2.
The global lighting industry expects an uptake of OLED technology by the residential sector in the next 5 years. International lighting manufacturers Phillips and Osram have already introduced OLED lighting technology into their global markets. Furthermore, Phillips has stopped all R&D programmes in CFL lighting technology and is now focusing exclusively on the latest EE lighting technologies such as LED and OLED lighting. Phillips Marketing Manager, John Westermeyer and Andrew Glenday Managing Director of LED Lighting South Africa expect an uptake of OLED lighting technology by the South African residential sector in the next 10 to 15 years.
There is potential for technological improvement for local manufacturers. Support structures could include services that are more accessible; for instance a system where manufacturers have a named representative who supports them through initiatives to gain support and funding. A leading manufacturer mentioned how they receive technological support from an international colleague who visits from time to time and provides on-site support and advice for efficient manufacturing. These individuals could feed back information from the industry to the support bodies to make the support more appropriate and useful.
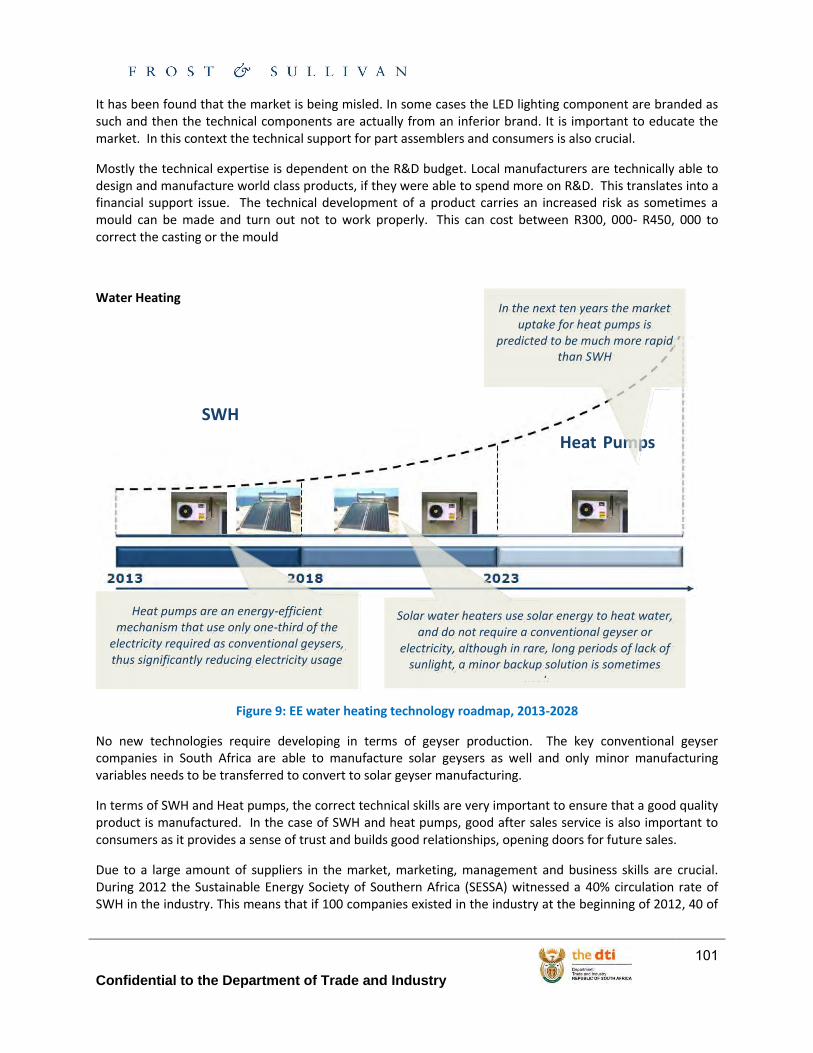
Confidential to the Department of Trade and Industry
101
It has been found that the market is being misled. In some cases the LED lighting component are branded as such and then the technical components are actually from an inferior brand. It is important to educate the market. In this context the technical support for part assemblers and consumers is also crucial.
Mostly the technical expertise is dependent on the R&D budget. Local manufacturers are technically able to design and manufacture world class products, if they were able to spend more on R&D. This translates into a financial support issue. The technical development of a product carries an increased risk as sometimes a mould can be made and turn out not to work properly. This can cost between R300, 000- R450, 000 to correct the casting or the mould
Water Heating
Figure 9: EE water heating technology roadmap, 2013-2028
No new technologies require developing in terms of geyser production. The key conventional geyser companies in South Africa are able to manufacture solar geysers as well and only minor manufacturing variables needs to be transferred to convert to solar geyser manufacturing.
In terms of SWH and Heat pumps, the correct technical skills are very important to ensure that a good quality product is manufactured. In the case of SWH and heat pumps, good after sales service is also important to consumers as it provides a sense of trust and builds good relationships, opening doors for future sales.
Due to a large amount of suppliers in the market, marketing, management and business skills are crucial. During 2012 the Sustainable Energy Society of Southern Africa (SESSA) witnessed a 40% circulation rate of SWH in the industry. This means that if 100 companies existed in the industry at the beginning of 2012, 40 of
Heat Pumps
SWH
Heat pumps are an energy-efficient mechanism that use only one-third of the
electricity required as conventional geysers, thus significantly reducing electricity usage
Solar water heaters use solar energy to heat water, and do not require a conventional geyser or
electricity, although in rare, long periods of lack of sunlight, a minor backup solution is sometimes
used.
In the next ten years the market uptake for heat pumps is
predicted to be much more rapid than SWH

Confidential to the Department of Trade and Industry
102
them would have left the industry by the end of the year. However, these 40 companies would have been replaced by other companies who wanted to invest in the industry.
Heat Pumps are a relatively new technology to the SA residential market and have been SABS approved in November 2012.
Large Household Appliances
Figure 10: EE Refrigerators Technology Roadmap, 2013-2028
Air Conditioners In the air conditioners industry, a great deal of the problems with efficiency is found in the system design and the efficiency of individual components. The biggest problem is that the motor to which the pump is attached is incorrectly sized. The major technological development in terms of energy savings for air conditioners are in the system components, for instance compressors and not in the device iteself.
Building owners are not taking full advantage of the various control and heat recovery devices that, when applied to the ventilation system, can reduce the energy consumed for heating and cooling. The use of a tracer summit control system on a water chilled system can improve a system’s efficiency by as much as 10%.
In the last 7 or 8 years inverter controlled units were introduced that saves about 30% of electricity. With smaller systems, the use of an inverter greatly improves the systems efficiency. Inverters allow for only the power required to be utilised.
A linear compressor is a gas compressor where the piston moves along a linear
track to compress to minimise energy loss during conversion. This device is found in
refrigerators and air conditioners
Solid-state lighting refers to a type of lighting that uses
semiconductor light-emitting diodes (LEDs) and organic light-
emitting diodes (OLED) as sources of illumination
Time to commercialization for SSPL is expect in the coming 5-10 years
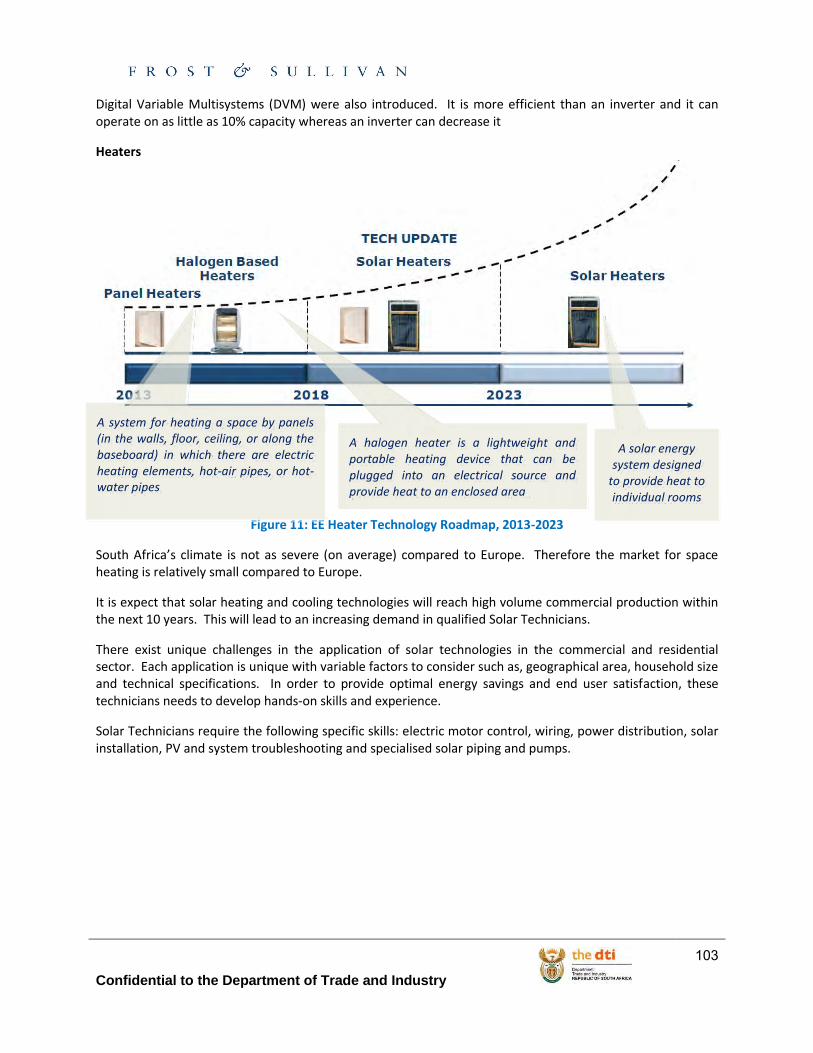
Confidential to the Department of Trade and Industry
103
Digital Variable Multisystems (DVM) were also introduced. It is more efficient than an inverter and it can operate on as little as 10% capacity whereas an inverter can decrease it
Heaters
Figure 11: EE Heater Technology Roadmap, 2013-2023
South Africa’s climate is not as severe (on average) compared to Europe. Therefore the market for space heating is relatively small compared to Europe.
It is expect that solar heating and cooling technologies will reach high volume commercial production within the next 10 years. This will lead to an increasing demand in qualified Solar Technicians.
There exist unique challenges in the application of solar technologies in the commercial and residential sector. Each application is unique with variable factors to consider such as, geographical area, household size and technical specifications. In order to provide optimal energy savings and end user satisfaction, these technicians needs to develop hands-on skills and experience.
Solar Technicians require the following specific skills: electric motor control, wiring, power distribution, solar installation, PV and system troubleshooting and specialised solar piping and pumps.
A system for heating a space by panels (in the walls, floor, ceiling, or along the baseboard) in which there are electric heating elements, hot-air pipes, or hot-water pipes
A halogen heater is a lightweight and portable heating device that can be plugged into an electrical source and provide heat to an enclosed area.
A solar energy system designed
to provide heat to individual rooms
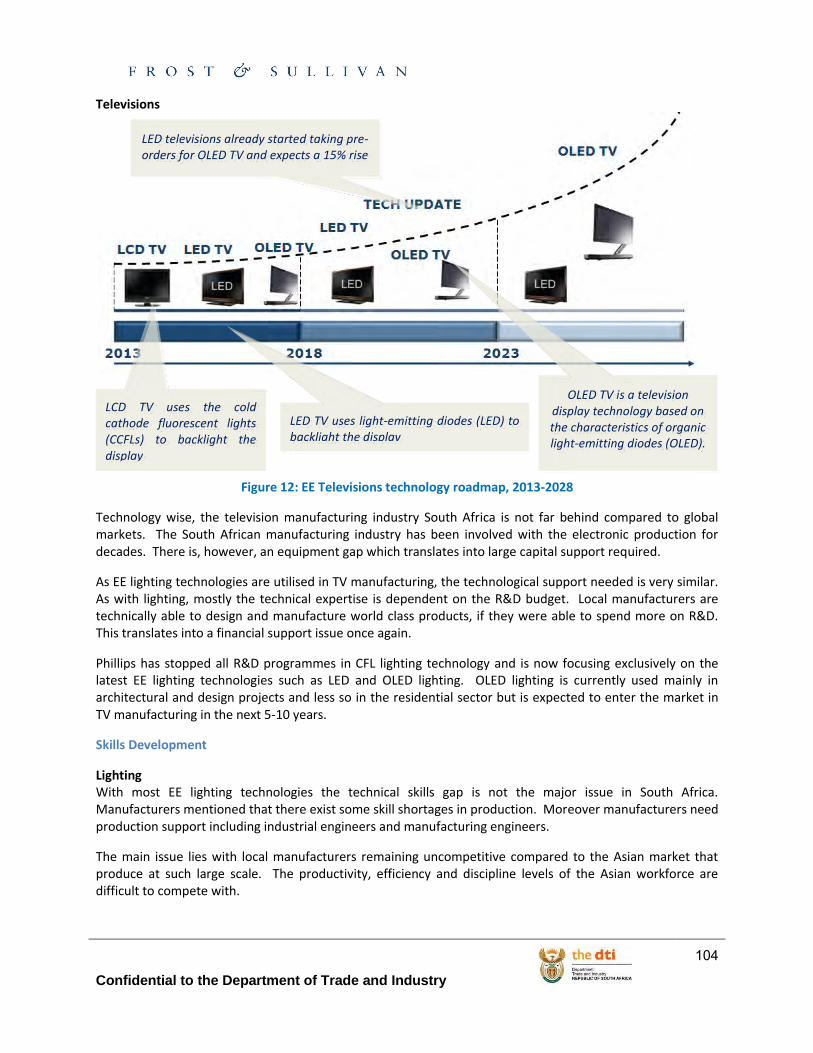
Confidential to the Department of Trade and Industry
104
Televisions
Figure 12: EE Televisions technology roadmap, 2013-2028
Technology wise, the television manufacturing industry South Africa is not far behind compared to global markets. The South African manufacturing industry has been involved with the electronic production for decades. There is, however, an equipment gap which translates into large capital support required.
As EE lighting technologies are utilised in TV manufacturing, the technological support needed is very similar. As with lighting, mostly the technical expertise is dependent on the R&D budget. Local manufacturers are technically able to design and manufacture world class products, if they were able to spend more on R&D. This translates into a financial support issue once again.
Phillips has stopped all R&D programmes in CFL lighting technology and is now focusing exclusively on the latest EE lighting technologies such as LED and OLED lighting. OLED lighting is currently used mainly in architectural and design projects and less so in the residential sector but is expected to enter the market in TV manufacturing in the next 5-10 years.
Skills Development
Lighting With most EE lighting technologies the technical skills gap is not the major issue in South Africa. Manufacturers mentioned that there exist some skill shortages in production. Moreover manufacturers need production support including industrial engineers and manufacturing engineers.
The main issue lies with local manufacturers remaining uncompetitive compared to the Asian market that produce at such large scale. The productivity, efficiency and discipline levels of the Asian workforce are difficult to compete with.
LED televisions already started taking pre-orders for OLED TV and expects a 15% rise
in sales in 2013
LCD TV uses the cold cathode fluorescent lights (CCFLs) to backlight the display
LED TV uses light-emitting diodes (LED) to backlight the display
OLED TV is a television display technology based on the characteristics of organic light-emitting diodes (OLED).
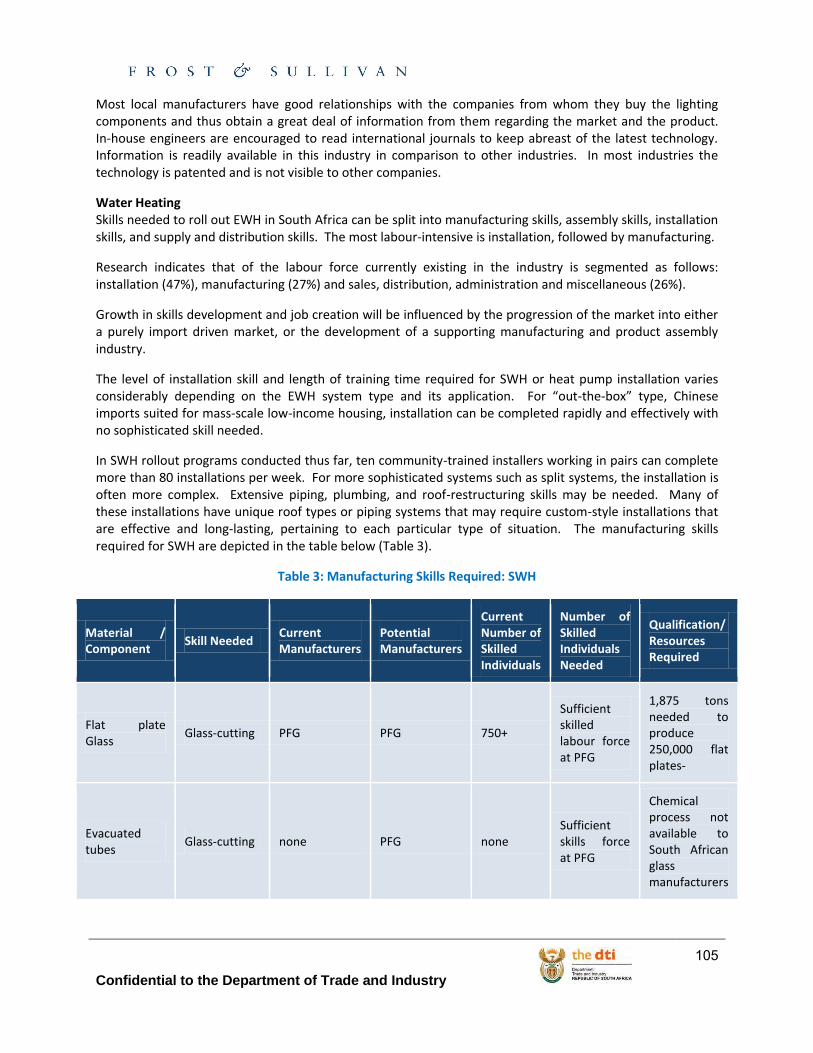
Confidential to the Department of Trade and Industry
105
Most local manufacturers have good relationships with the companies from whom they buy the lighting components and thus obtain a great deal of information from them regarding the market and the product. In-house engineers are encouraged to read international journals to keep abreast of the latest technology. Information is readily available in this industry in comparison to other industries. In most industries the technology is patented and is not visible to other companies.
Water Heating Skills needed to roll out EWH in South Africa can be split into manufacturing skills, assembly skills, installation skills, and supply and distribution skills. The most labour-intensive is installation, followed by manufacturing.
Research indicates that of the labour force currently existing in the industry is segmented as follows: installation (47%), manufacturing (27%) and sales, distribution, administration and miscellaneous (26%).
Growth in skills development and job creation will be influenced by the progression of the market into either a purely import driven market, or the development of a supporting manufacturing and product assembly industry.
The level of installation skill and length of training time required for SWH or heat pump installation varies considerably depending on the EWH system type and its application. For “out-the-box” type, Chinese imports suited for mass-scale low-income housing, installation can be completed rapidly and effectively with no sophisticated skill needed.
In SWH rollout programs conducted thus far, ten community-trained installers working in pairs can complete more than 80 installations per week. For more sophisticated systems such as split systems, the installation is often more complex. Extensive piping, plumbing, and roof-restructuring skills may be needed. Many of these installations have unique roof types or piping systems that may require custom-style installations that are effective and long-lasting, pertaining to each particular type of situation. The manufacturing skills required for SWH are depicted in the table below (Table 3).
Table 3: Manufacturing Skills Required: SWH
Material / Component
Skill Needed Current Manufacturers
Potential Manufacturers
Current Number of Skilled Individuals
Number of Skilled Individuals Needed
Qualification/ Resources Required
Flat plate Glass
Glass-cutting PFG PFG 750+
Sufficient skilled labour force at PFG
1,875 tons needed to produce 250,000 flat plates-
Evacuated tubes
Glass-cutting none PFG none Sufficient skills force at PFG
Chemical process not available to South African glass manufacturers
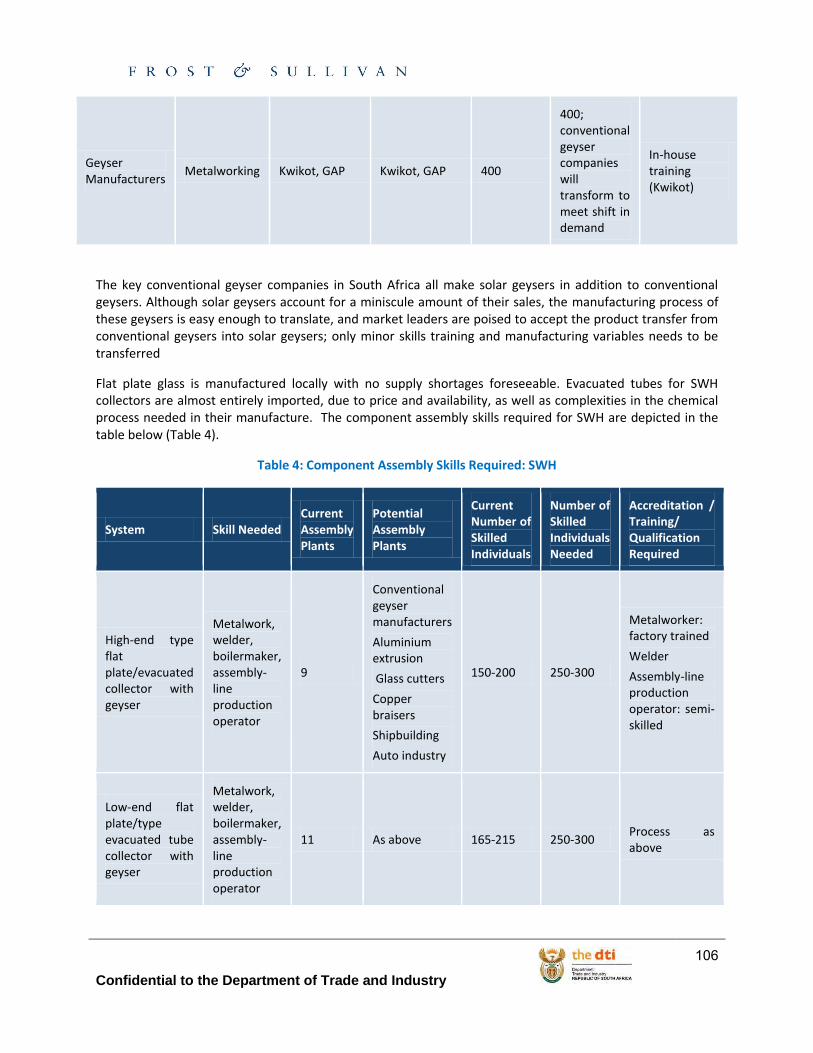
Confidential to the Department of Trade and Industry
106
Geyser Manufacturers
Metalworking Kwikot, GAP Kwikot, GAP 400
400; conventional geyser companies will transform to meet shift in demand
In-house training (Kwikot)
The key conventional geyser companies in South Africa all make solar geysers in addition to conventional geysers. Although solar geysers account for a miniscule amount of their sales, the manufacturing process of these geysers is easy enough to translate, and market leaders are poised to accept the product transfer from conventional geysers into solar geysers; only minor skills training and manufacturing variables needs to be transferred
Flat plate glass is manufactured locally with no supply shortages foreseeable. Evacuated tubes for SWH collectors are almost entirely imported, due to price and availability, as well as complexities in the chemical process needed in their manufacture. The component assembly skills required for SWH are depicted in the table below (Table 4).
Table 4: Component Assembly Skills Required: SWH
System Skill Needed Current Assembly Plants
Potential Assembly Plants
Current Number of Skilled Individuals
Number of Skilled Individuals Needed
Accreditation / Training/ Qualification Required
High-end type flat plate/evacuated collector with geyser
Metalwork, welder, boilermaker, assembly-line production operator
9
Conventional geyser manufacturers
Aluminium extrusion
Glass cutters
Copper braisers
Shipbuilding
Auto industry
150-200 250-300
Metalworker: factory trained
Welder
Assembly-line production operator: semi-skilled
Low-end flat plate/type evacuated tube collector with geyser
Metalwork, welder, boilermaker, assembly-line production operator
11 As above 165-215 250-300 Process as above
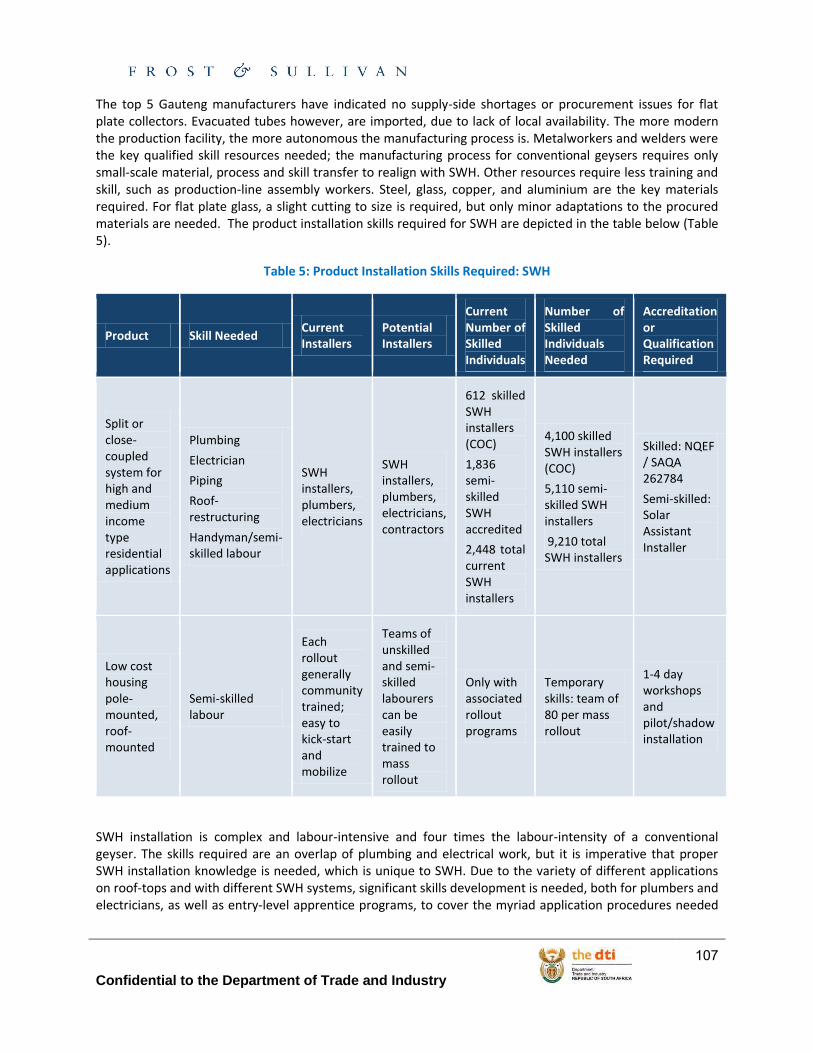
Confidential to the Department of Trade and Industry
107
The top 5 Gauteng manufacturers have indicated no supply-side shortages or procurement issues for flat plate collectors. Evacuated tubes however, are imported, due to lack of local availability. The more modern the production facility, the more autonomous the manufacturing process is. Metalworkers and welders were the key qualified skill resources needed; the manufacturing process for conventional geysers requires only small-scale material, process and skill transfer to realign with SWH. Other resources require less training and skill, such as production-line assembly workers. Steel, glass, copper, and aluminium are the key materials required. For flat plate glass, a slight cutting to size is required, but only minor adaptations to the procured materials are needed. The product installation skills required for SWH are depicted in the table below (Table 5).
Table 5: Product Installation Skills Required: SWH
Product Skill Needed Current Installers
Potential Installers
Current Number of Skilled Individuals
Number of Skilled Individuals Needed
Accreditation or Qualification Required
Split or close-coupled system for high and medium income type residential applications
Plumbing
Electrician
Piping
Roof-restructuring
Handyman/semi-skilled labour
SWH installers, plumbers, electricians
SWH installers, plumbers, electricians, contractors
612 skilled SWH installers (COC)
1,836 semi-skilled SWH accredited
2,448 total current SWH installers
4,100 skilled SWH installers (COC)
5,110 semi-skilled SWH installers
9,210 total SWH installers
Skilled: NQEF / SAQA 262784
Semi-skilled: Solar Assistant Installer
Low cost housing pole-mounted, roof-mounted
Semi-skilled labour
Each rollout generally community trained; easy to kick-start and mobilize
Teams of unskilled and semi-skilled labourers can be easily trained to mass rollout
Only with associated rollout programs
Temporary skills: team of 80 per mass rollout
1-4 day workshops and pilot/shadow installation
SWH installation is complex and labour-intensive and four times the labour-intensity of a conventional geyser. The skills required are an overlap of plumbing and electrical work, but it is imperative that proper SWH installation knowledge is needed, which is unique to SWH. Due to the variety of different applications on roof-tops and with different SWH systems, significant skills development is needed, both for plumbers and electricians, as well as entry-level apprentice programs, to cover the myriad application procedures needed
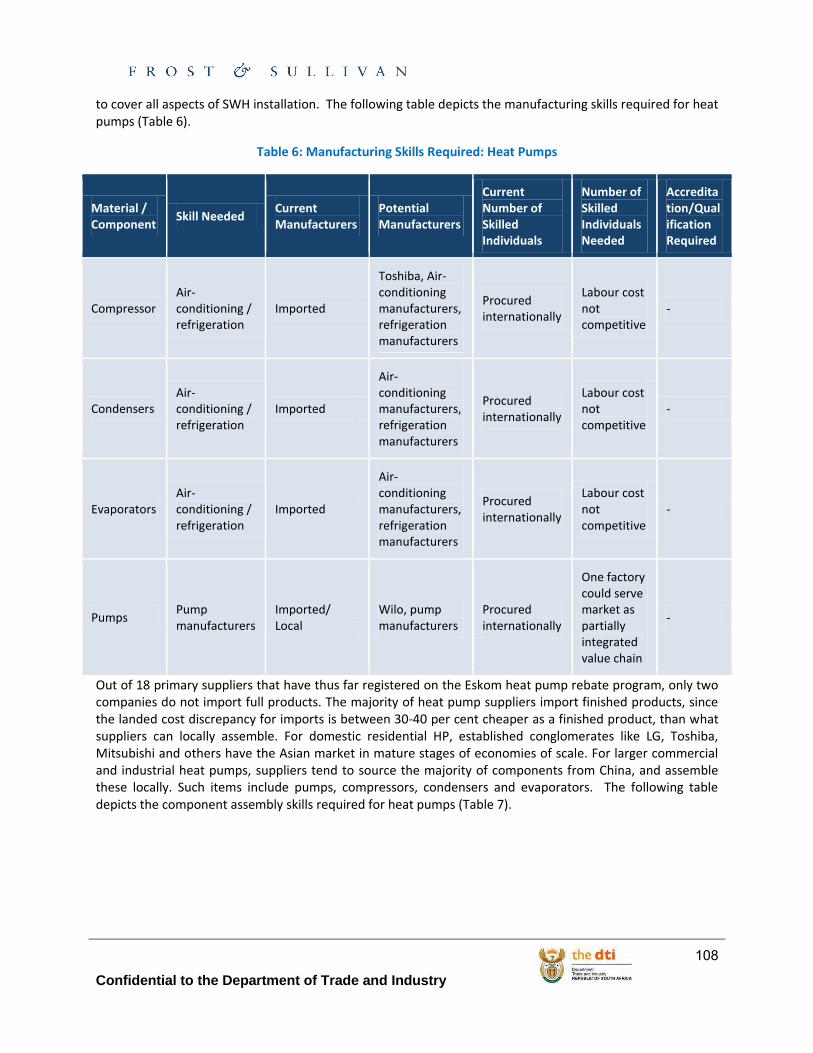
Confidential to the Department of Trade and Industry
108
to cover all aspects of SWH installation. The following table depicts the manufacturing skills required for heat pumps (Table 6).
Table 6: Manufacturing Skills Required: Heat Pumps
Material / Component
Skill Needed Current Manufacturers
Potential Manufacturers
Current Number of Skilled Individuals
Number of Skilled Individuals Needed
Accreditation/Qualification Required
Compressor Air-conditioning / refrigeration
Imported
Toshiba, Air-conditioning manufacturers, refrigeration manufacturers
Procured internationally
Labour cost not competitive
-
Condensers Air-conditioning / refrigeration
Imported
Air-conditioning manufacturers, refrigeration manufacturers
Procured internationally
Labour cost not competitive
-
Evaporators Air-conditioning / refrigeration
Imported
Air-conditioning manufacturers, refrigeration manufacturers
Procured internationally
Labour cost not competitive
-
Pumps Pump manufacturers
Imported/ Local
Wilo, pump manufacturers
Procured internationally
One factory could serve market as partially integrated value chain
-
Out of 18 primary suppliers that have thus far registered on the Eskom heat pump rebate program, only two companies do not import full products. The majority of heat pump suppliers import finished products, since the landed cost discrepancy for imports is between 30-40 per cent cheaper as a finished product, than what suppliers can locally assemble. For domestic residential HP, established conglomerates like LG, Toshiba, Mitsubishi and others have the Asian market in mature stages of economies of scale. For larger commercial and industrial heat pumps, suppliers tend to source the majority of components from China, and assemble these locally. Such items include pumps, compressors, condensers and evaporators. The following table depicts the component assembly skills required for heat pumps (Table 7).
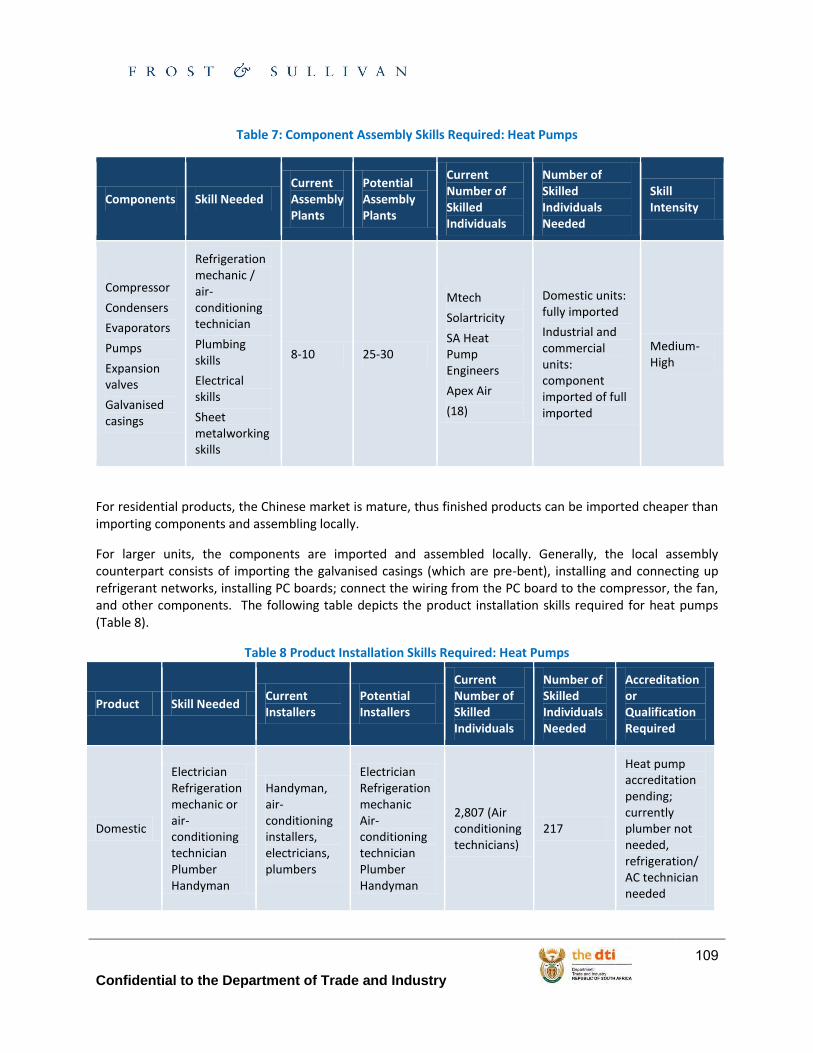
Confidential to the Department of Trade and Industry
109
Table 7: Component Assembly Skills Required: Heat Pumps
Components Skill Needed Current Assembly Plants
Potential Assembly Plants
Current Number of Skilled Individuals
Number of Skilled Individuals Needed
Skill Intensity
Compressor
Condensers
Evaporators
Pumps
Expansion valves
Galvanised casings
Refrigeration mechanic / air-conditioning technician
Plumbing skills
Electrical skills
Sheet metalworking skills
8-10 25-30
Mtech
Solartricity
SA Heat Pump Engineers
Apex Air
(18)
Domestic units: fully imported
Industrial and commercial units: component imported of full imported
Medium-High
For residential products, the Chinese market is mature, thus finished products can be imported cheaper than importing components and assembling locally.
For larger units, the components are imported and assembled locally. Generally, the local assembly counterpart consists of importing the galvanised casings (which are pre-bent), installing and connecting up refrigerant networks, installing PC boards; connect the wiring from the PC board to the compressor, the fan, and other components. The following table depicts the product installation skills required for heat pumps (Table 8).
Table 8 Product Installation Skills Required: Heat Pumps
Product Skill Needed Current Installers
Potential Installers
Current Number of Skilled Individuals
Number of Skilled Individuals Needed
Accreditation or Qualification Required
Domestic
Electrician Refrigeration mechanic or air-conditioning technician Plumber Handyman
Handyman, air-conditioning installers, electricians, plumbers
Electrician Refrigeration mechanic Air-conditioning technician Plumber Handyman
2,807 (Air conditioning technicians)
217
Heat pump accreditation pending; currently plumber not needed, refrigeration/AC technician needed
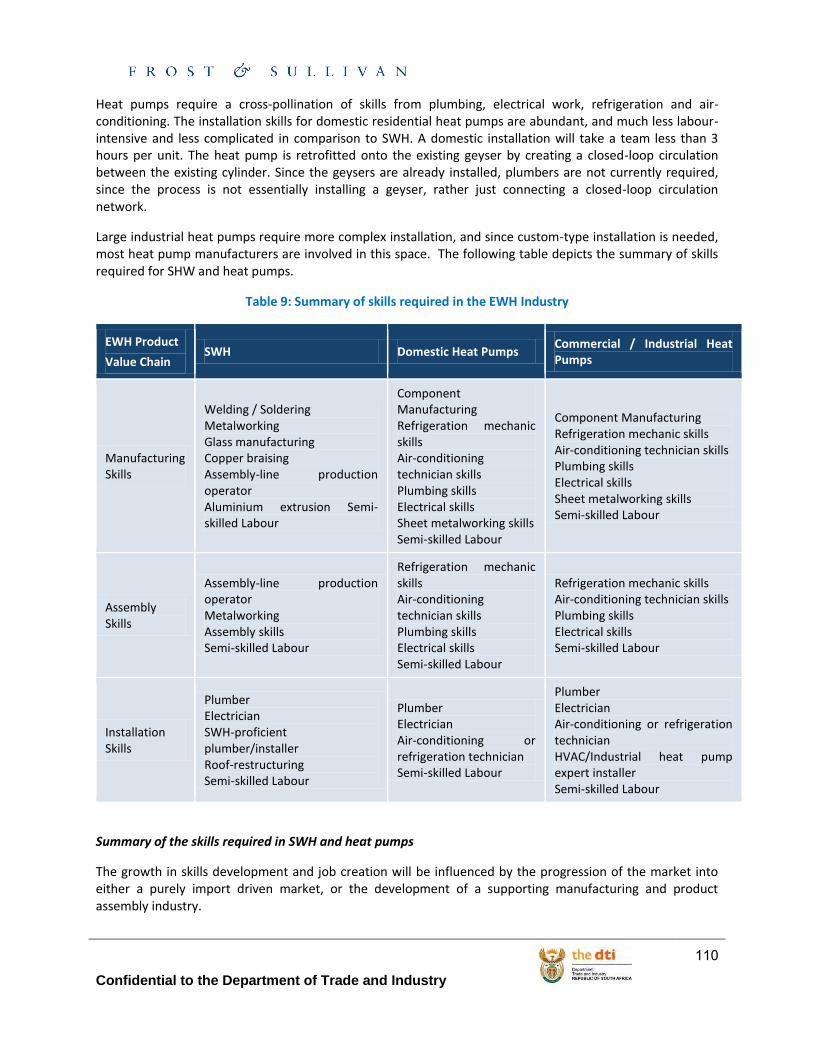
Confidential to the Department of Trade and Industry
110
Heat pumps require a cross-pollination of skills from plumbing, electrical work, refrigeration and air-conditioning. The installation skills for domestic residential heat pumps are abundant, and much less labour-intensive and less complicated in comparison to SWH. A domestic installation will take a team less than 3 hours per unit. The heat pump is retrofitted onto the existing geyser by creating a closed-loop circulation between the existing cylinder. Since the geysers are already installed, plumbers are not currently required, since the process is not essentially installing a geyser, rather just connecting a closed-loop circulation network.
Large industrial heat pumps require more complex installation, and since custom-type installation is needed, most heat pump manufacturers are involved in this space. The following table depicts the summary of skills required for SHW and heat pumps.
Table 9: Summary of skills required in the EWH Industry
EWH Product
Value Chain SWH Domestic Heat Pumps
Commercial / Industrial Heat Pumps
Manufacturing Skills
Welding / Soldering Metalworking Glass manufacturing Copper braising Assembly-line production operator Aluminium extrusion Semi-skilled Labour
Component Manufacturing Refrigeration mechanic skills Air-conditioning technician skills Plumbing skills Electrical skills Sheet metalworking skills Semi-skilled Labour
Component Manufacturing Refrigeration mechanic skills Air-conditioning technician skills Plumbing skills Electrical skills Sheet metalworking skills Semi-skilled Labour
Assembly Skills
Assembly-line production operator Metalworking Assembly skills Semi-skilled Labour
Refrigeration mechanic skills Air-conditioning technician skills Plumbing skills Electrical skills Semi-skilled Labour
Refrigeration mechanic skills Air-conditioning technician skills Plumbing skills Electrical skills Semi-skilled Labour
Installation Skills
Plumber Electrician SWH-proficient plumber/installer Roof-restructuring Semi-skilled Labour
Plumber Electrician Air-conditioning or refrigeration technician Semi-skilled Labour
Plumber Electrician Air-conditioning or refrigeration technician HVAC/Industrial heat pump expert installer Semi-skilled Labour
Summary of the skills required in SWH and heat pumps
The growth in skills development and job creation will be influenced by the progression of the market into either a purely import driven market, or the development of a supporting manufacturing and product assembly industry.
Confidential to the Department of Trade and Industry
111
The key conventional geyser companies in South Africa are all able to manufacture solar geysers as well and only minor skills training are needed to convert to the manufacturing of solar geysers.
In terms of SWH manufacturing, metalworkers and welders are the key qualified skill resources needed. For installation, the major gap lies with installation knowledge. Due to the variety of different applications, significant skills development is needed, both for plumbers and electricians. Entry-level apprentice programs, to cover the myriad of application procedures needed to cover all aspects of SWH installation are recommended.
Installation skills for domestic residential heat pumps are abundant, and much less labour-intensive and less complicated in comparison to SWH. Installation skills include plumbing, electrical work, refrigeration and air-conditioning.
Large industrial heat pumps require more complex installation, and since custom-type installation is needed, most heat pump manufacturers are involved in this space.
One particular manufacturer mentioned that the labour culture in South Africa was a factor which inhibits the development and growth of their local manufacturing industry.
It is important to note that there also exist a lack of skills and resources in municipalities in terms of building control officers. In Gauteng, in particular, the urbanisation rate is very high leading to high construction activities. Municipalities are not sufficiently resourced to follow up on building regulations.
Large Household Appliances, Air Conditioners, Heaters, Televisions The local expertise in the electronic production industry in South Africa is of high quality, there is currently no major skills gap. Local manufacturers have a good understanding and knowledge of the production requirements. Some industry players have mentioned minor gaps on the operator level. This will entail product specific training that will happen on the job. It was also mentioned that there is a lack of industrial engineers on the production side of electronic manufacturing.
The main concern lies in the fact that South African manufacturers cannot compete with international players in the industry. Imports into South Africa from the rest of the world grew by 23.9% from 2010 to 2011. This amounted to the total worth of R726.2 billion in 2011. The growth was mainly associated with imports from China, the United States, Germany and Saudi Arabia. The top import categories included: mineral fuels, machinery and equipment, electrical machinery and electronic equipment (Fig 13).
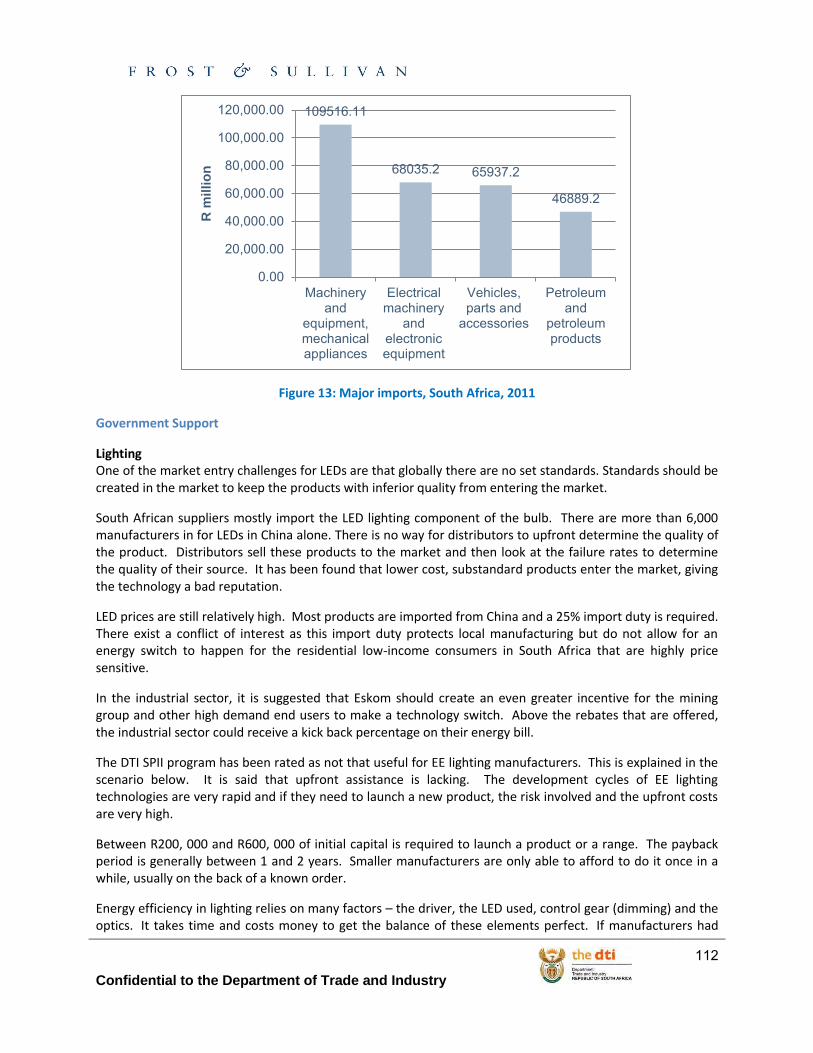
Confidential to the Department of Trade and Industry
112
Figure 13: Major imports, South Africa, 2011
Government Support
Lighting One of the market entry challenges for LEDs are that globally there are no set standards. Standards should be created in the market to keep the products with inferior quality from entering the market.
South African suppliers mostly import the LED lighting component of the bulb. There are more than 6,000 manufacturers in for LEDs in China alone. There is no way for distributors to upfront determine the quality of the product. Distributors sell these products to the market and then look at the failure rates to determine the quality of their source. It has been found that lower cost, substandard products enter the market, giving the technology a bad reputation.
LED prices are still relatively high. Most products are imported from China and a 25% import duty is required. There exist a conflict of interest as this import duty protects local manufacturing but do not allow for an energy switch to happen for the residential low-income consumers in South Africa that are highly price sensitive.
In the industrial sector, it is suggested that Eskom should create an even greater incentive for the mining group and other high demand end users to make a technology switch. Above the rebates that are offered, the industrial sector could receive a kick back percentage on their energy bill.
The DTI SPII program has been rated as not that useful for EE lighting manufacturers. This is explained in the scenario below. It is said that upfront assistance is lacking. The development cycles of EE lighting technologies are very rapid and if they need to launch a new product, the risk involved and the upfront costs are very high.
Between R200, 000 and R600, 000 of initial capital is required to launch a product or a range. The payback period is generally between 1 and 2 years. Smaller manufacturers are only able to afford to do it once in a while, usually on the back of a known order.
Energy efficiency in lighting relies on many factors – the driver, the LED used, control gear (dimming) and the optics. It takes time and costs money to get the balance of these elements perfect. If manufacturers had
109516.11
68035.2 65937.2
46889.2
0.00
20,000.00
40,000.00
60,000.00
80,000.00
100,000.00
120,000.00
Machineryand
equipment,mechanicalappliances
Electricalmachinery
andelectronicequipment
Vehicles,parts and
accessories
Petroleumand
petroleumproducts
R m
illio
n

Confidential to the Department of Trade and Industry
113
upfront assistance, they would be able to focus on product excellence – efficiency, functionality and aesthetics.
The following case studies could serve as a model for South Africa seeking to transform their domestic retail market for LED lamps. In various African countries like Senegal, Ghana and Egypt incandescent lights are already phased out; South Africa has no reason to lack behind this trend.
LED Lights in Japan
In Japan, 42%-50% of all lighting sales are contributed towards LED lighting. Legislation and government subsidies drive the LED market. By 2010 the average cost of LED lamps fell by about 25%, the result of increasing economies of scale and intense competition amongst Japanese manufacturers. The Eco-print programme in Japan stimulated the rapid market uptake of LED lighting.
In April 2009, then Prime Minister Taro Aso of Japan announced a large economic-stimulus package that included the $10.9 billion Eco-point Programme to stimulate consumer purchases of energy-efficient appliances. After an end user purchased an energy-efficient appliance, they received eco-points from government worth 5-10% of the value of the purchase. Each eco-point is worth ¥1. From April 2010 onward, consumers were allowed to exchange their eco-points for LED lamps at twice their value.
LED lights in USA
The Energy Department of the USA partnered with private industry to boost their national competitiveness in manufacturing. The Energy Department of the USA invested more than $7 million for three innovative lighting projects to lower the cost of manufacturing LEDs. The projects mainly focused on improving manufacturing equipment, processes, or monitoring techniques that will help make LEDs more cost-competitive with conventional lighting technologies. The investment not only lowered the cost for manufacturers, but also made the product more affordable for end users
Water Heating The industry has seen many teething problems as a result of consumer confusion, installation problems, accreditation issues and the low price of the rebate.
Currently there is an uncertainty in the EE water heating environment which the support of government could solve. The implementation of SANS 10400xa would create an enabling environment for EE water heating manufacturing. Clear policy statements and rebates will also provide the stability investors require.
One of the biggest barriers to market uptake in South Africa is that people are not aware of the technology. Currently there exists a lack of familiarity with the technology and its potential for reducing electricity consumption. EE awareness initiatives need to be tailored to the market needs. Different campaigns must be used to focus on the different sectors (household, residential, agricultural and commercial).
The Eskom rebate has had a positive impact on heat pump sales as it makes the product more affordable for the consumer. However, it is still believed that there are thousands of hot water systems that can be converted as the majority of the target market for this product does not have the capital to invest in it. The Heat Pump rebate has only been in existence for a relatively short period of time.
When building codes are officially instated in May 2013, new buildings will be required to account for at least 50% of their hot water consumption to be generated by energy efficient methods. The market uptake will inevitably increase.
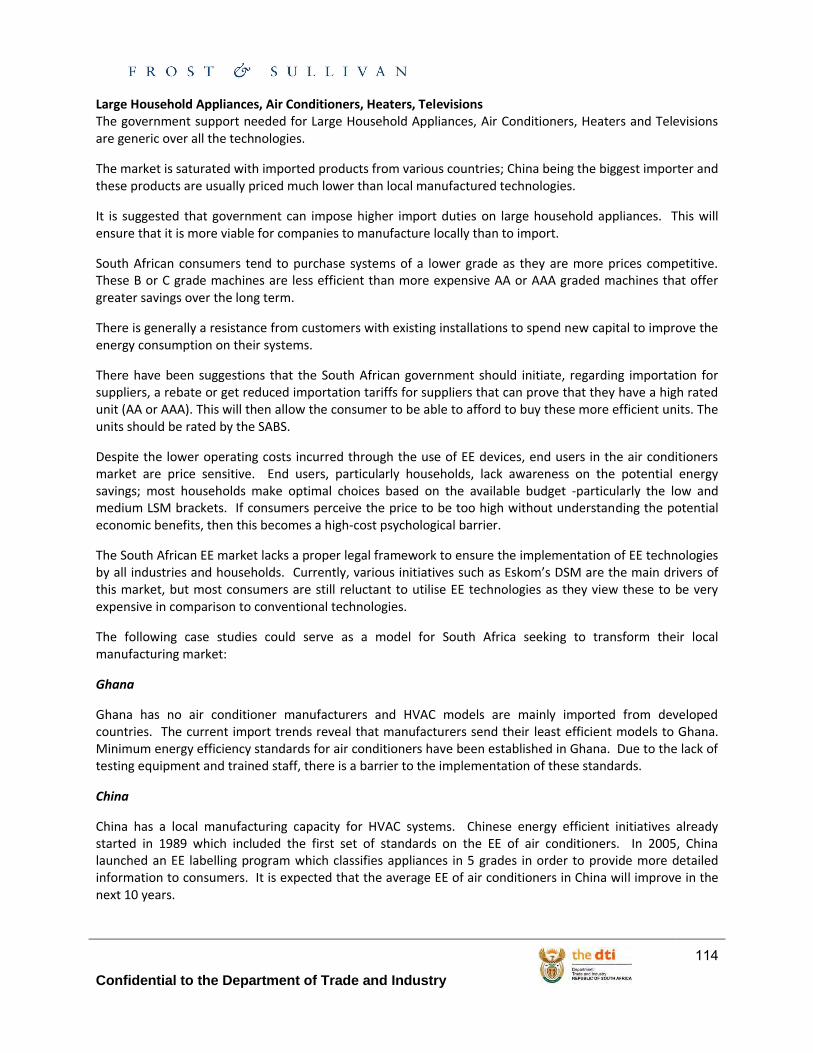
Confidential to the Department of Trade and Industry
114
Large Household Appliances, Air Conditioners, Heaters, Televisions The government support needed for Large Household Appliances, Air Conditioners, Heaters and Televisions are generic over all the technologies.
The market is saturated with imported products from various countries; China being the biggest importer and these products are usually priced much lower than local manufactured technologies.
It is suggested that government can impose higher import duties on large household appliances. This will ensure that it is more viable for companies to manufacture locally than to import.
South African consumers tend to purchase systems of a lower grade as they are more prices competitive. These B or C grade machines are less efficient than more expensive AA or AAA graded machines that offer greater savings over the long term.
There is generally a resistance from customers with existing installations to spend new capital to improve the energy consumption on their systems.
There have been suggestions that the South African government should initiate, regarding importation for suppliers, a rebate or get reduced importation tariffs for suppliers that can prove that they have a high rated unit (AA or AAA). This will then allow the consumer to be able to afford to buy these more efficient units. The units should be rated by the SABS.
Despite the lower operating costs incurred through the use of EE devices, end users in the air conditioners market are price sensitive. End users, particularly households, lack awareness on the potential energy savings; most households make optimal choices based on the available budget -particularly the low and medium LSM brackets. If consumers perceive the price to be too high without understanding the potential economic benefits, then this becomes a high-cost psychological barrier.
The South African EE market lacks a proper legal framework to ensure the implementation of EE technologies by all industries and households. Currently, various initiatives such as Eskom’s DSM are the main drivers of this market, but most consumers are still reluctant to utilise EE technologies as they view these to be very expensive in comparison to conventional technologies.
The following case studies could serve as a model for South Africa seeking to transform their local manufacturing market:
Ghana
Ghana has no air conditioner manufacturers and HVAC models are mainly imported from developed countries. The current import trends reveal that manufacturers send their least efficient models to Ghana. Minimum energy efficiency standards for air conditioners have been established in Ghana. Due to the lack of testing equipment and trained staff, there is a barrier to the implementation of these standards.
China
China has a local manufacturing capacity for HVAC systems. Chinese energy efficient initiatives already started in 1989 which included the first set of standards on the EE of air conditioners. In 2005, China launched an EE labelling program which classifies appliances in 5 grades in order to provide more detailed information to consumers. It is expected that the average EE of air conditioners in China will improve in the next 10 years.
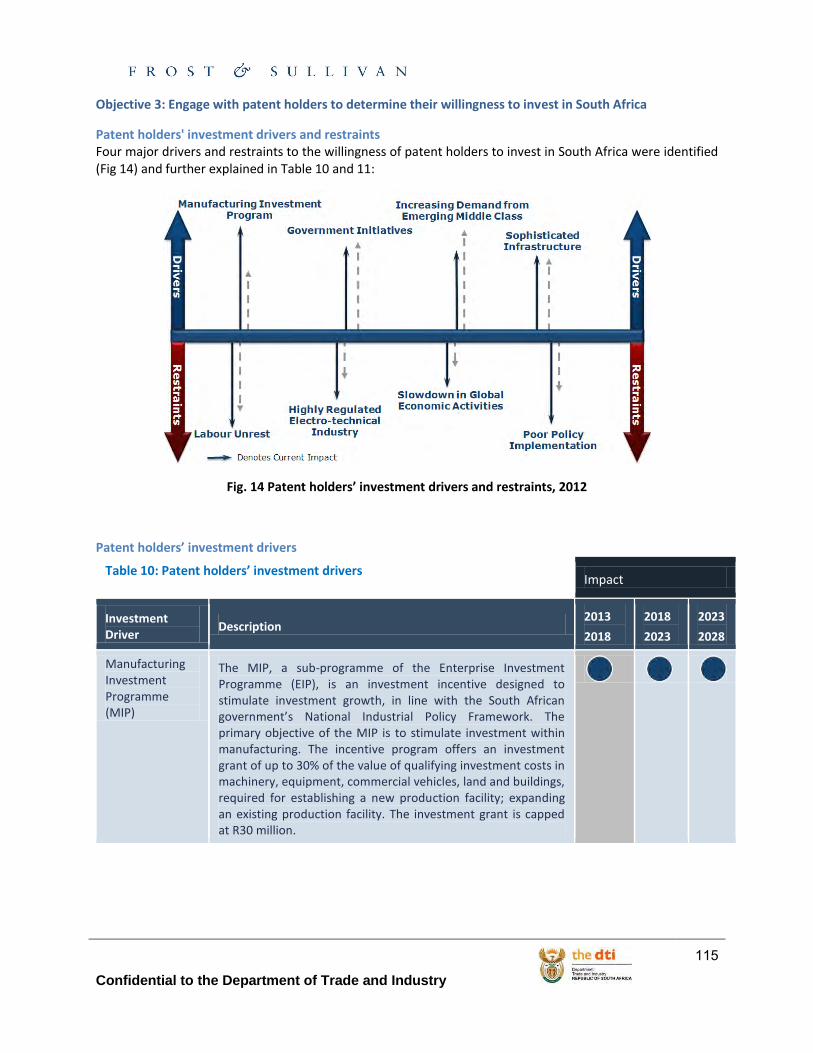
Confidential to the Department of Trade and Industry
115
Objective 3: Engage with patent holders to determine their willingness to invest in South Africa
Patent holders' investment drivers and restraints Four major drivers and restraints to the willingness of patent holders to invest in South Africa were identified (Fig 14) and further explained in Table 10 and 11:
Fig. 14 Patent holders’ investment drivers and restraints, 2012
Patent holders’ investment drivers
Table 10: Patent holders’ investment drivers Impact
Investment Driver
Description 2013
2018
2018
2023
2023
2028
Manufacturing Investment Programme (MIP)
The MIP, a sub-programme of the Enterprise Investment Programme (EIP), is an investment incentive designed to stimulate investment growth, in line with the South African government’s National Industrial Policy Framework. The primary objective of the MIP is to stimulate investment within manufacturing. The incentive program offers an investment grant of up to 30% of the value of qualifying investment costs in machinery, equipment, commercial vehicles, land and buildings, required for establishing a new production facility; expanding an existing production facility. The investment grant is capped at R30 million.
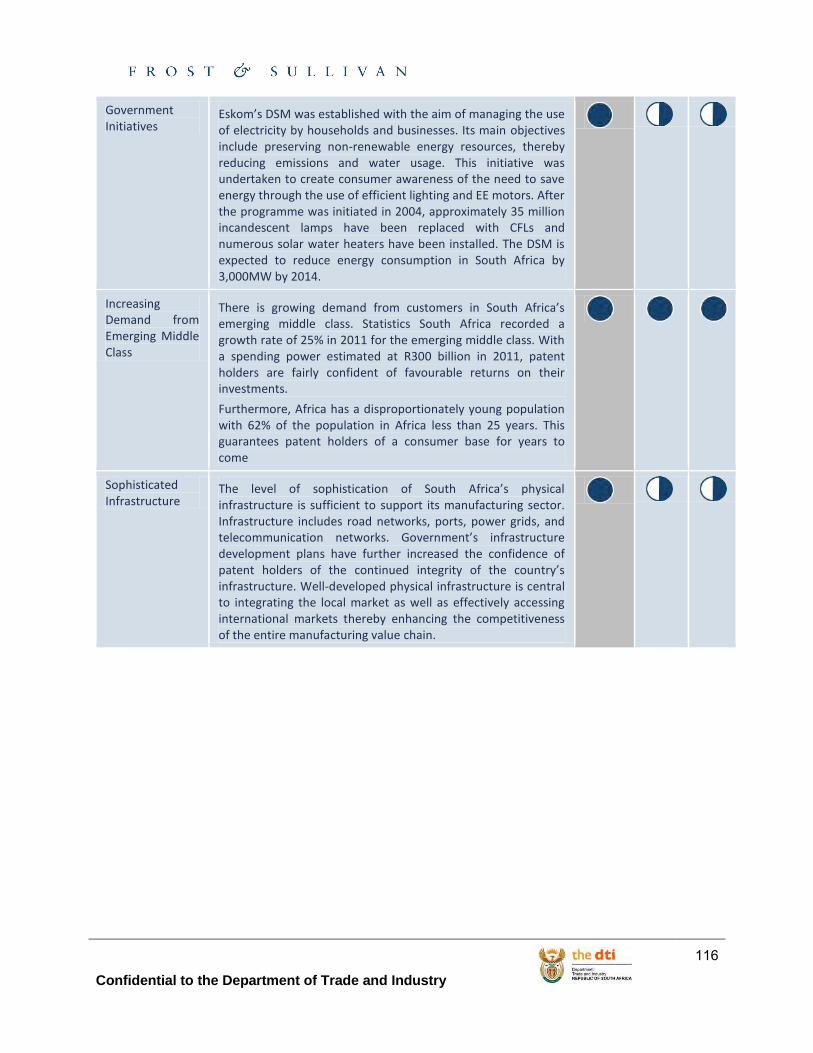
Confidential to the Department of Trade and Industry
116
Government Initiatives
Eskom’s DSM was established with the aim of managing the use of electricity by households and businesses. Its main objectives include preserving non-renewable energy resources, thereby reducing emissions and water usage. This initiative was undertaken to create consumer awareness of the need to save energy through the use of efficient lighting and EE motors. After the programme was initiated in 2004, approximately 35 million incandescent lamps have been replaced with CFLs and numerous solar water heaters have been installed. The DSM is expected to reduce energy consumption in South Africa by 3,000MW by 2014.
Increasing Demand from Emerging Middle Class
There is growing demand from customers in South Africa’s emerging middle class. Statistics South Africa recorded a growth rate of 25% in 2011 for the emerging middle class. With a spending power estimated at R300 billion in 2011, patent holders are fairly confident of favourable returns on their investments.
Furthermore, Africa has a disproportionately young population with 62% of the population in Africa less than 25 years. This guarantees patent holders of a consumer base for years to come
Sophisticated Infrastructure
The level of sophistication of South Africa’s physical infrastructure is sufficient to support its manufacturing sector. Infrastructure includes road networks, ports, power grids, and telecommunication networks. Government’s infrastructure development plans have further increased the confidence of patent holders of the continued integrity of the country’s infrastructure. Well-developed physical infrastructure is central to integrating the local market as well as effectively accessing international markets thereby enhancing the competitiveness of the entire manufacturing value chain.
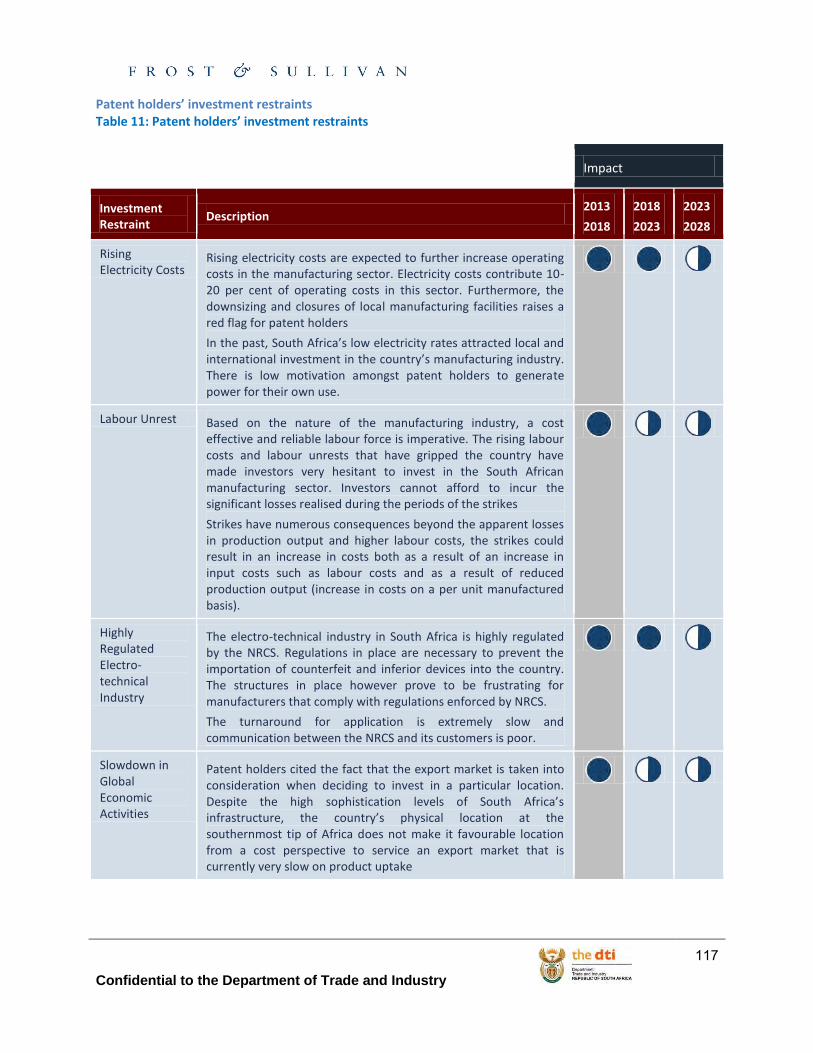
Confidential to the Department of Trade and Industry
117
Patent holders’ investment restraints Table 11: Patent holders’ investment restraints
Impact
Investment Restraint
Description 2013
2018
2018
2023
2023
2028
Rising Electricity Costs
Rising electricity costs are expected to further increase operating costs in the manufacturing sector. Electricity costs contribute 10-20 per cent of operating costs in this sector. Furthermore, the downsizing and closures of local manufacturing facilities raises a red flag for patent holders
In the past, South Africa’s low electricity rates attracted local and international investment in the country’s manufacturing industry. There is low motivation amongst patent holders to generate power for their own use.
Labour Unrest Based on the nature of the manufacturing industry, a cost effective and reliable labour force is imperative. The rising labour costs and labour unrests that have gripped the country have made investors very hesitant to invest in the South African manufacturing sector. Investors cannot afford to incur the significant losses realised during the periods of the strikes
Strikes have numerous consequences beyond the apparent losses in production output and higher labour costs, the strikes could result in an increase in costs both as a result of an increase in input costs such as labour costs and as a result of reduced production output (increase in costs on a per unit manufactured basis).
Highly Regulated Electro-technical Industry
The electro-technical industry in South Africa is highly regulated by the NRCS. Regulations in place are necessary to prevent the importation of counterfeit and inferior devices into the country. The structures in place however prove to be frustrating for manufacturers that comply with regulations enforced by NRCS.
The turnaround for application is extremely slow and communication between the NRCS and its customers is poor.
Slowdown in Global Economic Activities
Patent holders cited the fact that the export market is taken into consideration when deciding to invest in a particular location. Despite the high sophistication levels of South Africa’s infrastructure, the country’s physical location at the southernmost tip of Africa does not make it favourable location from a cost perspective to service an export market that is currently very slow on product uptake
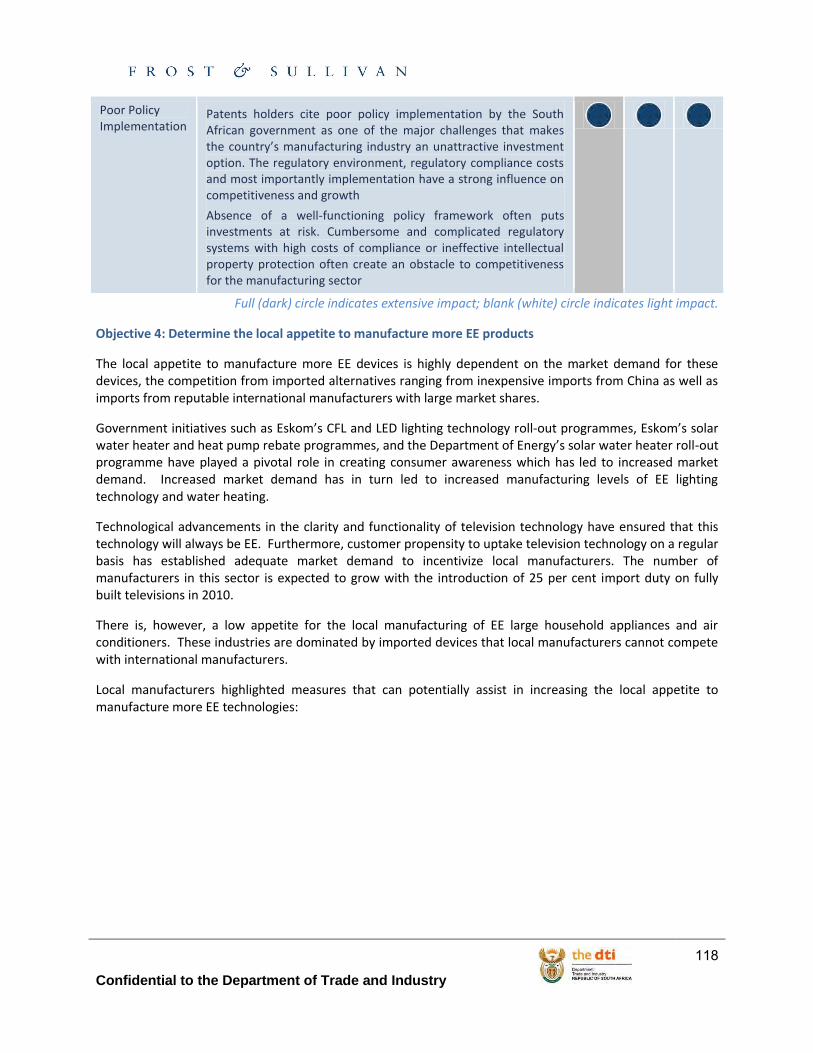
Confidential to the Department of Trade and Industry
118
Poor Policy Implementation
Patents holders cite poor policy implementation by the South African government as one of the major challenges that makes the country’s manufacturing industry an unattractive investment option. The regulatory environment, regulatory compliance costs and most importantly implementation have a strong influence on competitiveness and growth
Absence of a well-functioning policy framework often puts investments at risk. Cumbersome and complicated regulatory systems with high costs of compliance or ineffective intellectual property protection often create an obstacle to competitiveness for the manufacturing sector
Full (dark) circle indicates extensive impact; blank (white) circle indicates light impact.
Objective 4: Determine the local appetite to manufacture more EE products
The local appetite to manufacture more EE devices is highly dependent on the market demand for these devices, the competition from imported alternatives ranging from inexpensive imports from China as well as imports from reputable international manufacturers with large market shares.
Government initiatives such as Eskom’s CFL and LED lighting technology roll-out programmes, Eskom’s solar water heater and heat pump rebate programmes, and the Department of Energy’s solar water heater roll-out programme have played a pivotal role in creating consumer awareness which has led to increased market demand. Increased market demand has in turn led to increased manufacturing levels of EE lighting technology and water heating.
Technological advancements in the clarity and functionality of television technology have ensured that this technology will always be EE. Furthermore, customer propensity to uptake television technology on a regular basis has established adequate market demand to incentivize local manufacturers. The number of manufacturers in this sector is expected to grow with the introduction of 25 per cent import duty on fully built televisions in 2010.
There is, however, a low appetite for the local manufacturing of EE large household appliances and air conditioners. These industries are dominated by imported devices that local manufacturers cannot compete with international manufacturers.
Local manufacturers highlighted measures that can potentially assist in increasing the local appetite to manufacture more EE technologies:
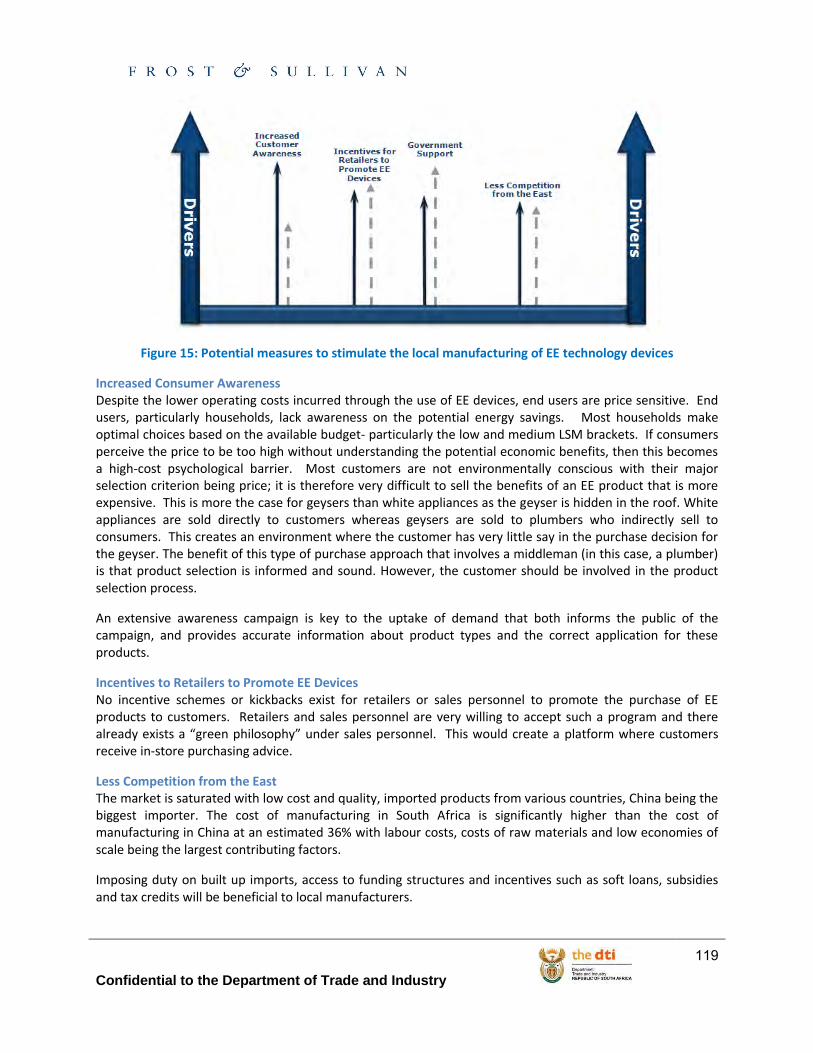
Confidential to the Department of Trade and Industry
119
Figure 15: Potential measures to stimulate the local manufacturing of EE technology devices
Increased Consumer Awareness Despite the lower operating costs incurred through the use of EE devices, end users are price sensitive. End users, particularly households, lack awareness on the potential energy savings. Most households make optimal choices based on the available budget- particularly the low and medium LSM brackets. If consumers perceive the price to be too high without understanding the potential economic benefits, then this becomes a high-cost psychological barrier. Most customers are not environmentally conscious with their major selection criterion being price; it is therefore very difficult to sell the benefits of an EE product that is more expensive. This is more the case for geysers than white appliances as the geyser is hidden in the roof. White appliances are sold directly to customers whereas geysers are sold to plumbers who indirectly sell to consumers. This creates an environment where the customer has very little say in the purchase decision for the geyser. The benefit of this type of purchase approach that involves a middleman (in this case, a plumber) is that product selection is informed and sound. However, the customer should be involved in the product selection process.
An extensive awareness campaign is key to the uptake of demand that both informs the public of the campaign, and provides accurate information about product types and the correct application for these products.
Incentives to Retailers to Promote EE Devices No incentive schemes or kickbacks exist for retailers or sales personnel to promote the purchase of EE products to customers. Retailers and sales personnel are very willing to accept such a program and there already exists a “green philosophy” under sales personnel. This would create a platform where customers receive in-store purchasing advice.
Less Competition from the East The market is saturated with low cost and quality, imported products from various countries, China being the biggest importer. The cost of manufacturing in South Africa is significantly higher than the cost of manufacturing in China at an estimated 36% with labour costs, costs of raw materials and low economies of scale being the largest contributing factors.
Imposing duty on built up imports, access to funding structures and incentives such as soft loans, subsidies and tax credits will be beneficial to local manufacturers.
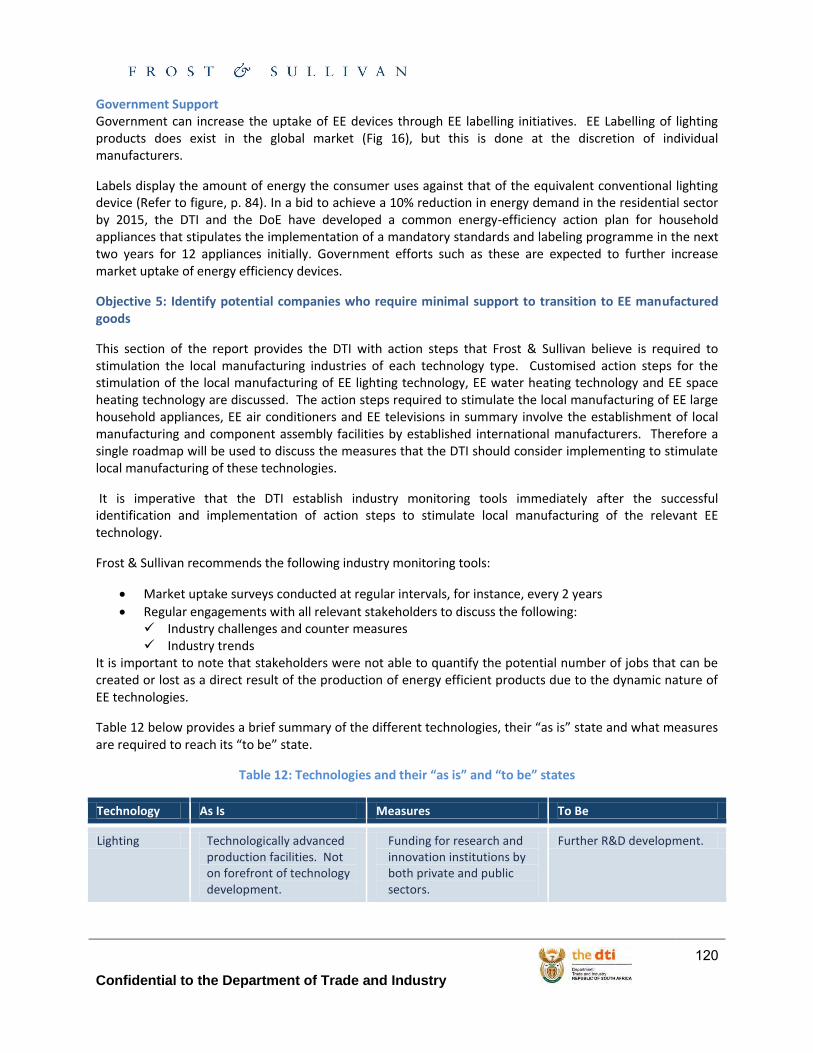
Confidential to the Department of Trade and Industry
120
Government Support Government can increase the uptake of EE devices through EE labelling initiatives. EE Labelling of lighting products does exist in the global market (Fig 16), but this is done at the discretion of individual manufacturers.
Labels display the amount of energy the consumer uses against that of the equivalent conventional lighting device (Refer to figure, p. 84). In a bid to achieve a 10% reduction in energy demand in the residential sector by 2015, the DTI and the DoE have developed a common energy-efficiency action plan for household appliances that stipulates the implementation of a mandatory standards and labeling programme in the next two years for 12 appliances initially. Government efforts such as these are expected to further increase market uptake of energy efficiency devices.
Objective 5: Identify potential companies who require minimal support to transition to EE manufactured goods
This section of the report provides the DTI with action steps that Frost & Sullivan believe is required to stimulation the local manufacturing industries of each technology type. Customised action steps for the stimulation of the local manufacturing of EE lighting technology, EE water heating technology and EE space heating technology are discussed. The action steps required to stimulate the local manufacturing of EE large household appliances, EE air conditioners and EE televisions in summary involve the establishment of local manufacturing and component assembly facilities by established international manufacturers. Therefore a single roadmap will be used to discuss the measures that the DTI should consider implementing to stimulate local manufacturing of these technologies.
It is imperative that the DTI establish industry monitoring tools immediately after the successful identification and implementation of action steps to stimulate local manufacturing of the relevant EE technology.
Frost & Sullivan recommends the following industry monitoring tools:
Market uptake surveys conducted at regular intervals, for instance, every 2 years
Regular engagements with all relevant stakeholders to discuss the following: Industry challenges and counter measures Industry trends
It is important to note that stakeholders were not able to quantify the potential number of jobs that can be created or lost as a direct result of the production of energy efficient products due to the dynamic nature of EE technologies.
Table 12 below provides a brief summary of the different technologies, their “as is” state and what measures are required to reach its “to be” state.
Table 12: Technologies and their “as is” and “to be” states
Technology As Is Measures To Be
Lighting Technologically advanced production facilities. Not on forefront of technology development.
Funding for research and innovation institutions by both private and public sectors.
Further R&D development.
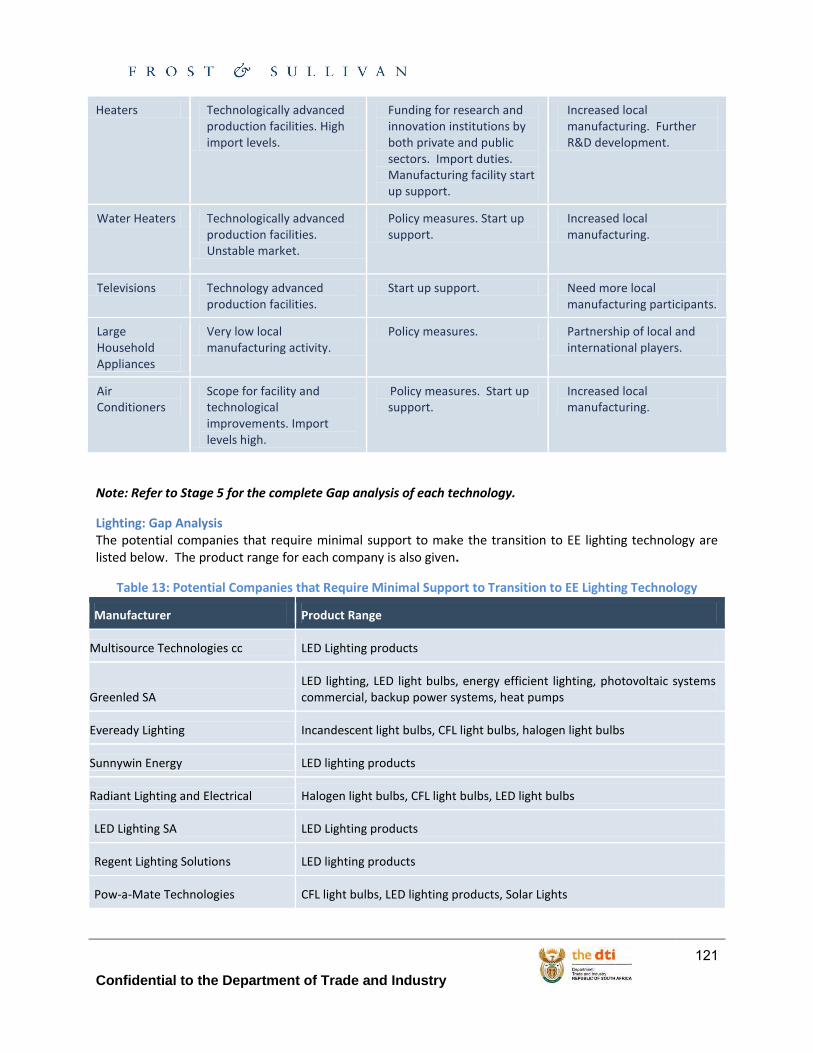
Confidential to the Department of Trade and Industry
121
Heaters Technologically advanced production facilities. High import levels.
Funding for research and innovation institutions by both private and public sectors. Import duties. Manufacturing facility start up support.
Increased local manufacturing. Further R&D development.
Water Heaters Technologically advanced production facilities. Unstable market.
Policy measures. Start up support.
Increased local manufacturing.
Televisions Technology advanced production facilities.
Start up support. Need more local manufacturing participants.
Large Household Appliances
Very low local manufacturing activity.
Policy measures. Partnership of local and international players.
Air Conditioners
Scope for facility and technological improvements. Import levels high.
Policy measures. Start up support.
Increased local manufacturing.
Note: Refer to Stage 5 for the complete Gap analysis of each technology.
Lighting: Gap Analysis The potential companies that require minimal support to make the transition to EE lighting technology are listed below. The product range for each company is also given.
Table 13: Potential Companies that Require Minimal Support to Transition to EE Lighting Technology
Manufacturer Product Range
Multisource Technologies cc LED Lighting products
Greenled SA LED lighting, LED light bulbs, energy efficient lighting, photovoltaic systems commercial, backup power systems, heat pumps
Eveready Lighting Incandescent light bulbs, CFL light bulbs, halogen light bulbs
Sunnywin Energy LED lighting products
Radiant Lighting and Electrical Halogen light bulbs, CFL light bulbs, LED light bulbs
LED Lighting SA LED Lighting products
Regent Lighting Solutions LED lighting products
Pow-a-Mate Technologies CFL light bulbs, LED lighting products, Solar Lights
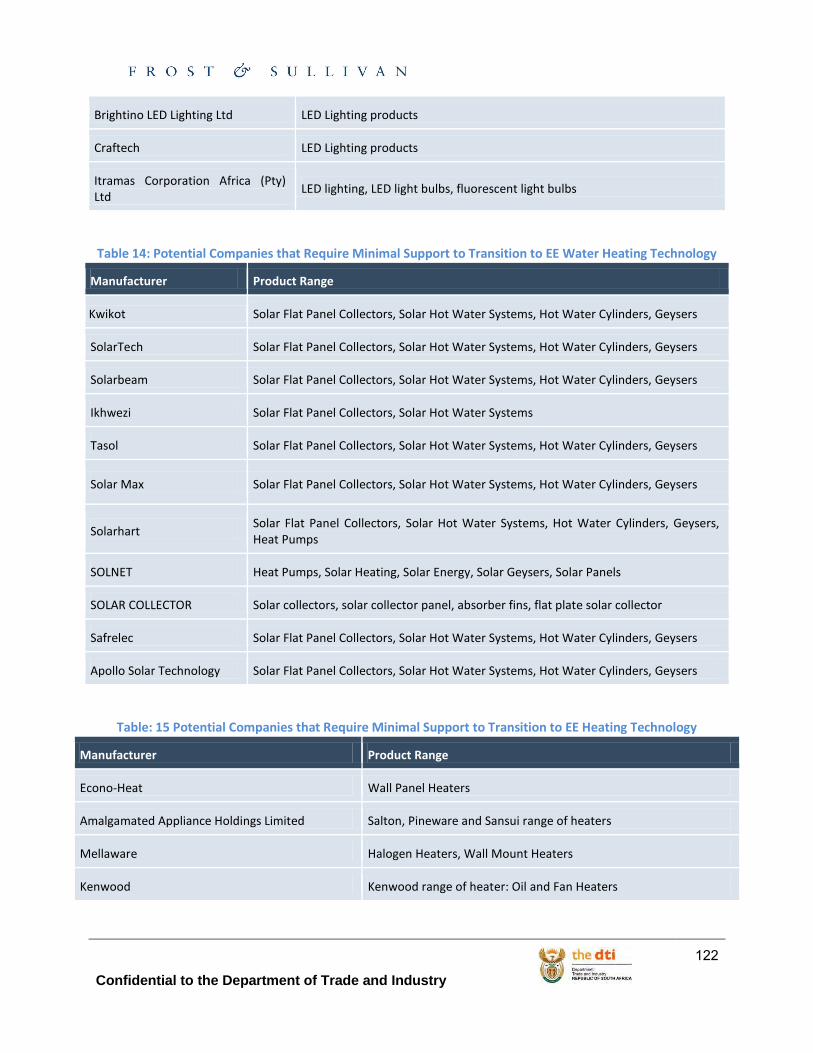
Confidential to the Department of Trade and Industry
122
Brightino LED Lighting Ltd LED Lighting products
Craftech LED Lighting products
Itramas Corporation Africa (Pty) Ltd
LED lighting, LED light bulbs, fluorescent light bulbs
Table 14: Potential Companies that Require Minimal Support to Transition to EE Water Heating Technology
Manufacturer Product Range
Kwikot Solar Flat Panel Collectors, Solar Hot Water Systems, Hot Water Cylinders, Geysers
SolarTech Solar Flat Panel Collectors, Solar Hot Water Systems, Hot Water Cylinders, Geysers
Solarbeam Solar Flat Panel Collectors, Solar Hot Water Systems, Hot Water Cylinders, Geysers
Ikhwezi Solar Flat Panel Collectors, Solar Hot Water Systems
Tasol Solar Flat Panel Collectors, Solar Hot Water Systems, Hot Water Cylinders, Geysers
Solar Max Solar Flat Panel Collectors, Solar Hot Water Systems, Hot Water Cylinders, Geysers
Solarhart Solar Flat Panel Collectors, Solar Hot Water Systems, Hot Water Cylinders, Geysers, Heat Pumps
SOLNET Heat Pumps, Solar Heating, Solar Energy, Solar Geysers, Solar Panels
SOLAR COLLECTOR Solar collectors, solar collector panel, absorber fins, flat plate solar collector
Safrelec Solar Flat Panel Collectors, Solar Hot Water Systems, Hot Water Cylinders, Geysers
Apollo Solar Technology Solar Flat Panel Collectors, Solar Hot Water Systems, Hot Water Cylinders, Geysers
Table: 15 Potential Companies that Require Minimal Support to Transition to EE Heating Technology
Manufacturer Product Range
Econo-Heat Wall Panel Heaters
Amalgamated Appliance Holdings Limited Salton, Pineware and Sansui range of heaters
Mellaware Halogen Heaters, Wall Mount Heaters
Kenwood Kenwood range of heater: Oil and Fan Heaters
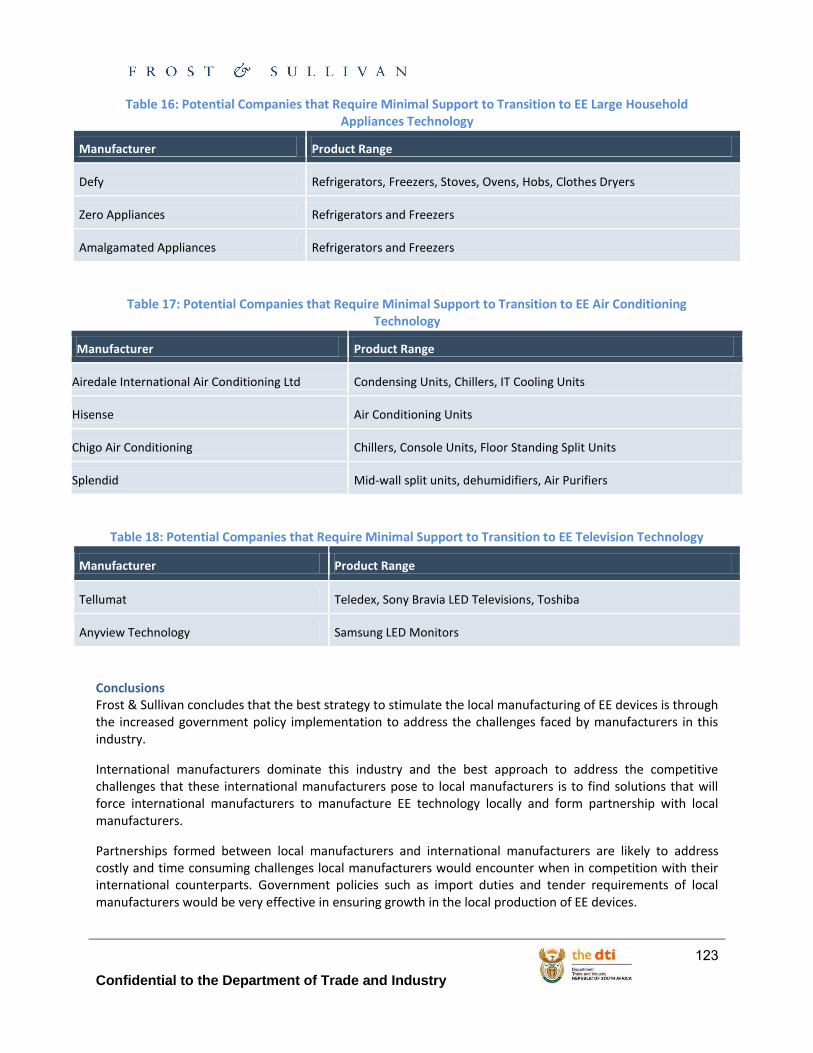
Confidential to the Department of Trade and Industry
123
Table 16: Potential Companies that Require Minimal Support to Transition to EE Large Household Appliances Technology
Manufacturer Product Range
Defy Refrigerators, Freezers, Stoves, Ovens, Hobs, Clothes Dryers
Zero Appliances Refrigerators and Freezers
Amalgamated Appliances Refrigerators and Freezers
Table 17: Potential Companies that Require Minimal Support to Transition to EE Air Conditioning Technology
Manufacturer Product Range
Airedale International Air Conditioning Ltd Condensing Units, Chillers, IT Cooling Units
Hisense Air Conditioning Units
Chigo Air Conditioning Chillers, Console Units, Floor Standing Split Units
Splendid Mid-wall split units, dehumidifiers, Air Purifiers
Table 18: Potential Companies that Require Minimal Support to Transition to EE Television Technology
Manufacturer Product Range
Tellumat Teledex, Sony Bravia LED Televisions, Toshiba
Anyview Technology Samsung LED Monitors
Conclusions Frost & Sullivan concludes that the best strategy to stimulate the local manufacturing of EE devices is through the increased government policy implementation to address the challenges faced by manufacturers in this industry.
International manufacturers dominate this industry and the best approach to address the competitive challenges that these international manufacturers pose to local manufacturers is to find solutions that will force international manufacturers to manufacture EE technology locally and form partnership with local manufacturers.
Partnerships formed between local manufacturers and international manufacturers are likely to address costly and time consuming challenges local manufacturers would encounter when in competition with their international counterparts. Government policies such as import duties and tender requirements of local manufacturers would be very effective in ensuring growth in the local production of EE devices.
Confidential to the Department of Trade and Industry
124
Furthermore, it is imperative that there be an uptake of EE devices. It is therefore important that consumers are made aware of the benefits of these products. Aggressive awareness campaigns to educate and inform households of the importance and the benefits of EE devices, is suggested.
Policies such as the phasing out of incandescent light bulbs set to be enacted by the end of 2013 will further serve to force end users to shift their purchasing criteria. It is imperative that government policies are effectively implemented as this too is a major challenge that local manufacturers face. Government needs to have a sufficiently sized and trained workforce in order to effectively implement these policies. Round table discussions with stakeholders on a regular basis are essential for the stimulation of the South African local manufacturing industry.
Confidential to the Department of Trade and Industry
125
Stage 5: Recommendations & Implementation Assistance The overall objective of this five part analysis was to identify global and local technological trends of new energy saving technologies that will be competitive and influence the future development in South African firms as well as to gather related data for effective policy and strategy formulation and implementation. During the course of this analysis, Frost & Sullivan identified projects that should be conducted going forward to further assist the DTI in its bid to identify specific focus areas to target as well as the action steps that should be implemented in order for it to meet its objectives. A list of these projects can be found in the addendum at the end of this report.
Objective 1: Identify the most appropriate technologies for the local market
The first objective of the fifth stage of this analysis is to identify the most appropriate technologies for the local market. Identifying these specific technologies will provide clearer recommendations to the DTI to have the highest impact on the local EE manufacturing market at the least cost. The most appropriate products to focus on from a South African context are Lighting, Water Heating and Space Heating. Going forward, Frost & Sullivan recommends the following implementation strategy:
Phase 1: Fact Foundation
Analysis
External Analysis: This phase of the implementation strategy will involve the analysis the external resources such as Frost &Sullivan’s analysis of the industry, journals and publications by the CSIR and TIA, global best practice and all relevant external sources of knowledge of all aspects of the EE devices manufacturing industry required for the DTI to make concise and informed decisions regarding the most appropriate strategy and areas of focus in its bid to stimulate the manufacturing of EE devices by local manufacturers in South Africa.
Internal Analysis: This will require an analysis of the internal resources available within the DTI as well as the identification of the internal resources required and relevant skills availability. Discussions with internal departments such as the Electro-technical department to determine the best course of action will be required. The overarching objective of the internal analysis will be to conduct a SWOT analysis of the internal capabilities of the DTI once a clearly defined course of action regarding the stimulation of the manufacturing of EE devices has been identified.
Phase 2: Strategic Options
Gap Analysis: Post of the external and internal analysis phase of the implementation strategy, an identification and analysis of the “as is” and the “to be” states should be conducted. This phase will involve the identification of mitigation strategies that should be implemented to address the areas identified in the SWOT analysis that require transformation in order to achieve the DTI’s objectives.
TOM (Target Operating Model) Analysis: This analysis will involve the identification of the resources and strategy required to get to the “to be” situation.
Prioritisation: Following the TOM analysis, strategies identified should then be categorised in terms of ease of implementation, risks and threats involved as well as size of opportunity. Frost & Sullivan believes that this will further assist the DTI to further narrow down on its focus areas.
Phase 3: Business Case Development
This phase of the implementation strategy will involve the development of a business case based on the TOM model
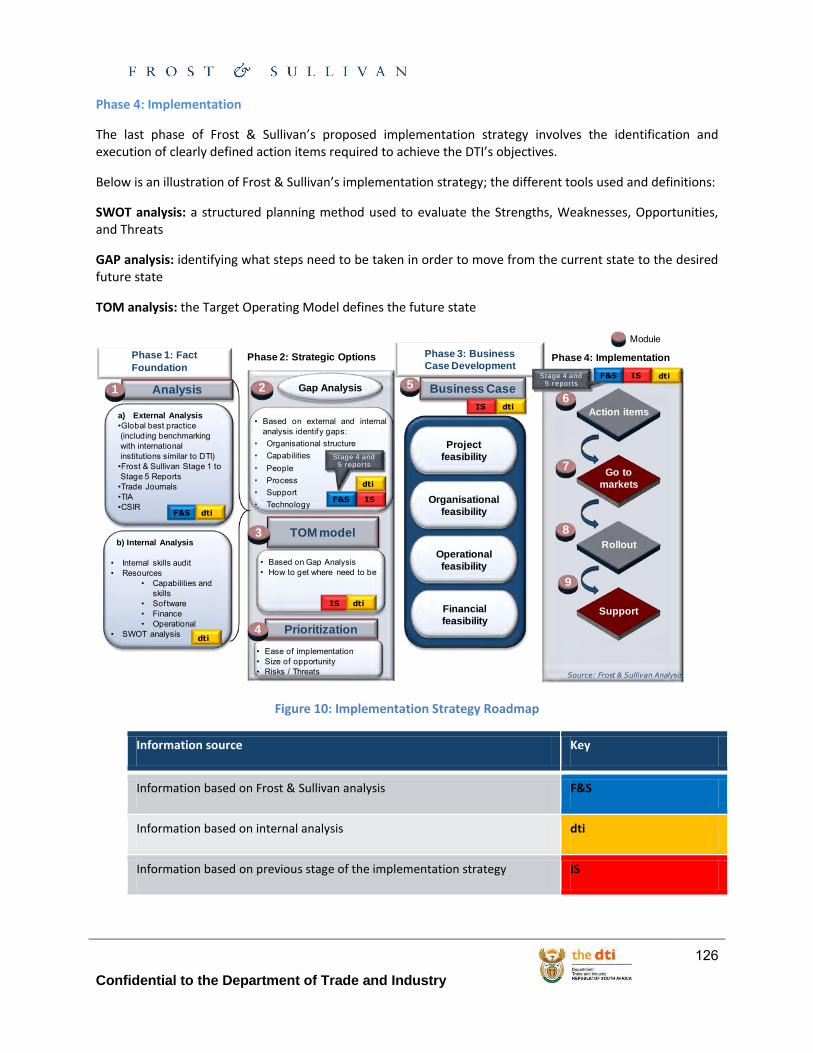
Confidential to the Department of Trade and Industry
126
Phase 4: Implementation
The last phase of Frost & Sullivan’s proposed implementation strategy involves the identification and execution of clearly defined action items required to achieve the DTI’s objectives.
Below is an illustration of Frost & Sullivan’s implementation strategy; the different tools used and definitions:
SWOT analysis: a structured planning method used to evaluate the Strengths, Weaknesses, Opportunities, and Threats
GAP analysis: identifying what steps need to be taken in order to move from the current state to the desired future state
TOM analysis: the Target Operating Model defines the future state
Figure 10: Implementation Strategy Roadmap
Information source Key
Information based on Frost & Sullivan analysis F&S
Information based on internal analysis dti
Information based on previous stage of the implementation strategy IS
Phase 3: Business
Case DevelopmentPhase 1: Fact
Foundation
b) Internal Analysis
• Internal skills audit• Resources
• Capabilities and skills
• Sof tware• Finance• Operational
• SWOT analysis
Action items
Rollout
Go to
markets
Support
• Based on Gap Analysis• How to get where need to be
Gap Analysis
a) External Analysis
•Global best practice (including benchmarking with international institutions similar to DTI)
•Frost & Sullivan Stage 1 to Stage 5 Reports
•Trade Journals•TIA•CSIR
Analysis1
TOM model3
Business Case
• Ease of implementation• Size of opportunity• Risks / Threats
Prioritization
5
4
6
7
8
9
2
Project
feasibility
Organisational
feasibility
Operational
feasibility
Financial
feasibility
Module
• Based on external and internalanalysis identify gaps:
• Organisational structure• Capabilities• People• Process• Support• Technology
Phase 2: Strategic Options Phase 4: Implementation
F&S dti
IS
dti
F&S
IS dti
dti
IS dti
IS dtiF&S
Source: Frost & Sullivan Analysis
Stage 4 and5 reports
Stage 4 and5 reports
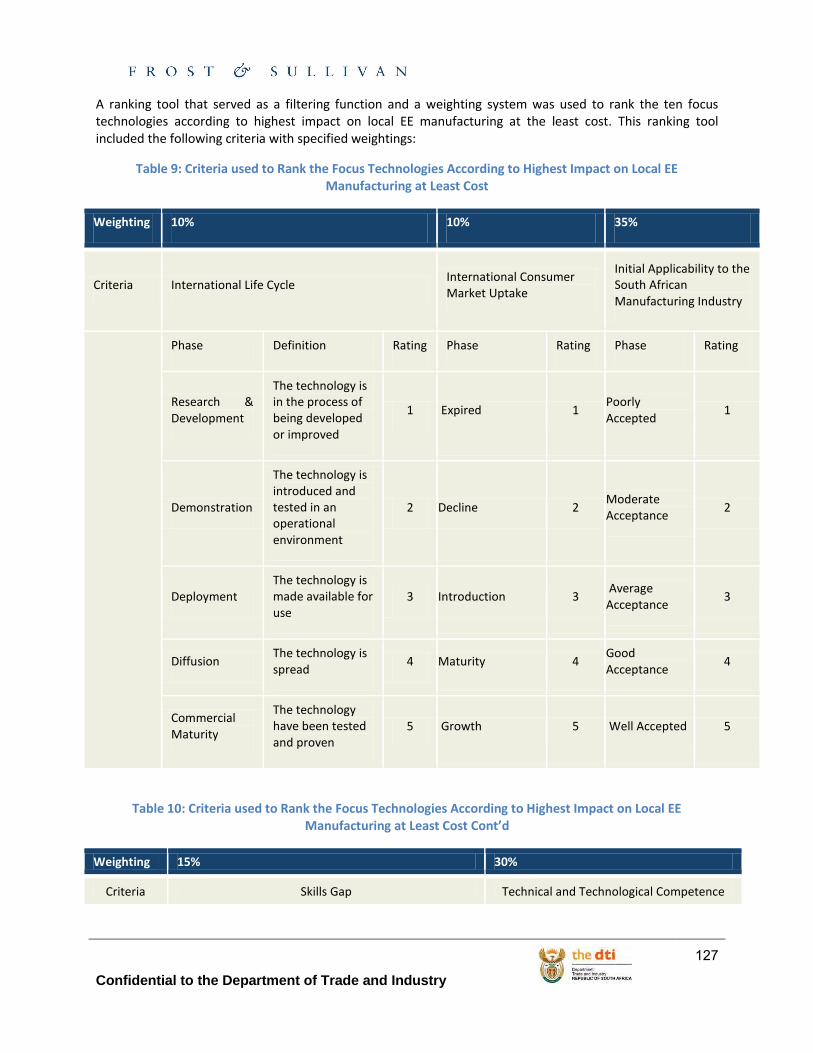
Confidential to the Department of Trade and Industry
127
A ranking tool that served as a filtering function and a weighting system was used to rank the ten focus technologies according to highest impact on local EE manufacturing at the least cost. This ranking tool included the following criteria with specified weightings:
Table 9: Criteria used to Rank the Focus Technologies According to Highest Impact on Local EE Manufacturing at Least Cost
Weighting 10% 10% 35%
Criteria International Life Cycle International Consumer Market Uptake
Initial Applicability to the South African Manufacturing Industry
Phase Definition Rating Phase Rating Phase Rating
Research & Development
The technology is in the process of being developed or improved
1 Expired 1 Poorly Accepted
1
Demonstration
The technology is introduced and tested in an operational environment
2 Decline 2 Moderate Acceptance
2
Deployment The technology is made available for use
3 Introduction 3 Average Acceptance
3
Diffusion The technology is spread
4 Maturity 4 Good Acceptance
4
Commercial Maturity
The technology have been tested and proven
5 Growth 5 Well Accepted 5
Table 10: Criteria used to Rank the Focus Technologies According to Highest Impact on Local EE Manufacturing at Least Cost Cont’d
Weighting 15% 30%
Criteria Skills Gap Technical and Technological Competence
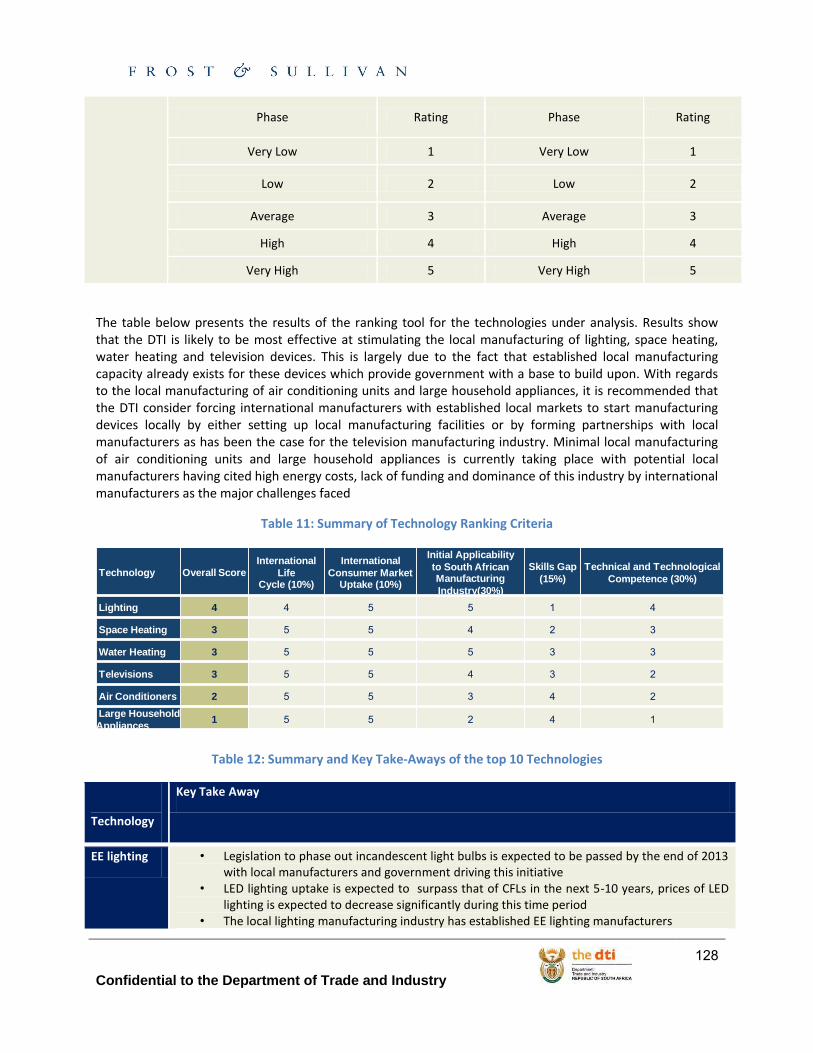
Confidential to the Department of Trade and Industry
128
Phase Rating Phase Rating
Very Low 1 Very Low 1
Low 2 Low 2
Average 3 Average 3
High 4 High 4
Very High 5 Very High 5
The table below presents the results of the ranking tool for the technologies under analysis. Results show that the DTI is likely to be most effective at stimulating the local manufacturing of lighting, space heating, water heating and television devices. This is largely due to the fact that established local manufacturing capacity already exists for these devices which provide government with a base to build upon. With regards to the local manufacturing of air conditioning units and large household appliances, it is recommended that the DTI consider forcing international manufacturers with established local markets to start manufacturing devices locally by either setting up local manufacturing facilities or by forming partnerships with local manufacturers as has been the case for the television manufacturing industry. Minimal local manufacturing of air conditioning units and large household appliances is currently taking place with potential local manufacturers having cited high energy costs, lack of funding and dominance of this industry by international manufacturers as the major challenges faced
Table 11: Summary of Technology Ranking Criteria
Table 12: Summary and Key Take-Aways of the top 10 Technologies
Technology
Key Take Away
EE lighting • Legislation to phase out incandescent light bulbs is expected to be passed by the end of 2013 with local manufacturers and government driving this initiative
• LED lighting uptake is expected to surpass that of CFLs in the next 5-10 years, prices of LED lighting is expected to decrease significantly during this time period
• The local lighting manufacturing industry has established EE lighting manufacturers
Technology Overall Score
International
Life Cycle (10%)
International
Consumer Market Uptake (10%)
Initial Applicability
to South African Manufacturing
Industry(30%)
Skills Gap
(15%)
Technical and Technological
Competence (30%)
Lighting 4 4 5 5 1 4
Space Heating 3 5 5 4 2 3
Water Heating 3 5 5 5 3 3
Televisions 3 5 5 4 3 2
Air Conditioners 2 5 5 3 4 2
Large Household
Appliances1 5 5 2 4 1
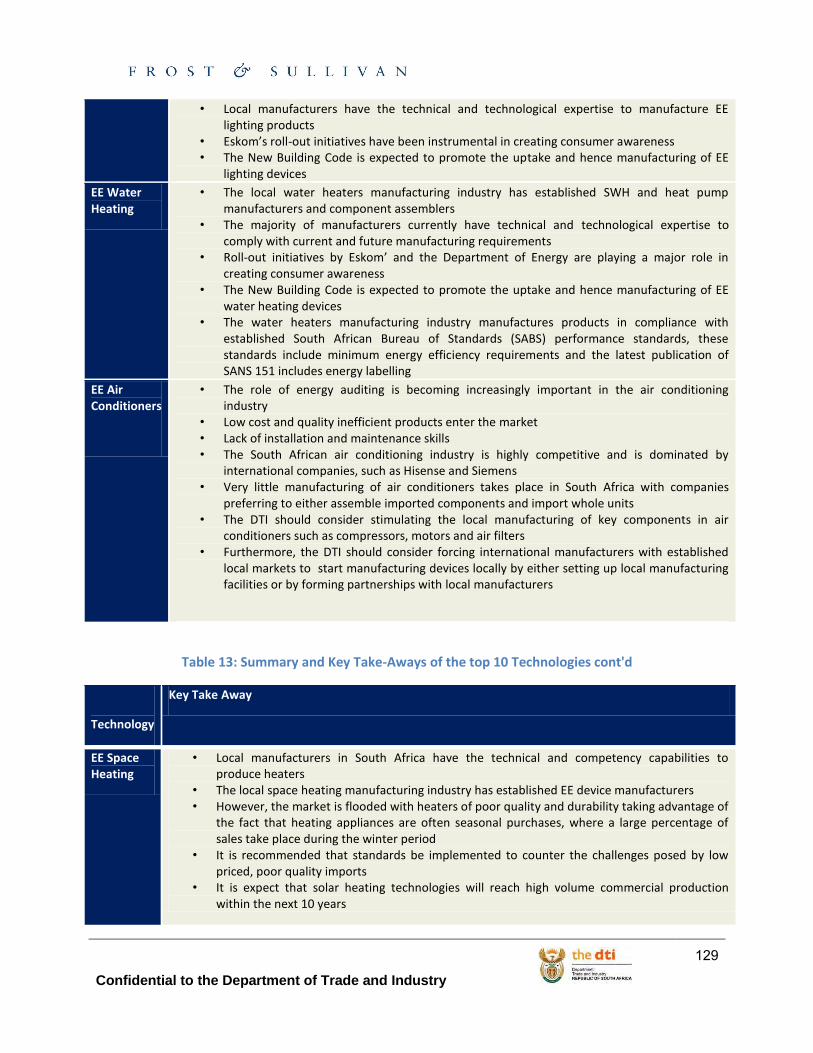
Confidential to the Department of Trade and Industry
129
• Local manufacturers have the technical and technological expertise to manufacture EE lighting products
• Eskom’s roll-out initiatives have been instrumental in creating consumer awareness • The New Building Code is expected to promote the uptake and hence manufacturing of EE
lighting devices
EE Water Heating
• The local water heaters manufacturing industry has established SWH and heat pump manufacturers and component assemblers
• The majority of manufacturers currently have technical and technological expertise to comply with current and future manufacturing requirements
• Roll-out initiatives by Eskom’ and the Department of Energy are playing a major role in creating consumer awareness
• The New Building Code is expected to promote the uptake and hence manufacturing of EE water heating devices
• The water heaters manufacturing industry manufactures products in compliance with established South African Bureau of Standards (SABS) performance standards, these standards include minimum energy efficiency requirements and the latest publication of SANS 151 includes energy labelling
EE Air Conditioners
• The role of energy auditing is becoming increasingly important in the air conditioning industry
• Low cost and quality inefficient products enter the market • Lack of installation and maintenance skills • The South African air conditioning industry is highly competitive and is dominated by
international companies, such as Hisense and Siemens • Very little manufacturing of air conditioners takes place in South Africa with companies
preferring to either assemble imported components and import whole units • The DTI should consider stimulating the local manufacturing of key components in air
conditioners such as compressors, motors and air filters • Furthermore, the DTI should consider forcing international manufacturers with established
local markets to start manufacturing devices locally by either setting up local manufacturing facilities or by forming partnerships with local manufacturers
Table 13: Summary and Key Take-Aways of the top 10 Technologies cont'd
Technology
Key Take Away
EE Space Heating
• Local manufacturers in South Africa have the technical and competency capabilities to produce heaters
• The local space heating manufacturing industry has established EE device manufacturers • However, the market is flooded with heaters of poor quality and durability taking advantage of
the fact that heating appliances are often seasonal purchases, where a large percentage of sales take place during the winter period
• It is recommended that standards be implemented to counter the challenges posed by low priced, poor quality imports
• It is expect that solar heating technologies will reach high volume commercial production within the next 10 years
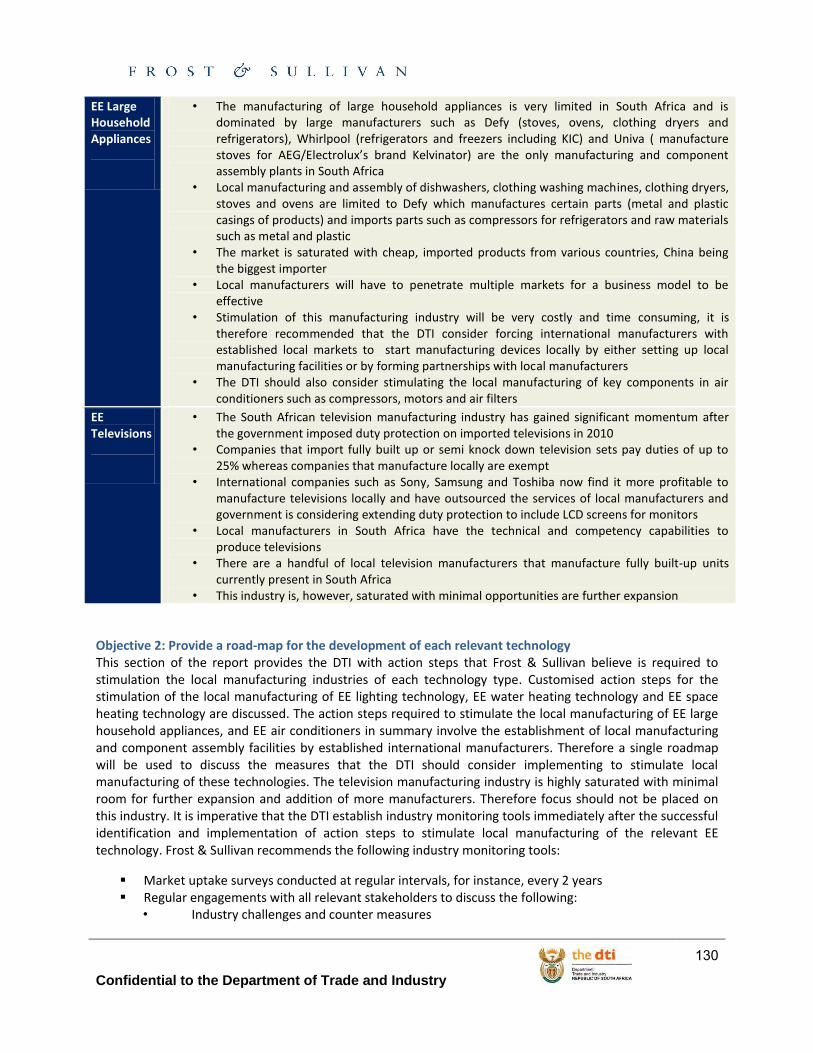
Confidential to the Department of Trade and Industry
130
EE Large Household Appliances
• The manufacturing of large household appliances is very limited in South Africa and is dominated by large manufacturers such as Defy (stoves, ovens, clothing dryers and refrigerators), Whirlpool (refrigerators and freezers including KIC) and Univa ( manufacture stoves for AEG/Electrolux’s brand Kelvinator) are the only manufacturing and component assembly plants in South Africa
• Local manufacturing and assembly of dishwashers, clothing washing machines, clothing dryers, stoves and ovens are limited to Defy which manufactures certain parts (metal and plastic casings of products) and imports parts such as compressors for refrigerators and raw materials such as metal and plastic
• The market is saturated with cheap, imported products from various countries, China being the biggest importer
• Local manufacturers will have to penetrate multiple markets for a business model to be effective
• Stimulation of this manufacturing industry will be very costly and time consuming, it is therefore recommended that the DTI consider forcing international manufacturers with established local markets to start manufacturing devices locally by either setting up local manufacturing facilities or by forming partnerships with local manufacturers
• The DTI should also consider stimulating the local manufacturing of key components in air conditioners such as compressors, motors and air filters
EE Televisions
• The South African television manufacturing industry has gained significant momentum after the government imposed duty protection on imported televisions in 2010
• Companies that import fully built up or semi knock down television sets pay duties of up to 25% whereas companies that manufacture locally are exempt
• International companies such as Sony, Samsung and Toshiba now find it more profitable to manufacture televisions locally and have outsourced the services of local manufacturers and government is considering extending duty protection to include LCD screens for monitors
• Local manufacturers in South Africa have the technical and competency capabilities to produce televisions
• There are a handful of local television manufacturers that manufacture fully built-up units currently present in South Africa
• This industry is, however, saturated with minimal opportunities are further expansion
Objective 2: Provide a road-map for the development of each relevant technology This section of the report provides the DTI with action steps that Frost & Sullivan believe is required to stimulation the local manufacturing industries of each technology type. Customised action steps for the stimulation of the local manufacturing of EE lighting technology, EE water heating technology and EE space heating technology are discussed. The action steps required to stimulate the local manufacturing of EE large household appliances, and EE air conditioners in summary involve the establishment of local manufacturing and component assembly facilities by established international manufacturers. Therefore a single roadmap will be used to discuss the measures that the DTI should consider implementing to stimulate local manufacturing of these technologies. The television manufacturing industry is highly saturated with minimal room for further expansion and addition of more manufacturers. Therefore focus should not be placed on this industry. It is imperative that the DTI establish industry monitoring tools immediately after the successful identification and implementation of action steps to stimulate local manufacturing of the relevant EE technology. Frost & Sullivan recommends the following industry monitoring tools:
Market uptake surveys conducted at regular intervals, for instance, every 2 years Regular engagements with all relevant stakeholders to discuss the following:
• Industry challenges and counter measures
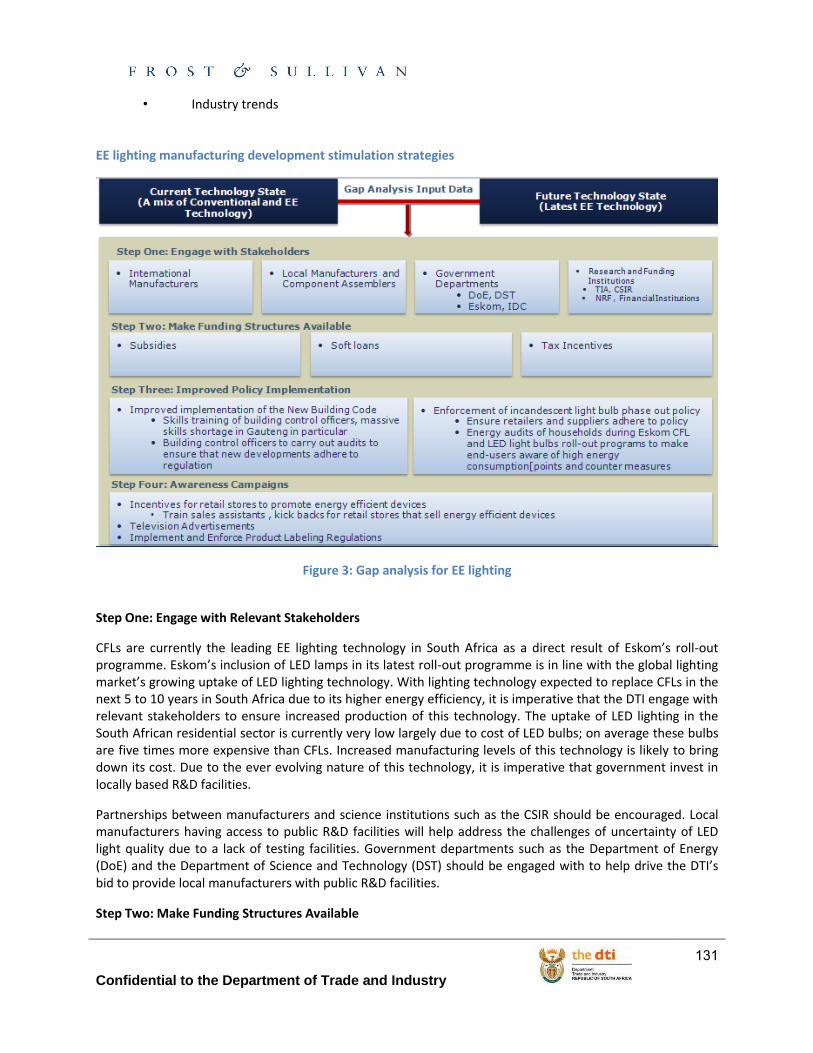
Confidential to the Department of Trade and Industry
131
• Industry trends EE lighting manufacturing development stimulation strategies
Figure 3: Gap analysis for EE lighting
Step One: Engage with Relevant Stakeholders
CFLs are currently the leading EE lighting technology in South Africa as a direct result of Eskom’s roll-out programme. Eskom’s inclusion of LED lamps in its latest roll-out programme is in line with the global lighting market’s growing uptake of LED lighting technology. With lighting technology expected to replace CFLs in the next 5 to 10 years in South Africa due to its higher energy efficiency, it is imperative that the DTI engage with relevant stakeholders to ensure increased production of this technology. The uptake of LED lighting in the South African residential sector is currently very low largely due to cost of LED bulbs; on average these bulbs are five times more expensive than CFLs. Increased manufacturing levels of this technology is likely to bring down its cost. Due to the ever evolving nature of this technology, it is imperative that government invest in locally based R&D facilities.
Partnerships between manufacturers and science institutions such as the CSIR should be encouraged. Local manufacturers having access to public R&D facilities will help address the challenges of uncertainty of LED light quality due to a lack of testing facilities. Government departments such as the Department of Energy (DoE) and the Department of Science and Technology (DST) should be engaged with to help drive the DTI’s bid to provide local manufacturers with public R&D facilities.
Step Two: Make Funding Structures Available
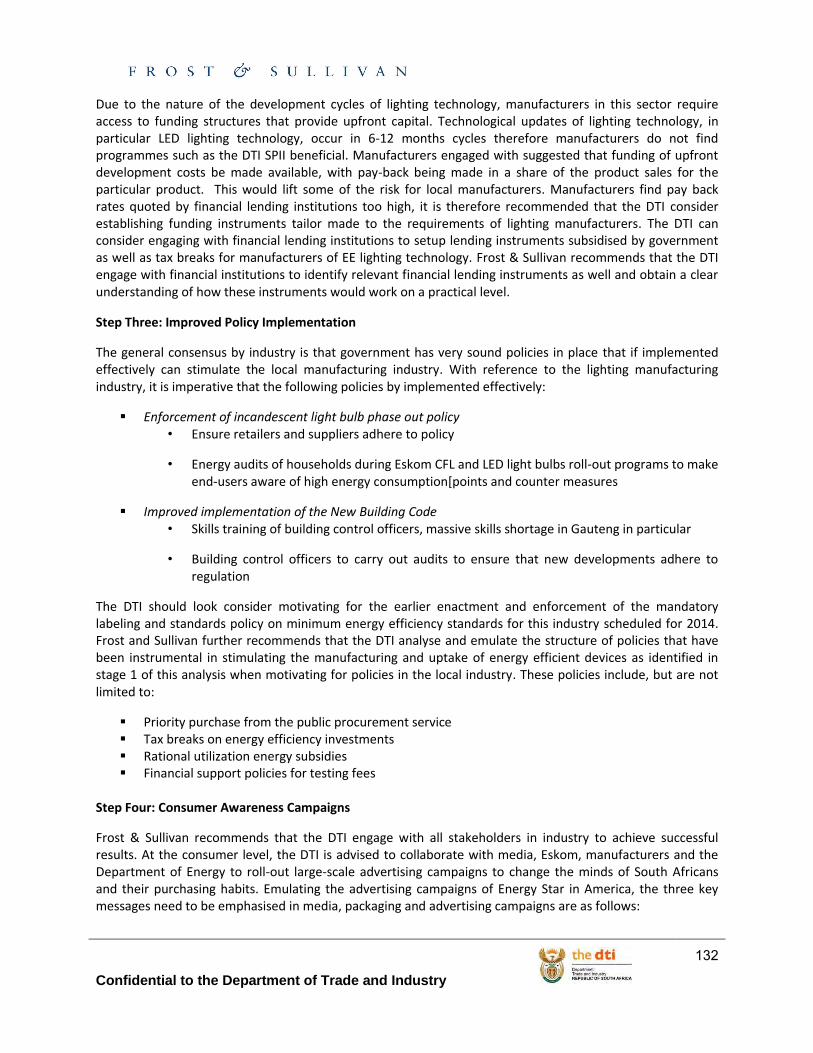
Confidential to the Department of Trade and Industry
132
Due to the nature of the development cycles of lighting technology, manufacturers in this sector require access to funding structures that provide upfront capital. Technological updates of lighting technology, in particular LED lighting technology, occur in 6-12 months cycles therefore manufacturers do not find programmes such as the DTI SPII beneficial. Manufacturers engaged with suggested that funding of upfront development costs be made available, with pay-back being made in a share of the product sales for the particular product. This would lift some of the risk for local manufacturers. Manufacturers find pay back rates quoted by financial lending institutions too high, it is therefore recommended that the DTI consider establishing funding instruments tailor made to the requirements of lighting manufacturers. The DTI can consider engaging with financial lending institutions to setup lending instruments subsidised by government as well as tax breaks for manufacturers of EE lighting technology. Frost & Sullivan recommends that the DTI engage with financial institutions to identify relevant financial lending instruments as well and obtain a clear understanding of how these instruments would work on a practical level.
Step Three: Improved Policy Implementation
The general consensus by industry is that government has very sound policies in place that if implemented effectively can stimulate the local manufacturing industry. With reference to the lighting manufacturing industry, it is imperative that the following policies by implemented effectively:
Enforcement of incandescent light bulb phase out policy • Ensure retailers and suppliers adhere to policy
• Energy audits of households during Eskom CFL and LED light bulbs roll-out programs to make end-users aware of high energy consumption[points and counter measures
Improved implementation of the New Building Code • Skills training of building control officers, massive skills shortage in Gauteng in particular
• Building control officers to carry out audits to ensure that new developments adhere to regulation
The DTI should look consider motivating for the earlier enactment and enforcement of the mandatory labeling and standards policy on minimum energy efficiency standards for this industry scheduled for 2014. Frost and Sullivan further recommends that the DTI analyse and emulate the structure of policies that have been instrumental in stimulating the manufacturing and uptake of energy efficient devices as identified in stage 1 of this analysis when motivating for policies in the local industry. These policies include, but are not limited to:
Priority purchase from the public procurement service Tax breaks on energy efficiency investments Rational utilization energy subsidies Financial support policies for testing fees
Step Four: Consumer Awareness Campaigns
Frost & Sullivan recommends that the DTI engage with all stakeholders in industry to achieve successful results. At the consumer level, the DTI is advised to collaborate with media, Eskom, manufacturers and the Department of Energy to roll-out large-scale advertising campaigns to change the minds of South Africans and their purchasing habits. Emulating the advertising campaigns of Energy Star in America, the three key messages need to be emphasised in media, packaging and advertising campaigns are as follows:
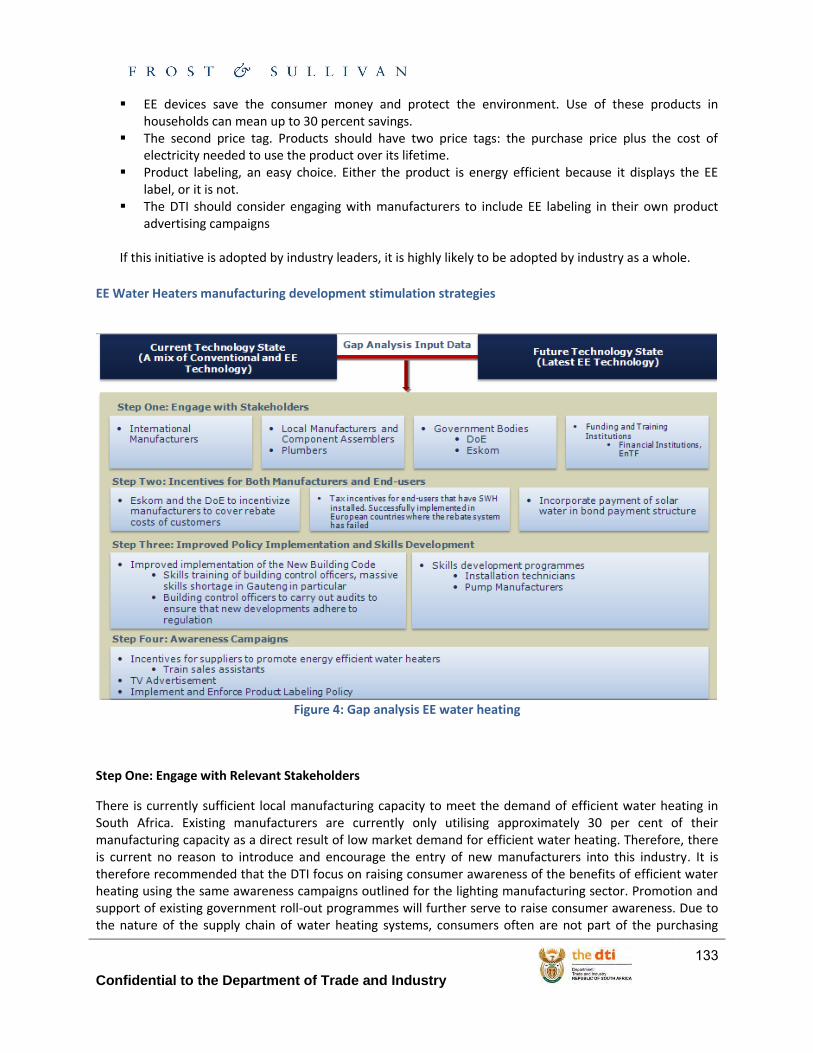
Confidential to the Department of Trade and Industry
133
EE devices save the consumer money and protect the environment. Use of these products in households can mean up to 30 percent savings.
The second price tag. Products should have two price tags: the purchase price plus the cost of electricity needed to use the product over its lifetime.
Product labeling, an easy choice. Either the product is energy efficient because it displays the EE label, or it is not.
The DTI should consider engaging with manufacturers to include EE labeling in their own product advertising campaigns
If this initiative is adopted by industry leaders, it is highly likely to be adopted by industry as a whole.
EE Water Heaters manufacturing development stimulation strategies
Figure 4: Gap analysis EE water heating
Step One: Engage with Relevant Stakeholders
There is currently sufficient local manufacturing capacity to meet the demand of efficient water heating in South Africa. Existing manufacturers are currently only utilising approximately 30 per cent of their manufacturing capacity as a direct result of low market demand for efficient water heating. Therefore, there is current no reason to introduce and encourage the entry of new manufacturers into this industry. It is therefore recommended that the DTI focus on raising consumer awareness of the benefits of efficient water heating using the same awareness campaigns outlined for the lighting manufacturing sector. Promotion and support of existing government roll-out programmes will further serve to raise consumer awareness. Due to the nature of the supply chain of water heating systems, consumers often are not part of the purchasing
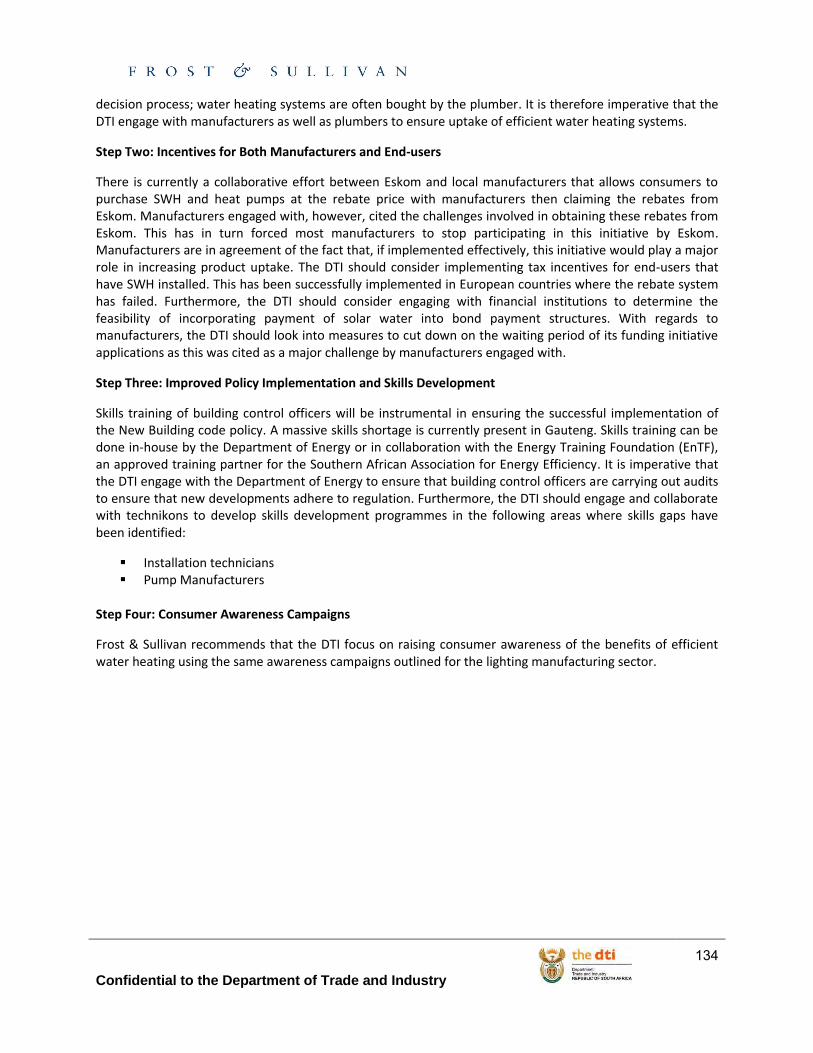
Confidential to the Department of Trade and Industry
134
decision process; water heating systems are often bought by the plumber. It is therefore imperative that the DTI engage with manufacturers as well as plumbers to ensure uptake of efficient water heating systems.
Step Two: Incentives for Both Manufacturers and End-users
There is currently a collaborative effort between Eskom and local manufacturers that allows consumers to purchase SWH and heat pumps at the rebate price with manufacturers then claiming the rebates from Eskom. Manufacturers engaged with, however, cited the challenges involved in obtaining these rebates from Eskom. This has in turn forced most manufacturers to stop participating in this initiative by Eskom. Manufacturers are in agreement of the fact that, if implemented effectively, this initiative would play a major role in increasing product uptake. The DTI should consider implementing tax incentives for end-users that have SWH installed. This has been successfully implemented in European countries where the rebate system has failed. Furthermore, the DTI should consider engaging with financial institutions to determine the feasibility of incorporating payment of solar water into bond payment structures. With regards to manufacturers, the DTI should look into measures to cut down on the waiting period of its funding initiative applications as this was cited as a major challenge by manufacturers engaged with.
Step Three: Improved Policy Implementation and Skills Development
Skills training of building control officers will be instrumental in ensuring the successful implementation of the New Building code policy. A massive skills shortage is currently present in Gauteng. Skills training can be done in-house by the Department of Energy or in collaboration with the Energy Training Foundation (EnTF), an approved training partner for the Southern African Association for Energy Efficiency. It is imperative that the DTI engage with the Department of Energy to ensure that building control officers are carrying out audits to ensure that new developments adhere to regulation. Furthermore, the DTI should engage and collaborate with technikons to develop skills development programmes in the following areas where skills gaps have been identified:
Installation technicians Pump Manufacturers
Step Four: Consumer Awareness Campaigns
Frost & Sullivan recommends that the DTI focus on raising consumer awareness of the benefits of efficient water heating using the same awareness campaigns outlined for the lighting manufacturing sector.

Confidential to the Department of Trade and Industry
135
EE Space Heating manufacturing development stimulation strategies
Figure 5: Gap analysis space heating
Step One: Engage with Relevant Stakeholders
One of the major challenges faced by local space heating manufacturers is competition from imported low priced, poor quality heaters. Heaters imported from China accounted for approximately 92 per cent of total heaters imported into South Africa in 2011. It is therefore imperative that the DTI engage with the International Trade Association Commission (ITAC) of South Africa to discuss the feasibility of imposing higher duty protection on fully built up heaters. Engagements with bodies such as the IDC to facilitate the setting up industrial manufacturing zones for EE space heating manufacturers is likely to stimulate the growth of this industry. Set up of these zones would address the issue of financial incentives in this industry. It should be noted that engagements with the IDC can be used to set up industrial manufacturing zones for the other EE technologies whose local manufacturing the DTI is striving to stimulate. Furthermore, the DTI can collaborate with Eskom and the DoE to raise consumer awareness of the benefits of EE devices during roll-out programmes.
Step Two: Funding Incentives and Structures
Manufacturers engaged with find funding schemes offered by the DTI such as MCEP and SPII to be appropriate for their financial requirements. They however cited the frustrations associated with the waiting periods and bureaucracy of the application process of these funding schemes. The DTI should therefore put measures in place to address the structure and timeframes of its funding schemes. Furthermore, as was stated for manufacturers of EE lighting technology, the DTI should consider engaging with financial lending institutions to setup a lending instrument subsidised by government as well as tax breaks for manufacturers of EE space heating technology.
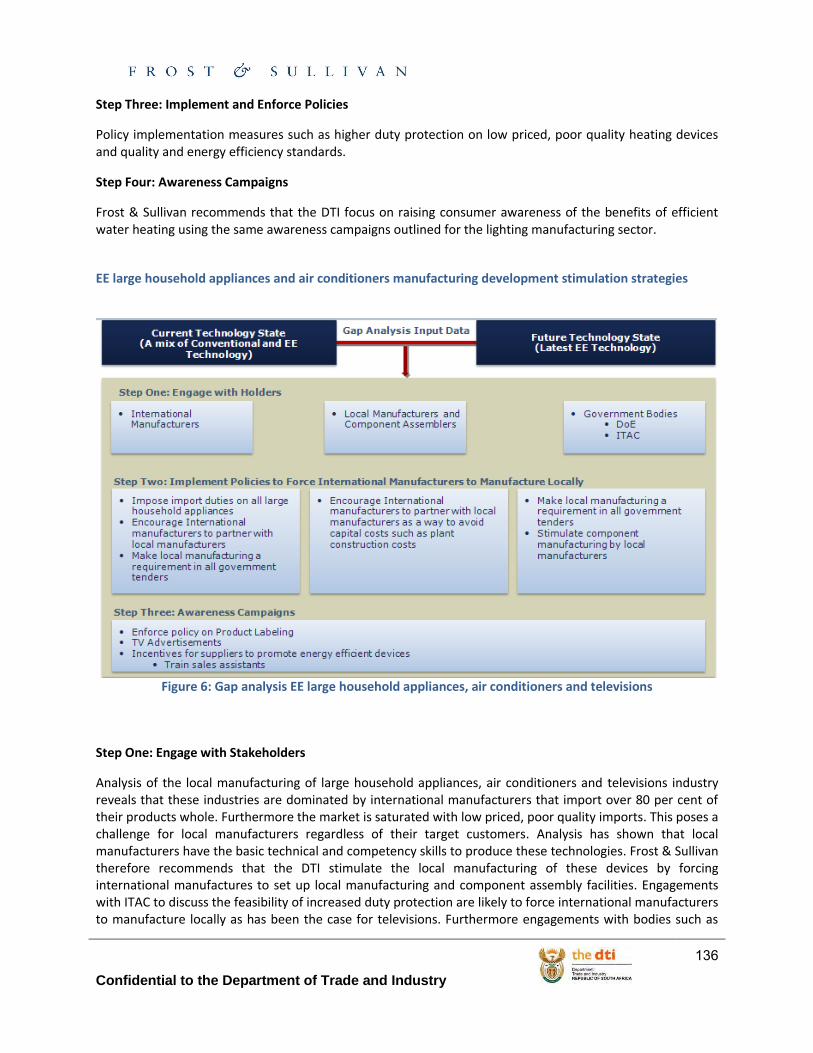
Confidential to the Department of Trade and Industry
136
Step Three: Implement and Enforce Policies
Policy implementation measures such as higher duty protection on low priced, poor quality heating devices and quality and energy efficiency standards.
Step Four: Awareness Campaigns
Frost & Sullivan recommends that the DTI focus on raising consumer awareness of the benefits of efficient water heating using the same awareness campaigns outlined for the lighting manufacturing sector.
EE large household appliances and air conditioners manufacturing development stimulation strategies
Figure 6: Gap analysis EE large household appliances, air conditioners and televisions
Step One: Engage with Stakeholders
Analysis of the local manufacturing of large household appliances, air conditioners and televisions industry reveals that these industries are dominated by international manufacturers that import over 80 per cent of their products whole. Furthermore the market is saturated with low priced, poor quality imports. This poses a challenge for local manufacturers regardless of their target customers. Analysis has shown that local manufacturers have the basic technical and competency skills to produce these technologies. Frost & Sullivan therefore recommends that the DTI stimulate the local manufacturing of these devices by forcing international manufactures to set up local manufacturing and component assembly facilities. Engagements with ITAC to discuss the feasibility of increased duty protection are likely to force international manufacturers to manufacture locally as has been the case for televisions. Furthermore engagements with bodies such as
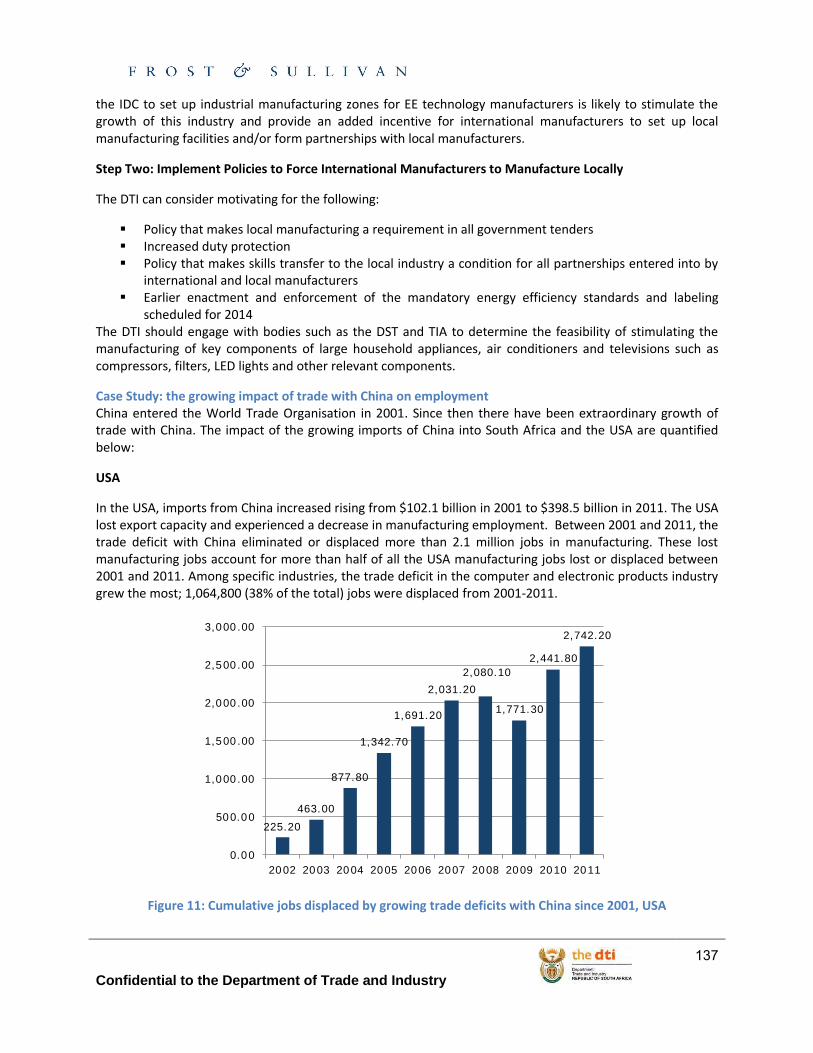
Confidential to the Department of Trade and Industry
137
the IDC to set up industrial manufacturing zones for EE technology manufacturers is likely to stimulate the growth of this industry and provide an added incentive for international manufacturers to set up local manufacturing facilities and/or form partnerships with local manufacturers.
Step Two: Implement Policies to Force International Manufacturers to Manufacture Locally
The DTI can consider motivating for the following:
Policy that makes local manufacturing a requirement in all government tenders Increased duty protection Policy that makes skills transfer to the local industry a condition for all partnerships entered into by
international and local manufacturers Earlier enactment and enforcement of the mandatory energy efficiency standards and labeling
scheduled for 2014 The DTI should engage with bodies such as the DST and TIA to determine the feasibility of stimulating the manufacturing of key components of large household appliances, air conditioners and televisions such as compressors, filters, LED lights and other relevant components.
Case Study: the growing impact of trade with China on employment China entered the World Trade Organisation in 2001. Since then there have been extraordinary growth of trade with China. The impact of the growing imports of China into South Africa and the USA are quantified below:
USA
In the USA, imports from China increased rising from $102.1 billion in 2001 to $398.5 billion in 2011. The USA lost export capacity and experienced a decrease in manufacturing employment. Between 2001 and 2011, the trade deficit with China eliminated or displaced more than 2.1 million jobs in manufacturing. These lost manufacturing jobs account for more than half of all the USA manufacturing jobs lost or displaced between 2001 and 2011. Among specific industries, the trade deficit in the computer and electronic products industry grew the most; 1,064,800 (38% of the total) jobs were displaced from 2001-2011.
Figure 11: Cumulative jobs displaced by growing trade deficits with China since 2001, USA
225.20
463.00
877.80
1,342.70
1,691.20
2,031.20
2,080.10
1,771.30
2,441.80
2,742.20
0.00
500.00
1,000.00
1,500.00
2,000.00
2,500.00
3,000.00
2002 2003 2004 2005 2006 2007 2008 2009 2010 2011
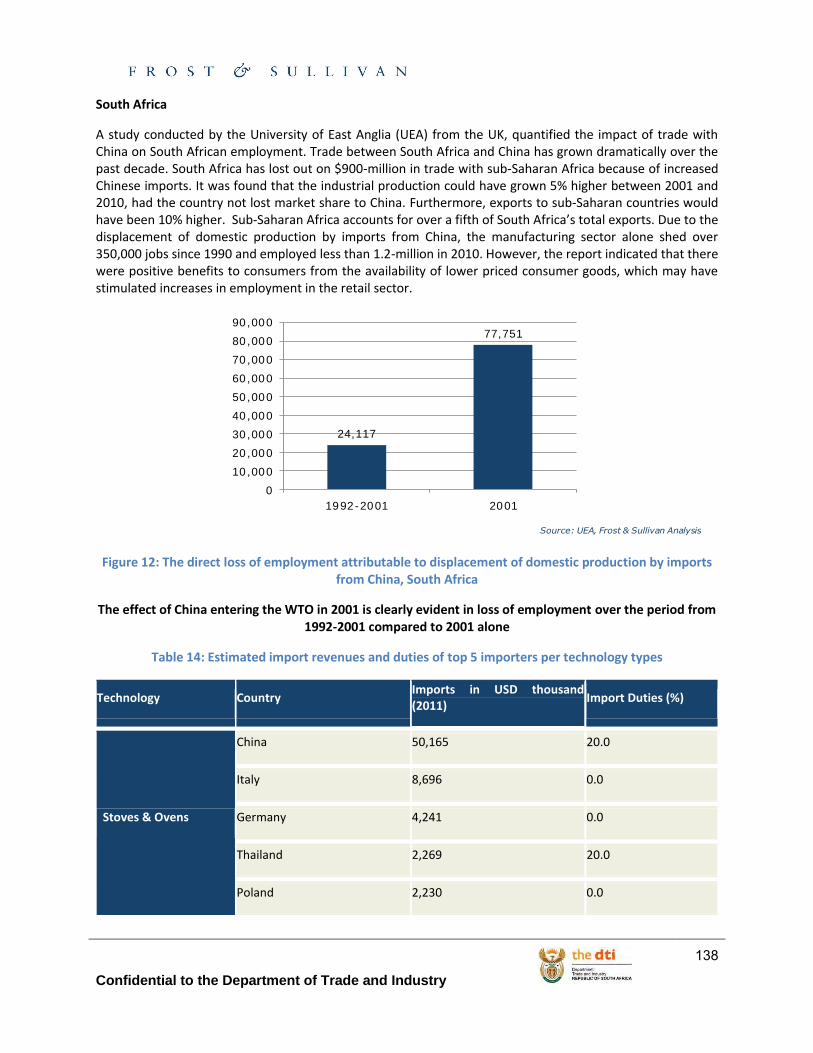
Confidential to the Department of Trade and Industry
138
South Africa
A study conducted by the University of East Anglia (UEA) from the UK, quantified the impact of trade with China on South African employment. Trade between South Africa and China has grown dramatically over the past decade. South Africa has lost out on $900-million in trade with sub-Saharan Africa because of increased Chinese imports. It was found that the industrial production could have grown 5% higher between 2001 and 2010, had the country not lost market share to China. Furthermore, exports to sub-Saharan countries would have been 10% higher. Sub-Saharan Africa accounts for over a fifth of South Africa’s total exports. Due to the displacement of domestic production by imports from China, the manufacturing sector alone shed over 350,000 jobs since 1990 and employed less than 1.2-million in 2010. However, the report indicated that there were positive benefits to consumers from the availability of lower priced consumer goods, which may have stimulated increases in employment in the retail sector.
Figure 12: The direct loss of employment attributable to displacement of domestic production by imports from China, South Africa
The effect of China entering the WTO in 2001 is clearly evident in loss of employment over the period from 1992-2001 compared to 2001 alone
Table 14: Estimated import revenues and duties of top 5 importers per technology types
Technology Country Imports in USD thousand (2011)
Import Duties (%)
Stoves & Ovens
China 50,165 20.0
Italy 8,696 0.0
Germany 4,241 0.0
Thailand 2,269 20.0
Poland 2,230 0.0
24,117
77,751
0
10,000
20,000
30,000
40,000
50,000
60,000
70,000
80,000
90,000
1992-2001 2001
Source: UEA, Frost & Sullivan Analysis
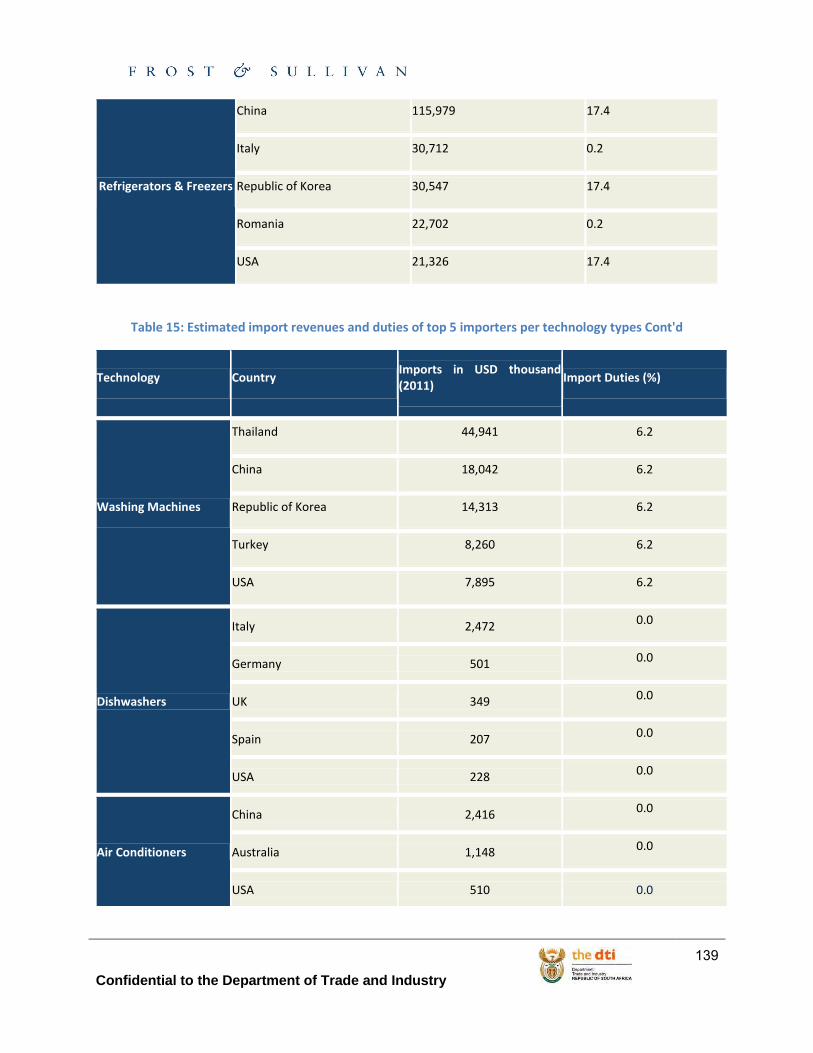
Confidential to the Department of Trade and Industry
139
Refrigerators & Freezers
China 115,979 17.4
Italy 30,712 0.2
Republic of Korea 30,547 17.4
Romania 22,702 0.2
USA 21,326 17.4
Table 15: Estimated import revenues and duties of top 5 importers per technology types Cont'd
Technology Country Imports in USD thousand (2011)
Import Duties (%)
Washing Machines
Thailand 44,941 6.2
China 18,042 6.2
Republic of Korea 14,313 6.2
Turkey 8,260 6.2
USA 7,895 6.2
Dishwashers
Italy 2,472 0.0
Germany 501 0.0
UK 349 0.0
Spain 207 0.0
USA 228 0.0
Air Conditioners
China 2,416 0.0
Australia 1,148 0.0
USA 510 0.0
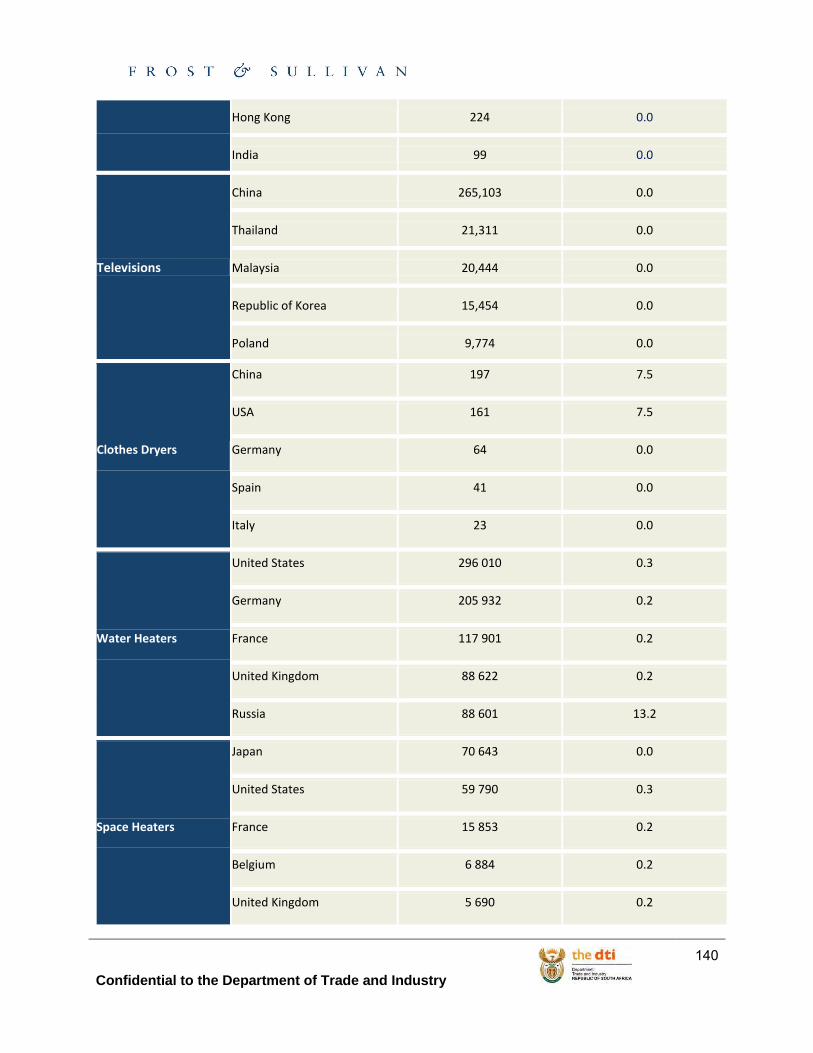
Confidential to the Department of Trade and Industry
140
Hong Kong 224 0.0
India 99 0.0
Televisions
China 265,103 0.0
Thailand 21,311 0.0
Malaysia 20,444 0.0
Republic of Korea 15,454 0.0
Poland 9,774 0.0
Clothes Dryers
China 197 7.5
USA 161 7.5
Germany 64 0.0
Spain 41 0.0
Italy 23 0.0
Water Heaters
United States 296 010 0.3
Germany 205 932 0.2
France 117 901 0.2
United Kingdom 88 622 0.2
Russia 88 601 13.2
Space Heaters
Japan 70 643 0.0
United States 59 790 0.3
France 15 853 0.2
Belgium 6 884 0.2
United Kingdom 5 690 0.2
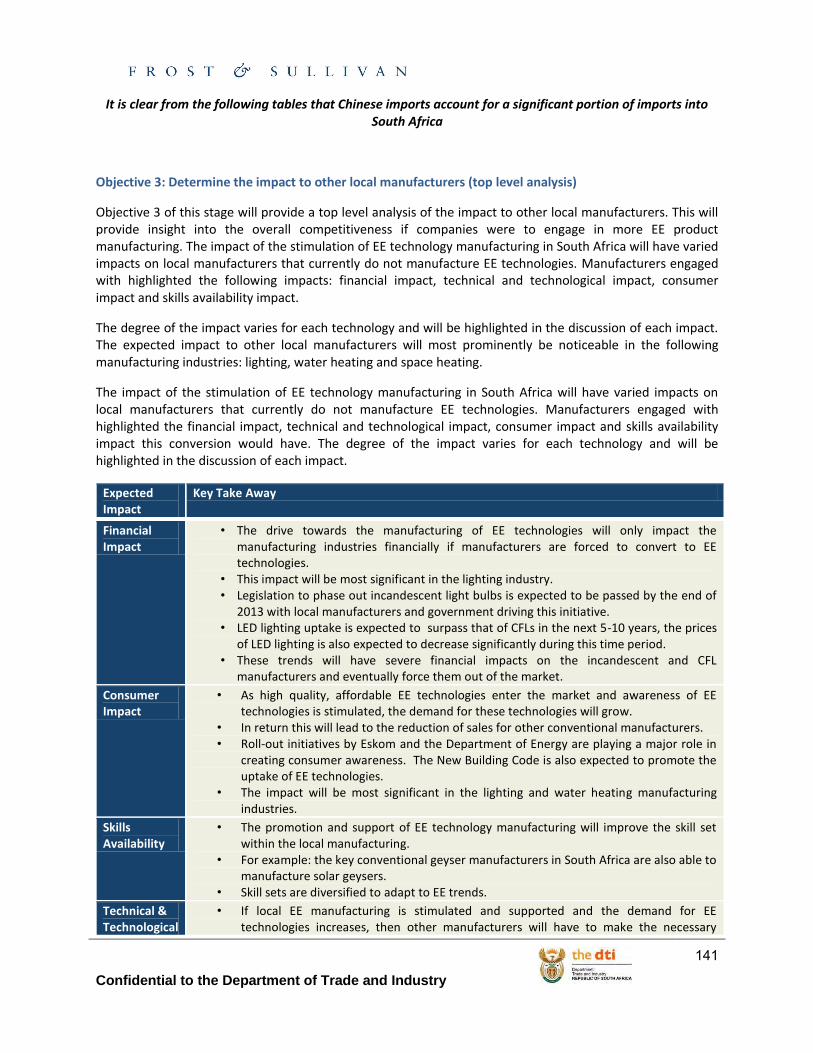
Confidential to the Department of Trade and Industry
141
It is clear from the following tables that Chinese imports account for a significant portion of imports into South Africa
Objective 3: Determine the impact to other local manufacturers (top level analysis)
Objective 3 of this stage will provide a top level analysis of the impact to other local manufacturers. This will provide insight into the overall competitiveness if companies were to engage in more EE product manufacturing. The impact of the stimulation of EE technology manufacturing in South Africa will have varied impacts on local manufacturers that currently do not manufacture EE technologies. Manufacturers engaged with highlighted the following impacts: financial impact, technical and technological impact, consumer impact and skills availability impact.
The degree of the impact varies for each technology and will be highlighted in the discussion of each impact. The expected impact to other local manufacturers will most prominently be noticeable in the following manufacturing industries: lighting, water heating and space heating.
The impact of the stimulation of EE technology manufacturing in South Africa will have varied impacts on local manufacturers that currently do not manufacture EE technologies. Manufacturers engaged with highlighted the financial impact, technical and technological impact, consumer impact and skills availability impact this conversion would have. The degree of the impact varies for each technology and will be highlighted in the discussion of each impact.
Expected Impact
Key Take Away
Financial Impact
• The drive towards the manufacturing of EE technologies will only impact the manufacturing industries financially if manufacturers are forced to convert to EE technologies.
• This impact will be most significant in the lighting industry. • Legislation to phase out incandescent light bulbs is expected to be passed by the end of
2013 with local manufacturers and government driving this initiative. • LED lighting uptake is expected to surpass that of CFLs in the next 5-10 years, the prices
of LED lighting is also expected to decrease significantly during this time period. • These trends will have severe financial impacts on the incandescent and CFL
manufacturers and eventually force them out of the market.
Consumer Impact
• As high quality, affordable EE technologies enter the market and awareness of EE technologies is stimulated, the demand for these technologies will grow.
• In return this will lead to the reduction of sales for other conventional manufacturers. • Roll-out initiatives by Eskom and the Department of Energy are playing a major role in
creating consumer awareness. The New Building Code is also expected to promote the uptake of EE technologies.
• The impact will be most significant in the lighting and water heating manufacturing industries.
Skills Availability
• The promotion and support of EE technology manufacturing will improve the skill set within the local manufacturing.
• For example: the key conventional geyser manufacturers in South Africa are also able to manufacture solar geysers.
• Skill sets are diversified to adapt to EE trends.
Technical & Technological
• If local EE manufacturing is stimulated and supported and the demand for EE technologies increases, then other manufacturers will have to make the necessary
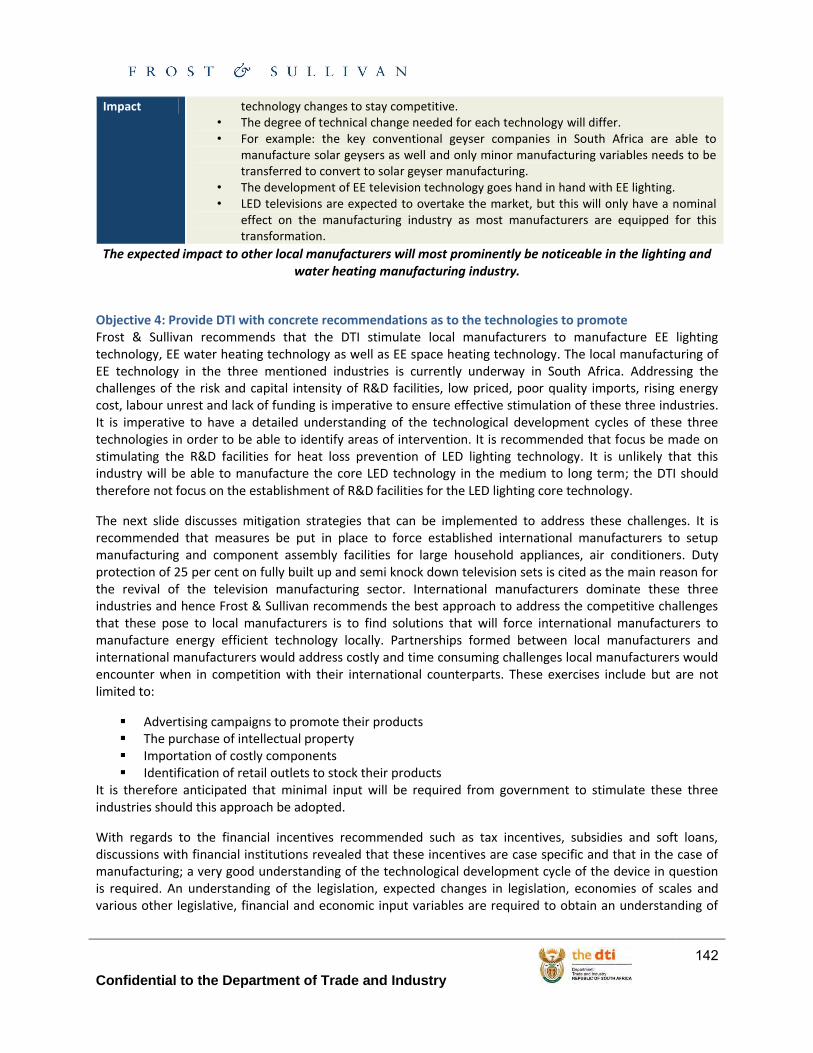
Confidential to the Department of Trade and Industry
142
Impact technology changes to stay competitive. • The degree of technical change needed for each technology will differ. • For example: the key conventional geyser companies in South Africa are able to
manufacture solar geysers as well and only minor manufacturing variables needs to be transferred to convert to solar geyser manufacturing.
• The development of EE television technology goes hand in hand with EE lighting. • LED televisions are expected to overtake the market, but this will only have a nominal
effect on the manufacturing industry as most manufacturers are equipped for this transformation.
The expected impact to other local manufacturers will most prominently be noticeable in the lighting and water heating manufacturing industry.
Objective 4: Provide DTI with concrete recommendations as to the technologies to promote Frost & Sullivan recommends that the DTI stimulate local manufacturers to manufacture EE lighting technology, EE water heating technology as well as EE space heating technology. The local manufacturing of EE technology in the three mentioned industries is currently underway in South Africa. Addressing the challenges of the risk and capital intensity of R&D facilities, low priced, poor quality imports, rising energy cost, labour unrest and lack of funding is imperative to ensure effective stimulation of these three industries. It is imperative to have a detailed understanding of the technological development cycles of these three technologies in order to be able to identify areas of intervention. It is recommended that focus be made on stimulating the R&D facilities for heat loss prevention of LED lighting technology. It is unlikely that this industry will be able to manufacture the core LED technology in the medium to long term; the DTI should therefore not focus on the establishment of R&D facilities for the LED lighting core technology.
The next slide discusses mitigation strategies that can be implemented to address these challenges. It is recommended that measures be put in place to force established international manufacturers to setup manufacturing and component assembly facilities for large household appliances, air conditioners. Duty protection of 25 per cent on fully built up and semi knock down television sets is cited as the main reason for the revival of the television manufacturing sector. International manufacturers dominate these three industries and hence Frost & Sullivan recommends the best approach to address the competitive challenges that these pose to local manufacturers is to find solutions that will force international manufacturers to manufacture energy efficient technology locally. Partnerships formed between local manufacturers and international manufacturers would address costly and time consuming challenges local manufacturers would encounter when in competition with their international counterparts. These exercises include but are not limited to:
Advertising campaigns to promote their products The purchase of intellectual property Importation of costly components Identification of retail outlets to stock their products
It is therefore anticipated that minimal input will be required from government to stimulate these three industries should this approach be adopted.
With regards to the financial incentives recommended such as tax incentives, subsidies and soft loans, discussions with financial institutions revealed that these incentives are case specific and that in the case of manufacturing; a very good understanding of the technological development cycle of the device in question is required. An understanding of the legislation, expected changes in legislation, economies of scales and various other legislative, financial and economic input variables are required to obtain an understanding of

Confidential to the Department of Trade and Industry
143
how these incentives would work on a practical level. Frost & Sullivan recommends that be addressed by a task team during the implementation phase of this project.
Frost & Sullivan recommends focus on the following specific EE technologies in the lighting, water heating and space heating manufacturing industries
Technology Focus EE Technology Reasons for Recommendation
Lighting LEDs
• Approximately 10 times more efficient than CFLs • Life span is approximately 5 times longer than that of
CFLs • Support Eskom’s roll-out programme • Reduce cost of bulbs by increasing production rate • Increase consumer uptake • Support implementation of New Building Code • Existing technical and technological expertise in the
local industry
Space Heating
Wall panel heaters, Oil-filled heaters, Solar Heaters
• Technologies do not reduce the moisture content of air
• Support implementation of New Building Code • Existing technical and technological expertise in the
local industry • Market analysis reveals that solar heating
technologies will reach high volume commercial production within the next 10 years globally
• Risk and capital intensity of R&Dfacilities
• Labour unrest
• Lack of funding
Mitigation Strategy
• Low priced, poor quality imports
• Collaborations with the NRF, CSIR and TIA
• Business Transparency measures , Revision of labour laws
• Soft loans, tax breaks, incentives, grants, subsidies
• Implementation of quality and energy efficiency standards
• Rising energy cost
• Kickbacks, incentives, tax breaks for manufacturers that setupindependent and/or backup power generation facilities.
• Collaboration with Eskom to set up a variable tariff system wherehigher consumption levels invoke higher unit prices
Industry Challenge
• Slow Policy Implementation• Skills training and capacity building of government implementation
teams
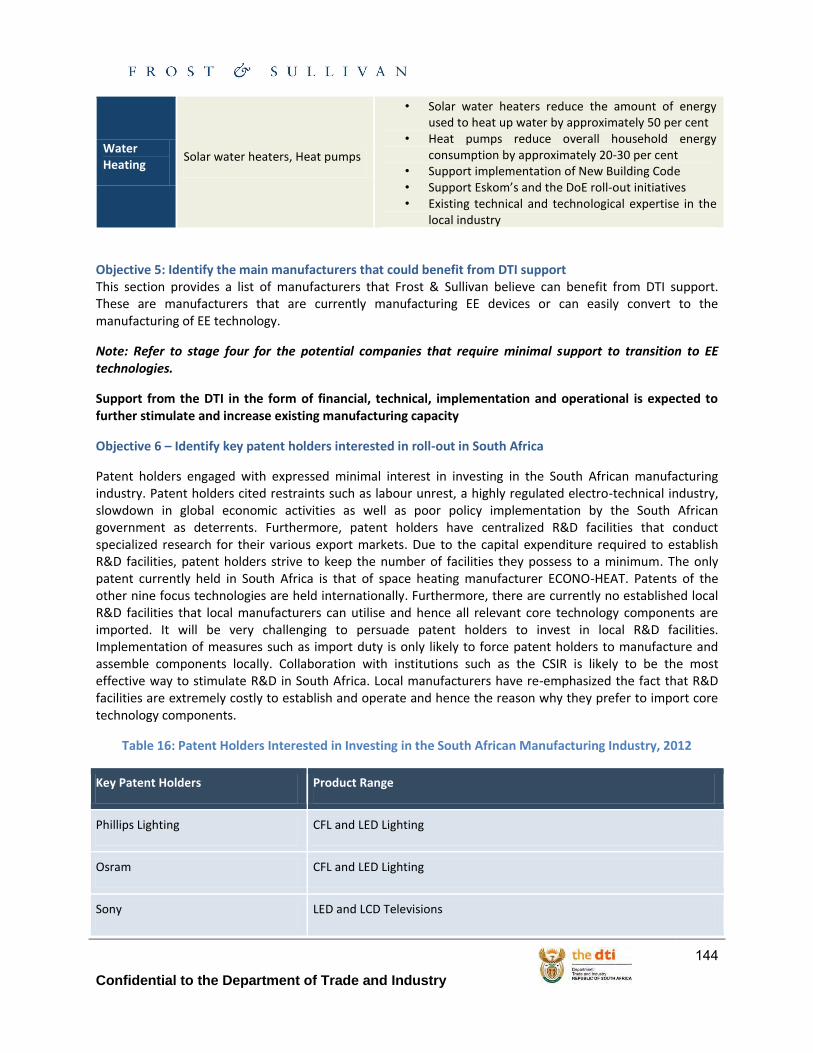
Confidential to the Department of Trade and Industry
144
Water Heating
Solar water heaters, Heat pumps
• Solar water heaters reduce the amount of energy used to heat up water by approximately 50 per cent
• Heat pumps reduce overall household energy consumption by approximately 20-30 per cent
• Support implementation of New Building Code • Support Eskom’s and the DoE roll-out initiatives • Existing technical and technological expertise in the
local industry
Objective 5: Identify the main manufacturers that could benefit from DTI support This section provides a list of manufacturers that Frost & Sullivan believe can benefit from DTI support. These are manufacturers that are currently manufacturing EE devices or can easily convert to the manufacturing of EE technology.
Note: Refer to stage four for the potential companies that require minimal support to transition to EE technologies.
Support from the DTI in the form of financial, technical, implementation and operational is expected to further stimulate and increase existing manufacturing capacity
Objective 6 – Identify key patent holders interested in roll-out in South Africa
Patent holders engaged with expressed minimal interest in investing in the South African manufacturing industry. Patent holders cited restraints such as labour unrest, a highly regulated electro-technical industry, slowdown in global economic activities as well as poor policy implementation by the South African government as deterrents. Furthermore, patent holders have centralized R&D facilities that conduct specialized research for their various export markets. Due to the capital expenditure required to establish R&D facilities, patent holders strive to keep the number of facilities they possess to a minimum. The only patent currently held in South Africa is that of space heating manufacturer ECONO-HEAT. Patents of the other nine focus technologies are held internationally. Furthermore, there are currently no established local R&D facilities that local manufacturers can utilise and hence all relevant core technology components are imported. It will be very challenging to persuade patent holders to invest in local R&D facilities. Implementation of measures such as import duty is only likely to force patent holders to manufacture and assemble components locally. Collaboration with institutions such as the CSIR is likely to be the most effective way to stimulate R&D in South Africa. Local manufacturers have re-emphasized the fact that R&D facilities are extremely costly to establish and operate and hence the reason why they prefer to import core technology components.
Table 16: Patent Holders Interested in Investing in the South African Manufacturing Industry, 2012
Key Patent Holders Product Range
Phillips Lighting CFL and LED Lighting
Osram CFL and LED Lighting
Sony LED and LCD Televisions

Confidential to the Department of Trade and Industry
145
Samsung LED and LCD Televisions
Kenwood Kenwood range of heater: Oil and Fan Heaters
Most of the patents are held overseas, but there is room for a local aspect of R&D that could drive patents. It is suggested that the DTI can implement certain kick-backs to local manufacturers to stimulate the development of R&D and patents.
Objective 7: Provide the DTI with a high level technology commercialisation analysis enabling the energy efficiency technologies to be moved from the research phase into the market phase
Objective 7 will provide the DTI with a high level of technology commersialisation analysis. Currently in South Africa there exists a lack of R&D and innovation of EE technologies. Specific strategies encouraging local R&D are suggested. Furthermore, strategies enabling the technologies to be moved from the R&D phase into the market phase are suggested. This analysis provides a greater level of insight into the level of support needed within each selected industry where South Africa could benefit for expanded EE product manufacturing. To move a product or technology from the R&D phase to the market may take anything between 3-5 years, depending on the project specifics. Throughout this process, support is needed and the following strategies are suggested to ensure commercialisation of EE technologies:
Financial Support Technical Support Dedicated effort to link private sector with universities The encouragement of smart partnerships
These support structures are discussed in greater detail in the following section
Currently in South Africa there exists a lack of R&D and innovation of EE technologies. Small to medium manufacturers often do not have the financial and technical resources available and in many cases it was found that larger companies do not deem R&D as their core business. It is suggested that innovation should already be promoted at school level. Furthermore, this also links to the development and improvement of math and science education. The table below depicts the different technologies, the products/components in the R&D phase and the applicability of it to the South African market.
Technology Products/components in the R&D phase Applicable to the South African market
Lighting LED Yes
OLED Not Yet (in 3-5 years)
Water Heating No N.A
Large Household appliances
EE compressor No
EE heating elements No
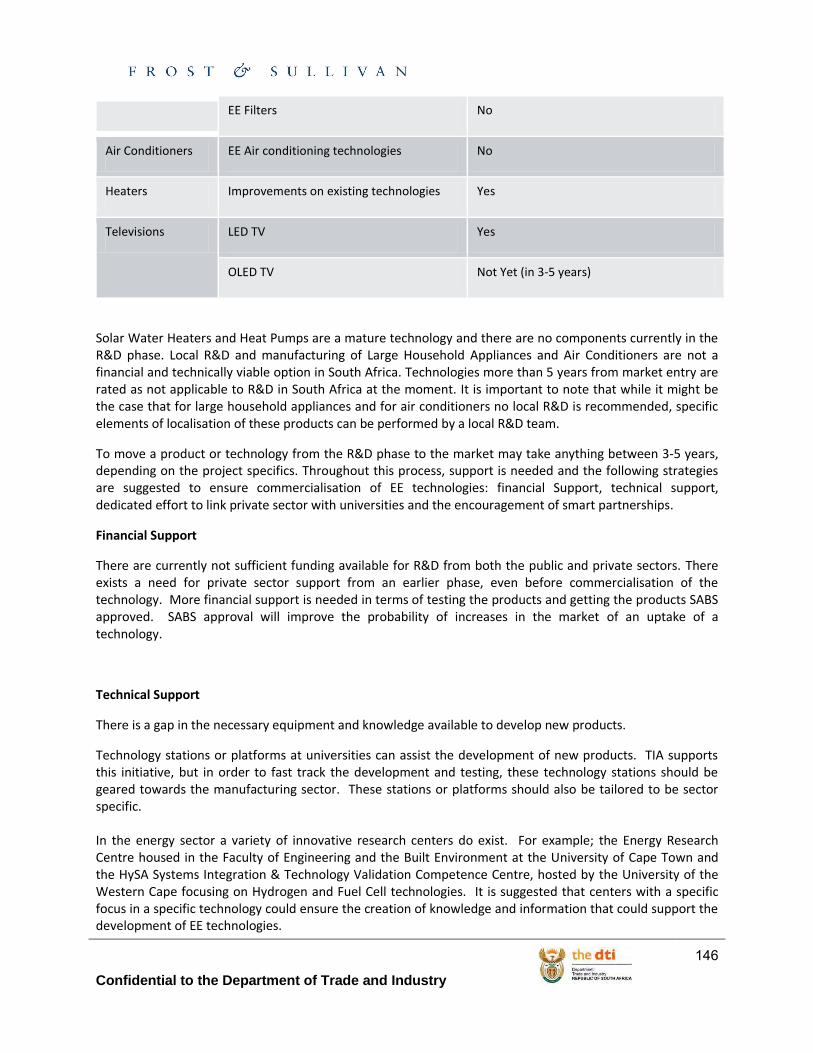
Confidential to the Department of Trade and Industry
146
EE Filters No
Air Conditioners EE Air conditioning technologies No
Heaters Improvements on existing technologies Yes
Televisions LED TV Yes
OLED TV Not Yet (in 3-5 years)
Solar Water Heaters and Heat Pumps are a mature technology and there are no components currently in the R&D phase. Local R&D and manufacturing of Large Household Appliances and Air Conditioners are not a financial and technically viable option in South Africa. Technologies more than 5 years from market entry are rated as not applicable to R&D in South Africa at the moment. It is important to note that while it might be the case that for large household appliances and for air conditioners no local R&D is recommended, specific elements of localisation of these products can be performed by a local R&D team.
To move a product or technology from the R&D phase to the market may take anything between 3-5 years, depending on the project specifics. Throughout this process, support is needed and the following strategies are suggested to ensure commercialisation of EE technologies: financial Support, technical support, dedicated effort to link private sector with universities and the encouragement of smart partnerships.
Financial Support
There are currently not sufficient funding available for R&D from both the public and private sectors. There exists a need for private sector support from an earlier phase, even before commercialisation of the technology. More financial support is needed in terms of testing the products and getting the products SABS approved. SABS approval will improve the probability of increases in the market of an uptake of a technology.
Technical Support
There is a gap in the necessary equipment and knowledge available to develop new products.
Technology stations or platforms at universities can assist the development of new products. TIA supports this initiative, but in order to fast track the development and testing, these technology stations should be geared towards the manufacturing sector. These stations or platforms should also be tailored to be sector specific. In the energy sector a variety of innovative research centers do exist. For example; the Energy Research Centre housed in the Faculty of Engineering and the Built Environment at the University of Cape Town and the HySA Systems Integration & Technology Validation Competence Centre, hosted by the University of the Western Cape focusing on Hydrogen and Fuel Cell technologies. It is suggested that centers with a specific focus in a specific technology could ensure the creation of knowledge and information that could support the development of EE technologies.
Confidential to the Department of Trade and Industry
147
Dedicated effort to link private sector with universities
R&D takes place at universities and research centers, but they are not always engaged with industry. In the UK and the USA, the private sectors work very closely with universities and the results can be seen in the pioneering role that they play in technology development and commercialisation. The TIA developed an industry matching fund, which encourages university and industry partnerships. In the case of a university finding an industry partner, TIA will fund 80% of the project. When an industry player approaches TIA and finds a university partner, then TIA will fund 70% of the total research project. This incentive scenario is not ideal as a potential funder will always be needed. It is suggested that a platform should be created where universities and industries can link without a mediator. An example of this is the Regional Innovation Forums that exist in the Western Cape, Eastern Cape and Gauteng. Once a quarter, industry, government, funders, community and university representatives meet to discuss the key gaps in technology innovation. Research at universities is then directed towards the gaps identified. This will not only secure funding, but also creates the certainty that industry is interested in purchasing the technology. Furthermore, this will ensure job availability for students and position them for specific skills development in industry or R&D in academia.
The encouragement of smart partnerships
Large multi-national companies approach South Africa only as a distribution center with no particular interest in local R&D. It is suggested that multi-national companies can partner with South Africa on the basis of R&D in improving an existing technology. R&D can be directed in improving the technology developed internationally, to adjust to the specific needs of the South African market. There is also the opportunity to protect the improvement of the specific technology through patents.
Objective 8: Industry multiplier effects and beneficiation options of the targeted industries will be examined, as well as indicating benefits and demand from industries outside the core industry on a best effort basis Objective 8 includes the industry multiplier effects and beneficiation options of the targeted industries identified. The specific benefits from industries outside the core industry will also be discussed on a best effort basis. In this section the overall industry multiplier effects of EE manufacturing will first be discussed:
Economic Growth: Stimulating the local manufacturing of EE technologies in South Africa will build these industries and reduce the reliance on imports which stops money going out of the country. It will also lead to a more attractive investment environment.
Job creation and skills development: The manufacturing of EE technologies will ensure job creation and skills development. This will not only affect the specific manufacturers, but their suppliers as well.
Industry Competitiveness: Stimulating the local EE manufacturing will ensure that the South African manufacturing industry remains competitive.
Stimulation of the demand for local products and services: Local manufacturing will also complement the service sector. High-value manufacturing will generate demand for the provision of technology-intensive services.
Reducing carbon emissions: Reducing carbon emissions will not only have a positive effect on the country as a whole, but in the light of carbon tax, also on specific industries and companies.
The effects that the specific technologies relevant to the South African manufacturing industry, will be discussed in further detail on the subsequent slides; it is suggested that South Africa should focus on Lighting, Water Heating, Heater and Television manufacturing.
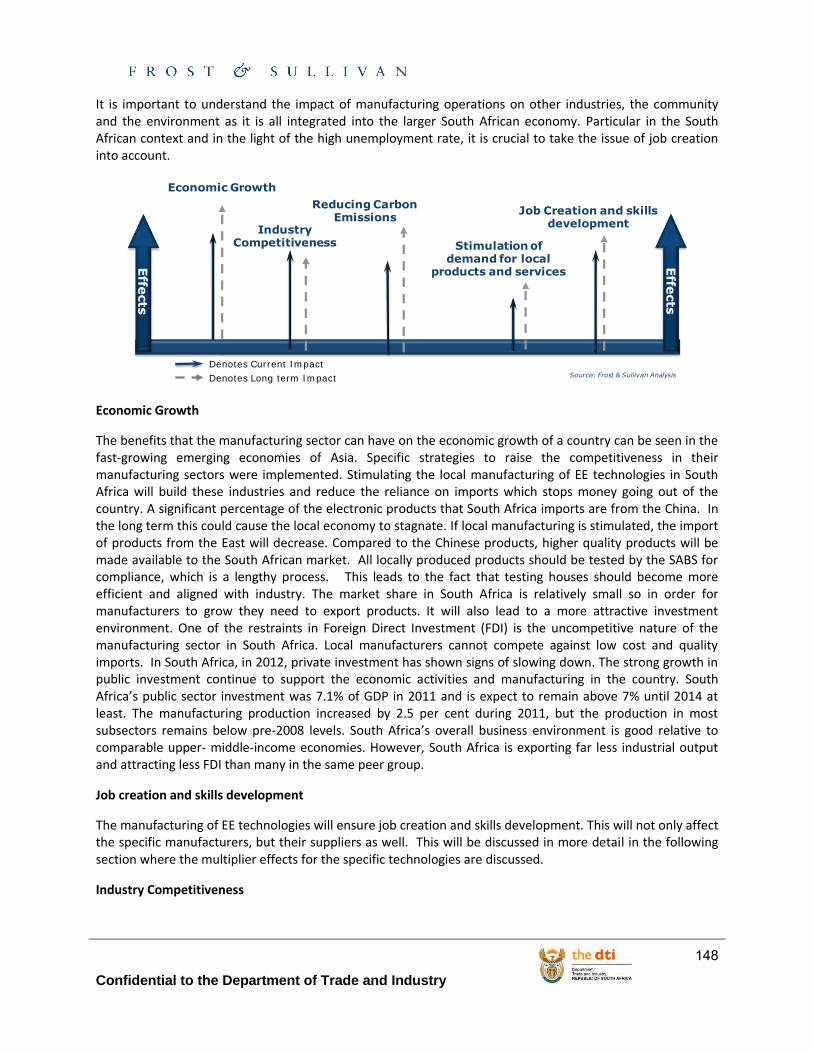
Confidential to the Department of Trade and Industry
148
It is important to understand the impact of manufacturing operations on other industries, the community and the environment as it is all integrated into the larger South African economy. Particular in the South African context and in the light of the high unemployment rate, it is crucial to take the issue of job creation into account.
Economic Growth
The benefits that the manufacturing sector can have on the economic growth of a country can be seen in the fast-growing emerging economies of Asia. Specific strategies to raise the competitiveness in their manufacturing sectors were implemented. Stimulating the local manufacturing of EE technologies in South Africa will build these industries and reduce the reliance on imports which stops money going out of the country. A significant percentage of the electronic products that South Africa imports are from the China. In the long term this could cause the local economy to stagnate. If local manufacturing is stimulated, the import of products from the East will decrease. Compared to the Chinese products, higher quality products will be made available to the South African market. All locally produced products should be tested by the SABS for compliance, which is a lengthy process. This leads to the fact that testing houses should become more efficient and aligned with industry. The market share in South Africa is relatively small so in order for manufacturers to grow they need to export products. It will also lead to a more attractive investment environment. One of the restraints in Foreign Direct Investment (FDI) is the uncompetitive nature of the manufacturing sector in South Africa. Local manufacturers cannot compete against low cost and quality imports. In South Africa, in 2012, private investment has shown signs of slowing down. The strong growth in public investment continue to support the economic activities and manufacturing in the country. South Africa’s public sector investment was 7.1% of GDP in 2011 and is expect to remain above 7% until 2014 at least. The manufacturing production increased by 2.5 per cent during 2011, but the production in most subsectors remains below pre-2008 levels. South Africa’s overall business environment is good relative to comparable upper- middle-income economies. However, South Africa is exporting far less industrial output and attracting less FDI than many in the same peer group.
Job creation and skills development
The manufacturing of EE technologies will ensure job creation and skills development. This will not only affect the specific manufacturers, but their suppliers as well. This will be discussed in more detail in the following section where the multiplier effects for the specific technologies are discussed.
Industry Competitiveness
Denotes Long term Impact
Denotes Current Impact
Effe
cts
Effe
cts
Economic Growth
Stimulation of demand for local
products and services
Industry Competitiveness
Job Creation and skills development
Reducing Carbon Emissions
Source: Frost & Sullivan Analysis
Confidential to the Department of Trade and Industry
149
The global energy landscape is changing and it will have an effect on energy markets and trade. This change occurs in the context of climate change, rapidly growing energy needs, electricity price increase and the challenge to provide energy access to the world’s poorest. Policy makers worldwide recognise EE as a key issue and globally the market is moving in this direction. Stimulating the local EE manufacturing will ensure that the South African manufacturing industry remains competitive.
Reducing carbon emissions
The stimulation of the demand and market uptake of EE technologies will lead to significant energy savings and the reduction of greenhouse gasses. Reducing carbon emissions will not only have a positive effect on the country as a whole, but in the light of carbon tax, also on specific industries and companies. South Africa remains one of the highest emitters of CO2 per capita in the world and set out the target to improve EE by 12% by 2014. South Africa has delayed introducing a carbon tax until 2015. However, in 2015, a carbon tax of R120 a metric ton of carbon on 40 per cent of a company’s emissions will be required. The tax is expected to increase with 10 per cent a year until 2020. To soften the impact, tax-free exemption thresholds are set and an updated carbon tax policy paper will be published by the end of March 2013.
Stimulation of the demand for local products and services
Local manufacturing will also complement the service sector. High-value manufacturing will generate demand for the provision of technology-intensive services.
Efficient water heaters (EWH): (includes both SWH and HP)
Currently there is sufficient local manufacturing capacity to meet the demand in EWH. After speaking to both manufacturers and suppliers, it was concluded that if a SWH manufacturing facility is set up it should have a minimum operating capacity of 8,000 to 10,000 units per month in order for the business to remain profitable. When considering that two of the most prominent market participants in SWH, i.e. Solar Primeg and Powerz-On only manufacture 4,000 units per month, the viability of opening a new manufacturing facility that will remain profitable is questionable. It is also important to note that additional jobs that could be created in stimulating the local manufacturing of EWH will not primarily be in manufacturing. Manufacturers mentioned that they only run at an estimated 30% capacity. Noticeable job increase will only be in the installation of EWH units. It is important to note that an increase in market uptake of EWH will not necessarily reduce the high installation costs. For the installation of high pressure flat plate SWH, one crew can only install one SWH per day. The installation of low pressure SWH are less complex and 3-5/day can be installed by one crew. The expenses related to installation will not be reduced through increased volumes. The commercial building sector will generate growth in the market as a result of the Green Building Codes being implemented. This is expected to gain momentum from 2014 onwards. This will ensure the creation of jobs for engineers in terms of designing EWH systems for commercial buildings. The increase in local manufacturing of SWH will increase the demand for manufacturing and installation materials. For the manufacturing of flat plate SWH collector, materials needed include glass, copper and aluminium. For the installation of SWH mounting brackets are needed and this specific manufacturing sector will also be stimulated with increased local manufacturing of SWH.
LED Lighting
The potential for job creation in LED lighting manufacturing is significant in the context of incandescent light bulbs being phased out. For this reason the market demand for LED lighting is expected to grow in the short term. A leading small LED manufacturer stated that they employ on a daily basis. In the last year they grew from 13 to 50 employees excluding the administration, IT and sales staff. Employees are trained from the ground and skills are developed in-house. Leading LED manufacturer, Phillips employ 45 people in South
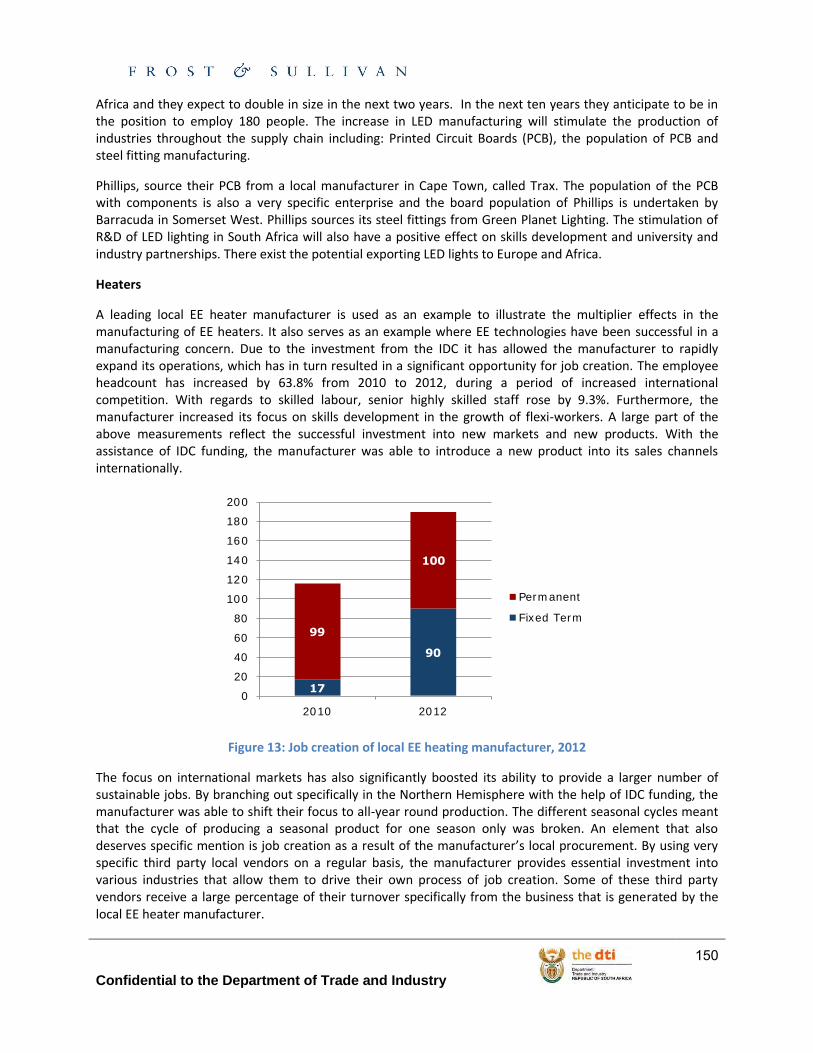
Confidential to the Department of Trade and Industry
150
Africa and they expect to double in size in the next two years. In the next ten years they anticipate to be in the position to employ 180 people. The increase in LED manufacturing will stimulate the production of industries throughout the supply chain including: Printed Circuit Boards (PCB), the population of PCB and steel fitting manufacturing.
Phillips, source their PCB from a local manufacturer in Cape Town, called Trax. The population of the PCB with components is also a very specific enterprise and the board population of Phillips is undertaken by Barracuda in Somerset West. Phillips sources its steel fittings from Green Planet Lighting. The stimulation of R&D of LED lighting in South Africa will also have a positive effect on skills development and university and industry partnerships. There exist the potential exporting LED lights to Europe and Africa.
Heaters
A leading local EE heater manufacturer is used as an example to illustrate the multiplier effects in the manufacturing of EE heaters. It also serves as an example where EE technologies have been successful in a manufacturing concern. Due to the investment from the IDC it has allowed the manufacturer to rapidly expand its operations, which has in turn resulted in a significant opportunity for job creation. The employee headcount has increased by 63.8% from 2010 to 2012, during a period of increased international competition. With regards to skilled labour, senior highly skilled staff rose by 9.3%. Furthermore, the manufacturer increased its focus on skills development in the growth of flexi-workers. A large part of the above measurements reflect the successful investment into new markets and new products. With the assistance of IDC funding, the manufacturer was able to introduce a new product into its sales channels internationally.
Figure 13: Job creation of local EE heating manufacturer, 2012
The focus on international markets has also significantly boosted its ability to provide a larger number of sustainable jobs. By branching out specifically in the Northern Hemisphere with the help of IDC funding, the manufacturer was able to shift their focus to all-year round production. The different seasonal cycles meant that the cycle of producing a seasonal product for one season only was broken. An element that also deserves specific mention is job creation as a result of the manufacturer’s local procurement. By using very specific third party local vendors on a regular basis, the manufacturer provides essential investment into various industries that allow them to drive their own process of job creation. Some of these third party vendors receive a large percentage of their turnover specifically from the business that is generated by the local EE heater manufacturer.
17
90
99
100
0
20
40
60
80
100
120
140
160
180
200
2010 2012
Permanent
Fixed Term
Confidential to the Department of Trade and Industry
151
Televisions
Before 1994, at the peak of its operations, Amalgamated Appliances’ television manufacturing factory employed approximately 1,500 people. Local television manufacturer, Tellumat, has over 100 employees currently. They have two manufacturing facilities; one in Cape Town (9,000m2), for prototyping to volume production and another in Atlantis (24,000m2), mostly for high volume production. International manufacturer, Samsung set up a local component assembly plant in South Africa. This created employment for over fifty people. Local manufacturing holds the potential for more job creation compared to component assemblers. The international partnerships enable international brands to assemble products in South Africa. This will ensure that the latest technology will be available in South Africa, it will remain competitively priced and the high quality associated with the brand will be guaranteed. South Africa has the potential to become a prominent manufacturer of television sets. Furthermore, local manufactured television sets could be exported to neighbouring African countries and boost the local economy of South Africa.
Conclusions DTI is likely to be most effective at stimulating the local manufacturing of lighting, space heating, water heating and television devices. This is largely due to the fact that established local manufacturing capacity already exists for these devices which provide government with a base to build upon. With regards to the local manufacturing of air conditioning units and large household appliances, it is recommended that the DTI consider forcing international manufacturers with established local markets to start manufacturing devices locally by either setting up local manufacturing facilities or by forming partnerships with local manufacturers due to minimal local manufacturing that is currently taking place in the country. It is imperative that existing trade relationships be taken into consideration when implementing duty protection measures. The impact of the stimulation of EE technology manufacturing is expected to have significantly positive effects on the country’s economy. It is imperative that the DTI determine how the insights and recommendations presented in this report can be best fitted into its internal processes and objectives. Furthermore, it is imperative that there is an uptake of energy efficient devices. It is therefore important that consumers are made aware of the benefits of these products. Aggressive awareness campaigns to educate and inform households of the importance and the benefits of energy efficient devices. Policies such as the phasing out of incandescent light bulbs set to be enacted by the end of 2013 will further serve to force end users to shift their purchasing criteria. It is imperative that government policies are effectively implemented as this too is a major challenge that local manufacturers face. Government needs to have a sufficiently sized and trained workforce in order to effectively implement these policies. Round table discussions with stakeholders on a regular basis are essential for the stimulation of the South African local manufacturing industry
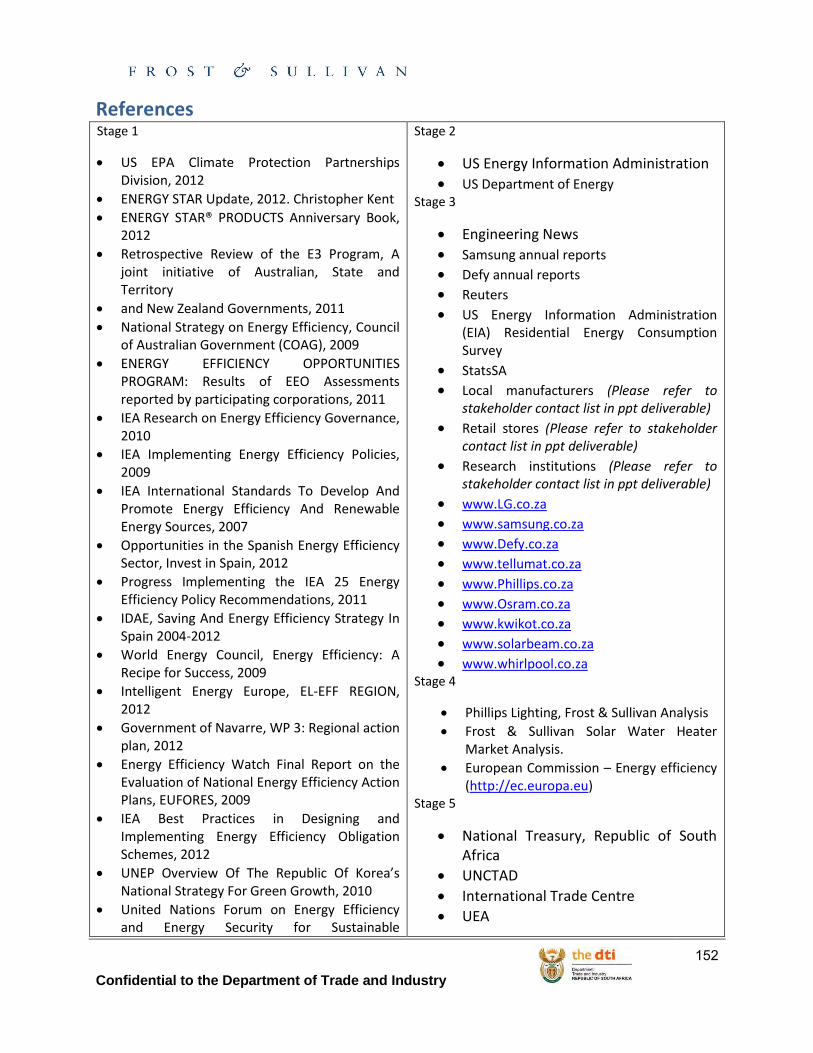
Confidential to the Department of Trade and Industry
152
References Stage 1
US EPA Climate Protection Partnerships Division, 2012
ENERGY STAR Update, 2012. Christopher Kent
ENERGY STAR® PRODUCTS Anniversary Book, 2012
Retrospective Review of the E3 Program, A joint initiative of Australian, State and Territory
and New Zealand Governments, 2011
National Strategy on Energy Efficiency, Council of Australian Government (COAG), 2009
ENERGY EFFICIENCY OPPORTUNITIES PROGRAM: Results of EEO Assessments reported by participating corporations, 2011
IEA Research on Energy Efficiency Governance, 2010
IEA Implementing Energy Efficiency Policies, 2009
IEA International Standards To Develop And Promote Energy Efficiency And Renewable Energy Sources, 2007
Opportunities in the Spanish Energy Efficiency Sector, Invest in Spain, 2012
Progress Implementing the IEA 25 Energy Efficiency Policy Recommendations, 2011
IDAE, Saving And Energy Efficiency Strategy In Spain 2004-2012
World Energy Council, Energy Efficiency: A Recipe for Success, 2009
Intelligent Energy Europe, EL-EFF REGION, 2012
Government of Navarre, WP 3: Regional action plan, 2012
Energy Efficiency Watch Final Report on the Evaluation of National Energy Efficiency Action Plans, EUFORES, 2009
IEA Best Practices in Designing and Implementing Energy Efficiency Obligation Schemes, 2012
UNEP Overview Of The Republic Of Korea’s National Strategy For Green Growth, 2010
United Nations Forum on Energy Efficiency and Energy Security for Sustainable
Stage 2
US Energy Information Administration
US Department of Energy Stage 3
Engineering News
Samsung annual reports Defy annual reports
Reuters
US Energy Information Administration (EIA) Residential Energy Consumption Survey
StatsSA Local manufacturers (Please refer to
stakeholder contact list in ppt deliverable)
Retail stores (Please refer to stakeholder contact list in ppt deliverable)
Research institutions (Please refer to stakeholder contact list in ppt deliverable)
www.LG.co.za www.samsung.co.za www.Defy.co.za www.tellumat.co.za
www.Phillips.co.za www.Osram.co.za www.kwikot.co.za www.solarbeam.co.za www.whirlpool.co.za
Stage 4
Phillips Lighting, Frost & Sullivan Analysis
Frost & Sullivan Solar Water Heater Market Analysis.
European Commission – Energy efficiency (http://ec.europa.eu)
Stage 5
National Treasury, Republic of South Africa
UNCTAD
International Trade Centre
UEA
Confidential to the Department of Trade and Industry
153
Development, Korea Chamber of Commerce and Industry, 2007
South Korea Energy Efficiency Report, ABB, 2011
Korea’s Energy Standards & Labeling, KEMCO, 2012
EPI
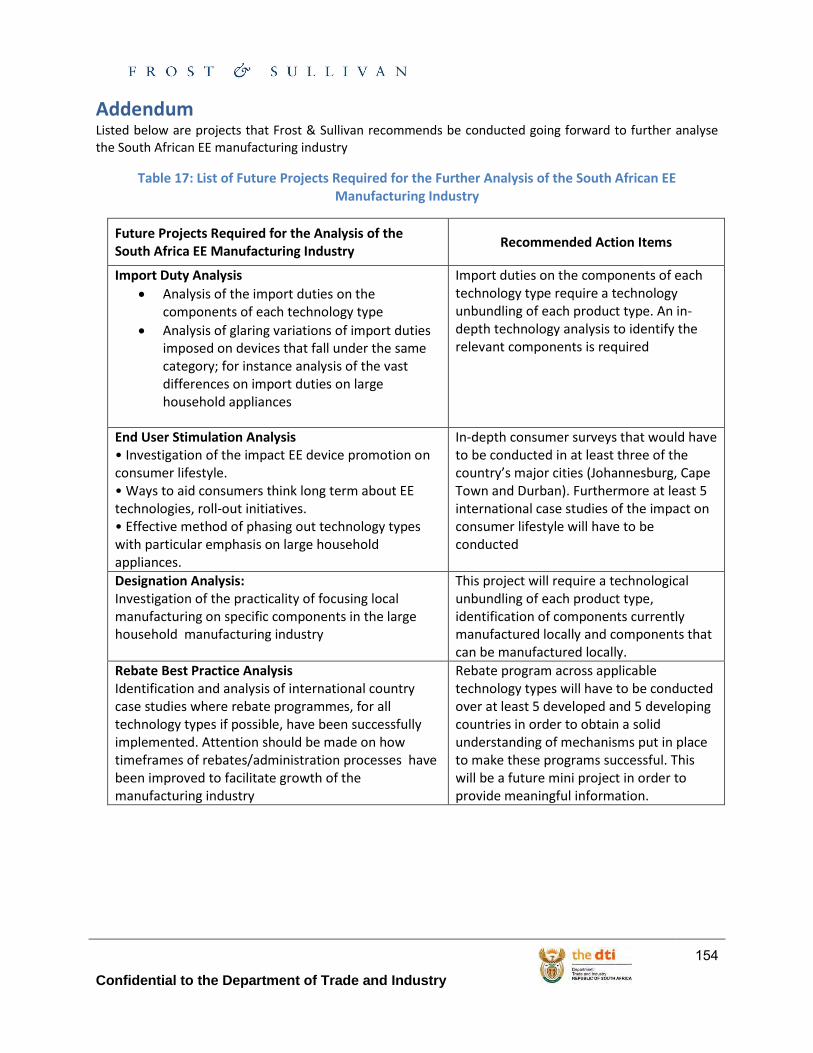
Confidential to the Department of Trade and Industry
154
Addendum Listed below are projects that Frost & Sullivan recommends be conducted going forward to further analyse the South African EE manufacturing industry
Table 17: List of Future Projects Required for the Further Analysis of the South African EE Manufacturing Industry
Future Projects Required for the Analysis of the South Africa EE Manufacturing Industry
Recommended Action Items
Import Duty Analysis
Analysis of the import duties on the components of each technology type
Analysis of glaring variations of import duties imposed on devices that fall under the same category; for instance analysis of the vast differences on import duties on large household appliances
Import duties on the components of each technology type require a technology unbundling of each product type. An in-depth technology analysis to identify the relevant components is required
End User Stimulation Analysis • Investigation of the impact EE device promotion on consumer lifestyle. • Ways to aid consumers think long term about EE technologies, roll-out initiatives. • Effective method of phasing out technology types with particular emphasis on large household appliances.
In-depth consumer surveys that would have to be conducted in at least three of the country’s major cities (Johannesburg, Cape Town and Durban). Furthermore at least 5 international case studies of the impact on consumer lifestyle will have to be conducted
Designation Analysis: Investigation of the practicality of focusing local manufacturing on specific components in the large household manufacturing industry
This project will require a technological unbundling of each product type, identification of components currently manufactured locally and components that can be manufactured locally.
Rebate Best Practice Analysis Identification and analysis of international country case studies where rebate programmes, for all technology types if possible, have been successfully implemented. Attention should be made on how timeframes of rebates/administration processes have been improved to facilitate growth of the manufacturing industry
Rebate program across applicable technology types will have to be conducted over at least 5 developed and 5 developing countries in order to obtain a solid understanding of mechanisms put in place to make these programs successful. This will be a future mini project in order to provide meaningful information.
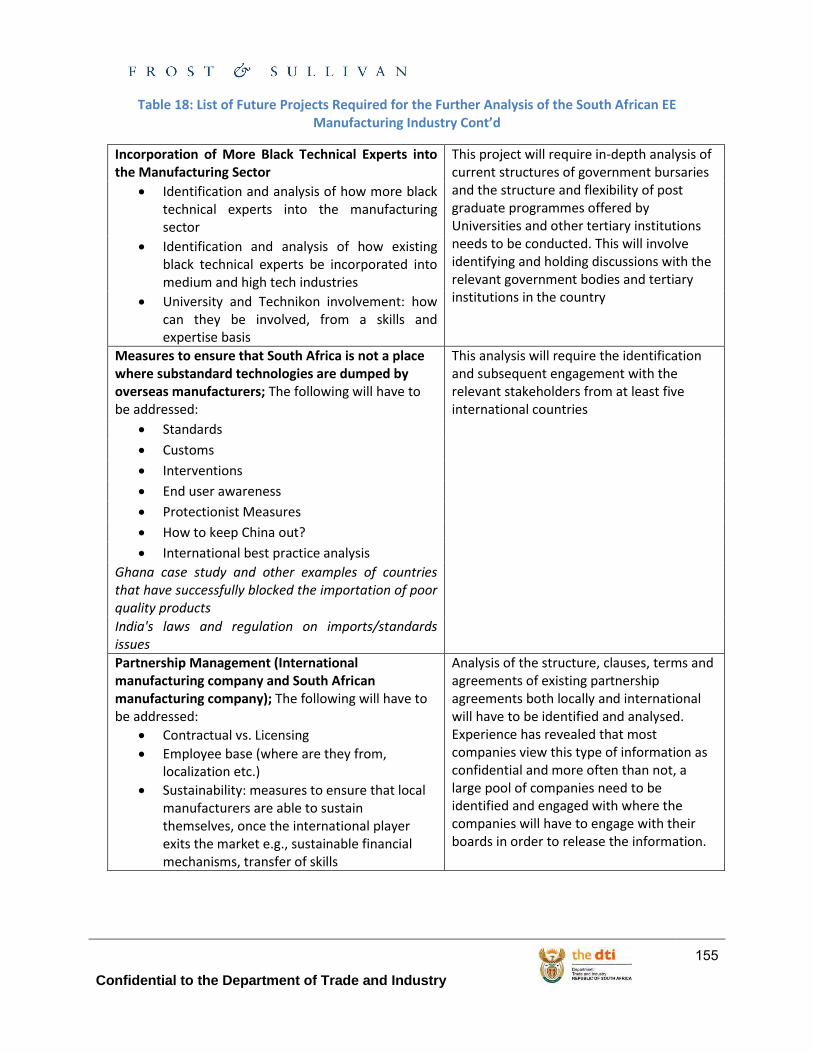
Confidential to the Department of Trade and Industry
155
Table 18: List of Future Projects Required for the Further Analysis of the South African EE Manufacturing Industry Cont’d
Incorporation of More Black Technical Experts into the Manufacturing Sector
This project will require in-depth analysis of current structures of government bursaries and the structure and flexibility of post graduate programmes offered by Universities and other tertiary institutions needs to be conducted. This will involve identifying and holding discussions with the relevant government bodies and tertiary institutions in the country
Identification and analysis of how more black technical experts into the manufacturing sector
Identification and analysis of how existing black technical experts be incorporated into medium and high tech industries
University and Technikon involvement: how can they be involved, from a skills and expertise basis
Measures to ensure that South Africa is not a place where substandard technologies are dumped by overseas manufacturers; The following will have to be addressed:
This analysis will require the identification and subsequent engagement with the relevant stakeholders from at least five international countries
Standards
Customs
Interventions
End user awareness
Protectionist Measures
How to keep China out?
International best practice analysis
Ghana case study and other examples of countries that have successfully blocked the importation of poor quality products
India's laws and regulation on imports/standards issues
Partnership Management (International manufacturing company and South African manufacturing company); The following will have to be addressed:
Contractual vs. Licensing
Employee base (where are they from, localization etc.)
Sustainability: measures to ensure that local manufacturers are able to sustain themselves, once the international player exits the market e.g., sustainable financial mechanisms, transfer of skills
Analysis of the structure, clauses, terms and agreements of existing partnership agreements both locally and international will have to be identified and analysed. Experience has revealed that most companies view this type of information as confidential and more often than not, a large pool of companies need to be identified and engaged with where the companies will have to engage with their boards in order to release the information.
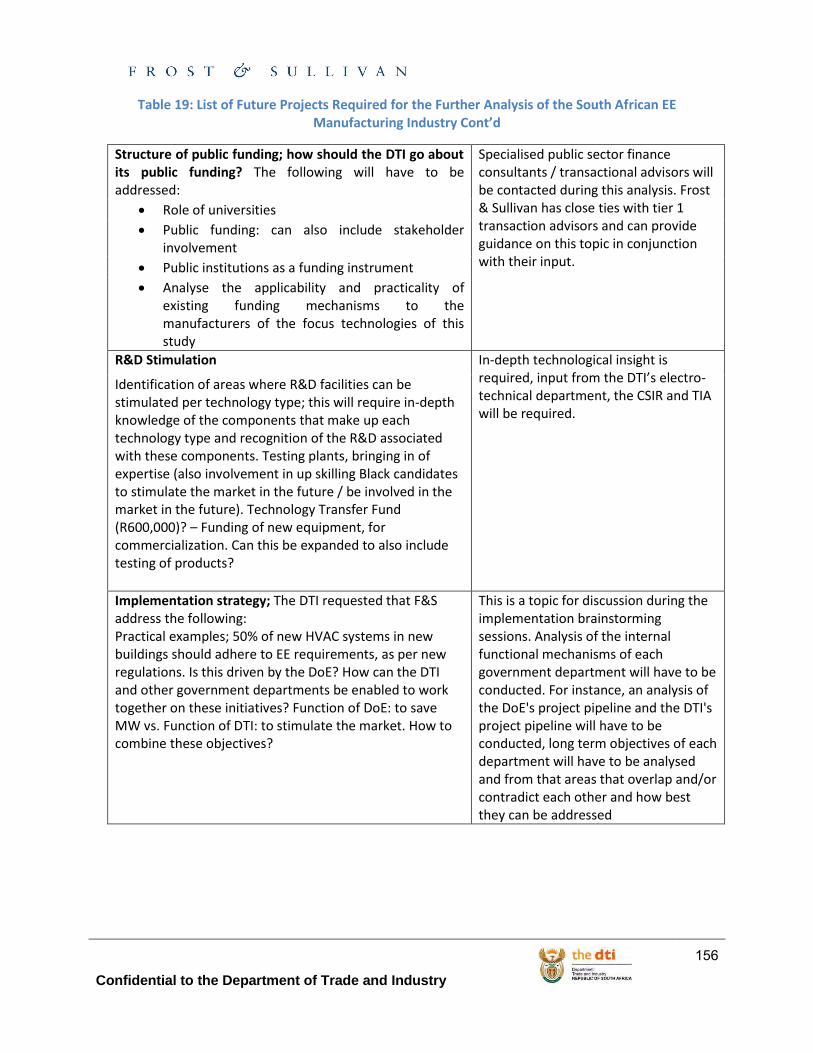
Confidential to the Department of Trade and Industry
156
Table 19: List of Future Projects Required for the Further Analysis of the South African EE Manufacturing Industry Cont’d
Structure of public funding; how should the DTI go about its public funding? The following will have to be addressed:
Specialised public sector finance consultants / transactional advisors will be contacted during this analysis. Frost & Sullivan has close ties with tier 1 transaction advisors and can provide guidance on this topic in conjunction with their input.
Role of universities
Public funding: can also include stakeholder involvement
Public institutions as a funding instrument
Analyse the applicability and practicality of existing funding mechanisms to the manufacturers of the focus technologies of this study
R&D Stimulation In-depth technological insight is required, input from the DTI’s electro-technical department, the CSIR and TIA will be required.
Identification of areas where R&D facilities can be stimulated per technology type; this will require in-depth knowledge of the components that make up each technology type and recognition of the R&D associated with these components. Testing plants, bringing in of expertise (also involvement in up skilling Black candidates to stimulate the market in the future / be involved in the market in the future). Technology Transfer Fund (R600,000)? – Funding of new equipment, for commercialization. Can this be expanded to also include testing of products?
Implementation strategy; The DTI requested that F&S address the following: Practical examples; 50% of new HVAC systems in new buildings should adhere to EE requirements, as per new regulations. Is this driven by the DoE? How can the DTI and other government departments be enabled to work together on these initiatives? Function of DoE: to save MW vs. Function of DTI: to stimulate the market. How to combine these objectives?
This is a topic for discussion during the implementation brainstorming sessions. Analysis of the internal functional mechanisms of each government department will have to be conducted. For instance, an analysis of the DoE's project pipeline and the DTI's project pipeline will have to be conducted, long term objectives of each department will have to be analysed and from that areas that overlap and/or contradict each other and how best they can be addressed