Embed Size (px)
Citation preview
−0.08
−0.04
0
0.04
0.08
Velo
city
(cm
/s)
BHT
BHR
BHZ
(a)20121028 M7.7 Dist: 2080.0 km BAZ: 337.7 deg Station: BK.PKD
−3
−1.5
0
1.5
3
hp > 5 Hz
BHZ
Velo
city
(cm
/s) (b)
x10−5
Freq
uenc
y (H
z) (c)
BHZ
Time since mainshock (s)200 400 600 800 1000 1200 14000
2
4
6
8
10
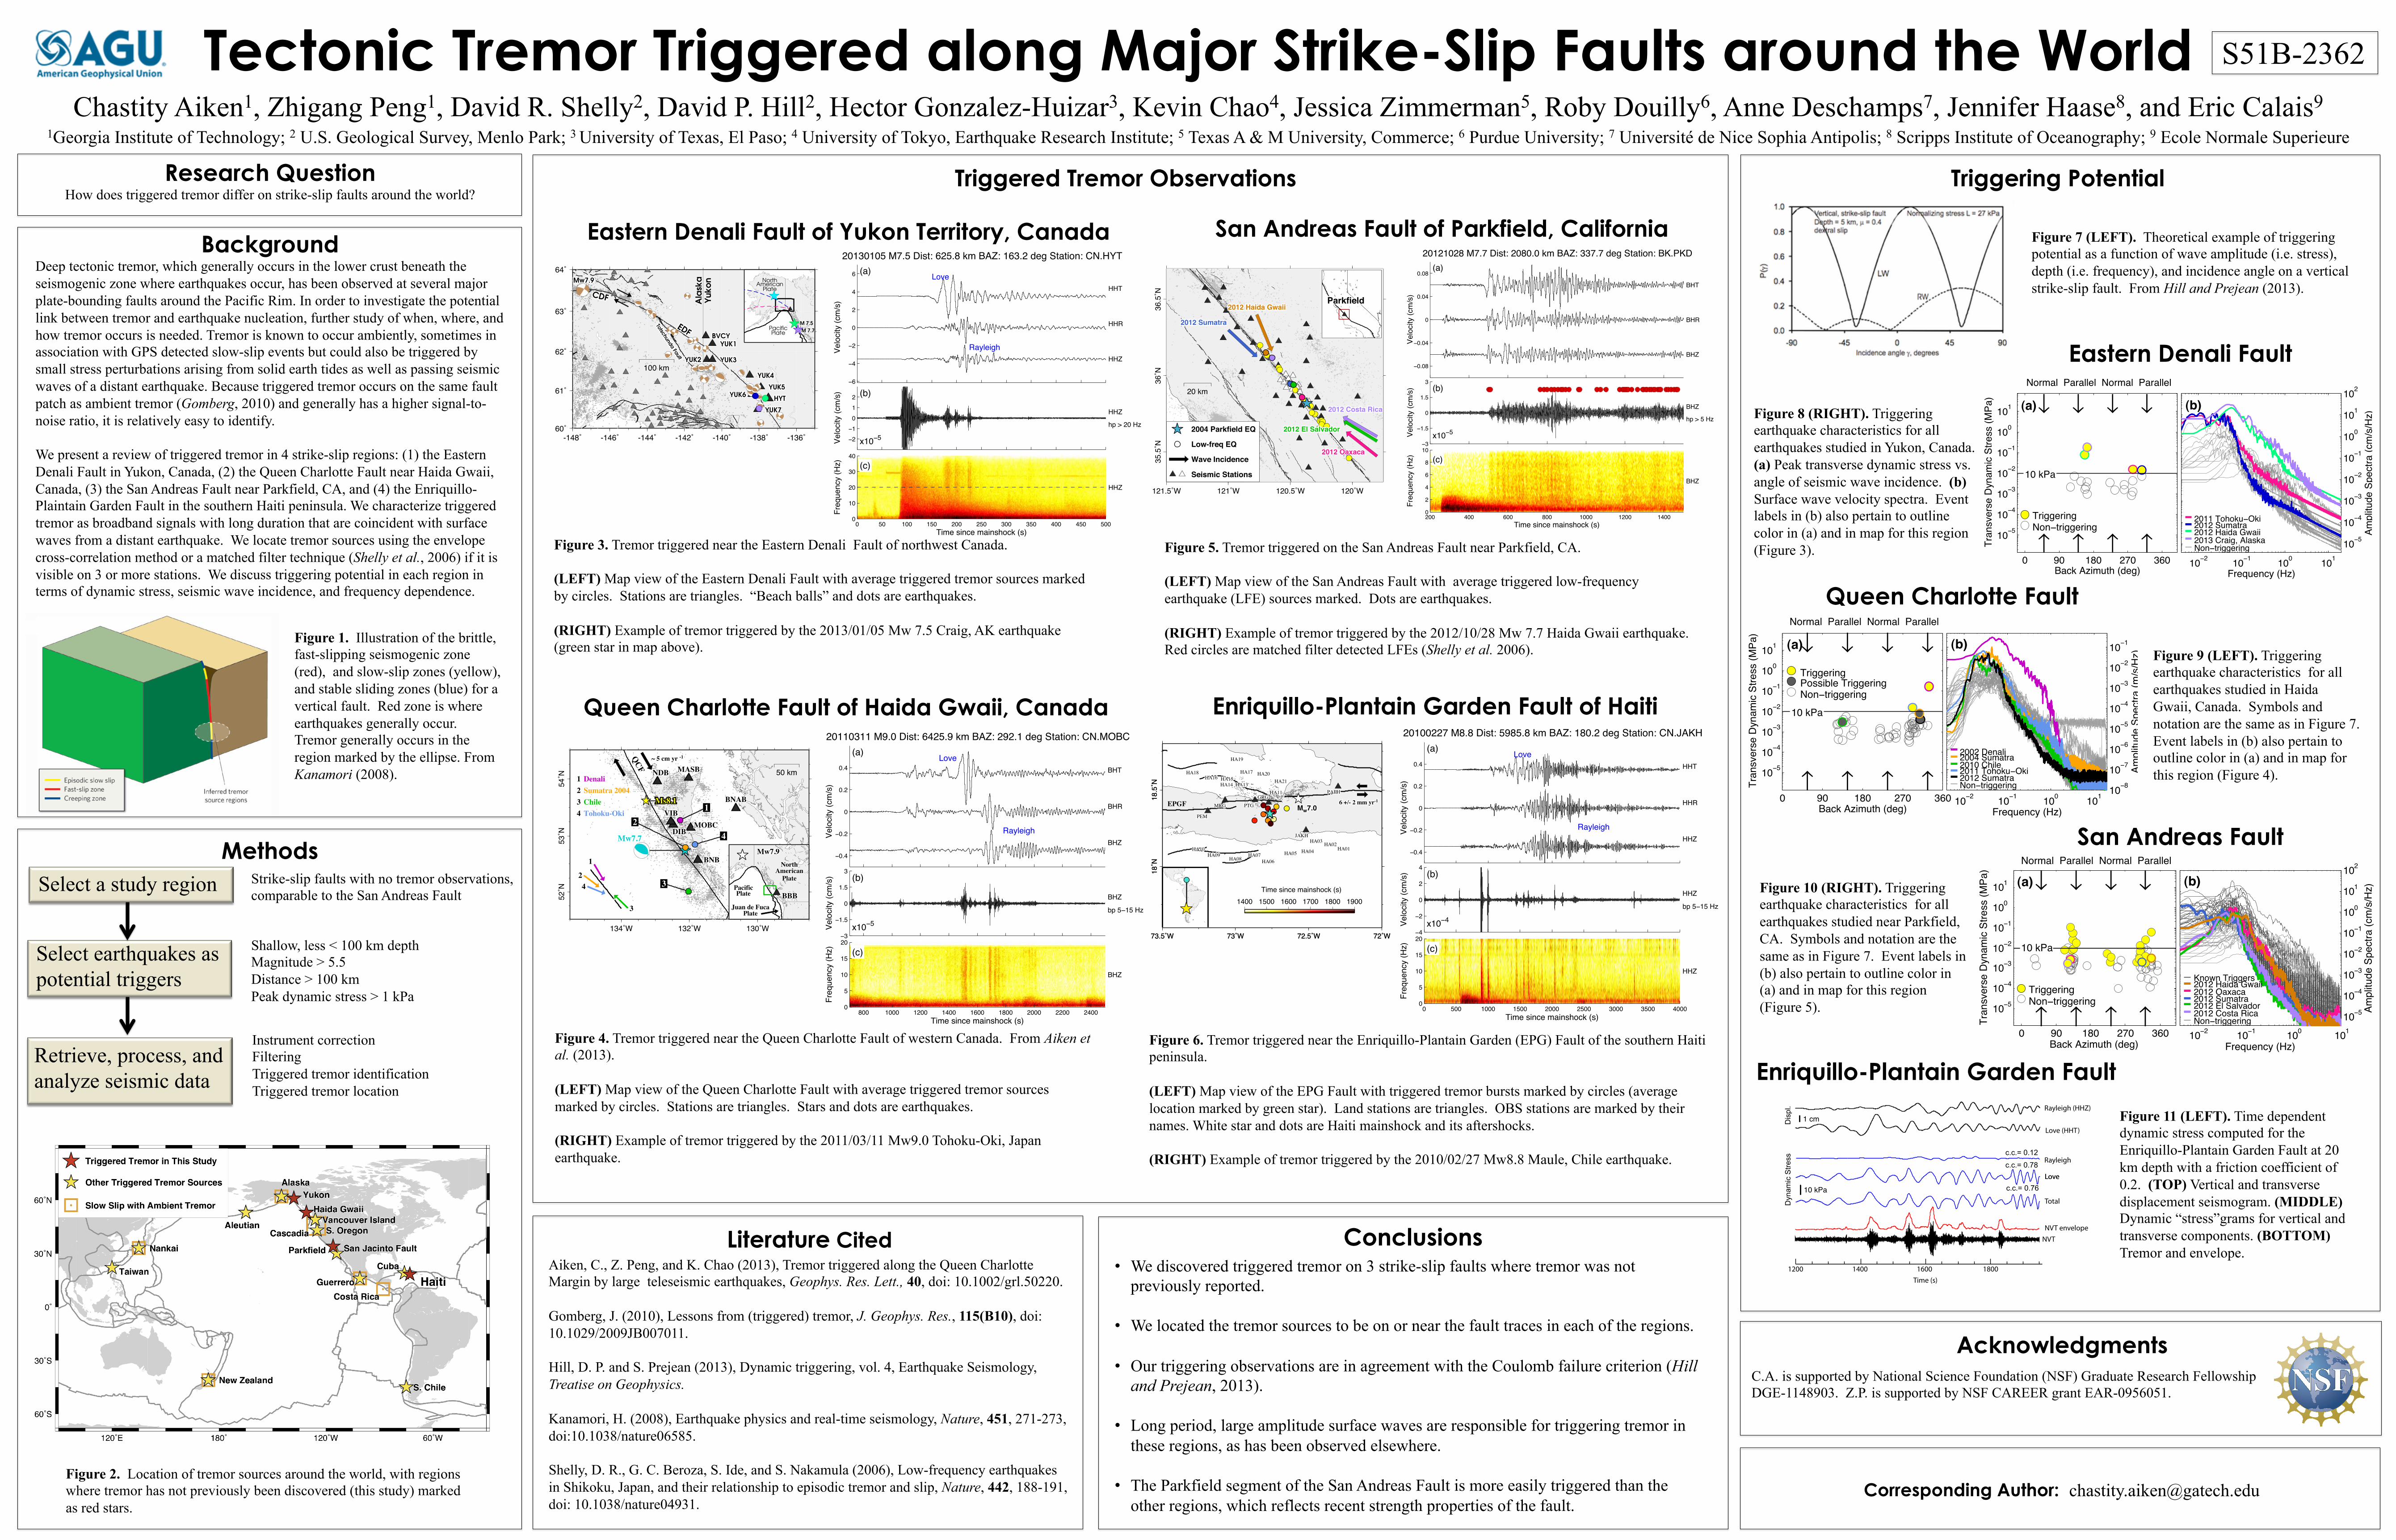
Tectonic Tremor Triggered along Major Strike-Slip Faults around the World Chastity Aiken1, Zhigang Peng1, David R. Shelly2, David P. Hill2, Hector Gonzalez-Huizar3, Kevin Chao4, Jessica Zimmerman5, Roby Douilly6, Anne Deschamps7, Jennifer Haase8, and Eric Calais9
1Georgia Institute of Technology; 2 U.S. Geological Survey, Menlo Park; 3 University of Texas, El Paso; 4 University of Tokyo, Earthquake Research Institute; 5 Texas A & M University, Commerce; 6 Purdue University; 7 Université de Nice Sophia Antipolis; 8 Scripps Institute of Oceanography; 9 Ecole Normale Superieure
Research Question How does triggered tremor differ on strike-slip faults around the world?
Methods Select a study region
Select earthquakes as potential triggers
Retrieve, process, and analyze seismic data
Strike-slip faults with no tremor observations, comparable to the San Andreas Fault
Shallow, less < 100 km depth Magnitude > 5.5 Distance > 100 km Peak dynamic stress > 1 kPa
Instrument correction Filtering Triggered tremor identification Triggered tremor location
Figure 2. Location of tremor sources around the world, with regions where tremor has not previously been discovered (this study) marked as red stars.
Figure 1. Illustration of the brittle, fast-slipping seismogenic zone (red), and slow-slip zones (yellow), and stable sliding zones (blue) for a vertical fault. Red zone is where earthquakes generally occur. Tremor generally occurs in the region marked by the ellipse. From Kanamori (2008).
Background Deep tectonic tremor, which generally occurs in the lower crust beneath the seismogenic zone where earthquakes occur, has been observed at several major plate-bounding faults around the Pacific Rim. In order to investigate the potential link between tremor and earthquake nucleation, further study of when, where, and how tremor occurs is needed. Tremor is known to occur ambiently, sometimes in association with GPS detected slow-slip events but could also be triggered by small stress perturbations arising from solid earth tides as well as passing seismic waves of a distant earthquake. Because triggered tremor occurs on the same fault patch as ambient tremor (Gomberg, 2010) and generally has a higher signal-to-noise ratio, it is relatively easy to identify. We present a review of triggered tremor in 4 strike-slip regions: (1) the Eastern Denali Fault in Yukon, Canada, (2) the Queen Charlotte Fault near Haida Gwaii, Canada, (3) the San Andreas Fault near Parkfield, CA, and (4) the Enriquillo-Plaintain Garden Fault in the southern Haiti peninsula. We characterize triggered tremor as broadband signals with long duration that are coincident with surface waves from a distant earthquake. We locate tremor sources using the envelope cross-correlation method or a matched filter technique (Shelly et al., 2006) if it is visible on 3 or more stations. We discuss triggering potential in each region in terms of dynamic stress, seismic wave incidence, and frequency dependence.
Triggered Tremor Observations
−0.4
−0.2
0
0.2
0.4Love
RayleighVelo
city
(cm
/s)
BHT
BHR
BHZ
(a)20110311 M9.0 Dist: 6425.9 km BAZ: 292.1 deg Station: CN.MOBC
−3
−1.5
0
1.5
3
bp 5−15 Hz
BHZ
Velo
city
(cm
/s) (b)
x10−5
Freq
uenc
y (H
z) (c)
BHZ
Time since mainshock (s)800 1000 1200 1400 1600 1800 2000 2200 2400
0
5
10
15
20
Queen Charlotte Fault of Haida Gwaii, Canada
134˚W 132˚W 130˚W
52˚N
53˚N
54˚N 50 km
VIB
DIBMOBC
MASBNDB
BNAB
BNB
QCF
Ms8.1
Mw7.7
~ 5 cm yr -1
1
1
2
23
3
4
4
DenaliSumatra 2004ChileTohoku-Oki
1234
Mw7.9
BBB
NorthAmerican
PlatePacificPlate
Juan de FucaPlate
Figure 4. Tremor triggered near the Queen Charlotte Fault of western Canada. From Aiken et al. (2013). (LEFT) Map view of the Queen Charlotte Fault with average triggered tremor sources marked by circles. Stations are triangles. Stars and dots are earthquakes. (RIGHT) Example of tremor triggered by the 2011/03/11 Mw9.0 Tohoku-Oki, Japan earthquake.
Eastern Denali Fault of Yukon Territory, Canada
−6
−4
−2
0
2
4
6 Love
RayleighVelo
city
(cm
/s)
HHT
HHR
HHZ
(a)20130105 M7.5 Dist: 625.8 km BAZ: 163.2 deg Station: CN.HYT
−2−1
012
hp > 20 Hz
HHZ
Velo
city
(cm
/s) (b)
x10−5
Freq
uenc
y (H
z) (c)
HHZ
Time since mainshock (s)0 50 100 150 200 250 300 350 400 450 500
0
10
20
30
40
Figure 3. Tremor triggered near the Eastern Denali Fault of northwest Canada. (LEFT) Map view of the Eastern Denali Fault with average triggered tremor sources marked by circles. Stations are triangles. “Beach balls” and dots are earthquakes. (RIGHT) Example of tremor triggered by the 2013/01/05 Mw 7.5 Craig, AK earthquake (green star in map above).
-148˚ -146˚ -144˚ -142˚ -140˚ -138˚ -136˚60˚
61˚
62˚
63˚
64˚
100 km
BVCY
YUK1
YUK3
YUK4
YUK5
YUK7
YUK2
YUK6HYT
Ala
sk
a
Yu
ko
n
EDF
CDF
Totsc
hunda Fa
ult
Mw7.9
M 7.5
M 7.7PacificPlate
AmericanPlate
North
San Andreas Fault of Parkfield, California
Figure 5. Tremor triggered on the San Andreas Fault near Parkfield, CA. (LEFT) Map view of the San Andreas Fault with average triggered low-frequency earthquake (LFE) sources marked. Dots are earthquakes. (RIGHT) Example of tremor triggered by the 2012/10/28 Mw 7.7 Haida Gwaii earthquake. Red circles are matched filter detected LFEs (Shelly et al. 2006).
−0.4
−0.2
0
0.2
0.4Love
RayleighVelo
city
(cm
/s)
HHT
HHR
HHZ
(a)20100227 M8.8 Dist: 5985.8 km BAZ: 180.2 deg Station: CN.JAKH
−4
−2
0
2
4
bp 5−15 Hz
HHZ
Velo
city
(cm
/s) (b)
x10−4
Freq
uenc
y (H
z) (c)
HHZ
Time since mainshock (s)0 500 1000 1500 2000 2500 3000 3500 4000
0
5
10
15
20
Enriquillo-Plantain Garden Fault of Haiti
73.5˚W 73˚W 72.5˚W 72˚W
18˚N
18.5
˚N
73.5˚W 73˚W 72.5˚W 72˚W
18˚N
18.5
˚N
HA01HA02HA03
HA04HA05HA06
HA07HA08
HA09HA10
HA11HA13
HA16HA17HA18
HA19
HA20HA21HA14
HA15
JAKH
PAPH
MRG
PEM
PTGGRG
Mw7.0
1400 1500 1600 1700 1800 1900Time since mainshock (s)
EPGF 6 +/- 2 mm yr-1
Figure 6. Tremor triggered near the Enriquillo-Plantain Garden (EPG) Fault of the southern Haiti peninsula. (LEFT) Map view of the EPG Fault with triggered tremor bursts marked by circles (average location marked by green star). Land stations are triangles. OBS stations are marked by their names. White star and dots are Haiti mainshock and its aftershocks. (RIGHT) Example of tremor triggered by the 2010/02/27 Mw8.8 Maule, Chile earthquake.
Conclusions • We discovered triggered tremor on 3 strike-slip faults where tremor was not
previously reported.
• We located the tremor sources to be on or near the fault traces in each of the regions. • Our triggering observations are in agreement with the Coulomb failure criterion (Hill
and Prejean, 2013).
• Long period, large amplitude surface waves are responsible for triggering tremor in these regions, as has been observed elsewhere.
• The Parkfield segment of the San Andreas Fault is more easily triggered than the other regions, which reflects recent strength properties of the fault.
C.A. is supported by National Science Foundation (NSF) Graduate Research Fellowship DGE-1148903. Z.P. is supported by NSF CAREER grant EAR-0956051.
Literature Cited Aiken, C., Z. Peng, and K. Chao (2013), Tremor triggered along the Queen Charlotte Margin by large teleseismic earthquakes, Geophys. Res. Lett., 40, doi: 10.1002/grl.50220. Gomberg, J. (2010), Lessons from (triggered) tremor, J. Geophys. Res., 115(B10), doi: 10.1029/2009JB007011. Hill, D. P. and S. Prejean (2013), Dynamic triggering, vol. 4, Earthquake Seismology, Treatise on Geophysics. Kanamori, H. (2008), Earthquake physics and real-time seismology, Nature, 451, 271-273, doi:10.1038/nature06585. Shelly, D. R., G. C. Beroza, S. Ide, and S. Nakamula (2006), Low-frequency earthquakes in Shikoku, Japan, and their relationship to episodic tremor and slip, Nature, 442, 188-191, doi: 10.1038/nature04931.
Acknowledgments
Triggering Potential
0 90 180 270 360
10−5
10−4
10−3
10−2
10−1
100
101
Back Azimuth (deg)
Tran
sver
se D
ynam
ic S
tress
(MPa
)
10 kPa
↓
↑
↓
↑
↓
↑
↓
↑
Normal Parallel Normal Parallel
(a)
TriggeringNon−triggering
10−2 10−1 100 101
10−5
10−4
10−3
10−2
10−1
100
101
102
Non−triggering
2011 Tohoku−Oki2012 Sumatra2012 Haida Gwaii2013 Craig, Alaska
Frequency (Hz)
Ampl
itude
Spe
ctra
(cm
/s/H
z)
(b)
0 90 180 270 360
10−5
10−4
10−3
10−2
10−1
100
101
Back Azimuth (deg)
Tran
sver
se D
ynam
ic S
tress
(MPa
)
10 kPa
↓
↑
↓
↑
↓
↑
↓
↑
Normal Parallel Normal Parallel
(a)
TriggeringPossible TriggeringNon−triggering
10−2 10−1 100 101 10−8
10−7
10−6
10−5
10−4
10−3
10−2
10−1
Non−triggering
2002 Denali2004 Sumatra2010 Chile2011 Tohoku−Oki2012 Sumatra
Frequency (Hz)
Ampl
itude
Spe
ctra
(m/s
/Hz)
(b)
Eastern Denali Fault
Queen Charlotte Fault
Enriquillo-Plantain Garden Fault
Figure 8 (RIGHT). Triggering earthquake characteristics for all earthquakes studied in Yukon, Canada. (a) Peak transverse dynamic stress vs. angle of seismic wave incidence. (b) Surface wave velocity spectra. Event labels in (b) also pertain to outline color in (a) and in map for this region (Figure 3).
Figure 9 (LEFT). Triggering earthquake characteristics for all earthquakes studied in Haida Gwaii, Canada. Symbols and notation are the same as in Figure 7. Event labels in (b) also pertain to outline color in (a) and in map for this region (Figure 4).
Dis
pl.
Dyn
amic
Stre
ss
10 kPa
Rayleigh (HHZ)
Love (HHT)
Rayleigh
Love Love
Total
1 cm
NVT envelope NVT
c.c.= 0.12
c.c.= 0.76
c.c.= 0.78
1200 1400 1600 1800Time (s)
by H. Gonzalez-Huizar (2013)UTEP
NVT in Haiti triggered by the 2010 Mw8.8 Maule, Chile earthquake
Figure 11 (LEFT). Time dependent dynamic stress computed for the Enriquillo-Plantain Garden Fault at 20 km depth with a friction coefficient of 0.2. (TOP) Vertical and transverse displacement seismogram. (MIDDLE) Dynamic “stress”grams for vertical and transverse components. (BOTTOM) Tremor and envelope.
Figure 7 (LEFT). Theoretical example of triggering potential as a function of wave amplitude (i.e. stress), depth (i.e. frequency), and incidence angle on a vertical strike-slip fault. From Hill and Prejean (2013).
Corresponding Author: [email protected]
San Andreas Fault
0 90 180 270 360
10−5
10−4
10−3
10−2
10−1
100
101
Back Azimuth (deg)
Tran
sver
se D
ynam
ic S
tress
(MPa
)
10 kPa
↓
↑
↓
↑
↓
↑
↓
↑
Normal Parallel Normal Parallel
(a)
TriggeringNon−triggering
10−2 10−1 100 101
10−5
10−4
10−3
10−2
10−1
100
101
102
Non−triggering
Known Triggers2012 Oaxaca2012 Sumatra2012 El Salvador2012 Costa Rica
2012 Haida Gwaii
Frequency (Hz)
Ampl
itude
Spe
ctra
(cm
/s/H
z)(b)Figure 10 (RIGHT). Triggering earthquake characteristics for all earthquakes studied near Parkfield, CA. Symbols and notation are the same as in Figure 7. Event labels in (b) also pertain to outline color in (a) and in map for this region (Figure 5).
121.5˚W 121˚W 120.5˚W 120˚W
35.5
˚N36
˚N36
.5˚N
20 km
2012 Sumatra
2012 Oaxaca
2012 El Salvador
2012 Costa Rica
2012 Haida Gwaii
Seismic Stations
Wave Incidence
Low-freq EQ
2004 Parkfield EQ
Parkfield
S51B-2362


![0.00 0.02 0.04 0.06 0.08 0.10 0.12 0.14 0.16 [A] (M) - Applications of... · 2020-02-04 · 0.00 0.02 0.04 0.06 0.08 0.10 0.12 0.14 0.16 0.0 5.0x10⁻⁷ 1.0x10⁻⁶ 1.5x10⁻⁶ 2.0x10⁻⁶ 2.5x10-6](https://img.pdfslide.net/doc/110x75/5e91edc8615c062292493193/000-002-004-006-008-010-012-014-016-a-m-applications-of-2020-02-04.jpg)


![Hydrophobic interaction and hydrogen-bond network for a ...0 2 4 6 8 10 [au] simulation time [ps]-0.04-0.02 0 0.02 0.04 0.06 0.08 0 0.2 0.4 0.6 0.8 1 constraint force [au] simulation](https://img.pdfslide.net/doc/110x75/5f0ba34f7e708231d4317cb3/hydrophobic-interaction-and-hydrogen-bond-network-for-a-0-2-4-6-8-10-au-simulation.jpg)


![0.00 0.02 0.04 0.06 0.08 0.10 0.12 0.14 0.16 [A] (M)ekwan/pdfs/29 - Applications...0.00 0.02 0.04 0.06 0.08 0.10 0.12 0.14 0.16 0.0 5.0x10⁻⁷ 1.0x10⁻⁶ 1.5x10⁻⁶ 2.0x10⁻⁶ 2.5x10⁻⁶ s-1)](https://img.pdfslide.net/doc/110x75/5aad3f997f8b9a2e088df1bd/000-002-004-006-008-010-012-014-016-a-m-ekwanpdfs29-applications000.jpg)